u.s. international economic accounts: concepts and methods
TRANSCRIPT

Investments
MultinationalForeign
Residence
Activities
Imports
Exports
Goods
Services
Country
GreenfieldD
irect
Statistics
A�liates TradeTransactions
Accounts
Expenditures
Investment
Enterprise
Po
sition
Revision
Benchmark
Portfolio
Survey
Financial
Parent
Abroad
Instruments
Ownership
Flow Global
Liabilities
Cla
im
Insurance
Deficit
Asse
ts
U.S. International Economic Accounts:
Concepts and Methods
International Transactions Accounts,
International Investment Position Accounts,
Activities of Multinational Enterprises, and
Other International Economic Accounts
July 2021
U.S. International Economic Accounts:
Concepts and Methods
International Transactions Accounts,
International Investment Position Accounts,
Activities of Multinational Enterprises, and
Other International Economic Accounts
July 2021
(301) 278-9004 [email protected] www.bea.gov @bea_news
July 20, 2021
U.S. Department of Commerce Gina Raimundo Secretary
Bureau of Economic Analysis Mary Bohman Acting Director

Bureau of Economic AnalysisU.S. International Economic Accounts: Concepts and Methods
iiiPreface
PrefaceThis volume details the concepts and methods used by the U.S. Bureau of Economic Analysis (BEA) to prepare the U.S. International Economic Accounts. It updates and expands BEA’s previ-ous volume that that was released on the BEA website in 2014. The 2014 volume accompanied a 2014 comprehensive restructuring of several of the accounts—the most significant change in the structure and presentation of these accounts since 1976. The 2014 volume expanded on an earlier 2011 volume by covering the International Investment Position (IIP) Accounts and statistics on the activities of multinational enterprises (AMNE), along with the featured International Transactions Accounts (ITAs).
This volume builds on the 2014 volume by adding coverage of several other International Economic Accounts: the monthly statistics on trade in goods and services, the international ser-vices statistics, the statistics on direct investment by country and industry, and the statistics on new foreign direct investment in the United States. This volume also expands and updates the coverage of the three core accounts. It provides considerably more detail on the AMNE statistics and reflects changes in 2020 to the trade in services and secondary income components of the ITAs. It also includes a new appendix on the projection methods used to prepare the ITAs and the IIP Accounts before complete source data are available.
This volume will be updated periodically to reflect changes in concepts, sources, and methods as they are introduced into the U.S. International Economic Accounts. In addition, new material may be introduced as needed to provide thorough and up-to-date documentation of important topics and issues related to these accounts.
BEA acknowledges the influence of the International Monetary Fund’s Balance of Payments and International Investment Position Manual, Sixth Edition (BPM6) on the structure and content of this volume.

Bureau of Economic AnalysisU.S. International Economic Accounts: Concepts and Methods
ivAbbreviations
Abbreviation Definition
ABCP Asset-backed commercial paper
ACE Automated Commercial Environment
AMNE Activities of multinational enterprises
API Application programming interface
APIS Advance Passenger Information System
ARC Airlines Reporting Corporation
BD4 Benchmark Definition of Foreign Direct Investment, Fourth Edition
BEA U.S. Bureau of Economic Analysis
BIS Bank for International Settlements
BLS U.S. Bureau of Labor Statistics
BOP Balance of payments
BPM5 Balance of Payments Manual, Fifth Edition
BPM6 Balance of Payments and International Investment Position Manual, Sixth Edition
BTS Bureau of Transportation Statistics
CBP U.S. Customs and Border Protection
DHS U.S. Department of Homeland Security
DOC U.S. Department of Commerce
DOD U.S. Department of Defense
DOE U.S. Department of Education
DTCC Depository Trust and Clearing Corporation
EBOPS Extended Balance of Payments Classification System
ECFMG Educational Commission for Foreign Medical Graduates
Abbreviation Definition
F&O Financial and operating
F.A.S. Free alongside ship
F.O.B. Free on board
FATS Foreign affiliates statistics
FCRS Foreign Credit Reporting System
FDIUS Foreign direct investment in the United States
FFIEC Federal Financial Institutions Examination Council
FISIM Financial intermediation services indirectly measured
FRB Federal Reserve Board
FRBNY Federal Reserve Bank of New York
GAAP Generally accepted accounting principles
GATS General Agreement on Trade in Services
GATT General Agreement on Tariffs and Trade
GDP Gross domestic product
GNI Gross national income
HS Harmonized Commodity Description and Coding System
I-0 Input-output
ICE Intercontinental Exchange
ICT Information and communication technology
IIE Institute of International Education
IIP International investment position
IMF International Monetary Fund
Abbreviations
Table continues

Bureau of Economic AnalysisU.S. International Economic Accounts: Concepts and Methods
vAbbreviations
Abbreviation Definition
IRS Internal Revenue Service
ISI International Surveys Industry
ISIC International Standard Industrial Classification
ITA(s) International Transactions Account(s)
MMF(s) Money market fund(s)
MNC Multinational company
MNE(s) Multinational enterprise(s)
MSCI Morgan Stanley Capital International
MSITS Manual on Statistics of International Trade in Services
NAICS North American Industry Classification System
NASS National Agricultural Statistics Service
NATO North Atlantic Treaty Organization
NAWS National Agricultural Workers Survey
NCD(s) Negotiable certificate(s) of deposit
n.i.e. Not included elsewhere
NIPA(s) National Income and Product Account(s)
NPISH(s) Nonprofit institution(s) serving households
NTTO National Travel and Tourism Office
OBE Office of Business Economics
OECD Organisation for Economic Co-operation and Development
OLFC Office of Foreign Labor Certification
Abbreviation Definition
OMB Office of Management and Budget
PP&E Property, plant, and equipment
R&D Research and development
SDR(s) Special drawing right(s)
SEVIS Student and Exchange Visitor System
SIAT Survey of International Air Travelers
SIC U.S. Standard Industrial Classification
SNA System of National Accounts
SOFR Secured Overnight Financing Rate
TIC Treasury International Capital
TIPS Treasury Inflation-Protected Securities
TRIPS Agreement on Trade-Related Aspects of Intellectual Property Rights
UBO Ultimate beneficial owner
UIS UNESCO Institute for Statistics
UN Comtrade
United Nations International Trade Statistics Database
UNCTAD United Nations Conference on Trade and Development
UNESCO United Nations Educational, Scientific, and Cultural Organization
USAID U.S. Agency for International Development
USDIA U.S. direct investment abroad
USPS U.S. Postal Service
WTO World Trade Organization
Bureau of Economic AnalysisU.S. International Economic Accounts: Concepts and Methods
viContents
Table of ContentsPart I. Introduction and Overview . . . . . . . . . . . . . . . . . . . . . . . . . . . . . . . . . . . . . . . . . . . . . . . . . . . . . . . . .1
Chapter 1. Purpose and Structure of the Accounts . . . . . . . . . . . . . . . . . . . . . . . . . . . . . . . . . . . . . .1
Chapter 2. Brief History of the Accounts . . . . . . . . . . . . . . . . . . . . . . . . . . . . . . . . . . . . . . . . . . . . . . . 4Overview of historical changes . . . . . . . . . . . . . . . . . . . . . . . . . . . . . . . . . . . . . . . . . . . . . . . . . . . . . . . . 5
Changes prior to the comprehensive restructuring . . . . . . . . . . . . . . . . . . . . . . . . . . . . . . . . . . . . 6Changes associated with the comprehensive restructuring of the accounts . . . . . . . . . . . . . 10Changes following the comprehensive restructuring . . . . . . . . . . . . . . . . . . . . . . . . . . . . . . . . . 13
Chapter 3. Data Sources . . . . . . . . . . . . . . . . . . . . . . . . . . . . . . . . . . . . . . . . . . . . . . . . . . . . . . . . . . . . . . 16BEA survey data . . . . . . . . . . . . . . . . . . . . . . . . . . . . . . . . . . . . . . . . . . . . . . . . . . . . . . . . . . . . . . . . . . . . 20
BEA data collection programs . . . . . . . . . . . . . . . . . . . . . . . . . . . . . . . . . . . . . . . . . . . . . . . . . . . . . 20Sampling . . . . . . . . . . . . . . . . . . . . . . . . . . . . . . . . . . . . . . . . . . . . . . . . . . . . . . . . . . . . . . . . . . . . . . . . 22Editing . . . . . . . . . . . . . . . . . . . . . . . . . . . . . . . . . . . . . . . . . . . . . . . . . . . . . . . . . . . . . . . . . . . . . . . . . . 22Universe estimation . . . . . . . . . . . . . . . . . . . . . . . . . . . . . . . . . . . . . . . . . . . . . . . . . . . . . . . . . . . . . . 22Data protection . . . . . . . . . . . . . . . . . . . . . . . . . . . . . . . . . . . . . . . . . . . . . . . . . . . . . . . . . . . . . . . . . . 24
Treasury International Capital survey data . . . . . . . . . . . . . . . . . . . . . . . . . . . . . . . . . . . . . . . . . . . . 24The TIC reporting system . . . . . . . . . . . . . . . . . . . . . . . . . . . . . . . . . . . . . . . . . . . . . . . . . . . . . . . . . 24
Chapter 4. Relationship to Other Economic Accounts . . . . . . . . . . . . . . . . . . . . . . . . . . . . . . . . . 28
Chapter 5. Release and Update Cycle . . . . . . . . . . . . . . . . . . . . . . . . . . . . . . . . . . . . . . . . . . . . . . . . . 30Update cycles for core International Economic Accounts . . . . . . . . . . . . . . . . . . . . . . . . . . . . . . 30
International Transactions Accounts . . . . . . . . . . . . . . . . . . . . . . . . . . . . . . . . . . . . . . . . . . . . . . . 30International Investment Position Accounts . . . . . . . . . . . . . . . . . . . . . . . . . . . . . . . . . . . . . . . . 31Statistics on the activities of multinational enterprises . . . . . . . . . . . . . . . . . . . . . . . . . . . . . . . 31
Update cycles for other international accounts . . . . . . . . . . . . . . . . . . . . . . . . . . . . . . . . . . . . . . . . 31Monthly goods and services statistics . . . . . . . . . . . . . . . . . . . . . . . . . . . . . . . . . . . . . . . . . . . . . . 31International services statistics . . . . . . . . . . . . . . . . . . . . . . . . . . . . . . . . . . . . . . . . . . . . . . . . . . . . 31Direct investment by country and industry statistics . . . . . . . . . . . . . . . . . . . . . . . . . . . . . . . . . 32Statistics on new foreign direct investment in the United States . . . . . . . . . . . . . . . . . . . . . . . 32
Dissemination of statistics and related analyses . . . . . . . . . . . . . . . . . . . . . . . . . . . . . . . . . . . . . . . . 32
Table continues
Bureau of Economic AnalysisU.S. International Economic Accounts: Concepts and Methods
viiContents
Part II. Conceptual Framework . . . . . . . . . . . . . . . . . . . . . . . . . . . . . . . . . . . . . . . . . . . . . . . . . . . . . . . . . . 34
Chapter 6. Economic Territory and Residence . . . . . . . . . . . . . . . . . . . . . . . . . . . . . . . . . . . . . . . . 34Economic territory . . . . . . . . . . . . . . . . . . . . . . . . . . . . . . . . . . . . . . . . . . . . . . . . . . . . . . . . . . . . . . . . . . 34Residence . . . . . . . . . . . . . . . . . . . . . . . . . . . . . . . . . . . . . . . . . . . . . . . . . . . . . . . . . . . . . . . . . . . . . . . . . . . 35
Individuals . . . . . . . . . . . . . . . . . . . . . . . . . . . . . . . . . . . . . . . . . . . . . . . . . . . . . . . . . . . . . . . . . . . . . . 35Business enterprises and nonprofit institutions . . . . . . . . . . . . . . . . . . . . . . . . . . . . . . . . . . . . . . 36General government . . . . . . . . . . . . . . . . . . . . . . . . . . . . . . . . . . . . . . . . . . . . . . . . . . . . . . . . . . . . . . 36International organizations . . . . . . . . . . . . . . . . . . . . . . . . . . . . . . . . . . . . . . . . . . . . . . . . . . . . . . . 37Partner country classifications . . . . . . . . . . . . . . . . . . . . . . . . . . . . . . . . . . . . . . . . . . . . . . . . . . . . 37
Chapter 7. Institutional Units and Sectors . . . . . . . . . . . . . . . . . . . . . . . . . . . . . . . . . . . . . . . . . . . . . 38Institutional units . . . . . . . . . . . . . . . . . . . . . . . . . . . . . . . . . . . . . . . . . . . . . . . . . . . . . . . . . . . . . . . . . . . 38Institutional sectors . . . . . . . . . . . . . . . . . . . . . . . . . . . . . . . . . . . . . . . . . . . . . . . . . . . . . . . . . . . . . . . . . 39
Chapter 8. Accounting Principles . . . . . . . . . . . . . . . . . . . . . . . . . . . . . . . . . . . . . . . . . . . . . . . . . . . . . 41Flows and positions . . . . . . . . . . . . . . . . . . . . . . . . . . . . . . . . . . . . . . . . . . . . . . . . . . . . . . . . . . . . . . . . . 41Double-entry principle . . . . . . . . . . . . . . . . . . . . . . . . . . . . . . . . . . . . . . . . . . . . . . . . . . . . . . . . . . . . . . 42Accounting periods, time of recording, and change in ownership . . . . . . . . . . . . . . . . . . . . . . . 43Valuation . . . . . . . . . . . . . . . . . . . . . . . . . . . . . . . . . . . . . . . . . . . . . . . . . . . . . . . . . . . . . . . . . . . . . . . . . . . 45Prices . . . . . . . . . . . . . . . . . . . . . . . . . . . . . . . . . . . . . . . . . . . . . . . . . . . . . . . . . . . . . . . . . . . . . . . . . . . . . . 45Gross and net recording . . . . . . . . . . . . . . . . . . . . . . . . . . . . . . . . . . . . . . . . . . . . . . . . . . . . . . . . . . . . . 46
Chapter 9. Classification of Transactions and Positions . . . . . . . . . . . . . . . . . . . . . . . . . . . . . . . 48Current and capital accounts . . . . . . . . . . . . . . . . . . . . . . . . . . . . . . . . . . . . . . . . . . . . . . . . . . . . . . . . . 48
Goods versus services . . . . . . . . . . . . . . . . . . . . . . . . . . . . . . . . . . . . . . . . . . . . . . . . . . . . . . . . . . . . . 48Primary income versus services . . . . . . . . . . . . . . . . . . . . . . . . . . . . . . . . . . . . . . . . . . . . . . . . . . . 49Current versus capital transfers . . . . . . . . . . . . . . . . . . . . . . . . . . . . . . . . . . . . . . . . . . . . . . . . . . . 50
Financial assets and liabilities . . . . . . . . . . . . . . . . . . . . . . . . . . . . . . . . . . . . . . . . . . . . . . . . . . . . . . . . 50Classification by type of instrument . . . . . . . . . . . . . . . . . . . . . . . . . . . . . . . . . . . . . . . . . . . . . . . . 51Classifications by maturity, currency, and sector . . . . . . . . . . . . . . . . . . . . . . . . . . . . . . . . . . . . 54Functional categories . . . . . . . . . . . . . . . . . . . . . . . . . . . . . . . . . . . . . . . . . . . . . . . . . . . . . . . . . . . . . 55
Table continues

Contents
Bureau of Economic AnalysisU.S. International Economic Accounts: Concepts and Methods
viii
Part III. Statistical Methodology of International Transactions Accounts . . . . . . . . . . . . . . . . . 63
Chapter 10. Introduction to the International Transactions Accounts . . . . . . . . . . . . . . . . . 63Seasonal adjustment . . . . . . . . . . . . . . . . . . . . . . . . . . . . . . . . . . . . . . . . . . . . . . . . . . . . . . . . . . . . . . . . . 67
Chapter 11. Current-Account Goods . . . . . . . . . . . . . . . . . . . . . . . . . . . . . . . . . . . . . . . . . . . . . . . . . . 70Concepts and coverage . . . . . . . . . . . . . . . . . . . . . . . . . . . . . . . . . . . . . . . . . . . . . . . . . . . . . . . . . . . . . . 70
Departures from BPM6 . . . . . . . . . . . . . . . . . . . . . . . . . . . . . . . . . . . . . . . . . . . . . . . . . . . . . . . . . . . 73Data sources . . . . . . . . . . . . . . . . . . . . . . . . . . . . . . . . . . . . . . . . . . . . . . . . . . . . . . . . . . . . . . . . . . . . . . . . 75Estimation methods . . . . . . . . . . . . . . . . . . . . . . . . . . . . . . . . . . . . . . . . . . . . . . . . . . . . . . . . . . . . . . . . . 75
Published components . . . . . . . . . . . . . . . . . . . . . . . . . . . . . . . . . . . . . . . . . . . . . . . . . . . . . . . . . . . . 77Goods, Census basis . . . . . . . . . . . . . . . . . . . . . . . . . . . . . . . . . . . . . . . . . . . . . . . . . . . . . . . . . . . . . . 78Balance of payments adjustments to Census-basis data . . . . . . . . . . . . . . . . . . . . . . . . . . . . . . 79
Chapter 12. Current-Account Services . . . . . . . . . . . . . . . . . . . . . . . . . . . . . . . . . . . . . . . . . . . . . . . . 83Concepts and coverage . . . . . . . . . . . . . . . . . . . . . . . . . . . . . . . . . . . . . . . . . . . . . . . . . . . . . . . . . . . . . . 83
Departures from BPM6 . . . . . . . . . . . . . . . . . . . . . . . . . . . . . . . . . . . . . . . . . . . . . . . . . . . . . . . . . . . 86Data sources . . . . . . . . . . . . . . . . . . . . . . . . . . . . . . . . . . . . . . . . . . . . . . . . . . . . . . . . . . . . . . . . . . . . . . . . 87
BEA survey data . . . . . . . . . . . . . . . . . . . . . . . . . . . . . . . . . . . . . . . . . . . . . . . . . . . . . . . . . . . . . . . . . 89Estimation methods . . . . . . . . . . . . . . . . . . . . . . . . . . . . . . . . . . . . . . . . . . . . . . . . . . . . . . . . . . . . . . . . . 92
Manufacturing services on physical inputs owned by others . . . . . . . . . . . . . . . . . . . . . . . . . . 92Maintenance and repair services n .i .e . . . . . . . . . . . . . . . . . . . . . . . . . . . . . . . . . . . . . . . . . . . . . . . 93Transport . . . . . . . . . . . . . . . . . . . . . . . . . . . . . . . . . . . . . . . . . . . . . . . . . . . . . . . . . . . . . . . . . . . . . . . 93Travel ( for all purposes including education) . . . . . . . . . . . . . . . . . . . . . . . . . . . . . . . . . . . . . . . 98Construction . . . . . . . . . . . . . . . . . . . . . . . . . . . . . . . . . . . . . . . . . . . . . . . . . . . . . . . . . . . . . . . . . . . . 101Insurance services . . . . . . . . . . . . . . . . . . . . . . . . . . . . . . . . . . . . . . . . . . . . . . . . . . . . . . . . . . . . . . . 102Financial services . . . . . . . . . . . . . . . . . . . . . . . . . . . . . . . . . . . . . . . . . . . . . . . . . . . . . . . . . . . . . . . 106Charges for the use of intellectual property n .i .e . . . . . . . . . . . . . . . . . . . . . . . . . . . . . . . . . . . . . 108Telecommunications, computer, and information services . . . . . . . . . . . . . . . . . . . . . . . . . . . . 111Other business services . . . . . . . . . . . . . . . . . . . . . . . . . . . . . . . . . . . . . . . . . . . . . . . . . . . . . . . . . . . 111Personal, cultural, and recreational services . . . . . . . . . . . . . . . . . . . . . . . . . . . . . . . . . . . . . . . .112Government goods and services n .i .e . . . . . . . . . . . . . . . . . . . . . . . . . . . . . . . . . . . . . . . . . . . . . . . 114
Table continues

Contents
Bureau of Economic AnalysisU.S. International Economic Accounts: Concepts and Methods
ix
Chapter 13. Current-Account Primary Income . . . . . . . . . . . . . . . . . . . . . . . . . . . . . . . . . . . . . . . 116Concepts and coverage . . . . . . . . . . . . . . . . . . . . . . . . . . . . . . . . . . . . . . . . . . . . . . . . . . . . . . . . . . . . . 116
Departures from BPM6 . . . . . . . . . . . . . . . . . . . . . . . . . . . . . . . . . . . . . . . . . . . . . . . . . . . . . . . . . . .117Data sources . . . . . . . . . . . . . . . . . . . . . . . . . . . . . . . . . . . . . . . . . . . . . . . . . . . . . . . . . . . . . . . . . . . . . . . 118Estimation methods . . . . . . . . . . . . . . . . . . . . . . . . . . . . . . . . . . . . . . . . . . . . . . . . . . . . . . . . . . . . . . . . 120
Investment income: direct investment income . . . . . . . . . . . . . . . . . . . . . . . . . . . . . . . . . . . . . . 120Investment income: portfolio investment income . . . . . . . . . . . . . . . . . . . . . . . . . . . . . . . . . . . 125Investment income: other investment income . . . . . . . . . . . . . . . . . . . . . . . . . . . . . . . . . . . . . . 127Income attributable to insurance policy holders . . . . . . . . . . . . . . . . . . . . . . . . . . . . . . . . . . . . 129Investment income: reserve asset income . . . . . . . . . . . . . . . . . . . . . . . . . . . . . . . . . . . . . . . . . . 130Compensation of employees . . . . . . . . . . . . . . . . . . . . . . . . . . . . . . . . . . . . . . . . . . . . . . . . . . . . . . 130
Chapter 14. Current-Account Secondary Income . . . . . . . . . . . . . . . . . . . . . . . . . . . . . . . . . . . . . 135Concepts and coverage . . . . . . . . . . . . . . . . . . . . . . . . . . . . . . . . . . . . . . . . . . . . . . . . . . . . . . . . . . . . . 135
Departures from BPM6 . . . . . . . . . . . . . . . . . . . . . . . . . . . . . . . . . . . . . . . . . . . . . . . . . . . . . . . . . . 136Data sources . . . . . . . . . . . . . . . . . . . . . . . . . . . . . . . . . . . . . . . . . . . . . . . . . . . . . . . . . . . . . . . . . . . . . . . 136Estimation methods . . . . . . . . . . . . . . . . . . . . . . . . . . . . . . . . . . . . . . . . . . . . . . . . . . . . . . . . . . . . . . . . 136
General government transfers receipts . . . . . . . . . . . . . . . . . . . . . . . . . . . . . . . . . . . . . . . . . . . . 138Private transfers receipts . . . . . . . . . . . . . . . . . . . . . . . . . . . . . . . . . . . . . . . . . . . . . . . . . . . . . . . . 139General government transfers (payments) . . . . . . . . . . . . . . . . . . . . . . . . . . . . . . . . . . . . . . . . . 139Private transfer payments . . . . . . . . . . . . . . . . . . . . . . . . . . . . . . . . . . . . . . . . . . . . . . . . . . . . . . . 142
Chapter 15. Capital Account . . . . . . . . . . . . . . . . . . . . . . . . . . . . . . . . . . . . . . . . . . . . . . . . . . . . . . . . . 145Concepts and coverage . . . . . . . . . . . . . . . . . . . . . . . . . . . . . . . . . . . . . . . . . . . . . . . . . . . . . . . . . . . . . 145
Departures from BPM6 . . . . . . . . . . . . . . . . . . . . . . . . . . . . . . . . . . . . . . . . . . . . . . . . . . . . . . . . . . 145Data sources . . . . . . . . . . . . . . . . . . . . . . . . . . . . . . . . . . . . . . . . . . . . . . . . . . . . . . . . . . . . . . . . . . . . . . . 145
BEA survey data . . . . . . . . . . . . . . . . . . . . . . . . . . . . . . . . . . . . . . . . . . . . . . . . . . . . . . . . . . . . . . . . 145Other data . . . . . . . . . . . . . . . . . . . . . . . . . . . . . . . . . . . . . . . . . . . . . . . . . . . . . . . . . . . . . . . . . . . . . 146
Estimation methods . . . . . . . . . . . . . . . . . . . . . . . . . . . . . . . . . . . . . . . . . . . . . . . . . . . . . . . . . . . . . . . . 146Capital transfers . . . . . . . . . . . . . . . . . . . . . . . . . . . . . . . . . . . . . . . . . . . . . . . . . . . . . . . . . . . . . . . . 146Acquisition and disposal of nonproduced nonfinancial assets . . . . . . . . . . . . . . . . . . . . . . . . 147
Chapter 16. Financial-Account Direct Investment . . . . . . . . . . . . . . . . . . . . . . . . . . . . . . . . . . . . 148Concepts and coverage . . . . . . . . . . . . . . . . . . . . . . . . . . . . . . . . . . . . . . . . . . . . . . . . . . . . . . . . . . . . . 148
Departures from BPM6 . . . . . . . . . . . . . . . . . . . . . . . . . . . . . . . . . . . . . . . . . . . . . . . . . . . . . . . . . 150Data sources . . . . . . . . . . . . . . . . . . . . . . . . . . . . . . . . . . . . . . . . . . . . . . . . . . . . . . . . . . . . . . . . . . . . . . . 151Estimation methods . . . . . . . . . . . . . . . . . . . . . . . . . . . . . . . . . . . . . . . . . . . . . . . . . . . . . . . . . . . . . . . . 151
Equity . . . . . . . . . . . . . . . . . . . . . . . . . . . . . . . . . . . . . . . . . . . . . . . . . . . . . . . . . . . . . . . . . . . . . . . . . .151Special issues . . . . . . . . . . . . . . . . . . . . . . . . . . . . . . . . . . . . . . . . . . . . . . . . . . . . . . . . . . . . . . . . . . . 155
Table continues

Contents
Bureau of Economic AnalysisU.S. International Economic Accounts: Concepts and Methods
x
Chapter 17. Financial-Account Portfolio Investment . . . . . . . . . . . . . . . . . . . . . . . . . . . . . . . . . 158Concepts and coverage . . . . . . . . . . . . . . . . . . . . . . . . . . . . . . . . . . . . . . . . . . . . . . . . . . . . . . . . . . . . . 158
Departures from BPM6 . . . . . . . . . . . . . . . . . . . . . . . . . . . . . . . . . . . . . . . . . . . . . . . . . . . . . . . . . . 159Data sources . . . . . . . . . . . . . . . . . . . . . . . . . . . . . . . . . . . . . . . . . . . . . . . . . . . . . . . . . . . . . . . . . . . . . . . 160Estimation methods . . . . . . . . . . . . . . . . . . . . . . . . . . . . . . . . . . . . . . . . . . . . . . . . . . . . . . . . . . . . . . . . 161
Short-term debt securities and NCDs of any maturity . . . . . . . . . . . . . . . . . . . . . . . . . . . . . . . .161Equity and long-term debt securities, excluding long-term NCDs . . . . . . . . . . . . . . . . . . . . 162
Chapter 18. Financial-Account Other Investment . . . . . . . . . . . . . . . . . . . . . . . . . . . . . . . . . . . . 167Concepts and coverage . . . . . . . . . . . . . . . . . . . . . . . . . . . . . . . . . . . . . . . . . . . . . . . . . . . . . . . . . . . . . 167
Departures from BPM6 . . . . . . . . . . . . . . . . . . . . . . . . . . . . . . . . . . . . . . . . . . . . . . . . . . . . . . . . . . 169Data sources . . . . . . . . . . . . . . . . . . . . . . . . . . . . . . . . . . . . . . . . . . . . . . . . . . . . . . . . . . . . . . . . . . . . . . . 169Estimation methods . . . . . . . . . . . . . . . . . . . . . . . . . . . . . . . . . . . . . . . . . . . . . . . . . . . . . . . . . . . . . . . . .171
Other equity . . . . . . . . . . . . . . . . . . . . . . . . . . . . . . . . . . . . . . . . . . . . . . . . . . . . . . . . . . . . . . . . . . . . .171Currency . . . . . . . . . . . . . . . . . . . . . . . . . . . . . . . . . . . . . . . . . . . . . . . . . . . . . . . . . . . . . . . . . . . . . . . .171Deposits . . . . . . . . . . . . . . . . . . . . . . . . . . . . . . . . . . . . . . . . . . . . . . . . . . . . . . . . . . . . . . . . . . . . . . . . 172Loans . . . . . . . . . . . . . . . . . . . . . . . . . . . . . . . . . . . . . . . . . . . . . . . . . . . . . . . . . . . . . . . . . . . . . . . . . . 173Insurance technical reserves . . . . . . . . . . . . . . . . . . . . . . . . . . . . . . . . . . . . . . . . . . . . . . . . . . . . . 174Trade credit and advances . . . . . . . . . . . . . . . . . . . . . . . . . . . . . . . . . . . . . . . . . . . . . . . . . . . . . . . 174Special drawing rights (SDR) allocations . . . . . . . . . . . . . . . . . . . . . . . . . . . . . . . . . . . . . . . . . . 175
Chapter 19. Financial-Account Reserve Assets . . . . . . . . . . . . . . . . . . . . . . . . . . . . . . . . . . . . . . . 176Concepts and coverage . . . . . . . . . . . . . . . . . . . . . . . . . . . . . . . . . . . . . . . . . . . . . . . . . . . . . . . . . . . . . 176
Departures from BPM6 . . . . . . . . . . . . . . . . . . . . . . . . . . . . . . . . . . . . . . . . . . . . . . . . . . . . . . . . . . 176Data sources . . . . . . . . . . . . . . . . . . . . . . . . . . . . . . . . . . . . . . . . . . . . . . . . . . . . . . . . . . . . . . . . . . . . . . . 177Estimation methods . . . . . . . . . . . . . . . . . . . . . . . . . . . . . . . . . . . . . . . . . . . . . . . . . . . . . . . . . . . . . . . . 177
Monetary gold . . . . . . . . . . . . . . . . . . . . . . . . . . . . . . . . . . . . . . . . . . . . . . . . . . . . . . . . . . . . . . . . . . 177Special drawing rights (SDRs) . . . . . . . . . . . . . . . . . . . . . . . . . . . . . . . . . . . . . . . . . . . . . . . . . . . . 177Reserve position in the IMF . . . . . . . . . . . . . . . . . . . . . . . . . . . . . . . . . . . . . . . . . . . . . . . . . . . . . . 178Other reserve assets . . . . . . . . . . . . . . . . . . . . . . . . . . . . . . . . . . . . . . . . . . . . . . . . . . . . . . . . . . . . . 178
Chapter 20. Financial-Account Financial Derivatives Other Than Reserves . . . . . . . . . . 180Concepts and coverage . . . . . . . . . . . . . . . . . . . . . . . . . . . . . . . . . . . . . . . . . . . . . . . . . . . . . . . . . . . . . 180
Departures from BPM6 . . . . . . . . . . . . . . . . . . . . . . . . . . . . . . . . . . . . . . . . . . . . . . . . . . . . . . . . . . 180Data sources . . . . . . . . . . . . . . . . . . . . . . . . . . . . . . . . . . . . . . . . . . . . . . . . . . . . . . . . . . . . . . . . . . . . . . . 181Estimation methods . . . . . . . . . . . . . . . . . . . . . . . . . . . . . . . . . . . . . . . . . . . . . . . . . . . . . . . . . . . . . . . . 181
Table continues
Contents
Bureau of Economic AnalysisU.S. International Economic Accounts: Concepts and Methods
xi
Chapter 21. Statistical Discrepancy and Balances . . . . . . . . . . . . . . . . . . . . . . . . . . . . . . . . . . . . . 182Statistical discrepancy . . . . . . . . . . . . . . . . . . . . . . . . . . . . . . . . . . . . . . . . . . . . . . . . . . . . . . . . . . . . . . 182Balances . . . . . . . . . . . . . . . . . . . . . . . . . . . . . . . . . . . . . . . . . . . . . . . . . . . . . . . . . . . . . . . . . . . . . . . . . . . 183
Balance on current account . . . . . . . . . . . . . . . . . . . . . . . . . . . . . . . . . . . . . . . . . . . . . . . . . . . . . . 183Balance on capital account . . . . . . . . . . . . . . . . . . . . . . . . . . . . . . . . . . . . . . . . . . . . . . . . . . . . . . . 184Net lending or net borrowing from current- and capital-account transactions . . . . . . . . . 184Net lending or net borrowing from financial-account transactions . . . . . . . . . . . . . . . . . . . 184
Part IV. Statistical Methodology of International Investment Position Accounts . . . . . . . . . 185
Chapter 22. Introduction to the International Investment Position Accounts . . . . . . . . . 185
Chapter 23. Direct Investment . . . . . . . . . . . . . . . . . . . . . . . . . . . . . . . . . . . . . . . . . . . . . . . . . . . . . . . 189Concepts and coverage . . . . . . . . . . . . . . . . . . . . . . . . . . . . . . . . . . . . . . . . . . . . . . . . . . . . . . . . . . . . . 189
Departures from BPM6 . . . . . . . . . . . . . . . . . . . . . . . . . . . . . . . . . . . . . . . . . . . . . . . . . . . . . . . . . 190Data sources . . . . . . . . . . . . . . . . . . . . . . . . . . . . . . . . . . . . . . . . . . . . . . . . . . . . . . . . . . . . . . . . . . . . . . . 190
BEA data . . . . . . . . . . . . . . . . . . . . . . . . . . . . . . . . . . . . . . . . . . . . . . . . . . . . . . . . . . . . . . . . . . . . . . . 190Other data . . . . . . . . . . . . . . . . . . . . . . . . . . . . . . . . . . . . . . . . . . . . . . . . . . . . . . . . . . . . . . . . . . . . . . .191
Estimation methods . . . . . . . . . . . . . . . . . . . . . . . . . . . . . . . . . . . . . . . . . . . . . . . . . . . . . . . . . . . . . . . . 191Historical cost . . . . . . . . . . . . . . . . . . . . . . . . . . . . . . . . . . . . . . . . . . . . . . . . . . . . . . . . . . . . . . . . . . .191Market value . . . . . . . . . . . . . . . . . . . . . . . . . . . . . . . . . . . . . . . . . . . . . . . . . . . . . . . . . . . . . . . . . . . 195Current cost . . . . . . . . . . . . . . . . . . . . . . . . . . . . . . . . . . . . . . . . . . . . . . . . . . . . . . . . . . . . . . . . . . . . 195
Chapter 24. Portfolio Investment . . . . . . . . . . . . . . . . . . . . . . . . . . . . . . . . . . . . . . . . . . . . . . . . . . . . 198Concepts and coverage . . . . . . . . . . . . . . . . . . . . . . . . . . . . . . . . . . . . . . . . . . . . . . . . . . . . . . . . . . . . . 198
Departures from BPM6 . . . . . . . . . . . . . . . . . . . . . . . . . . . . . . . . . . . . . . . . . . . . . . . . . . . . . . . . . . 198Data sources . . . . . . . . . . . . . . . . . . . . . . . . . . . . . . . . . . . . . . . . . . . . . . . . . . . . . . . . . . . . . . . . . . . . . . . 198Estimation methods . . . . . . . . . . . . . . . . . . . . . . . . . . . . . . . . . . . . . . . . . . . . . . . . . . . . . . . . . . . . . . . .200
Short-term debt securities and NCDs of any maturity . . . . . . . . . . . . . . . . . . . . . . . . . . . . . . . 200Equity and long-term debt securities, excluding long-term NCDs . . . . . . . . . . . . . . . . . . . . 201
Chapter 25. Financial Derivatives Other Than Reserves . . . . . . . . . . . . . . . . . . . . . . . . . . . . . . 204Concepts and coverage . . . . . . . . . . . . . . . . . . . . . . . . . . . . . . . . . . . . . . . . . . . . . . . . . . . . . . . . . . . . .204
Departures from BPM6 . . . . . . . . . . . . . . . . . . . . . . . . . . . . . . . . . . . . . . . . . . . . . . . . . . . . . . . . . . 204Data sources . . . . . . . . . . . . . . . . . . . . . . . . . . . . . . . . . . . . . . . . . . . . . . . . . . . . . . . . . . . . . . . . . . . . . . .204Estimation methods . . . . . . . . . . . . . . . . . . . . . . . . . . . . . . . . . . . . . . . . . . . . . . . . . . . . . . . . . . . . . . . . 205
Table continues

Contents
Bureau of Economic AnalysisU.S. International Economic Accounts: Concepts and Methods
xii
Chapter 26. Other Investment . . . . . . . . . . . . . . . . . . . . . . . . . . . . . . . . . . . . . . . . . . . . . . . . . . . . . . . 206Concepts and coverage . . . . . . . . . . . . . . . . . . . . . . . . . . . . . . . . . . . . . . . . . . . . . . . . . . . . . . . . . . . . .206
Departures from BPM6 . . . . . . . . . . . . . . . . . . . . . . . . . . . . . . . . . . . . . . . . . . . . . . . . . . . . . . . . . . 206Data sources . . . . . . . . . . . . . . . . . . . . . . . . . . . . . . . . . . . . . . . . . . . . . . . . . . . . . . . . . . . . . . . . . . . . . . . 207Estimation methods . . . . . . . . . . . . . . . . . . . . . . . . . . . . . . . . . . . . . . . . . . . . . . . . . . . . . . . . . . . . . . . .208
Other equity . . . . . . . . . . . . . . . . . . . . . . . . . . . . . . . . . . . . . . . . . . . . . . . . . . . . . . . . . . . . . . . . . . . . 208Currency . . . . . . . . . . . . . . . . . . . . . . . . . . . . . . . . . . . . . . . . . . . . . . . . . . . . . . . . . . . . . . . . . . . . . . . 209Deposits . . . . . . . . . . . . . . . . . . . . . . . . . . . . . . . . . . . . . . . . . . . . . . . . . . . . . . . . . . . . . . . . . . . . . . . . 210Loans . . . . . . . . . . . . . . . . . . . . . . . . . . . . . . . . . . . . . . . . . . . . . . . . . . . . . . . . . . . . . . . . . . . . . . . . . . .211Insurance technical reserves . . . . . . . . . . . . . . . . . . . . . . . . . . . . . . . . . . . . . . . . . . . . . . . . . . . . . 213Trade credit and advances . . . . . . . . . . . . . . . . . . . . . . . . . . . . . . . . . . . . . . . . . . . . . . . . . . . . . . . 213Special drawing rights (SDR) allocations . . . . . . . . . . . . . . . . . . . . . . . . . . . . . . . . . . . . . . . . . . 214
Chapter 27. Reserve Assets . . . . . . . . . . . . . . . . . . . . . . . . . . . . . . . . . . . . . . . . . . . . . . . . . . . . . . . . . . 216Concepts and coverage . . . . . . . . . . . . . . . . . . . . . . . . . . . . . . . . . . . . . . . . . . . . . . . . . . . . . . . . . . . . . 216
Departures from BPM6 . . . . . . . . . . . . . . . . . . . . . . . . . . . . . . . . . . . . . . . . . . . . . . . . . . . . . . . . . . 216Data sources . . . . . . . . . . . . . . . . . . . . . . . . . . . . . . . . . . . . . . . . . . . . . . . . . . . . . . . . . . . . . . . . . . . . . . . 216Estimation methods . . . . . . . . . . . . . . . . . . . . . . . . . . . . . . . . . . . . . . . . . . . . . . . . . . . . . . . . . . . . . . . . 217
Monetary gold . . . . . . . . . . . . . . . . . . . . . . . . . . . . . . . . . . . . . . . . . . . . . . . . . . . . . . . . . . . . . . . . . . 217Special drawing rights (SDRs) . . . . . . . . . . . . . . . . . . . . . . . . . . . . . . . . . . . . . . . . . . . . . . . . . . . . 218Reserve position in the IMF . . . . . . . . . . . . . . . . . . . . . . . . . . . . . . . . . . . . . . . . . . . . . . . . . . . . . . 219Other reserve assets . . . . . . . . . . . . . . . . . . . . . . . . . . . . . . . . . . . . . . . . . . . . . . . . . . . . . . . . . . . . . 219
Part V. Methodology of Statistics on the Activities of Multinational Enterprises . . . . . . . . . 221
Chapter 28. Statistics on the Activities of Multinational Enterprises. . . . . . . . . . . . . . . . . . 221Concepts and coverage . . . . . . . . . . . . . . . . . . . . . . . . . . . . . . . . . . . . . . . . . . . . . . . . . . . . . . . . . . . . . 221
Statistics on the activities of multinational enterprises and BPM6 . . . . . . . . . . . . . . . . . . . 223Data sources . . . . . . . . . . . . . . . . . . . . . . . . . . . . . . . . . . . . . . . . . . . . . . . . . . . . . . . . . . . . . . . . . . . . . . . 224Estimation methods . . . . . . . . . . . . . . . . . . . . . . . . . . . . . . . . . . . . . . . . . . . . . . . . . . . . . . . . . . . . . . . . 225
Balance sheets and income statements . . . . . . . . . . . . . . . . . . . . . . . . . . . . . . . . . . . . . . . . . . . . 225Sales by type and destination . . . . . . . . . . . . . . . . . . . . . . . . . . . . . . . . . . . . . . . . . . . . . . . . . . . . . 226Value added . . . . . . . . . . . . . . . . . . . . . . . . . . . . . . . . . . . . . . . . . . . . . . . . . . . . . . . . . . . . . . . . . . . . 229Employment and employee compensation . . . . . . . . . . . . . . . . . . . . . . . . . . . . . . . . . . . . . . . . . 231U .S . trade in goods . . . . . . . . . . . . . . . . . . . . . . . . . . . . . . . . . . . . . . . . . . . . . . . . . . . . . . . . . . . . . . . 231Research and development (R&D) . . . . . . . . . . . . . . . . . . . . . . . . . . . . . . . . . . . . . . . . . . . . . . . . 232Expenditures for property, plant, and equipment (PP&E) . . . . . . . . . . . . . . . . . . . . . . . . . . . . 232Taxes . . . . . . . . . . . . . . . . . . . . . . . . . . . . . . . . . . . . . . . . . . . . . . . . . . . . . . . . . . . . . . . . . . . . . . . . . . 233
Table continues

Contents
Bureau of Economic AnalysisU.S. International Economic Accounts: Concepts and Methods
xiii
Classification . . . . . . . . . . . . . . . . . . . . . . . . . . . . . . . . . . . . . . . . . . . . . . . . . . . . . . . . . . . . . . . . . . . . . . 233Classification by country . . . . . . . . . . . . . . . . . . . . . . . . . . . . . . . . . . . . . . . . . . . . . . . . . . . . . . . . . 233Classification by U .S . state . . . . . . . . . . . . . . . . . . . . . . . . . . . . . . . . . . . . . . . . . . . . . . . . . . . . . . . 234Classification by industry or product . . . . . . . . . . . . . . . . . . . . . . . . . . . . . . . . . . . . . . . . . . . . . . 235
Part VI. Statistical Methodologies of Other International Accounts . . . . . . . . . . . . . . . . . . . . . . 237
Chapter 29. Introduction to Other International Accounts . . . . . . . . . . . . . . . . . . . . . . . . . . . 237
Chapter 30. Monthly Trade in Goods and Services . . . . . . . . . . . . . . . . . . . . . . . . . . . . . . . . . . . 239Trade in goods . . . . . . . . . . . . . . . . . . . . . . . . . . . . . . . . . . . . . . . . . . . . . . . . . . . . . . . . . . . . . . . . . . . . . 239Trade in services . . . . . . . . . . . . . . . . . . . . . . . . . . . . . . . . . . . . . . . . . . . . . . . . . . . . . . . . . . . . . . . . . . . 239Seasonal adjustment . . . . . . . . . . . . . . . . . . . . . . . . . . . . . . . . . . . . . . . . . . . . . . . . . . . . . . . . . . . . . . . .240
Chapter 31. International Services . . . . . . . . . . . . . . . . . . . . . . . . . . . . . . . . . . . . . . . . . . . . . . . . . . . 241Trade in services . . . . . . . . . . . . . . . . . . . . . . . . . . . . . . . . . . . . . . . . . . . . . . . . . . . . . . . . . . . . . . . . . . . 242Services Supplied Through Affiliates . . . . . . . . . . . . . . . . . . . . . . . . . . . . . . . . . . . . . . . . . . . . . . . . 245Comparing U.S. Trade in Services and Services Supplied Through Affiliates . . . . . . . . . . . . 245
Chapter 32. Direct Investment by Country and Industry . . . . . . . . . . . . . . . . . . . . . . . . . . . . . 246Quarterly statistics . . . . . . . . . . . . . . . . . . . . . . . . . . . . . . . . . . . . . . . . . . . . . . . . . . . . . . . . . . . . . . . . . 248Annual statistics . . . . . . . . . . . . . . . . . . . . . . . . . . . . . . . . . . . . . . . . . . . . . . . . . . . . . . . . . . . . . . . . . . . 250Reconciliation of quarterly, annual, and benchmark surveys of direct investment . . . . . . . 250
Discrepancies . . . . . . . . . . . . . . . . . . . . . . . . . . . . . . . . . . . . . . . . . . . . . . . . . . . . . . . . . . . . . . . . . . . 250Replacement of imputed and other estimated data . . . . . . . . . . . . . . . . . . . . . . . . . . . . . . . . . . 251Updates to the survey frame . . . . . . . . . . . . . . . . . . . . . . . . . . . . . . . . . . . . . . . . . . . . . . . . . . . . . . 252
Chapter 33. New Foreign Direct Investment in the United States . . . . . . . . . . . . . . . . . . . . . 253Concepts and Coverage . . . . . . . . . . . . . . . . . . . . . . . . . . . . . . . . . . . . . . . . . . . . . . . . . . . . . . . . . . . . . 253Data sources . . . . . . . . . . . . . . . . . . . . . . . . . . . . . . . . . . . . . . . . . . . . . . . . . . . . . . . . . . . . . . . . . . . . . . . 255Estimation methods . . . . . . . . . . . . . . . . . . . . . . . . . . . . . . . . . . . . . . . . . . . . . . . . . . . . . . . . . . . . . . . . 256Classification . . . . . . . . . . . . . . . . . . . . . . . . . . . . . . . . . . . . . . . . . . . . . . . . . . . . . . . . . . . . . . . . . . . . . . 256
Classification by country . . . . . . . . . . . . . . . . . . . . . . . . . . . . . . . . . . . . . . . . . . . . . . . . . . . . . . . . . 256Classification by industry . . . . . . . . . . . . . . . . . . . . . . . . . . . . . . . . . . . . . . . . . . . . . . . . . . . . . . . . 256Classification by U .S . state . . . . . . . . . . . . . . . . . . . . . . . . . . . . . . . . . . . . . . . . . . . . . . . . . . . . . . . 256
Table continues

Contents
Bureau of Economic AnalysisU.S. International Economic Accounts: Concepts and Methods
xiv
Part VII. Special Topics . . . . . . . . . . . . . . . . . . . . . . . . . . . . . . . . . . . . . . . . . . . . . . . . . . . . . . . . . . . . . . . . . 257
Chapter 34. Modes of Supply for International Services . . . . . . . . . . . . . . . . . . . . . . . . . . . . . . 257Services delivered via multiple modes of supply: the case of data recovery services . . . . . . 259Estimates of modes of supply for international services . . . . . . . . . . . . . . . . . . . . . . . . . . . . . . .260
Chapter 35. Bilateral Statistics. . . . . . . . . . . . . . . . . . . . . . . . . . . . . . . . . . . . . . . . . . . . . . . . . . . . . . . 262Merchandise trade . . . . . . . . . . . . . . . . . . . . . . . . . . . . . . . . . . . . . . . . . . . . . . . . . . . . . . . . . . . . . . . . . 264Services trade . . . . . . . . . . . . . . . . . . . . . . . . . . . . . . . . . . . . . . . . . . . . . . . . . . . . . . . . . . . . . . . . . . . . . . 265Direct investment and AMNE statistics . . . . . . . . . . . . . . . . . . . . . . . . . . . . . . . . . . . . . . . . . . . . . . 265International Trade and Investment Country Facts . . . . . . . . . . . . . . . . . . . . . . . . . . . . . . . . . . . 267
Part VIII. Supplemental Information . . . . . . . . . . . . . . . . . . . . . . . . . . . . . . . . . . . . . . . . . . . . . . . . . . . 268
Appendix A. U.S. International Economic Accounts: Internal and External Relationships . . . 268
Appendix B. The Treasury International Capital Reporting System Prior to December 2013 . . 270Other investment and short-term debt securities . . . . . . . . . . . . . . . . . . . . . . . . . . . . . . . . . . . . . 270Financial derivatives . . . . . . . . . . . . . . . . . . . . . . . . . . . . . . . . . . . . . . . . . . . . . . . . . . . . . . . . . . . . . . . 270Equity and long-term debt securities . . . . . . . . . . . . . . . . . . . . . . . . . . . . . . . . . . . . . . . . . . . . . . . . 271
Appendix C. Reliability of the Statistics . . . . . . . . . . . . . . . . . . . . . . . . . . . . . . . . . . . . . . . . . . . . . . 272
Appendix D. Source Data Availability and Projections . . . . . . . . . . . . . . . . . . . . . . . . . . . . . . . . 274
Glossary . . . . . . . . . . . . . . . . . . . . . . . . . . . . . . . . . . . . . . . . . . . . . . . . . . . . . . . . . . . . . . . . . . . . . . . . . . . . 286
Contents
Bureau of Economic AnalysisU.S. International Economic Accounts: Concepts and Methods
xv
List of Tables
Table 3.a. Overview of Data Sources Used in the Bureau of Economic Analysis (BEA) International Economic Accounts . . . . . . . . . . . . . . . . . . . . . . . . . . . . . . . . . . . . . . . . . . . . . . . . . . . . . . . . . . . 17
Table 3.b. Treasury International Capital (TIC) Reporting Forms . . . . . . . . . . . . . . . . . . . . . . . . . . . . . . 25
Table 5.a. Availability of Analytical Materials by Account . . . . . . . . . . . . . . . . . . . . . . . . . . . . . . . . . . . . . . 33
Table 10.a. Transactions Shown in International Transactions Accounts Table 1.2. U.S. International Transactions, Expanded Detail . . . . . . . . . . . . . . . . . . . . . . . . . . . . . . . . . . . . . . . . . . . . . 65
Table 11.a. Transactions Shown in International Transactions Accounts Table 2.1 U.S. International Trade in Goods . . . . . . . . . . . . . . . . . . . . . . . . . . . . . . . . . . . . . . . . . . . . . . . . . . . . . . . . . . . . 70
Table 11.b. Sources of Data for Current-Account Goods . . . . . . . . . . . . . . . . . . . . . . . . . . . . . . . . . . . . . . . . 76
Table 12.a. Transactions Shown in International Transactions Accounts Table 3.1. U.S. International Trade in Services . . . . . . . . . . . . . . . . . . . . . . . . . . . . . . . . . . . . . . . . . . . . . . . . . . . . . . . . . . 84
Table 12.b. Sources of Data for Current-Account Services . . . . . . . . . . . . . . . . . . . . . . . . . . . . . . . . . . . . . . 87
Table 13.a. Transactions Shown in International Transactions Accounts Table 4.1. U.S. International Transactions in Primary Income . . . . . . . . . . . . . . . . . . . . . . . . . . . . . . . . . . . . . . . . . . .117
Table 13.b. Sources of Data for Current-Account Primary Income . . . . . . . . . . . . . . . . . . . . . . . . . . . . . 118
Table 13.c. Direct Investment Income on the Asset/Liability Basis and on the Directional Basis . . . . . . . . . . . . . . . . . . . . . . . . . . . . . . . . . . . . . . . . . . . . . . . . . . . . . . . . . . . . . . . . . . . . . . . . . . 124
Table 13.d. Data Sources Used to Estimate Receipts of Compensation of Employees . . . . . . . . . . . . 133
Table 13.e. Data Sources Used to Estimate Payments of Compensation of Employees . . . . . . . . . . . 134
Table 14.a. Transactions Shown in International Transactions Account Table 5.1. U.S. International Transactions in Secondary Income . . . . . . . . . . . . . . . . . . . . . . . . . . . . . . . . . . . . . . . . 136
Table 14.b. Sources of Data for Current-Account Secondary Income . . . . . . . . . . . . . . . . . . . . . . . . . . . 137
Table 16.a. Transactions Shown in International Transactions Account Table 6.1. U.S. International Financial Transactions for Direct Investment . . . . . . . . . . . . . . . . . . . . . . . . . . . . . . 149
List continues
Contents
Bureau of Economic AnalysisU.S. International Economic Accounts: Concepts and Methods
xvi
Table 16.b. Direct Investment Financial Transactions on the Asset/Liability Basis and on the Directional Basis . . . . . . . . . . . . . . . . . . . . . . . . . . . . . . . . . . . . . . . . . . . . . . . . . . . . . . . . . . . . . . . . . . . . 154
Table 17.a. Transactions Shown in International Transactions Accounts Table 7.1. U.S. International Financial Transactions for Portfolio Investment . . . . . . . . . . . . . . . . . . . . . . . . . . . . 158
Table 17.b. Transactions in Short-Term Debt Securities and Negotiable Certificates of Deposit in ITA Tables 7.1 and 9.1, Directly Estimated from TIC B & C and DTCC Reported Holdings . . . . . . . . . . . . . . . . . . . . . . . . . . . . . . . . . . . . . . . . . . . . . . . . . . . . . . . . . . . . . . . . . . . . . . . . 161
Table 17.c. Transactions in Equity and Long-Term Debt Securities in ITA Tables 7.1 and 9.1, Directly Estimated from Valuation-Adjusted SLT Holdings . . . . . . . . . . . . . . . . . . . . . . . . . . . . . . . . . . . 163
Table 17.d. Transactions in Equity and Long-Term Debt Securities from Valuation-Adjusted SLT Holdings and Ratios From SLT Holdings Detail . . . . . . . . . . . . . . . . . . . . . . . . . . . . . . . . . . . . . . . . . 164
Table 18.a. Transactions Shown in International Transactions Accounts Table 8.1. U.S. International Financial Transactions for Other Investment . . . . . . . . . . . . . . . . . . . . . . . . . . . . . . . 167
Table 22.a. Positions Shown in International Investment Position Table 1.2. U.S. Net International Investment Position at the End of the Period, Expanded Detail . . . . . . . . . . . . . . . . . . 186
Table 23.a. Direct Investment Position on the Asset/Liability Basis and on the Directional Basis . . . . . . . . . . . . . . . . . . . . . . . . . . . . . . . . . . . . . . . . . . . . . . . . . . . . . . . . . . . . . . . . . . . . . . . . . . 192
Table 24.a: Portfolio Investment Source Data for the International Investment Position . . . . . . . . 199
Table 28.a. Adjustments to Produce Estimates of Goods and Services Supplied and Other Sales . . . . . . . . . . . . . . . . . . . . . . . . . . . . . . . . . . . . . . . . . . . . . . . . . . . . . . . . . . . . . . . . . . . . . . . . . . . . . . . . 228
Table 28.b. Industry Distribution of Sales and Classification of Entity by Industry . . . . . . . . . . . . . . 236
Table 31.a. Service Types in International Transactions Accounts Table 3.1 for Which Components are Shown Only in International Services Tables . . . . . . . . . . . . . . . . . . . . . . . . . 242
Table 32.a. Summary of Detail Available on Direct Investment Transactions, Income, and
Positions by Source . . . . . . . . . . . . . . . . . . . . . . . . . . . . . . . . . . . . . . . . . . . . . . . . . . . . . . . . . . . . . . . . . . . . . . . . 247
Table D.1. Availability of Source Data for Current Quarter ITAs and IIP Accounts and Projection Methods Used When Source Data are Unavailable . . . . . . . . . . . . . . . . . . . . . . . . . . . . . . . . . 275

Contents
Bureau of Economic AnalysisU.S. International Economic Accounts: Concepts and Methods
xvii
List of Figures
Figure 1.a. U.S. International Economic Accounts . . . . . . . . . . . . . . . . . . . . . . . . . . . . . . . . . . . . . . . . . . . . . . 1
Figure 9.a. Affiliates, Parents, and Ultimate Beneficial Owners in Direct Investment Relationships . . . . . . . . . . . . . . . . . . . . . . . . . . . . . . . . . . . . . . . . . . . . . . . . . . . . . . . . . . . . . 59
Figure 11.a. Comparison of BPM6 Recommendation and BEA Treatment of Goods for Processing and Manufacturing Services . . . . . . . . . . . . . . . . . . . . . . . . . . . . . . . . . . . . . . . . . . . . 74
Figure 12.a. Calculating Normal Losses . . . . . . . . . . . . . . . . . . . . . . . . . . . . . . . . . . . . . . . . . . . . . . . . . . . . . . 103
Figure 12.b. How Insurance Transactions are Recorded in the International Transactions Accounts . . . . . . . . . . . . . . . . . . . . . . . . . . . . . . . . . . . . . . . . . . . . . . . . . . . . . . . . 105
Figure 12.c. BEA Treatment of Selected Intellectual Property . . . . . . . . . . . . . . . . . . . . . . . . . . . . . . . . . 110
Figure 23.a. Translating Historical-Cost Equity Positions to Current-Cost Equity Positions . . . . . . . . . . . . . . . . . . . . . . . . . . . . . . . . . . . . . . . . . . . . . . . . . . . . . . . . . . . . . . 197
Figure 28.a. Double Counting Income in Ownership Chain . . . . . . . . . . . . . . . . . . . . . . . . . . . . . . . . . . . 226
Figure 28.b. U.S.- and Foreign-Headquartered U.S. MNEs Among Entities Covered by AMNE Statistics. . . . . . . . . . . . . . . . . . . . . . . . . . . . . . . . . . . . . . . . . . . . . . . . . . . . . . . . 234
Figure 32.a. Components of Financial Transactions in Direct Investment . . . . . . . . . . . . . . . . . . . . . . 249
Figure 33.a. Comparison of the Statistics on New Investment and the Financial Transactions Statistics . . . . . . . . . . . . . . . . . . . . . . . . . . . . . . . . . . . . . . . . . . . . . . . . . . . . . . . . . . . . 254
Figure 34.a. How Data Recovery Services are Supplied by the United States to the United Kingdom . . . . . . . . . . . . . . . . . . . . . . . . . . . . . . . . . . . . . . . . . . . . . . . . . . . . . . . . . . . . . . . . . . . . . 259
Figure A.1. Statistics in Common Among the U.S. International Economic Accounts . . . . . . . . . . . . 268
Figure A.2. Major Data Sources of, and Other Statistics that Depend on, the U.S. International Economic Accounts . . . . . . . . . . . . . . . . . . . . . . . . . . . . . . . . . . . . . . . . . . . . . . . . . . . 269

Part I. Introduction and Overview
Bureau of Economic AnalysisU.S. International Economic Accounts: Concepts and Methods
1
Part I. Introduction and Overview
Chapter 1. Purpose and Structure of the Accounts
1.1. The U.S. International Economic Accounts prepared by the U.S. Bureau of Economic Analysis (BEA), part of the U.S. Department of Commerce, provide timely, accurate, and relevant economic statistics that allow policymakers and other decision makers to understand the role of the United States in the global economy and the performance of the U.S. economy relative to other countries. The core accounts consist of the International Transactions Accounts (ITAs), the International Investment Position (IIP) Accounts, and statistics on the activities of multinational enterprises (AMNE).
1.2. Related to the core International Economic Accounts are other statistics, such as monthly trade in goods and services statistics, international services statistics, direct investment by country and industry statistics, and statistics on new foreign direct investment in the United States (see figure 1.a.). The statistics in these other international accounts provide additional infor-mation on specific aspects of the core accounts; as such, they can be viewed as belonging to the
International Economic AccountsBureau of Economic Analysis
Figure 1.a. U.S. International Economic Accounts
Direct investmentby country and
industry
New foreigndirect
investmentInternational
servicesMonthly goods
and services
InternationalInvestment
Position (IIP)Accounts
Activities ofmultinational
enterprises(AMNE)
InternationalTransactions
Accounts(ITAs)
Otherinternational
economicaccounts
U.S. Bureau of Economic Analysis
The “other” accounts shown here include only those discussed in detail in this volume.
To Contents

Part I. Introduction and Overview
Bureau of Economic AnalysisU.S. International Economic Accounts: Concepts and Methods
2
U.S. International Economic Accounts broadly construed. This volume focuses primarily on the core International Economic Accounts, but it also discusses these related statistics. Taken together, the core accounts and the other International Economic Accounts provide a comprehensive, integrated, and detailed picture of important and closely followed U.S. international economic activities. Figure A.1 in appendix A presents an overview of data items connecting the various U.S. International Economic Accounts.
1.3. The ITAs are a quarterly statistical summary of transactions between U.S. residents and non-residents organized into three major accounts: the current account, the capital account, and the financial account. The current account records exports and imports of goods and services, receipts and payments of primary income, and receipts and payments of secondary income (current trans-fers). The capital account records capital transfers, such as debt forgiveness, and transactions in nonproduced, nonfinancial assets. Both current- and capital-account data are used in compiling the U.S. National Income and Product Accounts (NIPAs) prepared by BEA. The financial account records investment transactions between U.S. residents and nonresidents for direct investment, portfolio investment, other investment, reserve assets, and financial derivatives. Financial-account data are used in compiling the Financial Accounts of the United States prepared by the Federal Reserve Board (FRB).
1.4. The IIP Accounts are a statistical summary of the quarter-end value of accumulated stocks of U.S. assets and U.S. liabilities, as well as the value of the net international position of the United States. Separate statistics are available for the value of accumulated stocks of direct investment, portfolio investment, other investment, reserve assets, and financial derivatives. Changes in positions arise from financial transactions, valuation changes, and other changes in volume and valuation. Data from the IIP Accounts are used in compiling national balance sheet statistics in the Financial Accounts of the United States prepared by the FRB.
1.5. BEA prepares statistics on the financial and operating activities of U.S. multinational enterprises (MNEs) and the U.S. affiliates of foreign MNEs using data it collects on its surveys of U.S. direct investment abroad and foreign direct investment in the United States. These activities of MNEs (or AMNE) statistics—which include data items such as sales; employment; value added; expenditures for property, plant, and equipment; and balance sheets—are critical for understanding the role played by MNEs in an increasingly integrated global economy.
1.6. Monthly statistics on trade in goods and services provide more frequent information on these two particular aspects of the ITAs. International services statistics provide detailed information drawn from the trade in services data used to construct the ITAs and from data collected to prepare the AMNE statistics. Direct investment by country and industry statistics provide additional coun-try and industry detail underlying the direct investment entries in the ITA current and financial accounts and in the IIP Accounts. Statistics on new foreign direct investment in the United States provide information related to aspects of the ITAs and the AMNE statistics.
To Contents

Part I. Introduction and Overview
Bureau of Economic AnalysisU.S. International Economic Accounts: Concepts and Methods
3
1.7. Both the core International Economic Accounts and the other international accounts broadly conform to international statistical guidelines. These guidelines provide a useful framework for understanding and tracking changes in economic relationships between countries and assist sta-tistical agencies in categorizing and measuring new developments in the real and financial sectors of the international economy. In addition, alignment with the guidelines facilitates comparisons between statistics produced by BEA and statistics produced by partner countries. International guidelines for International Economic Accounts are consistent and have been developed together with international guidelines for National Economic Accounts. As a result, BEA’s International Economic Accounts are highly consistent with, and in many cases feed directly into, BEA’s National Economic Accounts, such as the NIPAs. Figure A.2 in appendix A presents an overview of how statistics from the U.S. International Economic Accounts are incorporated into BEA’s National Economic Accounts. The comprehensiveness of the International Economic Accounts and their consistency with BEA’s national economic statistics and with statistics of partner countries pro-vides policymakers, researchers, and others with a strong statistical foundation for understanding and responding to international economic events.
1.8. International economic statistics that are comparable across countries allow assessments of rel-ative economic performance, facilitate trade negotiations, and provide the basis for tracking and analyzing the global economy. BEA’s International Economic Accounts are also used to study inter-national competitiveness and to formulate trade and investment policy. Data on direct investment and the activities of U.S. MNEs and U.S. affiliates of foreign MNEs are also used by businesses to assist in their decisions on the location of affiliates abroad, the hiring of foreign labor, and sales and purchases of goods and services abroad.
1.9. This volume is organized into 8 parts consisting of 35 chapters, 4 appendixes, and a glossary. Part I (chapters 1–5) provides an introduction and overview of the accounts and identifies data sources used in compiling the accounts. Part II (chapters 6–9) is a conceptual framework that provides descriptions of key concepts and principles that underlie the International Economic Accounts and that are critical for understanding and interpreting the statistics. Parts III, IV, and V provide summaries of statistical methodologies used for the three core International Economic Accounts, including data sources and estimation methods. Specifically, part III (chapters 10–21) covers the ITAs, part IV (chapters 22–27) covers the IIP Accounts, and part V (chapter 28) covers AMNE statistics. Part VI (chapters 29–33) discusses International Economic Accounts other than the three core accounts. Part VII (chapters 34 and 35) covers special topics in the International Economic Accounts. Part VIII provides supplemental information including appendixes and a glos-sary of terms.
To Contents
Part I. Introduction and Overview
Bureau of Economic AnalysisU.S. International Economic Accounts: Concepts and Methods
4
Chapter 2. Brief History of the Accounts
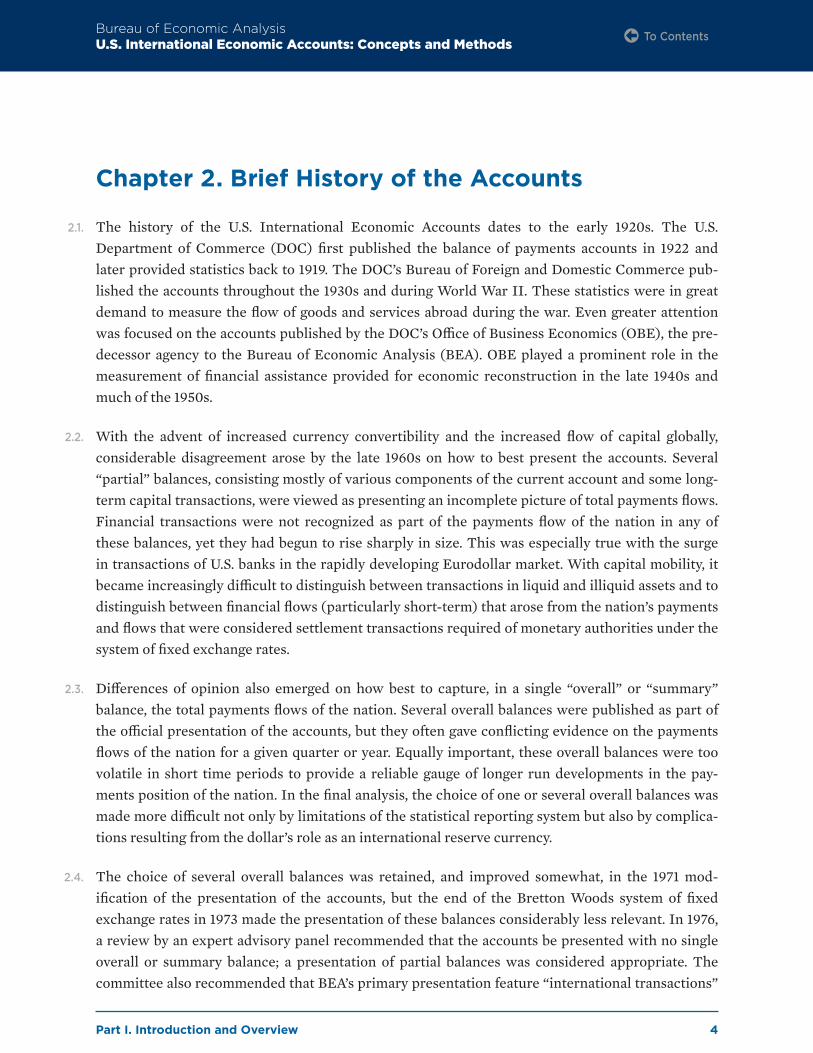
2.1. The history of the U.S. International Economic Accounts dates to the early 1920s. The U.S. Department of Commerce (DOC) first published the balance of payments accounts in 1922 and later provided statistics back to 1919. The DOC’s Bureau of Foreign and Domestic Commerce pub-lished the accounts throughout the 1930s and during World War II. These statistics were in great demand to measure the flow of goods and services abroad during the war. Even greater attention was focused on the accounts published by the DOC’s Office of Business Economics (OBE), the pre-decessor agency to the Bureau of Economic Analysis (BEA). OBE played a prominent role in the measurement of financial assistance provided for economic reconstruction in the late 1940s and much of the 1950s.
2.2. With the advent of increased currency convertibility and the increased flow of capital globally, considerable disagreement arose by the late 1960s on how to best present the accounts. Several “partial” balances, consisting mostly of various components of the current account and some long-term capital transactions, were viewed as presenting an incomplete picture of total payments flows. Financial transactions were not recognized as part of the payments flow of the nation in any of these balances, yet they had begun to rise sharply in size. This was especially true with the surge in transactions of U.S. banks in the rapidly developing Eurodollar market. With capital mobility, it became increasingly difficult to distinguish between transactions in liquid and illiquid assets and to distinguish between financial flows (particularly short-term) that arose from the nation’s payments and flows that were considered settlement transactions required of monetary authorities under the system of fixed exchange rates.
2.3. Differences of opinion also emerged on how best to capture, in a single “overall” or “summary” balance, the total payments flows of the nation. Several overall balances were published as part of the official presentation of the accounts, but they often gave conflicting evidence on the payments flows of the nation for a given quarter or year. Equally important, these overall balances were too volatile in short time periods to provide a reliable gauge of longer run developments in the pay-ments position of the nation. In the final analysis, the choice of one or several overall balances was made more difficult not only by limitations of the statistical reporting system but also by complica-tions resulting from the dollar’s role as an international reserve currency.
2.4. The choice of several overall balances was retained, and improved somewhat, in the 1971 mod-ification of the presentation of the accounts, but the end of the Bretton Woods system of fixed exchange rates in 1973 made the presentation of these balances considerably less relevant. In 1976, a review by an expert advisory panel recommended that the accounts be presented with no single overall or summary balance; a presentation of partial balances was considered appropriate. The committee also recommended that BEA’s primary presentation feature “international transactions”
To Contents
Part I. Introduction and Overview
Bureau of Economic AnalysisU.S. International Economic Accounts: Concepts and Methods
5
rather than “balance of payments.” This recommendation led to the accounts being renamed the International Transactions Accounts (ITAs). Although the presentation was modified several times since 1976, no significant alterations in the basic structure of the ITAs were made until June 2014, when BEA completed a comprehensive restructuring of the accounts. The restructuring resulted from a multiyear effort to modernize and enhance the accounts by introducing changes recom-mended by international statistical guidelines along with other improvements. The most significant change was a new presentation of the accounts that conformed more closely to international guide-lines and brought the U.S. accounts into closer alignment with those of other countries.
2.5. The United States was also involved in the 1920s with the collection of data on the operations of U.S. multinational enterprises (MNEs). When U.S. MNE data were first provided in 1929, the scope was limited to one item: the value of foreign commercial assets controlled by U.S. companies. Since then, the scope has been greatly expanded in step with the growth in MNEs and the increasing integration of the global economy. A DOC census of U.S. direct investment abroad (outward invest-ment) for 1950 marked the first appearance on a federal government survey of questions on the financing and operations of foreign affiliates of U.S. companies. In response to increased foreign direct investment in the United States, BEA conducted its first survey of the financing and opera-tions of the U.S. affiliates of foreign MNEs in the 1970s.
Overview of historical changes
2.6. The International Economic Accounts have evolved in response to policy needs and to address new types of international transactions and financial instruments, particularly those arising from rapid growth and innovation in international services trade and financial markets and the shifting global patterns of goods production and merchandise trade.
2.7. Changes to the accounts, including the introduction of new statistics and changes in estimation methods, definitions, and classifications for existing accounts are presented in Survey of Current Business articles. For the ITAs and International Investment Position (IIP) Accounts, changes are discussed in each year’s annual update articles, which are typically published in the July issue. Changes that do not affect the ITAs and the IIP Accounts may be discussed in other articles that present those statistics.
2.8. Below are examples of major changes that have been introduced to keep the accounts up-to-date and relevant to the needs of government, business officials, academia, and other users of the data. Most of these changes resulted in improvements to the ITAs, but some changes also resulted in improvements to the IIP Accounts and to the statistics on the activities of multinational enterprises (AMNE). Others resulted in the introduction of new statistical products that are published sepa-rately in other international accounts.
To Contents
Part I. Introduction and Overview
Bureau of Economic AnalysisU.S. International Economic Accounts: Concepts and Methods
6
Changes prior to the comprehensive restructuring
2.9. With continued growth of outward direct investment and the acceleration of inward direct investment in the 1970s and 1980s, interest in the finances and operations of MNEs—such as employment, technology, and domestic production—increased correspondingly, and equal empha-sis started to be placed on collecting data on investment in both directions. In response, BEA expanded its data on the overall operations of U.S. parent companies and their foreign affiliates and instituted new surveys to collect similar data on the operations of the U.S. affiliates of foreign companies. The resulting AMNE statistics became a main BEA data series.1 BEA also introduced statistics on new foreign direct investment in the United States. These statistics measured the establishment of new business enterprises and the acquisition of existing businesses by foreign direct investors. The authority to collect these data regularly on a mandatory basis was secured with the enactment of the International Investment Survey Act of 1976.
2.10. In the mid-1980s to early 1990s, BEA broadened its collection system for business services to capture the rapidly expanding universe of internationally traded services, partly in response to the International Investment and Trade in Services Survey Act of 1984, which amended the 1976 International Investment Survey Act. The 1984 amendment established mandatory reporting of U.S. international trade in services and called for benchmark surveys of international services. For the first time, trade in services between affiliated enterprises (parent companies and their affiliates) was recorded on a gross basis. Previously, these transactions had been recorded only on a net basis. This net treatment obscured the two-way flow of intrafirm services trade, resulting in an under-statement of total exports and imports of services.
2.11. In the early to mid-1980s, questions pertaining to sales reported on BEA’s surveys of U.S. MNEs and U.S. affiliates of foreign MNEs were expanded to request separate reporting of sales of goods and services. As a result, BEA started to provide annual statistics on the sales of services by affiliates, which included statistics often described as foreign affiliates’ trade in services statistics.2 The sup-ply of services by affiliates corresponds to the delivery of services via the channel of commercial presence, which is one of the four modes of service delivery identified in the General Agreement on Trade in Services. Later, in the mid-2000s, BEA developed new measures of services supplied through affiliates for insurance services, financial services, and wholesale and retail trade services that better capture the value of these services.
2.12. In 1989, the ITAs adopted the international Harmonized Commodity Description and Coding System (Harmonized System) of commodity classification for goods exports and imports, which provided an improved and more detailed structure for classifying merchandise trade data.
1. Starting with the 2011 statistics, BEA adopted standard international terminology by replacing the term “multinational companies” (or “MNC”) with “multinational enterprises” (or “MNE”) and the term “financial and operating (F&O) statistics” (or “F&O statistics”) with “statistics on the activities of multinational enterprises” (or “AMNE statistics”). This change in terminology did not affect the actual statistics produced.
2. Foreign affiliates’ trade in services statistics originally went by the acronym FATS. The meaning of the FATS acronym has evolved over time. FATS now refers to “Foreign AffiliaTe Statistics,” which is a set of statistics that encompasses several affiliate activities beyond just the sale or supply of services. The more recent notion of FATS is used in chapter 28 of this volume.
To Contents

Part I. Introduction and Overview
Bureau of Economic AnalysisU.S. International Economic Accounts: Concepts and Methods
7
The Harmonized System was developed under the auspices of the World Customs Organization to establish an internationally accepted standard for the classification of traded goods. Many coun-tries adopted the system at the time of its introduction in the late 1980s, and in 1989 the U.S. Census Bureau and BEA adopted the Harmonized System as the basic building block for U.S. merchandise trade data. At that time, BEA revamped its end-use commodity classification system to reflect the new Harmonized System. Commodity trade flows on the newly developed end-use basis were car-ried back to 1978.
2.13. Starting with the first quarter of 1990, U.S.-compiled exports to Canada were replaced with the counterpart Canadian import statistics, and Canadian-compiled exports to the United States were replaced with the counterpart U.S. import statistics. This exchange of statistics between the Census Bureau and Statistics Canada eliminated many of the U.S. balance of payments adjustments to the Census-basis data for timing, coverage, and valuation that were needed when the United States was using its own export data.
2.14. In 1994, a new set of monthly services statistics was introduced in response to requests from pol-icymakers for more timely data on services transactions that complemented the long-standing monthly series for merchandise trade. The new services statistics for seven services categories enabled BEA and the Census Bureau to begin publishing a joint monthly release on goods and services trade, which resulted in a more complete picture of U.S. international trade. The new sta-tistics on goods and services trade covered transactions beginning with 1992.
2.15. In the late 1990s, BEA introduced new statistics for exports and imports of financial services based on its first benchmark survey of financial services transactions between U.S. financial services pro-viders and unaffiliated foreign persons conducted for 1994. Services newly covered by the bench-mark and corresponding annual services surveys beginning in 1995 included financial management services, financial advisory and custody services, credit card services, credit-related services, secu-rities lending services, and electronic funds transfer services. Indirect methods used for brokerage services were replaced by survey data for commissions on stock transactions, private stock and bond placements, futures transactions, and foreign exchange transactions. The new statistics based on the benchmark survey began with 1992.
2.16. In 1993, the International Monetary Fund (IMF) published the Balance of Payments Manual, Fifth Edition (BPM5), the primary set of international guidelines for producing international economic accounts. In the late 1990s, changes resulting from these updated guidelines were introduced in the U.S. ITAs, including the establishment of the financial account along with the capital account in order to distinguish financial asset transactions from transactions in nonproduced nonfinancial assets. Transactions were presented in three accounts: current account, capital account, and finan-cial account. Previously, transactions had been presented in just the current account and the capital account. The current account was redefined by removing capital transfers and transactions in non-produced nonfinancial assets to the new capital account. The previous capital account became the new financial account. BEA provided statistics starting with 1982 under the revised presentation.
To Contents

Part I. Introduction and Overview
Bureau of Economic AnalysisU.S. International Economic Accounts: Concepts and Methods
8
2.17. From 1999 to 2003, BEA transitioned the industry classification used for its direct investment and AMNE statistics from one based on the U.S. Standard Industrial Classification (SIC) system to one based on the North American Industry Classification System (NAICS). The use of a NAICS-based classification allowed BEA’s statistics to better reflect new and emerging industries as well as industries involved in the production of advanced technologies. The NAICS-based classification also better reflected the growth and diversification of service industries that had taken place over the prior decades. With the movement away from the SIC-based classification, petroleum-related activities were no longer grouped as the major industry category “petroleum” but were instead spread among other sectors. The presentational changes were introduced in the AMNE statistics in 1999 for 1997 statistics on U.S. affiliates of foreign MNEs and in 2002 for 1999 statistics on U.S. MNEs. They were introduced in 2003 for the ITAs and for direct investment by country and indus-try statistics starting with 1999.
2.18. From 2001 to 2005, the reorganization and significant expansion of the U.S. Treasury Department’s and Federal Reserve Board’s statistical collection system for transactions in securities and for transactions of banks and nonbank firms—the Treasury International Capital (TIC) reporting sys-tem—led to major improvements in coverage, which resulted in benefits not only for the financial account and the IIP Accounts but also for portfolio and other investment income in the current account. In 2007, estimates of transactions in financial derivatives were incorporated into the ITAs and the IIP Accounts for the first time based on a newly developed TIC survey conducted by the Federal Reserve Bank of New York on behalf of the U.S. Treasury Department.
2.19. In July 2003, insurance services in the current account were redefined and new estimation meth-ods were developed to remove the impact of catastrophic events on the measure of services activity. Insurance services were previously measured as premiums less actual losses paid or recovered. A major shortcoming of this measure was that the often highly variable fluctuations in losses from period to period caused the measure of insurance services to vary in a way that had little relation to the services provided. The new method measures services as premiums less expected, or “normal” losses, where normal losses are inferred from the relationship between actual losses and premiums averaged over several years. Statistics were revised back to 1992. In addition, auxiliary insurance services were reclassified from business, professional, and technical services to insurance services.
2.20. In 2006 and 2007, the geographic detail available for the ITAs was expanded significantly from 18 to 38 major countries and areas in response to demand for bilateral statistics for a wider set of U.S. partners.3
2.21. In June 2008, services exports and imports were revised to incorporate statistics from redesigned surveys of international services. BEA’s redesigned benchmark survey of selected services and intellectual property for 2006 and quarterly follow-on survey beginning in 2007, as well as the redesigned quarterly survey of financial services beginning in 2007, consolidated transactions
3. In 2020, 3 of the 38 areas—Members of OPEC, Other European Union, and Other Euro Area—were dropped.
To Contents

Part I. Introduction and Overview
Bureau of Economic AnalysisU.S. International Economic Accounts: Concepts and Methods
9
with affiliated and unaffiliated parties into a single reporting system. In addition, detail by type of service activity for affiliated transactions was greatly expanded to parallel the detail available for unaffiliated transactions. The new estimates provided a more complete picture of services trade by detailed type of service.
2.22. In June 2008, claims on foreign residents reported by U.S. nonbank firms were revised back to 2005 to significantly expand the coverage of financial intermediaries’ claims associated with the issuance of asset-backed commercial paper (ABCP), resulting in improvements to both the ITAs and the IIP Accounts. During this period, many offshore structured investment vehicles and ABCP conduits set up 100-percent-owned affiliates in Delaware for the sole purpose of issuing ABCP in the U.S. market. The ABCP proceeds were then lent to the offshore special purpose vehicles, which used the funds to purchase other assets. The intercompany debt transactions between Delaware affiliates and their offshore parents took the form of increases and decreases in U.S. nonbank claims on financial intermediaries’ accounts. Estimates were based on data from industry sources.
2.23. In the late 2000s, BEA enhanced coverage of its AMNE statistics by requiring banks to report on annual surveys of direct investment. Prior to the expanded reporting, banks were only required to report in benchmark years, and the bank survey forms only included a few key data items. The expanded data collections for banks enabled BEA to publish statistics on all bank and nonbank U.S. parents, all bank and nonbank foreign affiliates of both bank and nonbank U.S. parents, and all bank and nonbank U.S. affiliates.
2.24. In response to a request from the IMF for more countries to compile quarterly IIP statistics as an economic monitoring tool in the wake of the global financial crisis, BEA introduced quarterly IIP statistics in March 2013. Previously, BEA had released only annual IIP statistics. The new quar-terly IIP statistics complemented the annual statistics by providing more frequent and timely information on the U.S. external position. These statistics also satisfied statistical guidelines from the IMF Executive Board, which prescribe quarterly IIP reporting for members that participate in the IMF’s Special Data Dissemination Standard. In contrast to BEA’s more detailed annual IIP Accounts, which included transactions and detailed valuation adjustments, BEA’s quarterly IIP Accounts provided only position statistics. One important factor that allowed production of quar-terly IIP Accounts was an acceleration of the reporting of financial derivatives in the TIC system from 60 days to 45 days after the end of the reference quarter.
2.25. Also in March 2013, the release of monthly goods and services trade statistics was accelerated from 40 days after the end of the reference month to 35 days. Both this acceleration initiative and the introduction of the quarterly IIP statistics resulted in more timely and more frequent data from the U.S. International Economic Accounts for policymakers.
2.26. In June 2013, BEA integrated new monthly data on cross-border holdings of U.S. and foreign long-term securities collected on a new TIC form, “Aggregate Holdings of Long-Term Securities by
To Contents

Part I. Introduction and Overview
Bureau of Economic AnalysisU.S. International Economic Accounts: Concepts and Methods
10
U.S. and Foreign Residents” (SLT). The monthly SLT positions data supplemented the monthly transactions data from the TIC reporting system, thereby improving coverage of long-term debt securities in financial-account statistics.
Changes associated with the comprehensive restructuring of the accounts
2.27. In June 2014, BEA introduced a comprehensive restructuring of the U.S. International Economic Accounts, the most significant change in the presentation of the accounts since 1976. As part of the comprehensive restructuring, BEA introduced a new presentation of the ITAs, a new presentation of the IIP Accounts, and a new presentation of international services statistics. These changes were the culmination of a multiyear effort to enhance the quality and usefulness of the accounts and to bring the accounts into closer alignment with international guidelines.
2.28. This restructuring was motivated by the 2009 release of the Balance of Payments and International Investment Position Manual, Sixth Edition (BPM6) and other related international statistical guidelines at about the same time. The manual was published by the IMF in cooperation with members of the international statistical community, including BEA, and was designed to improve accounts produced by national statistical organizations, promote relevance and consistency, and facilitate international comparability. This update, the first since 1993, was coordinated with an update in 2008 of the System of National Accounts (SNA 2008) in order to maximize consistency between these two key sets of international guidelines for economic accounts. In addition, in 2008 the Organisation for Economic Co-operation and Development (OECD) released the Benchmark Definition of Foreign Direct Investment, Fourth Edition (BD4), and in 2010 guidance was pro-vided in manuals for statistics on merchandise trade and services trade. These manuals include International Merchandise Trade Statistics: Concepts and Definitions 2010 and Manual on Statistics of International Trade in Services (MSITS) 2010, both published by the United Nations.
2.29. These international statistical guidelines were issued in response to important economic devel-opments that arose after the previous set of updates in 1993, such as the increased globalization of economic activity, rising innovation and complexity in financial markets, and an increased emphasis on the balance sheet as a tool for understanding economic activity. Some of the recom-mendations in these statistical guidelines were particularly noteworthy for their impact on the U.S. International Economic Accounts:
• Trade in goods and services was to be more strictly defined on a change-of-ownership basis
to increase consistency with the treatment of the related financial flows and the treatment of
domestic transactions and to more clearly identify global outsourcing of manufactured goods.
• Direct investment was to be presented on an asset/liability (gross) basis, and the related
income flows were to be defined on a receipts/payments basis, instead of both being
presented on a directional (net) basis. This change facilitated comparisons with related
balance sheet and financial flow statistics.
To Contents

Part I. Introduction and Overview
Bureau of Economic AnalysisU.S. International Economic Accounts: Concepts and Methods
11
• Financial intermediation services that are not explicitly charged—but are implicit in
transactions and can be measured indirectly—were to be recognized in order to account more
completely for the different ways that financial services are priced and delivered.
• Research and development (R&D) results were to be treated as produced assets and included
in the current account with other produced assets rather than treated as nonproduced assets
and recorded in the capital account. This change better reflected the role of R&D results as
assets that contribute to current production.
2.30. Because of the broad scope of the changes, BEA adopted a phased approach to implementing the updated international guidelines that took into account the feasibility of implementation due to factors such as source data availability, resource requirements, and consistency with BEA’s national, industry, and regional accounts. Beginning in 2009 and up until June 2014, BEA intro-duced changes recommended by the international guidelines that did not require changes to the presentation of the accounts, including the reclassification of transactions between goods and services and between services types, new treatments of special drawing rights holdings and transactions, the reclassification of debt between selected financial intermediaries, the exclusion of migrants’ transfers from the capital account, and the reclassification of certain disaster-related insurance settlements.
2.31. In June 2014, BEA introduced restructured presentations of the International Economic Accounts and several changes in definitions, classifications, and methodology recommended by the interna-tional guidelines. These changes were described in the March and July 2014 issues of the Survey of Current Business. Revised statistics were presented as a consistent quarterly time series back to 1960 for the highest levels of aggregation, back to 1999 for most current-account detailed series, and back to 2003 for most other detailed series. While BEA attempted to implement each of the major BPM6 recommendations, not all were feasible at that time. Certain recommendations were implemented in later years.
2.32. One of BEA’s principal objectives in adopting the updated international guidelines was to bring its standard presentation into closer alignment with the presentation recommended by BPM6. BEA’s previous presentation of the International Economic Accounts differed in several significant ways from the prior IMF guidelines based on BPM5, particularly for the financial account and the IIP Accounts. Adopting the BPM6-recommended presentation resulted in statistics that are more clearly identified, better understood by data users, and easier to compare with similar statistics from other countries.
2.33. Several aspects of the restructured International Economic Accounts represented major changes from BEA’s long-standing presentation. The major changes, which are briefly described below, included changes in sign convention and income presentation, the use of functional investment categories and sector detail, and the presentation of direct investment on an asset/liability basis.
To Contents
Part I. Introduction and Overview
Bureau of Economic AnalysisU.S. International Economic Accounts: Concepts and Methods
12
Sign convention
2.34. The uniform use of negative signs for debit entries was eliminated. Previously, credits (exports, income receivable, transfers received, reductions in assets, and increases in liabilities) were pre-sented as positive numbers, and debits (imports, income payable, transfers made, increases in assets, and reductions in liabilities) were presented as negative numbers. Although this convention facilitated some types of aggregation across accounts, it proved to be a source of confusion for a significant number of data users.
2.35. Under the restructured presentation, positive signs were used to show exports and imports, income receipts and payments, transfers made and received, and increases in assets and liabilities. Negative signs were used only to indicate negative investment income (losses) and decreases in assets or in liabilities (as occur, for example, if investments are sold off ). Consequently, current- account and capital-account balances were calculated as the difference between the underlying gross flows (for example, exports less imports). For the financial account, net lending/borrowing was calculated as the difference between the acquisition of assets and the incurrence of liabili-ties. These conventions not only made the ITAs easier to understand and interpret but also clar-ified their relationship with the corresponding changes in asset and liability positions in the IIP Accounts.
Income presentation
2.36. The restructured presentation adopted the BPM6 nomenclature of primary income and secondary income in the current account. Primary income is income generated from current production. In BEA’s previous presentation, primary income receipts and payments were known as income receipts and payments. Secondary income was known as current transfers and was only presented on a net basis. In the restructured presentation, secondary income receipts and secondary income payments were shown separately (gross) rather than combined.
Functional categories
2.37. The restructured presentation reflected significant changes to the presentation of the financial account and the IIP Accounts. Financial-account transactions and positions in the IIP Accounts were classified according to five functional categories—direct investment, portfolio investment, other investment, reserve assets, and financial derivatives other than reserves—and then according to the type of instrument. Investment income in the current account was also classified by func-tional category.
Sector detail
2.38. The restructured presentation introduced additional detail on portfolio investment and other investment by sector. BPM6 defines four main sectors: central bank, deposit-taking corporations except the central bank, general government, and “other sectors,” which includes the two sub-sectors “other financial corporations” and “nonfinancial corporations, households, and NPISHs”
To Contents
Part I. Introduction and Overview
Bureau of Economic AnalysisU.S. International Economic Accounts: Concepts and Methods
13
(nonprofit institutions serving households). BEA eliminated the summary category “other sectors” and presented the two subsectors, “other financial institutions” and “nonfinancial institutions except general government,” in its place.
2.39. Two basic changes to the names in the restructured presentation were made. First, for deposit-tak-ing corporations except the central bank sector and the two subsectors in “other sectors,” the term “corporations” was replaced with the term “institutions” to include enterprises such as partner-ships that belong in this category but that are not organized as publicly held corporations. Second, because BEA has little source data on the transactions of households and NPISHs with foreign residents, BEA used the label “nonfinancial institutions.”
Asset/liability basis
2.40. Direct investment was presented on the asset/liability basis recommended by BPM6, to the extent allowed by source data, in addition to the directional basis recommended by earlier guidelines.4 On the asset/liability basis, direct investment statistics are organized according to whether the investment relates to the net U.S. acquisition of an asset or the net U.S. incurrence of a liability. On the directional basis, direct investment statistics are organized according to whether the direct investment is outward (U.S. direct investment abroad) or inward (foreign direct investment in the United States). This change primarily affected the recording of intercompany debt between parents and affiliates. Under the asset/liability basis, U.S. parents’ debt claims were no longer netted against their debt liabilities to their foreign affiliates, and U.S. affiliates’ debt claims were no longer net-ted against their debt liabilities to their foreign parent groups. The restructured presentation also showed the conversion from the asset/liability basis to the directional basis.
Changes following the comprehensive restructuring
2.41. In late 2014, BEA reintroduced the survey of new foreign direct investment in the United States, which had been discontinued in 2008 because of budgetary constraints. In addition to collecting information on the acquisition and establishment of U.S. business enterprises by foreign direct investors, the new version of the survey also collected information on the expansion of existing U.S. affiliates of foreign entities. This addition allowed for the measure of “greenfield” investment, which includes establishments and expansions of U.S. affiliates. Statistics from the reinstated survey were first published in 2015 and included first-year investment expenditures and planned total expenditures. Subsequent releases also included a comparison of future-year expenditures projected at the time that establishments or expansions were initiated with actual future-year expenditures.
2.42. In May 2016, BEA updated and expanded an earlier study on trade in information and communica-tions technology (ICT) services and potentially ICT-enabled services (or “digitally enabled” trade in services). This study used data underlying the existing trade in services statistics to produce
4. Per BPM6 recommendations, statistics by partner country continued to be presented on the directional basis.
To Contents
Part I. Introduction and Overview
Bureau of Economic AnalysisU.S. International Economic Accounts: Concepts and Methods
14
aggregations, based on international guidelines, showing annual trade in ICT and potentially ICT-enabled services. In October 2016, these new statistics were added to the annual international services statistics, joining detailed trade in services statistics and statistics on services supplied through affiliates.
2.43. In 2016–2018, BEA expanded the detail shown in its international services statistics. In October 2016, BEA expanded the geographic detail it presents in its annual trade in services statistics by increasing the number of countries and areas from 49 to 90, beginning with statistics for 2013. In October 2017, BEA expanded and standardized the geographic and industry detail it presents in its statistics on services supplied through affiliates. In October 2018, BEA expanded this geographic detail for trade in services, as well as trade in ICT and potentially ICT-enabled services, back to 2006.
2.44. In 2019, BEA added a breakdown to its outward AMNE statistics for 2017 focusing on the activi-ties of U.S.-headquartered MNEs. This breakdown excluded the activities of U.S. parents that are ultimately owned by a foreign MNE and the activities of foreign affiliates of those parents. Such activities are included in the rest of the outward AMNE statistics and thus represent an overlap between the outward and inward AMNE statistics.
2.45. In 2020, BEA further expanded its coverage of trade in services in the ITAs and international services statistics. In both accounts, it increased the number of major service types covered to the 12 types recommended in BPM6 by adding manufacturing services on inputs owned by others,5 adding “personal, cultural, and recreational services,” and reclassifying construction to the status of major service type. It also closed a gap by providing estimates for two implicit financial services: financial intermediation services indirectly measured (FISIM) and market-making services. In the ITAs, BEA expanded the coverage of its table on trade in services by area and country to include 90 countries or geographic areas. In addition, it accelerated the release of the trade in services portion of the annual international services statistics from October to June/July.
2.46. BEA reorganized its presentation within and across the major service types and reclassified certain subcomponents to more closely conform to BPM6 guidance and to provide more information to data users. In particular, BEA reclassified certain transactions in intellectual property to better dis-tinguish outright sales or purchases from licenses to use and from licenses to reproduce or distrib-ute. The improved presentation of intellectual property was facilitated by requests for more detail from respondents on BEA’s surveys of transactions in selected services and intellectual property with foreign persons.
2.47. In the capital account of the ITAs, BEA included, for the first time, transactions that had previously been classified as trade in services (outright sales of trademarks and franchise fees) or as secondary income (investment grants provided by the U.S. government).
5. BEA tables on trade in services include manufacturing services on inputs owned by others as a major service type, but BEA does not yet provide statistics for this service type. The service type is included in the tables as a placeholder for future statistics.
To Contents

Part I. Introduction and Overview
Bureau of Economic AnalysisU.S. International Economic Accounts: Concepts and Methods
15
2.48. In 2020, BEA also introduced two new tables—one providing an alternate view of international transactions by partner country, the other providing more detailed annual statistics on goods and services by country and area—to its suite of ITA tables. It also expanded the detail provided in its secondary income table and added a new category of other investment—other equity—to its ITA and IIP tables.
To Contents

Part I. Introduction and Overview
Bureau of Economic AnalysisU.S. International Economic Accounts: Concepts and Methods
16
Chapter 3. Data Sources
3.1. The methods used to prepare statistics for the U.S. International Economic Accounts rely on a wide variety of source data that are adjusted as needed to meet the definitions and concepts used for the accounts. These accounts include the core accounts—the International Transactions Accounts (ITAs), the International Investment Position (IIP) Accounts, and statistics on the activities of mul-tinational enterprises (AMNE)—as well as other international accounts—monthly trade in goods in services statistics, international services statistics, statistics on direct investment by country and industry, and statistics on new foreign direct investment in the United States.
3.2. As shown in figure A.2 in appendix A, most of the source data are derived from data collection pro-grams conducted by the Bureau of Economic Analysis (BEA), the U.S. Department of the Treasury (Treasury Department), and the U.S. Census Bureau. In addition, BEA uses data provided by U.S. government agencies involved with international transactions; other government and private-sec-tor surveys and reports related to cross-border activities; and foreign statistical agencies, foreign central banks, and international organizations. Other sources, such as private for-profit and non-profit sources, are also used.
3.3. BEA uses three major types of source data for the accounts: survey data, administrative data, and other source data. These three types of data are not mutually exclusive—for instance, some data are collected on surveys but have important administrative purposes—but the various types of data sources used by BEA reflect the broad coverage of the accounts.
3.4. Survey data come from BEA surveys and from other government and nongovernment sources. BEA survey programs are designed primarily for collecting data to use in preparing BEA’s International Economic Accounts. The survey programs of other surveying institutions are designed primarily for other purposes, but some of these programs align, to various degrees, the data they collect with the needs of BEA’s International Economic Accounts.
3.5. Administrative data include tabulations created as a byproduct of administering government pro-grams; the trade in goods data from the Census Bureau are a key example. Administrative data also include information from U.S. government agencies that engage in international transactions, such as the U.S. Department of State and the U.S. Department of Defense.
3.6. Other source data come from a variety of entities and are collected for a variety of purposes. Among these data are data from the statistical agencies and central banks of certain partner coun-tries or from international agencies; these sources are sometimes described as counterparty data. Counterparty data measure transactions between U.S. and foreign residents from the point of view of the foreign resident.
To Contents
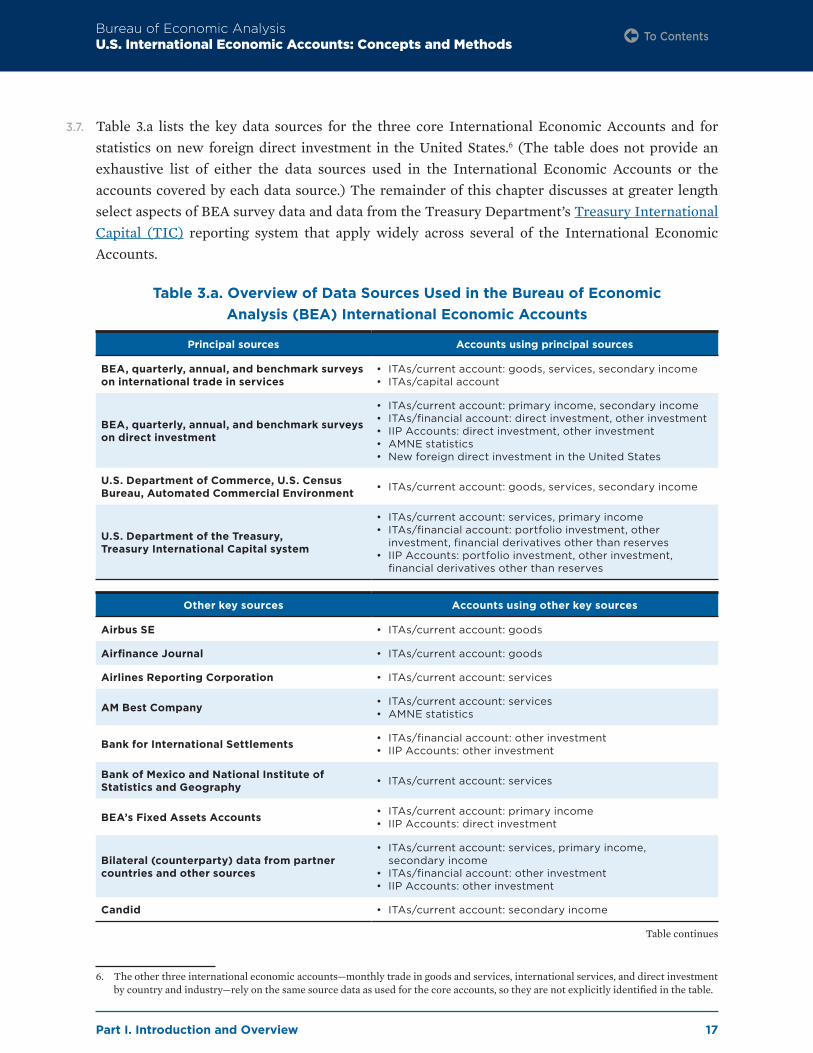
Part I. Introduction and Overview
Bureau of Economic AnalysisU.S. International Economic Accounts: Concepts and Methods
17
3.7. Table 3.a lists the key data sources for the three core International Economic Accounts and for statistics on new foreign direct investment in the United States.6 (The table does not provide an exhaustive list of either the data sources used in the International Economic Accounts or the accounts covered by each data source.) The remainder of this chapter discusses at greater length select aspects of BEA survey data and data from the Treasury Department’s Treasury International Capital (TIC) reporting system that apply widely across several of the International Economic Accounts.
Table 3.a. Overview of Data Sources Used in the Bureau of Economic Analysis (BEA) International Economic Accounts
Principal sources Accounts using principal sources
BEA, quarterly, annual, and benchmark surveys on international trade in services
• ITAs/current account: goods, services, secondary income• ITAs/capital account
BEA, quarterly, annual, and benchmark surveys on direct investment
• ITAs/current account: primary income, secondary income• ITAs/financial account: direct investment, other investment• IIP Accounts: direct investment, other investment• AMNE statistics• New foreign direct investment in the United States
U.S. Department of Commerce, U.S. Census Bureau, Automated Commercial Environment • ITAs/current account: goods, services, secondary income
U.S. Department of the Treasury, Treasury International Capital system
• ITAs/current account: services, primary income• ITAs/financial account: portfolio investment, other
investment, financial derivatives other than reserves• IIP Accounts: portfolio investment, other investment,
financial derivatives other than reserves
Other key sources Accounts using other key sources
Airbus SE • ITAs/current account: goods
Airfinance Journal • ITAs/current account: goods
Airlines Reporting Corporation • ITAs/current account: services
AM Best Company • ITAs/current account: services• AMNE statistics
Bank for International Settlements • ITAs/financial account: other investment• IIP Accounts: other investment
Bank of Mexico and National Institute of Statistics and Geography • ITAs/current account: services
BEA’s Fixed Assets Accounts • ITAs/current account: primary income• IIP Accounts: direct investment
Bilateral (counterparty) data from partner countries and other sources
• ITAs/current account: services, primary income, secondary income
• ITAs/financial account: other investment• IIP Accounts: other investment
Candid • ITAs/current account: secondary income
6. The other three international economic accounts—monthly trade in goods and services, international services, and direct investment by country and industry—rely on the same source data as used for the core accounts, so they are not explicitly identified in the table.
Table continues
To Contents

Part I. Introduction and Overview
Bureau of Economic AnalysisU.S. International Economic Accounts: Concepts and Methods
18
Other key sources Accounts using other key sources
Depository Trust and Clearing Corporation
• ITAs/current account: primary income• ITAs/financial account: portfolio investment, other
investment• IIP Accounts: portfolio investment, other investment
Educational Commission for Foreign Medical Graduates • ITAs/current account: services
Federal Financial Institutions Examination Council • ITAs/current account: services, primary income
Federal Reserve Bank of New York• ITAs/current account: goods, primary income• ITAs/financial account: other investment, reserve assets• IIP Accounts: other investment, reserve assets
Federal Reserve Board• ITAs/current account: primary income• ITAs/financial account: other investment• IIP Accounts: other investment
IHS Markit • ITAs/current account: goods, services
Institute of International Education, Open Doors report
• ITAs/current account: services, primary income, secondary income
Intercontinental Exchange Price Indexes• ITAs/current account: primary income• ITAs/financial account: portfolio investment• IIP Accounts: portfolio investment
International Monetary Fund• ITAs/current account: primary income• ITAs/financial account: other investment, reserve assets• IIP Accounts: other investment, reserve assets
Morgan Stanley Capital International• ITAs/current account: primary income• ITAs/financial account: portfolio investment• IIP Accounts: direct investment, portfolio investment
Pew Hispanic Center • ITAs/current account: primary income
Planespotters.net • ITAs/current account: goods
S&P Dow Jones Indices• ITAs/current account: primary income• ITAs/financial account: portfolio investment• IIP Accounts: direct investment, portfolio investment
Statistics Canada • ITAs/current account: goods, services, primary income, secondary income
Surface Transportation Board • ITAs/current account: services
United Nations Educational, Scientific, and Cultural Organization, Institute for Statistics • ITAs/current account: services
United Nations International Trade Statistics Database (UN Comtrade) • ITAs/current account: goods
U.S. Department of Agriculture, National Agricultural Statistics Service, Farm Labor Survey
• ITAs/current account: primary income
U.S. Department of Commerce, International Trade Administration, National Travel and Tourism Office, Survey of International Air Travelers
• ITAs/current account: services
U.S. Department of Commerce, U.S. Census Bureau, demographic/labor surveys • ITAs/current account: secondary income
Table continues
To Contents

Part I. Introduction and Overview
Bureau of Economic AnalysisU.S. International Economic Accounts: Concepts and Methods
19
Other key sources Accounts using other key sources
U.S. Department of Commerce, U.S. Census Bureau, other data • ITAs/current account: services
U.S. Department of Commerce, U.S. Census Bureau, U.S.-Canada Data Exchange
• ITAs/current account: goods, services, secondary income
U.S. Department of Defense• ITAs/current account: goods, services• ITAs/financial account: other investment• IIP Accounts: other investment
U.S. Department of Education, Foreign Gift and Contract Report • ITAs/current account: secondary income
U.S. Department of Homeland Security, Office of Immigration Statistics • ITAs/current account: primary income
U.S. Department of Homeland Security, U.S. Customs and Border Protection • ITAs/current account: goods, services
U.S. Department of Homeland Security, U.S. Immigration and Customs Enforcement, Student and Exchange Visitor Information System
• ITAs/current account: services, primary income
U.S. Department of Labor, Bureau of Labor Statistics, Consumer Expenditure Surveys
• ITAs/current account: services
U.S. Department of Labor, National Agricultural Workers Survey • ITAs/current account: primary income
U.S. Department of State, data on property transactions abroad • ITAs/capital account
U.S. Department of State, visa statistics • ITAs/current account: services, primary income
U.S. Department of Transportation, Bureau of Transportation Statistics • ITAs/current account: services
U.S. Department of Transportation, Federal Aviation Administration • ITAs/current account: services
U.S. Department of the Treasury, Internal Revenue Service • ITAs/current account: primary income, secondary income
U.S. Department of the Treasury, other data
• ITAs/current account: primary income, secondary income• ITAs/capital account• ITAs/financial account: other investment, reserve assets• IIP Accounts: other investment, reserve assets
U.S. government agencies
• ITAs/current account: services, primary income, secondary income
• ITAs/capital account• ITAs/financial account: other investment• IIP Accounts: other investment
U.S. Office of Management and Budget • ITAs/current account: services
U.S. Postal Service • ITAs/current account: goods, services, secondary income
U.S. Social Security Administration • ITAs/current account: secondary income
ITAs International Transactions AccountsAMNE Activities of multinational enterprisesIIP International Investment Position
To Contents

Part I. Introduction and Overview
Bureau of Economic AnalysisU.S. International Economic Accounts: Concepts and Methods
20
BEA survey data
3.8. BEA conducts survey programs focusing on direct investment and multinational enterprises (MNEs) and on trade in services. This section provides general information on these two survey programs.7 Because the survey programs collect the microdata underlying BEA’s published statis-tics, BEA must undertake several processing tasks for these data that it does not face when using data already largely processed by other data providers. This section also provides information on how BEA designs sampling schemes, derives population and subpopulation estimates, and protects the microdata from unauthorized disclosure.
BEA data collection programs
3.9. BEA conducts 7 mandatory surveys on direct investment and 10 mandatory surveys on trade in ser-vices that underlie BEA’s statistics on direct investment, AMNE, and several types of trade in ser-vices. The legal authority for these surveys is the International Investment and Trade in Services Survey Act (P.L. 94–472, as amended; 22 U.S.C. 3101–3108). The financial services surveys are also authorized by the Omnibus Trade and Competitiveness Act of 1988 (15 U.S.C. 4908). All U.S. enti-ties that meet the mandatory thresholds for covered activities or transactions with foreign persons must report these to BEA.
BEA’s direct investment surveys
3.10. BEA conducts mandatory quarterly, annual, and benchmark surveys on U.S. direct investment abroad and foreign direct investment in the United States, along with a mandatory survey on new foreign direct investment in the United States. Quarterly surveys provide data for measuring direct investment transactions and income for the ITAs and direct investment positions for the IIP Accounts. Annual and benchmark surveys provide AMNE statistics and more detailed data needed for annual and benchmark revisions of direct investment transactions and positions. The survey on new foreign direct investment provides information on the acquisition, establishment, and expan-sion of U.S. business enterprises by foreign direct investors.
3.11. Benchmark surveys are conducted at 5-year intervals and provide the most comprehensive cov-erage of business entities and data items. Quarterly and annual surveys are cutoff sample surveys that cover a sample of businesses above a size-exemption level. The survey of new foreign direct investment in the United States is required each time a foreign direct investor acquires, establishes, or expands a U.S. business enterprise.
3.12. U.S. direct investment abroad represents the ownership or control, directly or indirectly, by one U.S. entity of 10 percent or more of the voting securities of the foreign business enterprise if it is legally incorporated, or an equivalent interest if it is not legally incorporated. U.S. entities with direct investment abroad are required to report for the fully consolidated U.S. domestic business
7. The BEA website provides information for survey respondents and copies of survey forms used previously. Additional information on BEA’s direct investment surveys is available in A Guide to BEA’s Direct Investment Surveys, and additional information on BEA’s trade in services surveys is available in A Guide to BEA’s Services Surveys.
To Contents

Part I. Introduction and Overview
Bureau of Economic AnalysisU.S. International Economic Accounts: Concepts and Methods
21
enterprise and for each foreign affiliate. For the foreign affiliate reports, the U.S. entity may consoli-date affiliates in the same country when the affiliates are in the same industry or when the affiliates are integral parts of the same business operation.
3.13. Foreign direct investment in the United States represents the ownership or control, directly or indirectly, by a foreign entity (including business enterprises) of 10 percent or more of the voting securities of the U.S. business enterprise if it is legally incorporated, or an equivalent interest if it is not legally incorporated. A U.S business enterprise subject to these reporting requirements is known as a U.S affiliate. A U.S. affiliate must file its survey response on a fully consolidated domes-tic U.S. basis. The fully consolidated domestic entity is considered one U.S. affiliate.
BEA’s surveys of direct investment include the following:
• Quarterly Survey of U.S. Direct Investment Abroad (BE–577)
• Annual Survey of U.S. Direct Investment Abroad (BE–11)
• Benchmark Survey of U.S. Direct Investment Abroad (BE–10)
• Survey of New Foreign Direct Investment in the United States (BE–13)
• Quarterly Survey of Foreign Direct Investment in the United States (BE–605)
• Annual Survey of Foreign Direct Investment in the United States (BE–15)
• Benchmark Survey of Foreign Direct Investment in the United States (BE–12)
BEA’s services surveys
3.14. BEA conducts mandatory quarterly, annual, and benchmark surveys of U.S. exports and imports of services to obtain data used in estimating services transactions in the current account of the ITAs. Survey respondents are primarily U.S. business enterprises having transactions in services with nonresidents that exceed certain reporting thresholds. Quarterly surveys provide information on services transactions with both affiliated and unaffiliated parties by partner country. Benchmark services surveys are typically conducted at 5-year intervals. The surveys cover transactions in transportation services, financial services, insurance services, other selected services, and intellec-tual property.
BEA’s services surveys include the following:
• Quarterly Survey of Foreign Airline Operators’ Revenues and Expenses in the
United States (BE–9)
• Annual Survey of Foreign Ocean Carriers’ Expenses in the United States (BE–29)
• Quarterly Survey of Ocean Freight Revenues and Foreign Expenses of United States
Carriers (BE–30)
• Quarterly Survey of U.S. Airline Operators’ Foreign Revenues and Expenses (BE–37)
• Benchmark Survey of Financial Services Transactions Between U.S. Financial Services
Providers and Foreign Persons (BE–180)
To Contents

Part I. Introduction and Overview
Bureau of Economic AnalysisU.S. International Economic Accounts: Concepts and Methods
22
• Quarterly Survey of Financial Services Transactions Between U.S. Financial Services
Providers and Foreign Persons (BE–185)
• Benchmark Survey of Insurance Transactions by U.S. Insurance Companies
With Foreign Persons (BE–140)
• Quarterly Survey of Insurance Transactions by U.S. Insurance Companies
With Foreign Persons (BE–45)
• Benchmark Survey of Transactions in Selected Services and Intellectual Property
With Foreign Persons (BE–120)
• Quarterly Survey of Transactions in Selected Services and Intellectual Property
With Foreign Persons (BE–125)
Sampling
3.15. BEA collects survey data on trade in services and on direct investment from enterprises involved in these activities. The enterprises are U.S. entities that report for themselves and, for surveys of U.S. direct investment abroad, for their foreign affiliates.
3.16. Unlike many other surveys, BEA surveys typically do not use probability sampling. Some of BEA’s surveys are benchmark surveys, or censuses, in which BEA endeavors to survey the entire universe. Benchmark surveys are typically conducted once every 5 years. Other BEA surveys use nonproba-bility samples—most typically, size cutoff samples. For example, BEA’s annual and quarterly surveys of direct investment and BEA’s quarterly trade in services surveys use cutoff samples that account for very large fractions of the direct investment and trade in services estimates but much smaller fractions in terms of the number of units involved. The use of cutoff sampling reduces respondent burden and the resources required by BEA to process the surveys while ensuring high levels of cov-erage of the transactions and activities of interest.
Editing
3.17. Before BEA incorporates the survey data into the International Economic Accounts, it performs a number of data validity or “edit” checks. The data from a reporter are reviewed for consistency with filings for previous periods, with related data from other parts of the report, with data from related reports, with comparable data reported by other reporters, and with related data from other sources.
Universe estimation
3.18. In producing statistics for periods covered only by a sample survey, BEA fills in values for observa-tions missing from the sample survey by combining information from units reporting on the sample survey with information about the missing observations from prior (or in some cases, subsequent) benchmark or sample surveys. In doing so, a data file is constructed for the entire universe
To Contents

Part I. Introduction and Overview
Bureau of Economic AnalysisU.S. International Economic Accounts: Concepts and Methods
23
consisting of observations reported on the sample survey and estimates for observations that are not reported on that survey (or are reported but are not usable). Observations may not be reported for several reasons, including the following:
1. Units (to which the observations apply) are sampled but do not submit reports.
For such cases, observation values are imputed (unit imputation).
2. Units are sampled and submit reports, but one or more data items are not reported.
For some such cases, observation values are imputed (item imputation). For other such
cases, unit imputation is used.
3. Units are not sampled. For such cases, observation values are estimated.
4. Units are sampled and report the requested information but are required to provide
information with less detail than the level of detail at which statistics are published.
For such cases, observation values are estimated for data items at the missing level of detail.
5. Units or items are sampled less frequently than estimates are produced. For example, a
unit might be sampled only on a benchmark survey covering a full year, but estimates are
needed for each of the four quarters of the year. For such cases that are subject to universe
estimation, observation values are estimated for data items at the missing level of detail.
(Not all such cases are subject to universe estimation; in some cases, estimates are made
only at the publication level instead of at the unit level).
3.19. Construction of observations for the universe data file for cases (1) and (2) above falls under the traditional notion of imputation. Construction of observations for cases (3) through (5) uses impu-tation-like procedures and has the same goal of producing a data value that is not present in the reported data. In contrast to traditional imputation, however, the generation of observations for cases (3) through (5) produces data that are not intended to be in the sample, not just data missing from the sample.
3.20. Collectively, BEA calls the process of constructing observations for cases (1) through (5) “universe estimation.” This process varies in the particulars by survey, but in general it uses information that was reported for the unit on past surveys (if available), including the benchmark surveys, and infor-mation about trends or patterns from units reporting on the sample survey. For example, a value for exports of accounting services for a given enterprise may be estimated by taking that enterprise’s reported value from the preceding survey period and advancing it by the growth rate of exports of accounting services amongst a set of reporting, but otherwise similar, exporters of such services. Or, employee compensation on an annual direct investment survey may be estimated for a foreign affiliate that reports the number of employees by multiplying that number by the average compen-sation per employee of a set of reporting affiliates from countries with similar levels of economic development.
To Contents

Part I. Introduction and Overview
Bureau of Economic AnalysisU.S. International Economic Accounts: Concepts and Methods
24
3.21. Because BEA’s surveys do not use probability samples, and because universe estimation results in a data file with values—either reported or constructed—for each observation in the universe, BEA’s survey-based published statistics are compiled by simple addition. No weights are used, and mea-sures of sampling error are not estimated.
Data protection
3.22. The legal authorities under which BEA surveys are collected protect the confidentiality of the data of the companies that report. The assurance of confidentiality is essential to securing the cooperation of respondents and thus to maintaining the integrity of the statistical system. Without the prior written permission of the respondent, BEA cannot publish or otherwise release the data collected on its surveys in a form that would allow the reported information of an individual respondent to be identified. Therefore, BEA aggregates the survey data to the level of detail used for publication and performs a rigorous nondisclosure analysis to identify data cells that require suppression in order to ensure the confidentiality of individual respondents’ data.
3.23. If a data cell must be suppressed, a “D” is typically shown in that data cell in the published tables.8 Because subtracting the sum of unsuppressed cells from a published category total yields the sum of suppressed cells in that category, BEA also applies “complementary” suppressions until all primary suppressions are sufficiently protected. BEA’s suppression procedures are based on the “p-percent rule.”
Treasury International Capital survey data
3.24. The Treasury International Capital (TIC) reporting system is the U.S. government’s primary source of data on financial flows into and out of the United States, excluding direct investment, and the resulting levels of cross-border claims and liabilities. BEA uses data from the TIC system as a key source for the financial account of the ITAs and for the IIP Accounts. The TIC reporting system consists of a related set of monthly, quarterly, annual, and benchmark surveys conducted by the Federal Reserve Bank of New York (FRBNY) acting as the fiscal agent for the Treasury Department, which has the legal authority to collect the survey data and to publish the resulting statistics. In 1998, the Federal Reserve Board started performing validation and review services on behalf of the Treasury Department in support of this data collection system.
The TIC reporting system
3.25. The TIC reporting system collects data on all financial activities of U.S. residents with foreign res-idents, excluding direct investment, taking advantage of the concentration of international finan-cial activity in large U.S. financial enterprises. The TIC system requires that U.S. banks, securities brokers, and custodians report not only their own positions or transactions with foreign residents but also the positions or transactions of their customers. With one exception discussed below,
8. One exception to the use of “D” in suppressed cells is the use of size ranges for suppressed employment estimates in AMNE statistics.
To Contents

Part I. Introduction and Overview
Bureau of Economic AnalysisU.S. International Economic Accounts: Concepts and Methods
25
respondents report both for themselves and for their U.S. and foreign customers. TIC surveys can be grouped according to the types of financial instruments covered. Table 3.b summarizes the TIC reporting forms.
Table 3.b. Treasury International Capital (TIC) Reporting Forms
Form number Form description
TIC B reports (banks and other financial firms)
BC Report of U.S. Dollar Claims of Financial Institutions on Foreign Residents (monthly)
BL–1 Report of U.S. Dollar Liabilities of Financial Institutions to Foreign Residents (monthly)
BL–2 Report of Customers’ U.S. Dollar Liabilities to Foreign Residents (monthly)
BQ–1 Report of Customers’ U.S. Dollar Claims on Foreign Residents (quarterly)
BQ–2 Part 1: Report of Foreign Currency Liabilities and Claims of Financial Institutions and of Their Domestic Customers’ Foreign Currency Claims With Foreign Residents
Part 2: Report of Customers’ Foreign Currency Liabilities to Foreign Residents (quarterly)
BQ–3 Report of Maturities of Selected Liabilities and Claims of Financial Institutions With Foreign Residents (quarterly)
TIC C reports (nonfinancial firms)
CQ–1 Report of Financial Liabilities to, and Financial Claims on, Unaffiliated Foreign Residents (quarterly)
CQ–2 Report of Commercial Liabilities to, and Commercial Claims on, Unaffiliated Foreign Residents (quarterly)
TIC D report (derivatives)
D Report of Holdings of, and Transactions in, Financial Derivatives Contracts with Foreign Residents (quarterly)
TIC S reports (securities)
S Purchases and Sales of Long-Term Securities by Foreign-Residents (monthly)
SHC(A) Report of U.S. Ownership of Foreign Securities Including Selected Money Market Instruments (annually)
SHL(A) Foreign-Residents’ Holdings of U.S. Securities, Including Selected Money Market Instruments (annually)
SLT Aggregate Holding of Long-Term Securities by U.S. and Foreign Residents (monthly)
Other investment and short-term debt securities
3.26. (See paragraphs 9.67–9.69 for information on “other investment”; see paragraphs 9.20–9.22 for information on debt securities.) The TIC B and C forms collect balance sheet positions from U.S. financial and nonfinancial enterprises for their claims on and liabilities to foreign residents. Instruments covered include loans, deposits, trade credit, and similar instruments that are classi-fied as other investment in the ITAs and the IIP Accounts. These surveys also collect balance sheet positions covering short-term debt securities and negotiable certificates of deposit, which are clas-sified as portfolio investment.
3.27. Financial enterprises are required to report on the B forms if their claims or liabilities with foreign residents exceed the exemption levels. Most financial enterprises report their positions with affil-iated and unaffiliated foreign residents on the B forms. Transactions in debt instruments, such as
To Contents

Part I. Introduction and Overview
Bureau of Economic AnalysisU.S. International Economic Accounts: Concepts and Methods
26
deposits and loans, between affiliated U.S. and foreign financial enterprises are not considered to be part of a direct investment relationship and thus are also reported on the B forms. Insurance com-panies and pension funds receive special treatment because their transactions with affiliates are defined as direct investment in international guidelines; they are financial companies that report their balances only with unaffiliated foreign residents on the B forms.
3.28. Nonfinancial enterprises, which must file the C form if their claims or liabilities with foreign resi-dents exceed the exemption levels, report only positions with unaffiliated foreign residents to avoid reporting direct investment with affiliates.
Financial derivatives
3.29. (See paragraphs 9.72–9.74 for information on financial derivatives.) Comprehensive data on finan-cial derivatives are collected on TIC Form D, “Report of Holdings of, and Transactions in, Financial Derivatives Contracts.” Data are collected from U.S. banks, bank holding companies, financial hold-ing companies, securities dealers, and all other firms with worldwide holdings of financial deriva-tives, for their own and their customers’ accounts combined, in excess of $400 billion in notional value. The data collected include the fair value of derivative positions, which are included in the IIP Accounts, and the net settlement payments associated with derivatives contracts, which are included in the ITAs. Trading in financial derivatives is highly concentrated among a small number of large firms. With the introduction of the D form in 2005, derivatives were excluded from BEA’s direct investment surveys to avoid double counting transactions.
Equity and long-term debt securities
3.30. (See paragraph 9.16 for information on equity; see paragraphs 9.20–9.22 for information on debt securities.) TIC surveys that focus on the collection of transactions and positions between U.S. residents and foreign residents in long-term securities are another major group of surveys. Data are collected monthly on TIC Form S, “Purchases and Sales of Long-term Securities by Foreign Residents” on U.S. international transactions in equity and long-term debt securities from U.S. securities brokers, custodians, underwriters, issuers, investors, and other U.S. institutions in the securities markets. Complementing the S form, the monthly TIC Form “Aggregate Holdings of Long-term Securities by U.S. and Foreign Residents” (SLT) collects holdings of equity and long-term debt securities by U.S. and foreign residents through reports by U.S. custodians, U.S. issuers, and large U.S. investors.
3.31. In addition to these monthly surveys, benchmark surveys conducted every 5 years and related annual surveys collect holdings of equity securities and long- and short-term debt securities from U.S. custodians, U.S. issuers, and large U.S. investors on a security-by-security basis. Separate sur-veys are conducted to collect U.S. residents’ holdings of foreign securities and foreign residents’ holdings of U.S. securities. “Report of U.S. Ownership of Foreign Securities, Including Selected Money Market Instruments” [SHC(A)] collects U.S. residents’ holdings of foreign securities.
To Contents

Part I. Introduction and Overview
Bureau of Economic AnalysisU.S. International Economic Accounts: Concepts and Methods
27
“Foreign-Residents’ Holdings of U.S. Securities, Including Selected Money Market Instruments” [SHL(A)] collects foreign resident’s holdings of U.S. securities. These less frequent surveys are dif-ferent from the SLT in important ways.
3.32. The security level detail in these surveys allows the coupon interest rate for each issue to be matched with the position data, allowing (1) current interest yields on U.S. corporate, federally sponsored agency, and Treasury long-term debt securities held by foreign residents to be derived from the SHL(A) survey data and (2) current interest yields on foreign long-term debt securities held by U.S. residents to be derived from the SHC(A) survey data. These yields, together with other interest and dividend yields, are used to prepare estimates of portfolio investment income.
3.33. For the annual surveys, only the largest custodians and institutions are required to report, and sta-tistical methods are used to estimate holdings that are consistent with the most recent benchmark survey. In the benchmark surveys, a broader reporting panel is surveyed to obtain all holdings. U.S. custodians and large U.S. investors provide detailed records of all reportable securities on the SHC(A) and the SHL(A). Compiling these surveys security-by-security provides a much more detailed understanding of the holdings of securities by U.S. and foreign residents than does the SLT, which is collected by allowing respondents to submit aggregated monthly reports by security type.
3.34. The U.S. securities brokers, banks, custodians, investors, and other respondents on the TIC B, C, S, and SLT forms and the SHC(A), and SHL(A) surveys are instructed, in cooperation with BEA, to not report holdings of or transactions in equity or debt securities that are part of a direct invest-ment relationship, as defined in the TIC form instructions.
3.35. Significant changes have been made to the TIC reporting system over the years in response to innovation in financial activity and changes to international guidelines for preparing statistics for International Economic Accounts. Appendix B outlines changes made prior to December 2013. These changes provide insight into BEA statistics prepared using TIC source data for earlier periods
To Contents

Part I. Introduction and Overview
Bureau of Economic AnalysisU.S. International Economic Accounts: Concepts and Methods
28
Chapter 4. Relationship to Other Economic Accounts
4.1. The International Economic Accounts produced by the Bureau of Economic Analysis (BEA) are an important component of the three major sets of accounts that comprise the U.S. National Economic Accounts—the National Income and Product Accounts (NIPAs), the Industry Accounts, and the Financial Accounts of the United States. The U.S. National Economic Accounts closely follow the recommendations of the international System of National Accounts 2008 (SNA 2008). While the International Transactions Accounts (ITAs) correspond to the SNA’s rest-of-the-world accounts, they differ in that the ITAs present U.S. transactions with nonresidents from the perspective of the resident sectors, whereas the National Economic Accounts present these transactions from the perspective of nonresidents. The SNA items that are equivalent to international transactions items include exports and imports of goods and services, primary income, secondary income, cur-rent external balance, balance on the capital account, and net lending/net borrowing. Figure A.2 in appendix A presents an overview of how statistics from the U.S. International Economic Accounts are incorporated into BEA’s National Economic Accounts and the Federal Reserve Board’s (FRB) Financial Accounts of the United States.
4.2. The NIPAs, prepared by BEA, feature gross domestic product (GDP) statistics. These accounts present the value and composition of domestic output and the distribution of incomes generated in production. The international dimension of these productive activities is represented by trans-actions in goods and services between U.S. residents and nonresidents, which are obtained from the ITAs. The net exports component of GDP includes exports of goods and services less imports of goods and services. Income flows to and from foreign residents, which are also obtained from the ITAs, represent the international dimension of series such as national income and corporate profits.
4.3. Several adjustments are made to the ITA current-account statistics before they are incorporated in the NIPAs. These adjustments are generally small because of the use of common concepts, defini-tions, and source data. Adjustments are presented in NIPA tables 4.3B and 4.3C and are published annually in the August issue of the Survey of Current Business. The largest adjustments are for territorial coverage and for nonmonetary gold. In recent years, these adjustments have usually had only a small net impact on the current-account balance on the NIPA basis.
4.4. The Industry Accounts, also prepared by BEA, consist of the Input-Output (I-O) Accounts and the GDP by Industry Accounts. The I-O Accounts trace the flow of goods and services among indus-tries in the production process and show the value added by each industry and the detailed com-modity composition of national output. The GDP by Industry Accounts measure the contribution of each private industry and of government to nominal and real GDP. International flows of goods and services from the ITAs are critical to the complete measurement of output at the national level
To Contents
Part I. Introduction and Overview
Bureau of Economic AnalysisU.S. International Economic Accounts: Concepts and Methods
29
and to the industry composition of that output. Import use tables derived from the I-O Accounts, which show the use of imported goods and services by industries and final uses, are partly based on data from the ITAs.
4.5. The FRB’s Financial Accounts of the United States record the acquisition and sales of nonfinancial and financial assets throughout the U.S. economy, the sources of funds used to acquire those assets, and the value of assets held and of liabilities owed. Data on transactions and positions in financial assets and liabilities from the ITAs and International Investment Position (IIP) Accounts provide the international dimension of transactions and positions for the Financial Accounts of the United States. In addition, BEA and the FRB jointly publish the U.S. Integrated Macroeconomic Accounts, which combine data from the NIPAs, the ITAs, and the Financial Accounts of the United States to provide a reconciliation between national aggregate statistics for flows and stocks.
4.6. BEA also prepares regional accounts, which consist of statistics on GDP by state and by metropol-itan area, state personal income, and local area personal income. ITA statistics on compensation of border workers are used for these accounts. Finally, the U.S. Bureau of Labor Statistics prepares estimates of productivity for major sectors of the U.S. economy, which are partly based on BEA’s estimates of GDP and GDP by industry.
To Contents
Part I. Introduction and Overview
Bureau of Economic AnalysisU.S. International Economic Accounts: Concepts and Methods
30
Chapter 5. Release and Update Cycle
5.1. For the International Economic Accounts, the Bureau of Economic Analysis (BEA) prepares and releases statistics at monthly, quarterly, and annual frequencies. BEA releases U.S. interna-tional trade in goods and services statistics monthly ( jointly with the U.S. Census Bureau); the International Transactions Accounts (ITAs) and the International Investment Position (IIP) Accounts quarterly; and statistics on the activities of multinational enterprises (AMNE), on new foreign direct investment in the United States and on international services annually. Certain statistics on direct investment by country and industry are released quarterly; others are released annually.
5.2. Annual statistics for the ITAs represent the sum of the four quarters of the calendar year. Annual statistics for the IIP Accounts represent the positions at yearend. Annual statistics for trade in goods and services represent the sum of the twelve months of the calendar year.
5.3. Monthly, quarterly, and annual statistics from the International Economic Accounts are revised on a regular and published schedule. Updates typically incorporate new and revised source data and periodically incorporate changes in definitions, classifications, and estimation methods. Updates in certain months and quarters for seasonally adjusted statistics incorporate revisions to ensure that the total of monthly or quarterly statistics equals the total of not seasonally adjusted statistics. Update cycles for the core International Economic Accounts and for major related statistics are described below.
Update cycles for core International Economic Accounts
International Transactions Accounts
5.4. Preliminary quarterly ITA statistics are released in March, June, September, and December approximately 80 days after the end of the reference quarter. These statistics are revised the fol-lowing quarter to incorporate new source data. Quarterly not seasonally adjusted statistics are open for revision for at least the prior 3 years in annual updates released in June, and seasonal adjustments are open for at least 5 years. Preliminary annual statistics are released in March along with statistics for the fourth quarter of the previous year; the March statistics incorporate revisions for the seasonally adjusted statistics of each quarter of the previous year to ensure that the total of seasonally adjusted quarters equals the annual totals. These annual statistics are open for revision in subsequent annual updates.
To Contents

Part I. Introduction and Overview
Bureau of Economic AnalysisU.S. International Economic Accounts: Concepts and Methods
31
International Investment Position Accounts
5.5. Preliminary quarterly IIP Account statistics are released in March, June, September, and December, approximately 90 days after the end of the reference quarter. These statistics are revised the following quarter to incorporate new source data. Quarterly statistics are open for revi-sion for at least the prior 3 years in annual updates released in June. Preliminary annual statistics are released in March reflecting positions at the end of the fourth quarter of the previous year. These annual statistics are open for revision in subsequent annual updates.
Statistics on the activities of multinational enterprises
5.6. Preliminary statistics on the activities of multinational enterprises are released each August or November of the second year after the reference year and are revised once the following August or November.
Update cycles for other international accounts
Monthly goods and services statistics
5.7. Preliminary statistics are released each month about 35 days after the end of the reference month. These statistics are revised the following month to incorporate new source data. No further revi-sions are made until more complete source data become available in March, June, September, and December. The releases in March, September, and December contain revised statistics for the pre-vious 6 months.
5.8. The releases in February and March also contain revisions for each month of the prior year to ensure that the total of the seasonally adjusted months equals the annual totals. The release in June includes annual updates, which reflect newly available and revised source data, changes in defini-tions and classifications, and changes in estimation methods. Annual statistics are open for revision in subsequent annual updates.
International services statistics
5.9. Through 2019, annual statistics for trade in services that include service-type and geographical or affiliation detail beyond that included in the ITA statistics were released each October for the previous year. Beginning in 2020, these statistics were released in June or July. These statistics reflect the revisions made to the quarterly ITA statistics in June of that same year. Preliminary sta-tistics for services supplied to foreign markets by the foreign affiliates of U.S. MNEs and to the U.S. market by the U.S. affiliates of foreign MNEs are released in October of the second year after the reference year and are revised once the following October.
To Contents

Part I. Introduction and Overview
Bureau of Economic AnalysisU.S. International Economic Accounts: Concepts and Methods
32
Direct investment by country and industry statistics
5.10. Preliminary quarterly statistics providing country and industry detail for income and financial transactions beyond that shown in the ITAs are released concurrently with the ITAs in March, June, September, and December. These statistics are revised on the same schedule as the ITAs. More comprehensive annual statistics by country and by industry on income, financial transactions, and positions are released each July for the previous year and are revised in July of the following 3 years (4 years if the release occurs in a year in which benchmark results are incorporated into the statistics).
Statistics on new foreign direct investment in the United States
5.11. Preliminary annual statistics on new investments in the United States by foreign direct investors are released each July for the previous year and are revised the following July.
5.12. Departures from the standard revision practices are made infrequently, with advance notice, and only for special circumstances. For example, for the third quarter of 2009, BEA revised the ITA statistics in December 2009 to include a new treatment of special drawing rights (SDRs) requested by the International Monetary Fund as part of efforts to monitor the impact of the global financial crisis. Under the standard procedures, revisions to historical quarterly statistics are not made until the following June, when annual updates incorporate newly available and revised source data, along with any changes in definitions, classifications, and estimation methods, and all quarters of the current and previous years are open for revision.
Dissemination of statistics and related analyses
5.13. Full sets of detailed statistics from each of the International Economic Accounts are avail-able, free of charge, on BEA’s website at the time of each statistical release (see International Economic Accounts). For most of the accounts, many or all of the statistics are available through BEA’s interactive tables. Some statistics, however, are only available as pre-formatted files. BEA and the U.S. Department of Commerce have long-standing procedures that are designed to ensure that data dissemination to all interested members of the public occurs simultaneously. Furthermore, these procedures preserve the distinction between the policy-neutral release of data by statistical agencies and their interpretation by policy officials. The objectivity of BEA estimates is also fostered by the publication of methodologies. The BEA procedures adhere to the Office of Management and Budget (OMB) standards for data dissemination. See appendix C for information on the reliability of the statistics.
5.14. Many of the statistics from BEA’s core International Economic Accounts discussed in this chapter and many of the related statistics are also available through BEA’s application programming inter-face (API). BEA’s API provides developers and analysts a mechanism to search, display, analyze,
To Contents
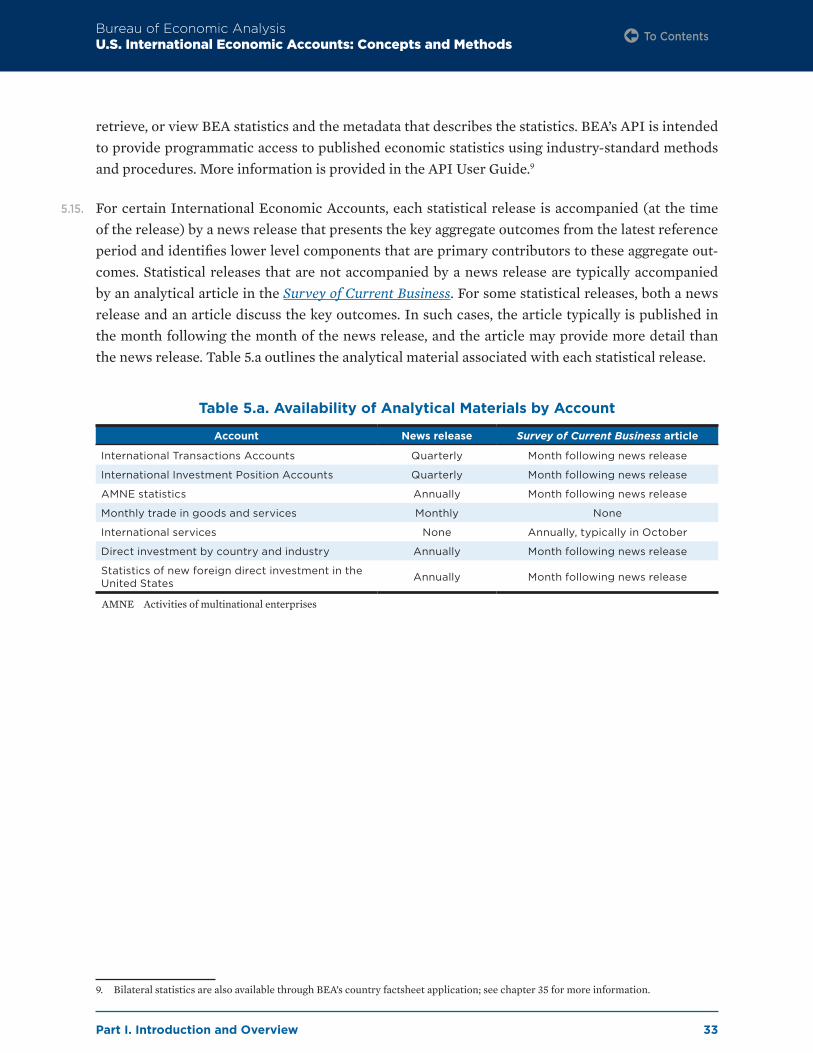
Part I. Introduction and Overview
Bureau of Economic AnalysisU.S. International Economic Accounts: Concepts and Methods
33
retrieve, or view BEA statistics and the metadata that describes the statistics. BEA’s API is intended to provide programmatic access to published economic statistics using industry-standard methods and procedures. More information is provided in the API User Guide.9
5.15. For certain International Economic Accounts, each statistical release is accompanied (at the time of the release) by a news release that presents the key aggregate outcomes from the latest reference period and identifies lower level components that are primary contributors to these aggregate out-comes. Statistical releases that are not accompanied by a news release are typically accompanied by an analytical article in the Survey of Current Business. For some statistical releases, both a news release and an article discuss the key outcomes. In such cases, the article typically is published in the month following the month of the news release, and the article may provide more detail than the news release. Table 5.a outlines the analytical material associated with each statistical release.
Table 5.a. Availability of Analytical Materials by Account
Account News release Survey of Current Business article
International Transactions Accounts Quarterly Month following news release
International Investment Position Accounts Quarterly Month following news release
AMNE statistics Annually Month following news release
Monthly trade in goods and services Monthly None
International services None Annually, typically in October
Direct investment by country and industry Annually Month following news release
Statistics of new foreign direct investment in the United States Annually Month following news release
AMNE Activities of multinational enterprises
9. Bilateral statistics are also available through BEA’s country factsheet application; see chapter 35 for more information.
To Contents

Part II. Conceptual Framework
Bureau of Economic AnalysisU.S. International Economic Accounts: Concepts and Methods
34
Part II. Conceptual Framework
Chapter 6. Economic Territory and Residence
6.1. Economic territory and residence are fundamental concepts for International Economic Accounts because they, along with the concept of institutional unit described in paragraphs 7.2–7.4, deter-mine the scope of the economy for which the accounts are compiled. An economy consists of the institutional units that are resident in a specific economic territory. The degree to which institu-tional units are connected to a particular economic territory is largely determined by factors such as physical presence and the extent of control by the government. Most institutional units have strong connections with only one economy.
Economic territory
6.2. The most common concept of economic territory is the area controlled by a single government.
6.3. The economic territory includes the land area, airspace, territorial waters, islands belonging to the territory, and territorial enclaves in the rest of the world. Territorial enclaves are clearly identified land areas physically located in other territories and used by governments for diplomatic, military, scientific, or other purposes. Examples include embassies, consulates, military bases, and immi-gration offices. International organizations, such as the International Monetary Fund (IMF) and the United Nations, are economic territories in their own right and are not considered part of the economic territory in which they are physically located.
6.4. For purposes of the U.S. International Economic Accounts, the United States consists of the 50 states, the District of Columbia, Puerto Rico, the U.S. Virgin Islands and other territories and possessions, U.S. foreign trade zones, and offshore oil and gas sites. The U.S. National Economic Accounts use a different definition of the United States, which excludes the territories and pos-sessions. The territories and possessions are included in the International Economic Accounts because they have a closer degree of economic association with the United States than with any other country and because the United States is the predominant center of economic interest for these territories and possessions.
To Contents

Part II. Conceptual Framework
Bureau of Economic AnalysisU.S. International Economic Accounts: Concepts and Methods
35
6.5. U.S. government military, diplomatic, consular, and other nonmilitary installations abroad are con-sidered to be part of the U.S. economy, and their operations are regarded as an extension of U.S. government domestic operations.
Residence
6.6. Residence is another fundamental concept for the International Economic Accounts because its application, in terms of the location of institutional units, determines whether transactions and related economic activities are within the scope of the International Economic Accounts. Each institutional unit’s residence is the economic territory with which it has the strongest connection, expressed as its center of predominant economic interest. Each institutional unit is a resident of one and only one economic territory. Other notions, such as citizenship or physical location of institutional units when transactions occur, are not used to determine whether transactions are in scope.
6.7. An institutional unit is resident in an economic territory when it engages—or intends to engage over a long period—in economic activities from some specific location in that territory. It is not necessary for the location to be fixed as long as it remains within the economic territory. In prac-tice, actual or intended location for one year or more is used as the criterion for establishing resi-dency in order to avoid uncertainty and to promote cross-country consistency.
6.8. For the U.S. International Economic Accounts, a U.S. resident is defined to include (1) individuals who reside or intend to reside in the United States for more than one year; (2) business enterprises and nonprofit organizations established under U.S. laws, including corporations, partnerships, and proprietorships; and (3) U.S. federal, state, and local governments, together with their subdivisions. Residency criteria for each of these three groups are described below. Also discussed below are the residency of international organizations and the determination of partner country classifications.
Individuals
6.9. Individuals who reside or intend to reside in a country for one year or more are considered resi-dents of that country; for example, those residing or intending to reside in the United States for at least one year are considered to be U.S. residents. The residence of individuals is determined by the economic territory in which their household members maintain or intend to maintain their princi-pal dwelling. All members of the same household have the same residence as the household itself.
6.10. Students and medical patients. Exceptions to the 1-year rule are made for students who study abroad and for persons who travel for medical treatment. Students retain the residency of their home country regardless of their length of stay. Medical patients, like students, retain the residency of their home country regardless of their length of stay for treatment.
To Contents
Part II. Conceptual Framework
Bureau of Economic AnalysisU.S. International Economic Accounts: Concepts and Methods
36
6.11. Diplomats, military personnel, etc. Exceptions to the 1-year rule are also made for government employees stationed abroad (and their families), such as diplomats, consular officials, and members of the armed forces. For example, U.S. diplomats and military personnel are treated as U.S. resi-dents, regardless of their length of stay abroad.
6.12. International organization staff. These staff, including those with diplomatic status, are treated as residents of the territory of their principal dwelling. The treatment of international organization staff differs from that for national diplomats and other government officials mentioned previously because the latter continue to be paid from and directed by their home government.
6.13. Cross-border workers. Because the residence of individual persons is determined by that of the household in which they belong, border workers, seasonal workers, and other short-term workers are considered residents of the country of their principal dwelling, rather than the country of their employment.
6.14. Crews of ships and other equipment. Crews of ships, aircraft, oil rigs, space stations, and other similar equipment that operate outside a territory or across several territories are treated as resi-dents of their home country.
6.15. Refugees. No exception to the 1-year rule is made for refugees. Refugees are considered residents of their country of refuge, rather than of their home country, if they have stayed or intend to stay for one year or more.
Business enterprises and nonprofit institutions
6.16. Business enterprises and nonprofit institutions serving households (NPISHs) are treated as resi-dents of the country in which they are located, operated, organized, or incorporated. U.S. resident entities consist of all for-profit and nonprofit institutions established under U.S. laws. Their for-eign affiliates—including branches10—are considered residents of the countries in which they are located; similarly, all U.S. affiliates of foreign for-profit and nonprofit institutions are considered U.S. residents.
6.17. Affiliates of multinational enterprises (MNEs) are treated as residents of the country in which they are located, not as residents of the country of the parent; thus, U.S. affiliates of foreign corporations are considered U.S. residents, and foreign affiliates of U.S. MNEs are considered foreign residents.
General government
6.18. General government includes federal, state, and local governments and their agencies and subdi-visions, whether operating at home or abroad. All of these government entities are treated as resi-dents of their home country. Thus, U.S. government installations abroad are considered residents of
10. A branch is a business affiliate established, but not incorporated, in a foreign country to conduct the business of the parent company in the parent’s name; it is not a separate legal entity.
To Contents
Part II. Conceptual Framework
Bureau of Economic AnalysisU.S. International Economic Accounts: Concepts and Methods
37
the United States, and foreign government installations located in the United States are considered residents of their home country. This treatment is adopted because such units usually have some degree of immunity from the host country’s laws and, under international law, are deemed to be extensions of the home government’s territory.
International organizations
6.19. International organizations, such as the IMF and the United Nations, are treated as residents of an international area of their own beyond national boundaries, rather than as residents of the country in which they are located or in which they operate. Transactions in the International Transactions Accounts (ITAs) include, for example, the administrative expenses of these organizations in the United States and the compensation paid to U.S. resident employees by these organizations.
Partner country classifications
6.20. The International Economic Accounts show transactions and positions with all nonresidents as a single total, but considerable interest exists for statistics on transactions and positions with nonresidents classified by individual partner country or country groups. Such breakdowns may be provided for the accounts as a whole or for particular components, such as goods, services, direct investment, portfolio investment, or sales and employment of MNEs and affiliates. Partner country data allow bilateral comparisons and assist in identifying compilation problems. The U.S. International Economic Accounts provide extensive bilateral (partner country) statistics for the ITAs and for statistics on the activities of multinational enterprises (AMNE) but only for the direct investment component of the International Investment Position (IIP) Accounts. More detailed information on U.S. bilateral statistics is provided in chapter 35.
6.21. The basic principle for attribution by partner country is the economy of residence of the coun-terparty to the transaction or position. The same principles for determining residence apply, but they are often more difficult for partner country attribution because the information is not always known to the resident party. For the U.S. ITAs, the partner country attribution is based on the loca-tion of the counterparty to the transaction (transactor approach). For the U.S. IIP Accounts, U.S. asset positions are attributed to the country of residence of the issuer, and U.S. liability positions are attributed to the country of residence of the holder (debtor/creditor approach). In practice, such attributions are sometimes made to the country of residence of the transactor, such as a finan-cial institution located in an international financial center, because the residence of the holder is not known. Inward AMNE statistics for U.S. affiliates are attributed to the country of residence of the ultimate beneficial owner, and outward AMNE statistics for foreign affiliates of U.S. MNEs are attributed to the country where the affiliate is located.
To Contents

Part II. Conceptual Framework
Bureau of Economic AnalysisU.S. International Economic Accounts: Concepts and Methods
38
Chapter 7. Institutional Units and Sectors
7.1. Institutional units are entities that engage in transactions and other economic activities in an economic territory and that form the foundation for economic statistics compiled in the National Economic Accounts and the International Economic Accounts. These units are characterized by having the right to own goods or assets and to exchange their ownership, the ability to make eco-nomic decisions and engage in economic transactions, the ability to incur liabilities on their own behalf and to enter into contracts, and the existence of a complete set of financial accounts or the capacity to construct such accounts as needed. Such units are grouped into sectors for the U.S. International Economic Accounts.
Institutional units
7.2. The two principal types of entities that qualify as institutional units are households and institutions. Households consist of persons or groups of persons who share the same living accommodation, pool some of their income and wealth, and consume certain goods and services collectively. Households include persons living in institutional arrangements such as retirement homes. Institutions include legally incorporated business enterprises, business enterprises that are not incorporated (such as cooperatives, limited liability partnerships, and notional resident units), government units, and nonprofit institutions. An enterprise is an institutional unit engaged in production and may be a business enterprise, a nonprofit institution, or a part of a household or government unit engaged in production.
7.3. A notional resident unit is a type of business enterprise created for statistical purposes to hold land owned by foreign residents. A wholly owned subsidiary corporation can be recognized as an insti-tutional unit separate from its parent. Business enterprises also include investment funds and other institutions and trusts that hold assets and liabilities on behalf of owners. A branch is a nonresident unit with substantial operations over a significant period in an economic territory but with no sep-arate legal entity for those operations. Each branch is a direct investment enterprise.
7.4. The Bureau of Economic Analysis (BEA) departs from the naming conventions recommended in the International Monetary Fund Balance of Payments and International Investment Position Manual, Sixth Edition (BPM6) in two ways. First, the BPM6 term “corporations” is replaced with the term “business enterprise” in order to include enterprises such as partnerships that belong in this category but that are not organized as publicly held corporations. This departure from BPM6 was made to clarify the concept for data users and survey respondents in the United States. Second,
To Contents

Part II. Conceptual Framework
Bureau of Economic AnalysisU.S. International Economic Accounts: Concepts and Methods
39
BEA does not use the term “unincorporated enterprise” in order to avoid confusion with business enterprises that are not legally incorporated. In BPM6, “unincorporated enterprise” only refers to part of a household or government unit in its capacity as a producer of goods and services.11
7.5. Institutional units that have similar economic objectives and behavior are grouped into insti-tutional sectors. While an institutional sector classification could apply to both resident units and counterpart nonresident units, BEA applies it only to resident units. The institutional sector classification system recommended in BPM6 closely follows that found in the System of National Accounts 2008. For the U.S. International Economic Accounts, sectors are recognized for finan-cial asset and liability transactions in the financial account of the ITAs and for positions in the International Investment Position (IIP) Accounts. For the IIP Accounts, assets are classified by sec-tor of the U.S. holder and liabilities are classified by sector of the U.S. issuer. Sector classifications for related ITA transactions follow the same principles. Sectors are not recognized for the statistics on the activities of multinational enterprises although those statistics are classified by industry.
Institutional sectors
7.6. BEA’s presentation uses sectors adapted from the BPM6 guidelines primarily to provide additional detail on portfolio investment and other investment. BPM6 defines four main sectors: central bank, deposit-taking corporations except the central bank, general government, and “other sectors,” which includes the two subsectors “other financial corporations” and “nonfinancial corporations, households, and NPISHs.” (NPISHs are nonprofit institutions serving households.) In its sector terminology, BEA has replaced “corporations” with “institutions.” In addition, because little source data is available for the international transactions of households and NPISHs, BEA uses the label “nonfinancial institutions” without reference to households and NPISHs. Finally, BEA has elimi-nated the summary category “other sectors” and presents its two subsectors in its place. BEA’s sec-tor classifications thus comprise central bank, deposit-taking institutions except central bank, other financial institutions, nonfinancial institutions except general government, and general government. Each of these sectors is described below.
7.7. Central bank. A central bank is the financial institution that exercises control over key aspects of the financial system. In the United States, the central bank is part of the Federal Reserve System. The central bank conducts activities such as issuing currency, managing international reserves, transacting with the International Monetary Fund, and providing credit to deposit-taking institutions.
7.8. Deposit-taking institutions except central bank. Deposit-taking institutions except central bank are business enterprises that engage in financial intermediation as their principal activity. As a result, they have liabilities in the form of either deposits or financial instruments that are close
11. For example, the provision of rideshare services by an individual acting as an independent contractor would be considered to be an unincorporated enterprise in BPM6.
To Contents

Part II. Conceptual Framework
Bureau of Economic AnalysisU.S. International Economic Accounts: Concepts and Methods
40
substitutes for deposits. These enterprises include commercial banks, savings banks, savings and loan associations, credit unions, cooperative credit banks, and other specialized financial institu-tions that take deposits.
7.9. Other financial institutions. Other financial institutions consist of all business enterprises other than deposit-taking institutions that are principally engaged in providing financial services to other institutional units. Such services include financial intermediation, financial risk manage-ment, liquidity transformation, and auxiliary financial services such as securities brokerage. Other financial institutions include money market funds (MMFs), non-MMF investment funds, insurance enterprises, pension funds, and other financial intermediaries such as those engaged in the securi-tization of assets, financial leasing, and commercial and personal lending.
7.10. Nonfinancial institutions except general government. Nonfinancial institutions except general government include business enterprises whose principal activity is the production of market goods or nonfinancial services as well as households and NPISHs. The business enterprises include legally constituted corporations and business that are not incorporated—such as branches of nonresident enterprises, cooperatives, limited liability partnerships, and notional resident units owning land—as well as nonprofit institutions that are market producers of goods or nonfinancial services. As described above, households consist of a group of persons who share the same living accommodation. NPISHs are entities engaged in providing goods and services to households or the community at large free of charge or at prices that are not economically significant and that are not controlled and financed by government units.
7.11. General government. General government units are legal entities established by political processes and that have legislative, judicial, or executive authority over other institutional units within a given area. The principal functions of government are to provide goods and services to the com-munity or individual households and to finance their provision; to redistribute income and wealth by means of transfers; and to engage in nonmarket production. In the United States, many separate government units exist at different levels, including federal, state, and local government.
To Contents

Part II. Conceptual Framework
Bureau of Economic AnalysisU.S. International Economic Accounts: Concepts and Methods
41
Chapter 8. Accounting Principles
8.1. This chapter discusses the accounting principles underlying the recording of entries in the International Economic Accounts that are designed to ensure a complete integration of flows and positions along with symmetric counterparty recording. It first describes the characteristics of flows and positions, then explains the double-entry recording system, and follows with expla-nations of general accounting principles such as time of recording, valuation, and gross versus net recording of values. These principles apply primarily to the International Transactions Accounts (ITAs) and the International Investment Position (IIP) Accounts. Accounting principles for statis-tics on the activities of multinational enterprises (AMNE) follow U.S. generally accepted account-ing principles.
Flows and positions
8.2. Flows refer to economic activities and events that occur within an accounting period and positions refer to a level of assets or liabilities at a point in time. Cross-border flows include transactions that are recorded in the ITAs and the IIP Accounts and other flows that account for other changes in financial assets and liabilities in the IIP Accounts. Flows and positions are integrated so that all changes in positions between two points in time are fully explained by the recorded flows. The ITAs consist of transactions and exclude other changes in the volume, value, or classification of assets and liabilities. The IIP Accounts consist of both positions and changes in position. Changes in position reflect either transactions or other changes in the volume, value, and classification of assets and liabilities. AMNE statistics consist of both flows and positions.
8.3. A transaction is an exchange or transfer of value between two institutional units that occurs by mutual agreement or by law. Transactions are classified according to the nature of the economic value provided—namely, goods or services, primary income, secondary income, capital transfers, nonproduced nonfinancial assets, financial assets, or liabilities. With an exchange of value, a trans-action consists of two economic flows, one in each direction—for example, goods supplied by one party in return for currency supplied by the other. Transfers represent transactions in which eco-nomic value is acquired or provided without a corresponding return of economic value (quid pro quo).
8.4. Changes in position may also result from changes in the volume, value, or classification of an asset or liability not arising from a resident-nonresident transaction. These “other flows,” as defined in international statistical guidelines, capture changes in the values of assets and liabilities between opening and closing positions that are not due to transactions. Other flows consist of two broad types of changes: (1) other changes in the volume of assets and liabilities, which reflect the entry of new and the exit of existing assets and liabilities from balance sheets that are not due to
To Contents
Part II. Conceptual Framework
Bureau of Economic AnalysisU.S. International Economic Accounts: Concepts and Methods
42
transactions and (2) revaluations (holding gains and losses) on an asset or liability that arise from changes in their prices or exchange rates. In the U.S. International Economic Accounts, other flows are classified into those revaluations identifiably due to exchange-rate changes, those revaluations identifiably due to other price changes, and changes in volume and valuation n.i.e. (not included elsewhere).
8.5. Positions refer to the level of financial assets or liabilities at a point in time and typically are shown at the beginning and end of an accounting period. Positions between two periods are connected with flows during that period because changes in positions are caused by transactions and other flows. The IIP Accounts include financial assets and liabilities that have an international dimen-sion. All financial claims and financial liabilities involve two parties and have an international dimension when the counterparty is a nonresident institutional unit. AMNE statistics include posi-tions from balance sheet statistics.
Double-entry principle
8.6. The ITAs are based on a double-entry system of accounting. The main characteristic of double- entry accounting is that each transaction leads to two corresponding entries—a credit entry and a debit entry—in the accounts of the transactors. The International Economic Accounts for an econ-omy are compiled on a double-entry basis from the perspective of the residents of that economy.
8.7. In the current and capital accounts, a credit denotes entries for exports, primary income receipts, secondary income (transfers) receipts, and disposals of nonproduced nonfinancial assets. A debit denotes entries for imports, primary income payments, secondary income (transfers) payments, and acquisitions of nonproduced nonfinancial assets.
8.8. In the case of transactions in financial assets and liabilities, the terms “net acquisition of financial assets” and “net incurrence of liabilities” are used. Financial-account items are recorded on a net basis separately for each financial asset and liability (that is, they reflect changes due to all credit and debit entries during an accounting period). The use of the terms “net acquisition of financial assets” and “net incurrence of liabilities” highlights the impact of the financial account on the IIP Accounts. The use of these terms also simplifies the interpretation of the statistics. A positive change indicates an increase in assets or liabilities and a negative change indicates a decrease in assets or liabilities.
8.9. The interpretation of increase or decrease under the credit or debit notion, however, depends on whether the increase or decrease refers to assets or liabilities. An increase for an asset and a decrease for a liability are both debits. Although the debit and credit presentation is not empha-sized for the financial-account transactions, it is important to recognize and maintain the account-ing identities. For example, a credit is always conceptually matched with a corresponding debit, the latter relating in the financial account to either an increase in an asset or a reduction in a liability.
To Contents

Part II. Conceptual Framework
Bureau of Economic AnalysisU.S. International Economic Accounts: Concepts and Methods
43
8.10. Each credit entry requires an equal and offsetting debit entry, and vice versa. For example, if a for-eign resident purchases a U.S. good with a payment from its U.S. bank account, the offsetting entry to the credit for U.S. goods exports would be a debit for U.S. incurrence of liabilities abroad by U.S. deposit-taking institutions, reflecting the reduction in U.S. bank deposit liabilities to foreign resi-dents. Similarly, a debit entry for a donation of emergency supplies by a U.S. resident to a foreign resident (transfer payment) is offset by a credit entry for U.S. goods exports.
Accounting periods, time of recording, and change in ownership
8.11. Unless noted otherwise below, statistics published in the ITAs represent the value of transactions taking place during a reference period. Annual statistics are presented on a calendar-year basis (that is, January through December) and quarterly statistics are presented on a calendar-quarter basis (that is, Q1 = January, February, and March; Q2 = April, May, and June; Q3 = July, August, and September; Q4 = October, November, and December). Also, unless noted otherwise below, the IIP Accounts present the dollar value of U.S. financial assets and liabilities with respect to foreign res-idents at a specific point in time, either the end of a calendar year or the end of a calendar quarter.
8.12. For trade in services and direct investment statistics based on surveys conducted by the Bureau of Economic Analysis (BEA), the respondent is typically required to report data for its fiscal quarter that ends closest to the end of a specified calendar quarter. For the annual and benchmark surveys, the respondent is typically required to report for its fiscal year that ends in the specified calendar year. In most cases, the respondent’s fiscal year coincides with the calendar year, so the published statistical aggregates track calendar-year transactions and positions fairly closely. When fiscal years differ from calendar years, BEA sums the four quarters that most closely correspond to the calen-dar year to proxy statistics on a calendar-year basis. Using the fiscal quarter instead of the calendar quarter is intended to ease the burden on respondents that use fiscal-year accounting records in their reports.
8.13. AMNE statistics are collected and published on a fiscal-year basis. As such, the comparability between those statistics and the direct investment statistics in the ITAs and the IIP Accounts depends, in part, on the number and size of, and volatility of the data for, multinational enterprises (MNEs) and affiliates whose fiscal years do not correspond to the calendar year. However, for the majority of MNEs and affiliates, the fiscal year ends on December 31.
8.14. For new foreign direct investments that begin in a particular calendar year, statistics on finances and operations associated with the new investments are compiled on a fiscal-year basis.
8.15. The accrual basis is used for determining the time of recording of flows for the ITAs and AMNE statistics, as recommended by international guidelines. Central to the recording of transactions on an accrual basis is the identification of the time at which economic ownership changes. Economic ownership, which may differ from legal ownership, accrues to the party that bears the risks and enjoys the rewards of ownership. For trade in goods, the time at which change of ownership
To Contents

Part II. Conceptual Framework
Bureau of Economic AnalysisU.S. International Economic Accounts: Concepts and Methods
44
occurs is approximated by the time at which goods cross the border. For services, transactions are recorded when the services are performed or provided rather than when payments are made. For income, transactions are recorded in the period in which the amounts payable accrue rather than when the income is paid or received. Entries for sales, payroll, and other AMNE flow statistics are recorded in a similar manner.
8.16. The accrual basis, which matches the time of recording with the timing of the events giving rise to the flows, provides the most comprehensive accounting because all flows are recorded, including nonmonetary transactions, imputed transactions, and other flows. Such a comprehensive recording ensures the integration of flows and changes in positions as well as consistency among ITA, IIP, and AMNE statistics. The accrual basis is consistent with the way transactions, other flows, and key aggregates are defined, and it corresponds closely to U.S. business accounting practices.
8.17. The accrual basis specifies that transactions are to be recorded when a change of ownership occurs in real or financial assets. Generally, economic ownership changes when real and financial assets are purchased or sold, and the time of recording these transactions is when the purchases or sales are entered on the books of the business entities, regardless of when payment was due or actu-ally made. This change in ownership principle is the same as that employed throughout the U.S. National Economic Accounts.
8.18. The concept of economic ownership refers to the ownership of assets and all of the risks and rewards of ownership. The risks include the potential losses caused by damage, theft, or holding losses; by management, transfer, or maintenance costs that are greater than anticipated; and, in the case of financial assets, by default of the counterparty. The rewards generally refer to the ability to use assets in production, such as buildings or machinery; the generation of services, such as renting produced assets to another entity; the generation of property income, such as interest and dividends received by owners of financial assets; and the potential to sell and thus realize holding gains.
8.19. Economic ownership is often the same as legal ownership, and changes in legal ownership are often used as evidence that a change in economic ownership has occurred. However, evidence that legal ownership has changed is sometimes not available in a timely fashion and occasionally differs from the concept of risk and rewards of economic ownership. In such cases, pragmatic applications are employed to gauge the appropriate time of recording of transactions.
To Contents
Part II. Conceptual Framework
Bureau of Economic AnalysisU.S. International Economic Accounts: Concepts and Methods
45
Valuation
8.20. In principle, whenever feasible the U.S. International Economic Accounts use market prices as the basis for valuation. Market prices are the amounts that willing buyers pay to acquire some-thing from willing sellers. The exchanges are made between independent parties on the basis of commercial considerations only—sometimes called “at arm’s length.” Market price is the price payable by the buyer after taking into account any rebates, refunds, and adjustments from the seller. Imports and exports of general merchandise are recorded at “free on board” (F.O.B) values, which take into account export taxes payable or tax rebates receivable. Most statistics from the International Economic Accounts are recorded at market prices.
8.21. Transactions in financial assets and liabilities are recorded exclusive of any commissions, fees, and taxes whether charged explicitly, included in the purchaser’s price, or deducted from the seller’s proceeds. Both debtors and creditors presumably record the same amount for the transaction in the same financial instrument. The commissions, fees, and taxes are recorded separately from the transaction under appropriate categories. The valuation of transactions in financial instruments, which excludes commission charges (recorded as transactions in services), differs from the valua-tion of nonfinancial asset transactions, which includes any costs of ownership transfer unless paid separately.
8.22. Transfer pricing refers to the valuation of transactions between affiliated enterprises. In the U.S. International Economic Accounts, these transactions are described as intrafirm trade. In some cases, transfer pricing may be motivated by income allocation or equity buildups or withdrawals. In principle, replacing book values (transfer prices) with market-equivalent values is desirable when the distortions are large and when availability of data makes it feasible to do so. However, in prac-tice BEA lacks the source data needed to identify transfer prices and adjust them to market values.
Prices
8.23. In general, positions of financial assets and liabilities are valued at market prices. Values are assigned as though the instruments were acquired in market transactions on the balance sheet reporting date. Loan positions and positions on deposits and accounts receivable/payable are recorded at nominal value. Nominal value refers to the outstanding amount owed, which con-sists of the outstanding principal amount including accrued interest. Use of nominal values for loans and deposits reflects pragmatic concerns about data availability and the need for symmetry between debtors and creditors. BEA applies these principles to the valuation of the IIP Accounts for each functional category, subject to limitations imposed by data availability.
8.24. Direct investment positions in the IIP Accounts are valued at market prices, which is BEA’s fea-tured measure, at current cost, and at historical cost (book value). AMNE balance sheet statistics are valued at historical cost (book value). Historical cost largely reflects values on the books of the entity during the reference period and is the valuation method used for positions reported on BEA’s
To Contents
Part II. Conceptual Framework
Bureau of Economic AnalysisU.S. International Economic Accounts: Concepts and Methods
46
direct investment surveys. BEA’s market value statistics are derived by revaluing the historical cost values of the equity portion of direct investment using indexes of stock market prices. Historical cost valuations are used for direct investment position statistics classified by country and by industry.
8.25. Transactions and other flows in the International Economic Accounts are generally presented in current dollars—that is, at prices current in the reference period.12 Positions in the International Economic Accounts are also presented in current dollars subject to the discussion in the Valuation section above.
8.26. Current-dollar trade in goods and services statistics from the ITAs are used as the basis for real (or “chained-dollar”) statistics on goods and services exports and imports in the National Income and Product Accounts (NIPAs). An adjustment for price change is made using the Fisher chain-weighted methodology developed by BEA and deflators primarily based on monthly price indexes published by the U.S. Bureau of Labor Statistics (see NIPA tables 4.2.1–4.2.6).
Gross and net recording
8.27. Transactions in the current and capital accounts of the ITAs are primarily recorded on a gross basis in order to present a complete picture of the two-way flow of trade and the exchange of nonpro-duced nonfinancial assets. For example, if the United States both exported and imported automo-biles in a given period, the exports and the imports would be separately recorded. Therefore, most entries in the current and capital accounts have positive signs.
8.28. For direct investment income on equity, however, transactions are recorded on a net basis in the sense that profits and losses—or, for an individual unit, revenues and costs—are not recorded sepa-rately but are netted against each other. As a result, direct investment income on equity entries can have a negative sign depending on the mix of profits and losses in the direct investment universe.
8.29. As with transactions in direct investment equity income, transactions in the financial account are presented on a net basis, but the nature of the netting differs slightly. For net U.S. acquisition of assets and net U.S. incurrence of liabilities, transactions reflecting flows in one direction are net-ted against transactions reflecting flows in the other direction. Therefore, if U.S. residents both sold and purchased foreign securities in a given period, only the net sales or purchases would be recorded. Consequently, as with direct investment income on equity, financial-account entries can have a negative sign depending on the magnitudes of cross-border gross outflows and inflows.
8.30. Transactions and other flows in financial assets and liabilities are recorded as net changes in financial assets and net changes in liabilities, respectively. The net recording principle is applied at
12. Note, however, that in the monthly goods and services statistics, in addition to the presentation in current dollars, real statistics are presented for broad end-use categories of Census-basis goods exports and imports.
To Contents

Part II. Conceptual Framework
Bureau of Economic AnalysisU.S. International Economic Accounts: Concepts and Methods
47
the lowest level of classification of financial instruments, taking into account the functional, insti-tutional sector, maturity, and currency classifications, as applicable. Generally, the net recording principle is applied within a given standard component of assets or liabilities.
8.31. Except in certain circumstances, financial asset transactions in the ITAs are not netted against financial liability transactions. For the United States, an exception is the treatment of financial derivatives, which are presented on a net basis as net transactions in assets less net transactions in liabilities.
8.32. In the IIP Accounts, positions of financial assets and liabilities are recorded on a gross basis. Positions of the same type of financial instrument held as both a financial asset and a liability are presented on a gross basis, so that assets are recorded under assets and liabilities are recorded under liabilities. For example, a claim from short-term debt securities held as an asset is presented separately from a liability for short-term debt securities.
8.33. AMNE statistics are primarily recorded on a gross basis and, consequently, have mostly positive signs. However, measures such as net income and value added, which, by construction, are calcu-lated as the sum of positive and negative components, can have negative signs. For example, the calculation for net income (revenues less costs) can result in a negative value.
To Contents

Part II. Conceptual Framework
Bureau of Economic AnalysisU.S. International Economic Accounts: Concepts and Methods
48
Chapter 9. Classification of Transactions and Positions
9.1. The International Transactions Accounts (ITAs) and the International Investment Position (IIP) Accounts disaggregate and classify resident-nonresident transactions and positions in various ways to provide greater insight into their economic significance and to present the statistics in the broader context of integrated economic accounts. Classifications are used to group similar compo-nents and to separate components with different characteristics. This chapter describes important classifications of transactions that distinguish activities in the current and capital accounts, the key characteristics of financial assets and liabilities and related classifications, and the functional cate-gories that are used to classify positions, income flows, and financial-account transactions. Some of these classifications also apply to statistics produced by the Bureau of Economic Analysis (BEA) on the activities of multinational enterprises (AMNE).
Current and capital accounts
9.2. The current account of the ITAs consists of resident-nonresident transactions in goods and ser-vices, primary income, and secondary income (current transfers). The capital account of the ITAs consists of resident-nonresident transactions in nonproduced nonfinancial assets and capital transfers. Major current-account classifications include goods versus services and primary income versus secondary income (current transfers). Distinctions between goods and services, between current and capital transfers, and between primary income and services are not always straight-forward. This section discusses important cross-cutting classification issues that affect the current and capital accounts.
Goods versus services
9.3. In economic accounts, goods and services are the two categories of outputs of productive activi-ties.13 In principle, goods are physical items with ownership rights that can be exchanged among institutional units through transactions. The production of a good can be separated from its sub-sequent sale or resale. In principle, services are the result of production activities that change the condition of the consumer—by changing either the condition of the consumer’s goods or the phys-ical or mental condition of the consumer—or that facilitate the exchange of products and financial assets. Services are not outputs over which ownership rights can be established; they cannot be traded separately from their production.
9.4. In practice, certain products lack the features that fully characterize goods or fully characterize services. In particular, “knowledge-capturing products,” which include outputs of information, advice, and entertainment that can be repeatedly accessed by the consumer, are not necessarily
13. This discussion of goods and services draws on the System of National Accounts 2008 (SNA 2008).
To Contents

Part II. Conceptual Framework
Bureau of Economic AnalysisU.S. International Economic Accounts: Concepts and Methods
49
physical, but ownership rights can be exchanged for such products and production can be sepa-rated from sale or resale. Most knowledge-capturing products are categorized in the International Economic Accounts as services and many services categories consist of these products. Knowledge-capturing products include some intellectual property products, such as computer software and audio-video recordings, and several other products in which the output is provided in the form of information, advice, and entertainment.14
9.5. In the ITAs, the valuation of goods includes transport services within the exporting economy as well as wholesale and retail services embedded in the price of the goods. Cross-border transport and insurance services for goods are included in services. Certain services include the value of goods, such as travel, construction, and government goods and services n.i.e. (not included else-where). Moreover, some services—particularly manufacturing services; maintenance and repair services; installation, alteration, and training services; and freight transport—are closely related to the production or transport of new and used goods.
Primary income versus services
9.6. Primary income includes both investment income—such as interest, dividends, and reinvested earnings—and compensation of employees. An important issue for distinguishing compensation of employees from services trade is the existence of an employer-employee relationship between a resident and nonresident. Provision of certain types of services may pose classification problems because firms may purchase a service, such as legal services, from a self-employed person or may hire an employee to provide the service. If an employer-employee relationship exists between the worker and the producing entity, the payment represents compensation of employees. If an employer-employee relationship does not exist, the payment constitutes a purchase of services.
9.7. Another cross-cutting issue regarding classifications between primary income and services concerns dividends paid by the affiliates of multinational enterprises (MNEs) to their parents. In some cases, parents provide management and administrative services to their affiliates without an explicit charge and account for these services as revenue for the parent and an expense for the affil-iate. If these types of intra-firm services transactions are not recognized for accounting purposes, then the measured flow of dividends between the parent and the affiliate would be affected. These distinctions are important for proper measurement of both the International Economic Accounts and the National Economic Accounts.
9.8. Disproportionately large values of services between affiliated enterprises may indicate the exis-tence of disguised dividends. Financial reporting and income tax minimization strategies may provide incentives for firms to characterize unpriced services transactions between affiliated enter-prises as business expenses rather than as dividends.
14. Although most knowledge-capturing products are categorized as services, some are categorized as goods. Aside from some intellectual property products, knowledge-capturing products include products such as newspapers, medical diagnostic testing, surveying, photography, and some legal services.
To Contents
Part II. Conceptual Framework
Bureau of Economic AnalysisU.S. International Economic Accounts: Concepts and Methods
50
Current versus capital transfers
9.9. Secondary income in the current account consists of current transfers between residents and non-residents. The capital account includes capital transfers along with transactions in nonproduced nonfinancial assets. Unlike an exchange, a transfer is a transaction that provides a good, service, or asset to another institutional unit without a corresponding return of economic value (quid pro quo). Capital transfers represent a change in ownership of an asset between parties. Current trans-fers include items such as personal remittances, government grants, cross-border fines and pen-alties, and institutional remittances. Capital transfers include debt forgiveness, nonlife insurance payments resulting from catastrophic events, and investment grants.
9.10. Current transfers directly affect the level of disposable income and savings and influence the con-sumption of goods or services. That is, current transfers reduce income and consumption possi-bilities of the donor country and increase income and consumption possibilities of the recipient country. As a result, current transfers are closely related to the goods, services, and financial assets provided and are included in the current account.
9.11. Entries for current transfers offset transactions with nonresidents that involve real resources or financial assets recorded in the goods, services, income, or financial accounts. Because a transfer is the offsetting entry to an actual resource flow, the value of the transfer equals the value of the corresponding flow. In general, transfers are recorded at the time of delivery of goods, performance of services, or disbursement of cash. The valuation of noncash transfers generally corresponds to the value of the goods or services for which they are offsets.
Financial assets and liabilities
9.12. Financial assets are a type of economic asset identified in economic accounts. Economic assets are resources over which ownership rights are enforced and from which future economic benefits may flow to the owner. They include fixed assets, such as equipment and outcomes of research and development, that are used repeatedly or continuously in production over more than one year. Economic assets also include inventories, valuables, nonproduced assets, and financial assets. Aggregate economic accounts usually distinguish produced and nonproduced assets among the universe of economic assets. In the ITAs, transactions in produced assets are recorded in the cur-rent account, in nonproduced nonfinancial assets in the capital account, and in financial assets and liabilities in the financial account.
9.13. Financial instruments, which consist of the full range of financial contracts between institutional units, may give rise to financial claims. A claim is a financial instrument that leads to an economic asset with a counterpart liability. Claims arise from contractual relationships under which one institutional unit promises to provide funds or other resources to another in the future. The only financial instrument that does not give rise to a claim is gold bullion that is included in monetary gold.
To Contents

Part II. Conceptual Framework
Bureau of Economic AnalysisU.S. International Economic Accounts: Concepts and Methods
51
9.14. Each claim is a financial asset that has a corresponding liability. The existence of two parties to a claim implies that it can arise in a cross-border situation. Nonfinancial assets do not have a cor-responding liability. Financial assets, which consist of claims and the gold bullion component of monetary gold, include equity and investment fund shares, debt instruments, financial derivatives other than reserve assets, and monetary gold.
Classification by type of instrument
9.15. Three broad categories of financial assets and liabilities are identified for the ITAs and the IIP Accounts: (1) equity and investment fund shares, (2) debt instruments, and (3) other financial assets and liabilities. More detailed classifications of financial assets and liabilities are also provided that are based primarily on the legal characteristics of the relationship between the involved parties. The classification system provides broad categories that allow for international comparability and the inclusion of new instruments arising from financial innovation. BEA’s financial instrument detail closely follows but does not exactly match the detail recommended by the International Monetary Fund (IMF) Balance of Payments and International Investment Position Manual, Sixth Edition (BPM6). Departures from BPM6 guidelines are described below.
Equity and investment fund shares
9.16. Equity and investment fund shares have the distinguishing feature that the holders own a resid-ual claim on the assets of the institutional unit that issued the instrument. Equity represents the owners’ funds in the institutional unit and is treated as a liability of the issuing institutional unit. In contrast to debt, equity generally does not provide the owner with a right to a predetermined payment or an amount determined by a fixed formula. Investment fund shares have a specialized role in financial intermediation as a type of collective investment in other assets. Investment funds include money market funds (MMFs) and non-MMF investment funds. Equity securities excluding investment fund shares include common stocks, preferred stocks, restricted stocks, and depository receipts. Investment fund shares include shares in money market, equity, and bond mutual funds; real estate investment trusts; index-linked equity unit investment trusts; and limited partnership interests.
Debt instruments
9.17. Debt instruments require the payment of principal and/or interest at some future point. Debt instruments consist of IMF special drawing rights (SDRs), currency and deposits, debt securities, loans, insurance technical reserves, pension and related entitlements, provision for calls under standardized guarantees, and other accounts receivable/payable. The term “debt instrument” applies to both the liability and the corresponding claim. Some instruments, such as currency and certain deposits, pay no interest. Debt securities are negotiable instruments that include asset-backed securities, collateralized debt obligations, and collateralized mortgage obligations.
To Contents

Part II. Conceptual Framework
Bureau of Economic AnalysisU.S. International Economic Accounts: Concepts and Methods
52
9.18. Debt instruments differ from equity and investment fund shares in the nature of the liability and risk. While equity provides a residual claim on the assets of the entity, a debt instrument involves an obligation to pay an amount of principal and/or interest, usually according to a predefined formula. As a result, the creditor usually has a more limited risk exposure with debt than with equity. In contrast, the return on equity largely depends on the economic performance of the issuer. Unlike financial derivatives, debt instruments have a principal amount typically associated with the supply of financial or other resources.
9.19. The ITAs and the IIP Accounts include detailed statistics for a variety of debt instruments in portfolio investment, other investment, and reserve assets. Below are descriptions for each of the published types of debt instrument.
9.20. Debt securities. Debt securities are negotiable instruments serving as evidence of a debt. They include bills, bonds, notes, negotiable certificates of deposit, commercial paper, debentures, asset-backed securities, money market instruments, and similar instruments traded in financial markets.
9.21. Debt securities include corporate bonds and notes both in registered and in bearer form, convert-ible debt, zero coupon debt, index-linked debt securities, medium-term notes, note issuance facil-ities, floating rate notes, asset-backed securities, sovereign debt of foreign governments and their political subdivisions, and debt issued by international and regional financial institutions. Debt securities also include U.S. Treasury securities, federally sponsored agency securities, and securi-ties issued by state and local governments.
9.22. Asset-backed securities include collateralized mortgage obligations, collateralized bond obliga-tions, collateralized loan obligations, collateralized debt obligations, other securities backed by pools of mortgages, credit card receivables, automobile loans, consumer and personal loans, and commercial and industrial loans.
9.23. Currency and deposits. Currency consists of notes and coins with fixed nominal values that are issued or authorized by central banks or governments. Deposits include all claims on deposit-tak-ing institutional units that are represented by evidence of deposit. The nominal value of deposits is usually fixed in the currency of denomination.
9.24. Loans. Loans are financial assets that are established when a creditor lends funds directly to a debtor and that are evidenced by documents that are not negotiable. This category includes install-ment loans, hire-purchase loans, and trade credit finance, as well as securities repurchase agree-ments and financial leases. A financial lease is a contract under which the lessor of an asset conveys substantially all the risks and rewards of ownership to the lessee; it is thus equivalent to a loan from the lessor to the lessee.
9.25. Some types of debt instruments may be classified as deposits or as loans. BPM6 recommends that “interbank positions” (transactions between U.S. banks and foreign banks) be classified as deposits.
To Contents

Part II. Conceptual Framework
Bureau of Economic AnalysisU.S. International Economic Accounts: Concepts and Methods
53
Because the Treasury International Capital source data used by BEA provide a breakdown of inter-bank positions between loans and deposits, BEA provides “interbank transactions” as a subset of transactions by deposit-taking institutions except central bank for both other investment assets and other investment liabilities. These interbank transactions may include deposits or loans.
9.26. Securities repurchase agreements, which are a widely used type of financial instrument in the U.S. economy, may also be classified as deposits or loans. BPM6 recommends that the supply and receipt of funds under a securities repurchase agreement be generally classified as a loan but as a deposit if it involves liabilities of a deposit-taking institution and is included in national measures of broad money.
9.27. Insurance technical reserves. Insurance technical reserves consist of reserves for unearned non-life insurance premiums due to prepayment of premiums and reserves against outstanding nonlife insurance claims, which are amounts identified by insurance companies to cover expected payouts from actual events for which claims have not been settled. Insurance technical reserves arise for both nonlife direct insurance and reinsurance.
9.28. Trade credit and advances. Trade credit and advances consist of credit extended directly by the suppliers of goods and services to their customers and advances for work in progress and prepay-ment by customers for goods and services not yet provided. Trade credit and advances arise when payment for goods and services is not made at the same time as the change in ownership of the good or provision of a service.
9.29. Special drawing rights. SDRs are international reserve assets created by the IMF and allocated to members to supplement existing official reserves. SDR holdings represent unconditional rights to obtain foreign exchange or other reserve assets from other IMF members.
9.30. Reserve position in the IMF. A country’s reserve position in the IMF equals the sum of the reserve tranche plus any indebtedness of the IMF in the General Resources Account that is readily avail-able to the member country. The reserve tranche represents the member’s unconditional drawing right on the IMF.
Other financial assets and liabilities
9.31. For the ITAs and the IIP Accounts, other financial assets and liabilities include (1) financial deriva-tives other than reserves and (2) monetary gold.
9.32. Financial derivatives other than reserves. In BPM6, this item is defined as financial derivatives and employee stock options. Financial derivatives and employee stock options have similar features in that both transfer risk, but employee stock options are also designed to be a form of compensa-tion. However, BEA is not able at this time to estimate cross-border transactions in employee stock options. A financial derivative contract is a financial instrument that is linked to another specific
To Contents
Part II. Conceptual Framework
Bureau of Economic AnalysisU.S. International Economic Accounts: Concepts and Methods
54
financial instrument, indicator, or commodity, and through which specific financial risks can be traded in financial markets. Transactions and positions in financial derivatives are treated sepa-rately from the values of underlying linked items.
9.33. Monetary gold. Monetary gold is gold for which the monetary authorities have title and is held as reserve assets. Gold includes gold bullion and unallocated gold accounts with nonresidents. All monetary gold is included in reserve assets or is held by international financial organizations. In contrast to monetary gold, which is a financial asset, nonmonetary physical gold is classified as a good. Monetary gold is treated differently because of its role as a means of international payments and as a store of value for use in reserve assets.
Classifications by maturity, currency, and sector
9.34. The maturity of a debt instrument is classified as either short-term or long-term. Short-term is defined as payable on demand or with a maturity of one year or less. Long-term is defined as hav-ing a maturity of more than one year or with no stated maturity (other than on demand, which is included in short-term). This classification provides information on the liquidity dimensions of debt. Currency is included in short-term maturity. Maturity may relate to original maturity or remaining maturity.
9.35. A financial asset or liability can also be classified as domestic currency or foreign currency, depending on its unit of account, denomination, or settlement. The currency of denomination is determined by the currency in which the value of the positions is fixed as specified in the contract between the parties. The currency of settlement may differ from the currency of denomination, and its use means that a currency conversion is required each time a settlement occurs.
9.36. Classification of financial assets and liabilities by sector can provide useful insights into how financial transactions and positions are distributed across the U.S. economy. For the ITAs and the IIP Accounts, sectors include central bank, deposit-taking institutions except central bank, other financial institutions, nonfinancial institutions except general government (including households and nonprofit institutions), and general government. Financial assets are classified by the sector of the U.S. holder and financial liabilities are classified by the sector of the U.S. issuer. Classifications by sector and by type of instrument provide even further insight into the distribution of asset and liability positions in the U.S. economy. (See chapter 7 for more detailed information about institu-tional sectors.)
To Contents

Part II. Conceptual Framework
Bureau of Economic AnalysisU.S. International Economic Accounts: Concepts and Methods
55
Functional categories
9.37. In the U.S. ITAs and the IIP Accounts, functional categories are the primary classification used for financial transactions, positions, and income. Five functional categories of investment are identi-fied in the accounts: direct investment, portfolio investment, other investment, reserves, and finan-cial derivatives other than reserves.
9.38. While the functional categories are based on the classification of financial assets and liabilities discussed above, they also take into account aspects of the relationship between the transactors and the motivation for the investment. The functional categories are designed to facilitate analy-sis by distinguishing categories that demonstrate different motivations and behavior patterns. For example, a loan can appear under direct investment or other investment, but the different nature of the relationship between the parties is important because the risks and motivations underlying the transaction may be different. A different relationship exists between the counterparties for portfo-lio investors versus direct investors.
9.39. Direct investment. Direct investment is related to control or a significant degree of influence and is usually associated with a lasting relationship. In contrast, portfolio investors typically have a much smaller role in the operations of the enterprise, with potentially important implications for future flows and for the volatility of the price and volume of positions.
9.40. Portfolio investment. Portfolio investment differs from other functional categories because it provides a direct way for investors to access financial markets and thus can provide liquidity and flexibility. It is associated with financial markets and with their specialized service providers, such as exchanges, dealers, and regulators.
9.41. Other investment. Other investment is a residual category that includes positions and transactions other than those included in direct investment, portfolio investment, reserve assets, and finan-cial derivatives other than reserves. Other investment includes the large volume of international transactions intermediated by large bank and nonbank financial intermediaries through loans and deposits.
9.42. Reserve assets. Reserve assets are shown separately because they serve a different function and thus are managed in different ways from other assets. Reserve assets include a range of instruments that are shown under other categories when they are not owned by monetary authorities. As reserve assets, however, they have the distinct purpose of meeting balance of payments financing needs and undertaking market intervention to influence the exchange rate.
9.43. Financial derivatives other than reserves. The nature of financial derivatives other than reserves as instruments through which risk is traded in its own right in financial markets sets them apart from other types of investment. While other instruments may also have risk transfer elements, these other instruments also provide financial or other resources.
To Contents

Part II. Conceptual Framework
Bureau of Economic AnalysisU.S. International Economic Accounts: Concepts and Methods
56
Direct investment
9.44. Direct investment is a category of cross-border investment in which a resident in one economy has control or a significant degree of influence over the management of an enterprise resident in another economy. In addition to the voting interest that leads to control or influence, direct invest-ment also includes equity investment associated with that relationship, including investment in indirectly influenced or controlled enterprises, investment in fellow enterprises, most debt, and reverse investment.
9.45. The Organisation for Economic Co-operation and Development provides criteria for determining whether cross-border ownership results in a direct investment relationship based on control and influence. Control or influence may be achieved directly by having voting power in the enterprise or indirectly by having voting power in another enterprise that has voting power in the enterprise. Immediate direct investment relationships arise when a direct investor directly owns 10 percent or more of the voting power in the direct investment enterprise. Control exists if the direct investor owns more than 50 percent of the voting power in the direct investment enterprise.
9.46. Indirect direct investment relationships arise through the ownership of voting power in one direct investment enterprise that owns voting power in another enterprise or enterprises. An entity is thus able to exercise indirect control or influence through a chain of direct investment relation-ships. For example, an enterprise may have an immediate direct investment relationship with a second enterprise that has an immediate direct investment relationship with a third enterprise. Although the first enterprise has no voting interest in the third enterprise, it may be able to exer-cise indirect control or influence.
9.47. U.S. direct investment abroad (outward investment) is the ownership or control, directly or indi-rectly, by one U.S. entity of 10 percent or more of the voting securities of a legally incorporated foreign business enterprise, or an equivalent interest in an unincorporated foreign business enterprise. Foreign direct investment in the United States (inward investment) is the ownership or control, directly or indirectly, by one foreign entity of 10 percent or more of the voting securities of a legally incorporated U.S. business enterprise, or an equivalent interest in an unincorporated U.S. business enterprise.
9.48. For partnerships, the determination of whether a partner and a limited partnership are in a direct investment relationship is based on control of the partnership and not on the percentage of owner-ship in the partnership’s equity. In most cases, the general partner is presumed to control a limited partnership and thus have a direct investment relationship with the limited partnership. In the case of multiple general partners, the partnership is presumed to be controlled equally by each of the general partners, unless a clause to the contrary is included in the partnership agreement. Limited partners normally do not exercise any control over a limited partnership. Unless a limited
To Contents

Part II. Conceptual Framework
Bureau of Economic AnalysisU.S. International Economic Accounts: Concepts and Methods
57
partner is granted some control over the partnership in a specific clause in the agreement or the agreement grants voting rights to limited partners, the limited partner is assumed to not be in a direct investment relationship with the partnership.
9.49. Direct investment refers to ownership by a single entity, or group of related entities, and not to the combined ownership of all entities in a country. An “entity” is broadly defined to include (1) any individual, branch, partnership, associated group, estate, trust, corporation or other business organization; (2) any government, including a foreign government, the U.S. government, a state or local government, or any division thereof; and (3) any government-sponsored agency or govern-ment-sponsored investment fund, such as a sovereign wealth fund. An associated group is treated in this definition as a single entity.
9.50. Because direct investment is defined from a single-owner viewpoint, it excludes investment in enterprises in which ownership is so dispersed that no one owner in another economy has an interest of 10 percent or more and the owners do not, or cannot, act in concert to influence man-agement. The single-owner viewpoint also means that investment by a U.S. entity of less than 10 percent in a foreign business enterprise is not considered direct investment, even if another U.S. entity has an interest of at least 10 percent in the enterprise. Thus, if one U.S. entity owns 11 percent and another owns 9 percent, then the 11 percent interest is included, but the 9 percent interest is excluded. However, if two or more U.S. entities each hold an interest of at least 10 percent, and are not associated with each other, then each such interest is included.
9.51. A direct investment ownership in a foreign business enterprise can result from direct or indirect ownership by a U.S. entity. For outward investment, it is directly held if the U.S. entity itself holds the ownership interest in the foreign business enterprise. It is indirectly held if one or more tiers of ownership exist between the foreign business enterprise and the U.S. entity. For example, a foreign business enterprise may be directly owned by another foreign business enterprise that is, in turn, owned by the U.S. entity.
9.52. A U.S. entity’s percentage of indirect voting ownership in a given foreign business enterprise is equal to the direct-voting-ownership percentage of the U.S. entity in the first foreign business enterprise in the ownership chain, times the first foreign business enterprise’s direct-voting-own-ership percentage in the second foreign business enterprise in the chain, times the corresponding percentages for all intervening enterprises in the chain, times the last intervening enterprise’s direct voting-ownership percentage in the given foreign business enterprise.
9.53. For example, suppose there are three related direct investment enterprises: a U.S. parent company (enterprise A), a directly held foreign affiliate in the Netherlands (enterprise B), and an indirectly held foreign affiliate in Spain (enterprise C). If enterprise A owns 80 percent of the voting power in enterprise B, which, in turn, owns 50 percent of the voting power in enterprise C, then enterprise A’s indirect voting ownership share in enterprise C is 40 percent (80 percent x 50 percent).
To Contents

Part II. Conceptual Framework
Bureau of Economic AnalysisU.S. International Economic Accounts: Concepts and Methods
58
9.54. If more than one ownership chain exists, the percentages of direct and indirect ownership in all the chains are summed to determine the U.S. entity’s ownership percentage. For inward direct invest-ment, the ownership percentage of a foreign entity in a given U.S. business enterprise is calculated in a parallel manner.
9.55. The direct investor is the entity that has a 10-percent or more direct or indirect ownership interest in a business enterprise located in another country. A business enterprise may have one or more direct investors, either through a single chain of ownership or through multiple chains. For out-ward investment, the International Economic Accounts focus on the direct investor that is resident in the United States; this direct investor is referred to as the U .S . parent. If the direct investor is a business enterprise, the U.S. parent is the fully consolidated domestic U.S. enterprise that consists of (1) the U.S. business enterprise whose voting securities are not owned more than 50 percent by another U.S. business enterprise and (2) proceeding down each ownership chain from that U.S. business enterprise, any U.S. business enterprise whose voting securities are more than 50 percent owned by the business enterprise above it in the chain. All other business enterprise and all foreign business enterprises owned by the U.S. parent are excluded from the full consolidation.
9.56. For inward investment, a U.S. business enterprise may have more than one direct investor through a given chain of ownership. The immediate direct investor in any ownership chain is referred to as the foreign parent, but the concept is defined much more narrowly than that of U.S. parent for outward investment. The foreign parent is the first foreign entity outside the United States in a U.S. affiliate’s ownership chain that has direct investment in the affiliate. Thus, while for outward investment the parent includes all members of the fully consolidated U.S. enterprise, for inward investment it includes only the first foreign entity outside the United States and excludes all other affiliated foreign entities. However, direct investment statistics include direct transactions of U.S. business entities with all of the affiliated foreign entities that, together with the foreign parent, constitute the foreign parent group. Some members of the foreign parent group may also be direct investors in the U.S. affiliate, but only the foreign parent is the immediate direct investor.
9.57. The foreign parent group, which is conceptually analogous to the U.S. parent for outward invest-ment, consists of (1) the foreign parent; (2) any foreign entity, proceeding up the foreign parent’s ownership chain, that owns more than 50 percent of the entity below it up to and including the ultimate beneficial owner (UBO) (the entity that is not owned more than 50 percent by another entity); and (3) any foreign entity, proceeding down the ownership chain of each of these mem-bers, that is owned more than 50 percent by the entity above it. Because the members of the foreign parent group may be located in different countries, transactions of a U.S. business entity with mem-bers of the foreign parent group are classified in the U.S. International Economic Accounts by the respective country of each member.15
15. The term “foreign affiliate of the foreign parent” is used to refer to any member of the foreign parent group besides the foreign parent itself (entities satisfying (2) or (3) in the definition of the foreign parent group).
To Contents

Part II. Conceptual Framework
Bureau of Economic AnalysisU.S. International Economic Accounts: Concepts and Methods
59
9.58. Affiliates are business enterprises that are directly or indirectly owned or controlled by an entity in another country to the extent of 10 percent or more ownership of the voting stock for a legally incorporated business, or an equivalent interest for an unincorporated business. A business enter-prise is any organization, association, branch, venture, or ownership of real estate that exists for profit-making purposes or to otherwise secure economic advantage.16 A business enterprise need not be legally incorporated; business enterprises also include branches, partnerships, and sole pro-prietorships. They may also include directly held commercial property.
9.59. Figure 9.a illustrates direct investment relationships between a direct investor (U.S. parent) and a foreign affiliate for outward direct investment to Mexico and between a UBO, a foreign parent, and a U.S. affiliate for inward direct investment from Germany through the Netherlands.
9.60. Direct investment transactions and positions include the equity that gives rise to control or influ-ence and intercompany lending, that is, debt between affiliated enterprises. However, debt between selected affiliated financial institutions is not classified as direct investment because it is not
16. The ownership of real estate exclusively for personal use is not a business enterprise; a primary residence that is leased to others by an owner while outside the United States who intends to reoccupy it is considered real estate held for personal use and not a business enterprise.
Figure 9.a. Affiliates, Parents, and Ultimate BeneficialOwners in Direct Investment Relationships
U.S. direct investment abroad
Foreign direct investment in the United States
U.S. entity(fully consolidated if a business enterprise) German entity
U.S. parent
Foreign affiliate
Ultimate beneficial owner
Mexican business enterprise
10 percent or more direct or indirect voting interest
50 percent or more ownership
Dutch entity
Foreign parent
U.S. business enterprise
U.S. affiliate
10 percent or more direct voting interest
U.S. Bureau of Economic Analysis
To Contents

Part II. Conceptual Framework
Bureau of Economic AnalysisU.S. International Economic Accounts: Concepts and Methods
60
considered to be so strongly connected to the direct investment relationship. These transactions are classified as other investment because the transactions are more closely connected to financial intermediation. The financial institutions covered by this exception are (1) deposit-taking corpora-tions, (2) investment funds, and (3) other financial intermediaries except insurance enterprises and pension funds.
9.61. Also excluded from direct investment, by definition, are transactions in financial derivatives. These transactions are included as a separate functional category in the International Economic Accounts. Even when transactions in financial derivatives are conducted by a direct investor or direct investment affiliate, they are considered transactions in financial instruments rather than transactions between a direct investor and an affiliated or unaffiliated entity.
9.62. Investments in or by private funds (collective investment institutions) are excluded from direct investment, and are included in portfolio investment, if the investor does not ultimately own at least 10 percent of the voting interest or equivalent of an “operating company”—that is, a U.S. or foreign business enterprise that is not a private fund or a holding company—through the private fund.
9.63. Direct investment is presented on the asset/liability basis recommended by BPM6, to the extent that source data allow, in addition to the directional basis recommended by previous guidelines. On the directional basis, direct investment statistics are organized according to whether the direct investment is outward or inward. On the asset/liability basis, direct investment statistics are orga-nized according to whether the investment relates to an asset or a liability. This primarily affects the recording of intercompany debt between parents and affiliates.
9.64. Under the asset/liability basis, U.S. parents’ debt claims are not netted against their debt liabilities to their foreign affiliates, and U.S. affiliates’ debt claims are not netted against their debt liabilities to their foreign parent groups. Partly because of source data limitations related to the measurement of investment between fellow enterprises, BEA’s direct investment statistics only approximate the full asset/liability basis. As recommended by BPM6, BEA presents direct investment statistics on a directional basis for the purpose of classifying direct investment by partner country and by industry.
Portfolio investment
9.65. Portfolio investment is defined as cross-border transactions and positions involving debt or equity securities, other than those included in direct investment or reserve assets. Securities are debt and equity financial instruments that have the characteristic feature of negotiability. Negotiability is a way of facilitating trading, allowing securities to be held by different parties during their lives. Negotiability allows investors to diversify their portfolios and to withdraw their investment readily.
9.66. Portfolio investment includes securities traded on organized financial markets. Such investment usually involves financial infrastructure, along with market-making dealers, and a sufficient volume
To Contents

Part II. Conceptual Framework
Bureau of Economic AnalysisU.S. International Economic Accounts: Concepts and Methods
61
of buyers and sellers. Acquisitions of shares in hedge funds, private equity funds, and venture capital are examples of portfolio investment that occur in less public and more lightly regulated markets. Portfolio investment is distinctive because of the nature of the funds raised, the largely anonymous relationship between the issuers and holders, and the degree of trading liquidity in the instruments. Portfolio investment may be classified by instrument, original or remaining maturity, or institutional sector.
Other investment
9.67. Other investment is a residual category that includes positions and transactions other than those included in direct investment, portfolio investment, reserve assets, and financial derivatives other than reserves. To the extent that the following classes of financial assets and liabilities are not included under direct investment or reserve assets, other investment includes: (1) other equity; (2) currency and deposits; (3) loans (including use of IMF credit and loans from the IMF); (4) nonlife insurance technical reserves, life insurance and annuities entitlements, pension entitle-ments, and provisions for calls under standardized guarantees; (5) trade credit and advances; (6) other accounts receivable/payable; and (7) SDR allocations. (SDR holdings are included in reserve assets.)
9.68. Other equity is included in other investment when it is not direct investment or reserve assets.
9.69. Other investment may be further classified by type of instrument, original or remaining maturity, or institutional sector. Because of a lack of source data, financial transactions and positions in the ITAs and the IIP Accounts are not separately reported for other equity liabilities and other accounts receivable/payable and do not include standardized guarantees or insurance technical reserves.
Reserves
9.70. Reserve assets are those external assets that are readily available to and controlled by monetary authorities for meeting balance of payments financing needs, for intervening in exchange markets to affect the currency exchange rate, and for achieving other related purposes such as maintain-ing confidence in the currency and the economy and serving as a basis for foreign borrowing. Underlying the concept of reserve assets are the notions of “control” and “availability for use” by the monetary authorities. In the United States, authority over reserve assets is shared by the U.S. Department of the Treasury and the Federal Reserve System.
9.71. In general, only external claims actually owned by the monetary authority can be classified as reserve assets. Reserve assets must also be readily available in the most unconditional form. Reserve assets consist of monetary gold, SDR holdings, reserve position in the IMF, currency and deposits, securities (including debt and equity securities), financial derivatives, and other claims (loans and other financial instruments, including repurchase agreements). Monetary gold,
To Contents
Part II. Conceptual Framework
Bureau of Economic AnalysisU.S. International Economic Accounts: Concepts and Methods
62
SDR holdings, and reserve position in the IMF are considered reserve assets because they are read-ily available to the monetary authorities in unconditional form. Currency and deposits, securities, and other assets often are equally available and therefore qualify as reserve assets.
Financial derivatives other than reserves
9.72. The functional category “financial derivatives other than reserves” in the U.S. ITAs and the IIP Accounts largely coincides with the corresponding financial instrument class described above; however, transactions in employee stock options are not included in the U.S. economic accounts because of the lack of appropriate source data.
9.73. This category is identified separately because it relates to risk transfer rather than supply of funds or other resources. Unlike other functional categories, no primary income accrues on financial derivatives. Any amounts accruing under the contract are classified as revaluations and are included in the other changes in assets and liabilities account.
9.74. While BPM6 encourages the recording of financial derivatives separately for both assets and liabil-ities, it recognizes that measuring transactions on a gross basis may not be feasible, in which case net reporting is acceptable. In the ITAs, net transactions are reported because measuring transac-tions on a gross basis is not feasible. In the IIP Accounts, however, gross positions are reported for financial derivatives held as assets and as liabilities.
To Contents

Part III. Statistical Methodology of International Transactions Accounts
Bureau of Economic AnalysisU.S. International Economic Accounts: Concepts and Methods
63
Part III. Statistical Methodology of International Transactions Accounts
Chapter 10. Introduction to the International Transactions Accounts
10.1. The International Transactions Accounts (ITAs) are a quarterly statistical summary produced by the Bureau of Economic Analysis (BEA) of transactions between U.S. residents and nonresidents. The ITAs consist of the current account, the capital account, and the financial account, along with a balancing item—the statistical discrepancy—and several balances. This chapter presents an over-view of the ITAs. The remaining chapters in part III present methodologies for statistics published in the ITAs.
10.2. Chapters 11–14 present information on current-account statistics. The current account consists of transactions between U.S. residents and nonresidents in goods, services, primary income, and sec-ondary income. Sources and methods for each major components of the current account are pro-vided in individual chapters: chapter 11 covers trade in goods; chapter 12 covers trade in services; chapter 13 covers transactions in primary income transactions; and chapter 14 covers transactions in secondary income.
10.3. Chapters 16–20 present information on financial-account statistics. The financial account con-sists of transactions between U.S. residents and nonresidents for direct investment, portfolio investment, other investment, reserves, and financial derivatives other than reserves. Sources and methods for statistics on financial transactions are discussed in chapter 16 for direct investment, in chapter 17 for portfolio investment, in chapter 18 for other investment, in chapter 19 for reserve assets, and in chapter 20 for financial derivatives other than reserves.
To Contents
Part III. Statistical Methodology of International Transactions Accounts
Bureau of Economic AnalysisU.S. International Economic Accounts: Concepts and Methods
64
10.4. Chapter 15 presents information on capital-account statistics. Chapter 21 discusses the statistical discrepancy and balances in the ITAs.
10.5. Included in the chapters in part III are descriptions of concepts and coverage, including departures from the International Monetary Fund Balance of Payments and International Investment Position Manual, Sixth Edition (BPM6), data sources, and estimation methods for the published compo-nents. For many of the accounts, the data sources identified in part III are available only with a lag—that is, not in time to be used for the most recent reference period(s). Appendix D outlines the sources and methods BEA uses to estimate (or “project”) the ITAs when the source data described in part III are not yet available.
10.6. The ITAs are prepared and released quarterly (except for ITA table 1.5). Transactions are pre-sented in current dollars (that is, at prices current in the reference period). Quarterly statistics are available both with and without seasonal adjustment, which is described in more detail below. Annual statistics represent the sum of the four quarters of the calendar year.
10.7. The ITA tables are comprised of several groups of tables, which are available on the BEA website:
• Tables 1.1–1.4 present the overall ITAs. Table 1.1 presents a summary of the current, capital,
and financial accounts, as well as the statistical discrepancy and balances; it contains limited
detail for major components of the accounts. Table 1.2 presents expanded detail on the
components of the accounts in table 1.1.17 Table 1.3 presents the expanded detail of table 1.2
by selected country and area grouping. Table 1.4 presents the same statistics as table 1.3 but
from the perspective of country and area detail by account. Table 1.5, an annual-only table,
presents details for trade in goods and services by country and area grouping.
• Tables 2.1–2.4 present details for trade in goods, part of the current account.
• Tables 3.1–3.3 present details for trade in services, part of the current account.
• Tables 4.1–4.4 present details for transactions in primary income, part of the current account.
• Table 5.1 presents detail for transactions in secondary income, part of the current account.
• Table 6.1 presents detail for financial transactions in direct investment.
• Table 7.1 presents detail for financial transactions in portfolio investment.
• Table 8.1 presents detail for financial transactions in other investment.
• Table 9.1 presents detail for financial transactions for liabilities to foreign official agencies.
Tables 1.3, 1.4, 1.5, 2.2, 2.3, 3.2, and 3.3 provide geographic detail. The other tables present statistics at the all-country level.
10.8. The accounts and their published components are discussed in part III in the order that they are presented in ITA table 1.2 and are shown below in table 10.a.
17. All of the accounts included in ITA table 1.1 are also included in ITA table 1.2, but table 1.1 provides a longer time series for these accounts than table 1.2.
To Contents

Part III. Statistical Methodology of International Transactions Accounts
Bureau of Economic AnalysisU.S. International Economic Accounts: Concepts and Methods
65
Table 10.a. Transactions Shown in International Transactions Accounts Table 1.2. U.S. International Transactions, Expanded Detail
Line Current account
1 Exports of goods and services and income receipts (credits)
2 Exports of goods and services
3 Goods
4 General merchandise
5 Foods, feeds, and beverages
6 Industrial supplies and materials
7 Capital goods except automotive
8 Automotive vehicles, parts, and engines
9 Consumer goods except food and automotive
10 Other general merchandise
11 Net exports of goods under merchanting
12 Nonmonetary gold
13 Services
14 Manufacturing services on physical inputs owned by others
15 Maintenance and repair services n.i.e.
16 Transport
17 Travel (for all purposes including education)
18 Construction
19 Insurance services
20 Financial services
21 Charges for the use of intellectual property n.i.e.
22 Telecommunications, computer, and information services
23 Other business services
24 Personal, cultural, and recreational services
25 Government goods and services n.i.e.
26 Primary income receipts
27 Investment income
28 Direct investment income
29 Portfolio investment income
30 Other investment income
31 Reserve asset income
32 Compensation of employees
33 Secondary income (current transfer) receipts
Line Current account
34 Imports of goods and services and income payments (debits)
35 Imports of goods and services
36 Goods
37 General merchandise
38 Foods, feeds, and beverages
39 Industrial supplies and materials
40 Capital goods except automotive
41 Automotive vehicles, parts, and engines
42 Consumer goods except food and automotive
43 Other general merchandise
44 Nonmonetary gold
45 Services
46 Manufacturing services on physical inputs owned by others
47 Maintenance and repair services n.i.e.
48 Transport
49 Travel (for all purposes including education)
50 Construction
51 Insurance services
52 Financial services
53 Charges for the use of intellectual property n.i.e.
54 Telecommunications, computer, and information services
55 Other business services
56 Personal, cultural, and recreational services
57 Government goods and services n.i.e.
58 Primary income payments
59 Investment income
60 Direct investment income
61 Portfolio investment income
62 Other investment income
63 Compensation of employees
64 Secondary income (current transfer) payments
Table continues
Line Capital account
65 Capital transfer receipts and other credits
Line Capital account
66 Capital transfer payments and other debits
To Contents

Part III. Statistical Methodology of International Transactions Accounts
Bureau of Economic AnalysisU.S. International Economic Accounts: Concepts and Methods
66
Line Financial account
67Net U.S. acquisition of financial assets excluding financial derivatives (net increase in assets/financial outflow (+))
68 Direct investment assets
69 Equity
70 Debt instruments
71 Portfolio investment assets
72 Equity and investment fund shares
73 Debt securities
74 Short term
75 Long term
76 Other investment assets
77 Other equity
78 Currency and deposits
79 Loans
80 Insurance technical reserves
81 Trade credit and advances
82 Reserve assets
83 Monetary gold
84 Special drawing rights
85 Reserve position in the International Monetary Fund
86 Other reserve assets
87 Currency and deposits
88 Securities
89 Financial derivatives
90 Other claims
Line Financial account
91Net U.S. incurrence of liabilities excluding financial derivatives (net increase in liabilities/financial inflow (+))
92 Direct investment liabilities
93 Equity
94 Debt instruments
95 Portfolio investment liabilities
96 Equity and investment fund shares
97 Debt securities
98 Short term
99 Long term
100 Other investment liabilities
101 Other equity
102 Currency and deposits
103 Loans
104 Insurance technical reserves
105 Trade credit and advances
106 Special drawing rights allocations
Line Financial account
107 Financial derivatives other than reserves, net transactions
Line Statistical discrepancy
108 Statistical discrepancy
Line Balances
109 Balance on current account
110 Balance on goods and services
111 Balance on goods
112 Balance on services
113 Balance on primary income
114 Balance on secondary income
115 Balance on capital account
116 Net lending (+) or net borrowing (−) from current- and capital-account transactions
117 Net lending (+) or net borrowing (−) from financial-account transactions
To Contents
Part III. Statistical Methodology of International Transactions Accounts
Bureau of Economic AnalysisU.S. International Economic Accounts: Concepts and Methods
67
10.9. Line 109 of ITA table 1.2 presents the balance on the current account, one of the Principal Federal Economic Indicators. Principal Federal Economic Indicators are a major statistical series des-ignated by the Office of Management and Budget that describe the current condition of the U.S. economy.
10.10. In addition to the statistics in the ITA tables, BEA also publishes related sets of statistics at differ-ent frequencies or at greater levels of detail than the ITA statistics. See figure A.1 in appendix A for an illustration of the related statistics and the data items that connect them.
10.11. One related set of statistics available at a greater frequency than the ITAs is the monthly statistics on trade in goods and services. These statistics are conceptually consistent with measures of trade in goods and services in the quarterly ITAs but generally are presented in less detail. For more information on the monthly statistics, see chapter 30.
10.12. Two sets of related statistics include more detail than the corresponding statistics in the ITAs, namely the trade in services portion of annual international services statistics and the transactions portion of the statistics on direct investment by country and industry.
10.13. The annual presentation of international services statistics provides expanded detail on a basis that is fully consistent with the quarterly ITAs. It includes additional detail by type, by affiliation, and by country and area. It also presents statistics on trade in information and communications technology (ICT) and potentially ICT-enabled services. For more information on the international services statistics, see chapter 31.
10.14. BEA also publishes more detailed quarterly and annual statistics on direct investment financial transactions and income flows than those presented in the ITAs. These statistics on direct invest-ment by country and industry use concepts and methods broadly consistent with those used for direct investment transactions in the ITAs, but they are presented on a directional basis and without current-cost adjustment. The detailed quarterly statistics include greater geographic and industry detail than in the ITAs. The comprehensive annual statistics include the most geographic and industry detail available. For more information on the direct investment by country and indus-try statistics, see chapter 32.
Seasonal adjustment
10.15. In its analysis of the ITAs in news releases and Survey of Current Business articles, BEA features seasonally adjusted statistics. Quarterly ITA statistics are seasonally adjusted when a series demon-strates a recurring seasonal pattern. Seasonal adjustment aims to remove effects due to variations that occur at about the same time and with about the same magnitude and direction each year. Removal of the seasonal component leaves a time series in which movements are caused by factors other than routine seasonal patterns.
To Contents

Part III. Statistical Methodology of International Transactions Accounts
Bureau of Economic AnalysisU.S. International Economic Accounts: Concepts and Methods
68
10.16. X-13ARIMA-SEATS, a software program developed by the U.S. Census Bureau to identify and remove seasonal effects from a time series, is used to seasonally adjust the ITAs. The ITAs to date are adjusted exclusively using the X-11ARIMA functionality within X-13ARIMA-SEATS. This process uses a combined regARIMA model to pre-adjust for time series features such as length of quarter, trading day, moving holidays, and outlier effects and an X-11 method that uses filter-based symmetric moving averages to determine trend, seasonal, and irregular components. The ITAs are predominately adjusted using a multiplicative model, meaning estimates of the quarterly or monthly adjustments are calculated as percentages above or below the general level of the series. Seasonally adjusting with X-13ARIMA-SEATS can yield multiple valid adjustment factors depend-ing on inputs to the model such as timespan considered and decisions about outliers. The software includes diagnostic tools and guidelines, but adjustment is subject to some degree of judgment. For more information, see X-13ARIMA-SEATS Seasonal Adjustment Program on the Census Bureau website.
10.17. BEA uses an indirect approach to seasonal adjustment in which the component series are season-ally adjusted, and these adjusted components are then aggregated to obtain the seasonally adjusted aggregate statistics. While this approach can introduce residual seasonality in aggregate series, BEA carefully evaluates the aggregates for residual seasonality and refines the adjustments as needed. This indirect approach allows users to add seasonally adjusted components to obtain the published seasonally adjusted totals. (Under a direct approach, the aggregate statistics would be separately seasonally adjusted without any expectation that seasonally adjusted components would sum to seasonally adjusted totals.)
10.18. Most components of the current account are seasonally adjusted; exceptions include many com-ponents of primary income. Most components of the financial account are not seasonally adjusted because these items do not exhibit stable, predictable seasonal patterns. One exception in the financial account is direct investment transactions, which exhibit a seasonal pattern that reflects seasonality in the company earnings that underlie the reinvestment of earnings. Neither capital- account receipts nor capital-account payments are seasonally adjusted.
10.19. For trade in goods, the Census Bureau computes seasonal adjustments for monthly Census-basis goods exports and imports by end-use commodity. BEA also evaluates its balance of payments adjustments to the Census-basis goods trade statistics (see paragraphs 11.26–11.46) to identify seasonal patterns and apply seasonal adjustment as needed. BEA sums these seasonally adjusted months to arrive at seasonally adjusted quarters of trade in goods. For trade in services, BEA adjusts at the most detailed level by type of service. For primary income, BEA adjusts direct invest-ment income receipts and payments at the level of major industry sectors.
10.20. BEA presents seasonally adjusted statistics for goods and services trade by selected country and area in ITA tables 2.2 and 3.2, respectively. These tables provide neither end-use detail for goods nor service-type detail for services. In general, estimates that are seasonally adjusted along one detailed dimension (such as geography) do not sum to the same total as estimates that are
To Contents
Part III. Statistical Methodology of International Transactions Accounts
Bureau of Economic AnalysisU.S. International Economic Accounts: Concepts and Methods
69
seasonally adjusted along another dimension (such as end-use commodity or service type) because the detailed seasonally adjusted estimates along each dimension are derived from different aggre-gations of the data and from different seasonal adjustment models. Therefore, the country-level seasonally adjusted statistics in these tables do not feed into statistics in other seasonally adjusted ITA tables.
10.21. Seasonal factors applied to the preliminary estimates (and for the first, second, and third quarters of a year, the first revised estimates) are projected for the reference year based on data for prior years. In the estimates released during the next calendar year’s annual update, the reference year’s not seasonally adjusted quarterly data themselves become inputs into the seasonal adjustment pro-cedure. For later revisions, adjustment factors account for seasonality in not seasonally adjusted estimates for years before, during, and after the year of the reference quarter.
10.22. Because the four quarterly estimates that sum to the preliminary annual estimate released each March after the reference year use seasonal factors that have been projected, the quarterly season-ally adjusted estimates do not automatically sum to the annual estimate. Therefore, BEA revises the quarterly adjusted estimates as necessary to ensure that the adjusted quarters sum to the annual total.
10.23. BEA reviews seasonal factors each year as part of the annual updates to account for newly avail-able source data and changes in seasonal patterns over time. BEA reviews every series and initiates adjustment on series that exhibit seasonality but were not previously adjusted, and it terminates adjustment on series that cease to exhibit a predictable seasonal pattern.
10.24. A revision to a seasonally adjusted estimate can be decomposed into a revision to the underlying not seasonally adjusted estimate and a revision to its seasonal adjustment factor. Because the sea-sonal factor for a particular reference period is estimated from a time series of the not seasonally adjusted data, revisions to not seasonally adjusted values in other periods in the time series can result in a revision to the seasonally adjusted value for a particular reference period even if its cor-responding not seasonally adjusted value in that period is unrevised.
To Contents
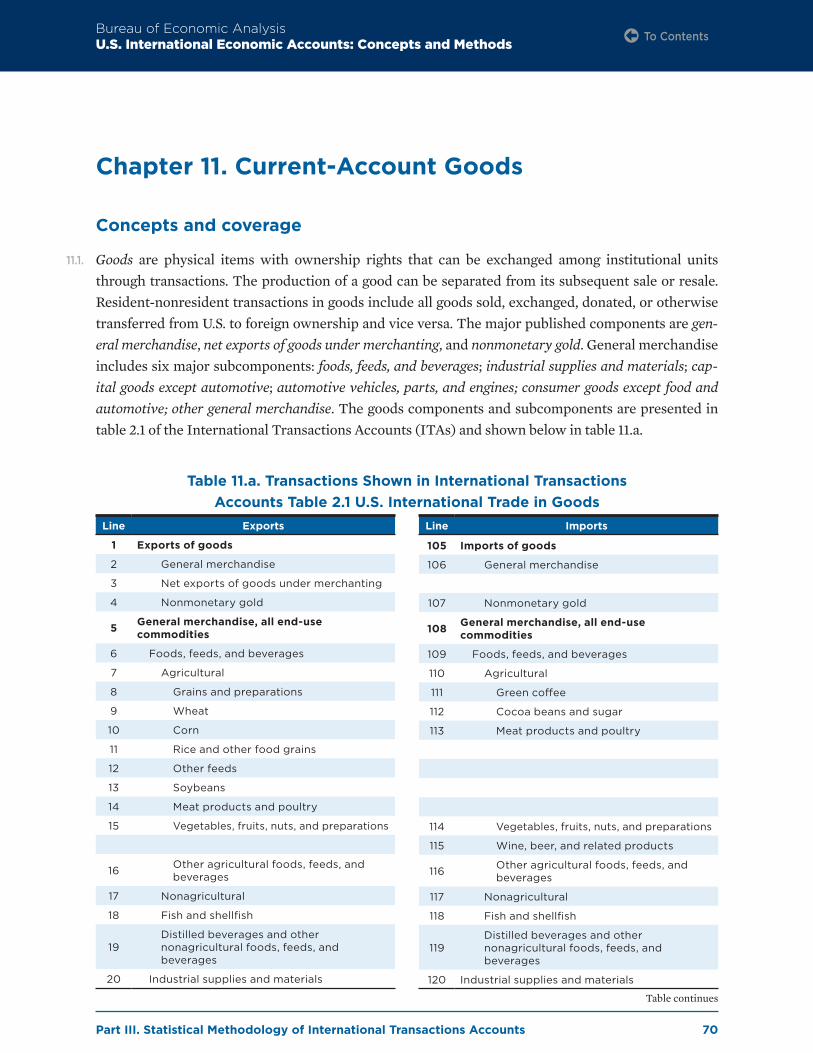
Part III. Statistical Methodology of International Transactions Accounts
Bureau of Economic AnalysisU.S. International Economic Accounts: Concepts and Methods
70
Chapter 11. Current-Account Goods
Concepts and coverage
11.1. Goods are physical items with ownership rights that can be exchanged among institutional units through transactions. The production of a good can be separated from its subsequent sale or resale. Resident-nonresident transactions in goods include all goods sold, exchanged, donated, or otherwise transferred from U.S. to foreign ownership and vice versa. The major published components are gen-eral merchandise, net exports of goods under merchanting, and nonmonetary gold. General merchandise includes six major subcomponents: foods, feeds, and beverages; industrial supplies and materials; cap-ital goods except automotive; automotive vehicles, parts, and engines; consumer goods except food and automotive; other general merchandise. The goods components and subcomponents are presented in table 2.1 of the International Transactions Accounts (ITAs) and shown below in table 11.a.
Table 11.a. Transactions Shown in International Transactions Accounts Table 2.1 U.S. International Trade in Goods
Line Exports
1 Exports of goods
2 General merchandise
3 Net exports of goods under merchanting
4 Nonmonetary gold
5 General merchandise, all end-use commodities
6 Foods, feeds, and beverages
7 Agricultural
8 Grains and preparations
9 Wheat
10 Corn
11 Rice and other food grains
12 Other feeds
13 Soybeans
14 Meat products and poultry
15 Vegetables, fruits, nuts, and preparations
16 Other agricultural foods, feeds, and beverages
17 Nonagricultural
18 Fish and shellfish
19Distilled beverages and other nonagricultural foods, feeds, and beverages
20 Industrial supplies and materials
Line Imports
105 Imports of goods
106 General merchandise
107 Nonmonetary gold
108 General merchandise, all end-use commodities
109 Foods, feeds, and beverages
110 Agricultural
111 Green coffee
112 Cocoa beans and sugar
113 Meat products and poultry
114 Vegetables, fruits, nuts, and preparations
115 Wine, beer, and related products
116 Other agricultural foods, feeds, and beverages
117 Nonagricultural
118 Fish and shellfish
119Distilled beverages and other nonagricultural foods, feeds, and beverages
120 Industrial supplies and materials
Table continues
To Contents

Part III. Statistical Methodology of International Transactions Accounts
Bureau of Economic AnalysisU.S. International Economic Accounts: Concepts and Methods
71
Line Exports
21 Agricultural
22 Raw cotton
23 Tobacco, unmanufactured
24 Hides and skins, including furskins
25 Other agricultural industrial supplies
26 Nonagricultural
27 Energy products
28 Petroleum and products
29 Crude
30 Fuel oil
31 Other petroleum products
32 Liquefied petroleum gases
33 Coal and related products
34 Natural gas
35 Nuclear fuel and electric energy
36 Paper and paper-base stocks
37 Textile supplies and related materials
38 Chemicals except medicinals
39 Plastic materials
40 Fertilizers, pesticides, and insecticides
41 Industrial inorganic chemicals
42 Industrial organic chemicals
43 Other chemicals
44 Building materials except metals
45 Other nonmetals
46 Metals and nonmetallic products
47 Steelmaking materials
48 Iron and steel products
49 Nonferrous metals
50 Precious metals except nonmonetary gold
51 Bauxite and aluminum
52 Copper
53 Other nonferrous metals
54 Other metals and nonmetallic products
55 Capital goods except automotive
56 Machinery and equipment except consumer-type
57 Electric-generating machinery, electric apparatus, and parts
58 Oil-drilling, mining, and construction machinery
59 Industrial engines, pumps, and compressors
60 Machine tools and metalworking machinery
Line Imports
121 Agricultural
122 Nonagricultural
123 Energy products
124 Petroleum and products
125 Crude
126 Fuel oil
127 Other petroleum products
128 Liquefied petroleum gases
129 Coal and related products
130 Natural gas
131 Nuclear fuel and electric energy
132 Paper and paper-base stocks
133 Textile supplies and related materials
134 Chemicals except medicinals
135 Plastic materials
136 Fertilizers, pesticides, and insecticides
137 Industrial inorganic chemicals
138 Industrial organic chemicals
139 Other chemicals
140 Building materials except metals
141 Other nonmetals
142 Metals and nonmetallic products
143 Steelmaking materials
144 Iron and steel products
145 Nonferrous metals
146 Precious metals except nonmonetary gold
147 Bauxite and aluminum
148 Other nonferrous metals
149 Other metals and nonmetallic products
150 Capital goods except automotive
151 Machinery and equipment except consumer-type
152 Electric-generating machinery, electric apparatus and parts
153 Oil-drilling, mining, and construction machinery
154 Industrial engines, pumps, and compressors
155 Machine tools and metalworking machinery
Table continues
To Contents

Part III. Statistical Methodology of International Transactions Accounts
Bureau of Economic AnalysisU.S. International Economic Accounts: Concepts and Methods
72
Line Exports
61 Measuring, testing, and control instruments
62 Other industrial machinery
63 Other service-industry and agricultural machinery
64 Computers
65 Computer accessories, peripherals, and parts
66 Semiconductors
67 Telecommunications equipment
68 Other office and business machines
69 Scientific, hospital, and medical equipment and parts
70 Civilian aircraft, engines, and parts
71 Civilian aircraft, complete, all types
72 Engines and parts
73 Other transportation equipment
74 Automotive vehicles, parts, and engines
75 To Canada
76 Passenger cars, new and used
77 Trucks, buses, and special purpose vehicles
78 Engines and engine parts
79 Other parts and accessories
80 To other areas
81 Passenger cars, new and used
82 Trucks, buses, and special purpose vehicles
83 Engines and engine parts
84 Other parts and accessories
85 Consumer goods except food and automotive
86 Nondurable goods
87 Apparel, footwear, and household goods
88 Medicinal, dental, and pharmaceutical products
89 Toiletries and cosmetics
90 Other nondurable goods
91 Durable goods
92 Televisions, video receivers, and other video equipment
93 Radio and stereo equipment, including recorded media
94 Toys and sporting goods, including bicycles
95 Household and kitchen appliances and other household goods
Line Imports
156 Measuring, testing, and control instruments
157 Other industrial machinery
158 Other service-industry and agricultural machinery
159 Computers
160 Computer accessories, peripherals, and parts
161 Semiconductors
162 Telecommunications equipment
163 Other office and business machines
164 Scientific, hospital, and medical equipment and parts
165 Civilian aircraft, engines, and parts
166 Civilian aircraft, complete, all types
167 Engines and parts
168 Other transportation equipment
169 Automotive vehicles, parts, and engines
170 From Canada
171 Passenger cars, new and used
172 Trucks, buses, and special purpose vehicles
173 Engines and engine parts
174 Other parts and accessories
175 From other areas
176 Passenger cars, new and used
177 Trucks, buses, and special purpose vehicles
178 Engines and engine parts
179 Other parts and accessories
180 Consumer goods except food and automotive
181 Nondurable goods
182 Apparel, footwear, and household goods
183 Medicinal, dental, and pharmaceutical products
184 Toiletries and cosmetics
185 Other nondurable goods
186 Durable goods
187 Televisions, video receivers, and other video equipment
188 Radio and stereo equipment, including recorded media
189 Toys and sporting goods, including bicycles
190 Household and kitchen appliances and other household goods
Table continues
To Contents

Part III. Statistical Methodology of International Transactions Accounts
Bureau of Economic AnalysisU.S. International Economic Accounts: Concepts and Methods
73
Line Exports
96 Household furnishings and related products
97 Household and kitchen appliances
98 Other household goods, including cell phones
99 Jewelry and collectibles
100 Gem diamonds and other gemstones
101 Other durable goods
102 Other general merchandise
103 Net exports of goods under merchanting
104 Nonmonetary gold
Line Imports
191 Household furnishings and related products
192 Household and kitchen appliances
193 Other household goods, including cell phones
194 Jewelry and collectibles
195 Gem diamonds and other gemstones
196 Other durable goods
197 Other general merchandise
198 Nonmonetary gold
11.2. The ITAs include goods that were produced in previous periods (used goods and inventories), U.S. exports that were produced in other countries (reexports), and U.S. imports that were produced in the United States (reimports). The ITAs do not identify how the goods are used, such as for per-sonal consumption, intermediate consumption, inventories, or gross fixed capital formation.
Departures from BPM6
11.3. The coverage and presentation of goods closely follow recommendations in the International Monetary Fund Balance of Payments and International Investment Position Manual, Sixth Edition (BPM6). The most important departure stems from the Bureau of Economic Analysis (BEA) not implementing the recommended treatment of goods for processing and the associated manufactur-ing services on physical inputs owned by others because of a lack of adequate source data. Another departure arises from not providing statistics on the gross flows for goods acquired and sold under merchanting.
11.4. For the processing abroad of U.S.-owned goods, under BEA’s current treatment a change in own-ership is imputed when goods intended for processing leave the United States, and the value of the goods is included in goods exports. Similarly, a change in ownership is imputed when the resulting processed goods return to the United States, and the value of the goods is included in goods imports. Conversely, a change in ownership is not recognized when goods to be processed are purchased over-seas by U.S. residents and stay abroad for processing. Neither is a change in ownership recognized when goods that are owned by U.S. residents but have been processed overseas are sold to a foreign buyer (either in the country of processing or a third country). BEA’s current treatment of foreign goods processed in the United States is symmetric to its treatment of U.S. goods processed abroad.
11.5. Under the BPM6 treatment, goods that are sent abroad for processing without a change in owner-ship and that are returned to the United States should be excluded from statistics on trade in goods, and the processing fee charged by the foreign manufacturing service provider should be recorded
Line Balance
199 Balance on goods
To Contents

Part III. Statistical Methodology of International Transactions Accounts
Bureau of Economic AnalysisU.S. International Economic Accounts: Concepts and Methods
74
as U.S. imports of services; any inputs purchased abroad by the U.S. firm and processed abroad should be recorded as U.S. imports of goods when the inputs are purchased. Similarly, goods that enter the United States for processing without a change in ownership and that are returned to the country of ownership should be excluded from statistics on trade in goods, and the processing fee charged by the U.S. manufacturing service provider should be recorded as U.S. exports of services; any inputs purchased in the United States by the foreign firm and processed in the United States should be recorded as U.S. exports of goods when the inputs are purchased.
11.6. In addition, goods sent abroad for processing and subsequently sold abroad should be recorded as U.S. exports of goods when they are sold. Similarly, goods entering the United States for processing and subsequently sold in the United States should be recorded as U.S. imports of goods when they are sold. In both cases, the processing fee should be recorded as a services transaction. Figure 11.a shows how the BPM6 treatment differs from BEA’s treatment for a case in which goods worth $800 are sent abroad for $200 of processing and then returned to the United States.
BPM6 recommendation
Figure 11.a. Comparison of BPM6 Recommendation and BEA Treatment of Goods for Processing and Manufacturing Services
BEA: Bureau of Economic AnalysisBPM6: Balance of Payments and International Investment Position Manual, Sixth Edition
Unprocessed good Unprocessed good
Processed goodProcessed good
Processing
Processing
International border
No export(No change of ownership)
No import(No change of ownership)
No manufacturingservice recognized
BEA treatment
Unprocessed good Unprocessed good
Processed goodProcessed good
International border
Goods export ($800)(Imputed change of ownership)
Goods import ($1,000)(Imputed change of ownership)
Manufacturing serviceimport ($200)
U.S. Bureau of Economic Analysis
To Contents
Part III. Statistical Methodology of International Transactions Accounts
Bureau of Economic AnalysisU.S. International Economic Accounts: Concepts and Methods
75
11.7. Currently, detailed information on the processing fees received and paid by U.S. firms for manu-facturing services and on the underlying goods transactions either are not available in the U.S. statistical system or are not identifiable in any of the source data. Despite these challenges, BEA continues to conduct research to determine feasible approaches for implementing this treatment. (See paragraphs 12.5 and 12.6 for a discussion of the discrepancy between BEA’s treatment of the processing fees for the manufacturing services and BPM6’s recommendation.)
11.8. In addition, under net exports of goods under merchanting, BPM6 recommends presenting sep-arately merchandise gross flows for goods acquired under merchanting as negative exports in the period the merchant acquires the goods and merchandise gross flows for goods sold under mer-chanting as positive exports in the period the merchant sells the goods. However, source data are not available for implementing this recommendation. BEA’s source data on merchanting transac-tions reflect the net value of goods that are purchased and subsequently resold abroad and thus assume that the purchase and sale occur in the same quarter.
Data sources
11.9. BEA uses a variety of data sources to estimate goods exports and imports; these sources are listed in table 11.b.
Estimation methods
11.10. Statistics for trade in goods in the ITAs are based on monthly trade data compiled by the U.S. Census Bureau (Census-basis data)—including data from the Automated Commercial Environment and from the U.S.-Canada Data Exchange—which are further described below. BEA makes adjustments to the Census-basis data in order to align them with the coverage, valuation, defini-tions, and concepts used for the International Economic Accounts and the National Economic Accounts. These adjustments, which are applied separately to exports and imports, are necessary to supplement coverage of the Census-basis data, to eliminate duplication of transactions recorded elsewhere in the ITAs, to value transactions at market prices, and to include certain changes in ownership that occur without the goods crossing the U.S. customs boundary.
11.11. Exports of goods consist of general merchandise, net exports of goods under merchanting, and non-monetary gold. Imports of goods consist of general merchandise and nonmonetary gold. Each of these published components is described below.
To Contents

Part III. Statistical Methodology of International Transactions Accounts
Bureau of Economic AnalysisU.S. International Economic Accounts: Concepts and Methods
76
Table 11.b. Sources of Data for Current-Account Goods
Source Use Note
Airbus SE Aircraft importsAirbus SE publishes aircraft delivery information used to estimate aircraft imports that are not collected by U.S. Customs and Border Protection.
Airfinance Journal Aircraft imports
Airfinance Journal is a private source that provides delivery information to estimate aircraft imports that are not collected by U.S. Customs and Border Protection.
Bureau of Economic Analysis (BEA) quarterly, annual, and benchmark surveys on international trade in services
(1) Fuel exports and imports and (2) net exports of goods under merchanting
BEA’s surveys used include (1) surveys of transport services and (2) surveys of international transactions in selected services and intellectual property. See chapters 3 and 12 for more information on these surveys.
Federal Reserve Bank of New York
Nonmonetary gold exports and imports
IHS Markit
Fuel exports and imports, electric energy exports to and imports from Mexico, and imports of locomotives and railcars from Mexico and Canada
IHS Markit is a private source that provides data on ocean vessels, on trade in electric energy, and on imports of locomotives and railcars that are not collected by U.S. Customs and Border Protection.
Planespotters.net Aircraft importsPlanespotters.net publishes aircraft delivery information used to estimate aircraft imports that are not collected by U.S. Customs and Border Protection.
Statistics CanadaMail order exports to Canada and imports of locomotives and railcars from Canada
United Nations International Trade Statistics Database (UN Comtrade)
Electric energy exports to and imports from Mexico
U.S. Department of Commerce, U.S. Census Bureau, Automated Commercial Environment (ACE)
Goods exports for all countries except Canada and goods imports for all countries
As required by law, exporters and importers or their agents file customs declarations with U.S. Customs and Border Protection through ACE. The Census Bureau compiles these data and provides them to BEA through a Memorandum of Understanding. Data on goods exports and imports by water are also used to estimate fuel procured in ports by nonresident ocean carriers.
U.S. Department of Commerce, U.S. Census Bureau, U.S.-Canada Data Exchange
Exports to Canada
For statistics on exports to Canada, the United States substitutes Canadian statistics on imports from the United States in accordance with a 1987 Memorandum of Understanding signed by the Census Bureau, U.S. Customs and Border Protection, Canada Border Services Agency, and Statistics Canada. Similarly, under this Memorandum of Understanding, Canada substitutes U.S. imports from Canada for Canadian exports to the United States.
U.S. Department of Defense
Goods purchased abroad by U.S. military agencies
U.S. government operating agencies submit data quarterly under Office of Management and Budget Statistical Directive No. 19.
U.S. Department of Homeland Security, U.S. Customs and Border Protection (CBP)
Fuel exports and importsCBP provides data on ocean vessels that are used to estimate fuel procured in ports by nonresident ocean carriers.
U.S. Postal Service Exports of private parcels
To Contents
Part III. Statistical Methodology of International Transactions Accounts
Bureau of Economic AnalysisU.S. International Economic Accounts: Concepts and Methods
77
Published components
General merchandise
11.12. General merchandise covers goods exchanged between a resident and a nonresident and excludes goods under merchanting and nonmonetary gold. While transactions in goods that have not changed ownership should be excluded from the ITAs according to international guidelines, BEA is not currently able to identify these transactions to remove them from the source data it receives from the Census Bureau. (See paragraphs 11.3–11.7 for more information.)
11.13. General merchandise is presented as a single item in the BPM6 standard components with no pro-posed standards for classification of goods. However, BPM6 encourages presentations according to the priorities of the compiling economy. In the ITAs, exports and imports of general merchan-dise are classified and presented by six broad end-use categories in ITA table 1.2 and by detailed end-use commodities in ITA table 2.1. The end-use commodities are based on the Harmonized Commodity Description and Coding System (Harmonized System). (See paragraphs 11.23–11.25 for more information.)
Net exports of goods under merchanting
11.14. Merchanting is defined as the purchase of goods by a resident of the compiling economy from a nonresident combined with the subsequent resale of the same goods to another nonresident with-out the goods entering the compiling economy. Merchanting arrangements are often used for inter-national wholesale and retail trade operations, but they may also be used in commodity dealing and for managing global manufacturing processes. In principle, for goods shipped under merchanting arrangements, purchases and resales are recorded at the time economic ownership of the goods changes.
11.15. BEA currently measures merchanting as the margin between proceeds from the sale of the goods and the cost of acquiring the goods sold. Data on this margin are collected as “net merchanting receipts” on BEA’s surveys of international transactions in selected services and intellectual property and presented as net exports of goods under merchanting. The Census-basis data do not include goods under merchanting because these goods do not cross the U.S. customs boundary.
Nonmonetary gold
11.16. Nonmonetary gold covers all gold other than monetary gold. (Monetary gold is owned by monetary authorities and is held as a reserve asset.) Nonmonetary gold can be in the form of bullion, gold powder, noncommemorative gold coins, and gold in other unwrought or semi-manufactured forms. Nonmonetary gold is shown separately from other goods partly because of its special role in finan-cial markets and partly because most gold transactions have little to do with current production, consumption, or income.
To Contents

Part III. Statistical Methodology of International Transactions Accounts
Bureau of Economic AnalysisU.S. International Economic Accounts: Concepts and Methods
78
11.17. In the ITAs, nonmonetary gold reflects the sum of cross-border trade in nonmonetary gold that is recorded in the Census-basis data and transactions between foreign official agencies and private U.S. residents in foreign official reserves of gold that are held in the custody of the Federal Reserve Bank of New York (FRBNY). These latter transactions are not captured in the Census-basis data but are added to goods exports and imports through a balance of payments adjustment. Gold that is purchased by foreign official agencies, such as a foreign central bank, from private entities in the United States and is shipped to the FRBNY for storage is recorded as an export. Similarly, gold that is purchased by private entities in the United States from foreign official agencies out of stock held at the FRBNY is recorded as an import.
Goods, Census basis
11.18. Exports consist of shipments of domestic and foreign goods by U.S. residents to foreign residents, involving both commercial and noncommercial transactions. Domestic exports consist of com-modities grown, produced, or manufactured in the United States and commodities of foreign origin that have been changed in form or enhanced in value in the United States. Foreign exports consist of commodities of foreign origin that are substantially in the same condition when exported as when initially imported into the United States. Exports of foreign goods are often referred to as reexports.
11.19. Imports consist of shipments of foreign goods and goods of U.S. origin by foreign residents to U.S. residents, involving both commercial and noncommercial transactions. Goods of U.S. origin include U.S. goods returned and reimports. U.S. goods returned consist of commodities that are not accepted by the foreign purchaser because of problems such as damage, defects, and incorrect shipments. Reimports consist of commodities of U.S. origin that are substantially in the same con-dition when imported as when initially exported from the United States.
Valuation
11.20. Exports are valued on a free alongside ship (F.A.S) basis at the U.S. port of export. The value of exports at the U.S. port of export is based on the transaction price, including inland freight, insur-ance, and other charges incurred in placing the goods alongside the carrier at the U.S. port of export. The value, as defined, excludes the cost of loading the goods aboard the exporting carrier and excludes freight, insurance, and charges or transportation costs beyond the U.S. port of export. Freight, insurance, and charges beyond the U.S. port of export are assumed to be incurred by the foreign importer.
11.21. Imports are valued on a customs-value basis at the foreign port of export. The customs value is the value of imports as appraised by U.S. Customs and Border Protection (CBP) in accordance with the legal requirements of the Tariff Act of 1930, as amended. The value is generally defined as the price actually paid or payable for goods at the foreign port of export, excluding U.S. import duties,
To Contents

Part III. Statistical Methodology of International Transactions Accounts
Bureau of Economic AnalysisU.S. International Economic Accounts: Concepts and Methods
79
freight, insurance, and other charges incurred in bringing the goods to the United States. Freight, insurance, and charges beyond the foreign port of export are assumed to be incurred by the U.S. importer.
11.22. The valuations of exports on an F.A.S. basis and of imports on a customs value basis differ slightly from the free on board (F.O.B) valuation recommended in BPM6. On an F.O.B basis, the valuation would include the loading cost of placing the goods onto the shipping carrier. BEA’s statistics on goods exclude this loading cost because it is not captured in source data from the Census Bureau.
Classification
11.23. Exports and imports are organized under several different commodity classification systems, including the Harmonized System and the end-use system. BEA primarily uses the end-use clas-sification system, which was created by the Balance of Payments Division of the former Office of Business Economics (BEA’s predecessor) to make it easier to relate changes in goods trade to changes in production and in consumption.
11.24. The end-use classification system is based on the Harmonized System, which is an internationally accepted standard for the commodity classification of internationally traded goods developed under the auspices of the World Customs Organization. The Harmonized System organizes transactions by the physical nature of commodities and their stage of processing rather than their end-use. The current U.S. Harmonized System consists of approximately 9,000 export commodity categories and 19,000 import commodity categories.
11.25. The broad end-use categories used by BEA and the Census Bureau are foods, feeds, and beverages; industrial supplies and materials; capital goods except automotive; automotive vehicles, parts, and engines; consumer goods except food and automotive; and “other” goods. Currently, the end-use system includes about 200 subcategories of exports and 200 subcategories of imports, which are aggregated in ITA table 2.1 in some instances.
Balance of payments adjustments to Census-basis data
11.26. As described above, BEA makes “balance of payments” adjustments to the Census-basis data in order to align them with the coverage, valuation, definitions, and concepts used for the International Economic Accounts and the National Economic Accounts. These adjustments are discussed below and are also presented in ITA table 2.4, which presents the reconciliation between Census-basis data and balance of payments-basis data. For both exports and imports, the largest adjustments are additions for goods procured in ports by nonresident ocean and air carriers.
To Contents

Part III. Statistical Methodology of International Transactions Accounts
Bureau of Economic AnalysisU.S. International Economic Accounts: Concepts and Methods
80
Export adjustments
11.27. An addition is made for goods procured in U.S. ports by foreign ocean and air carriers. At this time, these purchases are limited to fuel, which are not included in the Census-basis data described above. Estimates are based on a supplemental report provided by the Census Bureau, on BEA’s sur-veys of international transactions in transport services, and on data from IHS Markit.
11.28. An addition is made for the net value of goods under merchanting. This value reflects the net value of goods that are purchased and subsequently sold abroad without the goods entering the United States. Because these goods do not cross the U.S. customs boundary, their value is not recorded in the Census-basis data. This adjustment is based on BEA’s surveys of international transactions in selected services and intellectual property.
11.29. An addition is made for personal parcels shipped via the U.S. Postal Service because Census-basis data do not cover these items. The adjustment is based on a survey of postal operations and estimates by BEA. The offsetting entry to this item is included as part of other private transfer payments in secondary income. An addition is also made for U.S. mail order shipments to Canada based on data provided by Statistics Canada.
11.30. An addition is made for nonmonetary gold not included in the Census-basis data. This involves gold that is purchased by foreign official agencies and is shipped to the FRBNY where it is held in custody for foreign official accounts. No export documents are filed for this gold transaction. This adjustment is based on the monthly average of daily fixings of London gold prices and on data pro-vided by the FRBNY.
11.31. An addition is made for electric energy supplied to Mexico. The adjustment is based on data from IHS Markit and the United Nations International Trade Statistics Database (UN Comtrade).
11.32. An addition is made to raise the value of recorded smart cards to their full market value from the value of the media—that is, the value of the blank or unrecorded smart cards. This adjustment is based on Census-basis data and is applied beginning with statistics for 2009.
11.33. A deduction is made for the value of nonwarranty repairs and alterations of foreign-owned equip-ment repaired or altered in the United States and subsequently exported. The value of these repairs is combined with data on equipment repairs from BEA’s surveys of international transactions in selected services and intellectual property and included in services exports in maintenance and repair services n .i .e . (not included elsewhere). This adjustment is based on Census-basis data.
11.34. A deduction is made for exports of exposed motion picture film for sale or rent which are already included in services exports in personal, cultural, and recreational services. This adjustment is based on Census-basis data.
To Contents

Part III. Statistical Methodology of International Transactions Accounts
Bureau of Economic AnalysisU.S. International Economic Accounts: Concepts and Methods
81
11.35. A deduction is made for U.S.-owned grain shipped for storage in Canada and an addition is made for subsequent delivery of U.S.-owned grain from Canadian warehouses to third countries. The net effect of these adjustments to total goods exports is zero. These adjustments are based on Census-basis data.
Import adjustments
11.36. An addition is made for goods procured in foreign ports by U.S. ocean and air carriers. At this time, these purchases are limited to fuel, which are not included in the Census-basis data. Estimates are based on a supplemental report provided by the Census Bureau, on BEA’s surveys of international transactions in transport services, and on data from IHS Markit.
11.37. An addition is made for the value of goods purchased abroad by U.S. military agencies, which is reported to BEA by the U.S. Department of Defense. The Census-basis data only include imports of goods by U.S. military agencies that enter the U.S. customs territory.
11.38. An addition is made for locomotives and railcars imported from Canada and Mexico, which are not reported on CBP import declarations. The adjustment is based on data from Statistics Canada and IHS Markit.
11.39. An addition is made for nonmonetary gold not included in Census-basis data. This involves gold that is sold by foreign official agencies to private purchasers out of stock held at the FRBNY. No import documents are filed for this gold. This adjustment is based on the average of daily fixings of London gold prices and data provided by the FRBNY.
11.40. An addition is made for the value of electric energy imported from Mexico. This adjustment is based on data from IHS Markit and UN Comtrade.
11.41. An addition is made to raise the value of selected noncustomized computer software to its full mar-ket value from the value of the medium (such as CDs, DVDs, and smart cards) on which it is placed, which is the value reported on U.S. CBP import declarations.
11.42. An addition is made for U.S. air carriers’ purchases of foreign-manufactured aircraft delivered outside the United States, which are not reported on CBP import declarations. The adjustment is based on delivery information from Airbus SE, Airfinance Journal, and Planespotters.net and on Census Bureau data on imports of aircraft.
11.43. An addition is made for inland freight charges to transport goods from their point of origin in Canada and in Mexico to the U.S. customs boundary. Imports of goods from all countries should be val-ued at the customs value—that is, the value at the foreign port of export including inland freight charges. For imports from Canada and Mexico, this should be the cost of the goods at the U.S. bor-der. However, the customs value for imports for certain Canadian and Mexican goods is at the point
To Contents
Part III. Statistical Methodology of International Transactions Accounts
Bureau of Economic AnalysisU.S. International Economic Accounts: Concepts and Methods
82
of origin in Canada or Mexico. BEA makes an addition for the inland freight charges of transport-ing these goods to the U.S. border to make the value comparable to the customs value reported for imports from other countries. The adjustment is based on Census-basis data.
11.44. A deduction is made for the value of nonwarranty repairs and alterations of U.S.-owned equipment repaired or altered abroad and subsequently imported into the United States. The value of these repairs is combined with data on equipment repairs from BEA’s surveys of international transac-tions in selected services and intellectual property and included in services imports in maintenance and repair services n .i .e . This adjustment is based on Census-basis data.
11.45. A deduction is made for imports of exposed movie film for sale or rent, which are already included in services imports in personal, cultural, and recreational services. This adjustment is based on Census-basis data.
11.46. A deduction is made for the value of repairs performed abroad on U.S. -owned vessels included in Census-basis data. These transactions are already included in services imports in transport. This adjustment is based on Census-basis data.
To Contents

Part III. Statistical Methodology of International Transactions Accounts
Bureau of Economic AnalysisU.S. International Economic Accounts: Concepts and Methods
83
Chapter 12. Current-Account Services
Concepts and coverage
12.1. Services transactions reflect productive activities that change the condition of the consumer or that facilitate the exchange of products and financial assets. Services transactions also include most knowledge-capturing products. (See paragraphs 9.3–9.5 for more on the distinction between goods and services and on knowledge-capturing products.) In the International Transactions Accounts (ITAs), certain service types include the value of goods because of the difficulty of clearly distinguishing between goods and services transactions or because information is not available for the goods transactions incidental to some types of services to be assigned to the relevant goods categories.
12.2. Services can be provided to international markets by one of four modes of supply identified in the World Trade Organization’s General Agreement on Trade in Services. Modes of supply are dis-cussed in chapter 34. Services covered in the ITAs mostly correspond to services provided by the modes of cross-border supply, consumption abroad, and the presence of natural persons, specifi-cally services suppliers. The supply of services via the mode of commercial presence, such as by the affiliates of multinational enterprises, is mostly excluded from the ITAs. See chapters 28, 31, and 34 for more information on the mode of commercial presence and on services supplied through affiliates.
12.3. Services are classified in the ITAs into twelve broad categories that correspond to standard components in the International Monetary Fund’s sixth edition of the Balance of Payments and International Investment Position Manual (BPM6) classification scheme. These broad categories are further classified into subcategories. The services categories and subcategories are presented in ITA table 3.1 and shown in table 12.a below. Detail by type of service and by partner country in the annual international services statistics exceeds that in the quarterly ITAs (see chapter 31); detail in the quarterly ITAs exceeds that in the monthly trade in goods and services statistics (see chapter 30).
To Contents

Part III. Statistical Methodology of International Transactions Accounts
Bureau of Economic AnalysisU.S. International Economic Accounts: Concepts and Methods
84
Table 12.a. Transactions Shown in International Transactions Accounts Table 3.1. U.S. International Trade in Services
Line Exports
1 Exports of services
2 Manufacturing services on physical inputs owned by others
3 Maintenance and repair services n.i.e.
4 Transport
5 Sea transport
6 Freight
7 Port
8 Air transport
9 Passenger
10 Freight
11 Port
12 Other modes of transport
13 Travel (for all purposes including education)
14 Business
15 Expenditures by border, seasonal, and other short-term workers
16 Other business travel
17 Personal
18 Health related
19 Education related
20 Other personal travel
21 Construction
22 Construction abroad
23 Foreign contractors’ expenditures in the United States
24 Insurance services
25 Direct insurance
26 Reinsurance
27 Auxiliary insurance services
28 Financial services
29 Explicitly charged and other financial services
30 Brokerage and market-making services
31 Underwriting and private placement services
32 Credit card and other credit-related services
33 Financial management services
34 Financial advisory and custody services
35 Securities lending, electronic funds transfer, and other services
36 Financial intermediation services indirectly measured
Line Imports
55 Imports of services
56 Manufacturing services on physical inputs owned by others
57 Maintenance and repair services n.i.e.
58 Transport
59 Sea transport
60 Freight
61 Port
62 Air transport
63 Passenger
64 Freight
65 Port
66 Other modes of transport
67 Travel (for all purposes including education)
68 Business
69 Expenditures by border, seasonal, and other short-term workers
70 Other business travel
71 Personal
72 Health related
73 Education related
74 Other personal travel
75 Construction
76 Construction in the United States
77 United States contractors’ expenditures abroad
78 Insurance services
79 Direct insurance
80 Reinsurance
81 Auxiliary insurance services
82 Financial services
83 Explicitly charged and other financial services
84 Brokerage and market-making services
85 Underwriting and private placement services
86 Credit card and other credit-related services
87 Financial management services
88 Financial advisory and custody services
89 Securities lending, electronic funds transfer, and other services
90 Financial intermediation services indirectly measured
Table continues
To Contents

Part III. Statistical Methodology of International Transactions Accounts
Bureau of Economic AnalysisU.S. International Economic Accounts: Concepts and Methods
85
Line Exports
37 Charges for the use of intellectual property n.i.e.
38 Franchises and trademarks licensing fees
39 Licenses for the use of outcomes of research and development
40 Licenses to reproduce and/or distribute computer software
41 Licenses to reproduce and/or distribute audiovisual products
42 Telecommunications, computer, and information services
43 Telecommunications services
44 Computer services
45 Information services
46 Other business services
47 Research and development services
48 Professional and management consulting services
49 Technical, trade-related, and other business services
50 Personal, cultural, and recreational services
51 Audiovisual services
52 Artistic-related services
53 Other personal, cultural, and recreational services
54 Government goods and services n.i.e.
Line Imports
91 Charges for the use of intellectual property n.i.e.
92 Franchises and trademarks licensing fees
93 Licenses for the use of outcomes of research and development
94 Licenses to reproduce and/or distribute computer software
95 Licenses to reproduce and/or distribute audiovisual products
96 Telecommunications, computer, and information services
97 Telecommunications services
98 Computer services
99 Information services
100 Other business services
101 Research and development services
102 Professional and management consulting services
103 Technical, trade-related, and other business services
104 Personal, cultural, and recreational services
105 Audiovisual services
106 Artistic-related services
107 Other personal, cultural, and recreational services
108 Government goods and services n.i.e.
Line Balances
109 Balance on services
Line Supplemental detail on insurance transactions
110 Premiums received
111 Losses paid
112 Premiums paid
113 Losses recovered
n.i.e. Not included elsewhere
12.4. In some cases, the Bureau of Economic Analysis (BEA) provides detail beyond the BPM6 standard components that correspond with the Extended Balance of Payments (EBOPS) classification sys-tem published in the Manual on Statistics of International Trade in Services 2010 (MSITS 2010). Both the BPM6 and EBOPS classification systems are mainly product-based—that is, they are based on the type of service rather than on the industry or entity that provides or purchases the service. However, classifications are transactor-based for travel, for construction, and for government goods and services n .i .e . (not included elsewhere).
To Contents
Part III. Statistical Methodology of International Transactions Accounts
Bureau of Economic AnalysisU.S. International Economic Accounts: Concepts and Methods
86
Departures from BPM6
12.5. The coverage and presentation of services differ in some ways from BPM6 recommendations. One major gap stems from not yet providing estimates of manufacturing services on physical inputs owned by others, a specific form of contract manufacturing. At present, BEA’s statistics show “n.a.” (not available) for this major services component. In addition, BEA’s goods statistics impute a change in ownership to physical inputs and processed goods related to such manufacturing ser-vices when they enter or leave the United States but do not recognize a change in ownership when such items are sold to or purchased from foreigners without physically crossing the U.S. border. Under BPM6 recommendations, processing by a manufacturer that does not own the physical inputs or the resulting goods outputs should be recorded as manufacturing services on physical inputs owned by others. Trade in the physical inputs and finished goods associated with these manufacturing services should be recorded in accordance with actual changes in ownership, which is different from what is reflected in shipments of goods entering or leaving the United States. (See paragraphs 11.3–11.7 for more information on the discrepancy between BEA’s treatment of goods associated with manufacturing services and the BPM6 recommendations.)
12.6. Currently, detailed information on the processing fees received and paid by U.S. firms for manufac-turing services and on the underlying goods transactions either is not available in the U.S. statistical system or is not identifiable in any of the source data. Nevertheless, transactions associated with manufacturing services are partly included in the U.S. International Economic Accounts because (1) a portion of these services is included in the value of goods exports and imports and (2) some manufacturing services are collected on BEA’s surveys of transactions in selected services and intellectual property and are included in statistics on technical, trade-related, and other business services. However, the manufacturing services portion included in the value of goods exports and imports cannot be separately identified. Despite these challenges, BEA continues to conduct research to determine feasible approaches for implementing this treatment.
12.7. In addition, BEA’s insurance services category differs from the BPM6 standard component insur-ance and pension services because of a lack of source data for pension services.
To Contents

Part III. Statistical Methodology of International Transactions Accounts
Bureau of Economic AnalysisU.S. International Economic Accounts: Concepts and Methods
87
Data sources
12.8. BEA uses a variety of data sources to estimate services exports and imports; these sources are listed in table 12.b. The remainder of the section provides additional detail on one of the sources—BEA survey data.
Table 12.b. Sources of Data for Current-Account Services
Source Use Note
Bureau of Economic Analysis (BEA) quarterly, annual, and benchmark surveys on international trade in services
Transport; construction; insurance services; financial services; charges for the use of intellectual property n.i.e.; telecommunications, computer, and information services; other business services; and personal, cultural, and recreational services
See paragraphs 12.9–12.23 for details on these surveys. See chapter 3 for general information on BEA surveys.
Airlines Reporting Corporation (ARC) Air passenger transport
ARC, a company that offers ticket transaction settlement services between airlines and those that sell their products in the United States (including both traditional and online travel agencies), prepares ticket-level data on the travel patterns and fares of air passengers on foreign carriers.
AM Best Company—Best Aggregates and Averages: Property/Casualty
Insurance services
Bank of Mexico and National Institute of Statistics and Geography
Travel (trade with Mexico)
Educational Commission for Foreign Medical Graduates (ECFMG)
Education-related travelECFMG prepares data on the number of U.S. certification exams that it administers to international medical graduates.
Federal Financial Institutions Examination Council
Financial services
IHS Markit Sea freight and sea port transport
IHS Markit is a private source that prepares data on ocean vessels, including the operating company, the operating company’s country of registration, and the flag of the vessel.
Institute of International Education, Open Doors report
Education-related travel The Open Doors report features data on study-abroad programs of U.S. educational institutions.
Partner country data Financial services
Statistics Canada
Computer and information services (imports from Canada), travel (trade with Canada), air passenger transport and rail transport (trade with Canada)
Surface Transportation Board
Rail freight transport and rail port transport
Table continues
To Contents

Part III. Statistical Methodology of International Transactions Accounts
Bureau of Economic AnalysisU.S. International Economic Accounts: Concepts and Methods
88
Source Use Note
United Nations Education, Scientific, and Cultural Organization (UNESCO), UNESCO Institute for Statistics (UIS)
Education-related travel UIS prepares data on the number of internationally mobile students.
U.S. Department of Commerce, International Trade Administration, National Travel and Tourism Office (NTTO), Survey of International Air Travelers (SIAT)
Other personal travel, other business travel, and health-related travel
NTTO conducts the SIAT either in the gate area at U.S. international airports or aboard a sample of scheduled flights departing the United States. Data are collected on actual expenditures in the United States by foreign residents as they depart the United States and on anticipated expenditures abroad by departing U.S. residents.
U.S. Department of Commerce, U.S. Census Bureau, Air freight data
Air freight transportThe Census Bureau compiles data from U.S. Customs and Border Protection on air freight shipments and adds supplemental information about the air carrier.
U.S. Department of Commerce, U.S. Census Bureau, U.S.-Canada Data Exchange
Maintenance and repair services n.i.e. and freight transport
For statistics on goods exports to Canada, the United States substitutes Canadian statistics on goods imports from the United States in accordance with a 1987 Memorandum of Understanding signed by the Census Bureau, U.S. Customs and Border Protection, Canada Border Services Agency, and Statistics Canada. Similarly, under this Memorandum of Understanding, Canada substitutes U.S. goods imports from Canada for Canadian goods exports to the United States.
U.S. Department of Defense (DOD)
Government goods and services n.i.e.
DOD provides data on the Foreign Military Sales program. Military departments each provide data on compensation paid to U.S. personnel stationed abroad, purchases of goods and services supplied to military enclaves, payments to international organizations, and purchases of other goods and services not separately identified. The Defense Commissary Agency and the Military Postal Service Agency each provide data on sales in U.S. enclaves.
U.S. Department of Homeland Security, U.S. Customs and Border Protection (CBP)
Other business travel, other personal travel, health-related travel, air passenger transport, sea freight transport, and sea port transport
CBP collects counts of U.S. citizens and non-U.S. citizens traveling between the United States and other countries on its Advance Passenger Information System (APIS) and counts of foreign residents visiting the United States on the Arrival-Departure Record Card (Form I–94). In addition to passenger citizenship, the APIS data also include information on the nationality of the carrier and the last (first) foreign port visited for flights entering (leaving) the United States. In addition to passenger residency, the I-94 data also include the passengers’ class of admission granting them entry into the United States, which in some cases may indicate the purpose of the trip. The APIS and I-94 data are provided to BEA through NTTO. U.S. exports and imports of goods by water are collected by CBP and provided to BEA through the Census Bureau. Additional data on ocean vessels are provided by CBP directly.
U.S. Department of Homeland Security, U.S. Immigration and Customs Enforcement, Student and Exchange Visitor Information System (SEVIS)
Education-related travelSEVIS is a web-based system for maintaining information on nonimmigrant students and exchange visitors in the United States.
Table continues
To Contents

Part III. Statistical Methodology of International Transactions Accounts
Bureau of Economic AnalysisU.S. International Economic Accounts: Concepts and Methods
89
Source Use Note
U.S. Department of Labor, U.S. Bureau of Labor Statistics, Consumer Expenditure Surveys
Expenditures by border, seasonal, and other short-term workers (travel)
The Consumer Expenditure Surveys are conducted monthly to collect data on household expenditures.
U.S. Department of State (State Department)
Government goods and services n.i.e
The State Department provides data on compensation paid to U.S. citizens and foreign nationals working in U.S. enclaves.
U.S. Department of Transportation, Bureau of Transportation Statistics (BTS)
Air passenger transport, air freight transport, air port transport, and truck freight transport
BTS data include (1) ticket-level data from its Origin and Destination Survey on the travel patterns—for example, information on airports, flight connections, and carriers—and fares of air passengers on U.S. carriers; (2) data from its Report of Financial and Operating Statistics for Large Certificated Air Carriers on nonticket expenditures—for example, baggage fees; (3) air freight and air passenger data; and (4) data on the value and freight charges of goods crossing the U.S.-Canadian border by truck.
U.S. Department of Transportation, Federal Aviation Administration
Space transport
U.S. Department of the Treasury (Treasury Department), Treasury International Capital (TIC) system
Financial services
The Treasury Department collects cross-border financial transactions and positions on selected TIC forms. See chapter 3 for general information on the TIC system.
U.S. government agencies Government goods and services n.i.e.
U.S. government operating agencies submit data quarterly under Office of Management and Budget Statistical Directive No. 19.
U.S. Office of Management and Budget (OMB)
Government goods and services n.i.e.
OMB publishes appropriations data that are used to estimate the delivery of services provided through military grant programs.
U.S. Postal Service Postal services (transport)
BEA survey data
12.9. Statistics for several services categories are based largely on data collected on BEA’s quarterly, annual, and benchmark services surveys.18 These categories include transport; construction; insur-ance services; financial services; charges for the use of intellectual property n .i .e .; telecommunications, computer, and information services; other business services; and personal, cultural, and recreational services. General information on BEA surveys is provided in chapter 3. The surveys used for the services statistics are described in more detail below.
Surveys of transport services
12.10. Quarterly Survey of Foreign Airline Operators’ Revenues and Expenses in the United States (BE–9). This survey covers revenues of foreign air carriers for transporting freight to and from the United States, the weight of merchandise transported, expenses incurred in the United States, aircraft leasing expenses, the number of passengers transported to and from the United States, and
18. Benchmark surveys are generally conducted once every 5 years and cover services transactions that occur throughout a specified year. Compared to a corresponding quarterly survey, a benchmark survey covers the full transactions universe and may request additional detail on aspects of selected transactions.
To Contents

Part III. Statistical Methodology of International Transactions Accounts
Bureau of Economic AnalysisU.S. International Economic Accounts: Concepts and Methods
90
revenues for transporting passengers to and from the United States. U.S. offices, agents, or other representatives of foreign airline operators that transport passengers or freight and express freight to or from the United States must report all relevant transactions.
12.11. Annual Survey of Foreign Ocean Carriers’ Expenses in the United States (BE–29). This survey covers the expenses incurred by foreign ocean carriers in U.S. ports, both those that own and oper-ate vessels and those that operate chartered U.S.-flag and foreign-flag vessels. U.S. agents of foreign ocean carriers must report all relevant transactions on port services provided or obtained by them for foreign carriers and on port services provided by third persons.
12.12. Quarterly Survey of Ocean Freight Revenues and Foreign Expenses of U.S. Carriers (BE–30). This survey covers revenues and expenses of U.S. ocean carriers—both U.S. flagged and foreign flagged—from the transportation of U.S. exports and imports and associated weights, revenues from the transportation of cargo between foreign ports, expenses incurred by U.S. ocean carriers in for-eign countries, and charter hires with crew and space-leasing transactions with foreign residents.
12.13. Quarterly Survey of U.S. Airline Operators’ Foreign Revenues and Expenses (BE–37). This survey covers U.S. air carriers’ revenues for transporting U.S. exports to foreign points and for transporting freight between foreign points, expenses incurred by U.S. airline operators in foreign countries, aircraft leasing expenses, revenues for transporting passengers between foreign points, revenues for transporting passengers to and from the United States, the number of passengers transported to and from the United States, and interline settlements.
12.14. Data from the BE–9, BE–29, BE–30, and BE–37 surveys are used to prepare statistics for transport services.
Surveys of financial services
12.15. Benchmark Survey of Financial Services Transactions Between U.S. Financial Services Providers and Foreign Persons (BE–180). This survey covers the universe of U.S. international transactions in explicitly charged financial services between U.S. financial services providers and foreign persons. It collects annual data from U.S. financial services providers on payments to, and receipts from, affiliated and unaffiliated foreign persons for several detailed types of financial services.
12.16. Quarterly Survey of Financial Services Transactions Between U.S. Financial Services Providers and Foreign Persons (BE–185). This survey covers U.S. international transactions in explicitly charged financial services between U.S. financial services providers and foreign persons. It collects data on payments to, and receipts from, affiliated and unaffiliated foreign persons for several detailed types of financial services.
12.17. Data from the BE–180 and BE–185 surveys are used to prepare statistics for trade in financial services. The BE–180 benchmark survey collects all of the data items collected on the BE–185
To Contents

Part III. Statistical Methodology of International Transactions Accounts
Bureau of Economic AnalysisU.S. International Economic Accounts: Concepts and Methods
91
quarterly survey, and it typically collects information on additional aspects of financial services transactions not covered on the quarterly survey. Moreover, it collects data from U.S. financial ser-vices providers that do not provide data on the quarterly survey because their annual international financial services transactions fall below specified dollar thresholds.
Surveys of insurance services
12.18. Benchmark Survey of Insurance Transactions by U.S. Insurance Companies With Foreign Persons (BE–140). This survey covers the universe of U.S. international transactions in insurance between U.S. insurance companies and foreign persons. It collects annual data on premiums and losses related to reinsurance and primary insurance along with receipts and payments for auxiliary insurance services.
12.19. Quarterly Survey of Insurance Transactions by U.S. Insurance Companies With Foreign Persons (BE–45). This survey covers U.S. international transactions in insurance between U.S. insurance companies and foreign persons. It collects data on premiums and losses related to rein-surance and primary insurance along with receipts and payments for auxiliary insurance services.
12.20. Data from the BE–140 and BE–45 surveys are used to prepare statistics for trade in insurance ser-vices. The BE–140 benchmark survey collects all of data items collected on the BE–45 quarterly survey, and it typically collects information on additional aspects of insurance transactions not covered on the quarterly survey. Moreover, it collects data from U.S. insurance companies that do not provide data on the quarterly survey because their annual international insurance transactions fall below a specified dollar threshold.
Surveys of charges for the use of intellectual property and other selected services
12.21. Benchmark Survey of Transactions in Selected Services and Intellectual Property With Foreign Persons (BE–120). This survey covers the universe of U.S. international transactions in all types of services and intellectual property for which information is not collected on the BEA services surveys discussed previously and is not available to BEA from other sources. The survey collects annual data from by U.S. persons who had transactions—receipts and/or payments—with affiliated and unaffiliated foreign persons during the reporting period for a wide variety of busi-ness, professional, and technical services. This survey is also filed by U.S. persons that have entered into agreements with affiliated or unaffiliated foreign persons to distribute, buy, sell, or use various types of intellectual property or proprietary rights.
12.22. Quarterly Survey of Transactions in Selected Services and Intellectual Property With Foreign Persons (BE–125). This survey covers U.S. international transactions in the same types of services and intellectual property and proprietary rights as covered on the BE–120 benchmark survey. It is filed by U.S. persons who had transactions—receipts and/or payments—with affiliated and unaffil-iated foreign persons during the reporting period in the relevant types of services and intellectual property.
To Contents
Part III. Statistical Methodology of International Transactions Accounts
Bureau of Economic AnalysisU.S. International Economic Accounts: Concepts and Methods
92
12.23. Data from the BE–120 and BE–125 surveys are used to prepare statistics on trade in maintenance and repair services; construction; intellectual property; telecommunications, computer, and infor-mation services; other business services; and personal, cultural, and recreational services. These surveys also collect data on payments to foreign residents for insurance and explicitly charged financial services by U.S. persons that are not primarily insurance or financial services providers to ensure complete coverage of these services in BEA’s services statistics. The BE–120 benchmark sur-vey collects all of the data items collected on the BE–125 quarterly survey, and it typically collects information on additional aspects of transactions in selected services and intellectual property not covered on the quarterly survey. Moreover, it collects data from U.S. companies that do not provide data on the quarterly survey because their annual covered transactions fall below specified dollar thresholds.
Estimation methods
12.24. Estimation methods vary depending on the services component and the estimation period. As described above, for many of the services components, statistics are based on BEA survey data with adjustments for coverage and concepts. Certain components of travel statistics are prepared as the product of the number of travelers and a measure of average expenditure per traveler. Other com-ponents are based on government administrative data and other sources.
12.25. Definitions and estimation methods for each of the twelve broad services categories published quarterly by BEA are provided below. These categories closely follow but do not always exactly match the BPM6 standard components for services. Specific departures from BPM6 are also described below. Services categories are presented in the same order as in ITA table 3.1. Unless otherwise noted, descriptions of methods apply to both exports and imports.
Manufacturing services on physical inputs owned by others
12.26. Manufacturing services on physical inputs owned by others cover processing, assembly, labeling, packaging, and related services performed by entities that do not own the inputs or outputs of the manufacturing process. The owner of the goods pays the manufacturer a service fee for the pro-cessing services. Manufacturing services are recorded regardless of whether the inputs are shipped to the manufacturer by the owner of the inputs or the inputs are purchased by the owner from another company, including companies residing in different countries than the owner. Similarly, these services are recorded regardless of whether the outputs are shipped to the owner or shipped directly to a buyer.
12.27. Source data for manufacturing services on physical inputs owned by others are collected on BEA surveys, including the Quarterly Survey of Transactions in Selected Services and Intellectual Property With Foreign Persons (BE–125) and the Benchmark Survey of Transactions in Selected Services and Intellectual Property With Foreign Persons (BE–120). The data collected cover the fee received by the manufacturer; neither the value of the physical inputs nor the value of the physical
To Contents
Part III. Statistical Methodology of International Transactions Accounts
Bureau of Economic AnalysisU.S. International Economic Accounts: Concepts and Methods
93
outputs is included. At present, BEA has assessed that the data collected only comprise a partial measure of manufacturing services on physical inputs owned by others. Rather than directly pub-lish this partial measure, cell values for this category in published tables are marked as “n.a.” (not available). However, BEA indistinguishably includes the partial measure under technical, trade-re-lated, and other business services in the other business services major category. BEA continues to evaluate the comprehensiveness of these survey-collected source data. It is also examining the use of indirect methods to estimate manufacturing services and to remove from its trade in goods statistics estimates of physical inputs and processed goods that cross borders without a change in ownership.
Maintenance and repair services n.i.e.
12.28. Maintenance and repair services n.i.e (not included elsewhere) cover maintenance and repair ser-vices by residents of one country on goods that are owned by residents of another country. The repairs may be performed at the site of the repair facility or elsewhere. Maintenance and repair of ships, aircraft, and other transport equipment are currently included in transport because these transactions cannot be separately identified in BEA’s source data for transport services. Construction maintenance and repairs, including renovation, repair, or extension of fixed assets in the form of buildings, and repairs of railway facilities, harbors, and airfield facilities are included in construction. Computer maintenance and repairs are included in the computer services component of telecommunications, computer, and information services.
12.29. Statistics for maintenance and repair services are based primarily on BEA survey data and are sup-plemented by data from the U.S. Census Bureau on the cross-border movement of equipment and other goods for repair and by information from the U.S. Department of Defense (DOD) on repairs related to the Foreign Military Sales program. The BEA surveys include the Quarterly Survey of Transactions in Selected Services and Intellectual Property with Foreign Persons (BE–125) and the Benchmark Survey of Transactions in Selected Services and Intellectual Property With Foreign Persons (BE–120). The value recorded for maintenance and repair services is the value of the work performed, not the gross value of the goods before or after repair. Service values include parts or materials supplied by the service provider.
Transport
12.30. Transport consists of transactions associated with moving people and property from one location to another and includes related supporting and auxiliary services. Transport is classified by mode of transport (sea, air, or other mode) and by what is transported (passengers or freight). Under sea transport and air transport, BEA presents port services, which include cargo handling, storage and warehousing, and other related transport services. BEA does not separately present the BPM6 stan-dard component of postal and courier services.19
19. In its annual international services statistics, BEA separately presents statistics on postal services under other related transport services.
To Contents
Part III. Statistical Methodology of International Transactions Accounts
Bureau of Economic AnalysisU.S. International Economic Accounts: Concepts and Methods
94
12.31. The primary sources of information are (1) four mandatory BEA surveys of U.S. and foreign air and ocean carriers; (2) Census Bureau data on U.S. exports and imports of goods by air; (3) U.S. Customs and Border Protection (CBP) data on ocean vessels, U.S. exports and imports of goods by water, and international air passengers; (4) ticket-level information on international air transport from the Bureau of Transportation Statistics (BTS); (5) ticket-level information on international air transport from the Airlines Reporting Corporation (ARC); and (6) IHS Markit data on ocean vessels. Three of the BEA surveys are quarterly (U.S. ocean and air carriers and foreign air carriers) and one is annual (foreign ocean carriers). The Census Bureau data and the CBP data are monthly. The BTS, ARC, and IHS Markit data are quarterly.
12.32. Various methods are used to estimate the transactions covered by the components of transport. For some components, the transactions are available from a primary data source, such as a BEA survey. For most components, however, transactions are estimated using multistep methods that include, for example, multiplying the weight of goods transported, which is based on information from the Census Bureau or CBP, by estimates of freight rates derived from BEA surveys.
12.33. Freight services are recorded in the U.S. International Economic Accounts when shipping services are performed by the residents of one country for residents of other countries. A key convention in estimating freight services is the assumption that shipping services performed on a country’s goods exports beyond its borders are paid for by the importing country. Thus, freight charges for trans-porting U.S. exports of goods are included in the U.S. International Economic Accounts as trans-port exports if the carriers are U.S. residents; if the carriers are foreign residents, the charges are excluded because the transactions are deemed to be between foreign residents. Similarly, freight charges for transporting U.S. imports of goods are included in the U.S. International Economic Accounts as transport imports if the carriers are foreign residents; if the carriers are U.S. residents, the charges are excluded because the transactions are deemed to be between U.S. residents.
Sea transport
12.34. Sea transport consists of freight services and port services. Freight services exports include receipts of U.S. vessel operators for transporting U.S. goods exports to foreign ports and transporting goods between foreign ports; freight services imports include U.S. payments to foreign vessel operators for transporting U.S. goods imports from foreign ports to U.S. ports. Freight services also include short-term operating leases of transportation equipment and crew, such as for a single voyage. Port services exports include the value of nonfuel goods and services procured by foreign carriers in U.S. ports; imports include the value of nonfuel goods and services procured by U.S. carriers in foreign ports. Purchases of fuel in ports are excluded from transport and included in exports and imports of goods.
12.35. Sea freight. Sea freight services statistics are primarily based on CBP data on ocean vessels and waterborne exports and imports, on IHS Markit data on ocean vessels, and on BEA’s Quarterly Survey of Ocean Freight Revenues and Foreign Expenses of U.S. Carriers (BE–30). CBP waterborne
To Contents

Part III. Statistical Methodology of International Transactions Accounts
Bureau of Economic AnalysisU.S. International Economic Accounts: Concepts and Methods
95
data include tonnage and the value of goods transported, including freight and insurance charges on imports. IHS Markit data include information on type of vessel and on residency of the vessel operator. BEA merges these two datasets to identify the type and residency of vessels carrying goods exports and imports. IHS Markit and CBP data cover both U.S.-flag and foreign-flag vessels providing liner, tanker, and tramp services to and from the United States, including transport on the Great Lakes. The BE–30 survey covers U.S. ocean carriers’ revenues and tonnage for transport-ing U.S. exports to foreign points and revenues for transporting freight between foreign points.
12.36. Sea freight exports are estimated by multiplying the merged CBP and IHS Markit data on export tonnages carried by U.S.-operated vessels for each type of service (liner, tanker, and tramp) by the corresponding per-ton freight rates. Freight rates for liner services are derived from data reported on the BE–30 survey. Freight rates for tanker and tramp services are based on global rate indexes covering the tanker and dry bulk shipping market provided by the Baltic Exchange. Sea freight exports also include receipts of U.S.-operated vessels from foreign residents for carrying goods between foreign ports and for operating leases of transportation equipment with crew for limited periods of time (such as a single voyage) for the carriage of freight and passengers. These receipts are reported on the BE–30 survey.
12.37. Sea freight imports are estimated by summing the merged CBP and IHS Markit data on import freight charges, which include insurance, received by foreign-operated vessels. An estimate of insurance payments is removed from these data because such payments are covered by BEA’s source data for insurance services. Sea freight imports also include payments of U.S.-operated vessels to foreign residents for operating leases of transportation equipment with crew for limited periods of time (such as a single voyage) for the carriage of freight and passengers. These payments are reported on the BE–30 survey.
12.38. Sea port. Sea port services statistics are based on BEA’s Annual Survey of Foreign Ocean Carriers’ Expenses in the United States (BE–29), the BE–30 survey, CBP data on ocean vessels and U.S. waterborne exports and imports, and IHS Markit data on ocean vessels. The BE–29 survey covers the expenses incurred by foreign ocean carriers in U.S. ports. These carriers include foreign affil-iates of U.S. companies that operate vessels for their own accounts. The BE–30 survey covers the expenses incurred by U.S. ocean carriers in foreign ports. BEA merges the CBP and IHS Markit data to provide U.S. export and import tonnage by residency of the vessel operator and by type of service (liner, tanker, and tramp) transported to and from the United States, including transport on the Great Lakes.
12.39. Sea port exports are estimated by multiplying the merged CBP and IHS Markit data on export and import tonnages carried by foreign-operated vessels for each type of service by the correspond-ing per-ton port expense rates derived from the BE–29 survey. Sea port imports are estimated by multiplying the merged CBP and IHS Markit data on export and import tonnages carried by U.S.-operated vessels for each type of service by the corresponding per-ton port expense rates derived from the BE–30 survey.
To Contents

Part III. Statistical Methodology of International Transactions Accounts
Bureau of Economic AnalysisU.S. International Economic Accounts: Concepts and Methods
96
Air transport
12.40. Air transport consists of passenger services, freight services, and port services. Air passenger ser-vices cover the transport of nonresidents by U.S. air carriers between the United States and foreign countries and between two foreign points (exports), and the transport of U.S. residents by foreign air carriers between the United States and foreign countries and between two foreign points (imports). Air freight services exports cover the transport by U.S. air carriers of U.S. goods exports from the United States to foreign points and the transport of goods between two foreign points. Imports cover the transport by foreign air carriers of U.S. goods imports from foreign countries to U.S. points. Port services include the value of nonfuel goods and services procured by foreign air carriers in U.S. ports (exports) and by U.S. air carriers in foreign ports (imports). Purchases of fuel in ports, however, are excluded from transport and included in goods exports and imports.
12.41. Air passenger. Air passenger services statistics are compiled separately for Canada and for all other countries. For countries other than Canada, BEA multiplies counts of foreign passengers transported by U.S. carriers and U.S. passengers transported by foreign carriers by estimates of average air fares. Counts of passengers are from the Advance Passenger Information System (APIS), collected by CBP. Average fares for exports are based on the BTS’s Origin and Destination Survey. Average fares for imports are based on data from ARC. The BTS and ARC provide tick-et-level samples of flights operated, respectively, by U.S. and foreign air carriers. Along with calcu-lating average fares, BEA uses these data to link foreign travelers flying on U.S. carriers to individ-ual countries of residence and to link U.S. travelers with the nationality of the carriers operating their flights. For travel to and from Canada, BEA uses data provided by Statistics Canada.
12.42. Air passenger services also include ancillary fees, or nonticket expenditures by passengers, such as baggage fees and reservation fees. Estimates for these transactions are based on data from BTS.
12.43. Air freight. Air freight statistics are based primarily on BEA’s Quarterly Survey of U.S. Airline Operators’ Foreign Revenues and Expenses (BE–37) and the Census Bureau’s monthly data on exports and imports of goods by air. The BE–37 survey covers U.S. air carriers’ revenues for trans-porting U.S. exports to foreign points and for transporting freight between foreign points. The Census Bureau air freight data provide export tonnage and import freight and insurance charges by residence of operator.
12.44. Air freight exports are estimated based on the revenue data reported on the BE–37 survey. BEA uses ratios derived from freight export weight by country of destination reported by U.S. airlines on BTS Airline Passenger and Freight Traffic Form (T–100) to distribute total U.S. air carriers’ rev-enues to each of the ITA geographic areas. Air freight imports are estimated by summing Census Bureau data on import freight and insurance charges received by foreign air carriers. Insurance payments are estimated as a share of these charges and then removed because these transactions are covered by BEA’s source data for insurance services.
To Contents

Part III. Statistical Methodology of International Transactions Accounts
Bureau of Economic AnalysisU.S. International Economic Accounts: Concepts and Methods
97
12.45. Air port. Air port services statistics are based on BEA’s Quarterly Survey of Foreign Airline Operators’ Revenues and Expenses in the United States (BE–9) and the quarterly BE–37 survey. Air port exports are estimated based on reported data from the BE–9 survey, which covers the expenses incurred by foreign air carriers in the United States. Air port imports are estimated based on reported data from the BE–37 survey, which covers the expenses of U.S. air carriers in foreign countries.
Other modes of transport
12.46. Other modes of transport include postal services, port services for rail, and freight services per-formed by truck, rail, and pipeline, and in space. Statistics for each of these modes are derived using a variety of sources and methods.
12.47. Truck freight services exports consist of revenues of U.S. truck carriers for transporting U.S. exports from the U.S.-Canadian border to points in Canada and for transporting U.S. imports from points in Canada to the U.S.-Canadian border. Imports consist of revenues of Canadian truck carri-ers for transporting U.S. exports from points inside the United States to the U.S.-Canadian border and for transporting U.S. imports from the U.S.-Canadian border to points inside the United States. Small adjustments are made to account for U.S. and Canadian carriers’ receipts for cabotage and landbridge-type activities. Sources consist primarily of data from the BTS and private sources.
12.48. Rail freight services exports represent revenues of U.S. rail carriers for transporting (1) U.S. exports from the U.S. customs frontier to interior destinations or to other rail connections in Canada, (2) goods within Canada transported on the U.S. rail carriers’ leased trackage in Canada, and (3) for-eign-owned goods through the United States en route to another foreign country. Imports repre-sent revenues of Canadian rail carriers for transporting U.S. imports from third countries through Canada and U.S. goods through Canada en route from one U.S. point to another. Rail port services represent the expenditures by Canadian rail carriers in the United States (exports) and by U.S. rail carriers in Canada (imports). Sources include the Surface Transportation Board and Statistics Canada.
12.49. Space transport exports represent revenues of U.S. launch service providers for launching for-eign-owned satellites into space. Imports represent revenues of foreign launch service providers for launching U.S.-owned satellites into space. Sources include the Federal Aviation Administration and industry reports.
12.50. Pipeline freight exports represent revenues of U.S.-incorporated affiliates of Canadian pipeline companies for transporting oil and gas, unloaded from tankers in Portland, Maine, to destinations in Canada. Transportation of oil en route from one Canadian point to another through pipelines across the United States is also included. Data come from the U.S. affiliates of Canadian companies that provide such services.
To Contents

Part III. Statistical Methodology of International Transactions Accounts
Bureau of Economic AnalysisU.S. International Economic Accounts: Concepts and Methods
98
12.51. Postal service exports represent revenues of the U.S. Postal Service (USPS) for the transportation of foreign mail. Imports represent the payments of the USPS to foreign residents for the transporta-tion of U.S. mail. The source for data on these transactions is the USPS.
Travel (for all purposes including education)
12.52. Travel consists of transactions involving goods and services acquired by nonresidents while visit-ing another country. A traveler is defined as a person who stays, or intends to stay, for less than one year in a country of which the traveler is not a resident or a nonresident whose purpose is to obtain education or medical treatment, no matter how long the stay. Travel is a transactor-based component that covers a variety of goods and services, primarily lodging, meals, transportation in the country of travel, entertainment, and gifts. Travel excludes goods for resale, which are included in goods under general merchandise. Air passenger service for travel between the United States and other countries and between foreign countries is included in transport.
12.53. Travel is further classified between business travel and personal travel. Business travel covers goods and services acquired by persons whose primary purpose for travel is for business. It includes goods and services for which business travelers are reimbursed by their employers. BEA breaks down business travel into (1) expenditures by border, seasonal, and other short-term workers and (2) other business travel. Personal travel covers travel for all nonbusiness purposes. BEA breaks down personal travel into (1) health-related, (2) education-related, and (3) other personal travel.
12.54. Because of limits on source data, certain travel statistics for exports to and imports from Canada and Mexico are prepared differently than for other countries. Statistics for other business travel and other personal travel for Canada are based on data provided by Statistics Canada and for Mexico are based on data provided by the Bank of Mexico and National Institute of Statistics and Geography, Mexico’s national statistical agency. Statistics for health-related travel for Canada and Mexico are calculated by multiplying ratios of health-related travel to other business travel and other personal travel for other countries by estimates of other business travel and other personal travel for Canada and Mexico.
Business travel
12.55. Expenditures by border, seasonal, and other short-term workers. Expenditures by border, sea-sonal, and other short-term workers cover the expenditures on goods and services by foreign resi-dents who commute to work in the United States, by other foreign workers temporarily employed in the United States, and by U.S. residents employed temporarily abroad. Statistics are based on the earnings of these workers, which are included in primary income under compensation of employ-ees (see paragraphs 13.59–13.70), and on information from the U.S. Bureau of Labor Statistic’s Consumer Expenditure Surveys, which BEA uses to estimate the portion of earnings spent.
12.56. Other business travel. Other business travel is estimated as one component of “other business and other personal travel,” a sub-aggregate measure of travel that excludes expenditures by travelers
To Contents

Part III. Statistical Methodology of International Transactions Accounts
Bureau of Economic AnalysisU.S. International Economic Accounts: Concepts and Methods
99
whose primary purpose for travel is education or health and expenditures by border, seasonal, and other short-term workers. The total value of “other business and other personal travel” is estimated by multiplying the number of travelers by a measure of their average expenditures.
12.57. Numbers of travelers are collected by CBP. For travel exports, the numbers of travelers are counts of I-94 international visitor arrivals, by country of residence. These counts exclude foreign visitors who are admitted for purposes not relevant to other business and other personal travel, such as education, short-term work, or official travel by diplomats, consular staff, or military personnel.20 BEA adjusts these counts to remove estimates of health-related travelers. For travel imports, the numbers of travelers are counts of U.S. citizens on passenger manifests for flights departing the United States for foreign destinations, as reported to CBP via the APIS. Counts of outbound U.S. travelers are provided to BEA by the country of U.S. travelers’ flights’ initial destination outside the United States. BEA makes adjustments to remove estimates of health- and education-related travelers. These counts are allocated to the countries of the travelers’ ultimate destinations based on relationships observed in data from the Survey of International Air Travelers (SIAT), conducted by the National Travel and Tourism Office.
12.58. Baseline average expenditures by country of residency of foreign travelers and country of main des-tination of U.S. travelers are estimated from expenditures reported on the SIAT. For countries with smaller sample sizes, baseline expenditures are calculated by averaging reported expenditures over time or across geographic regions. Baseline average expenditures are then smoothed to limit the influence of data variability introduced by small sample sizes and survey sample outliers using a moving average of the baseline quarterly estimates and adjusted using supplemental information to account for underreported spending—a characteristic of many expenditure surveys—on the SIAT.
12.59. The product of the number of travelers and average expenditures is distributed into other business travel and other personal travel using country-level spending shares estimated using information on the main purpose of travel from the SIAT.
Personal travel
12.60. Health-related travel. Health-related travel includes expenditures by those traveling for health reasons—that is, by travelers seeking medical or dental care and procedures outside their country of residence and by travelers accompanying them on those trips. It is not limited to only medical expenditures, but it excludes medical (and other) expenditures by those traveling for reasons other than health. Estimates of health-related travel are based on SIAT data on expenditures by travelers traveling for health reasons and on the numbers of travelers data from CBP. SIAT data are used to calculate average spending by those traveling for health reasons and the share of travelers that
20. The counts also exclude certain visitors who are in-scope for other business travel but are omitted because of data limitations: (1) travelers on official government travel that is nondiplomatic in nature are excluded because such travelers cannot be identified separately in the source data from those on diplomatic travel or those covered by BEA’s estimates of expenditures by border, seasonal, and other short-term workers and (2) members of carrier crews stopping off or laying over are excluded because BEA’s estimates of average expenditure are thought to not be representative of their spending.
To Contents
Part III. Statistical Methodology of International Transactions Accounts
Bureau of Economic AnalysisU.S. International Economic Accounts: Concepts and Methods
100
travel for health reasons. These estimates are multiplied by the number of travelers. SIAT source data on travel for health reasons are sparse, so long-term averages are used to smooth health-re-lated travel estimates, both at the aggregate level and, more so, at the country level.
12.61. Education-related travel. Education-related travel includes all expenditures by travelers whose primary purpose for travel is education, including dependents and other travelers accompanying students. Numbers of travelers for education-related travel exports are based on counts of foreign students in the United States from the U.S. Immigration and Custom Enforcement’s Student and Exchange Visitor Information System (SEVIS). Numbers of travelers for imports are based on counts of U.S. students in study-abroad programs from the Institute of International Education’s Open Doors report and counts of U.S. students directly enrolled abroad from the UNESCO Institute for Statistics (UIS) and other data sources. For certain countries not covered by the UIS counts, numbers of travelers are supplemented with estimated counts of U.S. medical students enrolled abroad based on data from the Educational Commission for Foreign Medical Graduates on the number of certification examinations it administers or with estimated counts of students directly enrolled abroad based on other data sources. For exports, education-related travelers include indi-viduals enrolled in primary, secondary, and post-secondary programs at educational institutions in the United States who are not U.S. citizens, immigrants, or refugees; they do not include travelers on education-related visas working in the United States after graduation under Optional Practical Training or similar programs. For imports, education-related travelers exclude individuals enrolled in primary and secondary programs because of a lack of source data.
12.62. Foreign students’ average expenditures, which are used for calculating exports, are based on data collected by the SEVIS covering tuition, living expenses (including expenses for dependents), and other expenses. The SEVIS data are also used as the basis for estimating average expenditures of U.S. students abroad (for imports), with adjustments to account for differences in price levels, pro-gram lengths, and types of expenses encountered by U.S. students abroad compared with foreign students in the United States.
12.63. Other personal travel. Other personal travel is estimated as one component of “other business and other personal travel,” a sub-aggregate measure of travel that excludes expenditures by travelers whose primary purpose for travel is education or health and expenditures by border, seasonal, and other short-term workers. This sub-aggregate is first estimated by multiplying the number of travelers by a measure of their average expenditures. Subsequently, that total is distributed to the other business travel and the other personal travel components, and other personal travel is sup-plemented with expenditures by travelers on cruises, which are not covered by the primary source data used to estimate other business and other personal travel. See paragraphs 12.56–12.59 for the method used to estimate other business and other personal travel. Source data from CBP and from several private sources are used to estimate expenditures by travelers on cruises.
To Contents
Part III. Statistical Methodology of International Transactions Accounts
Bureau of Economic AnalysisU.S. International Economic Accounts: Concepts and Methods
101
Construction
12.64. Construction covers the creation, renovation, repair, or extension of buildings, land improvements, and civil engineering constructions, such as roads and bridges. It also includes management of con-struction projects. Statistics on construction are presented differently than statistics on other ser-vice types. Whereas other service types cover only sales of the service outputs themselves, BPM6 recommends that construction statistics include measures of local goods and services purchased by construction companies. Under BPM6 guidelines, construction exports are to be measured as the sum of sales of construction projects abroad by U.S. construction companies and purchases of goods and services from U.S. residents by foreign construction companies for their projects in the United States. Construction imports are to be measured as the sum of sales of construction projects in the United States by foreign companies and purchases of inputs from foreign residents by U.S. construction companies for their projects abroad.
12.65. BEA’s construction statistics depart from the recommendation in BPM6 for exports in that source data are unavailable for goods and services acquired in the United States by foreign construction companies for projects in the United States. The statistics also depart by including in imports local wages and salaries along with local purchases of goods and services. BPM6 recommends that local wages and salaries instead be recorded in primary income as compensation of employees. Finally, the statistics depart from BPM6 recommendations by subtracting exports of goods by U.S. construction companies for their projects abroad. Under BPM6 guidelines, no subtraction is made in construction, but such exports are not included in the goods statistics either since there is no change in ownership. The source data for goods do not allow these exports to be excluded from the goods statistics, so BEA subtracts them from construction to avoid the overcounting of exports.
12.66. Statistics for construction are based on data collected on BEA’s Quarterly Survey of Transactions in Selected Services and Intellectual Property With Foreign Persons (BE–125) and Benchmark Survey of Transactions in Selected Services and Intellectual Property With Foreign Persons (BE–120). Data on sales, goods exports, and local expenses are collected from U.S. sellers of construction ser-vices; data on purchases are collected from U.S. purchasers of construction services.
12.67. Subcategories of BEA’s statistics on construction services include construction abroad and foreign contractors’ expenditures in the United States. Construction abroad is estimated as U.S. firms’ sales less their goods exports for projects abroad. Foreign contractors’ expenditures in the United States are shown as “n.a.” (not available) because of a lack of source data. Subcategories of BEA’s statistics on imports of construction services include construction in the United States and U .S . contractors’ expenditures abroad. Construction in the United States is estimated as U.S. firms’ purchases of con-struction services from foreign suppliers. U.S. contractors’ expenditures abroad are estimated as U.S. construction firms’ local expenses related to projects abroad.
To Contents
Part III. Statistical Methodology of International Transactions Accounts
Bureau of Economic AnalysisU.S. International Economic Accounts: Concepts and Methods
102
Insurance services
12.68. Insurance services include direct insurance, reinsurance, and auxiliary insurance services. Direct insurers and reinsurers provide policyholders financial protection against specified risks (a risk-pooling service) and serve as financial intermediaries by investing technical reserves that are viewed as belonging to policyholders. Direct insurance services include the provision of life insurance (including annuities) and nonlife (property and casualty) insurance. Reinsurance is the provision of insurance to another insurance company to cover risks associated with the purchas-ing company’s policies, either individually or collectively. Both direct insurance and reinsurance services are measured as gross premiums earned less “normal” (expected) losses plus premium supplements; this net measure reflects the margin between the amounts accruing to the companies and the amounts accruing to the policyholders. BEA does not include the BPM6 component pen-sion services because of a lack of source data.
Gross premiums less normal losses
12.69. Gross premiums less normal losses represent the bulk of the services provided by direct insurers and reinsurers. Normal losses are a proxy measure for the claims that insurers expect to pay in a given period. The calculation of normal losses is based on reference period premiums and the historical relationship between premiums and actual losses. The use of normal losses is consistent with the notion that insurers’ expectations about current and future losses are informed by their historical losses. Premiums less normal losses are used instead of premiums less actual claims paid in a single period because actual claims paid are subject to high volatility and their use could result in an erratic, or even negative, measure of insurance services that would inadequately reflect long-term insurance output. (The “replacement” of actual claims with normal losses is referred to as an adjustment for claims volatility in paragraphs 14.12, 14.33, and 14.34.) Two types of losses are distinguished: catastrophic losses and regularly occurring losses; regularly occurring losses are all losses not deemed to be catastrophic. Calculations of normal losses involve the two loss types as described below.
12.70. The calculation of normal losses involves several steps (see figure 12.a): (1) add regularly occurring losses and “allocated catastrophic losses” (as described below) to give “disaster-adjusted losses”; (2) divide disaster-adjusted losses by premiums to get a loss ratio; (3) take a moving average over 24 quarters of the loss ratio; and (4) multiply the moving average of the loss ratio by reference-quarter premiums. The result of these four steps is normal losses. In the moving average calculation in step (3), ratios from the reference quarter are excluded from the moving average in order to achieve an ex ante concept of regularly occurring losses.
12.71. Catastrophic losses occur at infrequent intervals and are assumed to affect loss expectations over a long period. BEA generally identifies losses as catastrophic when they arise from an event where the total impact, insured and uninsured, is greater than 0.1 percent of annual U.S. gross domestic product. Before using catastrophic losses in the calculation of normal losses, the catastrophic losses are spread and allocated over two decades to give the quantity used in step (1) above using the
To Contents

Part III. Statistical Methodology of International Transactions Accounts
Bureau of Economic AnalysisU.S. International Economic Accounts: Concepts and Methods
103
following process. First, catastrophic losses are spread over the 80 quarters following their occur-rence in equal allotments. Second, for each reference quarter the allotments from each catastrophe that occurred in the 80 quarters prior to the reference quarter are summed to get the total cata-strophic loss allotment for the reference quarter.
12.72. Ratios of normal losses to premiums are calculated separately for direct insurance and reinsurance and for exports and imports because the ratio of losses-to-premiums tends to be lower for direct insurance than for reinsurance. Reinsurance involves fewer and larger transactions than direct insurance, which involves selling and writing larger numbers of individual policies to customers.
Premium supplements
12.73. Premium supplements represent investment income (“gains”) earned on the insurance technical reserves that insurers hold on behalf of policyholders. Insurance companies hold and manage these assets as an integral part of their business. Because the income generated on these assets serves to decrease the premiums that insurance companies charge, BEA treats it as being paid to the policyholders by the insurer, who then pay it back to the insurer as a second means of compen-sation for the insurance services provided.21 Premium supplements are estimated by multiplying smoothed premiums and a ratio of investment gains to premiums that is based on data from AM Best’s Aggregates & Averages: Property/Casualty, an industry report. Investment gains-to-premiums
21. In practice, the insurers typically retain the investment income earned from investing policyholders’ technical reserves, so there is no actual flow of funds from insurer to policyholder and back. The notional payment of income to policyholders—the first part of this as-if round-trip transaction—is recorded in primary income (see also paragraph 12.78). The notional payment back to the insurer is the premium supplement and is recorded as part of insurance services.
Catastrophic losses ( ) are spread over 80 quarters, beginning with the quarter in which they occur, to estimate “allocated catastrophic losses” ( ).
Normal losses ( ) are calculated by multiplying reference-quarter premiums by a 24-quarter moving average of the ratio of disaster-adjusted losses to premiums.
Regularly occurring losses ( ) plus allocated catastrophic losses ( ) are equal to “disaster-adjusted losses.”
Figure 12.a. Calculating Normal Losses
Catastrophic losses
Normal losses
U.S. Bureau of Economic Analysis
Amount
0
1
2
3
4
5
6
7
8
9
10
Regularly occurring lossesAllocated catastrophic losses
Disaster-adjustedlosses
Quarters
To Contents

Part III. Statistical Methodology of International Transactions Accounts
Bureau of Economic AnalysisU.S. International Economic Accounts: Concepts and Methods
104
ratios are estimated separately for direct insurance and reinsurance because reinsurers may have different ratios of gains to premiums and may hold larger reserves than direct insurers. Because data necessary to compute the ratio of investment gains to premiums are not available for foreign insurance companies, the ratio for domestic insurance companies is applied to premium payments to estimate premium supplement payments.
12.74. Conceptually, calculating premium supplements using the relationship between investment gains and the technical reserves held by insurance enterprises on behalf of policyholders would be pre-ferred to using the relationship between investment gains and premiums. However, BEA does not collect information on technical reserves on its surveys.
Auxiliary insurance services
12.75. Services that are auxiliary to insurance are measured separately and includes agents’ commissions, insurance brokering and agency services, insurance consulting services, actuarial services, evalua-tion and adjustment services, salvage administration services, and other insurance administration services.
Relationship to other accounts in the ITAs
12.76. Normal losses are considered transfers from the policyholders to the insurance company and are recorded in insurance-related transfers in secondary income as a current transfer. These transfers represent the portion of premiums that is not accounted for in insurance services. Claims payable (actual losses), except catastrophic losses, are transfers from the insurance company back to the policyholder and are also recorded in insurance-related transfers in secondary income. (For more on the recording of insurance transactions in secondary income see paragraphs 14.33–14.35).
12.77. An exception to this treatment of claims payable is the treatment for catastrophic losses. For cat-astrophic losses, the full amount of the insured loss is entered as a transfer in the capital account in the quarter in which the event occurs. This treatment is consistent with the treatment of these losses in BEA’s National Income and Product Accounts, and it avoids having the payment affect current economic activity, as it would if it were combined with regular losses in current transfers. The treatment also removes a significant source of volatility in the current-account balance. (For more on the recording of catastrophic losses see paragraphs 14.35 and 15.11.)
12.78. To account for the investment income on technical reserves that accrues to policyholders and is implicitly paid as premium supplements, an offsetting entry is recorded in primary income. (For more on the recording of primary income attributable to insurance premium supplements, see paragraph 13.52.) Figure 12.b illustrates how premiums, premium supplements, normal losses, and actual losses are recorded in the ITAs.
To Contents

Part III. Statistical Methodology of International Transactions Accounts
Bureau of Economic AnalysisU.S. International Economic Accounts: Concepts and Methods
105
12.79. International guidelines recommend that cross-border transactions in insurance technical reserves should be recorded in the financial account. However, BEA does not include them because insur-ance-related transactions currently cannot be distinguished from other changes in claims and lia-bilities reported in BEA’s source data from the U.S. Department of the Treasury.
Example of a resident insurer and a nonresident policyholder
Figure 12.b. How Insurance Transactions are Recordedin the International Transactions Accounts
Direct insurer
For every insurance policy, the following transactions are recorded each quarter:
PolicyPrimary income payments
Insurance services exports�
Secondary income receipts
Insurance services provided are recorded as insurance services exports. Insurance services are estimated as premiums less normal losses plus premium supplements.1. For consistency with the representation of the other transactions in this example, the direction of the arrow indicates the direction
of the funds received by the resident exporter of insurance services, not the direction of the exports themselves.
Normal losses are recorded as insurance-related transfers in secondary income receipts. These transactions offset the portion of premiums that is not accounted for in insurance services exports.
Interest on prepaid premiums is considered to accrue to the policyholder and is therefore notionally recorded as insurance-related transfers in primary income payments. This interest is considered to be returned to the insurer as the premium supplement component of insurance services exports.
Direct insurer
When there is a claim other than a catastrophicclaim, the following transaction is recorded:
Secondary income paymentsActual losses are paid by resident insurance companies to nonresident policyholders and are recorded as insurance-related transfers in secondary income payments.
Direct insurer
When there is a catastrophic claim,the following transaction is recorded:
Capital account paymentsActual catastrophic losses are paid by resident insurance companies to nonresident policyholders and are recorded in capital account payments as insured catastrophic (disaster-related) losses.
Policy
Claim
Policy
!Claim
U.S. Bureau of Economic Analysis
To Contents

Part III. Statistical Methodology of International Transactions Accounts
Bureau of Economic AnalysisU.S. International Economic Accounts: Concepts and Methods
106
Estimation
12.80. The main data source for statistics on insurance services is BEA surveys, which collect data on pre-miums, losses, and auxiliary insurance services. BEA surveys of U.S. insurance providers are the Quarterly Survey of Insurance Transactions by U.S. Insurance Companies With Foreign Persons (BE–45) and the Benchmark Survey of Insurance Transactions by U.S. Insurance Companies With Foreign Persons (BE–140). BEA collects data from noninsurance companies on their transactions in auxiliary insurance services and on their premiums paid for direct insurance on the Quarterly Survey of Transactions in Selected Services and Intellectual Property with Foreign Persons (BE–125) and the Benchmark Survey of Transactions in Selected Services and Intellectual Property With Foreign Persons (BE–120).
Financial services
12.81. Financial services include financial intermediary and auxiliary services, except insurance services. These services include those normally provided by banks and other financial institutions. Services include both those for which an explicit commission or fee is charged as well as those for which fees are implicit: financial intermediation services indirectly measured (FISIM), bond transactions, and dealers’ and market-makers’ margins on financial instruments. BEA classifies FISIM separately in its financial services statistics. All other financial services are grouped under explicitly charged and other financial services.
Explicitly charged and other financial services
12.82. BEA presents explicitly charged and other financial services according to the six components described below.
12.83. Brokerage and market-making services. Brokerage and market-making services cover commis-sion or fee-based financial brokerage services including (1) brokerage services related to equity ser-vices, such as commissions and fees for executing orders to purchase or sell equities; (2) brokerage services for executing orders to purchase or sell forwards, futures, options, and swaps and other financial instruments, including brokerage of foreign currencies, whether conducted on organized exchanges, in over-the-counter markets, or over internet and electronic communications networks; and (3) brokerage services related to debt securities, estimated as implicit fees for executing orders to purchase and sell bonds. Brokerage and market-making services also cover liquidity services performed by dealers, which are proxied by the implicit trading profit generated by market mak-ers when they trade on their quoted bid-ask spread. Brokerage and market-making services cover transactions by U.S. financial firms with foreign-resident customers (exports) and by foreign finan-cial firms with U.S.-resident counterparties (imports).
12.84. Underwriting and private placement services. Underwriting and private placement services cover services associated with both equities and bonds, including earnings and losses from buying
To Contents

Part III. Statistical Methodology of International Transactions Accounts
Bureau of Economic AnalysisU.S. International Economic Accounts: Concepts and Methods
107
and reselling an entire or substantial portion of newly issued securities and fees provided by an issuer of securities for privately placing its securities, including fees on dealer-placed commercial paper.
12.85. Credit card and other credit-related services. Credit card and other credit-related services cover (1) credit card services, such as transaction and service fees, interchange fees, and currency-con-version fees and (2) credit-related services, such as for establishing and maintaining standby letters of credit, arranging mortgages, performing factoring services, issuing financial guarantees and loan commitments, and arranging or entering into financial lease contracts.
12.86. Financial management services. Financial management services cover fees for administering portfolios of cash, securities, financial derivatives, and other financial instruments.
12.87. Financial advisory and custody services. Financial advisory and custody services cover (1) fees for advisory services on mergers and acquisitions, commodity trading services, investment news-letters or investment advice, and proxy voting advisory services and (2) custody services (including payments and settlements services such as mortgage servicing) and other custody services.
12.88. Securities lending, electronic funds transfer, and other services. Securities lending, electronic funds transfer, and other services cover (1) amounts received or paid for lending or borrowing securities, arranging loan terms and conditions, monitoring the value of collateral, providing guar-antees against default, and providing other securities lending services; (2) fees for the electronic funds transfers of money or financial assets received directly from, or paid directly to, foreign persons; and (3) other financial services, such as asset pricing services, check processing fees, securities or futures clearing and settling services, and imports of financial services by nonfinancial services companies.
Financial intermediation services indirectly measured
12.89. FISIM measures the revenue implicitly generated by financial intermediaries through their lend-ing and deposit-taking services, including services associated with repurchase/resale agreements. FISIM is enabled by differences in interest rates charged by financial intermediaries for loans to customers, or rates paid by financial intermediaries on customer deposits, and a reference rate that represents a financial intermediary’s cost of funds. For borrower FISIM, financial intermediaries charge customers a loan rate that is higher than the reference rate, with the spread between the two rates generating revenue to cover the costs of providing the lending service. Likewise, financial intermediaries pay a deposit rate to customers that is lower than the reference rate. This allows the financial intermediary to obtain funds more cheaply than if it borrowed at the cost of funds rate. This “savings” is depositor FISIM.
12.90. In accordance with BPM6 guidance, BEA recognizes no FISIM on transactions between affiliated parties. In contrast with that guidance, however, BEA currently only recognizes FISIM when a
To Contents
Part III. Statistical Methodology of International Transactions Accounts
Bureau of Economic AnalysisU.S. International Economic Accounts: Concepts and Methods
108
bank is the lender or the deposit taker. No FISIM is attributed to loans provided by, and deposits accepted by, other financial institutions. When both parties to a loan or deposit transaction are banks, no FISIM is recognized as this activity is assumed to occur at the reference rate.
Estimation
12.91. Statistics for financial services are based primarily on BEA survey data. BEA collects information from U.S. financial services providers on the Quarterly Survey of Financial Services Transactions Between U.S. Financial Services Providers and Foreign Persons (BE–185) and the Benchmark Survey of Financial Services Transactions by U.S. Financial Services Providers With Foreign Persons (BE–180). BEA collects information on U.S. nonfinancial services companies’ purchases of financial services from foreign persons on the Quarterly Survey of Transactions in Selected Services and Intellectual Property With Foreign Persons (BE–125) and the Benchmark Survey of Transactions in Selected Services and Intellectual Property With Foreign Persons (BE–120). These surveys collect data on exports and imports of explicitly charged financial services transactions.
12.92. Because bonds are generally not traded on a commission or fee basis, bond brokerage transactions are estimated as the product of one-half of the difference between bid and ask prices and transac-tions volume. Similarly, market-making services (margins) are estimated as the product of one-half of the difference between bid-ask prices and transactions volume. Transactions volumes for both bond brokerage estimates and margins estimates are based on data from Treasury International Capital (TIC) S reports (Purchases and Sales of Long-Term Securities by Foreign-Residents). Data on bid-ask spreads for both types of estimates are obtained from industry sources.
12.93. FISIM is estimated as the product of a measure of outstanding loans and deposits (including repurchase/resale agreements) and the difference between market interest rates and a reference rate. Data on the value of loan and deposit balances come from various TIC surveys, including TIC B (filed by banks and other financial institutions) and C reports (filed by other commercial enter-prises)—see chapter 3 for more information on TIC reports. BEA also uses data on balances from partner-country statistical agencies. Data on market interest rates come primarily from call reports collected by the Federal Financial Institutions Examination Council. The reference rate is based on an average of the 5-year U.S. Treasury rate and a composite Treasury rate computed from the call reports. The reference rate used for trade in FISIM is the same reference rate used in BEA’s National Economic Accounts for estimates of domestic FISIM. For repurchase/resale agreements, rates are based on the Secured Overnight Financing Rate from the Federal Reserve Board.
Charges for the use of intellectual property n.i.e.
12.94. Charges for the use of intellectual property n.i.e. include charges for rights to reproduce, redis-tribute, or otherwise use intellectual property that are not included in other service types. These include (1) charges for the use of proprietary rights (such as patents, trademarks, copyrights, indus-trial processes and designs including trade secrets, and franchises) that can arise from research and development (R&D) as well as from marketing and (2) charges for licenses to reproduce and/or
To Contents

Part III. Statistical Methodology of International Transactions Accounts
Bureau of Economic AnalysisU.S. International Economic Accounts: Concepts and Methods
109
distribute intellectual property embodied in produced originals or prototypes (such as copyrights on books and manuscripts, computer software, cinematographic works, and sound recordings) and related rights (such as for live performances and television, cable, or satellite broadcast).
12.95. Outright sales or purchases of ownership rights to intellectual property are not included in charges for the use of intellectual property n.i.e.; such transactions are instead included in the service cat-egory that reflects the production of these rights or in the capital account. For example, outright sales or purchases of patents, processes, and trade secrets are included in research and development services (in other business services), outright sales or purchases of the rights to computer software products are included in computer services (in telecommunications, computer, and information services), and outright sales or purchases of the rights to books, music, motion pictures (including television programming), and recorded performances and events are included in audiovisual ser-vices (in personal, cultural, and recreational services). Outright sales or purchases of trademarks and franchises are included in the capital account because they are nonfinancial assets that are consid-ered to be nonproduced.
12.96. Licenses to use intellectual property, excluding reproduction and distribution, are included in com-puter services for computer software products and in audiovisual services for books, music, motion pictures, and recorded performances and events. Figure 12.c illustrates how transactions in various types of intellectual property are classified in the ITAs.
12.97. Statistics for charges for the use of intellectual property n.i.e. are based primarily on BEA survey data. The BEA surveys include the Quarterly Survey of Transactions in Selected Services and Intellectual Property With Foreign Persons (BE–125) and the Benchmark Survey of Transactions in Selected Services and Intellectual Property With Foreign Persons (BE–120). Quarterly and bench-mark survey data are collected by type of service and by type of rights conveyed.
12.98. BEA classifies and presents charges for the use of intellectual property n.i.e. according to the four components described below.
12.99. Franchises and trademarks licensing fees. Franchises and trademarks licensing fees include receipts and payments for the rights to sell products under a particular trademark, brand name, or signature and fees received and paid under business format franchising agreements with foreign persons.
12.100. Licenses for the use of outcomes of research and development. Licenses for the use of outcomes of research and development include license fees, royalties, and other fees received or paid for rights to use intellectual property, including patents, trade secrets, and other proprietary rights, that are used in connection with, or related to, the production of goods or services. This component also includes transactions in intellectual property that cannot be classified in one of the other three components of charges for the use of intellectual property n.i.e or in research and development ser-vices, computer services, audiovisual services, or the capital account.
To Contents
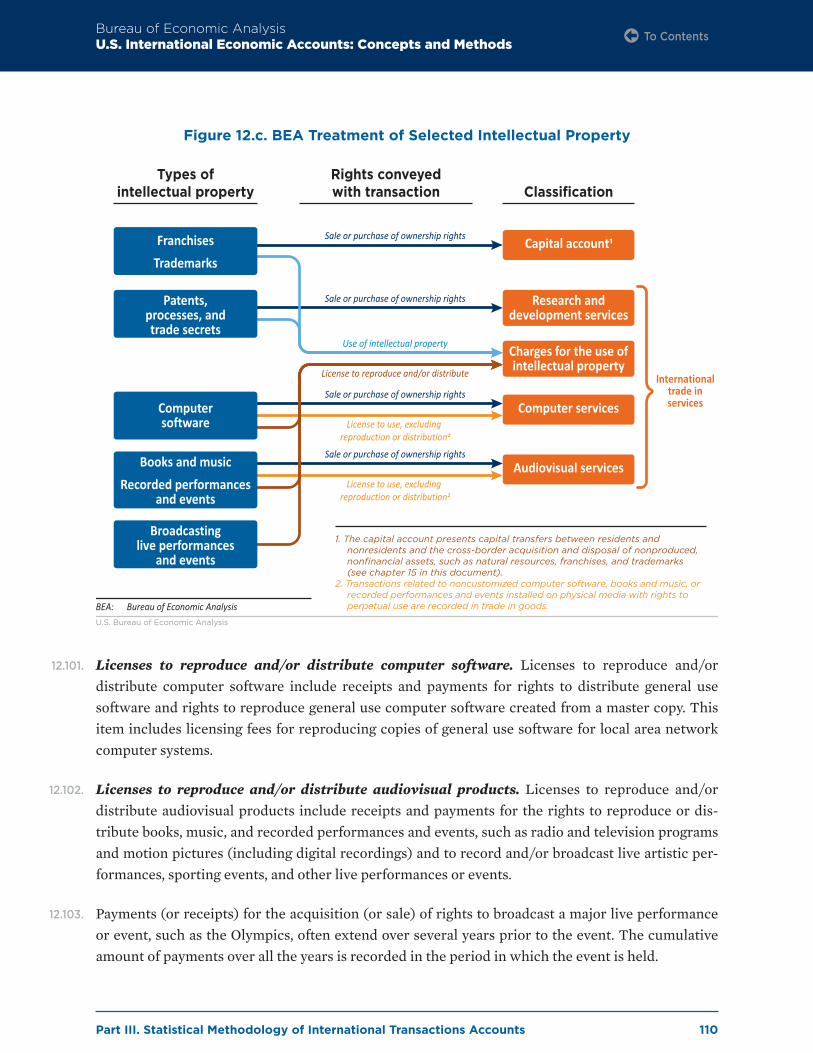
Part III. Statistical Methodology of International Transactions Accounts
Bureau of Economic AnalysisU.S. International Economic Accounts: Concepts and Methods
110
12.101. Licenses to reproduce and/or distribute computer software. Licenses to reproduce and/or distribute computer software include receipts and payments for rights to distribute general use software and rights to reproduce general use computer software created from a master copy. This item includes licensing fees for reproducing copies of general use software for local area network computer systems.
12.102. Licenses to reproduce and/or distribute audiovisual products. Licenses to reproduce and/or distribute audiovisual products include receipts and payments for the rights to reproduce or dis-tribute books, music, and recorded performances and events, such as radio and television programs and motion pictures (including digital recordings) and to record and/or broadcast live artistic per-formances, sporting events, and other live performances or events.
12.103. Payments (or receipts) for the acquisition (or sale) of rights to broadcast a major live performance or event, such as the Olympics, often extend over several years prior to the event. The cumulative amount of payments over all the years is recorded in the period in which the event is held.
Figure 12.c. BEA Treatment of Selected Intellectual Property
1. The capital account presents capital transfers between residents and nonresidents and the cross-border acquisition and disposal of nonproduced, nonfinancial assets, such as natural resources, franchises, and trademarks (see chapter 15 in this document).
2. Transactions related to noncustomized computer software, books and music, or recorded performances and events installed on physical media with rights to perpetual use are recorded in trade in goods.BEA: Bureau of Economic Analysis
Types ofintellectual property
FranchisesTrademarks
Books and musicRecorded performances
and events
Patents,processes, andtrade secrets
Broadcastinglive performances
and events
Computersoftware
Research anddevelopment services
Charges for the use ofintellectual property
Capital account�
Computer services
Audiovisual services
Sale or purchase of ownership rights
Rights conveyedwith transaction Classification
Internationaltrade inservices
Sale or purchase of ownership rights
Sale or purchase of ownership rights
Sale or purchase of ownership rights
Use of intellectual property
License to reproduce and/or distribute
License to use, excluding reproduction or distribution�
License to use, excluding reproduction or distribution�
U.S. Bureau of Economic Analysis
To Contents

Part III. Statistical Methodology of International Transactions Accounts
Bureau of Economic AnalysisU.S. International Economic Accounts: Concepts and Methods
111
Telecommunications, computer, and information services
12.104. This service type consists of telecommunications services, computer services, and information ser-vices. BEA publishes each component separately.
12.105. Telecommunications services. Telecommunications services include the broadcast or trans-mission of sound, images, data, or other information by electronic means. These services do not include the value of the information transmitted. Telecommunications services include (1) basic telecommunications, defined as transmitting messages between U.S. and foreign destinations or between foreign points; (2) private leased channel services; (3) value-added services; (4) support services; and (5) reciprocal exchanges.
12.106. Computer services. Computer services include subcomponents for computer software services and for computing and data storage services, along with a variety of other services. The computer software subcomponent includes end-user licenses and customization. It covers sales of custom-ized software and related use licenses as well as licenses to use noncustomized software with a periodic license fee. This subcomponent also covers software downloaded from the internet, fees and subscriptions for online gaming, licensing agreements and end-user fees associated with downloading applications, and sales and purchases of ownership rights of existing general use software. Transactions in noncustomized packaged software with a license for perpetual use are included in goods. Transactions in licenses to reproduce and/or distribute computer software are included in charges for the use of intellectual property n.i.e. The cloud computing and data storage subcomponent includes data processing and hosting services, such as hosting web pages and other content. Other services in computer services include hardware and software consultancy, installa-tion, and maintenance and repair services.
12.107. Information services. Information services include news agency services, which cover the provi-sion of news, photographs, and other content to the media. They also include other types of infor-mation services, such as database services and web search portals.
12.108. Statistics for telecommunications, computer, and information services are based primarily on BEA survey data. The BEA surveys include the Quarterly Survey of Transactions in Selected Services and Intellectual Property With Foreign Persons (BE–125) and the Benchmark Survey of Transactions in Selected Services and Intellectual Property With Foreign Persons (BE–120). Specific definitions for the survey data items can be found in these surveys. For computer services imports from Canada, BEA uses counterpart data from Statistics Canada.
Other business services
12.109. Other business services consist of research and development services; professional and management consulting services; and technical, trade-related, and other business services. BEA publishes each component separately. Additional subcomponents of each component are published in the detailed annual international services statistics discussed in chapter 31.
To Contents

Part III. Statistical Methodology of International Transactions Accounts
Bureau of Economic AnalysisU.S. International Economic Accounts: Concepts and Methods
112
12.110. Research and development (R&D) services. R&D services consist of services associated with basic and applied research and experimental development of new products and processes. They include work undertaken on a systematic basis to increase the stock of knowledge, which consists of the provision of customized and noncustomized R&D services and the sale of proprietary rights related to patents, processes, and trade secrets arising from R&D. They also include other R&D ser-vices, mainly testing and other development activities.
12.111. Professional and management consulting services. Professional and management consulting services cover a variety of services grouped into two subcomponents: (1) legal, accounting, man-agement consulting, and public relations services and (2) advertising and related services. Affiliated receipts and payments for general overhead expenses that are not separately identified with a par-ticular service type are included in professional and management consulting services.
12.112. Legal, accounting, management consulting, and public relations services include legal services; accounting, auditing bookkeeping, and tax consulting services; and business and management con-sulting and public relations services.
12.113. Advertising and related services include advertising services, market research and public opinion polling services, and trade exhibition and sales convention services.
12.114. Technical, trade-related, and other business services. Technical, trade-related, and other busi-ness services cover a variety of services including architectural services; engineering services; sci-entific and other technical services; waste treatment and de-pollution services; services incidental to agriculture, forestry, and fishing; services incidental to mining, and oil and gas extraction; oper-ating leasing services; trade-related services; and other business services n.i.e.
12.115. Statistics for research and development services, professional and management consulting ser-vices, and technical, trade-related, and other business services are based primarily on BEA survey data. The BEA surveys include the Quarterly Survey of Transactions in Selected Services and Intellectual Property With Foreign Persons (BE–125) and Benchmark Survey of Transactions in Selected Services and Intellectual Property With Foreign Persons (BE–120). Specific definitions for the survey data items can be found in these BEA surveys.
Personal, cultural, and recreational services
12.116. Personal, cultural, and recreational services include services provided to individuals, business, or other groups. The main components in personal, cultural, and recreational services are audiovisual services; artistic-related services; and other personal, cultural, and recreational services.
12.117. Audiovisual services. Audiovisual services include audiovisual production services and other subcomponents covering rights to use and outright sales of proprietary rights to audiovisual orig-inals of various types. Audiovisual production services cover the production of motion pictures, radio and television programs, and musical recordings. Rights to use audiovisual products and
To Contents

Part III. Statistical Methodology of International Transactions Accounts
Bureau of Economic AnalysisU.S. International Economic Accounts: Concepts and Methods
113
proprietary rights to audiovisual originals each cover products associated with (1) movies and tele-vision programming (including radio programming) and (2) books and sound recording. The rights to use audiovisual products and audiovisual originals are distinguished from licenses to reproduce and/or distribute audiovisual products; those licenses are included in charges for the use of intellec-tual property, n .i .e .
12.118. Artistic-related services. Artistic-related services include fees paid to performers, athletes, direc-tors, and producers involved with live events, such as concerts, theatrical and musical productions, and sporting events. Excluded from artistic-related services are any payments made directly to employees; such payments are included in compensation of employees in primary income if either the employee or employer is a U.S. resident and the other is a foreign resident. Also excluded from artistic-related services are fees related to the recording of live events; these fees are included in audiovisual services.
12.119. Other personal, cultural, and recreational services. Other personal, cultural, and recreational services cover health services, education services, and heritage and recreational services. Health services include general and specialized human health services supplied by health-care providers, as well as laboratory, diagnostic, and similar services. Educational services include instruction for any type of structured learning and related services, such as correspondence courses and online education provided across borders and instructional services by teachers and other instructors provided while in the economy of the customer. Heritage and recreational services include services associated with museums and other cultural, sporting, gambling, and recreational activities that are provided across borders or by suppliers while in the country of the customer. Gambling, including online gambling, includes service charges receivable or payable to the unit organizing the lottery or gambling.
12.120. All services in other personal, cultural, and recreational services may be provided remotely or by persons temporarily in the country of the customer. However, other personal, cultural, and recre-ational services exclude transactions that occur when the customer travels to the country of the service provider. Such services are instead included in travel ( for all purposes including education); in travel, the primary purpose of the trip determines how a service is categorized. Education-related travel and health-related travel are shown separately; travel for cultural or recreational pur-poses are included in other personal travel.
12.121. Statistics for personal, cultural, and recreational services are based on BEA survey data. The BEA surveys include the Quarterly Survey of Transactions in Selected Services and Intellectual Property With Foreign Persons (BE–125) and Benchmark Survey of Transactions in Selected Services and Intellectual Property With Foreign Persons (BE–120). Specific definitions for the survey data items can be found in these BEA surveys.
To Contents

Part III. Statistical Methodology of International Transactions Accounts
Bureau of Economic AnalysisU.S. International Economic Accounts: Concepts and Methods
114
Government goods and services n.i.e.
12.122. Government goods and services n.i.e. covers goods and services supplied by and to enclaves, such as embassies, military bases, and international organizations; goods and services acquired from the host economy by diplomats, consular staff, and military personnel located abroad and their dependents; and services supplied by and to governments that are not included in other services categories. Services supplied by and to governments are classified to specific services categories when source data permit.
12.123. Government goods and services n.i.e. are based largely on data provided to BEA by other U.S. gov-ernment agencies and are subdivided into military and nonmilitary components. Exports of gov-ernment goods and services by the U.S. military include (1) sales of goods and services, excluding maintenance and repair services, through the Foreign Military Sales program, which are estimated using data reported by DOD as well as from press releases and other sources and (2) the delivery of services provided through military grant programs, which are estimated based on appropriations information from the Office of Management and Budget (OMB).
12.124. Exports of government goods and services by nonmilitary entities include (1) fees collected from overseas consulates (such as visa application fees), which are estimated using data on the value of such fees provided by the U.S. Department of State (State Department) under OMB Statistical Directive No. 19; (2) exports of certain goods and services reported to BEA by U.S. government operating agencies under OMB Statistical Directive No. 19; (3) expenditures by foreign govern-ments (for example, for supplying diplomatic enclaves) and their workers stationed in the United States, both of which are calculated as a share (based on BEA research) of compensation paid to foreign government workers stationed in the United States (see paragraph 13.60 for more informa-tion on the estimation of earnings of U.S. residents employed by foreign governments in the United States); and (4) expenditures by international organizations based in the United States, which are calculated as a share (based on BEA research) of compensation paid to U.S. residents employed by international organizations in the United States (see paragraph 13.61 for more information on the estimation of earnings of U.S. residents employed by international organizations in the United States).
12.125. Imports of government goods and services supplied to the U.S. military include (1) expenditures on goods and services abroad by U.S. personnel stationed abroad in military enclaves, which are estimated using data on compensation paid to U.S. personnel stationed abroad reported to BEA by military departments within DOD, less an estimate of spending within U.S. enclaves, which are estimated using data on commissary sales from the Defense Commissary Agency and on military post office sales from the U.S. Military Postal Service; (2) payments to foreign nationals for goods (except petroleum) and services supplied to military enclaves, which are estimated using data pro-vided by U.S. military departments within DOD;22 (3) payments to international organizations, such as the North Atlantic Treaty Organization (NATO), which are estimated based on appropriations
22. Petroleum purchases abroad by U.S. military enclaves are recorded in the ITAs as goods imports.
To Contents
Part III. Statistical Methodology of International Transactions Accounts
Bureau of Economic AnalysisU.S. International Economic Accounts: Concepts and Methods
115
data from OMB and data reported to BEA by military departments within DOD; and (4) imports of other goods and services not separately identifiable in the source data (including spending by those in military enclaves), which are estimated based on data reported to BEA by U.S. military depart-ments within DOD and data reported by the U.S. Coast Guard under OMB Statistical Directive No. 19.
12.126. Imports of government goods and services to nonmilitary government entities include (1) goods and services acquired in the host economy that are supplied to nonmilitary enclaves, such as embassies, which are calculated as a share (based on BEA research) of the compensation paid to U.S. citizen and foreign national employees working at those facilities (from data provided by the State Department); (2) expenditures on goods and services abroad by U.S. citizens in nonmilitary enclaves, which are calculated as a share (based on BEA research) of the compensation paid to U.S. citizen employees working at those facilities (from data provided by the State Department); and (3) other imports of goods and services by the U.S. government, including goods and services provided to U.S. government enclaves, which are estimated from data reported to BEA by U.S. government operating agencies under OMB Statistical Directive No. 19.
To Contents

Part III. Statistical Methodology of International Transactions Accounts
Bureau of Economic AnalysisU.S. International Economic Accounts: Concepts and Methods
116
Chapter 13. Current-Account Primary Income
Concepts and coverage
13.1. Primary income represents the return that accrues to institutional units for their contribution to the production process or for the provision of financial assets and renting natural resources to other institutional units. The first-level published components are investment income and compen-sation of employees. Investment income is the return on holdings of financial assets and includes direct investment income, portfolio investment income, other investment income, and income on reserve assets. Unlike other functional categories, no primary income accrues to financial deriva-tives; any amounts that accrue under the contract are classified as revaluations. Compensation of employees is income for the contribution of labor inputs to the production process. Cross-border primary income flows provide a link between gross domestic product (GDP) and gross national income (GNI) as GNI equals GDP plus the primary income balance.
13.2. The presentation structure of investment income in the current account of the International Transactions Accounts (ITAs) is consistent with that for the corresponding financial flows in the financial account and positions in the International Investment Position (IIP) Accounts. Investment income receipts and payments are classified and presented by functional category. ITA table 4.1 presents investment income by functional category and by instrument type. The catego-ries and instrument types in this table are shown below in table 13.a. ITA table 4.2 presents direct investment income by type and by industry. ITA tables 4.3 and 4.4 present portfolio investment income and other investment income by sector and by type of instrument.
To Contents

Part III. Statistical Methodology of International Transactions Accounts
Bureau of Economic AnalysisU.S. International Economic Accounts: Concepts and Methods
117
Table 13.a. Transactions Shown in International Transactions Accounts Table 4.1. U.S. International Transactions in Primary Income
Line Receipts
1 Primary income receipts
2 Investment income
3 Direct investment income
4 Income on equity
5 Dividends and withdrawals
6 Reinvested earnings
7 Interest
8 U.S. parents’ receipts
9 U.S. affiliates’ receipts
10 Portfolio investment income
11 Income on equity and investment fund shares
12 Dividends on equity other than investment fund shares
13 Income attributable to investment fund shareholders
14 Interest on debt securities
15 Short term
16 Long term
17 Other investment income
18 Interest
19 Income attributable to insurance policyholders
20 Reserve asset income
21 Interest
22 Compensation of employees
Line Payments
23 Primary income payments
24 Investment income
25 Direct investment income
26 Income on equity
27 Dividends and withdrawals
28 Reinvested earnings
29 Interest
30 U.S. affiliates’ payments
31 U.S. parents’ payments
32 Portfolio investment income
33 Income on equity and investment fund shares
34 Dividends on equity other than investment fund shares
35 Income attributable to investment fund shareholders
36 Interest on debt securities
37 Short term
38 Long term
39 Other investment income
40 Interest
41 Income attributable to insurance policyholders
42 Compensation of employees
Line Balance
43 Balance on primary income
Line Addenda
44 Other investment interest income receipts before adjusting for FISIM
45 Other investment interest income payments before adjusting for FISIM
Departures from BPM6
13.3. The coverage and presentation of primary income closely follow recommendations from the International Monetary Fund (IMF) Balance of Payments and International Investment Position Manual, Sixth Edition (BPM6), particularly in the more detailed ITA tables 4.1–4.4. One departure is the absence of statistics for other primary income, which consists of rent for the use of natural resources and taxes less subsidies on products and production. Source data are not available that allow the separation of rental income from investment income. Cross-border taxes and subsidies
To Contents
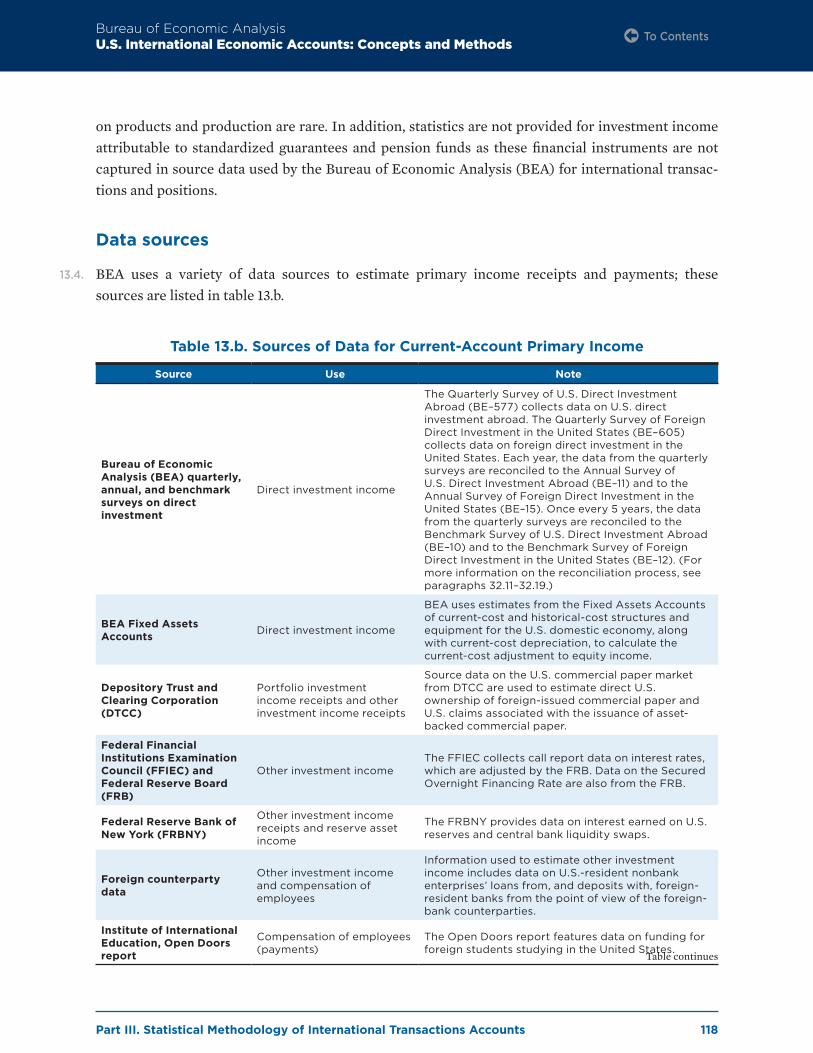
Part III. Statistical Methodology of International Transactions Accounts
Bureau of Economic AnalysisU.S. International Economic Accounts: Concepts and Methods
118
on products and production are rare. In addition, statistics are not provided for investment income attributable to standardized guarantees and pension funds as these financial instruments are not captured in source data used by the Bureau of Economic Analysis (BEA) for international transac-tions and positions.
Data sources
13.4. BEA uses a variety of data sources to estimate primary income receipts and payments; these sources are listed in table 13.b.
Table 13.b. Sources of Data for Current-Account Primary Income
Source Use Note
Bureau of Economic Analysis (BEA) quarterly, annual, and benchmark surveys on direct investment
Direct investment income
The Quarterly Survey of U.S. Direct Investment Abroad (BE–577) collects data on U.S. direct investment abroad. The Quarterly Survey of Foreign Direct Investment in the United States (BE–605) collects data on foreign direct investment in the United States. Each year, the data from the quarterly surveys are reconciled to the Annual Survey of U.S. Direct Investment Abroad (BE–11) and to the Annual Survey of Foreign Direct Investment in the United States (BE–15). Once every 5 years, the data from the quarterly surveys are reconciled to the Benchmark Survey of U.S. Direct Investment Abroad (BE–10) and to the Benchmark Survey of Foreign Direct Investment in the United States (BE–12). (For more information on the reconciliation process, see paragraphs 32.11–32.19.)
BEA Fixed Assets Accounts Direct investment income
BEA uses estimates from the Fixed Assets Accounts of current-cost and historical-cost structures and equipment for the U.S. domestic economy, along with current-cost depreciation, to calculate the current-cost adjustment to equity income.
Depository Trust and Clearing Corporation (DTCC)
Portfolio investment income receipts and other investment income receipts
Source data on the U.S. commercial paper market from DTCC are used to estimate direct U.S. ownership of foreign-issued commercial paper and U.S. claims associated with the issuance of asset-backed commercial paper.
Federal Financial Institutions Examination Council (FFIEC) and Federal Reserve Board (FRB)
Other investment incomeThe FFIEC collects call report data on interest rates, which are adjusted by the FRB. Data on the Secured Overnight Financing Rate are also from the FRB.
Federal Reserve Bank of New York (FRBNY)
Other investment income receipts and reserve asset income
The FRBNY provides data on interest earned on U.S. reserves and central bank liquidity swaps.
Foreign counterparty data
Other investment income and compensation of employees
Information used to estimate other investment income includes data on U.S.-resident nonbank enterprises’ loans from, and deposits with, foreign-resident banks from the point of view of the foreign-bank counterparties.
Institute of International Education, Open Doors report
Compensation of employees (payments)
The Open Doors report features data on funding for foreign students studying in the United States.
Table continues
To Contents

Part III. Statistical Methodology of International Transactions Accounts
Bureau of Economic AnalysisU.S. International Economic Accounts: Concepts and Methods
119
Source Use Note
International Monetary Fund (IMF) Reserve asset income
The IMF provides month-end position data and daily increases and decreases during each month, including interest flows, for the U.S. accounts at the IMF. The data include positions and transactions between the United States and the IMF for the Special Drawing Rights account and the General Resources (tranche) Account and its subaccounts covering securities, valuation adjustments, and IMF borrowing from the United States.
Morgan Stanley Capital International (MSCI), S&P Dow Jones Indices, and Intercontinental Exchange (ICE) Price Indexes
Portfolio investment income
These data include the dividend yield from the S&P 500, MSCI national and regional dividend yields for developed and emerging markets, and ICE bond prices indexes.
Pew Hispanic Center Compensation of employees
Statistics Canada Compensation of employees
U.S. Department of Agriculture, National Agricultural Statistics Service (NASS), Farm Labor Survey
Compensation of employees (payments) NASS conducts the Farm Labor Survey semiannually.
U.S. Department of Homeland Security, Office of Immigration Statistics
Compensation of employees
U.S. Department of Homeland Security, U.S. Immigration and Customs Enforcement, Student and Exchange Visitor Information System (SEVIS)
Education-related travelSEVIS is a web-based system for maintaining information on nonimmigrant students and exchange visitors in the United States.
U.S. Department of Labor, National Agricultural Workers Survey (NAWS)
Compensation of employees (payments)
The NAWS collects data biannually on the characteristics of temporary foreign workers in the United States.
U.S. Department of State, visa statistics
Compensation of employees (payments)
The statistics include data on counts of H–1B, H–1B1, E–3, H–2A, H–2B, L, Q, R, and TN visas issued.
U.S. Department of the Treasury, Foreign Credit Reporting System (FCRS)
Other investment income (receipts)
Data from the FCRS include U.S. government interest receipts from foreign residents.
U.S. Department of the Treasury, Internal Revenue Service (IRS)
Compensation of employeesThe IRS provides data from Form 2555 (“Foreign Earned Income”) and data on earnings of foreign artists and athletes.
U.S. Department of the Treasury, Treasury International Capital (TIC) system
Portfolio investment income and other investment income
TIC S, SLT, C, and B forms collect monthly data on U.S. resident-nonresident transactions and positions. The related SHC(A) and SHL(A) annual and benchmark surveys also collect information on transactions and positions. Data from the SHL(A) survey provide information on current interest yields on U.S. corporate, federally sponsored agency, and Treasury long-term debt securities; data from the SHC(A) survey provide information on current interest yields on long-term foreign debt securities. (For more information on the TIC reporting forms, see table 3.b in chapter 3.)
U.S. government agencies Other investment incomeU.S. government operating agencies submit data quarterly under Office of Management and Budget Statistical Directive No. 19.
To Contents
Part III. Statistical Methodology of International Transactions Accounts
Bureau of Economic AnalysisU.S. International Economic Accounts: Concepts and Methods
120
Estimation methods
13.5. Estimation methods vary significantly for the components of investment income and for com-pensation of employees. Direct investment income statistics are based largely on data reported on BEA’s direct investment surveys. Portfolio investment income, other investment income, and reserve asset income statistics are primarily derived by type of asset and liability as the product of positions from the IIP Accounts and effective yields. Compensation of employees statistics are based on a wide variety of sources and methods, including direct reporting by foreign central banks, counterpart statistical organizations, and international organizations, supplemented by esti-mates from various sources on numbers of employees and average compensation. These sources and methods are described below. Unless otherwise noted, descriptions of methods for primary income apply to both receipts and payments.
Investment income: direct investment income
13.6. Direct investment income receipts and payments measure the return that parents and affiliates receive on their direct investment equity and debt investments abroad or in the United States. In the ITAs, direct investment income consists of the parents’ shares of the earnings and losses from current operations of affiliates plus interest received and paid on intercompany debt. Income on equity, or earnings, includes both earnings distributed to parent companies and earnings reinvested in affiliates. The inclusion of reinvested earnings in direct investment income recognizes that the earnings of affiliates are income to parents, whether or not the earnings are distributed to parents. Interest is income received or paid on intercompany loans, trade credit, and other forms of debt between related parties.
13.7. Direct investment income is recorded on an asset/liability basis in the aggregate statistics. Recording direct investment income on an asset/liability basis is consistent with the recording of income for the other functional categories in the International Economic Accounts. It also facil-itates balance sheet analysis and is consistent with other macroeconomic statistics. On an asset/liability basis, direct investment income statistics are organized according to whether the income is earned on an asset or paid on a liability.
13.8. Direct investment income statistics by country or by industry, however, are presented on a direc-tional basis because that basis is better suited for analyzing certain aspects of direct investment, such as identifying the foreign countries in which U.S. multinational enterprises (MNEs) invest or the U.S. industries in which foreign direct investors invest. On the directional basis, direct invest-ment statistics in the current account are organized according to whether the direct investment is outward or inward—that is, whether the investor is a domestic resident or a foreign resident.
13.9. ITA tables 1.2 and 4.1 present direct investment income on an asset/liability basis, while ITA tables 1.3 and 1.4, which provide bilateral statistics, present direct investment income on a directional basis. ITA table 4.2 presents the translation from the asset/liability basis to the directional basis as well as detail on direct investment income by industry of the affiliate.
To Contents

Part III. Statistical Methodology of International Transactions Accounts
Bureau of Economic AnalysisU.S. International Economic Accounts: Concepts and Methods
121
13.10. On an asset/liability basis, U.S. receipts of direct investment income measure receipts on direct investment assets, whether those assets are held by U.S. parents or U.S. affiliates. Similarly, U.S. payments measure payments of direct investment income on liabilities, whether those liabilities are incurred by U.S. parents or U.S. affiliates. Thus, direct investment income receipts measure the return on U.S. direct investment assets. In contrast, on a directional basis, direct investment income receipts measure the return on U.S. direct investment abroad—that is, the U.S. parents’ return on their equity and debt investments in their foreign affiliates. On a directional basis, U.S. payments of direct investment income measure the return on foreign direct investment in the United States—that is, the foreign parents’ return on their equity and debt investments in their U.S. affiliates, plus the return of other members of the foreign parent group on their debt investments in their U.S. affiliates.
13.11. The published statistics represent the aggregation of income-related data items reported on BEA direct investment surveys by U.S. MNEs for U.S. direct investment abroad and by the U.S. affiliates of foreign MNEs for foreign direct investment in the United States. The following sections describe the methods used for each component of the direct investment income statistics presented in the ITA tables.
Income on equity
13.12. Direct investment income on equity, or earnings, represents parents’ shares in the net income of their affiliates, after provision for income taxes and excluding extraordinary gains and losses. A parent’s share in net income is based on its directly held equity interest in the affiliate; a parent’s directly held debt in the affiliate is not considered in determining the parent’s share because debt is not an indication of ownership. Debt instruments are, however, a major component of direct invest-ment. Direct investment income on equity is recorded as it accrues, in accordance with the accrual principles of accounting. Income on equity is recorded before deduction of withholding taxes on dividends. These taxes are treated as payable by the recipients of such income, even though as an administrative convenience, they may be withheld at the source.
13.13. Direct investment income on equity measures earnings from productive activities during the ref-erence period. This concept of income on equity is sometimes referred to as net operating earnings or net operating surplus. Because income on equity is related to current production, it excludes several items that may be included in financial accounting statements. Examples of such exclusions are (1) parents’ shares of capital gains and losses of affiliates, such as realized or unrealized gains and losses that result from the sale or other disposition of affiliates’ assets and liabilities; (2) real-ized gains or losses on plant and equipment that result from the closures of part or all of a business; (3) realized gains and losses on the sale or disposition of financial assets including investment secu-rities, except in cases where the affiliate is a market maker; (4) goodwill impairment; (5) restruc-turing costs that reflect write-downs or write-offs of assets; and (6) gains and losses from changes in the dollar value of foreign -currency-denominated assets and liabilities, or from the translation
To Contents

Part III. Statistical Methodology of International Transactions Accounts
Bureau of Economic AnalysisU.S. International Economic Accounts: Concepts and Methods
122
of affiliates’ financial statements from local currencies into dollars due to changes in exchange rates. These capital gains and losses are, however, included as valuation adjustments to outstanding assets and liabilities in the IIP Accounts.
13.14. A current-cost adjustment is made to measure direct investment income on equity at current (replacement) cost in the International Economic Accounts. The current-cost adjustment is also applied to the reinvested earnings component of income. The adjustment includes adjustments to the depreciation and depletion charges reported in the financial statements of affiliates. It adjusts depreciation to reflect current-period stocks of tangible capital and prices, and it excludes depletion charges. These adjustments are made primarily to ensure that these charges reflect cur-rent-period prices and to more closely align income earned in a given period with charges against income in the same period, as required by economic accounting principles. The current-cost adjustment converts depreciation charges valued for financial accounting purposes at historical cost (book value) to a current (replacement) cost valuation using depreciation rates implied for U.S. total structures and equipment in BEA’s Fixed Assets Accounts. The adjustment also adds charges for depletion of natural resources back to income because these charges are not treated as produc-tion costs in the U.S. National Economic Accounts. Estimates for the adjustments are available only on a global basis; estimates by country or by industry are not available because of a lack of appro-priate source data.
13.15. The two major components of direct investment income on equity are dividends and withdrawals and reinvested earnings.
13.16. Dividends and withdrawals. Dividends and withdrawals are distributed earnings allocated to the owners of a business for placing funds at the disposal of the business. For corporations, they repre-sent the payment of dividends to the owners of equity. They are the returns to the shareholders or owners. Although dividends are notionally paid out of the reference period’s earnings, corporations sometimes pay out more than reference period’s operating earnings by using the surplus earned in earlier periods and other times pay out less.
13.17. In addition to dividends from corporations, withdrawals from unincorporated affiliates are included in income on equity. These entities usually engage in the same type of economic and financial activities and maintain separate financial statements as do corporations, but they are not legally incorporated. Legally, they cannot distribute income as dividends. Nevertheless, the owner, or owners, may choose to withdraw some or all of the income earned by the affiliate. Some are enti-ties formally organized as trusts, partnerships, or other institutions that may formally distribute some or all of their earnings. From an economic point of view, the withdrawal of such income is equivalent to the distribution of corporate income through dividends and is treated the same way in the ITAs.
13.18. Stock dividends are excluded from dividends because they are not considered to represent the remittance of earnings; instead, they represent the capitalization of retained earnings and are
To Contents

Part III. Statistical Methodology of International Transactions Accounts
Bureau of Economic AnalysisU.S. International Economic Accounts: Concepts and Methods
123
an alternative to distributing cash dividends. Therefore, stock dividends are treated as income which is immediately reinvested. Liquidating dividends are also excluded from dividends because they represent a return of capital, not a remittance of earnings. Instead, liquidating dividends are treated as withdrawals of equity and are recorded in the financial account.
13.19. Dividends are recorded at the time they are either received from or entered into intercompany accounts with the affiliate, whichever occurs first. If all or part of the dividends are not transferred to the parent at the time they are entered into the intercompany accounts, the amount not trans-ferred is added to the stock of the parent’s debt instrument receivables. Withdrawals of income from unincorporated entities are recorded when they are withdrawn by their owners. Dividends and withdrawals of income are recorded before the deduction of withholding taxes. These taxes are treated as payable by recipients of such income.
13.20. Reinvested earnings. Reinvested earnings are the earnings that remain after distributions have been made to owners of the affiliate. Because reinvested earnings, or net savings, represent an addition to owners’ capital, an offsetting entry of equal magnitude is made in the direct investment component of the financial account. The offsetting entry is presented as reinvestment of earnings, and it is listed separately along with other equity and intercompany debt as components of owners’ investment in the affiliate.
13.21. Reinvested earnings are recorded in the period in which they accrue and are measured after deduction of income taxes charged on the income earned by the affiliate. Such taxes are payable by the affiliate and not by its owners. In the aggregate statistics, reinvested earnings are measured after the depreciation of fixed assets has been restated at current (replacement) cost and after the adjustments to depletion charges described above have been made.
13.22. Reinvested earnings can be negative when a direct investment affiliate has a loss on its operations or the dividends declared in a period are larger than net earnings in that period. If direct invest-ment generates negative earnings, the entry is shown as negative income receipts by the direct investor.
Interest
13.23. On an asset/liability basis, interest receipts and payments are recorded on a gross basis. U.S. direct investment interest receipts consist of U.S. parents’ receipts of interest from their foreign affiliates and U.S. affiliates’ receipts of interest from their foreign parent group, both before the deduction of withholding taxes. Likewise, U.S. interest payments on direct investment consist of U.S. parents’ interest payments to their foreign affiliates and U.S. affiliates’ interest payments to their foreign parent groups.
13.24. On a directional basis, interest receipts and payments are recorded on a net basis. Interest is income received by, or credited to, parents on intercompany debt owed to them by their affiliates,
To Contents

Part III. Statistical Methodology of International Transactions Accounts
Bureau of Economic AnalysisU.S. International Economic Accounts: Concepts and Methods
124
less interest paid or credited by parents on intercompany debt owed by them to their affiliates, both before the deduction of withholding taxes. Interest includes net interest on capitalized leases between parents and affiliates.
13.25. Table 13.c presents an example of the conversion of direct investment income on the asset/liabil-ity basis recommended by BPM6 to income on the directional basis recommended for classifying direct investment income by partner country and by industry.
Table 13.c. Direct Investment Income on the Asset/ Liability Basis and on the Directional Basis
13.26. Interest is recorded on an accrual basis—that is, interest is recorded as accruing continuously over time to the creditor on the amount of debt outstanding, in accordance with the principles of accrual accounting.
13.27. Interest received and paid on debt instruments excludes receivables and payables on intercompany debt between parents in the finance industry and affiliated financial institutions. This exclusion derives from the treatment in the financial accounts of intercompany debt transactions among cer-tain financial institutions. Under this treatment, the transactions are classified as other investment claims and liabilities rather than direct investment claims and liabilities because the nature of the
Receipts Millions of dollars
Primary income on direct investment, asset/liability basis 130
Income on equity 100
Dividends and withdrawals 75
Reinvested earnings 25
Interest 30
U.S. parents’ receipts 20
U.S. affiliates’ receipts 10
Less: Adjustments to convert to directional basis 25
U.S. parents’ interest payments 15
U.S. affiliates’ interest receipts 10
Equals: Primary income for outward direct investment (U.S. direct investment abroad), directional basis
105
Income on equity 100
Dividends and withdrawals 75
Reinvested earnings 25
Interest, net receipts 5
U.S. parents’ receipts 20
U.S. parents’ payments 15
Payments Millions of dollars
Primary income on direct investment, asset/liability basis 90
Income on equity 50
Dividends and withdrawals 30
Reinvested earnings 20
Interest 40
U.S. affiliates’ payments 25
U.S. parents’ payments 15
Less: Adjustments to convert to directional basis 25
U.S. parents’ interest payments 15
U.S. affiliates’ interest receipts 10
Equals: Primary income for inward direct investment (foreign direct investment in the United States), directional basis
65
Income on equity 50
Dividends and withdrawals 30
Reinvested earnings 20
Interest, net payments 15
U.S. affiliates’ payments 25
U.S. affiliates’ receipts 10
To Contents

Part III. Statistical Methodology of International Transactions Accounts
Bureau of Economic AnalysisU.S. International Economic Accounts: Concepts and Methods
125
transactions is related to the underlying activity of financial intermediation rather than to activity typical of a direct investment relationship. Therefore, the related interest received and paid on the debt is excluded from direct investment interest and included in other investment interest.
Investment income: portfolio investment income
13.28. Portfolio investment income consists of income received by U.S. and foreign investors who own equity and investment fund shares and debt securities that are included in the portfolio investment functional category. The published components are income on equity and investment fund shares and interest on debt securities. U.S. portfolio income receipts are income received by U.S. residents who own equity or debt securities issued by foreign governments or business enterprises. U.S. portfolio income payments are income paid to foreign residents who own equity or debt securities issued by the U.S. government, U.S. federally sponsored agencies, or U.S. business enterprises.
13.29. Receipts and payments of income on holdings of equity and debt securities are estimated by multi-plying average positions owned by investors by representative dividend or current interest yields. The methods for average positions and representative yields are described below.
Average positions
13.30. Average positions for U.S. and foreign short-term debt securities and for negotiable certificates of deposit (NCDs) are based on the positions reported in the monthly and quarterly Treasury Investment Capital (TIC) B and C forms. U.S. residents’ holdings of foreign commercial paper reported on the TIC BQ–1 form are supplemented by holdings estimated from the Depository Trust and Clearing Corporation (DTCC) data. Average positions for U.S. and foreign equity and long-term debt securities are based on data from the monthly TIC SLT form. BEA uses data from the annual SHC(A) survey and the benchmark SHL(A) survey to review and, if necessary, revise the average positions that are based on the SLT.
Interest yields
13.31. For interest on short-term debt securities and on NCDs, BEA uses representative U.S. money mar-ket and Eurodollar rates. Rates are matched to average positions estimated for these securities and NCDs based on the type of instrument.
13.32. For interest on long-term debt securities, BEA uses representative current yields that reflect cou-pon interest flows. This current yield is the same measure used for the U.S. National Income and Product Accounts (NIPAs). It also meets IMF guidelines, which recommend estimating interest on debt securities on a debtor basis, or the actual coupon payments made by debtors. Current yields are derived from the annual SHC(A) and benchmark SHL(A) surveys by dividing the reported annual coupon interest by the market value of the U.S. or foreign holdings of long-term debt securi-ties to obtain the current yield for the long-term debt securities reported in the surveys. In order to
To Contents

Part III. Statistical Methodology of International Transactions Accounts
Bureau of Economic AnalysisU.S. International Economic Accounts: Concepts and Methods
126
estimate a quarterly current yield between annual surveys when income data are not available, the most recent annual current yield is advanced by holding interest income constant and revaluing the market value of bond holdings by weighted average price indexes.
13.33. For income payments on U.S. Treasury Inflation-Protected Securities (TIPS), BEA estimates infla-tion compensation income, which is added to the coupon interest payments. BEA compiles infor-mation on TIPS issues held by all (U.S. and foreign) investors from Treasury data and calculates the value of all TIPS issues and the total amount of inflation compensation received by all investors. BEA estimates the inflation compensation received by foreign residents by multiplying the total inflation compensation received by all investors by the ratio of foreign holdings of TIPS from the SHL(A) survey to total investor holdings of TIPS.
13.34. For U.S. holdings of both foreign-currency-denominated and dollar-denominated foreign bonds, Intercontinental Exchange (ICE) price indexes, stated in dollar terms for five major currencies and one broad global index, are used to advance the market value of U.S. holdings and, implicitly, the current yields for each quarter between two annual surveys. The indexes are weighted by the distribution of currencies on the latest annual or benchmark survey.
13.35. For foreign holdings of U.S. bonds, ICE price indexes for U.S. Treasury, federally sponsored agency, and corporate bonds (denominated in both U.S. dollars and foreign currencies) are used to advance the market value of foreign holdings and, implicitly, the current yields for each quarter between two annual surveys.
Dividend yields
13.36. For U.S. holdings of foreign equities, BEA uses market dividend yields by major country and area. The dividend yields are Morgan Stanley Capital International index dividend yields stated in dollar terms. Seven country and two regional indexes are used for developed markets abroad, and three regional indexes are used for emerging markets abroad. The nine developed market yields are com-bined to create a weighted average yield for the developed markets. The weighted yield is applied to holdings of foreign equities, averaged over two quarter-end positions, for all developed countries to estimate dividend receipts. The three emerging market yields are combined to create a weighted average yield for emerging markets. The weighted yield is applied to holdings of foreign equities, averaged over two quarter-end positions, for all emerging market countries to estimate dividend receipts. The weights are based on the country distribution of holdings in the latest annual or benchmark TIC survey.
13.37. For foreign holdings of U.S. equities, the dividend yield is the yield on the S&P 500 index. It is multiplied by an average of two quarter-end positions to estimate dividend payments. Only a single index is necessary because the composition of holdings in the annual and benchmark TIC surveys is very similar to the composition of equities included in the S&P 500 index.
To Contents

Part III. Statistical Methodology of International Transactions Accounts
Bureau of Economic AnalysisU.S. International Economic Accounts: Concepts and Methods
127
Investment income: other investment income
13.38. Other investment income consists of income received by U.S. and foreign residents who own finan-cial assets such as loans, deposits, insurance technical reserves, and trade credit and advances that are included in the other investment functional category. The published components are interest and income attributable to insurance policyholders. U.S. other investment income receipts include income received by U.S. residents on loans to foreign residents, including resale agreements; exten-sions of trade credit and advances to foreign residents; deposits in foreign banks, including resale agreements; and claims on insurance technical reserves of foreign-resident insurance companies. U.S. other investment income payments include income paid to foreign residents on loans to U.S. residents, including repurchase agreements; extensions of trade credit and advances to U.S. resi-dents; deposits in U.S. banks, including repurchase agreements; and claims on insurance technical reserves of U.S.-resident insurance companies.
13.39. Other investment income is a broad category with statistics based on several sources and methods. Some components are from reports provided by the Federal Reserve Board (FRB) and by U.S. gov-ernment operating agencies under Office of Management and Budget (OMB) Statistical Directive No. 19. Other components are derived by multiplying average positions by representative yields.
13.40. Income receipts and payments associated with loans, deposits, and trade credit and advances for which the U.S. party to the transaction is a business enterprise are mostly estimated by multiplying average positions held by investors by representative interest yields. U.S. financial and nonfinancial business enterprises report their claims and liabilities for these types of assets on the TIC B and C forms. Loans and deposits are reported on both the B and C forms. Trade credit and advances are separately identified in the TIC system only on the C forms (form CQ–2). BEA supplements TIC C form data on deposits and loans with partner country data on claims and liabilities of foreign banks.
13.41. The recognition that interest rates sometimes reflect a service charge component—as reflected by the fact that rates on some loans are typically higher than rates on some deposits—points to a divergence between the “monetary interest” paid and received on loans and deposits and the “pure interest” that reflects interest without a service charge component. For loans, monetary interest typically exceeds pure interest; for deposits, pure interest typically exceeds monetary interest. The difference between monetary interest and pure interest reflects financial intermediation services indirectly measured (FISIM) (see paragraphs 12.89 and 12.90). Pure interest is measured using a reference rate representing the cost of funds to the lender or deposit-taker.
13.42. Prior to the 2020 annual update, BEA’s other investment income statistics reflected monetary interest for all interest income. With the 2020 annual update, interest income statistics reflect pure interest—that is, with an adjustment for FISIM—for loans provided by banks to nonbank customers and for deposits by nonbank customers at banks, except in cases where the customer and the bank are affiliated. (The use of monetary interest, and the related absence of an adjustment for FISIM,
To Contents

Part III. Statistical Methodology of International Transactions Accounts
Bureau of Economic AnalysisU.S. International Economic Accounts: Concepts and Methods
128
for loans provided by nonbank financial institutions and for deposits at such institutions departs from BPM6 guidelines—see paragraph 12.90 for more information.) Other investment interest income before adjusting for FISIM is presented in the addenda section of ITA table 4.1.
Deposit, loan, and repurchase/resale agreement interest rates
13.43. For deposits and loans other than repurchase/resale agreements, BEA calculates “book” interest rates from call reports collected by the Federal Financial Institutions Examination Council. The call report data are adjusted by the FRB to account for the impact on the data of bank mergers. The reference rate for deposits and loans is based on an average of the 5-year U.S. Treasury rate and a composite Treasury rate computed from the call reports.
13.44. For repurchase/resale agreements, interest rates are based on the Secured Overnight Financing Rate (SOFR) from the FRB. The use of the SOFR reflects the short-term length of these contracts. For these contracts, the reference rate is the median SOFR. For repurchase/resale agreements reflecting deposits placed by a nonbank customer in a bank, the 25th percentile of the SOFRs reported by the FRB is used as the monetary interest rate. For agreements reflecting loans from a bank to a nonbank customer, the 75th percentile of the SOFRs is used as the monetary interest rate.
Interest on deposits, loans, and repurchase/resale agreements
13.45. Pure interest, instead of monetary interest, is included in other investment income when FISIM (reflecting services provided by a U.S. or foreign bank to an unaffiliated nonbank customer) is recorded in the trade in services accounts or when it is assumed that no financial service is charged because the debtor and the creditor are affiliated or are both banks. Monetary interest is included in other investment income when both the creditor and the debtor are nonbanks. For example, securities brokers reporting on the TIC B forms provide loans, deposit-like instruments, known as brokerage balances, and repurchase agreements to their customers. No FISIM is estimated for financial intermediation by securities brokers. The interest paid by customers to securities brokers and the interest received by customers from securities brokers is monetary interest.
13.46. Pure interest on deposits and loans is calculated using the reference rates described above. Pure interest receipts are estimated on bank-reported deposit, loan, and resale agreement claims from TIC B forms, on U.S. nonbank deposit and resale claims on foreign banks from TIC C forms, on loan claims from the DTCC, on loan claims from the Foreign Credit Reporting System, and on U.S. nonbank claims on foreign banks from partner country data. Pure interest payments are estimated on bank-reported deposit, loan, and repurchase agreement liabilities from TIC B forms, on U.S. nonbank loan and repurchase agreement liabilities to foreign banks from TIC C forms, and on U.S. nonbank liabilities to foreign banks from partner country data.
13.47. Monetary interest on deposits and loans other than repurchase/resale agreements is calculated by multiplying outstanding positions for these loans and deposits by their respective book rates.
To Contents

Part III. Statistical Methodology of International Transactions Accounts
Bureau of Economic AnalysisU.S. International Economic Accounts: Concepts and Methods
129
Monetary interest on repurchase/resale agreements included in deposits and loans is calculated by multiplying outstanding amounts of these agreements by their respective SOFRs (25th or 75th percentile rates).
Interest on trade credit and advances
13.48. U.S. nonfinancial enterprises report their claims and liabilities from trade credit and advances vis-à-vis unaffiliated foreign residents on the CQ-2 form. BEA statistics on receipts and payments of trade credit and advances are calculated by multiplying average positions from the CQ-2 form by the monetary loan rate.
Interest on U.S. government and central bank assets and liabilities
13.49. U.S. government interest income receipts earned on outstanding U.S. government credits extended to foreign residents are reported quarterly to BEA by U.S. government operating agencies under OMB Statistical Directive No. 19. Receipts include capitalized interest, which is reported as having been realized through the recording of an additional credit utilization, which, in turn, increases principal indebtedness outstanding. Except for capitalized interest, receipts are recorded on a cash collection basis or when the debtor delivers goods or services to U.S. operating agencies. Collections of commitment fees for credits extended by U.S. government operating agencies are included indistinguishably with these interest receipts.
13.50. U.S. government debt is mainly in the form of debt securities, so it does not pay interest to foreign residents on loans, deposits, or trade credit and advances. The U.S. government does pay interest to the IMF on allocations of Special Drawing Rights (SDRs), which are reserve-related liabilities on the books of the Exchange Stabilization Fund of the U.S. Department of the Treasury (Treasury Department). Monthly reports of interest payments are made available to BEA through the IMF accounting department.
13.51. Beginning in December 2007, the FRB provided dollar funding to foreign central banks through temporary central bank liquidity swaps, which do not meet the definition of a reserve asset. Under these arrangements, foreign central banks sold their currencies to the FRB in exchange for dollars. The foreign currency received by the FRB remained on deposit at the foreign central bank until the swap was reversed, creating a U.S. asset that earned interest. The Federal Reserve Bank of New York (FRBNY) reports these interest receipts monthly to BEA on a cash-received basis.
Income attributable to insurance policy holders
13.52. Other investment income attributable to insurance policy holders, which is also known as insur-ance premium supplements, is income that accrues to the owners of insurance policies from insurance company reserves (“technical reserves”) that are accumulated from premiums paid by insurance policy owners. Insurance policy owners benefit from the income on the reserves through lower premiums because of the investment income that insurance companies receive from holding
To Contents

Part III. Statistical Methodology of International Transactions Accounts
Bureau of Economic AnalysisU.S. International Economic Accounts: Concepts and Methods
130
reserves. These implicitly charged services are included in the insurance services component of services, and an offsetting entry is made in other investment income receipts or payments. Statistics for investment income paid to foreign policy owners by U.S. insurance companies and for invest-ment income received by U.S. policy owners from foreign insurance companies are based on BEA insurance services surveys and industry data (see paragraphs 12.73–12.74 for more information).
Investment income: reserve asset income
13.53. U.S. monetary authorities invest U.S. foreign currency reserves in a variety of instruments that yield market rates of return and that have a high degree of liquidity and credit quality. To the greatest extent practicable, the investments are split evenly between the System Open Market Account of the FRB and the Treasury Department’s Exchange Stabilization Fund.
13.54. A significant portion of the U.S. monetary authorities’ foreign exchange reserves is usually invested on an outright basis in German, French, Dutch, and Japanese government securities. Foreign currency reserves are also invested at official institutions such as the Bank for International Settlements and foreign central banks. The FRBNY reports interest receipts from these reserve assets monthly to BEA on a cash-received basis.
13.55. U.S. reserve assets also include the U.S. reserve position at the IMF and SDRs held in the U.S. SDR account at the IMF. The IMF pays interest on these U.S. assets. Monthly reports of interest receipts are made available to BEA through the IMF accounting department.
Compensation of employees
13.56. Compensation of employees receipts cover earnings of (1) U.S. residents employed temporarily abroad, (2) U.S. residents employed by foreign governments in the United States, and (3) U.S. resi-dents employed by international organizations in the United States.
13.57. Compensation of employees payments cover earnings of (1) Canadian and Mexican workers who commute to work in the United States, (2) foreign students studying at colleges and universities in the United States, (3) foreign professionals temporarily residing in the United States, (4) foreign temporary agricultural workers in the United States, (5) foreign temporary nonagricultural work-ers in the United States, and (6) foreign nationals working for U.S. diplomatic missions abroad.
13.58. Compensation receipts and payments, which are recorded before the deduction of U.S. and foreign income taxes, are based on a variety of methods and on source data from foreign statistical author-ities, the Internal Revenue Service (IRS), and various demographic and labor market data from the National Agricultural Statistics Service (NASS), the U.S. Department of State (State Department), the U.S. Department of Homeland Security (DHS), and the U.S. Department of Labor (Labor Department).
To Contents
Part III. Statistical Methodology of International Transactions Accounts
Bureau of Economic AnalysisU.S. International Economic Accounts: Concepts and Methods
131
Compensation receipts
13.59. U.S. residents employed temporarily abroad. Estimates for the earnings of U.S. residents employed in Germany, Canada, and the United Kingdom are based on data from the Deutsche Bundesbank, Statistics Canada, and the United Kingdom’s Office of National Statistics, respectively. Estimates of U.S. residents’ earnings abroad for countries other than Germany, Canada, and the United Kingdom are derived as a fixed ratio of total income earned in each country by U.S. citizens and resident aliens. The estimates of total income by country are based on data from IRS Form 2555 (“Foreign Earned Income”).
13.60. U.S. residents employed by foreign governments in the United States. Earnings are estimated by multiplying the number of U.S. residents employed by average compensation, with the exception of Canada, for which Statistics Canada provides an estimate of earnings of U.S. residents employed by the Canadian government installations in the United States. Estimates for countries other than Canada are based on data on the number of foreign diplomats in the United States from the State Department, on estimates of their average compensation, and on a study of the relationship between the number and compensation of foreign diplomats and U.S. residents employed by for-eign embassies.
13.61. U.S. residents employed by international organizations in the United States. This item mea-sures earnings of U.S. residents, including foreign nationals, employed by international organiza-tions in the United States. Foreign nationals employed by international organizations in the United States are considered U.S. residents. Earnings are estimated by multiplying the number of U.S. res-idents employed by average compensation. Estimates are based on annual reports of international organizations.
Compensation payments
13.62. Canadian and Mexican workers who commute to work in the United States. This item measures the compensation of Mexican and Canadian residents who commute to jobs in the United States. Employment of Mexican residents who commute to work in the United States is generally limited to the U.S.-Mexican border area; employment of Canadian residents who commute to work in the United States is mostly along the U.S.-Canadian border. The proximity of the households to the places of employment permits daily trips to and from work across the border. Estimates of compen-sation of Mexican workers are based on academic and other studies and are extrapolated forward each year. Estimates of compensation of Canadian residents working in the United States are based on data provided to BEA by Statistics Canada that are extrapolated forward each year.
13.63. Foreign students studying in the United States. This item measures wages earned by foreign students studying in the United States. Compensation to foreign students is measured as the prod-uct of education-related travel exports (which use the Student and Exchange Visitor Information System (SEVIS) as a primary data source—see paragraph 12.61) for a subset of travelers and an esti-mate of the share of students’ spending that is funded by compensation. Education-related travel
To Contents
Part III. Statistical Methodology of International Transactions Accounts
Bureau of Economic AnalysisU.S. International Economic Accounts: Concepts and Methods
132
estimates used in the calculation of compensation to foreign students exclude exports to primary and secondary students because it is assumed these students are not employed while studying in the United States. The estimate of the share of spending funded by compensation is based on data on foreign students’ primary sources of funding for studying in the United States from the Institute of International Education (IIE) Open Doors report.
13.64. Foreign professionals temporarily residing in the United States. This item measures the com-pensation of foreign professionals temporarily residing in the United States, including artists, athletes, managers, workers with specialized knowledge, consultants, and teachers. Estimates are based on State Department statistics on visas issued to foreign professionals and average wage rates reported by employers to the Labor Department’s Office of Foreign Labor Certification (OFLC), supplemented by data on earnings of foreign artists and athletes from the IRS.
13.65. Foreign temporary agricultural workers in the United States. This item measures the com-pensation of foreign temporary agricultural workers in the United States. Estimates cover both documented and undocumented workers—that is, workers who are in the United States with no work authorization—who are employed temporarily in the United States to assist in the growing and harvesting of crops. The primary residence of these workers is usually Mexico and other Latin American countries.
13.66. The estimates are based on biennial data from the Labor Department’s National Agricultural Workers Survey (NAWS), H–2A visa counts from State Department visa statistics, and data from NASS’s Farm Labor Survey. The NAWS is an employment-based, random-sample survey of U.S. crop workers that collects demographic, employment, and health data in face-to-face interviews. The Farm Labor Survey is conducted semiannually in April and October, in all surveyed states except California, where it is conducted quarterly.
13.67. Foreign temporary nonagricultural workers. This item measures the compensation of foreign temporary nonagricultural workers in the United States, excluding foreign professionals. Estimates cover both documented and undocumented workers. The primary residence of these workers is usually Mexico and other Latin American countries. Compensation is calculated by multiplying the number of foreign temporary nonagricultural workers by their annual employment in hours and their average hourly wage.
13.68. The number of documented temporary nonagricultural workers is obtained from H–2B visa counts from State Department visa statistics. The number of undocumented temporary nonagricultural workers is calculated by adding (1) an estimate of the undocumented immigrant population in the U.S. civilian labor force based on data from the Office of Immigration Statistics and the Pew Hispanic Center and (2) an estimate of the share of those who are temporary workers based on information from the NAWS.
To Contents

Part III. Statistical Methodology of International Transactions Accounts
Bureau of Economic AnalysisU.S. International Economic Accounts: Concepts and Methods
133
13.69. Annual employment is estimated at approximately 1,000 hours. The average wage rate for undocu-mented workers is based on wage rates for occupations commonly filled by this group and various studies about undocumented workers. The wage rate for documented workers is based on informa-tion on the occupational distribution of H–2B visa holders from the OFLC and wage rates from the U.S. Bureau of Labor Statistics (BLS) for occupations filled by H–2B visa holders.
13.70. Foreign nationals working for U.S. diplomatic missions abroad. This item measures the com-pensation of foreign nationals employed directly by U.S. diplomatic missions abroad. Estimates are based on data reported to BEA quarterly by the State Department.
13.71. Tables 13.d and 13.e summarize the data sources and methods used to estimate the various compo-nents of receipts and payments of compensation of employees.
Table 13.d. Data Sources Used to Estimate Receipts of Compensation of Employees
Direct estimation Estimation through multiplication1
Earnings Employee counts Wages or average earnings
U.S. residents employed temporarily abroad
• Deutsche Bundesbank• Statistics Canada• United Kingdom Office of
National Statistics• Modeled estimates based
on IRS Form 2555 data
n.a. n.a.
U.S. residents employed by foreign governments in the United States
• Statistics Canada • Modeled estimates based on State Department data
• Labor Department BLS Employment Cost Index
U.S. residents employed by international organizations in the United States
n.a. • International organizations • International organizations
n.a. Not applicableBLS Bureau of Labor StatisticsIRS Internal Revenue Service
1. Estimation through multiplication involves calculating earnings by multiplying an estimate of the number of employees by an estimate of the average earnings of employees.
To Contents
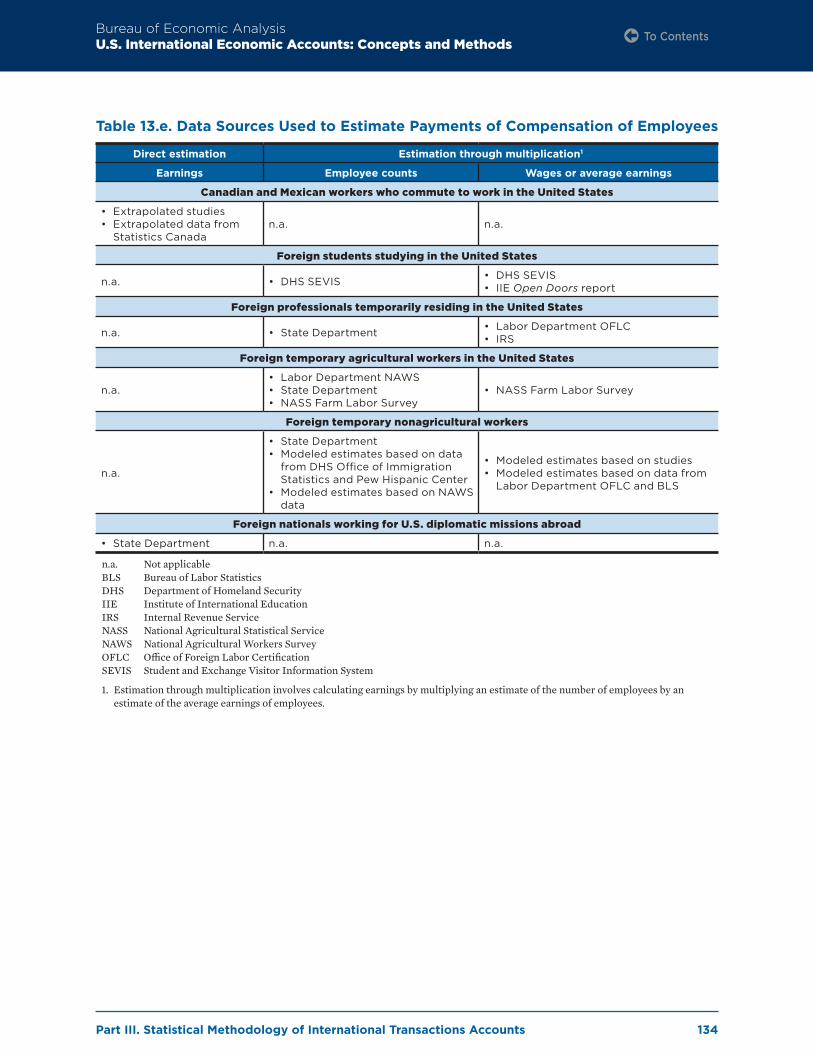
Part III. Statistical Methodology of International Transactions Accounts
Bureau of Economic AnalysisU.S. International Economic Accounts: Concepts and Methods
134
Table 13.e. Data Sources Used to Estimate Payments of Compensation of Employees
Direct estimation Estimation through multiplication1
Earnings Employee counts Wages or average earnings
Canadian and Mexican workers who commute to work in the United States
• Extrapolated studies• Extrapolated data from
Statistics Canadan.a. n.a.
Foreign students studying in the United States
n.a. • DHS SEVIS • DHS SEVIS• IIE Open Doors report
Foreign professionals temporarily residing in the United States
n.a. • State Department • Labor Department OFLC• IRS
Foreign temporary agricultural workers in the United States
n.a.• Labor Department NAWS• State Department• NASS Farm Labor Survey
• NASS Farm Labor Survey
Foreign temporary nonagricultural workers
n.a.
• State Department• Modeled estimates based on data
from DHS Office of Immigration Statistics and Pew Hispanic Center
• Modeled estimates based on NAWS data
• Modeled estimates based on studies• Modeled estimates based on data from
Labor Department OFLC and BLS
Foreign nationals working for U.S. diplomatic missions abroad
• State Department n.a. n.a.
n.a. Not applicableBLS Bureau of Labor StatisticsDHS Department of Homeland SecurityIIE Institute of International EducationIRS Internal Revenue ServiceNASS National Agricultural Statistical ServiceNAWS National Agricultural Workers SurveyOFLC Office of Foreign Labor CertificationSEVIS Student and Exchange Visitor Information System
1. Estimation through multiplication involves calculating earnings by multiplying an estimate of the number of employees by an estimate of the average earnings of employees.
To Contents

Part III. Statistical Methodology of International Transactions Accounts
Bureau of Economic AnalysisU.S. International Economic Accounts: Concepts and Methods
135
Chapter 14. Current-Account Secondary Income
Concepts and coverage
14.1. Secondary income presents current transfers between residents and nonresidents. Unlike an exchange, a transfer is a transaction in which a good, service, or asset is provided without a corre-sponding return of economic value. Current transfers directly affect the level of disposable income and savings and influence the consumption of goods or services in both the donor and recipient countries. Entries for current transfers in the International Transactions Accounts (ITAs) offset transactions with nonresidents that involve real resources or financial assets recorded in the goods, services, income, or financial accounts. Capital transfers are presented in the capital account.
14.2. Secondary income receipts and payments are further classified and presented in ITA table 5.1 and shown below in table 14.a. Both receipts and payments are distinguished between general gov-ernment transfers and private transfers based on the type of U.S. entity receiving or providing the transfer. For some types of transfers, such as international cooperation, both receipts and payments are categorized in general government transfers because government entities receive and provide the transfer. For other types of transfers, such as insurance-related transfers, both receipts and pay-ments are categorized in private transfers because private entities receive and provide the trans-fer. The remainder of the transfer types, such as taxes on income, wealth, etc. and social benefits (which are reported separately for payments but included indistinguishably as part of other private transfers for receipts), involve transfers between governments and private households or institu-tions; these transfer types are shown in general government transfers for receipts and in private transfers for payments or vice versa.
To Contents
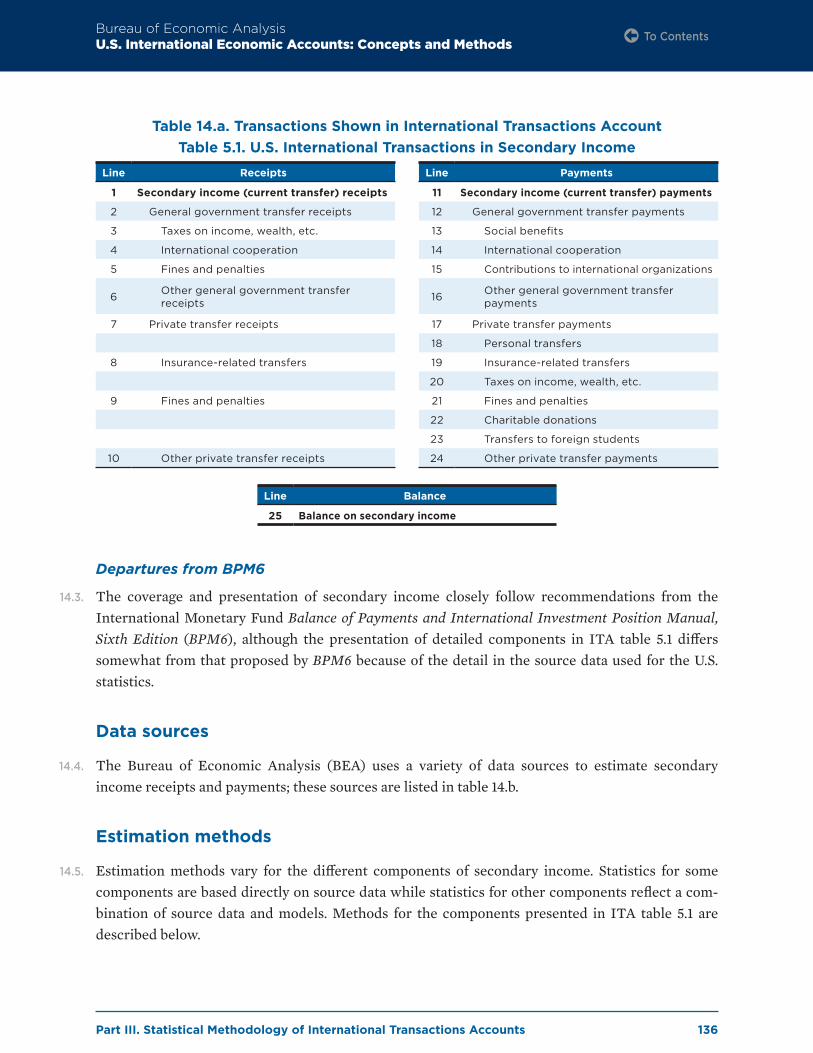
Part III. Statistical Methodology of International Transactions Accounts
Bureau of Economic AnalysisU.S. International Economic Accounts: Concepts and Methods
136
Table 14.a. Transactions Shown in International Transactions Account Table 5.1. U.S. International Transactions in Secondary Income
Departures from BPM6
14.3. The coverage and presentation of secondary income closely follow recommendations from the International Monetary Fund Balance of Payments and International Investment Position Manual, Sixth Edition (BPM6), although the presentation of detailed components in ITA table 5.1 differs somewhat from that proposed by BPM6 because of the detail in the source data used for the U.S. statistics.
Data sources
14.4. The Bureau of Economic Analysis (BEA) uses a variety of data sources to estimate secondary income receipts and payments; these sources are listed in table 14.b.
Estimation methods
14.5. Estimation methods vary for the different components of secondary income. Statistics for some components are based directly on source data while statistics for other components reflect a com-bination of source data and models. Methods for the components presented in ITA table 5.1 are described below.
Line Receipts
1 Secondary income (current transfer) receipts
2 General government transfer receipts
3 Taxes on income, wealth, etc.
4 International cooperation
5 Fines and penalties
6 Other general government transfer receipts
7 Private transfer receipts
8 Insurance-related transfers
9 Fines and penalties
10 Other private transfer receipts
Line Payments
11 Secondary income (current transfer) payments
12 General government transfer payments
13 Social benefits
14 International cooperation
15 Contributions to international organizations
16 Other general government transfer payments
17 Private transfer payments
18 Personal transfers
19 Insurance-related transfers
20 Taxes on income, wealth, etc.
21 Fines and penalties
22 Charitable donations
23 Transfers to foreign students
24 Other private transfer payments
Line Balance
25 Balance on secondary income
To Contents
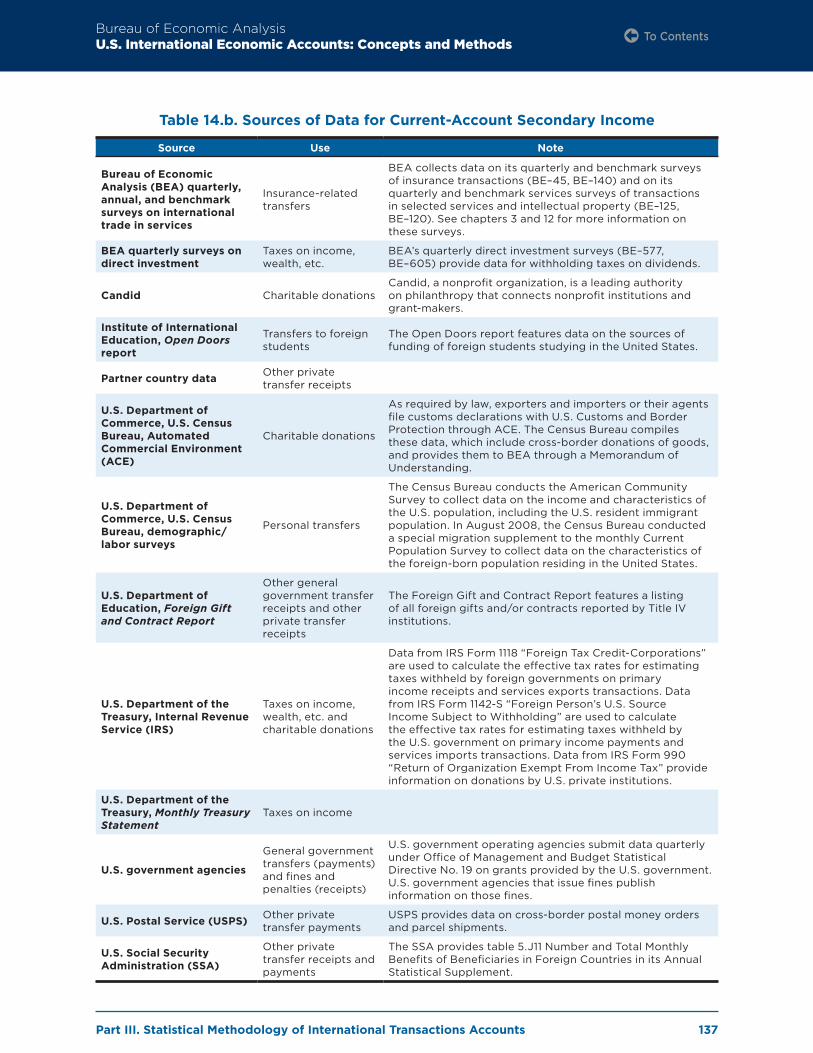
Part III. Statistical Methodology of International Transactions Accounts
Bureau of Economic AnalysisU.S. International Economic Accounts: Concepts and Methods
137
Table 14.b. Sources of Data for Current-Account Secondary Income
Source Use Note
Bureau of Economic Analysis (BEA) quarterly, annual, and benchmark surveys on international trade in services
Insurance-related transfers
BEA collects data on its quarterly and benchmark surveys of insurance transactions (BE–45, BE–140) and on its quarterly and benchmark services surveys of transactions in selected services and intellectual property (BE–125, BE–120). See chapters 3 and 12 for more information on these surveys.
BEA quarterly surveys on direct investment
Taxes on income, wealth, etc.
BEA’s quarterly direct investment surveys (BE–577, BE–605) provide data for withholding taxes on dividends.
Candid Charitable donationsCandid, a nonprofit organization, is a leading authority on philanthropy that connects nonprofit institutions and grant-makers.
Institute of International Education, Open Doors report
Transfers to foreign students
The Open Doors report features data on the sources of funding of foreign students studying in the United States.
Partner country data Other private transfer receipts
U.S. Department of Commerce, U.S. Census Bureau, Automated Commercial Environment (ACE)
Charitable donations
As required by law, exporters and importers or their agents file customs declarations with U.S. Customs and Border Protection through ACE. The Census Bureau compiles these data, which include cross-border donations of goods, and provides them to BEA through a Memorandum of Understanding.
U.S. Department of Commerce, U.S. Census Bureau, demographic/labor surveys
Personal transfers
The Census Bureau conducts the American Community Survey to collect data on the income and characteristics of the U.S. population, including the U.S. resident immigrant population. In August 2008, the Census Bureau conducted a special migration supplement to the monthly Current Population Survey to collect data on the characteristics of the foreign-born population residing in the United States.
U.S. Department of Education, Foreign Gift and Contract Report
Other general government transfer receipts and other private transfer receipts
The Foreign Gift and Contract Report features a listing of all foreign gifts and/or contracts reported by Title IV institutions.
U.S. Department of the Treasury, Internal Revenue Service (IRS)
Taxes on income, wealth, etc. and charitable donations
Data from IRS Form 1118 “Foreign Tax Credit-Corporations” are used to calculate the effective tax rates for estimating taxes withheld by foreign governments on primary income receipts and services exports transactions. Data from IRS Form 1142-S “Foreign Person’s U.S. Source Income Subject to Withholding” are used to calculate the effective tax rates for estimating taxes withheld by the U.S. government on primary income payments and services imports transactions. Data from IRS Form 990 “Return of Organization Exempt From Income Tax” provide information on donations by U.S. private institutions.
U.S. Department of the Treasury, Monthly Treasury Statement
Taxes on income
U.S. government agencies
General government transfers (payments) and fines and penalties (receipts)
U.S. government operating agencies submit data quarterly under Office of Management and Budget Statistical Directive No. 19 on grants provided by the U.S. government. U.S. government agencies that issue fines publish information on those fines.
U.S. Postal Service (USPS) Other private transfer payments
USPS provides data on cross-border postal money orders and parcel shipments.
U.S. Social Security Administration (SSA)
Other private transfer receipts and payments
The SSA provides table 5.J11 Number and Total Monthly Benefits of Beneficiaries in Foreign Countries in its Annual Statistical Supplement.
To Contents

Part III. Statistical Methodology of International Transactions Accounts
Bureau of Economic AnalysisU.S. International Economic Accounts: Concepts and Methods
138
General government transfers receipts
14.6. This component includes taxes on income, wealth, etc.; international cooperation; fines and penal-ties; and other general government transfer receipts.
Taxes on income, wealth, etc.
14.7. Taxes on income, wealth, etc. represent withholding taxes collected by the U.S. government on interest and dividend income arising from nonresident holdings of portfolio investment assets in the United States and from the distribution of earnings on foreign direct investment in the United States, on services transactions, on foreign source income of nonresident U.S. citizens, and on com-pensation earned by nonresidents temporarily employed in the United States. Entries for trans-actions upon which these taxes are withheld are recorded prior to the withholding of taxes. That is, these primary income and services transactions are recorded gross of withholding taxes. The withholding taxes recorded in general government transfers serve to net out (or offset) the portion of the services imports and primary income payments not available for use by nonresidents. For securities, withholding taxes for both dividends and interest are based on data from the Internal Revenue Service (IRS). For direct investment, withholding taxes on dividends are reported on BEA direct investment surveys, and withholding taxes on interest and royalties are based on IRS data. For services and compensation, estimates are based on IRS data, BEA services surveys, and BEA research. For taxes on foreign source income of nonresident U.S. citizens, estimates are based on data from the U.S. Department of the Treasury’s Monthly Treasury Statement.
International cooperation
14.8. International cooperation represents cash settlements for (1) grants previously provided to foreign residents, (2) returns of equipment previously transferred, (3) foreign currencies provided to offset U.S. expenditures under foreign assistance programs, and (4) goods and services provided under mutual assistance programs that require the receiver to extend assistance to the United States or other countries to achieve a common objective. Statistics are based on data submitted quarterly by U.S. government agencies under Office of Management and Budget (OMB) Statistical Directive No. 19.
Fines and penalties
14.9. Fines and penalties are monetary amounts paid by foreign corporations and individuals to the U.S. government for violations of U.S. laws including antitrust and environmental laws, the U.S. Foreign Corrupt Practices Act, banking regulations, and others. Statistics are compiled by BEA using data from U.S. government agencies, U.S. courts, other public documents, and media reports.
Other general government transfer receipts
14.10. Other general government transfer receipts include foreign gifts to U.S. public institutions of higher learning. Source data for these gifts come from the U.S. Department of Education’s (DOE) Foreign Gift and Contract Report.
To Contents

Part III. Statistical Methodology of International Transactions Accounts
Bureau of Economic AnalysisU.S. International Economic Accounts: Concepts and Methods
139
Private transfers receipts
14.11. Private transfers receipts include insurance-related transfers, fines and penalties, and other private transfer receipts.
Insurance-related transfers
14.12. The entry for insurance-related transfers is the offsetting entry to the adjustment for insurance claims volatility made to insurance services. (This adjustment is described in paragraph 14.33 as a component of secondary income payments.)
Fines and penalties
14.13. Fines and penalties represent amounts paid by foreign corporations and individuals to U.S. resi-dents mostly from class action settlements and other violations of U.S. laws. Statistics are compiled by BEA using data from U.S. government agencies, U.S. courts, other public documents, and media reports.
Other private transfer receipts
14.14. Other private transfer receipts include (1) pensions, inheritances, and other benefits received by U.S. residents from residents and governments in Canada, Germany, and the United Kingdom and personal transfers paid to U.S. residents by nonresidents; (2) foreign gifts to U.S. private institu-tions of higher learning; (3) transfers from Germany associated with World War II indemnification claims of U.S. residents; and (4) personal transfers from U.S. expatriate retirees to U.S. residents. Source data for pensions, inheritances, and other benefits are from Statistics Canada, the Deutsche Bundesbank, and the Office for National Statistics of the United Kingdom. Source data for these transfers from other countries are not available. Source data for foreign gifts are from the DOE’s Foreign Gift and Contract Report. Source data for indemnification claims are from the Deutsche Bundesbank. Source data for personal transfers from U.S. expatriate retirees to U.S. residents are from the U.S. Social Security Administration (SSA) table 5.J11 Number and Total Monthly Benefits of Beneficiaries in Foreign Countries, published in SSA’s Annual Statistical Supplement.
General government transfers (payments)
14.15. This component includes social benefits, international cooperation, contributions to international organizations, and other general government transfer payments. Statistics for these subcompo-nents are based on data submitted quarterly by U.S. government operating agencies under OMB Statistical Directive No. 19.
Social benefits
14.16. Social benefits include (1) payments of social security, railroad retirement, and other social insurance benefits to eligible persons residing abroad and (2) payments under retirement and
To Contents

Part III. Statistical Methodology of International Transactions Accounts
Bureau of Economic AnalysisU.S. International Economic Accounts: Concepts and Methods
140
compensation programs for former U.S. government civilian employees, military personnel, and veterans residing abroad, including the cost of providing medical services abroad under Veterans Benefits Administration programs.
International cooperation
14.17. International cooperation covers the use of U.S. government financing to transfer real resources or financial assets to foreigners, except international organizations, under programs enacted by the U.S. Congress for the provision of nonmilitary and military foreign assistance (grants) for which no repayment is expected. Also included are transfers under assistance programs for which repayment terms are indeterminate at the time of the transfer and subject to future settlement. These types of assistance are recorded as payments in the period rendered. Subsequently, when settlement for the assistance is agreed upon, the terms may call for a cash settlement, which are included as general government transfer receipts.
14.18. Excluded from international cooperation are investment grants—that is, grants of capital equip-ment, such as transport equipment, machinery, and military weapons, and cash grants for purposes of gross fixed capital formation, which are often tied to specific investments projects, such as large construction projects. Investment grants represent capital transfers and are included in capital- account payments. The discussion of nonmilitary and military grants that follows describes both the noninvestment grants included in international cooperation payments and the investment grants included in capital transfer payments.
14.19. U.S. government nonmilitary grants payments measure the financing of goods delivered, services rendered, or cash disbursed by U.S. nonmilitary agencies to foreign countries under programs enacted by the U.S. Congress to authorize the provision of nonmilitary assistance for which no repayment is expected or for which repayment terms are indeterminate.
14.20. U.S. government nonmilitary grants payments include (1) funds advanced to finance sales to for-eign governments and to release foreign governments from their contractual liabilities to pay for defense articles and services purchased under the Arms Export Control Act, (2) funds advanced by the U.S. Agency for International Development (USAID), (3) assistance for economic recon-struction and humanitarian relief abroad, (4) donations of food and other relief supplies, and their transportation, (5) expenditures for international refugee assistance, (6) expenditures for the Peace Corps, and (7) contributions to the economic development and subsidies for the Pacific Ocean islands that the United States holds in trusteeship for the United Nations.
14.21. The offsetting entries to the expenditures by the Peace Corps and USAID are included, unless the specific type of goods or services can be identified, in exports of government goods and services n .i .e . (not included elsewhere) where they represent the “export” of U.S. government goods and services
To Contents
Part III. Statistical Methodology of International Transactions Accounts
Bureau of Economic AnalysisU.S. International Economic Accounts: Concepts and Methods
141
to the aid-receiving countries. If the specific type of goods or services can be identified, the offset-ting entries to the transfer payments from the Peace Corps and USAID are included in the relevant export category.
14.22. U.S. government military grants payments measure the financing of goods delivered, services rendered, or cash disbursed by U.S. military services to foreign countries under programs enacted by the U.S. Congress to authorize the provision of military assistance for which no repayment is expected or for which repayment terms are indeterminate.
14.23. For recent time periods, military grants payments include primarily transfers of equipment, materi-als, supplies, and services for security forces in Iraq, Afghanistan, and Pakistan (valued on the basis of the U.S. government financial records reflecting the expenditure of authorized funds). For earlier time periods, similar transfers made under various military assistance programs are also included here.
14.24. Military grants payments include transfers of goods and services purchased with dollar funds appropriated or with foreign currencies owned by the U.S. government and authorized by legis-lation for that use (valued on the basis of the U.S. government financial records reflecting the expenditure of authorized funds). Military grants payments also include transfers of goods under authorizations to deliver to foreign nations the equipment and material deemed excess to U.S. requirements and military drawdowns (valued according to the legislative authorization under which the transfer is made).
14.25. Military grants payments also include transfers for programs such as U.S. Department of Defense (DOD) narcotics in-country support, cooperative threat reduction, and humanitarian assistance for which DOD has been designated as the executive agent.
14.26. The value of goods and services financed by U.S. military grant programs offsets identical export entries for goods and for services in the current account, which reflect the military goods delivered and services rendered.
14.27. U.S. government grants statistics are based on data submitted quarterly by U.S. government oper-ating agencies under OMB Statistical Directive No. 19. Where necessary, the data reported through OMB Statistical Directive No. 19 are adjusted for timing. The adjustments are based on supplemen-tal information, including published statements, Congressional submissions, and the financial and operating records of government agencies. For transactions that are reported only partially or not at all by the government agencies, BEA uses supplemental information.
Contributions to international organizations
14.28. Contributions to international organizations cover (1) contributions and special grants to interna-tional agencies carrying out humanitarian activities, (2) contributions to international peacekeep-ing activities, and (3) membership contributions (dues) to international nonfinancial organizations.
To Contents
Part III. Statistical Methodology of International Transactions Accounts
Bureau of Economic AnalysisU.S. International Economic Accounts: Concepts and Methods
142
Other general government transfer payments
14.29. Other general government transfer payments cover miscellaneous transfers to nonresidents by the U.S. government that are not covered in the subcategories above. Such transfers are infrequent, and payments are zero in most periods.
Private transfer payments
14.30. Private transfer payments consist of personal transfers; insurance-related transfers; taxes on income, wealth, etc.; fines and penalties; charitable donations; transfers to foreign students; and other private transfer payments.
Personal transfers
14.31. Personal transfers, often called “remittances,” consist of all current transfers from households in cash or in kind sent by the foreign-born population resident in the United States to households abroad.23 (This departs slightly from BPM6 guidelines by not including household current trans-fers sent by U.S.-born U.S. residents. An estimate of household transfers from this population is included in other private transfer payments.) The foreign-born population resident in the United States is defined as that part of the total foreign-born population that has resided, or intends to reside, in the United States for more than one year. These transfers are estimated using a model that incorporates demographic and economic characteristics of the foreign-born population, including the income of the foreign-born population and the percentage of income remitted by the foreign-born population. The percentage of income remitted varies based on the demographic characteristics of the foreign-born population.
14.32. The demographic characteristics of the foreign-born population and their income are based on source data from the U.S. Census Bureau American Community Survey. The percentage of income remitted is a BEA estimate based on the Census Bureau’s 2008 migration supplement to the Census Bureau Current Population Survey and various research and academic studies. The demographic characteristics in the model include duration of stay in the United States, family type (presence or absence of a spouse and presence or absence of roommates), and country of origin. The effects of country of origin in the model depend on the current circumstances of the country as measured by macroeconomic and governance data from the World Bank Worldwide Governance Indicators and World Development Indicators.
Insurance-related transfers
14.33. The entry for insurance-related transfers is the offsetting entry for adjustments for insurance claims volatility made to insurance services. The adjustments are calculated using data from BEA’s surveys on international trade in services and replace actual losses payable on claims with expected
23. “Remittance” is a flexible term, both in everyday discussion and in international statistical guidelines. BPM6 identifies three progressively broader categories of remittances. The narrowest category—personal remittances—includes personal transfers as the largest of the three components. The other two categories include personal remittances along with other transactions. BEA does not provide estimates for any of these three remittance categories.
To Contents

Part III. Statistical Methodology of International Transactions Accounts
Bureau of Economic AnalysisU.S. International Economic Accounts: Concepts and Methods
143
losses so that insurance services are measured as premiums less expected losses. Expected losses consist of losses that occur regularly and a share of certain major catastrophic losses that occur at infrequent intervals. For regularly occurring losses, expected losses are measured as a 24-quarter moving average of the ratio of premiums to actual losses. Certain catastrophic losses are added in equal increments to the estimate of regularly occurring losses over the 80 quarters following the event to derive an estimate of total expected losses. The determination of which catastrophic losses are subject to 80-quarter spreading is made on a case-by-case evaluation of each major event or loss.
14.34. Expected losses are considered transfers from the policyholders to the insurance company. Claims payable (actual losses) are transfers from the insurance company to the policyholder. Payments of insurance-related transfers—that is, payments for the offset of the insurance claims volatility adjustment in insurance services—consist of expected losses associated with insurance contracts ceded to or sold by nonresidents and actual losses incurred on insurance contracts assumed from or sold to nonresidents. Receipts for insurance-related transfers consist of expected losses associ-ated with insurance contracts assumed or sold to nonresidents and actual losses recovered from insurance contracts ceded to or sold by nonresidents.
14.35. An exception to the treatment of actual losses is for actual catastrophic losses, which BEA defines as events where the total impact, insured and uninsured, is greater than 0.1 percent of gross domes-tic product. For catastrophic losses, the full amount of the actual insured loss is entered as a trans-fer in the capital account in the quarter in which the event occurs. This treatment is consistent with the treatment of these losses in BEA’s National Income and Product Accounts, and it avoids having the loss affect current economic activity as it would if it were combined with regular losses in current transfers. The treatment also removes a significant source of volatility in the current-ac-count balance.
14.36. The calculation of expected (“normal”) losses and the classification of various insurance-related transactions are illustrated in figures 12.a and 12.b, respectively.
Taxes on income, wealth, etc.
14.37. Taxes on income, wealth, etc. are measured by withholding taxes paid to foreign governments and represents taxes collected by foreign governments on U.S. residents’ interest and dividend receipts, on the distribution of earnings on U.S. direct investment abroad, and on services transactions. Entries for transactions upon which these taxes are withheld are recorded prior to the withholding of taxes. That is, these primary income and services transactions are recorded gross of withholding taxes. The withholding taxes paid to foreign governments serve to net out (or offset) the portion of these services exports and primary income receipts not available for use by U.S. residents. For securities, withholding taxes for both dividends and interest are based on IRS data. For direct investment, withholding taxes on dividends are reported on BEA surveys, and withholding taxes on interest and royalties are based on IRS data. For services, estimates are based on IRS data, BEA services surveys, and BEA research.
To Contents
Part III. Statistical Methodology of International Transactions Accounts
Bureau of Economic AnalysisU.S. International Economic Accounts: Concepts and Methods
144
Fines and penalties
14.38. Fines and penalties represent monetary amounts paid by U.S. corporations and individuals to for-eign governments, including the European Commission, for violations of foreign laws, including antitrust laws for participation in illegal international cartels. Estimates are from administrative records of foreign government agencies, foreign courts, and media reports.
Charitable donations
14.39. Statistics for charitable donations are obtained from data on cross-border charitable donations reported on IRS Forms 990 and 990-EZ, “Return of Organization Exempt From Income Tax.” Form 990 is an annual return required to be filed with the IRS by most organizations exempt from income tax under section 501(a) and certain political organizations and nonexempt charitable trusts. Each year, more than 10,000 entities engaged in cross-border charitable donations com-plete Form 990. The data provide a universe count of U.S. charities and their foreign donations by country. The Form 990 data are supplemented by data reported by U.S. foundations to Candid and by cross-border donations of goods reported to U.S. Customs and Border Protection through the Automated Commercial Environment and compiled by the Census Bureau.
Transfers to foreign students
14.40. Transfers to foreign students include transfers, such as scholarships, to foreign students while studying in the United States. Transfers to foreign students are measured as the product of edu-cation-related travel exports (see paragraph 12.61) for a subset of travelers and an estimate of the share of students’ spending that is funded by transfers. The education-related travel estimates used in the calculation of transfers to foreign students exclude exports to primary and secondary students because data on these students’ funding are not available. The estimate of the share of spending funded by transfers is based on data on foreign students’ primary sources of funding for study in the United States from the Institute of International Education’s Open Doors report and assumptions about the share of each type of funding source that can be attributed to transfers (as opposed to compensation; see paragraph 13.63).
Other private transfer payments
14.41. Other private transfer payments include revenue sharing agreements between U.S. professional hockey teams and their counterparts in Canada, cross-border postal money orders processed by the U.S. Postal Service (USPS), parcel shipments through USPS, and transfers from U.S.-born U.S. res-idents to U.S. citizens resident abroad.. Source data for revenue sharing by hockey teams are from their annual reports. Source data for money orders and parcel shipments are reported to BEA by USPS. Transfers from U.S.-born U.S. residents to U.S. citizens resident abroad are primarily esti-mated based on data from SSA table 5.J11 Number and Total Monthly Benefits of Beneficiaries in Foreign Countries of the SSA’s Annual Statistical Supplement.
To Contents

Part III. Statistical Methodology of International Transactions Accounts
Bureau of Economic AnalysisU.S. International Economic Accounts: Concepts and Methods
145
Chapter 15. Capital Account
Concepts and coverage
15.1. The capital account presents capital transfers between residents and nonresidents and the cross-border acquisition and disposal of nonproduced nonfinancial assets. Capital transfers include debt forgiveness, investment grants payments, and nonlife insurance claims. Nonproduced non-financial assets include natural resources and contracts, leases, and licenses. Current transfers are presented in the current account.
15.2. Capital-account transactions are distinguished from current-account transactions in that capi-tal-account transactions result in a change in the assets of one or both parties to the transaction without affecting the income or savings of either party. Thus, transactions in the components of the capital account do not affect measures of production, income, and savings of an economy, whereas transactions in the components of the current account do affect these measures.
15.3. Capital-account transactions are recorded in the International Transactions Accounts (ITAs) in lines 65 (receipts) and 66 (payments) of ITA table 1.2. ITA tables 1.1, 1.3, and 1.4 include the same capital-account categories as those included in ITA table 1.2. The Bureau of Economic Analysis (BEA) does not provide a dedicated ITA table focusing on the capital account.
Departures from BPM6
15.4. The coverage and presentation of the capital account largely follow the guidelines recommended by the International Monetary Fund Balance of Payments and International Investment Position Manual, Sixth Edition (BPM6), including the separate presentation of credits (receipts) and debits (payments). Transactions related to debt assumption are not included in the ITAs because of the lack of adequate source data. BEA combines capital transfers with other capital-account transac-tions in its presentation.
Data sources
BEA survey data
15.5. Statistics for sales or purchases of marketing assets (trademarks and franchises) are based on data collected on BEA’s quarterly and benchmark services surveys of selected services and intellectual property (BE–125, BE–120). Some of the data used to estimate transfer agreements related to sports players are also collected on these surveys. Estimates for the adjustments for disaster-related insurance claims are largely based on data collected on BEA’s quarterly and benchmark surveys of insurance transactions (BE–45, BE–140).
To Contents

Part III. Statistical Methodology of International Transactions Accounts
Bureau of Economic AnalysisU.S. International Economic Accounts: Concepts and Methods
146
Other data
15.6. U.S. government agencies. Estimates for grants provided by the U.S. government are based on data submitted quarterly to BEA by U.S. government operating agencies under Office of Management and Budget Statistical Directive No. 19.
15.7. U.S. Department of the Treasury (Treasury Department). Data for forgiveness of U.S. govern-ment loans are obtained from the Treasury Department.
15.8. U.S. Department of State (State Department). The State Department provides BEA with data on its sales and purchases of land abroad, which are recorded as transactions in nonproduced non-financial assets.
15.9. Publicly available information. Preliminary estimates of disaster-related claims are based on press releases issued by insurance companies and risk assessment firms or on information obtained from insurance company financial reports. These estimates are replaced with reported disaster-re-lated losses from the BE-45 as they are available. Publicly available information, such as press releases and private industry reports, is also used to estimate certain acquisitions and disposals of nonproduced nonfinancial assets.
Estimation methods
15.10. Estimation methods differ between capital transfers and the acquisition and disposal of nonpro-duced nonfinancial assets. Each component is described below.
Capital transfers
15.11. Three major components of capital transfers are insured disaster-related (catastrophic) losses, debt forgiveness, and investment grants payments. Insured disaster-related losses are based on data col-lected on BEA’s surveys of insurance transactions and on publicly available information (when sur-vey data are not available). A single entry for the entire amount of the loss recovered from reinsur-ance and primary insurance companies is made in the quarter in which the disaster occurs. These transfers are separated from other insurance transactions to assure that insured disaster-related losses do not affect measures of income and savings in the National Income and Product Accounts (NIPAs).
15.12. Debt forgiveness is the voluntary cancellation of all or part of a debt obligation within a contrac-tual agreement between a creditor and debtor. With debt forgiveness, the contractual arrangement cancels or forgives all or part of the principal amount outstanding, including interest unpaid past the due date (arrears) and other interest costs that have accrued. Currently, source data are avail-able only for forgiveness of debt owed to the U.S. government; these data are from the Treasury Department.
To Contents

Part III. Statistical Methodology of International Transactions Accounts
Bureau of Economic AnalysisU.S. International Economic Accounts: Concepts and Methods
147
15.13. Investment grants payments are similar to international cooperation in secondary income pay-ments in that they cover the use of U.S. government financing to transfer real resources or financial assets to foreigners under programs enacted by the U.S. Congress for the provision of nonmilitary and military foreign assistance (grants) for which no repayment is expected. They are distin-guished from grants covered by international cooperation by the purpose of the grant. Investment grants pertain to grants of capital equipment, such as transport equipment, machinery, and mili-tary weapons, and cash grants for purposes of gross fixed capital formation, which are often tied to specific investments projects, such as large construction projects. U.S. government grants—both investment grants and otherwise—are described at greater length in paragraphs 14.17–14.27.
Acquisition and disposal of nonproduced nonfinancial assets
15.14. Acquisitions and disposals of nonproduced nonfinancial assets include purchases and sales of rights to tangible assets, such as mineral rights, electromagnetic spectrum, and offshore drilling rights, and purchases and sales of certain intangible assets, such as trademarks and franchises. Source data are not available to separately identify and completely measure some of these trans-actions. Transactions are often intermittent and are recorded in the ITAs when large transactions are identified. Examples of intermittent transactions in nonproduced nonfinancial assets currently included in the capital account are receipts of U.S.-based sports leagues for the establishment of franchises abroad and receipts of the State Department for the sale of land abroad.
15.15. Data on certain acquisitions and disposals of nonproduced nonfinancial assets are collected, at least in part, on BEA’s surveys of selected services and intellectual property. These include data on purchases and sales of trademarks and franchises and on the fee(s) paid by one sporting franchise to another for the transfer of a player. The transfer fee for players reflects the sale/purchase of an asset representing the exclusive right to employ an athlete. Estimates for other fees paid by sport-ing franchises for player transfers are based on publicly available information.
To Contents
Part III. Statistical Methodology of International Transactions Accounts
Bureau of Economic AnalysisU.S. International Economic Accounts: Concepts and Methods
148
Chapter 16. Financial-Account Direct Investment
Concepts and coverage
16.1. Direct investment is a category of cross-border investment associated with a resident in one econ-omy having control or a significant degree of influence on the management of a business enterprise resident in another economy. Generally, direct investment indicates a long-term relationship with the management of a foreign enterprise. Ownership or control of 10 percent or more of the nonres-ident entity’s voting securities is the threshold for separating direct investment from other types of investment. (See paragraphs 9.44–9.64 for a further discussion of direct investment.)
16.2. Direct investment financial transactions include those transactions between entities in a direct investment relationship that change assets or liabilities of the parent or affiliate. The major pub-lished components in the International Transactions Accounts (ITAs) are equity and debt instru-ments. Equity transactions comprise equity other than reinvestment of earnings and reinvestment of earnings.
16.3. ITA table 6.1 (see table 16.a) presents direct investment financial transactions first on the asset/liability basis recommended by the International Monetary Fund Balance of Payments and International Investment Position Manual, Sixth Edition (BPM6) for aggregate direct investment statistics and then on the directional basis—outward and inward, depending on whether the direct investor is a U.S. resident or a foreign resident—recommended for classifying direct investment by partner country and by industry. ITA table 6.1 also presents the conversion of direct investment on the asset/liability basis to the directional basis. ITA tables 1.3 and 1.4 present financial transactions for outward and inward direct investment by country.
To Contents
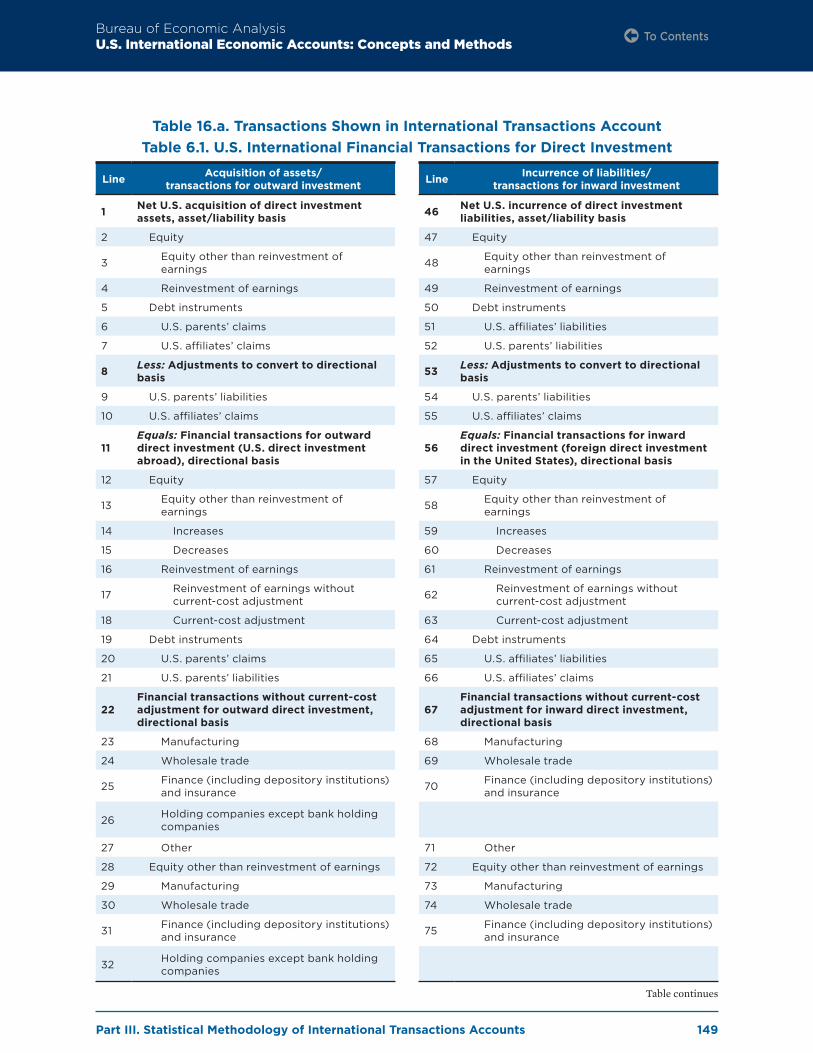
Part III. Statistical Methodology of International Transactions Accounts
Bureau of Economic AnalysisU.S. International Economic Accounts: Concepts and Methods
149
Table 16.a. Transactions Shown in International Transactions Account Table 6.1. U.S. International Financial Transactions for Direct Investment
Line Acquisition of assets/ transactions for outward investment
1 Net U.S. acquisition of direct investment assets, asset/liability basis
2 Equity
3 Equity other than reinvestment of earnings
4 Reinvestment of earnings
5 Debt instruments
6 U.S. parents’ claims
7 U.S. affiliates’ claims
8 Less: Adjustments to convert to directional basis
9 U.S. parents’ liabilities
10 U.S. affiliates’ claims
11Equals: Financial transactions for outward direct investment (U.S. direct investment abroad), directional basis
12 Equity
13 Equity other than reinvestment of earnings
14 Increases
15 Decreases
16 Reinvestment of earnings
17 Reinvestment of earnings without current-cost adjustment
18 Current-cost adjustment
19 Debt instruments
20 U.S. parents’ claims
21 U.S. parents’ liabilities
22Financial transactions without current-cost adjustment for outward direct investment, directional basis
23 Manufacturing
24 Wholesale trade
25 Finance (including depository institutions) and insurance
26 Holding companies except bank holding companies
27 Other
28 Equity other than reinvestment of earnings
29 Manufacturing
30 Wholesale trade
31 Finance (including depository institutions) and insurance
32 Holding companies except bank holding companies
Line Incurrence of liabilities/ transactions for inward investment
46 Net U.S. incurrence of direct investment liabilities, asset/liability basis
47 Equity
48 Equity other than reinvestment of earnings
49 Reinvestment of earnings
50 Debt instruments
51 U.S. affiliates’ liabilities
52 U.S. parents’ liabilities
53 Less: Adjustments to convert to directional basis
54 U.S. parents’ liabilities
55 U.S. affiliates’ claims
56Equals: Financial transactions for inward direct investment (foreign direct investment in the United States), directional basis
57 Equity
58 Equity other than reinvestment of earnings
59 Increases
60 Decreases
61 Reinvestment of earnings
62 Reinvestment of earnings without current-cost adjustment
63 Current-cost adjustment
64 Debt instruments
65 U.S. affiliates’ liabilities
66 U.S. affiliates’ claims
67Financial transactions without current-cost adjustment for inward direct investment, directional basis
68 Manufacturing
69 Wholesale trade
70 Finance (including depository institutions) and insurance
71 Other
72 Equity other than reinvestment of earnings
73 Manufacturing
74 Wholesale trade
75 Finance (including depository institutions) and insurance
Table continues
To Contents

Part III. Statistical Methodology of International Transactions Accounts
Bureau of Economic AnalysisU.S. International Economic Accounts: Concepts and Methods
150
16.4. Like other financial-account components, direct investment transactions are measured and pre-sented on a net basis. Net acquisition of direct investment assets represents net purchases (gross purchases less gross sales) of foreign direct investment assets by U.S. residents, and net incurrence of direct investment liabilities represents net direct investment purchases of U.S. assets by foreign residents.
Departures from BPM6
16.5. The coverage and presentation of direct investment including ITA table 6.1 closely follow BPM6 recommendations, with an exception for the treatment of some investment by fellow enterprises that is due to limitations in source data collected by the Bureau of Economic Analysis (BEA). BEA surveys capture investment between majority-owned fellow enterprises but not with those fellow enterprises that are minority-owned as called for in BPM6 and the Benchmark Definition of Foreign Direct Investment, Fourth Edition (BD4).
16.6. A second departure from the international guidelines concerns private funds (collective investment institutions). In BEA statistics, investments in, or by, private funds are excluded from direct invest-ment and included in portfolio investment if the investor does not ultimately own at least 10 per-cent of the voting interest or equivalent of an “operating company” through the private fund. (An “operating company” is a U.S. or foreign business enterprise that is not a private fund or a holding company.) Under the international guidelines, any investment that meets the 10 percent threshold is considered direct investment whether or not it involves ultimate ownership of 10 percent of an operating company.
Line Acquisition of assets/ transactions for outward investment
33 Other
34 Reinvestment of earnings without current-cost adjustment
35 Manufacturing
36 Wholesale trade
37 Finance (including depository institutions) and insurance
38 Holding companies except bank holding companies
39 Other
40 Debt instruments
41 Manufacturing
42 Wholesale trade
43 Finance (including depository institutions) and insurance
44 Holding companies except bank holding companies
45 Other
Line Incurrence of liabilities/ transactions for inward investment
76 Other
77 Reinvestment of earnings without current-cost adjustment
78 Manufacturing
79 Wholesale trade
80 Finance (including depository institutions) and insurance
81 Other
82 Debt instruments
83 Manufacturing
84 Wholesale trade
85 Finance (including depository institutions) and insurance
86 Other
To Contents
Part III. Statistical Methodology of International Transactions Accounts
Bureau of Economic AnalysisU.S. International Economic Accounts: Concepts and Methods
151
Data sources
16.7. BEA survey data. Statistics for direct investment financial transactions (assets and liabili-ties) presented in ITA tables 1.1–1.4 and in ITA table 6.1 are based largely on data collected on BEA’s quarterly, annual, and benchmark direct investment surveys. The quarterly surveys collect only information needed for the ITAs and the International Investment Position (IIP) Accounts—specifically, financial transactions and positions between parents and their affiliates and income flows between parents and their affiliates.
16.8. The Quarterly Survey of U.S. Direct Investment Abroad (BE–577) collects quarterly data on U.S. direct investment abroad. The Quarterly Survey of Foreign Direct Investment in the United States (BE–605) collects quarterly data on foreign direct investment in the United States. Each year, the data from the quarterly surveys are reconciled to the Annual Survey of U.S. Direct Investment Abroad (BE–11) and to the Annual Survey of Foreign Direct Investment in the United States (BE–15). Once every 5 years, the data from the quarterly surveys are reconciled to the Benchmark Survey of U.S. Direct Investment Abroad (BE–10) and to the Benchmark Survey of Foreign Direct Investment in the United States (BE–12). (See paragraphs 32.11–32.19 for a discussion of the recon-ciliation process.)
Estimation methods
16.9. Direct investment financial transactions represent the aggregation of data items reported on BEA’s direct investment surveys by U.S. multinational enterprises (MNEs) for U.S. direct investment abroad and by the U.S. affiliates of foreign MNEs for foreign direct investment in the United States. The following sections describe the methods used for each of the direct investment components and classifications presented in ITA table 6.1.
Equity
Equity other than reinvestment of earnings
16.10. Parents’ equity in legally incorporated affiliates consists of the parents’ holdings of capital stock in, and other capital contributions to, their affiliates. Capital stock consists of all stock of affiliates, whether common or preferred, voting or nonvoting. Other capital contributions by parents, also referred to as “equity in additional paid-in capital,” consist of (1) capital, invested or contributed, that is not included in capital stock, such as amounts paid for stock in excess of its par or stated value, and (2) capitalizations of intercompany accounts (conversions of debt to equity) that do not result in the issuance of capital stock. Direct investment equity does not include investment fund shares. Parents’ equity in unincorporated affiliates consists of the parents’ share of the affiliates’ total owners’ equity.
16.11. Equity investment other than reinvestment of earnings is the net of parents’ equity increases and decreases in their affiliates. It excludes changes in equity that result from the reinvestment of
To Contents
Part III. Statistical Methodology of International Transactions Accounts
Bureau of Economic AnalysisU.S. International Economic Accounts: Concepts and Methods
152
earnings, which are recorded as a separate component of direct investment financial transactions. Increases in equity other than reinvestment of earnings result from: (1) the parents’ establishment of new affiliates (that is, greenfield investment), (2) initial acquisitions of a 10-percent-or-more ownership interest in existing businesses, (3) acquisitions of additional ownership interests in existing affiliates, and (4) capital contributions to affiliates. Decreases in equity other than rein-vestment of earnings result from liquidations of affiliates, from partial or total sales of ownership interests in affiliates, and from the return of capital contributions. Decreases also include liquidat-ing dividends, which are a return of capital to parents. Decreases in equity investment other than reinvestment of earnings are netted against increases to derive net flows of equity other than rein-vestment of earnings.
Reinvestment of earnings
16.12. Reinvestment of earnings of affiliates equals total earnings less dividends and withdrawals. Earnings are the parents’ shares in the net income of their affiliates after provision for host country income taxes and excluding extraordinary items. Earnings are from the books of the affiliate. A par-ent’s share in net income is based on its directly held equity interest in the affiliate.
16.13. Reinvestment of earnings is shown as a separate component of direct investment financial transac-tions, in recognition of the fact that the earnings of an affiliate are income to the parent, whether they are reinvested or remitted to the parent. However, because reinvested earnings are not actu-ally transferred to the parent but increase the parent’s investment in its affiliate, an entry of equal magnitude, but opposite direction, is made in the direct investment financial account, offsetting the entry made in direct investment income receipts or payments.
16.14. Reinvestment of earnings, as well as total earnings and total income in the current account, is measured at current cost (or replacement cost) rather than at historical cost (book value) to assure that fixed assets are valued at current-period prices and to assure that reported measures of earn-ings and income earned in a given period are properly aligned with charges against income in the same period (see paragraph 13.14 for more information). The adjustment is made at the global level because source data are not available to apply it at either the country level or industry level; reinvestment of earnings at country and industry levels is based on historical-cost assets. The total amount of the current-cost adjustment is entered in the “international organizations and unallo-cated” area in ITA tables 1.3 and 1.4 to assure that the geographic areas sum to the global total for reinvestment of earnings.
Debt instruments
16.15. Debt instrument transactions can involve transactions between a parent and its affiliates or between enterprises that are under the control or influence of the same direct investor (immediate or otherwise), but where neither enterprise controls nor influences the other enterprise (“fellow
To Contents

Part III. Statistical Methodology of International Transactions Accounts
Bureau of Economic AnalysisU.S. International Economic Accounts: Concepts and Methods
153
enterprises”). For example, debt instrument transactions for foreign direct investment in the United States cover transactions between U.S. affiliates and members of their foreign parent group other than their immediate foreign parent.
16.16. When a parent lends funds to its affiliate, the balance of the parent’s receivables (amounts due) from the affiliate increases; subsequently, when the affiliate repays the principal owed to its par-ent, the balance of the parent’s receivables from the affiliate is reduced. Similarly, when a parent borrows funds from its affiliate, the balance of the parent’s payables (amounts owed) to the affiliate increases; subsequently, when the parent repays the principal owed to its affiliate, the balance of the parent’s payables to the affiliate is reduced. Quarterly transactions in debt instruments are derived by subtracting the outstanding intercompany receivables and payables balances at the end of the previous quarter from the corresponding balances at the end of the reference quarter.
16.17. Debt investment transactions are recorded on an asset/liability basis in the aggregate statis-tics. However, statistics presented by country or by industry are presented on a directional basis because the directional basis is better for analyzing certain aspects of direct investment, such as identifying the foreign countries in which U.S. MNEs are investing or the U.S. industries in which foreign direct investors are investing.
16.18. On the asset/liability basis, debt instrument transactions that increase or decrease U.S. parents’ receivables (claims) from their foreign affiliates and transactions that increase or decrease U.S. affiliates’ receivables (claims) from their foreign parent groups are recorded under net U.S. acquisi-tion of direct investment assets. Likewise, transactions that increase or decrease U.S. parents’ pay-ables (liabilities) to their foreign affiliates and transactions that increase or decrease U.S. affiliates’ payables (liabilities) to their foreign parent groups are recorded under U.S. net incurrence of direct investment liabilities. On the directional basis, debt instrument transactions are recorded on a net basis. They consist of the change in parents’ net intercompany debt due from their affiliates during the quarter. The net balance at the end of a quarter or year is calculated as parents’ receivables less parents’ payables.
16.19. On the directional basis, increases in U.S. parents’ receivables from their foreign affiliates or reduc-tions in U.S. parents’ payables to their foreign affiliates result in increases in U.S. parents’ net assets and give rise to outflows in debt instruments under outward direct investment. Reductions in U.S. parents’ receivables from their foreign affiliates or increases in U.S. parents’ payables to their for-eign affiliates result in decreases in U.S. parents’ net assets and give rise to inflows in debt instru-ments under outward direct investment.
16.20. On the directional basis, increases in U.S. affiliates’ payables to their foreign parents or reductions in U.S. affiliates’ receivables from their foreign parents result in increases in U.S. affiliates’ net lia-bilities and give rise to inflows in debt instruments under inward direct investment. Reductions in
To Contents

Part III. Statistical Methodology of International Transactions Accounts
Bureau of Economic AnalysisU.S. International Economic Accounts: Concepts and Methods
154
U.S. affiliates’ payables to their foreign parents or increases in U.S. affiliates’ receivables from their foreign parents result in decreases in U.S. affiliates’ net liabilities and give rise to outflows in debt instruments under inward direct investment.
16.21. Table 16.b presents an example of the conversion of direct investment financial-account transac-tions defined on the asset/liability basis recommended by BPM6 to the directional basis recom-mended for classifying direct investment transactions by partner country and by industry.
Table 16.b. Direct Investment Financial Transactions on the Asset/Liability Basis and on the Directional Basis
16.22. Not all debt instrument transactions reflect actual flows of funds. For example, when distributed earnings or interest accrue to a parent from an affiliate, the full amount is included as a receipt or payment of direct investment income. If all or part of that amount is not actually transferred to the parent, the amount not transferred is entered into debt instruments as an increase in the parent’s receivables from its affiliate.
Net U.S. acquisition of assets/transactions for outward investment
Millions of dollars
Net U.S. acquisition of direct investment assets, asset/liability basis 460
Equity 400
Equity other than reinvestment of earnings 50
Reinvestment of earnings 350
Debt instruments 60
U.S. parents’ claims 20
U.S. affiliates’ claims 40
Less: Adjustments to convert to directional basis 50
U.S. parents’ liabilities 10
U.S. affiliates’ claims 40
Equals: Financial transactions for outward direct investment, directional basis
410
Equity 400
Equity other than reinvestment of earnings 50
Reinvestment of earnings 350
Debt instruments 10
U.S. parents’ claims 20
U.S. parents’ liabilities 10
Net U.S. incurrence of liabilities/transactions for inward investment
Millions of dollars
Net U.S. incurrence of direct investment liabilities, asset/liability basis 255
Equity 200
Equity other than reinvestment of earnings 90
Reinvestment of earnings 110
Debt instruments 55
U.S. affiliates’ liabilities 45
U.S. parents’ liabilities 10
Less: Adjustments to convert to directional basis 50
U.S. parents’ liabilities 10
U.S. affiliates’ claims 40
Equals: Financial transactions for inward direct investment, directional basis
205
Equity 200
Equity other than reinvestment of earnings 90
Reinvestment of earnings 110
Debt 5
U.S. affiliates’ liabilities 45
U.S. affiliates’ claims 40
To Contents

Part III. Statistical Methodology of International Transactions Accounts
Bureau of Economic AnalysisU.S. International Economic Accounts: Concepts and Methods
155
Special issues
16.23. The following sections discuss special issues in the measurement of direct investment transactions. These special issues include financial intermediaries, leases lasting longer than one year, direct investment and portfolio investment, and reverse investment and investment in fellow enterprises.
Financial intermediaries
16.24. Complexities arise in the classification of intercompany debt transactions between parents (or other members of the foreign parent group) and affiliates that are both financial intermediaries. Direct investment entities are deemed to be financial intermediaries if they are classified in a finance industry, including banking but excluding insurance. In contrast to other intercompany debt transactions between parties in a direct investment relationship, transactions between two financial intermediaries are classified outside direct investment as other investment. This excep-tion is applied because the nature of these transactions is more closely related to the underlying activity of financial intermediation than to activity typical of a direct investment relationship. (By the same reasoning, related interest flows are also classified as other investment income rather than as direct investment interest.) The exception is not applied if only one party to the transaction is a financial intermediary.
16.25. For example, if a U.S. manufacturer borrows funds from its affiliate or its parent in a financial industry, the acquisition of those funds is recorded as an increase in debt instrument payables (a debt inflow) and the repayment of those funds as a decrease in debt instrument payables (a debt outflow), and both are included in direct investment financial transactions. However, if a U.S. financial firm acquires funds from or repays funds to a financial affiliate or parent, those financial transactions are classified as an incurrence or repayment of other investment liabilities.
Leases lasting longer than one year
16.26. Transactions in debt instruments include the initiation and changes in the value of leases with terms of more than one year between parents and their affiliates. When property is leased by a foreign affiliate from its U.S. parent, or leased by a foreign parent from its U.S. affiliate, the value of the leased property is recorded as an asset of the U.S. parent or U.S. affiliate because it increases its receivables (a debt instruments outflow). The subsequent payment of principal is a return of capi-tal and is recorded as a reduction in the U.S. parent’s or U.S. affiliate’s assets because it reduces its receivables (a debt inflow).
16.27. Similarly, when property is leased to a U.S. parent by its foreign affiliate, or to a U.S. affiliate by its foreign parent, the value of the leased property is recorded as a liability of the U.S. parent or U.S. affiliate because it increases its payables (a debt instruments inflow). The subsequent payment of principal on the lease is a return of capital and is recorded as a reduction in the U.S. parent’s or U.S. affiliate’s liabilities because it reduces its payables (a debt outflow).
To Contents
Part III. Statistical Methodology of International Transactions Accounts
Bureau of Economic AnalysisU.S. International Economic Accounts: Concepts and Methods
156
Direct investment and portfolio investment
16.28. Some transactions require a shift in classification between direct investment and portfolio invest-ment. If a U.S. parent’s voting interest in a foreign business enterprise, or a foreign parent’s voting interest in a U.S. business enterprise, is originally less than 10 percent, and if additional purchases result in a greater than 10 percent voting interest, a direct investment financial transaction equal to the value of the additional equity interest is recorded.24 In addition, offsetting valuation adjust-ments are made to the direct investment position and the portfolio investment position to bring the original equity interest into the direct investment position. If a U.S. parent’s voting interest in a foreign affiliate or a foreign parent’s voting interest in a U.S. affiliate falls below 10 percent, a direct investment financial transaction equal to the value of the reduction in equity interest is recorded, and offsetting valuation adjustments are made to the direct investment position and the portfolio investment position to extinguish the remaining direct investment position. Related income flows are also reclassified.
Reverse investment and investment in fellow enterprises
16.29. A U.S. parent may have investment in a foreign affiliate that, in turn, has investment in the U.S. parent as a result of the affiliate’s lending funds to, or acquiring voting securities or other equity interest in, the U.S. parent. Likewise, a foreign parent may have investment in a U.S. affiliate that, in turn, has investment in the foreign parent as a result of the affiliate’s lending funds to, or acquiring voting securities or other equity interest in, the foreign parent. For cases in which affiliates have no voting power or less than 10 percent voting power in their parents, equity and debt investment by affiliates in their parent companies is known as “reverse investment.” For cases in which affiliates have 10 percent or more voting power in their parent companies, investment by affiliates in parents is treated as separate direct investment in its own right.
16.30. BPM6 calls for reverse equity investment to be separately identified in cases where it is signifi-cant. The results from the 2014 Benchmark Survey of U.S. Direct Investment Abroad and the 2017 Benchmark Survey of Foreign Direct Investment in the United States suggest that reverse equity investment is not significant for U.S. outward or inward direct investment, so BEA does not show this category in its accounts at this time. Reverse debt investment is separately identified in ITA table 6.1.
16.31. An affiliate may have debt investment in a fellow enterprise, another enterprise that is under the control or influence of the same direct investor (immediate or otherwise), but where neither enter-prise controls nor influences the other enterprise. International guidelines call for such invest-ment to be separately identified and labeled as “direct investment between fellow enterprises” in cases where it is significant. Because of the high level of consolidation of data collected for U.S. parent companies, BEA is not able to separately identify fellow enterprise transactions on outward
24. A direct investment relationship exists when a parent’s voting interest in an affiliate is greater than 10 percent. Direct investment transactions and positions reflect the parent’s equity interest in the affiliate. A parent’s voting and equity interests are usually the same, but they can differ.
To Contents

Part III. Statistical Methodology of International Transactions Accounts
Bureau of Economic AnalysisU.S. International Economic Accounts: Concepts and Methods
157
investment. For this reason, these transactions are included with direct transactions between the U.S. parent company and its foreign affiliates on outward investment. For consistency, these trans-actions are included with direct transactions between U.S. affiliates and their foreign parent group on inward investment as well. On an asset/liability basis, the direction of equity ownership does not matter; an inflow of direct-investment-related debt funds represents an increase in U.S. debt liabilities and an outflow of direct-investment-related debt funds represents an increase in U.S. debt assets.
To Contents
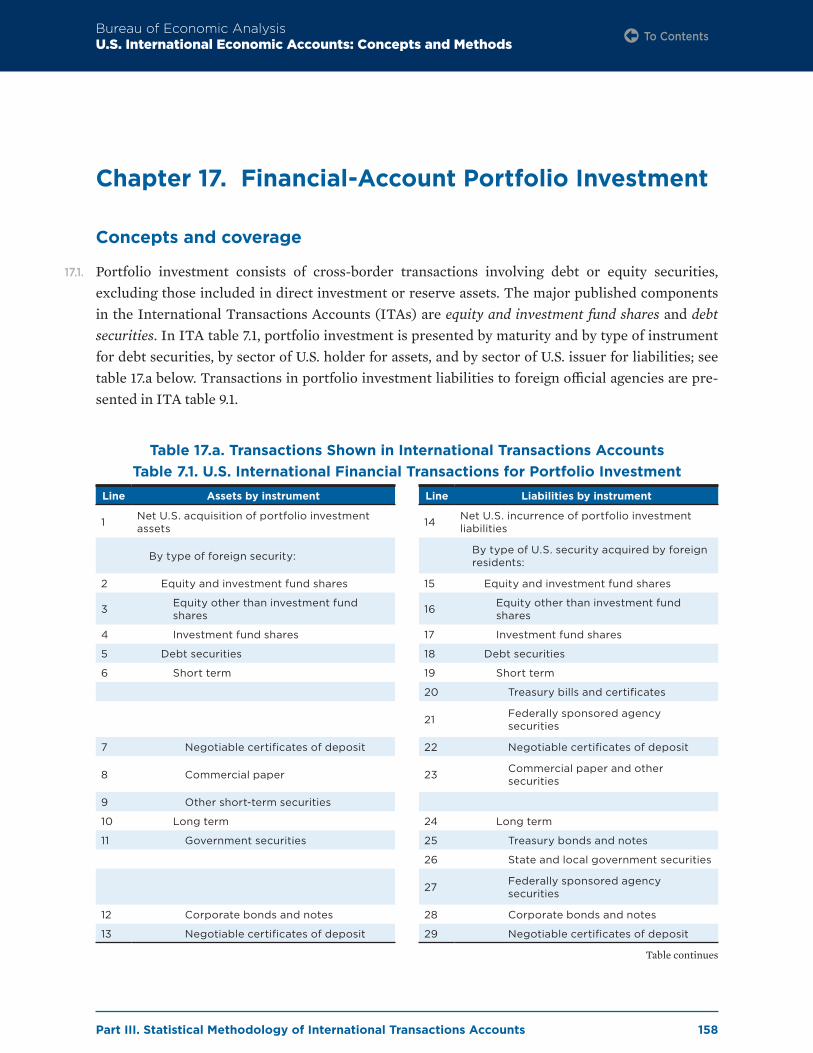
Part III. Statistical Methodology of International Transactions Accounts
Bureau of Economic AnalysisU.S. International Economic Accounts: Concepts and Methods
158
Chapter 17. Financial-Account Portfolio Investment
Concepts and coverage
17.1. Portfolio investment consists of cross-border transactions involving debt or equity securities, excluding those included in direct investment or reserve assets. The major published components in the International Transactions Accounts (ITAs) are equity and investment fund shares and debt securities. In ITA table 7.1, portfolio investment is presented by maturity and by type of instrument for debt securities, by sector of U.S. holder for assets, and by sector of U.S. issuer for liabilities; see table 17.a below. Transactions in portfolio investment liabilities to foreign official agencies are pre-sented in ITA table 9.1.
Table 17.a. Transactions Shown in International Transactions Accounts Table 7.1. U.S. International Financial Transactions for Portfolio Investment
Line Assets by instrument
1 Net U.S. acquisition of portfolio investment assets
By type of foreign security:
2 Equity and investment fund shares
3 Equity other than investment fund shares
4 Investment fund shares
5 Debt securities
6 Short term
7 Negotiable certificates of deposit
8 Commercial paper
9 Other short-term securities
10 Long term
11 Government securities
12 Corporate bonds and notes
13 Negotiable certificates of deposit
Line Liabilities by instrument
14 Net U.S. incurrence of portfolio investment liabilities
By type of U.S. security acquired by foreign residents:
15 Equity and investment fund shares
16 Equity other than investment fund shares
17 Investment fund shares
18 Debt securities
19 Short term
20 Treasury bills and certificates
21 Federally sponsored agency securities
22 Negotiable certificates of deposit
23 Commercial paper and other securities
24 Long term
25 Treasury bonds and notes
26 State and local government securities
27 Federally sponsored agency securities
28 Corporate bonds and notes
29 Negotiable certificates of deposit
Table continues
To Contents

Part III. Statistical Methodology of International Transactions Accounts
Bureau of Economic AnalysisU.S. International Economic Accounts: Concepts and Methods
159
17.2. Like other financial-account components, portfolio investment is measured and presented on a net basis. Net acquisition of portfolio investment assets represents net purchases (gross purchases less gross sales) of foreign securities by U.S. residents, and net incurrence of portfolio investment liabil-ities represents net purchases of U.S. securities by foreign residents.
Departures from BPM6
17.3. The coverage and presentation of portfolio investment closely follow recommendations from the International Monetary Fund Balance of Payments and International Investment Position Manual, Sixth Edition (BPM6). The Bureau of Economic Analysis (BEA) uses slightly different terminology and sector detail in some cases.
Line Assets by sector of U.S. holder
30 Net U.S. acquisition of portfolio investment assets
31 Deposit-taking institutions except central bank
32 Equity and investment fund shares
33 Debt securities
34 Short term
35 Long term
36 Other financial institutions
37 Equity and investment fund shares
38 Debt securities
39 Short term
40 Long term
41 Nonfinancial institutions except general government
42 Equity and investment fund shares
43 Debt securities
44 Short term
45 Long term
Line Liabilities by sector of U.S. issuer
46 Net U.S. incurrence of portfolio investment liabilities
47 Deposit-taking institutions except central bank
48 Equity and investment fund shares
49 Debt securities
50 Short term
51 Long term
52 Other financial institutions
53 Equity and investment fund shares
54 Debt securities
55 Federally sponsored agency securities
56 Short term
57 Long term
58 Other securities
59 Short term
60 Long term
61 Nonfinancial institutions except general government
62 Equity and investment fund shares
63 Debt securities
64 Short term
65 Long term
66 General government
67 Debt securities
68 U.S. Treasury securities
69 Short term
70 Long term
71 State and local government long-term securities
To Contents
Part III. Statistical Methodology of International Transactions Accounts
Bureau of Economic AnalysisU.S. International Economic Accounts: Concepts and Methods
160
Data sources
17.4. U.S. Department of the Treasury. U.S. residents’ net purchases of foreign-issued equity and long-term debt securities and foreign residents’ net purchases of U.S.-issued equity and long-term debt securities are based on data collected monthly on the Treasury International Capital (TIC) SLT form. The related annual and benchmark surveys cover equity and long- and short-term debt secu-rities, including negotiable certificates of deposit (NCDs), and are used to supplement the other TIC data sources. The SHL(A) covers foreign holding of U.S. securities and the SHC(A) covers U.S. holdings of foreign securities. Values on these surveys reflect the secondary market prices of the equity and long-term debt securities. See chapter 3 for more details on the TIC data.
17.5. Estimates of U.S. short-term debt securities and NCDs are based on the TIC B and C forms: BC, BL–2, BQ–1, BQ–2, and CQ–1. Values on the TIC B and C forms are reported at their original con-tractual values (face value).
17.6. Changes in reported values caused by the addition of new reporters, corrected reports, or changes to the reporting panels of these TIC surveys are reported to BEA and are categorized as other changes in position n.i.e. (not included elsewhere) in the International Investment Position (IIP) Accounts.
17.7. The values of securities denominated in foreign currencies, including most foreign-issued securi-ties and some U.S.-issued securities, are converted to U.S. dollars at exchange rates prevailing on the reporting date and are reported in U.S. dollars on the TIC surveys.
17.8. Morgan Stanley Capital International (MSCI), S&P Dow Jones Indices, and Intercontinental Exchange (ICE) Price Indexes. For U.S. equity shares, BEA uses the S&P 500 stock index, which is a proxy for the composition of foreign holdings of U.S. equity shares. For U.S. corporate, federally sponsored agency, and Treasury long-term debt securities, BEA uses various ICE indexes matched to these market segments and to the maturity, investment quality, and currency of denomination of U.S. long-term debt securities held by foreign residents.
17.9. For foreign equity shares, BEA uses MSCI national and regional indexes for developed and emerg-ing markets matched to the composition of the foreign stocks held by U.S. residents. For foreign bonds, BEA uses various ICE indexes representing investment quality long-term debt securities issued abroad in the U.S. dollar, the euro, the Japanese yen, the Canadian dollar, and the British pound, as well as a global broad market index excluding U.S. dollar debt, to match the composition of foreign-issued long-term debt held by U.S. residents.
17.10. Depository Trust and Clearing Corporation (DTCC). BEA receives reports of commercial paper issued in the United States from the DTCC. Data provided by the DTCC are combined with data-bases of company reports to determine whether commercial paper issuers are U.S. residents or foreign residents, providing estimates that supplement U.S. holdings of foreign commercial paper reported on TIC BQ–1 form and the SHC(A).
To Contents

Part III. Statistical Methodology of International Transactions Accounts
Bureau of Economic AnalysisU.S. International Economic Accounts: Concepts and Methods
161
Estimation methods
17.11. Estimation methods for portfolio investment statistics, including classifications by maturity and sector, are summarized below in tables 17.b, 17.c, and 17.d. Table 17.b summarizes transactions in short-term debt securities and NCDs of any maturity. Table 17.c summarizes transactions in equity and long-term debt securities, excluding long-term NCDs. Table 17.d summarizes methods used to derive detailed components by sector from aggregate components.
Short-term debt securities and NCDs of any maturity
17.12. Estimates of U.S. residents’ net purchases of foreign short-term debt securities and NCDs of any maturity and of foreign residents’ net purchases of U.S. short-term debt securities and NCDs of any maturity are based on changes in quarterly holdings of these securities reported on the TIC B and C forms. U.S. residents’ holdings of foreign commercial paper reported on the TIC BQ–1 form are supplemented by holdings estimated from the DTCC data. Transactions in short-term instruments and NCDs are equal to holdings reported at the end of the reference quarter, less holdings reported at the end of the preceding quarter, less changes in holdings not due to transactions.
17.13. Changes not due to transactions include changes in holdings caused by changes to reporting panels and changes in foreign-currency-denominated instruments caused by changes in exchange rates. (See paragraphs 24.14 and 24.15 for information on the estimation of exchange-rate changes.) Because holdings are reported at face value, reported values are not much affected by price changes in secondary markets, so no adjustment is made for changes in secondary market prices. Table 17.b shows the components published in ITA tables 7.1 and 9.1 derived by this method.
Table 17.b. Transactions in Short-Term Debt Securities and Negotiable Certificates of Deposit in ITA Tables 7.1 and 9.1,
Directly Estimated from TIC B & C and DTCC Reported Holdings
Line Item description
ITA Table 7.1. U.S. International Financial Transactions for Portfolio Investment
Net U.S. acquisition of portfolio investment assets
7+13 Negotiable certificates of deposit, any maturity
8 Commercial paper
9 Other short-term securities
Assets by sector of U.S. holder
34 Short-term debt securities held by deposit-taking institutions except central bank1
39 Short-term debt securities held by other financial institutions1
44 Short-term debt securities held by nonfinancial institutions except general government1
Net U.S. incurrence of portfolio investment liabilities
22+29 Negotiable certificates of deposit, any maturity
20 Treasury bills and certificates
21 Federally sponsored agency securities, short term
23 Commercial paper and other short-term securities
Table continues
To Contents

Part III. Statistical Methodology of International Transactions Accounts
Bureau of Economic AnalysisU.S. International Economic Accounts: Concepts and Methods
162
Line Item description
Liabilities by sector of U.S. issuer
50 Short-term debt securities issued by deposit-taking institutions except central bank2
56 Federally sponsored agency securities, short term (equals line 21)
59 Short-term debt securities issued by other financial institutions
64 Short-term debt securities issued by nonfinancial institutions except general government
69 U.S. Treasury securities, short term (equals line 20)
ITA Table 9.1. U.S. International Financial Transactions for Liabilities to Foreign Official Agencies
Net U.S. incurrence of portfolio investment liabilities
10+17 Negotiable certificates of deposit, any maturity
8 Treasury bills and certificates
9+11 Short-term federally sponsored agency securities plus commercial paper and other short-term securities
DTCC Depository Trust and Clearing Corporation.ITA International Transactions AccountsTIC Treasury International Capital
1. Transactions in negotiable certificates of deposit directly estimated for this sector are allocated between short- and long-term maturities based on annual data from the SHC(A).
2. All transactions in U.S. negotiable certificates of deposit are allocated to deposit-taking institutions except central bank. Transactions are allocated between short- and long-term maturities based on annual data from the SHL(A).
17.14. The TIC B and C forms provide outstanding amounts for NCDs but do not provide long-term and short-term holdings for these instruments. BEA uses annual data from the SHC(A) and SHL(A) annual and benchmark surveys of portfolio investment on long- and short-term holdings of NCDs to allocate transactions computed for NCDs to long-term and short-term transactions for ITA tables 7.1 and table 9.1.
17.15. The SHL(A) annual and benchmark surveys of foreign portfolio investment in the United States provide complete holdings by foreign official agencies of all types of U.S.-issued short-term secu-rities and short- and long-term NCDs. The TIC BL–2 form provides monthly holdings by foreign official agencies of short-term U.S. Treasury securities and the aggregate holdings of all other U.S. short-term securities plus NCDs of any maturity. Quarterly aggregate holdings by foreign official agencies from the BL–2 are combined with the detailed annual holdings by security type from the SHL(A) to estimate quarterly transactions by foreign official agencies of short-term U.S. federally sponsored agency securities, U.S. commercial paper and other U.S. short-term securities, and U.S. short- and long-term NCDs for ITA table 9.1. Also included in table 9.1 are transactions of foreign official agencies of U.S. Treasury bills and certificates, based on quarterly holdings reported in the BL–2.
Equity and long-term debt securities, excluding long-term NCDs
17.16. Statistics for U.S. residents’ net purchases of foreign equity and long-term debt securities and for foreign residents’ net purchases of U.S equity and long-term debt securities are based on (1) changes in quarterly holdings of these securities reported on the TIC SLT form; (2) changes in the value of the holdings based on broad market price indexes from MSCI, S&P Dow Jones
To Contents

Part III. Statistical Methodology of International Transactions Accounts
Bureau of Economic AnalysisU.S. International Economic Accounts: Concepts and Methods
163
Indices, and ICE; and (3) other changes in reported holdings not due to transactions or valuation, such as changes in reporting panels. Price indexes denominated in U.S. dollars are used to mea-sure changes in prices. For foreign-currency-denominated equity and debt securities, changes in value caused by changes in exchange rates are included in the price changes computed from the U.S.-dollar-denominated price indexes. (See paragraph 24.24 for information on the estimation of exchange-rate changes.) Transactions equal holdings reported at the end of the reference quarter, less holdings reported at the end of the preceding quarter, less the sum of changes in the value of the holdings caused by changes in prices and exchange rates and other changes in holdings not due to transactions or valuation. Table 17.c shows the components published in ITA tables 7.1 and 9.1 derived by this method.
17.17. Annually, BEA uses corresponding annual or benchmark survey data for cross-border securities holdings to reconcile positions and transactions by comparing the annual or benchmark survey results to data from the TIC SLT form for the same reporting date.
Table 17.c. Transactions in Equity and Long-Term Debt Securities in ITA Tables 7.1 and 9.1, Directly Estimated from Valuation-Adjusted SLT Holdings
Line Item
ITA Table 7.1. U.S. International Financial Transactions for Portfolio Investment
Net U.S. acquisition of portfolio investment assets
2 Equity and investment fund shares
Debt securities
11+12 Long-term government securities plus corporate bonds and notes
Net U.S. incurrence of portfolio investment liabilities
15 Equity and investment fund shares
Debt securities
Long term
25 Treasury bonds and notes
27 Federally sponsored agency securities
26+28 Corporate bonds and notes plus state and local government securities
Liabilities by sector of U.S. issuer
Debt securities
57 Federally sponsored agency securities, long term (equals line 27)
70 U.S. Treasury securities, long term (equals line 25)
ITA Table 9.1. U.S. International Financial Transactions for Liabilities to Foreign Official Agencies
Net U.S. incurrence of portfolio investment liabilities
3 Equity and investment fund shares
Debt securities
Long term
13 Treasury bonds and notes
15 Federally sponsored agency securities
14+16 Corporate bonds and notes plus state and local government securities
ITA International Transactions AccountsTIC Treasury International Capital
To Contents

Part III. Statistical Methodology of International Transactions Accounts
Bureau of Economic AnalysisU.S. International Economic Accounts: Concepts and Methods
164
17.18. Table 17.d presents the lines in ITA tables 7.1 and 9.1 that are estimated by allocating estimates of transactions in equity and long-term debt securities from the lines listed in table 17.c according to U.S. holdings of foreign assets at the end of the reference quarter or according to foreign holdings of U.S. liabilities at the end of the reference quarter. In table 17.d, the derived estimate described in column A is equal to the source estimate in column B multiplied by the ratio of column C holdings to column D holdings, at the end of the reference quarter. Transactions in long-term NCDs, esti-mated as described in the previous section, are added to selected lines listed in table 17.d covering long-term debt securities.
Table 17.d. Transactions in Equity and Long-Term Debt Securities from Valuation-Adjusted SLT Holdings and Ratios From SLT Holdings Detail
Derived transactions Source transactions Allocation ratio components from SLT holdings
Table Line Item description Table Line Item description Numerator Denominator
[A] [B] [C] [D]
Net U.S. acquisition of portfolio investment assets
Assets by type of foreign security
Equity and investment fund shares
7.1 3Equity other than investment fund shares
7.1 2Equity and investment fund shares
Equity other than investment fund shares
Equity and investment fund shares
7.1 4 Investment fund shares 7.1 2
Equity and investment fund shares
Investment fund shares
Equity and investment fund shares
Long-term debt securities
7.1 11 Government securities 7.1 11+12
Long-term government securities plus corporate bonds and notes
Government securities
Long-term government securities plus corporate bonds and notes
7.1 12 Corporate bonds and notes 7.1 11+12
Long-term government securities plus corporate bonds and notes
Corporate bonds and notes
Long-term government securities plus corporate bonds and notes
Assets by sector of U.S. holder
Deposit-taking institutions except central bank
7.1 32
Equity and investment fund shares held by deposit-taking institutions except central bank
7.1 2
Equity and investment fund shares held by all sectors
Equity and investment fund shares held by deposit-taking institutions except central bank
Equity and investment fund shares held by all sectors
7.1 35
Long-term debt securities held by deposit-taking institutions except central bank1
7.1 10Long-term debt securities held by all sectors
Long-term debt securities held by deposit-taking institutions except central bank
Long-term debt securities held by all sectors
Table continues
To Contents

Part III. Statistical Methodology of International Transactions Accounts
Bureau of Economic AnalysisU.S. International Economic Accounts: Concepts and Methods
165
Derived transactions Source transactions Allocation ratio components from SLT holdings
Table Line Item description Table Line Item description Numerator Denominator
[A] [B] [C] [D]
Other financial institutions
7.1 37
Equity and investment fund shares held by other financial institutions
7.1 2
Equity and investment fund shares held by all sectors
Equity and investment fund shares held by other financial institutions
Equity and investment fund shares held by all sectors
7.1 40
Long-term debt securities held by other financial institutions1
7.1 10Long-term debt securities held by all sectors
Long-term debt securities held by other financial institutions
Long-term debt securities held by all sectors
Nonfinancial institutions except general government
7.1 42
Equity and investment fund shares held by nonfinancial institutions except general government
7.1 2
Equity and investment fund shares held by all sectors
Equity and investment fund shares held by nonfinancial institutions except general government
Equity and investment fund shares held by all sectors
7.1 45
Long-term debt securities held by nonfinancial institutions except general government1
7.1 10Long-term debt securities held by all sectors
Long-term debt securities held by nonfinancial institutions except general government
Long-term debt securities held by all sectors
Net U.S. incurrence of portfolio investment liabilities
Liabilities by type of U.S. security acquired by foreign residents
Equity and investment fund shares acquired by all foreign residents
7.1 16Equity other than investment fund shares
7.1 15Equity and investment fund shares
Equity other than investment fund shares
Equity and investment fund shares
7.1 17 Investment fund shares 7.1 15
Equity and investment fund shares
Investment fund shares
Equity and investment fund shares
Equity and investment fund shares acquired by foreign official agencies
9.1 4Equity other than investment fund shares
9.1 3Equity and investment fund shares
Equity other than investment fund shares
Equity and investment fund shares
9.1 5 Investment fund shares 9.1 3
Equity and investment fund shares
Investment fund shares
Equity and investment fund shares
Long-term debt securities acquired by all foreign residents
7.1 26State and local government securities
7.1 26+28
Corporate bonds and notes plus state and local government securities
State and local government securities
Corporate bonds and notes plus state and local government securities
7.1 71
State and local government long-term securities (equals line 26)
7.1 26+28
Corporate bonds and notes plus state and local government securities
State and local government securities
Corporate bonds and notes plus state and local government securities
Table continues
To Contents
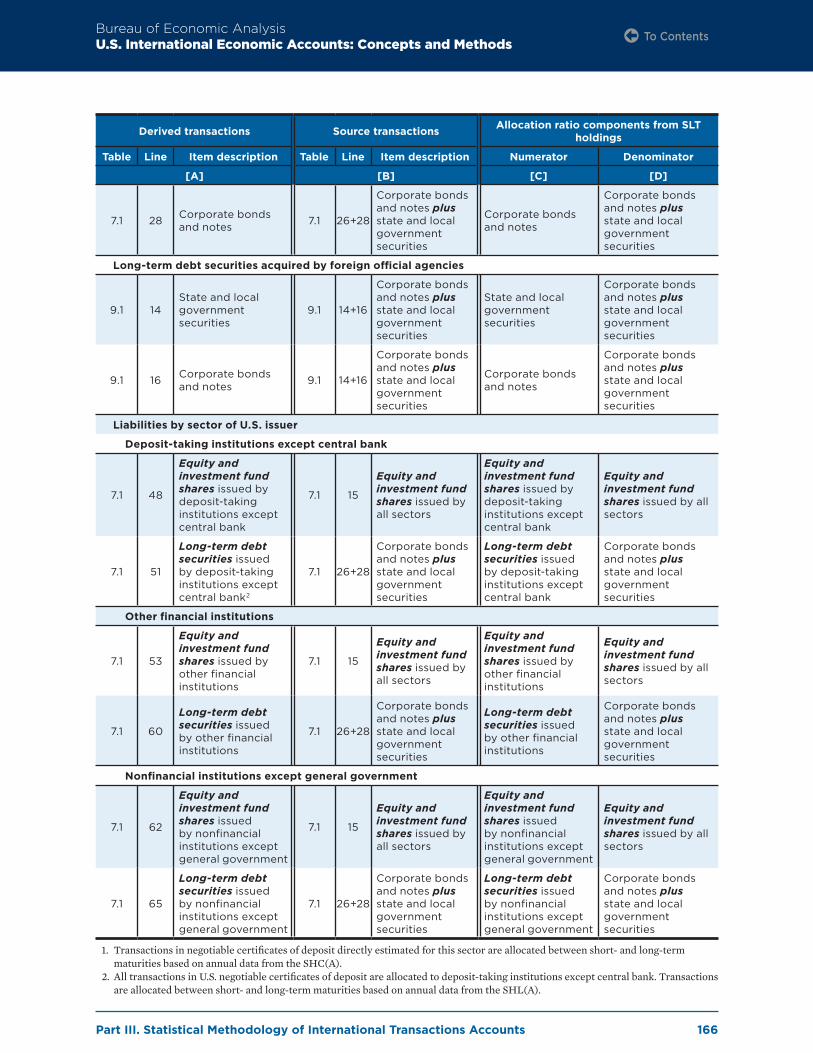
Part III. Statistical Methodology of International Transactions Accounts
Bureau of Economic AnalysisU.S. International Economic Accounts: Concepts and Methods
166
Derived transactions Source transactions Allocation ratio components from SLT holdings
Table Line Item description Table Line Item description Numerator Denominator
[A] [B] [C] [D]
7.1 28 Corporate bonds and notes 7.1 26+28
Corporate bonds and notes plus state and local government securities
Corporate bonds and notes
Corporate bonds and notes plus state and local government securities
Long-term debt securities acquired by foreign official agencies
9.1 14State and local government securities
9.1 14+16
Corporate bonds and notes plus state and local government securities
State and local government securities
Corporate bonds and notes plus state and local government securities
9.1 16 Corporate bonds and notes 9.1 14+16
Corporate bonds and notes plus state and local government securities
Corporate bonds and notes
Corporate bonds and notes plus state and local government securities
Liabilities by sector of U.S. issuer
Deposit-taking institutions except central bank
7.1 48
Equity and investment fund shares issued by deposit-taking institutions except central bank
7.1 15
Equity and investment fund shares issued by all sectors
Equity and investment fund shares issued by deposit-taking institutions except central bank
Equity and investment fund shares issued by all sectors
7.1 51
Long-term debt securities issued by deposit-taking institutions except central bank2
7.1 26+28
Corporate bonds and notes plus state and local government securities
Long-term debt securities issued by deposit-taking institutions except central bank
Corporate bonds and notes plus state and local government securities
Other financial institutions
7.1 53
Equity and investment fund shares issued by other financial institutions
7.1 15
Equity and investment fund shares issued by all sectors
Equity and investment fund shares issued by other financial institutions
Equity and investment fund shares issued by all sectors
7.1 60
Long-term debt securities issued by other financial institutions
7.1 26+28
Corporate bonds and notes plus state and local government securities
Long-term debt securities issued by other financial institutions
Corporate bonds and notes plus state and local government securities
Nonfinancial institutions except general government
7.1 62
Equity and investment fund shares issued by nonfinancial institutions except general government
7.1 15
Equity and investment fund shares issued by all sectors
Equity and investment fund shares issued by nonfinancial institutions except general government
Equity and investment fund shares issued by all sectors
7.1 65
Long-term debt securities issued by nonfinancial institutions except general government
7.1 26+28
Corporate bonds and notes plus state and local government securities
Long-term debt securities issued by nonfinancial institutions except general government
Corporate bonds and notes plus state and local government securities
1. Transactions in negotiable certificates of deposit directly estimated for this sector are allocated between short- and long-term maturities based on annual data from the SHC(A).
2. All transactions in U.S. negotiable certificates of deposit are allocated to deposit-taking institutions except central bank. Transactions are allocated between short- and long-term maturities based on annual data from the SHL(A).
To Contents
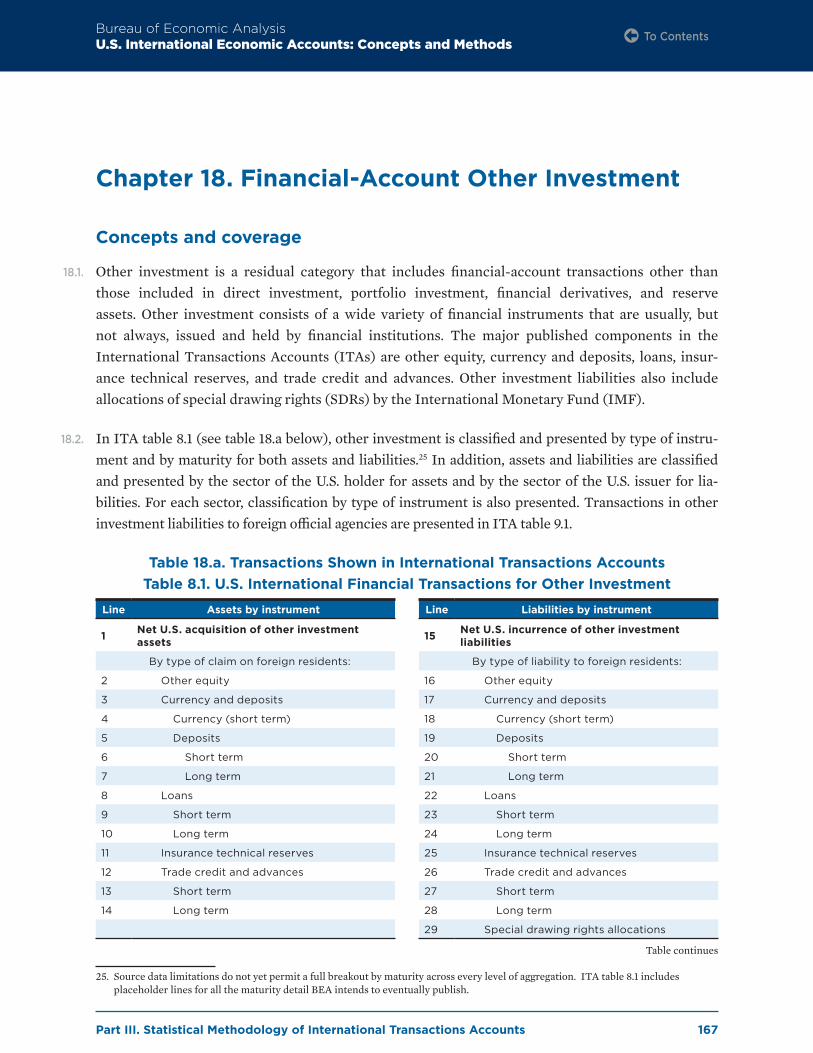
Part III. Statistical Methodology of International Transactions Accounts
Bureau of Economic AnalysisU.S. International Economic Accounts: Concepts and Methods
167
Chapter 18. Financial-Account Other Investment
Concepts and coverage
18.1. Other investment is a residual category that includes financial-account transactions other than those included in direct investment, portfolio investment, financial derivatives, and reserve assets. Other investment consists of a wide variety of financial instruments that are usually, but not always, issued and held by financial institutions. The major published components in the International Transactions Accounts (ITAs) are other equity, currency and deposits, loans, insur-ance technical reserves, and trade credit and advances. Other investment liabilities also include allocations of special drawing rights (SDRs) by the International Monetary Fund (IMF).
18.2. In ITA table 8.1 (see table 18.a below), other investment is classified and presented by type of instru-ment and by maturity for both assets and liabilities.25 In addition, assets and liabilities are classified and presented by the sector of the U.S. holder for assets and by the sector of the U.S. issuer for lia-bilities. For each sector, classification by type of instrument is also presented. Transactions in other investment liabilities to foreign official agencies are presented in ITA table 9.1.
Table 18.a. Transactions Shown in International Transactions Accounts Table 8.1. U.S. International Financial Transactions for Other Investment
25. Source data limitations do not yet permit a full breakout by maturity across every level of aggregation. ITA table 8.1 includes placeholder lines for all the maturity detail BEA intends to eventually publish.
Line Assets by instrument
1 Net U.S. acquisition of other investment assets
By type of claim on foreign residents:
2 Other equity
3 Currency and deposits
4 Currency (short term)
5 Deposits
6 Short term
7 Long term
8 Loans
9 Short term
10 Long term
11 Insurance technical reserves
12 Trade credit and advances
13 Short term
14 Long term
Line Liabilities by instrument
15 Net U.S. incurrence of other investment liabilities
By type of liability to foreign residents:
16 Other equity
17 Currency and deposits
18 Currency (short term)
19 Deposits
20 Short term
21 Long term
22 Loans
23 Short term
24 Long term
25 Insurance technical reserves
26 Trade credit and advances
27 Short term
28 Long term
29 Special drawing rights allocations
Table continues
To Contents
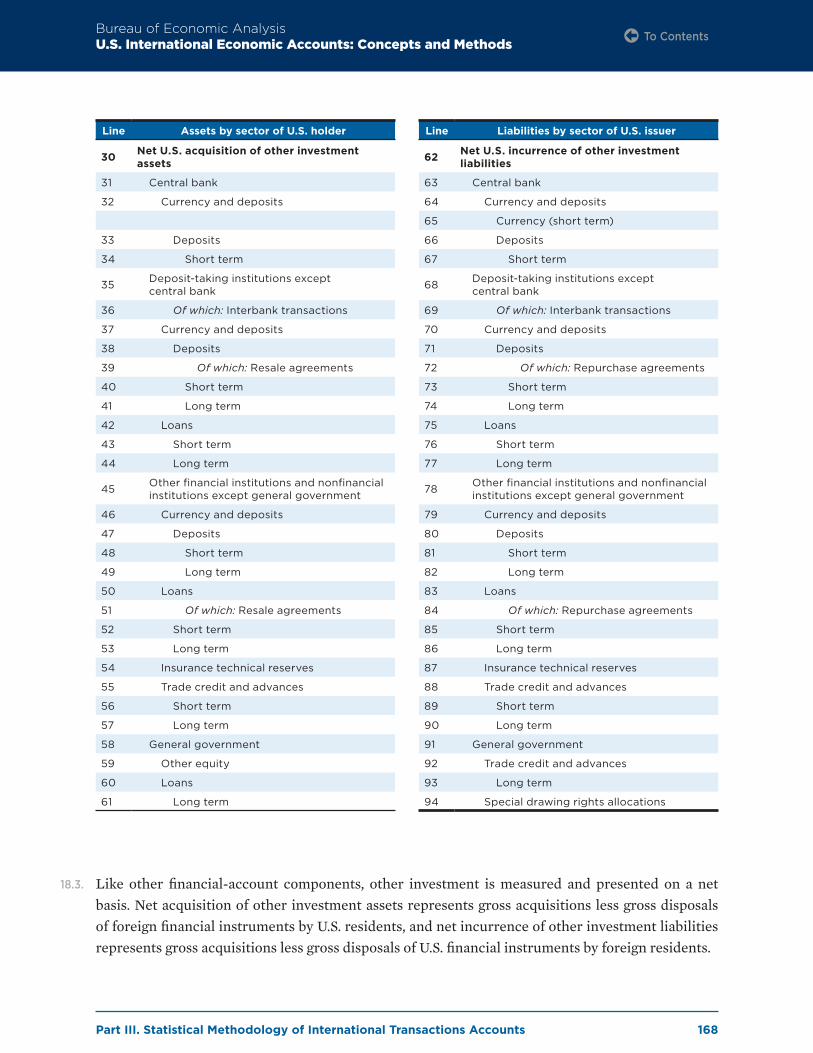
Part III. Statistical Methodology of International Transactions Accounts
Bureau of Economic AnalysisU.S. International Economic Accounts: Concepts and Methods
168
18.3. Like other financial-account components, other investment is measured and presented on a net basis. Net acquisition of other investment assets represents gross acquisitions less gross disposals of foreign financial instruments by U.S. residents, and net incurrence of other investment liabilities represents gross acquisitions less gross disposals of U.S. financial instruments by foreign residents.
Line Assets by sector of U.S. holder
30 Net U.S. acquisition of other investment assets
31 Central bank
32 Currency and deposits
33 Deposits
34 Short term
35 Deposit-taking institutions except central bank
36 Of which: Interbank transactions
37 Currency and deposits
38 Deposits
39 Of which: Resale agreements
40 Short term
41 Long term
42 Loans
43 Short term
44 Long term
45 Other financial institutions and nonfinancial institutions except general government
46 Currency and deposits
47 Deposits
48 Short term
49 Long term
50 Loans
51 Of which: Resale agreements
52 Short term
53 Long term
54 Insurance technical reserves
55 Trade credit and advances
56 Short term
57 Long term
58 General government
59 Other equity
60 Loans
61 Long term
Line Liabilities by sector of U.S. issuer
62 Net U.S. incurrence of other investment liabilities
63 Central bank
64 Currency and deposits
65 Currency (short term)
66 Deposits
67 Short term
68 Deposit-taking institutions except central bank
69 Of which: Interbank transactions
70 Currency and deposits
71 Deposits
72 Of which: Repurchase agreements
73 Short term
74 Long term
75 Loans
76 Short term
77 Long term
78 Other financial institutions and nonfinancial institutions except general government
79 Currency and deposits
80 Deposits
81 Short term
82 Long term
83 Loans
84 Of which: Repurchase agreements
85 Short term
86 Long term
87 Insurance technical reserves
88 Trade credit and advances
89 Short term
90 Long term
91 General government
92 Trade credit and advances
93 Long term
94 Special drawing rights allocations
To Contents

Part III. Statistical Methodology of International Transactions Accounts
Bureau of Economic AnalysisU.S. International Economic Accounts: Concepts and Methods
169
Departures from BPM6
18.4. The components of other investment in the International Monetary Fund Balance of Payments and International Investment Position Manual, Sixth Edition (BPM6) include insurance, pension, and standardized guarantee schemes. This component consists of insurance technical reserves (pre-payments of premiums and reserves against outstanding insurance claims), pension entitlements (the claims of pensioners on their employers or pension funds), and provisions for calls under standardized guarantees (prepayments of net fees and provisions to meet outstanding calls under standardized loan guarantees). Because of a lack of source data, financial transactions and positions in the ITAs and the International Investment Position (IIP) Accounts are not separately reported for insurance technical reserves and do not include standardized guarantees.
18.5. While source data for transactions related to pension entitlements and standardized guarantee schemes are not sufficient for preparing statistics, cross-border transactions in pension entitle-ments and standardized guarantees are believed to be negligible.
18.6. Also, in some cases the Bureau of Economic Analysis (BEA) uses slightly different terminology and slightly different sector detail. For example, BEA uses the term trade credit and advances because it is the only item for which source data are available under the BPM6 component other accounts receivable/payable.
18.7. Currently, BEA is not able to provide separate estimates of certain transactions in other equity. Other equity is equity that is not in the form of securities. It can include equity in institutions such as branches, trusts, limited liability and other partnerships, unincorporated funds, and notional units for ownership of real estate and other natural resources. Source data for these types of transactions are not separately available and are partly commingled with equity reported in the Treasury International Capital (TIC) system, which is included in portfolio investment. The owner-ship of many international financial institutions is not in the form of securities and is thus classified as other equity. BEA’s estimates of transactions in other equity assets cover equity in these interna-tional financial institutions.
18.8. In BEA’s presentation, the sectors “other financial institutions” and “nonfinancial institutions excluding general government” are combined, mainly because counterparty data used to supple-ment TIC survey data do not distinguish between U.S. financial institutions and nonfinancial non-bank institutions.
Data sources
18.9. U.S. Department of the Treasury (Treasury Department). Claims and liabilities for deposits, loans, and insurance technical reserves are reported by financial institutions on the TIC B forms. Deposits, loans, and trade credit and advances are reported by nonfinancial institutions on the
To Contents

Part III. Statistical Methodology of International Transactions Accounts
Bureau of Economic AnalysisU.S. International Economic Accounts: Concepts and Methods
170
TIC C forms beginning in December 2013.26 (See chapter 3 for more details on the TIC data.) Administrative data from the Monthly Treasury Statement and the Treasury Department’s Foreign Credit Reporting System are used to estimate other equity assets and to supplement estimates of loan assets.
18.10. Values on the TIC B and C forms are reported at their original contractual values (face value). Changes in prices in the secondary markets for assets and liabilities reported on the TIC B and C forms are assumed to have little or no impact on the reported positions. Write-offs of assets are reported on the TIC B forms and, if write-offs are significant, estimates of transactions are adjusted to exclude the impact of write-offs. Other known inconsistencies between reported quarterly bal-ances, caused by the addition of new respondents or corrected reporting, are also reported to BEA so that the changes in quarterly balances caused by these inconsistencies can be removed from total changes in balances when estimating transactions.
18.11. BEA survey data. BEA uses data reported on BEA BE–577 and BE–605 direct investment surveys to adjust the TIC source data by removing transactions covered in direct investment.
18.12. U.S. Department of Defense (DOD). Advance payments for sales of military goods to foreign governments are reported to BEA. U.S. government liabilities to foreign governments for these advance payments are classified as payments for trade credit and advances in the general govern-ment sector.
18.13. U.S. government administrative data. U.S. government agencies that engage in international transactions report these transactions quarterly to BEA as required under Office of Management and Budget (OMB) Statistical Directive No. 19. Loans by the U.S. government to foreign residents are mostly made under programs enacted by the U.S. Congress for the provision of foreign assis-tance, requiring repayment over a period of years, usually with interest.
18.14. Federal Reserve Board (FRB). Net shipments of U.S. currency into and out of the United States are provided by the FRB to BEA to measure increases and decreases in foreign holdings of U.S. cur-rency. These transactions are not captured elsewhere in statistical reporting systems.
18.15. Federal Reserve Bank of New York (FRBNY). The Treasury and Federal Reserve Foreign Exchange Operations Report from the FRBNY provides data for transactions in central bank liquidity swaps. The report of foreign central bank account balances at the FRBNY provides key data for central bank sector deposit transactions.
26. Prior to December 2013, U.S. banks, bank holding companies, financial holding companies, and securities brokers and dealers reported deposits and loans on the TIC B forms, and other types of financial intermediaries, nonfinancial institutions, and nonprofit institutions reported deposits, loans, insurance technical reserves, and trade credit and advances on the TIC C forms.
To Contents
Part III. Statistical Methodology of International Transactions Accounts
Bureau of Economic AnalysisU.S. International Economic Accounts: Concepts and Methods
171
18.16. International Monetary Fund (IMF). The IMF issues press releases and posts information on its website when it implements significant decisions, such as allocating new SDRs to members or increasing member quotas. Recommendations by the IMF Executive Board for such actions must be ratified by member countries before they can be implemented.
18.17. Depository Trust and Clearing Corporation (DTCC). Claims of U.S. nonbank firms include loans associated with the issuance of asset-backed commercial paper (ABCP) that are not captured in other source data. Estimates of loan transactions between U.S. affiliates located in Delaware and their offshore parents are estimated from DTCC records for selected ABCP program.
18.18. Supplemental counterparty data. Bilateral comparisons between U.S. statistics and comparable statistics from foreign banks for loans and deposits show that U.S. statistics, collected directly from U.S. nonbank firms, understate the external claims and liabilities of U.S. nonbank firms vis-à-vis foreign banks. The foreign banking data are from the central banks of the United Kingdom and Germany; from the Bank for International Settlements (BIS) for Austria, Belgium, France, Ireland, Luxembourg, the Netherlands, and Spain; and from FRB reports for banks in the Bahamas and the Cayman Islands.
Estimation methods
18.19. Estimation methods are described below for each of the major published components. These com-ponents include other equity, currency, deposits, loans, insurance technical reserves, trade credit and advances, and SDRs. Unless otherwise noted, methods are the same for U.S. asset transactions and U.S. liability transactions.
Other equity
18.20. Transactions in other equity include financial transactions in equity that is not in the form of securities and that is not included in the direct investment or reserves functional categories. BEA’s other investment statistics include transactions related to U.S. government equity stakes in inter-national organizations other than the IMF that do not issue securities. BEA currently lacks source data to provide estimates related to financial transactions in other equity liabilities.
18.21. Statistics for transactions in other equity assets are based on U.S. government capital subscriptions and contributions to international financial institutions reported by the Treasury Department in the Monthly Treasury Statement. Transactions in these assets are recorded in the general govern-ment sector in ITA table 8.1.
Currency
18.22. Transactions in U.S. currency liabilities are equal to net shipments of U.S. currency into and out of the United States. Net disbursements of $100 notes from FRB cash offices to foreign wholesale
To Contents

Part III. Statistical Methodology of International Transactions Accounts
Bureau of Economic AnalysisU.S. International Economic Accounts: Concepts and Methods
172
banks serve as the measure of currency flows. In a typical transaction, foreign wholesale banks pur-chase notes from the FRB for distribution to customers abroad. Foreign wholesale banks also sell back to the FRB notes unfit for further circulation or excess balances of notes.
18.23. U.S. currency liabilities are liabilities of the U.S. central bank, and transactions in U.S. currency lia-bilities are recorded in the central bank sector in ITA table 8.1. Transactions in these liabilities are excluded from ITA table 9.1 because they are not liabilities to foreign official agencies.
Deposits
18.24. U.S. deposit claims and liabilities with foreign residents include those reported by U.S. financial and nonfinancial institutions both for their own account and for their customers on the TIC B and C forms. Also included are the deposit claims and liabilities of the FRB with foreign central banks reported by the FRBNY.
18.25. Statistics for transactions in deposit claims and liabilities of U.S. financial and nonfinancial institu-tions are based on changes in quarterly holdings as reported on the TIC B and C forms, which are supplemented by changes in quarterly holdings of deposits placed in foreign banks by U.S. nonbank firms estimated from counterparty data from foreign banks. The computed changes in holdings are adjusted to remove the impact of any changes in holdings not caused by transactions, such as changes in exchange rates or reporting panels for the TIC surveys. (See paragraphs 26.33 and 26.34 for information about the estimation of exchange-rate changes.)
18.26. Assets held abroad by the FRB as the result of central bank liquidity swaps with foreign central banks are classified in other investment as deposits of the U.S. central bank in foreign central banks. Transactions in these deposits are equal to changes in quarterly swap balances reported by the FRBNY. These deposits are excluded from U.S. reserve assets because they are held until the swap is reversed and are not available for other purposes. The FRBNY also reports to BEA the FRB’s deposit liabilities and its liabilities from repurchase agreements with foreign central banks. The liabilities from repurchase agreements are classified as deposits following BPM6 guidelines. Transactions are equal to changes in the liability balances reported by the FRBNY.
18.27. Transactions in U.S. deposit liabilities for all U.S. sectors with foreign official agencies are estimated from changes in deposit liabilities to foreign official agencies available separately on the TIC BL–1 form. These liabilities include those of the FRB. These transactions are presented in ITA table 9.1.
18.28. U.S. deposit claims and liabilities by sector are presented in ITA table 8.1. Central bank deposit claims received by the FRB in central bank liquidity swaps are short-term and the deposits are denominated in foreign currencies. Deposits placed in foreign banks by U.S. deposit-taking institu-tions except central bank are estimated from separate reports by deposit-taking institutions on the TIC B forms.
To Contents
Part III. Statistical Methodology of International Transactions Accounts
Bureau of Economic AnalysisU.S. International Economic Accounts: Concepts and Methods
173
18.29. U.S. central bank deposit liabilities to foreign central banks include liabilities from repurchase agreements. Repurchase agreements are short-term and the other deposit liabilities are available to foreign central banks on short notice, so these are classified as short-term liabilities. Deposit lia-bilities of U.S. deposit-taking institutions except central bank with foreign residents are estimated from separate reports by deposit-taking institutions on the TIC B forms.
18.30. Securities brokers, classified in the other financial institutions sector, hold brokerage balances in brokerage accounts for their customers that are very similar to deposits. Many investors use their brokerage balances like deposit accounts and many brokers pay interest on the accounts and offer limited or unlimited check writing on the accounts. Because of the similarity of brokerage bal-ances to deposits, BEA records transactions in brokerage balances in the deposit liability category. Transactions of U.S. securities brokers with foreign residents in brokerage balances are estimated from separate reports by securities brokers on the TIC B forms.
Loans
18.31. U.S. loan claims and liabilities with foreign residents include those reported by U.S. financial and nonfinancial institutions both for their own account and for their customers on the TIC B and C forms. Also included are loan claims on foreign residents reported by U.S. government agencies, mainly under foreign assistance programs, in administrative data.
18.32. BEA adjusts the TIC data by removing transactions in owner’s equity between financial institutions and unincorporated branches and by removing debt transactions between U.S. financial institutions and nonfinancial foreign affiliates, which are covered in direct investment, from transactions in loan claims and loan liabilities computed from the TIC B forms. The loan transactions removed are covered in the TIC B forms because, in the case of owner’s equity, positions in owner’s equity in unincorporated branches cannot be separated from other intercompany positions in the TIC B reporting. In the case of debt between U.S. financial companies and nonfinancial foreign affiliates, the TIC B reporting applies to all loans made by U.S. financial companies, whether the foreign entity is affiliated or not. Direct investment includes intercompany debt between U.S. financial companies and nonfinancial foreign affiliates. These adjustments are based on data reported on BEA’s direct investment surveys.
18.33. Statistics for loan transactions between U.S. financial and nonfinancial institutions and foreign res-idents are based on changes in quarterly holdings as reported on the TIC B and C forms. TIC data are supplemented by (1) loan claims data from the DTCC and (2) loan claims and loan liabilities of U.S. nonbank firms with foreign banks based on supplementary counterparty data from foreign banks. The computed changes in holdings from the TIC data are adjusted to remove the impact of any changes in holdings not caused by transactions, such as changes in exchange rates or TIC sur-vey reporting panels. (See paragraph 26.44 for information about the estimation of exchange-rate changes.) Loan transactions for this sector are reported separately in ITA table 8.1.
To Contents

Part III. Statistical Methodology of International Transactions Accounts
Bureau of Economic AnalysisU.S. International Economic Accounts: Concepts and Methods
174
18.34. Statistics for transactions in U.S. government loan claims are based on data submitted by U.S. gov-ernment operating agencies under OMB Statistical Directive No. 19. BEA supplements these data with information from (1) quarterly statements of receipts, expenditures, and balances of foreign currency holdings provided by the Treasury Department; (2) published financial statements; (3) annual reports and other submissions to the U.S. Congress; and (4) the financial and operating records of other U.S. government agencies. Loan transactions for this sector are reported separately in ITA table 8.1.
18.35. Transactions in U.S. loan claims on foreign residents by U.S. deposit-taking institutions except cen-tral bank are estimated using separate reports from deposit-taking institutions on the TIC B forms. Loan liabilities of U.S. deposit-taking institutions except central bank with foreign residents are estimated using separate reports from deposit-taking institutions on the TIC B forms. Loan trans-actions for this sector are reported separately in ITA table 8.1.
18.36. U.S. loan liabilities of all U.S. sectors with foreign official agencies are estimated from changes in loan liabilities to foreign official agencies available separately on the TIC BL–1 and BL–2 forms. These loan transactions are presented in ITA table 9.1.
Insurance technical reserves
18.37. Source data for transactions in insurance technical reserves do not capture enough of the activity in these technical reserves to use to estimate these transactions separately; in ITA table 8.1 these transactions are commingled with transactions in loans. Insurance technical reserves are not liabil-ities to foreign official agencies and are therefore not relevant for inclusion in ITA table 9.1.
Trade credit and advances
18.38. Transactions in claims and liabilities with foreign residents from trade credit and advances include those reported by U.S. financial and nonfinancial institutions on the TIC CQ–2 form. Also included are transactions in the liabilities of the U.S. government to foreign governments from funds advanced mainly for the purchase of military goods and services reported to BEA by DOD.
18.39. Trade credit and advances of other U.S. financial institutions and nonfinancial institutions are esti-mated from changes in quarterly holdings reported on the TIC CQ–2 form. The computed changes in holdings are adjusted to remove the impact of any changes in holdings not caused by transac-tions. (See paragraph 26.56 for information about the estimation of exchange-rate changes.) Claims and liabilities are reported in ITA table 8.1. The liabilities are not liabilities to foreign official agen-cies and are therefore not relevant for inclusion in ITA table 9.1.
18.40. U.S. government transactions in liabilities from advance payments for foreign purchases of goods and services that are mainly for military use are the sum of (1) U.S. government cash receipts from foreign governments for purchases of military goods and services and (2) the financing of military sales by U.S. government credits and grants. Netted against this gross total are (3) the part of the
To Contents

Part III. Statistical Methodology of International Transactions Accounts
Bureau of Economic AnalysisU.S. International Economic Accounts: Concepts and Methods
175
receipts from foreign governments that represents principal repayments on credits financing mili-tary agency sales contracts, (4) issues of special U.S. Treasury securities that are subject to redemp-tion prior to maturity for the purpose of prepaying for military purchases in the United States, and (5) the counterpart to the value of deliveries of military goods and services recorded in the goods and services accounts. These liabilities are classified as long-term liabilities because contracts for the foreign purchases of goods and services are generally long-term arrangements. Estimates of these U.S. liabilities are presented in ITA tables 8.1 and 9.1.
Special drawing rights (SDR) allocations
18.41. SDR allocations to the United States and other countries through a collective decision of IMF-member governments are rare. The most recent allocations occurred in the third quarter of 2009 and were widely publicized in IMF and other publications. Data on future SDR allocations will continue to be obtained from IMF publications and databases.
18.42. By sector, SDR allocations are liabilities of the Treasury Department to other governments that participate in the SDR program and are classified in the general government sector. Transactions are presented in ITA tables 8.1 and 9.1.
To Contents
Part III. Statistical Methodology of International Transactions Accounts
Bureau of Economic AnalysisU.S. International Economic Accounts: Concepts and Methods
176
Chapter 19. Financial-Account Reserve Assets
Concepts and coverage
19.1. Reserve assets are those external assets that are readily available to and controlled by monetary authorities for meeting balance of payments financing needs, for intervening in exchange markets to affect the currency exchange rate, and for other related purposes such as maintaining confidence in the currency and the economy and serving as a basis for foreign borrowing. The major published components in the International Transactions Accounts (ITAs) are monetary gold, International Monetary Fund (IMF) special drawing rights (SDRs), reserve position in the IMF, and other reserve assets.
19.2. Other reserve assets enable the United States to hold foreign currency balances that are highly liquid and that are available for intervention sales. U.S. foreign currency balances include deposits, debt securities, and repurchase agreements that are classified as “other.” The United States does not have financial derivatives in its reserve assets.
19.3. Excluded from transactions are changes in the value of reserve assets attributable to holding gains and losses, which are not considered to be international transactions. Thus, changes in the value of assets that arise from fluctuations in the market price of gold and from fluctuations in the exchange market value of the dollar vis-à-vis foreign currencies and SDRs are excluded. Also excluded are reclassifications arising from monetizations and demonetizations of monetary gold by monetary authorities. These exclusions are, however, included in the International Investment Position (IIP) Accounts as valuation adjustments.
19.4. Transactions in nonmonetary gold—gold exported or imported in forms such as ore, scrap and base bullion, refined bullion, and coins and medallions—are not included with transactions in monetary gold; they are included in goods exports and goods imports.
19.5. Transactions in reserve assets are recorded in lines 82–90 of ITA table 1.2. The Bureau of Economic Analysis (BEA) does not provide a dedicated ITA table focusing on reserve assets.
Departures from BPM6
19.6. The coverage and presentation of reserve assets closely follow recommendations from the International Monetary Fund Balance of Payments and International Investment Position Manual, Sixth Edition (BPM6).
To Contents

Part III. Statistical Methodology of International Transactions Accounts
Bureau of Economic AnalysisU.S. International Economic Accounts: Concepts and Methods
177
Data sources
19.7. U.S. Department of the Treasury (Treasury Department). Data on U.S. reserve assets are pub-lished by the U.S. Department of the Treasury (Treasury Department) in terms of holdings (out-standing amounts). BEA also uses Treasury Department source data on the gold stock.
19.8. Federal Reserve Bank of New York (FRBNY). The Interest Collected Report includes interest earned on U.S. reserves and central bank liquidity swaps. This report records the net acquisition of reserves through interest receipts.
19.9. International Monetary Fund (IMF). The IMF provides month-end position data and daily increases and decreases during each month for the U.S. accounts at the IMF. The data include posi-tions and transactions between the United States and the IMF for the SDR account and the General Resources (tranche) Account and its subaccounts covering securities, valuation adjustments, and IMF borrowing from the United States.
Estimation methods
19.10. Descriptions are provided below for each published reserve asset component and classification.
Monetary gold
19.11. Transactions in monetary gold are rare. Such transactions can only take place with another mone-tary authority or with an international institution such as the IMF that is authorized to hold mone-tary gold. If transactions were to take place, BEA would obtain from the Treasury Department data for the quantity of gold transferred out or received from the counterparty, either in ounces or in dollars at a known price. If daily data were available, BEA would value the daily gold transactions using the afternoon (PM) fix in the London market for each day. If transactions occurred over a period of time and daily data were not available, the transactions over the period would be valued at an average price of gold over that period. Transactions valued using the PM fix for the gold price in London would be aggregated and reported quarterly. BEA checks the gold stock report from Treasury monthly to determine if monetary gold stocks have changed.
Special drawing rights (SDRs)
19.12. The SDR is an international reserve asset, created by the IMF in 1969 to supplement its member countries’ official reserves. Its value is based on a basket of four key international currencies, and SDRs can be exchanged for freely usable currencies. The SDR is neither a currency nor a claim on the IMF. Rather, it is a potential claim on the freely usable currencies of IMF members. In addition to its role as a supplementary reserve asset, the SDR serves as the unit of account of the IMF and some other international organizations. The value of the SDR in terms of the U.S. dollar is
To Contents

Part III. Statistical Methodology of International Transactions Accounts
Bureau of Economic AnalysisU.S. International Economic Accounts: Concepts and Methods
178
determined daily and posted on the IMF’s website. It is calculated as the sum of specific amounts of the four basket currencies valued in U.S. dollars on the basis of exchange rates quoted at noon each day in the London market.
19.13. Transactions in SDRs can take place with the IMF, which uses the SDR as a common unit of account for transactions with member countries, or with other countries and institutions that subscribe to the SDR. Generally, all U.S. transactions in SDRs are conducted through the U.S. SDR account at the IMF with the IMF as the immediate foreign counterparty.
19.14. BEA converts daily increases or decreases caused by transactions in the U.S. SDR account from SDRs to U.S. dollars at the conversion rate in effect on that date. These daily transactions are aggre-gated into quarterly financial flows for the ITAs.
Reserve position in the IMF
19.15. The U.S. reserve position in the IMF is comprised of the U.S. General Resources, or tranche, Account plus any borrowing by the IMF from the United States through the General Arrangements to Borrow, the New Arrangements to Borrow, or other borrowing facilities. The U.S. General Resources Account is equal to the U.S. quota in the IMF less IMF holdings of dollars, excluding dollar holdings in IMF administrative and subsidiary accounts. Thus, the reserve position is affected by changes in the U.S. quota, changes in IMF holdings of U.S. dollars, and changes in bal-ances borrowed from the United States by the IMF. Transactions in the reserve position in the IMF are equal to transactions in the General Resources Account plus transactions from IMF borrowings or repayments.
19.16. Transactions from IMF borrowings or repayments are provided for each day of the reporting month to BEA by the IMF. BEA converts daily increases or decreases from SDRs to U.S. dollars at the conversion rate in effect on that date. These daily transactions are aggregated into quarterly financial flows for the ITAs.
19.17. Transactions in the General Resources Account are computed by deducting valuation changes from the total change in balance of the account, which is equal to the U.S. holdings at the end of the reference quarter converted to U.S. dollars, less the U.S. holdings at the end of the previous quarter converted to U.S. dollars. The valuation changes are computed from the change in the SDR/U.S. dollar conversion rate and valuation adjustments to IMF holdings of U.S. dollars. The SDR/U.S. dollar conversion rate and valuation adjustments to IMF holdings of U.S. dollars are provided to BEA by the IMF.
Other reserve assets
19.18. Other reserve assets can include currency and deposits, securities, financial derivatives, and other claims, such as repurchase agreements that are readily redeemable in foreign currencies to enable
To Contents
Part III. Statistical Methodology of International Transactions Accounts
Bureau of Economic AnalysisU.S. International Economic Accounts: Concepts and Methods
179
the monetary authorities to carry out timely interventions in the foreign exchange market or to facilitate balance of payments financing. The United States does not have financial derivatives in its reserve assets.
19.19. The U.S. monetary authorities invest their foreign currency reserves in a variety of instruments that yield market rates of return and have a high degree of liquidity and credit quality. To the greatest extent practicable, the investments are split evenly between the System Open Market Account at the Federal Reserve Board (FRB) and the Exchange Stabilization Fund at the Treasury Department.
19.20. A significant portion of the U.S. monetary authorities’ foreign exchange reserves is invested on an outright basis in German, French, Dutch, and Japanese government securities. Foreign currency reserves are also invested at official institutions such as the Bank for International Settlements and foreign central banks.
19.21. Intervention in the foreign exchange market by U.S. monetary authorities is relatively rare. It is much more common for transactions in other reserve assets to reflect income earned on the depos-its, securities, and repurchase agreements. The interest collected on these investments is reported by the FRBNY to BEA. This interest is entered by type of investment into the U.S. reserve assets as an increase in assets and into investment income on U.S. reserve assets.
19.22. Intervention purchases and sales of assets are also reported to BEA by type of investment by the Federal Reserve Board so that the appropriate increase or decrease in deposits, securities, or repur-chase agreements can be recorded in the accounts. Purchases or sales of foreign currency would be recorded in nominal U.S. dollar amounts at the exchange rates in effect at the time of the trans-actions. The impact of changes in exchange rates on the value of reserve assets is excluded from transactions and is reflected in price and exchange-rate changes recorded in the IIP Accounts.
To Contents

Part III. Statistical Methodology of International Transactions Accounts
Bureau of Economic AnalysisU.S. International Economic Accounts: Concepts and Methods
180
Chapter 20. Financial-Account Financial Derivatives Other Than Reserves
Concepts and coverage
20.1. Financial derivatives contracts are financial instruments whose value is derived from the value of one or more underlying security, equity index, debt instruments, commodity, other deriva-tive instrument, or any agreed upon pricing index or arrangement. Financial derivatives include futures, options, and swaps, and they can be traded on exchanges or in over-the-counter markets. Cross-border transactions in financial derivatives consist of U.S. cash receipts and payments aris-ing from the sale, purchase, periodic settlement, or final settlement of financial derivatives con-tracts. Financial derivatives are a type of financial instrument and financial derivatives other than reserves is a functional category. Transactions in financial derivatives were introduced into the International Transactions Accounts (ITAs) beginning with statistics for the first quarter of 2006.
20.2. Transactions are reported in the source data on a net settlements basis as U.S. cash receipts less payments on individual contracts grouped into reporting categories. Because of the difficulty in characterizing transactions as arising from assets (contracts with positive fair values) or from lia-bilities (contracts with negative fair values), transactions for assets and liabilities are not separately reported. Thus, net settlements are presented in the ITAs in ITA table 1.2 on a single line (line 107), separate from net U.S. acquisition of assets and net U.S. incurrence of liabilities.
Departures from BPM6
20.3. The coverage of financial derivatives other than reserves follows recommendations from the International Monetary Fund Balance of Payments and International Investment Position Manual, Sixth Edition (BPM6) for the net reporting of transactions when gross reporting is not feasible. However, BPM6 also recommends that (1) employee stock options be included with financial derivatives other than reserves and (2) when financial derivatives are reported net they should be reported as a component of assets. BEA does not follow the first recommendation because source data are not available for employee stock options. For the second recommendation, BEA prefers to present transactions in U.S. assets and U.S. liabilities excluding financial derivatives for analytical purposes. The functional category, financial derivatives other than reserves, net transactions, is pre-sented as a component of the financial account separately from transactions in U.S. assets and U.S. liabilities.
To Contents

Part III. Statistical Methodology of International Transactions Accounts
Bureau of Economic AnalysisU.S. International Economic Accounts: Concepts and Methods
181
Data sources
20.4. U.S. Department of the Treasury (Treasury Department). Comprehensive data on financial derivatives are collected on Treasury International Capital (TIC) Form D, “Report of Holdings of, and Transactions in, Financial Derivatives Contracts.” Data are collected quarterly from U.S. banks, bank holding companies, financial holding companies, securities dealers, and all other firms with worldwide holdings of financial derivatives, for their own and their customers’ accounts combined, in excess of $400 billion in notional value or in excess of $400 million in total net settlements. Trading in financial derivatives is highly concentrated among a small number of large firms.
20.5. Survey respondents provide net settlements data following specific steps. Receipts of cash by U.S. residents from foreign residents are treated as positive amounts, and payments of cash by U.S. residents to foreign residents are treated as negative amounts. The receipts and payments for all contracts are summed for each reporting category. A net settlement cash receipt or payment occurs only when cash is received or paid for the purchase or sale of a derivative, or a settlement payment (such as the periodic settlement under a swap agreement or the daily settlement of an exchange-traded contract) is received or paid.
Estimation methods
20.6. Published statistics are equal to net settlements from the TIC D form with the sign reversed. The sign is reversed because net settlements from TIC D form have a positive sign when U.S. receipts of cash from foreign residents exceed U.S. payments of cash to foreign residents, and these net U.S. receipts, which represent net U.S. borrowing from financial-account transactions, are recorded with a negative sign in the ITAs. Similarly, net U.S. payments have a negative sign in the TIC source data, and net U.S. payments, which represent net U.S. lending from financial-account transactions, are recorded with a positive sign in the ITAs.
To Contents
Part III. Statistical Methodology of International Transactions Accounts
Bureau of Economic AnalysisU.S. International Economic Accounts: Concepts and Methods
182
Chapter 21. Statistical Discrepancy and Balances
Statistical discrepancy
21.1. The statistical discrepancy is the amount that balances the sum of the recorded credits and debits underlying the international Transactions Accounts (ITAs).
21.2. The statistical discrepancy is the difference between total debits and total credits recorded in the current, capital, and financial accounts. A positive value indicates that recorded debits (inflows) exceed recorded credits (outflows), and a negative value indicates that recorded credits exceed recorded debits. The statistical discrepancy can be calculated as the difference between net lend-ing/borrowing as measured by transactions recorded in the current and capital accounts and as measured by transactions recorded in the financial account.
21.3. Errors and omissions in recorded transactions may exist in any account or component and may arise for many reasons. Statistical reporting systems may be inaccurate in their measurement or may be incomplete in their coverage. Such systems may overlap in their coverage of transactions or completely miss transactions that do not fall clearly under one reporting system or the other. Statistical reporting systems, which are often independent of each other, must capture opposite sides of the same transaction identically for net errors and omissions to be zero. For example, the total value for U.S. purchases of goods measured in one reporting system must be the same as the total value for the payments for those goods measured in another system. Finally, some ITA com-ponents do not lend themselves to direct measurement and must be estimated indirectly from eco-nomic data series; these statistics depend critically on the adequacy of source data and estimation methods.
21.4. The greatest challenges for statistical reporting systems often result from rapid changes in economic and financial markets. During the economic cycle of 1997–2002, numerous and large mergers and acquisitions were difficult to track and measure accurately. Throughout the 1990s and 2000s, the evolution and development of complex financial derivatives were incompletely recorded in the accounts for nearly the entire period. The rapid expansion in 2003–2008 of hedge funds, many of which operated from offshore locations, proved especially difficult to track because of the inability to locate officials responsible for reporting transactions. The securitization of assets in 2003–2008 and the establishment of special investment vehicles abroad to borrow funds in the United States for distribution abroad escaped tracking by traditional reporting systems. Difficulties in recording the process of securitization were compounded by the rapid run up in leveraging and then deleveraging of these activities.
To Contents

Part III. Statistical Methodology of International Transactions Accounts
Bureau of Economic AnalysisU.S. International Economic Accounts: Concepts and Methods
183
21.5. It is not unreasonable to expect that the size and volatility of fluctuations in the statistical dis-crepancy might increase in times of heightened uncertainty and increased activity in the financial markets. In fact, such a tendency has been demonstrated in the past. The statistical discrepancy increased sharply in absolute value about the time of the 1997–1998 financial crisis that started in East Asia as well as during the 2008 global financial crisis. However, the relationship is not strong, and the discrepancy may also be large in periods of relative stability in financial markets. If both sides of a transaction are absent from the statistical reporting systems, the statistical discrepancy is unaffected, but the accounts will still contain errors, inaccuracies, or gaps in coverage.
21.6. Analysis of the statistical discrepancy could identify data problems, such as gaps in coverage or misreporting. A consistently positive or negative sign may indicate a bias in one or more of the underlying components. For example, a positive statistical discrepancy indicates that credit entries, such as exports or income receipts, are understated or omitted, or that debit entries, such as imports or income payments, are overstated. However, the ability to use analysis of the statistical discrepancy to identify data problems is limited by the fact that measurement errors in opposite directions offset each other.
21.7. At the global level, the statistical discrepancy represents net errors and omissions in recorded transactions. For individual partner countries and regions, in addition to errors and omissions, it also reflects discrepancies that arise when transactions with one country or region are settled through transactions with another country or region. These transfers of funds between foreign areas often occur because the dollar is used extensively in settling international transactions and forms a large part of the foreign currency reserves of many countries. Therefore, changes in dollar balances held by one country often cannot be accounted for by U.S. transactions with that country. Consequently, the statistical discrepancies included in the country and area statistics of the International Economic Accounts cannot be interpreted as a measure of the area distribution of global errors and omissions. Instead, they reflect a combination of errors and omissions and third-country settlements.
Balances
21.8. ITA table 1.2 includes a section with balances on the current account, on major current-account components, and on the capital account. It also includes closely related measures of net lending or net borrowing. In the current and capital accounts, a balance is defined as credits less debits for some category of transactions.
Balance on current account
21.9. The balance on the current account is the featured net measure in the ITAs of transactions between the United States and the rest of the world. The current-account balance is the difference between
To Contents

Part III. Statistical Methodology of International Transactions Accounts
Bureau of Economic AnalysisU.S. International Economic Accounts: Concepts and Methods
184
credits (exports of goods and services and income receipts) and debits (imports of goods and ser-vices and income payments) in the current account. A positive balance indicates a current-account surplus. A negative balance indicates a current-account deficit.
21.10. ITA table 1.2 includes balances on major current-account components, namely the balance on goods and services, the balance on goods, the balance on services, the balance on primary income, and the balance on secondary income. Although in principle balances can shift from surplus to deficit or vice versa, in practice the quarterly balances on goods and services, goods, and secondary income have been in deficit, and the quarterly balances on services and primary income have been in surplus, since 1999 or earlier.
Balance on capital account
21.11. The balance on the capital account has been in deficit in most quarters, but it occasionally shifts to surplus in quarters for which capital transfer receipts for large disaster-related insurance losses are recorded, as foreign insurance companies indemnify customers for catastrophes in the United States.
Net lending or net borrowing from current- and capital-account transactions
21.12. The combined balance on the current and capital accounts is a measure of U.S. net lending to for-eign residents or net borrowing from abroad. Net lending or net borrowing measures the balance of funds supplied to the rest of the world. Net lending means that, in net terms, the U.S. economy supplies funds to the rest of the world. Net borrowing means the opposite. A combined surplus on the current and capital accounts indicates that the United States is a net lender; a combined deficit indicates that the United States is a net borrower. The net lending or net borrowing terminology reflects the accounting identity that deficits in the current and capital accounts must be financed by inflows of borrowing from abroad and that surpluses in these accounts are offset by outflows of lending to nonresidents.
Net lending or net borrowing from financial-account transactions
21.13. Net lending or net borrowing can also be measured from financial-account transactions; such transactions more directly reflect lending and borrowing activities. In the financial account, net lending or net borrowing is measured as net acquisition of financial assets less net incurrence of liabilities (including transactions in financial derivatives). Conceptually, the financial-account mea-sure of net lending or net borrowing equals the measure from the current and capital accounts. In practice, the two measures differ by the statistical discrepancy.
To Contents
Part IV. Statistical Methodology of International Investment Position Accounts
Bureau of Economic AnalysisU.S. International Economic Accounts: Concepts and Methods
185
Part IV. Statistical Methodology of International Investment Position Accounts
Chapter 22. Introduction to the International Investment Position Accounts
22.1. The International Investment Position (IIP) Accounts are a statistical summary produced by the U.S. Bureau of Economic Analysis (BEA) of the dollar value of accumulated stocks of U.S. finan-cial assets and liabilities with respect to foreign residents at a specific point in time. The U.S. net international investment position is the value of U.S. financial assets less the value of U.S. liabilities. The IIP Accounts are classified and presented for each of the five functional categories of invest-ment discussed in chapter 9, which is the same organizational structure used for primary income in the current account of the International Transactions Accounts (ITAs) and for transactions in the financial account of the ITAs.
22.2. This chapter presents an overview of the IIP Accounts. The remaining chapters in part IV pres-ent the methodologies for statistics published in the IIP Accounts organized by major functional category. Chapter 23 covers direct investment, chapter 24 covers portfolio investment, chapter 25 covers financial derivatives other than reserves, chapter 26 covers other investment, and chapter 27 covers reserve assets.
22.3. Included in the chapters in part IV are descriptions of concepts and coverage, including departures from the International Monetary Fund Balance of Payments and International Investment Position Manual, Sixth Edition (BPM6) data sources, and estimation methods for the published components. For many of the accounts, the data sources identified in part III are available only with a lag—that is, not in time to be used for the most recent reference period(s). Appendix D outlines the sources and methods BEA uses to estimate the IIP Accounts when the source data described in Part IV are not yet available.
To Contents
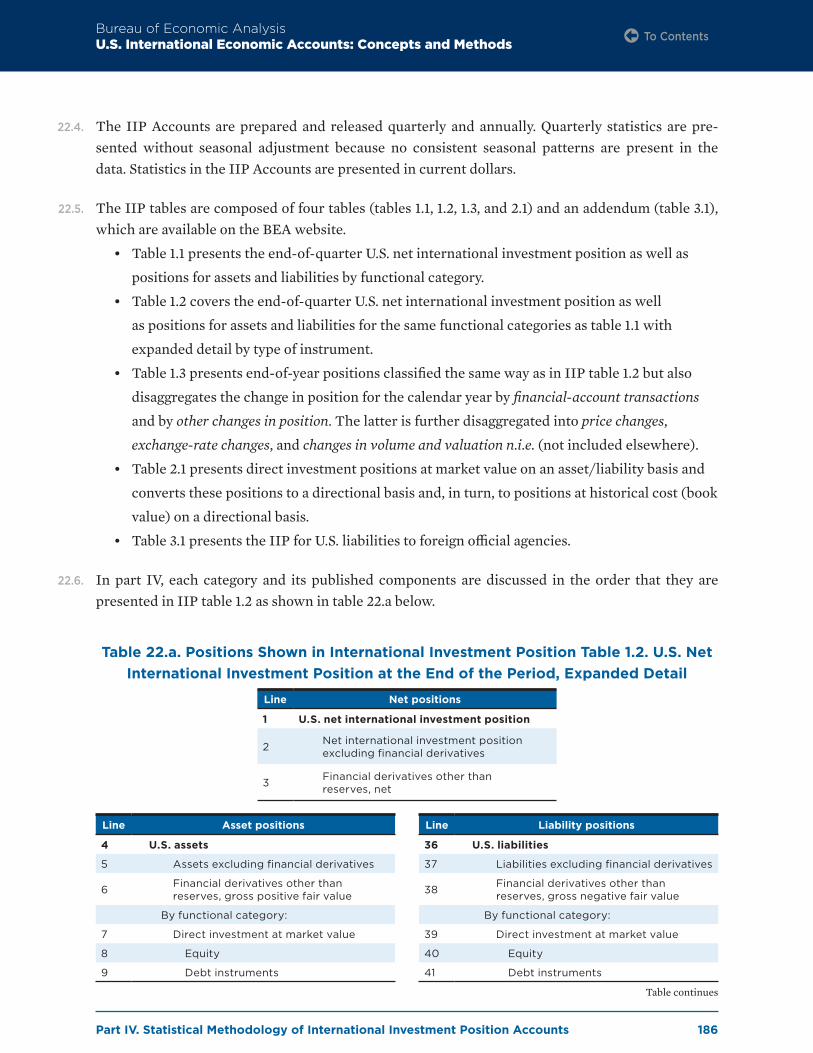
Part IV. Statistical Methodology of International Investment Position Accounts
Bureau of Economic AnalysisU.S. International Economic Accounts: Concepts and Methods
186
22.4. The IIP Accounts are prepared and released quarterly and annually. Quarterly statistics are pre-sented without seasonal adjustment because no consistent seasonal patterns are present in the data. Statistics in the IIP Accounts are presented in current dollars.
22.5. The IIP tables are composed of four tables (tables 1.1, 1.2, 1.3, and 2.1) and an addendum (table 3.1), which are available on the BEA website.
• Table 1.1 presents the end-of-quarter U.S. net international investment position as well as
positions for assets and liabilities by functional category.
• Table 1.2 covers the end-of-quarter U.S. net international investment position as well
as positions for assets and liabilities for the same functional categories as table 1.1 with
expanded detail by type of instrument.
• Table 1.3 presents end-of-year positions classified the same way as in IIP table 1.2 but also
disaggregates the change in position for the calendar year by financial-account transactions
and by other changes in position. The latter is further disaggregated into price changes,
exchange-rate changes, and changes in volume and valuation n .i .e . (not included elsewhere).
• Table 2.1 presents direct investment positions at market value on an asset/liability basis and
converts these positions to a directional basis and, in turn, to positions at historical cost (book
value) on a directional basis.
• Table 3.1 presents the IIP for U.S. liabilities to foreign official agencies.
22.6. In part IV, each category and its published components are discussed in the order that they are presented in IIP table 1.2 as shown in table 22.a below.
Table 22.a. Positions Shown in International Investment Position Table 1.2. U.S. Net International Investment Position at the End of the Period, Expanded Detail
Line Asset positions
4 U.S. assets
5 Assets excluding financial derivatives
6 Financial derivatives other than reserves, gross positive fair value
By functional category:
7 Direct investment at market value
8 Equity
9 Debt instruments
Line Net positions
1 U.S. net international investment position
2 Net international investment position excluding financial derivatives
3 Financial derivatives other than reserves, net
Line Liability positions
36 U.S. liabilities
37 Liabilities excluding financial derivatives
38 Financial derivatives other than reserves, gross negative fair value
By functional category:
39 Direct investment at market value
40 Equity
41 Debt instruments
Table continues
To Contents

Part IV. Statistical Methodology of International Investment Position Accounts
Bureau of Economic AnalysisU.S. International Economic Accounts: Concepts and Methods
187
22.7. In the IIP Accounts, functional categories are further classified by type of financial instrument, similar to the detail for primary income and financial-account transactions in the ITAs. The IIP Accounts and the financial account of the ITAs are closely related: the position at the end of a ref-erence period equals the position at the start of the period plus financial-account transactions for the reference period plus other changes in position (detailed below) that occur during the period.
22.8. Price changes apply to equity asset and liability positions for direct investment and portfolio invest-ment, long-term debt asset and liability positions for portfolio investment, and monetary gold and
Line Asset positions
10 Portfolio investment
11 Equity and investment fund shares
12 Debt securities
13 Short term
14 Long term
15 Financial derivatives other than reserves, gross positive fair value
16 Over-the-counter contracts
17 Single-currency interest rate contracts
18 Foreign exchange contracts
19 Other contracts
20 Exchange-traded contracts
21 Other investment
22 Other equity
23 Currency and deposits
24 Loans
25 Insurance technical reserves
26 Trade credit and advances
27 Reserve assets
28 Monetary gold
29 Special drawing rights
30 Reserve position in the International Monetary Fund
31 Other reserve assets
32 Currency and deposits
33 Securities
34 Financial derivatives
35 Other claims
Line Liability positions
42 Portfolio investment
43 Equity and investment fund shares
44 Debt securities
45 Short term
46 Treasury bills and certificates
47 Other short-term securities
48 Long term
49 Treasury bonds and notes
50 Other long-term securities
51 Financial derivatives other than reserves, gross negative fair value
52 Over-the-counter contracts
53 Single-currency interest rate contracts
54 Foreign exchange contracts
55 Other contracts
56 Exchange-traded contracts
57 Other investment
58 Other equity
59 Currency and deposits
60 Loans
61 Insurance technical reserves
62 Trade credit and advances
63 Special drawing rights allocations
To Contents

Part IV. Statistical Methodology of International Investment Position Accounts
Bureau of Economic AnalysisU.S. International Economic Accounts: Concepts and Methods
188
securities positions for reserve assets. Exchange-rate changes represent the gain or loss on for-eign-currency-denominated assets and liabilities due to changes in the values of foreign currencies relative to the value of the U.S. dollar. These changes apply to direct investment equity assets, port-folio investment assets and some corporate debt security liabilities, other investment assets and liabilities, and reserve assets. Changes in volume and valuation n .i .e . include changes in assets and liabilities that are not due to transactions, price changes, or exchange-rate changes or that cannot be separately identified as transactions, price changes, or exchange-rate changes.
22.9. In addition to the statistics in the IIP tables, BEA publishes related statistics annually for direct investment positions at historical cost (book value) on a directional basis that provide additional country and industry detail. These statistics differ from the featured measure of direct investment positions in the IIP Accounts that are presented at market value on an asset/liability basis. For more information on these statistics, see chapter 32. The connection between the IIP Accounts and the positions in the direct investment by country and industry statistics, along with the connection between the IIP Accounts and the ITAs, is illustrated in figure A.1 in appendix A.
To Contents

Part IV. Statistical Methodology of International Investment Position Accounts
Bureau of Economic AnalysisU.S. International Economic Accounts: Concepts and Methods
189
Chapter 23. Direct Investment
Concepts and coverage
23.1. Direct investment is a category of cross-border investment associated with a resident in one economy having control or a significant degree of influence on the management of a business enterprise resident in another economy. Ownership or control of 10 percent or more of the nonres-ident entity’s voting securities is the threshold for separating direct investment from other types of investment. Generally, direct investment indicates a long-term relationship with a nonresident enterprise. (See paragraphs 9.44–9.64 for further discussion of the direct investment functional category.)
23.2. Direct investment positions represent the accumulated stock of investment between entities in a direct investment relationship. For both assets and liabilities, the major published components of direct investment positions are equity and debt instruments. Debt positions comprise parents’ and affiliates’ claims and liabilities.
23.3. International investment position (IIP) table 2.1 presents direct investment positions first on the asset/liability basis recommended by the International Monetary Fund Balance of Payments and International Investment Position Manual, Sixth Edition (BPM6) for aggregate direct investment statistics and then on the directional basis—outward and inward depending on whether the direct investor is a U.S. resident or a foreign resident. Direct investment positions on the directional basis can be viewed as the equity and debt financing provided by parent companies to their affiliates or as the parents’ net financial claims on their affiliates.27
23.4. The Bureau of Economic Analysis (BEA) reports statistics on direct investment positions at his-torical cost (book value), at market value, and at current cost. IIP table 2.1 shows the conversion of direct investment positions from the asset/liability basis to the directional basis and the conversion from market-value positions to historical-cost positions. Current-cost positions are shown as alter-native current-price positions in IIP table 2.1. Country and industry information on direct invest-ment positions at historical cost (book value) are available in the direct investment by country and industry statistics—see chapter 32 and figure A.1 in appendix A for more information.
23.5. The asset/liability direct investment positions at market value are featured in the IIP Accounts because market valuation is used for other functional categories in these accounts. However, market values are often not available for direct investment because the equity for many direct
27. For inward investment, the direct investment position data measure the U.S. affiliate’s positions with its foreign parent and other members of its foreign parent group.
To Contents

Part IV. Statistical Methodology of International Investment Position Accounts
Bureau of Economic AnalysisU.S. International Economic Accounts: Concepts and Methods
190
investment enterprises is not listed on stock exchanges. Consequently, as described below, the mar-ket values of the direct investment positions are estimated using historical-cost (book value) data collected on BEA’s direct investment surveys and information from stock price indexes.
Departures from BPM6
23.6. The coverage and presentation of direct investment in the IIP Accounts closely follow BPM6 recommendations, with an exception for the treatment of some fellow enterprises that is due to limitations in BEA’s survey data. BEA surveys capture debt investments between majority-owned fellow enterprises but not with those fellow enterprises that are minority-owned, as called for in BPM6 and the Organisation for Economic Co-operation and Development (OECD) Benchmark Definition of Foreign Direct Investment, Fourth Edition (BD4).
23.7. Another departure from the international guidelines is that in BEA’s statistics investments in or by private funds (collective investment institutions) are excluded from direct investment, and included in portfolio investment, if the investor does not ultimately own at least 10 percent of the voting interest or equivalent of an “operating company”—that is, a U.S. or foreign business enterprise that is not a private fund or a holding company—through the private fund. Under the international guidelines, any investment that meets the 10 percent threshold is considered direct investment whether or not it involves ultimate ownership of 10 percent of an operating company.
Data sources
BEA data
23.8. Survey data. Statistics for the historical-cost (book value) direct investment position are based largely on data collected on BEA’s quarterly, annual, and benchmark direct investment surveys. The Quarterly Survey of U.S. Direct Investment Abroad (BE–577) and the Quarterly Survey of Foreign Direct Investment in the United States (BE–605) collect the information on financial transactions and positions between parents and their affiliates needed to construct the IIP Accounts.
23.9. Each year, the data from the quarterly surveys are reconciled to the Annual Survey of U.S. Direct Investment Abroad (BE–11) and to the Annual Survey of Foreign Direct Investment in the United States (BE–15). Once every 5 years, the data from the quarterly surveys are reconciled to the Benchmark Survey of U.S. Direct Investment Abroad (BE–10) and to the Benchmark Survey of Foreign Direct Investment in the United States (BE–12). (See paragraphs 32.11–32.19 for more information.)
23.10. Other BEA data. Ratios obtained from applying the BEA Fixed Assets Perpetual Inventory Model to domestic fixed-asset investment are used along with other domestic BEA data to revalue par-ents’ share of their affiliates’ investment in plant and equipment from historical cost (book value) to current-period prices for the current-cost valuation.
To Contents
Part IV. Statistical Methodology of International Investment Position Accounts
Bureau of Economic AnalysisU.S. International Economic Accounts: Concepts and Methods
191
Other data
23.11. Morgan Stanley Capital International (MSCI) foreign stock market indexes and S&P Dow Jones Indices. MSCI foreign stock market indexes, and the S&P 500 U.S. stock market indexes of S&P Dow Jones, are used to revalue the equity portion of the historical-cost (book value) outward and inward direct investment positions, respectively, to a market value basis.
Estimation methods
23.12. This section begins with estimation methods for the direct investment position at historical cost (book value) and then describes the estimation methods for the market value and current cost measures of the position, which are derived from historical-cost (book value) data. BEA’s direct investment surveys collect direct investment position data valued at historical cost (book value) because that is the primary basis used for valuation in company accounting records. Therefore, it is the basis on which companies can most easily report data on BEA’s direct investment surveys. The historical-cost (book) value reflects the values in the accounting records of the affiliate during the reference period. It is also the only basis for which detailed estimates of the position are available by country, by industry, and by component. Discussions below apply to both the equity and debt instrument components of direct investment asset and liability positions.
Historical cost
23.13. The direct investment position in an affiliate equals the parent’s equity in and debt with its affili-ates. Parents’ equity in affiliates can be broken down into parents’ holdings of capital stock in, and other capital contributions to, their affiliates and parents’ equity in the retained earnings of their affiliates. Capital stock consists of all the stock of the affiliates—both common and preferred and voting and nonvoting. Other capital contributions by parents, also referred to as the “parents’ equity in additional paid-in capital,” consist of the invested and contributed capital that is not included in capital stock, such as cash contributions, the amount paid for stock in excess of its par or stated value, and the capitalization of intercompany accounts (conversions of debt to equity) that do not result in the issuance of capital stock. Parents’ equity in retained earnings is the parents’ shares of the cumulative undistributed earnings of their affiliates.
23.14. Parents’ debt with their affiliates, also called intercompany debt, consists of trade accounts and trade notes payable, other current liabilities, and long-term debt owed. On the asset/liability basis, debt instrument positions that U.S. parents hold in their foreign affiliates and that U.S. affiliates hold in their foreign parent groups are recorded as U.S. assets. Likewise, debt instruments that U.S. parents issue to their foreign affiliates or that U.S. affiliates issue to their foreign parent groups are recorded as U.S. liabilities. (The term “foreign parent group” is defined in paragraph 9.57.)
To Contents
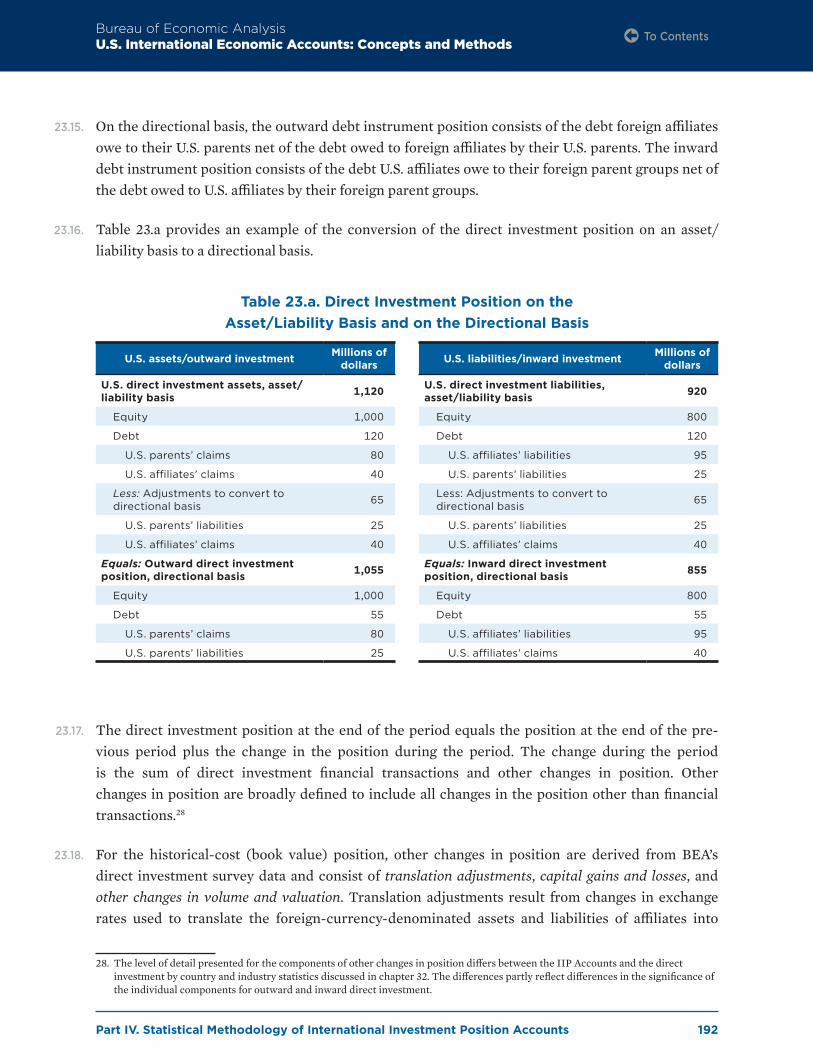
Part IV. Statistical Methodology of International Investment Position Accounts
Bureau of Economic AnalysisU.S. International Economic Accounts: Concepts and Methods
192
23.15. On the directional basis, the outward debt instrument position consists of the debt foreign affiliates owe to their U.S. parents net of the debt owed to foreign affiliates by their U.S. parents. The inward debt instrument position consists of the debt U.S. affiliates owe to their foreign parent groups net of the debt owed to U.S. affiliates by their foreign parent groups.
23.16. Table 23.a provides an example of the conversion of the direct investment position on an asset/liability basis to a directional basis.
Table 23.a. Direct Investment Position on the Asset/Liability Basis and on the Directional Basis
23.17. The direct investment position at the end of the period equals the position at the end of the pre-vious period plus the change in the position during the period. The change during the period is the sum of direct investment financial transactions and other changes in position. Other changes in position are broadly defined to include all changes in the position other than financial transactions.28
23.18. For the historical-cost (book value) position, other changes in position are derived from BEA’s direct investment survey data and consist of translation adjustments, capital gains and losses, and other changes in volume and valuation. Translation adjustments result from changes in exchange rates used to translate the foreign-currency-denominated assets and liabilities of affiliates into
28. The level of detail presented for the components of other changes in position differs between the IIP Accounts and the direct investment by country and industry statistics discussed in chapter 32. The differences partly reflect differences in the significance of the individual components for outward and inward direct investment.
U.S. assets/outward investment Millions of dollars
U.S. direct investment assets, asset/liability basis 1,120
Equity 1,000
Debt 120
U.S. parents’ claims 80
U.S. affiliates’ claims 40
Less: Adjustments to convert to directional basis 65
U.S. parents’ liabilities 25
U.S. affiliates’ claims 40
Equals: Outward direct investment position, directional basis 1,055
Equity 1,000
Debt 55
U.S. parents’ claims 80
U.S. parents’ liabilities 25
U.S. liabilities/inward investment Millions of dollars
U.S. direct investment liabilities, asset/liability basis 920
Equity 800
Debt 120
U.S. affiliates’ liabilities 95
U.S. parents’ liabilities 25
Less: Adjustments to convert to directional basis 65
U.S. parents’ liabilities 25
U.S. affiliates’ claims 40
Equals: Inward direct investment position, directional basis 855
Equity 800
Debt 55
U.S. affiliates’ liabilities 95
U.S. affiliates’ claims 40
To Contents

Part IV. Statistical Methodology of International Investment Position Accounts
Bureau of Economic AnalysisU.S. International Economic Accounts: Concepts and Methods
193
U.S. dollars. Capital gains and losses of affiliates comprise changes in asset values that generate revenues or expenses that are not related to current production. “Other” changes in volume and valuation primarily reflect differences between transactions values, which are used to record direct investment financial transactions, and the book values in affiliates’ accounting records, which are used to record the position. “Other” changes in volume and valuation also include changes in coverage and the reclassification of investment positions between direct investment and portfolio investment as the 10-percent threshold criterion for direct investment is crossed.
23.19. Several issues related to definition and classification are important to address as part of develop-ing the historical-cost (book value) estimates of direct investment positions. These issues include financial intermediaries, leases lasting longer than one year, shifts between direct investment and portfolio investment, and reverse investment and investment in fellow enterprises. Each issue is described separately below.
Financial intermediaries
23.20. Complexities arise in the classification of intercompany debt positions involving parents and affiliates in financial industries, including banking but excluding insurance. For example, if a U.S. manufacturer borrows funds from its affiliate or its parent in a financial industry, that debt position is included in the direct investment position. However, if a U.S. financial firm acquires funds from a financial affiliate, that debt position is classified in the other investment position because the nature of the transaction is more closely related to the underlying activity of financial intermedi-ation than to activity typical of a direct investment relationship. Debt positions between financial intermediaries, such as in the latter example, are classified in other investment even though they represent positions between firms in a direct investment relationship (that is, between U.S. parents and their foreign affiliates or between U.S. affiliates and their foreign parent groups). To qualify as a debt position between financial intermediaries, both the U.S. and foreign firm must be classified in a finance industry (excluding insurance).
Leases lasting longer than one year
23.21. Positions in debt instruments include the value of leases with terms of more than one year between parents and their affiliates. When property is leased by a foreign affiliate from its U.S. parent, or leased by a foreign parent from its U.S. affiliate, the value of the leased property is recorded as an asset of the U.S. parent or U.S. affiliate because it increases its receivables. The subsequent payment of principal is a return of capital and lowers the U.S. parent’s or U.S. affiliate’s assets accordingly.
23.22. Similarly, when property is leased to a U.S. parent by its foreign affiliate, or to a U.S. affiliate by its foreign parent, the value of the leased property is recorded as a liability of the U.S. parent or U.S. affiliate because it increases its payables. The subsequent payment of principal on the lease is a return of capital and lowers the U.S. parent’s or U.S. affiliate’s liabilities accordingly.
To Contents

Part IV. Statistical Methodology of International Investment Position Accounts
Bureau of Economic AnalysisU.S. International Economic Accounts: Concepts and Methods
194
Direct investment and portfolio investment
23.23. Some transactions require a shift in classification between direct investment and portfolio invest-ment. If a U.S. parent’s voting interest in a foreign business enterprise, or a foreign parent’s voting interest in a U.S. business enterprise, is originally less than 10 percent, and if additional purchases result in an voting interest of 10 percent or more, offsetting adjustments are made to the direct investment position and to the portfolio investment position to bring the original equity interest into the direct investment position. If a U.S. parent’s voting interest in a foreign affiliate or a foreign parent’s voting interest in a U.S. affiliate falls below 10 percent, offsetting adjustments are made to the direct investment position and the portfolio investment position to extinguish the remaining direct investment equity interest.29
Reverse investment and investment in follow enterprises
23.24. A U.S. parent may have investment in a foreign affiliate that, in turn, has investment in the U.S. parent as a result of the affiliate’s lending funds to, or acquiring voting securities or other equity interest in, the U.S. parent. Likewise, a foreign parent may have investment in a U.S. affiliate that, in turn, has investment in the foreign parent as a result of the affiliate’s lending funds to, or acquiring voting securities or other equity interest in, the foreign parent. For cases in which affiliates have no voting power or less than 10 percent voting power in their parents, equity and debt investment by affiliates in their parent companies is known as “reverse investment.” BEA includes reverse debt investment in the direct investment position statistics. For cases in which affiliates have 10 percent or more voting power in their parent companies, investment by affiliates in parents is treated as separate direct investment in its own right.
23.25. International guidelines call for reverse equity investment to be separately identified in cases where it is significant. The results from the 2014 Benchmark Survey of U.S. Direct Investment Abroad and the 2017 Benchmark Survey of Foreign Direct Investment in the United States indicate that reverse investment is negligible for U.S. outward and inward direct investment, so BEA has decided to not show this category in its accounts at this time.
23.26. An affiliate may have debt investment in a fellow enterprise, another enterprise that is under the control or influence of the same direct investor (immediate or otherwise), but where neither enterprise controls nor influences the other. International guidelines call for such investment to be separately identified in the IIP Accounts and labeled as “direct investment in fellow enterprises.” Because of the high level of consolidation of data collected for U.S. parent companies, BEA is not able to separately identify positions between fellow enterprises for outward investment. For this reason, these positions are treated as direct positions between the (consolidated) U.S. parent com-pany and its foreign affiliates for outward investment. Inward investment positions between U.S. affiliates and foreign affiliates of the foreign parent are collected separately on BEA’s survey but
29. A direct investment relationship exists when a parent’s voting interest in an affiliate is greater than 10 percent. Direct investment transactions and positions reflect the parent’s equity interest in the affiliate. A parent’s voting and equity interests are usually are the same but can differ.
To Contents

Part IV. Statistical Methodology of International Investment Position Accounts
Bureau of Economic AnalysisU.S. International Economic Accounts: Concepts and Methods
195
for consistency with outward investment are treated as direct positions between affiliates and their foreign parent group in published statistics. Positions with foreign affiliates of the foreign parent are not separately identified in BEA’s publications, but such positions are separately recorded by the country of the foreign affiliate, which is typically not the same as the country of the foreign par-ent. On an asset/liability basis, debt instruments that U.S. parents hold in their foreign affiliates and that U.S. affiliates hold in their foreign parent groups are recorded as assets, and debt instruments that U.S. parents issue to their foreign affiliates or that U.S. affiliates issue to their foreign parent groups are recorded as U.S. liabilities.
Market value
23.27. The market value estimates of the direct investment position revalue parents’ equity investment in their affiliates from historical cost (book value) to market value using stock market indexes. The market value estimates revalue only the equity portion of the direct investment position because it is assumed that there is no difference between market and book value for the debt. The revaluation method excludes the portion of the movements in stock prices due to the reinvestment of earnings. This avoids the double-counting of retained earnings that would result from the inclusion of rein-vested earnings in direct investment financial transactions.
23.28. The outward investment position is revalued using a weighted average of stock market indexes from MSCI. If a stock market index is available for a country, that index is used. For countries where a stock market index is not available, the Morgan Stanley World Index is used. The stock market data are first converted into U.S. dollars so that exchange-rate effects are reflected in the market indexes. For inward investment, the S&P 500 stock market index is used. The key assump-tion of this method is that using general stock market price indexes produces, on average, a reason-able estimate of the aggregate value of the equity in affiliates in a country.
23.29. The change in the market value position equals financial transactions including reinvestment of earnings with the current cost adjustment plus other changes in position. Other changes in posi-tion consist of price changes, exchange-rate changes, and changes in volume and valuation n.i.e. (not included elsewhere). For the market value position, price changes represent changes in the local currency value of stock market indexes after removing the effects of reinvested earnings. Exchange-rate changes represent gains or losses on foreign-currency-denominated assets and lia-bilities due to their revaluation at end-of-period exchange rates. Changes in volume and valuation n.i.e. include changes in coverage and other changes in value, such as the capital gains and losses of affiliates discussed above.
Current cost
23.30. The current-cost estimates of the direct investment position revalue parents’ equity claims in their affiliates’ tangible assets from historical cost (book value) to current cost. The current-cost
To Contents

Part IV. Statistical Methodology of International Investment Position Accounts
Bureau of Economic AnalysisU.S. International Economic Accounts: Concepts and Methods
196
estimates revalue affiliates’ plant and equipment using ratios from a perpetual inventory model applied to domestic investment data, land using general price indexes, and inventory stocks using estimates of current replacement cost. The estimates do not revalue mineral or other natural resource rights.
23.31. The ratios used to revalue plant and equipment from historical cost (book value) to current cost are derived from BEA’s Fixed Assets Accounts. These accounts construct estimates of total U.S. stocks of structures and equipment using investment flows and a perpetual inventory model.30 The perpetual inventory model produces estimates of net stocks at historical cost (book value) by cumulating past investment in plant and equipment and deducting the accumulated plant and equipment that has been used up (using a depreciation formula) or discarded (using estimated average service lives and retirement patterns). To estimate net stocks at current cost, the model first revalues each year’s investments from historical cost (book value) to constant cost using U.S. capital goods price indexes. It then cumulates past constant-cost investments in a manner similar to that for historical-cost (book value) investments, deducting used-up and discarded assets. The resulting constant-cost net capital stock is then revalued to current cost using the appropriate price indexes for capital goods.
23.32. To revalue direct investment plant and equipment, BEA multiplies industry-level ratios of cur-rent-cost net stocks to historical-cost (book value) net stocks from the Fixed Assets Accounts by industry-level estimates of direct investment stocks of plant and equipment from BEA’s annual and benchmark direct investment surveys. The resulting products are summed over industries, yielding a current-cost estimate of the net capital stock of affiliate plant and equipment.
23.33. The current-cost value of the net capital stock of plant and equipment derived by this method is added to the current-cost estimate of the parents’ share of their affiliate’s land and inventories. Land is revalued using a U.S. gross domestic product price index. Inventories are revalued using ratios of current-cost to historical-cost (book) values for U.S. inventory stocks. The sum of the revalued plant and equipment, land, and inventories produce a current-cost replacement value of tangible assets.
23.34. The direct investment equity position at current cost is equal to the direct investment equity position at historical cost (book value) adjusted by the difference between current-cost value of tangible assets and the historical-cost (book) value of tangible assets. Figure 23.a illustrates the revaluation of certain assets from historical cost (book value) to current cost.
30. For a description of the model, see “Methodology, Fixed Assets and Consumer Durables, 1925–1997,” September 2003.
To Contents
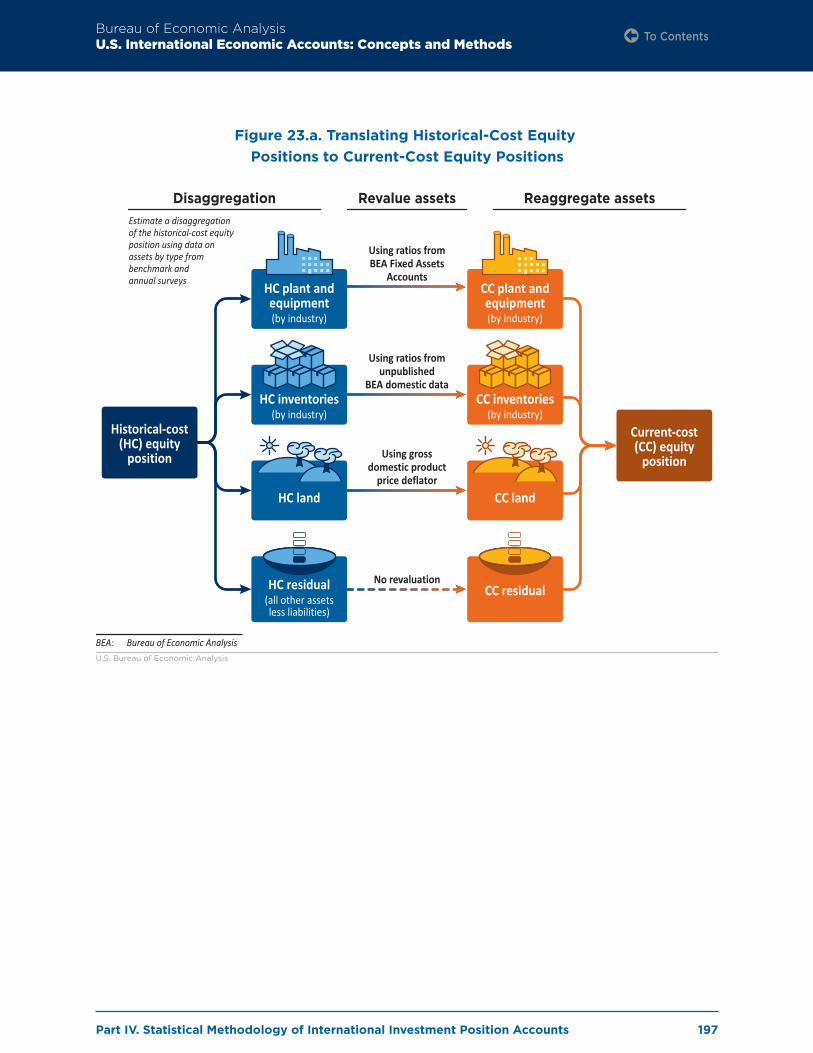
Part IV. Statistical Methodology of International Investment Position Accounts
Bureau of Economic AnalysisU.S. International Economic Accounts: Concepts and Methods
197
Figure 23.a. Translating Historical-Cost Equity Positions to Current-Cost Equity Positions
Historical-cost(HC) equity
position
Current-cost(CC) equity
position
HC plant andequipment(by industry)
Disaggregation Revalue assets
HC inventories(by industry)
HC land
HC residual(all other assetsless liabilities)
Using ratios fromBEA Fixed Assets
Accounts
Reaggregate assetsEstimate a disaggregationof the historical-cost equityposition using data onassets by type from benchmark and annual surveys CC plant and
equipment(by industry)
CC inventories(by industry)
CC land
CC residual
Using ratios fromunpublished
BEA domestic data
Using grossdomestic product
price deflator
No revaluation
BEA: Bureau of Economic AnalysisU.S. Bureau of Economic Analysis
To Contents
Part IV. Statistical Methodology of International Investment Position Accounts
Bureau of Economic AnalysisU.S. International Economic Accounts: Concepts and Methods
198
Chapter 24. Portfolio Investment
Concepts and coverage
24.1. Portfolio investment consists of cross-border positions in debt or equity securities, excluding those included in direct investment or reserve assets. (See paragraphs 9.65 and 9.66 for further discussion of the portfolio investment functional category.) The major published components of portfolio investment positions are equity and investment fund shares and debt securities. Debt securities are classified by maturity (short term versus long term). Short-term debt security liabilities are further classified as U.S. Treasury bills and certificates and other short-term securities, and long-term debt security liabilities are further classified as U.S. Treasury bonds and notes and other long-term debt securities. Other short- and long-term U.S. debt securities include securities issued by federally sponsored agencies, corporations, and state and local governments.
Departures from BPM6
24.2. The coverage and presentation of portfolio investment positions closely follow recommendations from the International Monetary Fund Balance of Payments and International Investment Position Manual, Sixth Edition (BPM6). The Bureau of Economic Analysis (BEA) uses slightly different ter-minology in some cases.
Data sources
24.3. U.S. Department of the Treasury (Treasury Department). U.S. residents’ holdings of foreign-is-sued equity and long-term debt securities and foreign residents’ holdings of U.S.-issued equity and long-term debt securities are based on data collected monthly on the Treasury International Capital (TIC) SLT form. The related annual and benchmark surveys cover equity, long-term debt, and short-term debt, including negotiable certificates of deposit (NCDs). These surveys are also used to supplement the other TIC data sources. The SHL(A) survey covers foreign holdings of U.S. securities and the SHC(A) survey covers U.S. holdings of foreign securities. Values on these surveys reflect the secondary market prices of the equity and long-term debt securities. Cross-border hold-ings of short-term debt securities and NCDs are based on the TIC B and C forms: BC, BL–2, BQ–1, BQ–2, and CQ–1. For more information on TIC reporting data, see table 3.b in chapter 3.
24.4. Details on the primary sources of portfolio investment positions for lines presented in international investment position tables 1.2 and 3.1 are provided in table 24.a. Positions for some components are taken directly from the SLT while positions for other components are projected from the annual and benchmark surveys. In these cases, the projection methodology is indicated.
To Contents

Part IV. Statistical Methodology of International Investment Position Accounts
Bureau of Economic AnalysisU.S. International Economic Accounts: Concepts and Methods
199
Table 24.a: Portfolio Investment Source Data for the International Investment Position
IIP table Line Type of investment Primary source of investment positions
1.2 4 U.S. assets
1.2 10 Portfolio investment
1.2 11 Equity and investment fund shares SHC(A) plus SLT change
1.2 12 Debt securities
1.2 13 Short term BC, BQ–1, BQ–2, CQ–1, and DTCC
1.2 14 Long term SHC(A) plus SLT change
1.2 36 U.S. liabilities to all foreign residents
1.2 42 Portfolio investment
1.2 43 Equity and investment fund shares SHL(A) plus SLT change
1.2 44 Debt securities
1.2 45 Short term
1.2 46 Treasury bills and certificates BL–2
1.2 47 Other short-term securities BL–2, BQ–2 and CQ–1
1.2 48 Long term
1.2 49 Treasury bonds and notes SLT
1.2 50 Other long-term securities SHL(A) plus SLT change
3.1 1 U.S. liabilities to foreign official agencies
3.1 2 Portfolio investment
3.1 3 Equity and investment fund shares SLT
3.1 4 Debt securities
3.1 5 Short term
3.1 6 Treasury bills and certificates BL–2
3.1 7 Other short-term securities BL–2
3.1 8 Long term
3.1 9 Treasury bonds and notes SLT
3.1 10 Other long-term securities SLT
DTCC Depository Trust and Clearing Corporation
24.5. Morgan Stanley Capital International (MSCI), S&P Dow Jones Indices, and Intercontinental Exchange (ICE) Price Indexes. For U.S. equity shares, BEA uses the S&P 500 stock index, which is a proxy for the composition of foreign holdings of U.S. equity shares. For U.S. corporate, federally sponsored agency, and Treasury long-term debt securities, BEA uses various ICE indexes matched to these market segments and to the maturity, investment quality, and currency of denomination of U.S. long-term debt securities held by foreign residents.
24.6. For foreign equity shares, BEA uses MSCI national and regional indexes for developed and emerg-ing markets matched to the composition of the foreign stocks held by U.S. residents. For foreign long-term debt securities, BEA uses various ICE indexes representing investment quality long-term debt securities issued abroad in the U.S. dollar, the euro, the Japanese yen, the Canadian
To Contents

Part IV. Statistical Methodology of International Investment Position Accounts
Bureau of Economic AnalysisU.S. International Economic Accounts: Concepts and Methods
200
dollar, and the British pound, as well as a global broad market index excluding U.S. dollar debt securities, to match the composition of foreign-issued long-term debt securities held by U.S. residents.
24.7. Depository Trust and Clearing Corporation (DTCC). BEA receives reports of commercial paper issued in the United States from the DTCC. The data provided by the DTCC are combined with databases of company reports to determine whether commercial paper issuers are U.S. residents or foreign residents, providing estimates that supplement U.S. holdings of foreign commercial paper reported on TIC BQ–1 form and the SHC(A) survey.
Estimation methods
24.8. The presentation of portfolio investment positions for equity and investment fund shares and for debt instruments in the IIP Accounts includes statistics for positions at the end of the period and for changes in position between periods. Changes in position consist of financial-account transac-tions and other changes in position, which include changes due to price changes, exchange-rate changes, and changes in value and volume n.i.e. (not included elsewhere). As described in chap-ter 17, portfolio investment transactions are generally derived as the difference between the total change in positions and position changes that are not due to transactions. IIP table 1.2 presents portfolio investment position levels at quarter end. IIP table 1.3 presents portfolio investment posi-tion levels at yearend and a decomposition of annual changes in position. The published statistics are derived using the methods described below.
Short-term debt securities and NCDs of any maturity
Positions
24.9. U.S. holdings of short-term foreign debt securities equal positions reported on TIC BC, BQ–1, BQ–2, and CQ–1 forms plus supplemental data for foreign commercial paper from the DTCC. U.S. holdings of foreign-issued NCDs reported on the TIC B and C forms are allocated between short- and long-term holdings based on data reported in the SHC(A).
24.10. Foreign holdings of short-term U.S. debt securities equal positions reported on TIC BL–2, BQ–2, and CQ–1 forms. Foreign holdings of U.S.-issued NCDs reported on the TIC B and C forms are allo-cated between short- and long-term holdings based on data reported in the SHL(A) survey.
Total change in position
24.11. Total change in position of U.S. residents’ holdings of foreign short-term debt securities and NCDs of any maturity and in foreign residents’ holdings of U.S. short-term debt securities and NCDs of any maturity equals the changes in quarterly holdings of these securities reported on the TIC B and C forms. U.S. residents’ holdings of foreign commercial paper reported on TIC BQ–1 form are supplemented by holdings estimated from the DTCC data.
To Contents

Part IV. Statistical Methodology of International Investment Position Accounts
Bureau of Economic AnalysisU.S. International Economic Accounts: Concepts and Methods
201
Financial-account transactions
24.12. As described in chapter 17, portfolio investment transactions are generally derived as the difference between the total change in position and position changes that are not due to transactions.
Price changes
24.13. Values on the TIC B and C forms are reported at their original contractual values (face value). Changes in prices in the secondary markets for short-term securities and for NCDs are assumed to have little or no impact on transactions estimated from the reported values. Price changes are not presented for short-term securities and NCDs.
Exchange-rate changes
24.14. Claims and liabilities of U.S. residents with foreign residents that are denominated in foreign currencies are reported on TIC BQ–2 and CQ–1 forms, separately from U.S.-dollar-denominated holdings. Claims and liabilities of U.S. financial companies and those of their customers with for-eign residents that are denominated in foreign currencies are reported on BQ–2 form. Claims and liabilities of U.S. nonfinancial companies with foreign residents that are denominated in foreign currencies are reported on the CQ–1 form.
24.15. Total holdings are reported in U.S. dollars with additional detail on the currency composition of the holdings. The exchange-rate change for each currency denomination is calculated by subtracting the exchange-rate-adjusted change in position from the total change in position. The exchange-rate-adjusted change is computed by converting the change in the amount of each foreign currency held into U.S. dollars using each currency’s average exchange rate for the period. The total change in position is calculated by converting the foreign- currency-denominated positions to U.S. dollars and computing the change from those dollar-equivalent positions. Exchange-rate changes are com-puted for each currency and summed to obtain the total exchange-rate change.
Other changes in volume and valuation n.i.e.
24.16. Changes in TIC reporting caused by the addition of new reporters, corrected reporting, or other changes to the reporting panels are reported to BEA so that quarterly changes in positions that are not caused by transactions, price changes, and exchange-rate changes can be removed from total changes in positions when estimating transactions.
Equity and long-term debt securities, excluding long-term NCDs
Positions
24.17. Portfolio investment positions for equity and long-term debt securities are compiled from TIC surveys in one of two ways. Positions are either taken directly from the monthly SLT form or they are projected by adding the quarterly change in the SLT positions to the most recent TIC annual or benchmark survey positions. Investment positions from the SLT form and from the annual and
To Contents

Part IV. Statistical Methodology of International Investment Position Accounts
Bureau of Economic AnalysisU.S. International Economic Accounts: Concepts and Methods
202
benchmark surveys are reported at market value. For corporate bonds and notes, position data from the annual or benchmark surveys must be adjusted to exclude NCDs for comparability with SLT positions. The portfolio investment positions derived from these surveys are presented at mar-ket value.
24.18. Positions are taken directly from the monthly SLT form when holdings reported on the SLT form tend to be in close alignment with holdings from the relevant annual or benchmark survey. This condition generally holds for foreign official holdings of U.S. equity and long-term debt securities, and for foreign holdings of long-term U.S. Treasury securities and U.S. federally sponsored agency securities.
24.19. Positions are projected by adding quarterly changes in SLT positions to yearend positions in the SHC(A) survey for U.S. holdings of foreign equity and long-term debt securities. For foreign private holdings of U.S. corporate bonds and stocks, positions are projected by adding quarterly changes in SLT positions to positions in the SHL(A) survey, reported as of June 30 each year. Positions are projected in this way because for these types of holdings, the annual and benchmark surveys, which are compiled from microdata reported for cross-border holdings of individual securities, are significantly more accurate than the aggregate data reported more frequently on the SLT form. Although the annual and benchmark surveys provide the best available measure of positions at cer-tain points in time, the change in the SLT positions is the best available information for projecting the positions quarter-by-quarter.
24.20. Annually, when annual or benchmark survey results are available that can be compared with the SLT results available earlier in the estimation cycle for the same period, the key assumption about the agreement between the annual or benchmark survey and the SLT form can be tested. BEA’s annual update cycle provides the opportunity to revise positions that had been based on SLT positions if, in fact, the SLT form and the most recent annual or benchmark survey do not agree as expected.
Total change in position
24.21. Total changes in position for U.S. residents’ holdings of foreign equity and long-term debt securities and for foreign residents’ holdings of U.S. equity and long-term debt securities are equal to changes in quarterly holdings of these securities reported on the SLT form.
Financial-account transactions
24.22. As described in chapter 17, portfolio investment transactions are generally derived as the difference between the total change in position and position changes that are not due to transactions.
To Contents

Part IV. Statistical Methodology of International Investment Position Accounts
Bureau of Economic AnalysisU.S. International Economic Accounts: Concepts and Methods
203
Price changes and exchange-rate changes
24.23. Price indexes from MSCI, S&P Dow Jones Indices, and ICE denominated in U.S. dollars are used to measure changes in prices and exchange rates. U.S.-dollar-denominated securities have no exchange-rate change component as part of the total price change. Price changes for a given period are equal to the holdings at the beginning of the period multiplied by the percent change over the period in the appropriate price index.
24.24. For foreign currency-denominated equity and debt securities, changes in value caused by changes in exchange rates are included in the price change computed from the U.S.-dollar-denominated price index. Exchange-rate changes for a given period are equal to the holdings of securities of a particular currency at the beginning of the period multiplied by the percent change in the rele-vant exchange rate over the period. These exchange-rate changes are subtracted from total price changes measured in U.S. dollars to obtain price changes exclusive of changes due to exchange rates.
Other changes in volume and valuation n.i.e.
24.25. Changes in SLT reporting caused by the addition of new reporters, corrected reporting, or other changes to the reporting panels are reported to BEA so that quarterly changes in positions that are not caused by transactions, price changes, or exchange-rate changes can be allocated to other changes in volume and valuation n.i.e. (not included elsewhere) when estimating transactions.
To Contents

Part IV. Statistical Methodology of International Investment Position Accounts
Bureau of Economic AnalysisU.S. International Economic Accounts: Concepts and Methods
204
Chapter 25. Financial Derivatives Other Than Reserves
Concepts and coverage
25.1. Financial derivatives other than reserves consist of cross-border positions arising from financial contracts that are linked to underlying financial instruments, commodities, or indicators. (See paragraphs 9.72–9.74 for further discussion of the financial derivatives other than reserves func-tional category.) Positions in financial derivatives consist of contracts with positive fair values that are assets of U.S. residents and contracts with negative fair values that are liabilities of U.S. residents. Statistics for both gross positive fair value and gross negative fair value are presented in international investment position table 1.2. Financial derivatives are a type of financial instrument and financial derivatives other than reserves is a functional category. Positions in financial deriva-tives were introduced into the IIP Accounts beginning with statistics for the end of the fourth quarter of 2005.
Departures from BPM6
25.2. The coverage and presentation of positions in financial derivatives other than reserves closely follow the guidelines recommended by the International Monetary Fund Balance of Payments and International Investment Position Manual, Sixth Edition (BPM6). However, the Bureau of Economic Analysis (BEA) does not include employee stock options with financial derivatives other than reserves because of a lack of source data. BEA provides some detail on risk categories of financial derivatives that is not required by BPM6 but is not able to provide other detail recommended by BPM6 because of source data limitations.
Data sources
25.3. U.S. Department of the Treasury. Comprehensive data on financial derivatives are collected on Treasury International Capital (TIC) Form D, “Report of Holdings of, and Transactions in, Financial Derivatives Contracts.” Data are collected quarterly from U.S. banks, bank holding com-panies, financial holding companies, securities dealers, and all other firms with worldwide hold-ings of financial derivatives, for their own and their customers’ accounts combined, in excess of $400 billion in notional value. Trading in financial derivatives is highly concentrated among a small number of large firms. Classifications by risk category are also available from TIC D form. For more information on TIC reporting data, see table 3.b in chapter 3.
To Contents

Part IV. Statistical Methodology of International Investment Position Accounts
Bureau of Economic AnalysisU.S. International Economic Accounts: Concepts and Methods
205
Estimation methods
25.4. Estimation methods for quarterly and annual statistics, including the risk category classifications of over-the-counter contracts and exchange-traded contracts, are the same.
Positions
25.5. Positions equal the reported gross positive fair values from the TIC D form for assets and the reported gross negative fair values from the TIC D form for liabilities.
Financial-account transactions
25.6. As described in chapter 20, published statistics equal net settlements from the TIC D form with the sign reversed. Because financial-account transactions are not available separately for gross positive fair values and gross negative fair values, BEA does not present a decomposition for gross positive fair values and for gross negative fair values.
Other changes
25.7. Data are not available from the TIC D form to provide separate estimates of price changes, exchange-rate changes, and other changes in volume and valuation n.i.e. (not included elsewhere). Total other changes in position, which equal total change in position less financial-account trans-actions, are presented as other changes in volume and valuation n.i.e. for U.S. net holdings of derivatives.
To Contents

Part IV. Statistical Methodology of International Investment Position Accounts
Bureau of Economic AnalysisU.S. International Economic Accounts: Concepts and Methods
206
Chapter 26. Other Investment
Concepts and coverage
26.1. Other investment is a residual category that includes positions other than those included in direct investment, portfolio investment, financial derivatives, and reserve assets. Other investment con-sists of a wide variety of financial instruments that are usually, but not always, issued and held by financial institutions. (See paragraphs 9.67–9.69 for further discussion of the other investment func-tional category.) The major published components of other investment positions are other equity, currency and deposits, loans, insurance technical reserves, and trade credit and advances. Other investment liabilities also include allocations of special drawing rights (SDRs) by the International Monetary Fund (IMF).
Departures from BPM6
26.2. The components of other investment in the IMF Balance of Payments and International Investment Position Manual, Sixth Edition (BPM6) include insurance, pension, and standardized guarantee schemes. This component consists of insurance technical reserves (prepayments of premiums and reserves against outstanding insurance claims), pension entitlements (the claims of pensioners on their employers or pension funds), and provisions for calls under standardized guarantees (prepay-ments of net fees and provisions to meet outstanding calls under standardized loan guarantees). While source data for positions related to insurance technical reserves, pension entitlements, and standardized guarantee schemes are not sufficient for preparing statistics, cross-border positions in pension entitlements and standardized guarantees are believed to be negligible.
26.3. Also, in some cases the Bureau of Economic Analysis (BEA) uses slightly different terminology and slightly different sector detail. For example, BEA uses the term “trade credit and advances” because it is the only item for which source data are available under the BPM6 component “other accounts receivable/payable.”
26.4. Currently, BEA is unable to provide separate estimates of certain types of positions in other equity. Other equity is equity that is not in the form of securities. It can include equity in institutions such as branches, trusts, limited liability and other partnerships, unincorporated funds, and notional units for ownership of real estate and other natural resources. The ownership of many interna-tional financial institutions is not in the form of shares and is thus classified as other equity. BEA’s estimates of positions in other equity cover equity in these international institutions. Other types of other equity are commingled in BEA’s source data with equity in the form of securities and are included in portfolio investment.
To Contents

Part IV. Statistical Methodology of International Investment Position Accounts
Bureau of Economic AnalysisU.S. International Economic Accounts: Concepts and Methods
207
Data sources
26.5. U.S. Department of the Treasury (Treasury Department). Claims and liabilities for deposits, loans, and insurance technical reserves are reported by financial institutions on the Treasury International Capital (TIC) B forms. Deposits, loans, and trade credit and advances are reported by nonfinancial institutions on the TIC C forms beginning in December 2013.31 For more information on TIC reporting data, see table 3.b in chapter 3. Administrative data from the Monthly Treasury Statement and the Treasury Department’s Foreign Credit Reporting System are used to estimate other equity assets and to supplement estimates of loan assets.
26.6. Values on the TIC B and C forms are reported at their original contractual values (face value). Changes in prices in the secondary markets for assets and liabilities reported on the TIC B and C forms are assumed to have little or no impact on the reported positions.
26.7. BEA survey data. BEA uses data reported on BEA’s BE–577 and BE–605 direct investment surveys to adjust the TIC source data by removing positions covered in direct investment.
26.8. U.S. Department of Defense (DOD). Advance payments for sales of military goods to foreign governments are reported to BEA. U.S. government liabilities to foreign governments for these advance payments are classified as trade credit and advances in the general government sector.
26.9. U.S. government administrative data. U.S. government agencies that engage in international transactions report these transactions quarterly to BEA. Quarterly statistics for transactions in U.S. government loan claims are based on transactions data submitted by U.S. government operating agencies under Office of Management and Budget (OMB) Statistical Directive No. 19. Positions are projected from the transactions.
26.10. Federal Reserve Board (FRB). Net shipments of U.S. currency into and out of the United States are provided by the FRB to BEA to measure increases and decreases in foreign holdings of U.S. currency. The holdings projected from these transactions are not captured elsewhere in statistical reporting systems.
26.11. Federal Reserve Bank of New York (FRBNY). The Treasury and Federal Reserve Foreign Exchange Operations Report from the FRBNY provides data for positions in central bank liquidity swaps. The report of foreign central bank account balances at the FRBNY provides key data for central bank sector positions.
31. Prior to December 2013, U.S. banks, bank holding companies, financial holding companies, and securities brokers and dealers reported deposits and loans on the TIC B forms, and other types of financial intermediaries, nonfinancial institutions, and nonprofit institutions reported deposits, loans, insurance technical reserves, and trade credit and advances on the TIC C forms.
To Contents
Part IV. Statistical Methodology of International Investment Position Accounts
Bureau of Economic AnalysisU.S. International Economic Accounts: Concepts and Methods
208
26.12. International Monetary Fund (IMF). The IMF issues press releases and posts information on its website when it implements significant decisions, such as allocating new SDRs to members or increasing member quotas. Recommendations by the IMF Executive Board for such actions must be ratified by member countries before they can be implemented.
26.13. Depository Trust and Clearing Corporation (DTCC). Claims of U.S. nonbank firms include claims associated with the issuance of asset-backed commercial paper (ABCP) that are not com-pletely captured in other source data.
26.14. Supplemental counterparty data. Bilateral comparisons between U.S. statistics and comparable statistics from foreign banks for loans and deposits show that U.S. statistics, collected directly from U.S. nonbank firms, understate the external claims and liabilities of these firms vis-à-vis foreign banks. The foreign banking data are from the central banks of the United Kingdom and Germany, from the Bank for International Settlements (BIS) for Austria, Belgium, France, Ireland, Luxembourg, the Netherlands, and Spain, and from FRB reports for banks in the Bahamas and the Cayman Islands.
Estimation methods
26.15. The presentation of the International Investment Position (IIP) Accounts includes statistics for positions at the end of the period and for changes in position. Changes in positions consist of finan-cial-account transactions and changes due to price changes, exchange-rate changes, and changes in value and volume n.i.e. (not included elsewhere). Estimation methods for financial-account transactions are described in chapter 18. IIP table 1.2 presents other investment position levels at quarter end. IIP table 1.3 presents other investment position levels at yearend and a decomposition of changes in position. Methods for each of the published components are described below. Unless otherwise noted, methods are the same for both U.S. asset positions and U.S. liability positions.
Other equity
Positions
26.16. Other equity assets include U.S. government equity stakes in international organizations other than the IMF that do not issue securities. BEA currently lacks source data to provide estimates for posi-tions in other equity liabilities.
26.17. Statistics for positions in other equity assets are projected based on an estimate of holdings in 1976 brought forward by adding transactions. Transactions are based on U.S. government capital subscriptions and contributions to international financial institutions reported by the Treasury Department in the Monthly Treasury Statement.
To Contents

Part IV. Statistical Methodology of International Investment Position Accounts
Bureau of Economic AnalysisU.S. International Economic Accounts: Concepts and Methods
209
Financial-account transactions
26.18. As described in chapter 18, quarterly statistics for transactions in U.S. other equity claims are based on U.S. government capital subscriptions and contributions to international financial institutions reported by the Treasury Department in the Monthly Treasury Statement.
Price changes
26.19. Source data are not available for this category.
Exchange-rate changes
26.20. All U.S. government other equity assets are assumed to be denominated in U.S. dollars. The value of these assets is not affected by changes in exchange rates.
Other changes in volume and valuation n.i.e.
26.21. Source data are not available for this category.
Currency
Positions
26.22. Foreign holdings of U.S. currency abroad are projected based on an estimate of holdings in 1973 brought forward by adding quarterly net shipments using data from the FRB, which are used to measure transactions. Foreign holdings of U.S. currency are not liabilities to foreign official agen-cies and are thus not included in IIP table 3.1.
Financial-account transactions
26.23. As described in chapter 18, transactions in U.S. currency liabilities are equal to net shipments of U.S. currency into and out of the United States.
Price changes
26.24. The U.S. dollar value of U.S. currency held abroad is not affected by changes in prices.
Exchange-rate changes
26.25. The U.S. dollar value of U.S. currency held abroad is not affected by changes in exchange rates.
Other changes in volume and valuation n.i.e.
26.26. Source data are not available for this category.
To Contents

Part IV. Statistical Methodology of International Investment Position Accounts
Bureau of Economic AnalysisU.S. International Economic Accounts: Concepts and Methods
210
Deposits
Positions
26.27. U.S. deposit claims and liabilities with foreign residents include (1) deposits reported by U.S. finan-cial institutions and nonfinancial institutions for their own account and for their customers on the TIC B and C forms, (2) the deposit claims and liabilities of the FRB with foreign central banks reported by FRBNY, and (3) additional deposits placed in foreign banks by U.S. nonbank firms based on counterparty data from foreign banks. Brokerage balances held by securities brokers for their customers that are very similar to deposits, and that are reported in the deposit category on the TIC B forms, are also classified as deposits. The deposit claims of the FRB include holdings of foreign currency obtained through central bank liquidity swaps.
26.28. Positions in deposit claims and liabilities in the IIP Accounts equal the positions reported on the TIC B and C forms, the administrative data from the FRB, and the supplemental balances com-puted from the counterparty data from foreign banks. U.S. deposit liabilities to foreign official agen-cies are estimated from reported deposit liabilities to foreign official agencies available separately on the TIC BL–1 form.
Financial-account transactions
26.29. As described in chapter 18, transactions in deposit claims and liabilities of U.S. financial institutions and nonfinancial institutions are based on changes in quarterly holdings as reported on the TIC B and C forms. These estimates are supplemented by changes in quarterly holdings of deposits placed in foreign banks by U.S. nonbank firms based on counterparty data from foreign banks.
26.30. Transactions in deposits denominated in foreign currency equal the change in holdings, with the holdings converted to the original currency of denomination at the exchange rates in effect at the beginning and end of the period, less changes due to changes in reporting panels classified as other changes in volume and valuation n.i.e. The foreign-currency-denominated estimate of the transac-tion amount is converted to U.S. dollars using an average exchange rate for the period.
26.31. Transactions in deposits denominated in U.S. dollars equal the reported dollar-denominated change in holdings, less changes due to changes in reporting panels classified as other changes. Transactions in deposits abroad held by the FRB acquired through central bank liquidity swaps equal changes in quarterly swap balances reported by the FRB.
Price changes
26.32. The U.S. dollar value of U.S. deposit claims and liabilities with foreign residents is not affected by changes in prices.
To Contents

Part IV. Statistical Methodology of International Investment Position Accounts
Bureau of Economic AnalysisU.S. International Economic Accounts: Concepts and Methods
211
Exchange-rate changes
26.33. The calculation of exchange-rate changes for foreign-currency-denominated deposits, excluding those acquired by the FRB through central bank liquidity swaps, makes use of the exchange-rate-adjusted transactions described above. Exchange-rate changes equal the unadjusted total change in holdings of foreign-currency-denominated deposits less the sum of transactions and changes in reporting panels that would be classified as other changes in volume and valuation n.i.e.
26.34. Deposits abroad held by the FRB acquired through central bank liquidity swaps are denominated in foreign currency. However, these holdings are not affected by changes in exchange rates because the swaps are reversed at prearranged exchange rates specified in the swap agreement and the same amounts of U.S. dollars are always returned as were originally swapped. The FRB carries these assets on its balance sheet at constant U.S. dollar-equivalent values.
Other changes in volume and valuation n.i.e.
26.35. Changes in TIC reporting caused by the addition of new reporters, corrected reporting, or other changes to the reporting panels are reported to BEA so that the changes in quarterly balances not caused by transactions or exchange-rate changes can be removed from total changes in holdings when estimating transactions.
Loans
Positions
26.36. U.S. loan claims and liabilities with foreign residents include (1) loans reported by U.S. financial institutions and nonfinancial institutions both for their own account and for their customers on the TIC B and C forms, (2) loan claims from the DTCC data, (3) loan claims on foreign residents reported in the Foreign Credit Reporting System, and (4) additional loans to or from U.S. nonbank firms with foreign banks based on counterparty data from foreign banks.
26.37. Quarterly statistics for positions in U.S. government loan claims are projected based on an esti-mate of holdings in 1976 brought forward by adding transactions. Transactions are based on data submitted by U.S. government operating agencies under OMB Statistical Directive No. 19; data are summarized by country and by agency.
26.38. Other positions in loan claims and liabilities in the IIP Accounts are equal to the positions reported on the TIC B and C forms supplemented by the balances computed from the counterparty data from foreign banks. U.S. loan liabilities to foreign official agencies are estimated from reported loan liabilities to foreign official agencies available separately on the TIC BL–1 and BL–2 forms.
26.39. BEA adjusts the TIC data by removing selected debt positions and positions in owner’s equity between financial institutions and unincorporated branches and by removing debt positions between U.S. financial institutions and nonfinancial foreign affiliates, which are covered in direct
To Contents

Part IV. Statistical Methodology of International Investment Position Accounts
Bureau of Economic AnalysisU.S. International Economic Accounts: Concepts and Methods
212
investment, from positions in loan claims and loan liabilities computed from the TIC B forms. The loan positions removed are covered in the TIC B forms because, in the case of owner’s equity, positions in owner’s equity in unincorporated branches cannot be separated from other intercom-pany positions in the TIC B reporting. In the case of debt between U.S. financial companies and nonfinancial foreign affiliates, the TIC B reporting applies to all loans made by U.S. financial com-panies, whether the foreign entity is affiliated or not. This adjustment is based on data reported on BEA’s quarterly direct investment surveys.
Financial-account transactions
26.40. As described in chapter 18, transactions in loans of U.S. financial institutions and nonfinancial institutions with foreign residents are based on changes in quarterly holdings as reported on the TIC B and C forms. These estimates are supplemented by loan claims data from the DTCC and by loan claims and loan liabilities of U.S. nonbank firms with foreign banks based on counterparty data from foreign banks. The computed changes in holdings from the TIC data are adjusted to remove the impact of any changes in holdings not caused by transactions, such as changes in exchange rates or changes in TIC survey reporting panels.
26.41. Transactions in loans denominated in foreign currency equal the change in holdings, with the holdings converted to the original currency of denomination at the exchange rates in effect at the beginning and end of the period, less changes due to changes in reporting panels classified as other changes in volume and valuation n.i.e. The foreign-currency-denominated estimate of the transac-tion amount is converted to U.S. dollars using an average exchange rate for the period.
26.42. Transactions in loans denominated in U.S. dollars equal the reported dollar-denominated change in holdings, less changes due to changes in reporting panels classified as other changes in volume and valuation n.i.e. Quarterly statistics for transactions in U.S. government loan claims are based on transactions data submitted by U.S. government operating agencies under OMB Statistical Directive No. 19. All U.S. government loan claims are assumed to be denominated in U.S. dollars.
Price changes
26.43. The value of U.S. loan claims and liabilities with foreign residents is assumed to be unaffected by changes in prices in secondary markets.
Exchange-rate changes
26.44. The calculation of exchange-rate changes for foreign-currency-denominated loans makes use of the exchange-rate-adjusted transactions described above. Exchange-rate changes equal the unad-justed total change in holdings of foreign-currency-denominated loans less the sum of transactions and any changes in reporting panels that would be classified as other changes in volume and valua-tion n.i.e.
To Contents
Part IV. Statistical Methodology of International Investment Position Accounts
Bureau of Economic AnalysisU.S. International Economic Accounts: Concepts and Methods
213
Other changes in volume and valuation n.i.e.
26.45. Changes in TIC reporting caused by the addition of new reporters, corrected reporting, or other changes to the reporting panels are reported to BEA so that the changes in quarterly balances not caused by transactions or exchange-rate changes can be removed from total changes in holdings when estimating transactions.
Insurance technical reserves
26.46. Positions for insurance technical reserves are based on quarterly holdings as reported on the TIC B forms. Source data for insurance technical reserves are currently not sufficient for the preparation of statistics.
26.47. Insurance technical reserves are not liabilities to foreign official agencies and are therefore not included in IIP table 3.1.
Trade credit and advances
Positions
26.48. Holdings of claims and liabilities with foreign residents from trade credit and advances include (1) those reported by U.S. financial institutions and nonfinancial institutions on the TIC CQ–2 form and (2) the liabilities of the U.S. government to foreign governments from funds advanced mainly for the purchase of military goods and services reported to BEA by DOD.
26.49. The trade credit and advances of other (non-deposit-taking) U.S. financial institutions and non-financial institutions equal the quarterly holdings as reported on the TIC CQ–2 form. The liabilities are not liabilities to foreign official agencies and are not included in IIP table 3.1.
26.50. U.S. government liabilities from advance payments for foreign purchases of goods and services that are mainly for military use are projected based on an estimate of holdings in 1976 brought forward by adding quarterly transactions to the latest position estimate. Transactions are based on U.S. government administrative data. These U.S. government liabilities to foreign governments are also included in trade credit and advances in IIP table 3.1.
Financial-account transactions
26.51. As described in chapter 18, transactions in trade credit and advances of U.S. financial institutions and nonfinancial institutions with foreign residents are based on changes in quarterly holdings of claims and liabilities as reported on the TIC CQ–2 form. The computed changes in holdings from the TIC data are adjusted to remove the impact of any changes in holdings not caused by transac-tions, such as changes in exchange rates or TIC survey reporting panels.
26.52. Transactions in trade credit and advances denominated in foreign currency equal the change in holdings, with the holdings converted to the original currency of denomination at the exchange
To Contents

Part IV. Statistical Methodology of International Investment Position Accounts
Bureau of Economic AnalysisU.S. International Economic Accounts: Concepts and Methods
214
rates in effect at the beginning and end of the period, less changes due to changes in reporting pan-els classified as other changes in volume and valuation n.i.e. The foreign-currency-denominated estimate for the transaction amount is converted to U.S. dollars using an average exchange rate for the period.
26.53. Transactions in trade credit and advances denominated in U.S. dollars equal the reported dollar-de-nominated change in holdings less changes due to changes in reporting panels classified as other changes in volume and valuation n.i.e.
26.54. U.S. government liabilities from advance payments for foreign purchases of goods and services are estimated directly from U.S. government administrative data for payments received, which increase liabilities, and for deliveries of goods and services, which reduce liabilities.
Price changes
26.55. The value of U.S. trade credit and advances with foreign residents is assumed to be unaffected by changes in prices in secondary markets.
Exchange-rate changes
26.56. The calculation of exchange-rate changes for foreign-currency-denominated trade credit and advances makes use of the exchange-rate-adjusted transactions described above. Exchange-rate changes are equal to the unadjusted total change in holdings of foreign-currency-denominated trade credit and advances less the sum of transactions and any changes in reporting panels that would be classified as other change in volume and valuation n.i.e.
Other changes in volume and valuation n.i.e.
26.57. Changes in TIC reporting caused by the addition of new reporters, corrected reporting, or other changes to the reporting panels are reported to BEA so that the changes in quarterly balances not caused by transactions or exchange-rate changes can be removed from total changes in holdings when estimating transactions.
Special drawing rights (SDR) allocations
Positions
26.58. SDR allocations to the United States are available in an IMF public database with values denomi-nated in SDRs. The position in the IIP Accounts equals the amount reported by the IMF as of the end of the period converted from SDRs to U.S. dollars at the conversion rate in effect at the end of the period. SDR allocations are also included in IIP table 3.1.
To Contents

Part IV. Statistical Methodology of International Investment Position Accounts
Bureau of Economic AnalysisU.S. International Economic Accounts: Concepts and Methods
215
Financial-account transactions
26.59. As described in chapter 18, changes in SDR allocations to the United States are available in IMF public releases and databases with values denominated in SDRs.
Price changes
26.60. The value of SDR allocations to the United States is not affected by changes in prices.
Exchange-rate changes
26.61. The exchange-rate change for a period when the SDR allocation is unchanged equals holdings in U.S. dollars at the end of the period less holdings in U.S. dollars at the beginning of the period, with the holdings converted to U.S. dollars from SDRs at the conversion rates in effect at the beginning and end of the period. If the SDR allocation changed during the period, exchange-rate changes for each level and duration of the allocation would be computed and summed to obtain the exchange-rate change for the period.
Other changes in volume and valuation n.i.e.
26.62. Increases or decreases in SDR allocations to the United States are always transactions as defined in BPM6. As a result, other changes in volume and valuation do not apply to this component.
To Contents

Part IV. Statistical Methodology of International Investment Position Accounts
Bureau of Economic AnalysisU.S. International Economic Accounts: Concepts and Methods
216
Chapter 27. Reserve Assets
Concepts and coverage
27.1. Reserve assets are those external assets that are readily available to, and controlled by, monetary authorities for meeting balance of payments financing needs, for intervening in exchange markets to affect the currency exchange rate, and for other related purposes such as maintaining confidence in the currency and the economy, and serving as a basis for foreign borrowing. (See paragraphs 9.70 and 9.71 for further discussion of the reserve assets functional category.) The major published components of the reserve assets position are monetary gold, International Monetary Fund (IMF) special drawing rights (SDRs), reserve position in the IMF, and other reserve assets.
27.2. Other reserve assets enable the United States to hold foreign currency balances that are highly liquid and that are available for intervention sales. U.S. foreign currency balances include deposits, debt securities, and repurchase agreements that are classified as “other claims.” The United States does not have financial derivatives in its reserve assets.
Departures from BPM6
27.3. The coverage and presentation of reserve assets closely follow recommendations from the IMF Balance of Payments and International Investment Position Manual, Sixth Edition (BPM6).
Data sources
27.4. U.S. Department of the Treasury (Treasury Department). Data on U.S. reserve assets are pub-lished by the Treasury Department in terms of holdings (outstanding amounts). The Bureau of Economic Analysis (BEA) also uses Treasury Department source data on the gold stock.
27.5. Federal Reserve Bank of New York (FRBNY). The Treasury and Federal Reserve Foreign Exchange Operations Report from the FRBNY provides data for transactions in central bank liquidity swaps. The FRBNY also provides the report of Foreign Investment Balances with data on the outstanding amounts of foreign currencies in U.S. reserve assets. Other data for interest earned on reserves and swaps and on claims and liabilities with foreign central banks are provided to BEA for estimates of reserve assets and central bank sector transactions.
27.6. International Monetary Fund (IMF). The IMF provides month-end position data and daily increases and decreases during each month for the U.S. Accounts at the IMF. The data include
To Contents

Part IV. Statistical Methodology of International Investment Position Accounts
Bureau of Economic AnalysisU.S. International Economic Accounts: Concepts and Methods
217
positions and transactions between the United States and the IMF for the SDR account and the General Resources (tranche) Account and its subaccounts covering securities, valuation adjust-ments, and IMF borrowing from the United States.
Estimation methods
27.7. The presentation of the International Investment Position (IIP) Accounts includes statistics for positions at period end and for changes in position. Changes in positions consist of financial- account transactions and changes due to price changes, exchange-rate changes, and changes in value and volume n.i.e. (not included elsewhere). Estimation methods for financial-account trans-actions are described in chapter 19. IIP table 1.2 presents reserve assets position levels at quarter end. IIP table 1.3 presents reserve assets position levels at yearend and a decomposition of annual changes in position. Methods for each of the published components are described below.
Monetary gold
Positions
27.8. Positions in monetary gold are equal to the amount of gold in ounces in the monthly Treasury Department report on the U.S. gold stock at the end of the quarter, multiplied by the price of gold from the afternoon price quoted in the London gold market (“the London gold afternoon (PM) fix”) at the end of the quarter. If the London gold market is closed on the afternoon of the last day of the quarter, then the last fixing for the quarter is the price used.
27.9. Monetary gold is valued at the market price in London, following recommendations from BPM6 that the investment position should be valued at market prices. The value of monetary gold in the IIP Accounts is different from the valuation used by the Treasury Department in the official state-ment of the value of U.S. reserve assets. The price used to value gold in the Treasury Department report on the U.S. gold stock and in the official statement of the value of U.S. reserve assets is fixed by U.S. law at $42.2222 per ounce. Official valuations of U.S. gold are made pursuant to the Par Value Modification Act (Public Law 92–268) and its amendment (Public Law 93–110).
Financial-account transactions
27.10. As described in chapter 19, if transactions were to occur, BEA would obtain from the Treasury Department data for the quantity of gold transferred out or received from the counterparty, either in ounces or in dollars at a known price. If daily data were available, BEA would value the daily gold transactions using the afternoon (PM) fix in the London market for each day. If transactions were to occur over a period of time and daily data were not available, the transactions over the period would be valued at an average price of gold for that period.
To Contents

Part IV. Statistical Methodology of International Investment Position Accounts
Bureau of Economic AnalysisU.S. International Economic Accounts: Concepts and Methods
218
Price changes
27.11. Price changes for a given period equal the holdings in ounces at the beginning of the period mul-tiplied by the change in the gold price. If the holdings of gold change during the period, price changes for each level and duration of holdings would be computed and summed to obtain the price change for the period. A significant change in gold holdings would be unusual; accurate price changes can usually be computed based on the holdings at the beginning of the period.
Exchange-rate changes
27.12. The value of the gold stock is not affected by changes in exchange rates.
Other changes in volume and valuation n.i.e.
27.13. The value of changes in the gold stock caused by the monetization or demonetization of gold would be recorded in this category, based on the price on the date of the monetization or demonetization.
Special drawing rights (SDRs)
Positions
27.14. Positions in SDRs equal the amount in the U.S. SDR account reported by the IMF as of the end of the period, converted to U.S. dollars at the conversion rate in effect at the end of the period.
Financial-account transactions
27.15. As described in chapter 19, BEA converts daily increases or decreases caused by transactions in the U.S. SDR account from SDRs to U.S. dollars at the conversion rate in effect on that date. These daily transactions are aggregated into quarterly financial transactions for the International Transactions Accounts (ITAs).
Price changes
27.16. The value of U.S. holdings of SDRs is not affected by changes in prices.
Exchange-rate changes.
27.17. Exchange-rate changes equal the total change in U.S. SDR holdings, less financial-account transac-tions computed from reported increases and decreases.
Other changes in volume and valuation n.i.e.
27.18. Increases or decreases in the value of U.S. SDR holdings are completely accounted for by transac-tions and by exchange-rate changes. As a result, other changes in volume and valuation n.i.e do not apply to this component.
To Contents

Part IV. Statistical Methodology of International Investment Position Accounts
Bureau of Economic AnalysisU.S. International Economic Accounts: Concepts and Methods
219
Reserve position in the IMF
Positions
27.19. Positions in the U.S. reserve position in the IMF equal the amount in the U.S. General Resources, or tranche, Account plus any borrowing by the IMF from the United States through the General Arrangements to Borrow, the New Arrangements to Borrow, or other borrowing facilities, con-verted to U.S. dollars at the conversion rate in effect at the end of the period.
Financial-account transactions
27.20. As described in chapter 19, transactions from IMF borrowings or repayments are provided for each day of the reporting month to BEA by the IMF. The IMF reports these values in terms of SDRs. BEA converts daily increases or decreases from SDRs to U.S. dollars at the conversion rate in effect on that date. These daily transactions are aggregated into quarterly financial transactions for the ITAs.
27.21. Transactions in the General Resources Account are computed by deducting valuation changes from the total change in balance of the account, which is equal to U.S. holdings at the end of the refer-ence quarter converted to U.S. dollars, less U.S. holdings at the end of the previous quarter con-verted to U.S. dollars. The valuation changes are computed from the change in the SDR/U.S. dollar conversion rate and from valuation adjustments to IMF holdings of U.S. dollars recorded by the IMF in their accounting records. The SDR/U.S. dollar conversion rate and valuation adjustments to IMF holdings of U.S. dollars are provided to BEA by the IMF.
Price changes
27.22. The value of the U.S. reserve position in the IMF is not affected by changes in prices.
Exchange-rate changes
27.23. Exchange-rate changes equal the total change in the U.S. reserve position in the IMF, less financial- account transactions.
Other changes in volume and valuation n.i.e.
27.24. Increases or decreases in the value of the U.S. reserve position in the IMF are completely accounted for by transactions and exchange-rate changes. As a result, changes in volume and valu-ation n.i.e do not apply to this component.
Other reserve assets
Positions
27.25. Positions in other reserve assets are equal to the U.S. dollar-equivalent positions reported by the FRBNY to BEA as of the end of the quarter. These reports include holdings of
To Contents

Part IV. Statistical Methodology of International Investment Position Accounts
Bureau of Economic AnalysisU.S. International Economic Accounts: Concepts and Methods
220
foreign-currency-denominated deposits, securities, and repurchase agreements, all converted to U.S. dollars at exchange rates in effect at the end of the quarter.
Financial-account transactions
27.26. As described in chapter 19, transactions are estimated from reports of interest collected from holdings of deposits, securities, and repurchase agreements and from reports of any intervention purchases or sales of assets from the FRBNY.
Price changes
27.27. BEA estimates price changes for securities, but not for deposits and repurchase agreements, because the impact of secondary market prices for deposits and repurchase agreements is assumed to be minimal. Price changes for securities equal total changes in securities holdings, less the sum of exchange-rate changes and other changes in volume and value n.i.e.
Exchange-rate changes
27.28. The exchange-rate change for each instrument in each period for each currency denomination (Japanese yen and euro) is calculated by subtracting the exchange-rate-adjusted change in position from the total change in position. The exchange-rate-adjusted change is computed by converting the change in the amount of Japanese yen or euro held into U.S. dollars using each currency’s average exchange rate for the period. The total change in positions is calculated by converting the foreign-currency-denominated positions to U.S. dollars and computing the change from those dol-lar-equivalent positions. Exchange-rate changes are computed for each currency and summed to obtain the total exchange-rate change.
Other changes in volume and valuation n.i.e.
27.29. These changes mainly include offsetting changes in holdings of deposits, securities, and repurchase agreements by U.S. monetary authorities, representing changes in the mix of investments held. These offsetting changes are excluded from transactions because they are accomplished without any impact on the value of the U.S. dollar in exchange markets and they do not change the total reserve holdings of a particular foreign currency.
27.30. For deposits, other changes equal the total change less the sum of the financial transactions and the exchange-rate change. Price change does not apply to deposits. For other claims (repurchase agreements), other changes equal the total change less the sum of financial transactions and the exchange-rate change. Price changes do not apply to repurchase agreements. For securities, other changes equal the sum of other changes for deposits and repurchase agreements with the sign reversed, reflecting the assumption that other changes are offsetting and do not change the total reserve holdings of foreign currencies.
To Contents

Part V. Methodology of Statistics on the Activities of Multinational Enterprises
Bureau of Economic AnalysisU.S. International Economic Accounts: Concepts and Methods
221
Part V. Methodology of Statistics on the Activities of Multinational Enterprises
Chapter 28. Statistics on the Activities of Multinational Enterprises
Concepts and coverage
28.1. Statistics produced by the Bureau of Economic Analysis (BEA) on the activities of multinational enterprises (AMNE) provide a comprehensive and integrated data set for empirical analysis of multinational enterprises (MNEs) and their effects on home and host country economies. These annual statistics provide an additional perspective on the impact of direct investment beyond that provided by the International Transactions Accounts (ITAs) and the International Investment Position ( IIP) Accounts. AMNE statistics provide insights into the overall activities of U.S. MNEs—both U.S. parents and their foreign affiliates—and U.S. affiliates of foreign MNEs using a wide vari-ety of indicators of their financial structure and operations. The statistics on foreign affiliates and U.S. affiliates cover the entire operations of the affiliate, regardless of the share of ownership by the parent companies.
28.2. The following are some of the key indicators included in BEA’s AMNE statistics: • Balance sheets and income statements
• Sales by type (goods supplied, services
supplied, or other sales)
• Value added
• Employment and employee compensation
• U.S. trade in goods
• Research and development (R&D)
• Expenditures for property, plant, and
equipment (PP&E)
• Taxes
To Contents
Part V. Methodology of Statistics on the Activities of Multinational Enterprises
Bureau of Economic AnalysisU.S. International Economic Accounts: Concepts and Methods
222
28.3. Each of these categories includes additional related individual data items. For example, detailed balance sheet components, such as inventories and net property, plant, and equipment, are avail-able annually for majority-owned affiliates. The amount of additional detail available for some of the categories is greater in benchmark survey years (every 5 years) than in other years.
28.4. BEA’s AMNE statistics are compiled for all direct investment enterprises and, separately, for a subset of direct investment enterprises in which the direct investor directly or indirectly holds or controls a majority of the voting power. In BEA’s AMNE statistics, these controlled direct invest-ment enterprises are referred to as majority-owned affiliates. BEA provides separate tabulations for foreign affiliates that are majority-owned by their U.S. parent(s) and for U.S. affiliates that are majority-owned by their foreign parent(s).32 The focus on majority ownership facilitates analysis of the behavior of MNEs according to a conceptual framework in which the direct investor or the ultimate owner controls and coordinates the global activities of affiliated businesses.
28.5. BEA goes beyond guidance from the IMF Balance of Payments and International Investment Position Manual, Sixth Edition (BPM6) by not excluding from the scope of AMNE statistics the activities of minority-owned affiliates, which are business entities that are owned between 10 and 50 percent by another business entity.33 However, fewer statistics are compiled for the broader set of all affiliates than for the subset that excludes minority-owned affiliates. BEA compiles AMNE statistics for both foreign enterprises resident in the U.S. economy (“inward AMNE”) and foreign affiliates owned by U.S. residents (“outward AMNE”). In addition, selected AMNE statistics are compiled for the domestic activities of U.S. MNE parent companies, a component of outward AMNE.34
28.6. Closely related to AMNE statistics are foreign affiliates statistics (FATS). Whereas AMNE statistics provide information on the overall operations of MNEs in their home country and of their affili-ates in host countries, FATS exclude the operations of the affiliate’s ultimate parent enterprise and operations of minority-owned affiliates. FATS provide data on goods produced and services pro-vided by affiliates in foreign markets and provide information on other economic variables, such as sales or output, employment, value added, exports and imports of goods and services, and number of enterprises. FATS represents a subset of AMNE statistics. BEA does not explicitly label any of its AMNE statistics as FATS. However, FATS are emphasized in certain contexts in international sta-tistical guidelines, and BEA’s AMNE statistics on majority-owned affiliates can be compared with FATS produced by statistical agencies in other countries.
28.7. BEA’s AMNE statistics on U.S. parents are published by industry. Statistics on U.S. affiliates and foreign affiliates are published by country and by industry, and some statistics on U.S. affiliates are
32. BEA shifted from a focus on all affiliates to one on majority-ownership for foreign affiliates starting with statistics for 1994 and for U.S. affiliates starting with statistics for 2002.
33. BEA includes entities that are owned exactly 50 percent by another business entity in “minority-owned affiliates.”
34. BPM6 and other international statistical guidelines use the term “associates” to describe minority-owned affiliates and the term “subsidiaries” to describe majority-owned affiliates. BEA does not use these terms in its presentation of AMNE statistics.
To Contents

Part V. Methodology of Statistics on the Activities of Multinational Enterprises
Bureau of Economic AnalysisU.S. International Economic Accounts: Concepts and Methods
223
published by U.S. state. (See paragraphs 28.52–28.60 for more information on classification of the AMNE statistics.) Typically, U.S. parent and U.S. affiliate statistics are compiled at the enterprise—or company—level.35
28.8. AMNE statistics provide insight into the finances and operations of MNEs, the effects of increased globalization of economic activity, and the continued growth of services trade. The growth of ser-vices trade has led to the need for a more complete picture of the international supply of services that considers not only resident-nonresident transactions as recorded in the ITAs but also those services delivered via physical commercial presence by foreign affiliates that are not included in ITA statistics. Commercial presence is one of the four modes of supply for services (mode 3) iden-tified in the General Agreement on Trade in Services. Chapter 34 provides more information on modes of supply.
28.9. AMNE statistics are important for understanding the impact of direct investment on a broad set of activities in an economy rather than just the investment transactions and positions that are the focus of direct investment statistics in BEA’s ITA and IIP statistics. AMNE statistics are also important for the analysis of the performance of direct investment enterprises, both in absolute terms and relative to the larger domestic and foreign populations of enterprises. For example, direct investment enterprises may be involved in activities such as R&D that have important impacts in the domestic economy but that may not be recorded as international transactions.
Statistics on the activities of multinational enterprises and BPM6
28.10. BPM6 includes an appendix that endorses and provides guidance for the compilation of AMNE statistics as a supplement to the direct investment statistics compiled for the ITAs and the IIP Accounts. Detailed discussion and guidance for both AMNE statistics and FATS are found in the Manual on Statistics of International Trade in Services 2010 (MSITS), specifically in chapter IV. Additional guidance is found in the Organisation for Economic Co-operation and Development (OECD) Handbook on Economic Globalization Indicators and in the OECD Benchmark Definition of Foreign Direct Investment, Fourth Edition (BD4). BEA’s AMNE statistics exceed the standards recommended by these guidelines. BEA’s statistics also cover a broader set of MNEs than recom-mended in BPM6, one that includes minority-owned affiliates.
35. Statistics compiled at the establishment—or plant—level are also available for selected years as a result of several projects linking BEA’s enterprise data on foreign direct investment in the United States with more detailed establishment data from the U.S. Census Bureau (Census Bureau) and the Bureau of Labor Statistics (BLS). These statistics do not exactly match the statistics compiled from the enterprise level, as they are primarily based on data collected by the Census Bureau or BLS. The data can be accessed from BEA’s website.
To Contents

Part V. Methodology of Statistics on the Activities of Multinational Enterprises
Bureau of Economic AnalysisU.S. International Economic Accounts: Concepts and Methods
224
Data sources
28.11. BEA survey data. BEA’s AMNE statistics are based almost entirely on data collected on BEA’s mandatory benchmark and annual direct investment surveys. Benchmark surveys, which are con-ducted once every 5 years, are censuses of all U.S. MNEs and all U.S. affiliates of foreign MNEs. Annual surveys, conducted between benchmark surveys, are size-cutoff sample surveys. Outward AMNE statistics are based on the Annual Survey of U.S. Direct Investment Abroad (BE-11) and the Benchmark Survey of U.S. Direct Investment Abroad (BE-10). Inward AMNE statistics are based on the Annual Survey of Foreign Direct Investment in the United States (BE-15) and the Benchmark Survey of Foreign Direct Investment in the United States (BE-12).
28.12. In most cases, U.S. MNEs and U.S. affiliates of foreign MNEs are required to report data as they would for stockholder’s reports rather than for tax or other purposes. Thus, unless otherwise indi-cated by the survey instructions, survey reporters are asked to report using U.S. generally accepted accounting principles (GAAP). The survey instructions depart from GAAP in cases where the departure would result in data that are conceptually or analytically more useful or appropriate for MNE analysis. One major departure from GAAP is in the area of consolidation rules.
28.13. U.S. parents and U.S. affiliates are required to report on a fully consolidated domestic (U.S.) basis. The fully consolidated U.S. domestic business enterprise is defined as (1) the U.S. business enterprise whose voting securities are not owned more than 50 percent by another U.S. business enterprise and (2) proceeding down each ownership chain from that U.S. business enterprise, any U.S. business enterprise whose voting securities are more than 50 percent owned by the U.S. business enterprise above it. This consolidation excludes all other U.S. business enterprises, foreign branches, and all foreign business enterprises.
28.14. Each foreign affiliate is required to be reported separately. However, consolidation of foreign affiliates in the same country is permitted if the affiliates are in the same four-digit industry or are integral parts of the same business operation. BEA’s U.S. MNE statistics cover all foreign affiliates owned by U.S. parents, either directly or indirectly through other affiliates. The inclusion of all the tiers of foreign affiliates is needed to reflect the countries in which goods and services are ulti-mately produced and where inputs to production such as labor and capital are located.
28.15. U.S. MNEs and U.S. affiliates of foreign MNEs are required to report on a fiscal-year basis. The fis-cal year is defined as the financial reporting year that ended during the calendar year covered by the survey.
28.16. The data for each of the surveys are collected using a series of survey forms. The survey form required to be reported depends on the size of the reporting firm and whether the foreign affiliate or U.S. affiliate is majority owned. The size is determined by the total assets, sales, or net income (or loss) of the reporting firm, and smaller and minority-owned firms are required to provide less detailed information. (For more detailed information on BEA’s survey methods, see chapter 3.)
To Contents
Part V. Methodology of Statistics on the Activities of Multinational Enterprises
Bureau of Economic AnalysisU.S. International Economic Accounts: Concepts and Methods
225
Estimation methods
28.17. BEA’s AMNE statistics represent the aggregation of financial and operating data items reported by U.S. MNEs for their U.S. operations and for their foreign affiliates and by the U.S. affiliates of foreign MNEs operating in the United States. Published statistics cover the universes of U.S. MNEs and U.S. affiliates of foreign MNEs. These statistics represent the sum of (1) values reported by firms that exceed asset, sales, or net income reporting thresholds and (2) values estimated for firms below the thresholds and for firms that fail to report. For items with higher reporting thresholds (that is, for items collected only on the most detailed survey forms), BEA generally bases estimates on relationships among data items reported for above-threshold firms. For other items, estimates are based on values reported for the firm in a previous year (possibly the benchmark year) extrapo-lated by the year-to-year movement in the data reported by a selection of firms in similar industries (and countries, if applicable).
28.18. The following sections highlight some concepts, definitions, and statistical issues for selected AMNE data items. Most of the concepts and definitions used for other data items in BEA’s AMNE statistics can be found in the instructions for BEA surveys available on the BEA website.
Balance sheets and income statements
28.19. Balance sheets and income statements are required to be reported as they would have been for stockholders’ reports, preferably according to U.S. GAAP. For most parents and affiliates, the income statement includes all types of income, both ordinary and extraordinary.
28.20. Many U.S. MNEs have complex ownership structures in which one foreign affiliate owns other foreign affiliates, and ownership of a lower-tier affiliate is included as an asset in the balance sheet of each foreign affiliate up the ownership chain to its U.S. parent. This characteristic of the data allows for analysis of the complete financial structure of U.S. MNEs and provides a window into the overall degree of complexity of MNE ownership structures. Consequently, however, the aggre-gate balance sheet statistics reflect the cumulative balance sheets of each foreign affiliate (both the top and lower tiers), so that assets of the lower-tier affiliates are counted at least twice. Statistics covering the income statement are similarly affected.
28.21. An example of double counting of income is illustrated in figure 28.a. In this example, a U.S. parent owns a holding-company affiliate in the Netherlands, which in turn owns a German manufactur-ing affiliate. The German affiliate generates $100 million in net income from its manufacturing operations. The affiliate in the Netherlands generates $110 million in net income: $10 million from its own operations to go along with the $100 million of equity income from its investment in the German affiliate. BEA’s foreign-affiliate income statement statistics would show $100 million in Germany and $110 million in the Netherlands for a total net income of $210 million. The aggre-gated data overstates the income of the MNE by $100 million, but the subtotals for Germany and the Netherlands accurately reflect the net income of those affiliates.
To Contents
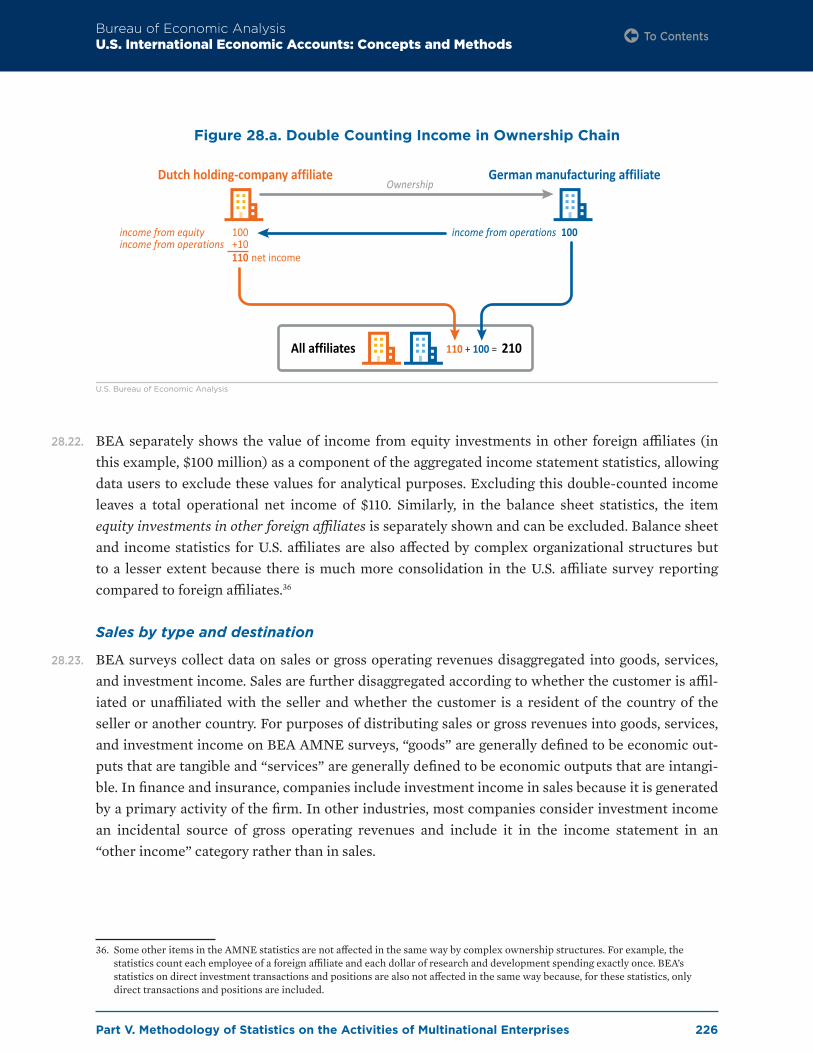
Part V. Methodology of Statistics on the Activities of Multinational Enterprises
Bureau of Economic AnalysisU.S. International Economic Accounts: Concepts and Methods
226
28.22. BEA separately shows the value of income from equity investments in other foreign affiliates (in this example, $100 million) as a component of the aggregated income statement statistics, allowing data users to exclude these values for analytical purposes. Excluding this double-counted income leaves a total operational net income of $110. Similarly, in the balance sheet statistics, the item equity investments in other foreign affiliates is separately shown and can be excluded. Balance sheet and income statistics for U.S. affiliates are also affected by complex organizational structures but to a lesser extent because there is much more consolidation in the U.S. affiliate survey reporting compared to foreign affiliates.36
Sales by type and destination
28.23. BEA surveys collect data on sales or gross operating revenues disaggregated into goods, services, and investment income. Sales are further disaggregated according to whether the customer is affil-iated or unaffiliated with the seller and whether the customer is a resident of the country of the seller or another country. For purposes of distributing sales or gross revenues into goods, services, and investment income on BEA AMNE surveys, “goods” are generally defined to be economic out-puts that are tangible and “services” are generally defined to be economic outputs that are intangi-ble. In finance and insurance, companies include investment income in sales because it is generated by a primary activity of the firm. In other industries, most companies consider investment income an incidental source of gross operating revenues and include it in the income statement in an “other income” category rather than in sales.
36. Some other items in the AMNE statistics are not affected in the same way by complex ownership structures. For example, the statistics count each employee of a foreign affiliate and each dollar of research and development spending exactly once. BEA’s statistics on direct investment transactions and positions are also not affected in the same way because, for these statistics, only direct transactions and positions are included.
Figure 28.a. Double Counting Income in Ownership Chain
Dutch holding-company affiliate German manufacturing affiliateOwnership
income from equityincome from operations
100+10110 net income
income from operations 100
110 + 100 = All affiliates 210
U.S. Bureau of Economic Analysis
To Contents

Part V. Methodology of Statistics on the Activities of Multinational Enterprises
Bureau of Economic AnalysisU.S. International Economic Accounts: Concepts and Methods
227
28.24. In BEA’s statistics, total sales are distributed by type of sale into categories that roughly correspond to goods, sales, and investment income but more closely approximate measures of output, namely goods supplied, services supplied, and other sales. For sales in industries other than banking, insur-ance, and wholesale and retail trade, goods and services supplied are equal to the reported values of sales of goods and services, and other sales, which is calculated as the residual of total sales less goods and services supplied, is equal to investment income. For banking, insurance, and wholesale and retail trade, adjustments are made to the reported values of sales of services.
Adjustments for banking, insurance, and wholesale trade
28.25. For sales in banking, services supplied include not only the explicit fees and commissions reported as sales, but also BEA’s estimate of the value of implicit services provided by banks, often referred to as financial intermediation services indirectly measured (FISIM). The adjustment of other sales for entities with sales in banking subtracts FISIM. For entities with sales in insurance, the adjustment for services supplied subtracts BEA’s estimate of the premiums set aside for expected or “normal” losses from sales of services and adds BEA’s estimate of premium supplements, which represent income earned on funds that insurers hold on policyholders’ behalf. The adjustment for other sales for entities with sales in insurance adds normal losses less premium supplements. For sales in wholesale and retail trade, services supplied includes BEA’s estimate of the value of the distributive services provided by selling, or arranging for the sales of, goods. This estimate of dis-tributive services is subtracted from the reported value of sales of goods to produce a measure of goods supplied that includes only the value of the goods resold.
28.26. The following formulas show the general relationships between goods supplied and sales of goods, between services supplied and sales of services, and between other sales and investment income.
• Goods supplied = reported sales of goods + adjustments
• Services supplied = reported sales of services + adjustments
• Other sales = reported investment income + adjustments
The adjustments in banking, insurance, and wholesale and retail trade are shown in table 28.a and described in more detail in paragraphs 28.27–28.30. The adjustments affect the distribution of sales or operating revenues among goods supplied, services supplied, and other sales, but they do not affect the value of total sales or operating revenues.
To Contents

Part V. Methodology of Statistics on the Activities of Multinational Enterprises
Bureau of Economic AnalysisU.S. International Economic Accounts: Concepts and Methods
228
Table 28.a. Adjustments to Produce Estimates of Goods and Services Supplied and Other Sales
Adjustments due to sales in...
Adjustments in converting...
Sales of goods to goods supplied
Sales of services to services supplied
Investment income to other sales
Banking None + FISIM – FISIM
Insurance carriers, except life insurance carriers
None – Normal losses+ Premium supplements
+ Normal losses– Premium supplements
Life insurance carriers None – Normal losses + Normal losses
Wholesale and retail trade – Distributive services + Distributive services None
FISIM Financial intermediation services indirectly measured
28.27. Financial intermediation services indirectly measured (FISIM). FISIM measures the value of implicit services provided by banks. Banks are compensated for some such services by paying lower interest rates on deposits, and charging higher interest rates on loans, than their cost of funds. BEA estimates these services as the difference between reported net interest earned in banking and BEA’s estimate of the cost of providing funds calculated as reported net assets multiplied by a refer-ence rate.
28.28. “Normal” losses. Normal losses are a proxy measure for the claims that insurers expect to pay in a given period. A measure of claims is subtracted in the calculation of insurance services supplied because claims represent resources that are allocated to policyholders and thus are not available to an insurance company to cover costs and provide an operating surplus. Normal losses are used as an alternative to the actual claims paid in a single period because actual claims paid are subject to high volatility and their use could result in an erratic, or even negative, measure of insurance services that would inadequately reflect long-term insurance output. Normal losses are calculated as reported premiums in a given year multiplied by a moving average of the ratio of reported losses to premiums.
28.29. Premium supplements. Premium supplements represent income earned on the insurance techni-cal reserves that insurers hold on the behalf of policyholders. Insurance companies hold and man-age these assets as an integral part of their business. Because the income generated on these assets serves to decrease the premiums that insurance companies charge, it is treated as being payable to the policyholders, who then pay it back to the insurer as a second means of compensation for the insurance services provided. Premium supplements are estimated by BEA by multiplying reported investment income earned by the share of investment income attributable to technical reserves for the domestic insurance industry.37 Premium supplements are not calculated for life insurance companies because for permanent (or “whole”) life insurance the investment income earned on these policies is allocated to actuarial reserves to meet the capital sums guaranteed to individual
37. This share comes from AM Best. See AM Best Company, Best’s Aggregates and Averages: Property/Casualty, and Best’s Aggregates and Averages: Life/Health.
To Contents

Part V. Methodology of Statistics on the Activities of Multinational Enterprises
Bureau of Economic AnalysisU.S. International Economic Accounts: Concepts and Methods
229
policyholders and is thus unavailable to defray insurers’ expenses. While this allocation does not apply to term life insurance, it is not possible to separately distinguish permanent and term life insurance in BEA’s data, and most of the investment income reported in life insurance is presumed to be attached to permanent life policies.
28.30. Distributive services. Distributive services measure the value of services provided by wholesal-ers and retailers through selling, or arranging for the sales of, goods. Companies report all of their wholesale and retail sales as goods, but the reported value includes both the cost of the goods to the seller and remuneration for the seller’s distributive services. BEA therefore estimates the dis-tributive services component in order to recategorize these sales as services supplied. The services component is calculated by multiplying the reported value of sales in goods by wholesale and retail margin rates that are estimated by extrapolating rates collected by BEA on past benchmark surveys using information on domestic activity from the U.S. Census Bureau.
Value added
28.31. Value added is a useful summary measure of MNE operations derived primarily from several data items collected on the surveys. MNE value added measures the value of goods and services pro-duced by MNEs and represents the firm’s direct contribution to gross domestic product (GDP), either in the United States (U.S. parent value added or majority-owned U.S. affiliate value added) or abroad (majority-owned foreign affiliate value added). Compared with sales, value added is a pref-erable measure of production because it indicates the extent to which a firm’s output results from its own production and excludes output resulting from production that originates elsewhere (that is, it excludes the value of output embodied in inputs purchased from other firms). Value added also more precisely reflects production in a specific reference period than does sales, which may include production from earlier periods.
28.32. BEA’s value added estimates are calculated as the sum of costs incurred (except for intermediate inputs) and profits earned in production; this method of calculating value added is known as the income method. Under the income-method calculation, the costs incurred fall into four major cat-egories: compensation of employees, net interest paid, taxes on production and imports, and cap-ital consumption allowances. The costs incurred exclude intermediate inputs (goods and services purchased from other firms) because these costs reflect production by other firms. In principle, a firm’s value added could also be measured as gross output (revenue) less its intermediate inputs, but BEA’s surveys do not collect specific information on intermediate inputs used in production.
28.33. Data for two of the cost categories used in calculating value added—compensation of employees and taxes on production and imports—come directly from the surveys. Capital consumption allowances represent depreciation and are estimated using survey reports of depreciation and depletion.38
38. BEA’s annual surveys collect only the combination of depreciation and depletion. However, the benchmark surveys collect each item separately, so to calculate capital consumption allowances for nonbenchmark years BEA removes an estimate of depletion from the annual reports using the relative values of depletion and depreciation on benchmark surveys.
To Contents
Part V. Methodology of Statistics on the Activities of Multinational Enterprises
Bureau of Economic AnalysisU.S. International Economic Accounts: Concepts and Methods
230
28.34. Net interest paid consists of net monetary interest paid and net imputed interest paid. Each of the measures of net interest is calculated as the difference between interest paid and interest received. Interest paid is one of the costs incurred in production. Interest received is netted out of value added because it adds to profits without representing production. Data for monetary interest paid and received come directly from the surveys. Data for imputed interest are estimated using both reported related data items and external data.
28.35. Imputed interest represents different types of activities for different types of entities. For insurers, imputed interest paid represents the premium supplements (or, for life insurance, the allocations to actuarial reserves) that belong to policyholders (see paragraph 28.29). In accounting for premium supplements and allocations to actuarial reserves as imputed interest paid, a notional payment of interest from insurers to policy holders is recognized.
28.36. In banking, imputed interest represents FISIM—services produced by banks and supplied to bor-rowers and depositors without explicit charge (see paragraph 28.27). Loan FISIM is enabled by banks charging higher loan rates than their cost of funds, and deposit FISIM is enabled by banks paying lower deposit rates. For deposit FISIM, a notional payment of imputed interest from the bank to the depositor is recognized; this imputed interest payment is the extra amount of interest required to bring the monetary interest paid on deposits to pure interest (see paragraph 13.41 for more on pure interest). For loan FISIM, a negative notional receipt of imputed interest to the bank from the borrower is recognized; this negative imputed interest receipt is the amount required to bring monetary interest received to pure interest.39
28.37. Outside of banking, imputed interest also represents premium supplements and FISIM, but from the perspective of insurance and banking customers. For the FISIM portion, for example, imputed interest paid is a negative notional payment representing the amount required to bring monetary interest paid by borrowers on bank loans to pure interest. FISIM-related imputed interest received is a positive notional receipt representing the amount required to bring monetary interest received by nonbanks on bank deposits to pure interest. Both FISIM values enter the net imputed interest paid calculation (and, therefore, the value-added calculation) with a minus sign. The minus sign is consistent with the exclusion of FISIM from nonbank value added because FISIM represents the cost of an intermediate input in production for nonbanks.
28.38. Imputed interest is estimated in different ways for different entities. For imputed interest in insurance and banking, estimates of premium supplements and allocations to actuarial reserves are consistent with those described in paragraph 28.29. For imputed interest in banking, estimates of FISIM are consistent with those described in paragraph 28.27. For entities in other industries, imputed interest paid is based on reported monetary interest paid, and imputed interest received is based on reported assets. For U.S. parents and U.S. affiliates, BEA estimates the imputed interest
39. Because net imputed interest paid equals imputed interest paid less imputed interest received, recognizing loan FISIM as negative interest received for this imputed transaction is equivalent to recognizing loan FISIM as positive imputed interest paid. Both treatments serve to raise net interest paid above net monetary interest paid in accounting for loan FISIM.
To Contents
Part V. Methodology of Statistics on the Activities of Multinational Enterprises
Bureau of Economic AnalysisU.S. International Economic Accounts: Concepts and Methods
231
transactions by multiplying the reported monetary interest paid and assets data by ratios—imputed interest paid to monetary interest paid and imputed interest received to assets, respectively—from domestic data used by BEA’s National Economic Accounts. For foreign affiliates, the calculations are similar, but monetary interest paid and assets are multiplied by ratios from (partly imputed) U.S. parent data instead of by ratios from domestic data.
28.39. The profits-earned-in-production component of value added is also called “profit-type return.” Profit-type return starts with reported net income. To this, BEA adds reported income taxes and an estimate of depletion (see paragraph 28.33.). From this sum, BEA subtracts reported capital gains (or adds capital losses), reported income from equity investments, and (for U.S. affiliates only) an estimate of holding gains (or losses) on inventories sold that do not represent income from current production. The last of these—the “inventory valuation adjustment”— is estimated by multiplying reported inventories by the domestic ratio (from data used for BEA’s National Economic Accounts) of the inventory valuation adjustment to inventories.
Employment and employee compensation
28.40. Employment represents the number of full-time and part-time employees on the payroll at the end of the fiscal year. However, some respondents provide a count taken during the year if it is a reasonable proxy for the end-of-year number. In addition, if employment at the end of the year was unusually high or low because of temporary factors, such as seasonal variations or a strike, respon-dents may provide a number reflecting normal operations. Employee compensation includes wages and salaries and supplements, such as fringe benefits.
U.S. trade in goods
28.41. The concepts and definitions underlying the data collected in the BEA surveys on trade in goods are very similar to those used for the statistics on total U.S. trade in goods compiled by the Census Bureau (referred to as “Census-basis” statistics in chapter 10 and elsewhere in this volume). In the AMNE statistics, trade between U.S. parents and their foreign affiliates or between U.S. affiliates and their foreign parent group is referred to as affiliated trade. All other U.S. trade in goods involv-ing U.S. MNEs is referred to as unaffiliated trade.
28.42. On BEA’s MNE surveys, data on U.S. trade in goods are requested to be reported on a “shipped” basis—that is, on the basis of when, where, and to (or by) whom the goods were shipped—to make the AMNE statistics comparable with Census-basis trade in goods statistics. However, unlike the Census-basis statistics, which are based on data compiled from export and import documents filed by shippers with U.S. Customs and Border Protection (CBP) on individual transactions, the AMNE statistics are compiled from survey data based primarily on company records. Most firms keep their accounting records (which is the source of most information provided on BEA’s MNE surveys) on a “charged” basis—that is, on the basis of when, where, and to (or by) whom the goods were charged.
To Contents

Part V. Methodology of Statistics on the Activities of Multinational Enterprises
Bureau of Economic AnalysisU.S. International Economic Accounts: Concepts and Methods
232
28.43. The two bases are usually the same, but they can differ substantially. For example, if a firm buys goods from country A and sells them to country B and if the goods are shipped directly from coun-try A to country B, the firm’s books would show a purchase from country A and a sale to country B. Because the goods never entered or left the United States, on a shipped basis, they would not be recorded as either U.S. imports or U.S. exports. However, if the firm’s trade data were reported on a charged basis, the purchase would appear as a U.S. import, and the sale would appear as a U.S. export.
28.44. BEA believes most firms report on a shipped, rather than on a charged, basis, even though doing so usually requires using shipping department invoices rather than accounting records. However, some firms have difficulty providing data on a shipped basis; if BEA determines that the data are reported on a charged basis and that these data are likely to differ materially from data reported on a shipped basis, it requires revised reports to be filed.
28.45. Because BEA’s MNE trade statistics are based on company records, they may not fully align with Census-basis trade data, even if they are based on shipping invoices. In particular, the timing, val-uation, origin or destination, shipper, and product involved in a given transaction may be recorded differently on company records than on the export and import documents filed with CBP.
28.46. A further reason that the MNE trade statistics may not fully align with the Census-basis statistics is that the MNE statistics reflect trade on a fiscal-year basis, whereas the Census-basis statistics reflect trade on a calendar-year basis.
Research and development (R&D)
28.47. Data on R&D expenditures are collected annually for R&D performed by the parent or the affiliate, whether for its own use or for use by others. BEA provides statistics for R&D expenditures by U.S. parents, by their foreign affiliates, and by U.S. affiliates of foreign MNEs. Every 5 years on its bench-mark surveys, BEA collects data on R&D expenditures funded by the parent or affiliate, whether performed internally or by others.
Expenditures for property, plant, and equipment (PP&E)
28.48. Expenditures for PP&E are sometimes called capital expenditures in the AMNE statistics, but they exclude expenditures for most types of intangible capital recognized by BPM6. Expenditures for PP&E include expenditures for land, timber, mineral and like rights owned; structures; machinery, equipment, special tools, and other depreciable property; construction in progress; and capitalized and expensed tangible and intangible exploration and development costs.40 They exclude expen-ditures for other types of intangible assets (such as R&D expenditures), and expenditures on land held for resale.
40. BEA includes expensed exploration and development costs in expenditures for PP&E even though the assets obtained through such expenditures are not included as PP&E in firm’s balance sheets.
To Contents

Part V. Methodology of Statistics on the Activities of Multinational Enterprises
Bureau of Economic AnalysisU.S. International Economic Accounts: Concepts and Methods
233
Taxes
28.49. BEA’s MNE surveys collect two type of tax data: income taxes and “taxes other than income and payroll taxes” (also referred to as indirect business taxes). Both types of taxes exclude payroll taxes. Payroll taxes are included in employee compensation, but they are not separately identified.
28.50. Income tax statistics for U.S. parents and U.S. affiliates cover provision for federal, state, and local income taxes. For foreign affiliates, income taxes also cover all such taxes regardless of the level of government at which they are imposed.
28.51. Indirect business taxes include a wide variety of taxes such as sales taxes, value-added taxes, and excise taxes; property taxes; import and export duties, license fees, and various other taxes, fines and penalties. Also included indistinguishably are nontax payments to government, although these are likely quite small compared to the taxes in this category. Indirect business taxes for outward AMNE statistics (U.S. parents and their foreign affiliates) exclude production royalty payments made to governments for natural resources, but such taxes for inward statistics (U.S. affiliates) include production royalty payments.
Classification
28.52. AMNE statistics are classified in several ways. One key classification is geographical, which involves determining the country where foreign-affiliate production occurs for outward statistics or the country of the owner of the U.S. affiliate for inward statistics. Select data items for U.S. affili-ates, including employment and gross PP&E, are also collected and published by U.S. state. Another key classification is based on the primary industrial activity or product of the producer.
Classification by country
Inward activities of multinational enterprises
28.53. For U.S. affiliates of foreign MNEs, BEA attributes AMNE statistics to the country of incorpora-tion (or of residence if an individual) of the ultimate investor or ultimate beneficial owner (UBO). Usually the immediate investor (first foreign parent) and the ultimate investor are the same, but in many cases they differ. Apart from practical considerations, attributing variables concerning production to the country of the ultimate investor is preferred because that country controls and derives most of the benefits from controlling the direct investment enterprise. While BEA follows international guidelines by attributing most inward AMNE statistics to the country of the UBO, it also provides selected tabulations by the country of the first foreign parent. For U.S. affiliates with more than one UBO or foreign parent, the statistics are classified by the country of the UBO or for-eign parent with the largest ownership share in the affiliate.
To Contents
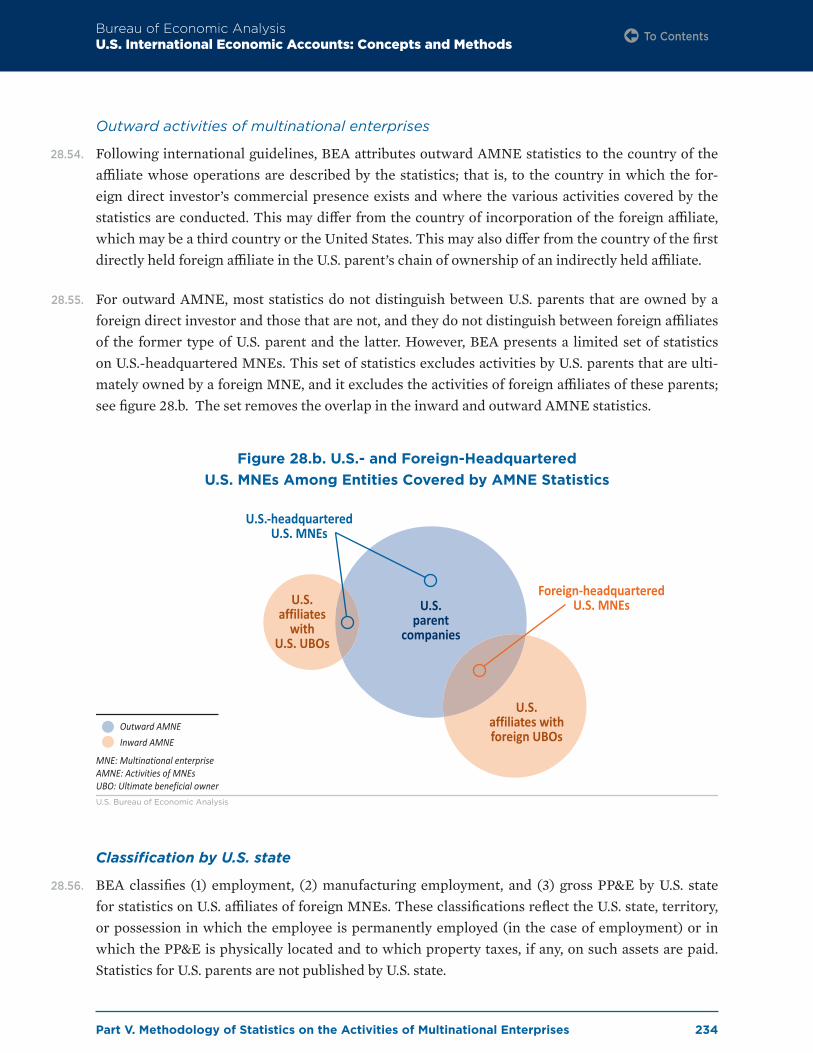
Part V. Methodology of Statistics on the Activities of Multinational Enterprises
Bureau of Economic AnalysisU.S. International Economic Accounts: Concepts and Methods
234
Outward activities of multinational enterprises
28.54. Following international guidelines, BEA attributes outward AMNE statistics to the country of the affiliate whose operations are described by the statistics; that is, to the country in which the for-eign direct investor’s commercial presence exists and where the various activities covered by the statistics are conducted. This may differ from the country of incorporation of the foreign affiliate, which may be a third country or the United States. This may also differ from the country of the first directly held foreign affiliate in the U.S. parent’s chain of ownership of an indirectly held affiliate.
28.55. For outward AMNE, most statistics do not distinguish between U.S. parents that are owned by a foreign direct investor and those that are not, and they do not distinguish between foreign affiliates of the former type of U.S. parent and the latter. However, BEA presents a limited set of statistics on U.S.-headquartered MNEs. This set of statistics excludes activities by U.S. parents that are ulti-mately owned by a foreign MNE, and it excludes the activities of foreign affiliates of these parents; see figure 28.b. The set removes the overlap in the inward and outward AMNE statistics.
Classification by U.S. state
28.56. BEA classifies (1) employment, (2) manufacturing employment, and (3) gross PP&E by U.S. state for statistics on U.S. affiliates of foreign MNEs. These classifications reflect the U.S. state, territory, or possession in which the employee is permanently employed (in the case of employment) or in which the PP&E is physically located and to which property taxes, if any, on such assets are paid. Statistics for U.S. parents are not published by U.S. state.
Figure 28.b. U.S.- and Foreign-HeadquarteredU.S. MNEs Among Entities Covered by AMNE Statistics
U.S.parent
companies
Outward AMNEInward AMNE
MNE: Multinational enterpriseAMNE: Activities of MNEsUBO: Ultimate beneficial owner
U.S.affiliates withforeign UBOs
U.S.affiliates
withU.S. UBOs
Foreign-headquarteredU.S. MNEs
U.S.-headquarteredU.S. MNEs
U.S. Bureau of Economic Analysis
To Contents
Part V. Methodology of Statistics on the Activities of Multinational Enterprises
Bureau of Economic AnalysisU.S. International Economic Accounts: Concepts and Methods
235
Classification by industry or product
28.57. International guidelines recommend classification of AMNE statistics by activity (that is, by industry) according to the International Standard Industrial Classification (ISIC). BEA has devel-oped its own enterprise industry classification system for AMNE statistics that is comparable to ISIC categories. U.S. parents and their foreign affiliates and U.S. affiliates are classified according to International Surveys Industry (ISI) classifications. The classifications and their code numbers are adapted by BEA from the most recent North American Industry Classification System (NAICS). For the most part, the ISI classifications are equivalent to NAICS four-digit industries; at its most detailed level, NAICS classifies industries at a six-digit level. The ISI classification system is less detailed than NAICS because it is designed for classifying enterprises rather than establishments. Foreign parents and UBOs are classified using a classification scheme that is based on two-digit codes.
28.58. Each U.S. parent or foreign affiliate and each U.S. affiliate is classified by industry on the basis of its sales (or for holding companies, on the basis of its total income) in a three-step procedure. First, a given parent or affiliate is classified in the NAICS sector that accounts for the largest percentage of its sales. Second, within the sector, the parent or affiliate is classified in the three-digit subsector in which its sales are largest; a three-digit subsector consists of all four-digit industries that have the same first three digits in their four-digit ISI code. Third, within its three-digit subsector, the parent or affiliate is classified in the four-digit industry in which its sales are largest. This proce-dure ensures that the affiliate or U.S. parent is not assigned to a four-digit industry outside either its primary sector or its primary three-digit subsector.
28.59. As an example of the three-stage classification procedure, suppose that an entity’s sales are distrib-uted as shown in table 28.b, where industry codes 3341, 3342, 3344, and 3353 are in the manufac-turing sector and code 4236 is in the wholesale trade sector. Because 55 percent of the sales are in manufacturing and only 45 percent are in wholesale trade, the entity’s sector is manufacturing. Because the largest share of its sales within manufacturing is in the three-digit subsector 334 (com-puters and electronic products, which includes industry codes 3341, 3342, and 3344), the affiliate’s three-digit subsector is 334. Finally, because its sales within subsector 334 are largest in industry 3344, the entity’s four-digit industry is 3344 (semiconductors and other electronic components). Thus, the entity is assigned to industry 3344, even though its sales in that industry are smaller than its sales in either industry 4236 or industry 3353.
To Contents

Part V. Methodology of Statistics on the Activities of Multinational Enterprises
Bureau of Economic AnalysisU.S. International Economic Accounts: Concepts and Methods
236
Table 28.b. Industry Distribution of Sales and Classification of Entity by Industry
Industry Percentage of total sales Sector Sector percentage
of total salesThree-digit
industryThree-digit industry
percentage of total sales
3341 5
Manufacturing 55334 303342 10
3344 15
3353 25 335 25
4236 45 Wholesale trade 45 423 45
28.60. BEA has also developed a supplementary classification system designed to approximate classifica-tion on an establishment basis rather than on an enterprises basis for sales and employment statis-tics. Establishment-level classification at detailed industry levels provides insights into the types of products produced and sold. Tabulations of AMNE statistics by “industry of sales” are developed by asking respondents to report their sales broken down by four-digit product codes. AMNE statis-tics classified on this basis can be compared to establishment-based statistics for the U.S. economy.
To Contents

Part VI. Statistical Methodologies of Other International Accounts
Bureau of Economic AnalysisU.S. International Economic Accounts: Concepts and Methods
237
Part VI. Statistical Methodologies of Other International Accounts
Chapter 29. Introduction to Other International Accounts
29.1. The Bureau of Economic Analysis (BEA) produces several other international economic statistical products that supplement the three core International Economic Accounts. These other accounts provide additional detail in various dimensions for the core accounts or focus on related economic topics. The information they provide offers policymakers and other data users a fuller picture of U.S. economic engagement with the rest of the world.
29.2. The four chapters that follow discuss a selection of these other accounts. Chapter 30 discusses monthly statistics on trade in goods and services, a joint product of BEA and the U.S. Census Bureau. Chapter 31 discusses the international services statistics—an annual statistical product that provides more detail on trade in services than the International Transactions Accounts (ITAs) and covers services provided internationally through affiliates of multinational enterprises (MNEs). Chapter 32 discusses the direct investment by country and industry statistics. These statistics provide more detail than the ITAs and International Investment Position (IIP) Accounts on the income, financial transactions, and positions associated with direct investment. Chapter 33 dis-cusses statistics on new foreign direct investment in the United States. Covered in these statistics are acquisitions of existing U.S. enterprises and greenfield investment by foreign direct investors, which includes the establishment of new U.S. businesses along with expansions of existing U.S. affiliates.
To Contents

Part VI. Statistical Methodologies of Other International Accounts
Bureau of Economic AnalysisU.S. International Economic Accounts: Concepts and Methods
238
29.3. BEA also produces other international economic statistical products, either on a regular basis or periodically, that are not discussed at length in this volume. For example, BEA publishes an article annually in the Survey of Current Business on an ownership-based framework of the U.S. current account.41 This framework disaggregates the current account of the ITAs along ownership lines and provides additional detail on direct investment income to show how that income is derived from the production and sales of affiliates. As a second example, BEA has periodically published statistics profiling U.S. firms involved in trade in services.42 These statistics utilize a link between survey data BEA collects on trade in services and survey data it collects on MNEs to provide information on the characteristics of firms that account for a large share of U.S. trade in services. Characteristics covered include industry, ownership, and size of firm.
41. For example, see Kassu W. Hossiso, “An Ownership-Based Framework of the U.S. Current Account, 2019,” Survey of Current Business 101 (January 2021).
42. For details, see Jennifer Bruner and Alexis Grimm, “A Profile of U.S. Exporters and Importers of Services, 2017,” Survey of Current Business 99 (December 2019). Note that selected statistics presented in this article are also included in the international services section of BEA interactive tables.
To Contents

Part VI. Statistical Methodologies of Other International Accounts
Bureau of Economic AnalysisU.S. International Economic Accounts: Concepts and Methods
239
Chapter 30. Monthly Trade in Goods and Services
30.1. Monthly statistics on trade in goods and services provide more frequent information on transac-tions in two particular current-account categories in the International Transactions Accounts (ITAs)—see figure A.1 in appendix A for an illustration. The monthly statistics are released by the Bureau of Economic Analysis (BEA) jointly with the U.S. Census Bureau and are available on both the BEA website and the Census Bureau website. A joint news release presents the statistics, highlights outcomes for the most recent reference month, and provides considerable detail on esti-mation methodologies used. The monthly balance on goods and services (also known as the “trade balance”), like the quarterly balance on the current account in the ITAs, is designated as a Principal Federal Economic Indicator.
30.2. The monthly trade in goods and services statistics include measures that are conceptually consis-tent with the ITAs.
Trade in goods
30.3. For trade in goods, the monthly statistics are presented on two bases: the Census basis and the balance of payments (BOP) basis. The Census-basis statistics reflect the value recorded in monthly trade data collected by U.S. Customs and Border Protection and compiled by the Census Bureau. The Census-basis data require several adjustments to align them with the coverage, valuation, defi-nitions, and concepts featured in the ITAs and in BEA’s National Economic Accounts. (For more information on the adjustments to the Census-basis data to align them with the BOP basis, see paragraphs 11.26–11.46.) The monthly statistics presented on a BOP basis are fully consistent with those featured in the quarterly ITAs.
30.4. BEA also publishes detailed statistics on monthly trade in goods, which are released concurrently with the joint monthly news release. The statistics include monthly goods trade by detailed end-use category and commodity on both a BOP basis and a Census basis.
Trade in services
30.5. Monthly statistics on trade in services are based on quarterly, annual, and benchmark surveys and on information obtained from government and private sector reports. For categories for which monthly data are not available, monthly statistics are derived from quarterly statistics through tem-poral distribution, or interpolation. The interpolation methodology used by BEA is the modified Denton proportional first difference method.
To Contents

Part VI. Statistical Methodologies of Other International Accounts
Bureau of Economic AnalysisU.S. International Economic Accounts: Concepts and Methods
240
30.6. Monthly trade in services statistics cover the same broad services categories as shown in ITA table 1.2. The additional services detail published in ITA table 3.1 is not available in the monthly release.
Seasonal adjustment
30.7. Monthly Census-basis trade in goods statistics are presented on both a seasonally adjusted basis and a not seasonally adjusted basis. Seasonal adjustment is applied using the X-11 ARIMA func-tionality within the Census Bureau’s X-13-ARIMA-SEATS seasonal adjustment software, which estimates monthly movements as percentages above or below the general level of the series. The Census Bureau performs seasonal adjustment at the level of end-use commodities, which classify goods according to their principal uses (see exhibits 7 and 8 of the monthly news release). (For more information on the end-use commodity classification system, see paragraphs 11.23–11.25.)
30.8. Monthly trade in services statistics are presented on a seasonally adjusted basis only. However, quarterly trade in services statistics on a not seasonally adjusted basis are available, along with sta-tistics on a seasonally adjusted basis, in the ITAs.
30.9. In addition, statistics on trade in goods and services for selected countries and areas are seasonally adjusted. Unlike seasonal adjustment by commodity or by service type, the geographic seasonal adjustments are developed and applied directly at the country and world area level. Consequently, seasonally adjusted statistics by geography do not sum to the same totals as statistics based on seasonal adjustment by commodity or service type. Seasonally adjusted statistics by geography are presented in exhibit 19 of the monthly news release, for Census-basis goods, and in exhibits 20, 20a, and 20b of the release, for BOP-basis goods and services.
To Contents

Part VI. Statistical Methodologies of Other International Accounts
Bureau of Economic AnalysisU.S. International Economic Accounts: Concepts and Methods
241
Chapter 31. International Services
31.1. To supplement the trade in services statistics in the International Transactions Accounts (ITAs) and the services supplied through affiliates statistics in the statistics on activities of multinational enterprises (AMNE), the Bureau of Economic Analysis (BEA) publishes a collection of more detailed annual statistics known as the international services statistics. Figure A.1 in appendix A illustrates the connections between these statistics. The international services statistics provide detail on U.S. trade in services by type and by country and area or affiliation, and on services sup-plied through affiliates by industry and by country and area. They also feature a complementary aggregation that focuses on trade in information and communications technology (ICT) services and on trade in services potentially enabled by ICT technologies.43 Beginning in 2020, the detailed trade in services statistics and the trade in ICT and potentially ICT-enabled services statistics are released in June or July. (Also see paragraph 2.45.) Statistics on services supplied through affiliates are released in October, although selected statistics may be released earlier as part of the AMNE statistics. An article published every October in the Survey of Current Business discusses the inter-national services statistics.
31.2. BEA’s international services statistics bring together information on all services provided to inter-national customers or procured from international sources. These statistics are organized into two groups: trade in services, which approximately covers modes of supply 1, 2, and 4 and services supplied through affiliates, which approximately covers mode 3.44 Trade in services statistics cover (1) U.S. trade in services in greater service-type and geographic detail than in the ITAs and (2) U.S. trade in ICT and potentially ICT-enabled services. Statistics on services supplied through affiliates cover (1) services supplied to foreign persons by U.S. multinational enterprises (MNEs) through their majority-owned foreign affiliates and (2) services supplied to U.S. persons by foreign MNEs through their majority-owned U.S. affiliates.
31.3. Both trade in services and services supplied through affiliates statistics are largely based on surveys conducted by BEA. For trade in services, the statistics are based on the sources described for the ITAs in chapter 12, including BEA’s quarterly and benchmark trade in services surveys, other gov-ernment surveys, and data from U.S. Customs and Border Protection, private sources, and partner countries. For services supplied through affiliates, the statistics are based on the same annual and benchmark direct investment surveys, as adjusted using other data sources, that are used to pre-pare the AMNE statistics; these sources are described in chapter 28.
43. As noted in chapter 29, the international services section of the BEA website also includes statistics profiling U.S. firms involved in trade in services.
44. The four modes of supply for international services delivery identified in the General Agreement on Trade in Services include (1) cross-border supply, (2) consumption abroad, (3) commercial presence, and (4) presence of natural persons. The modes are discussed further in chapter 34.
To Contents
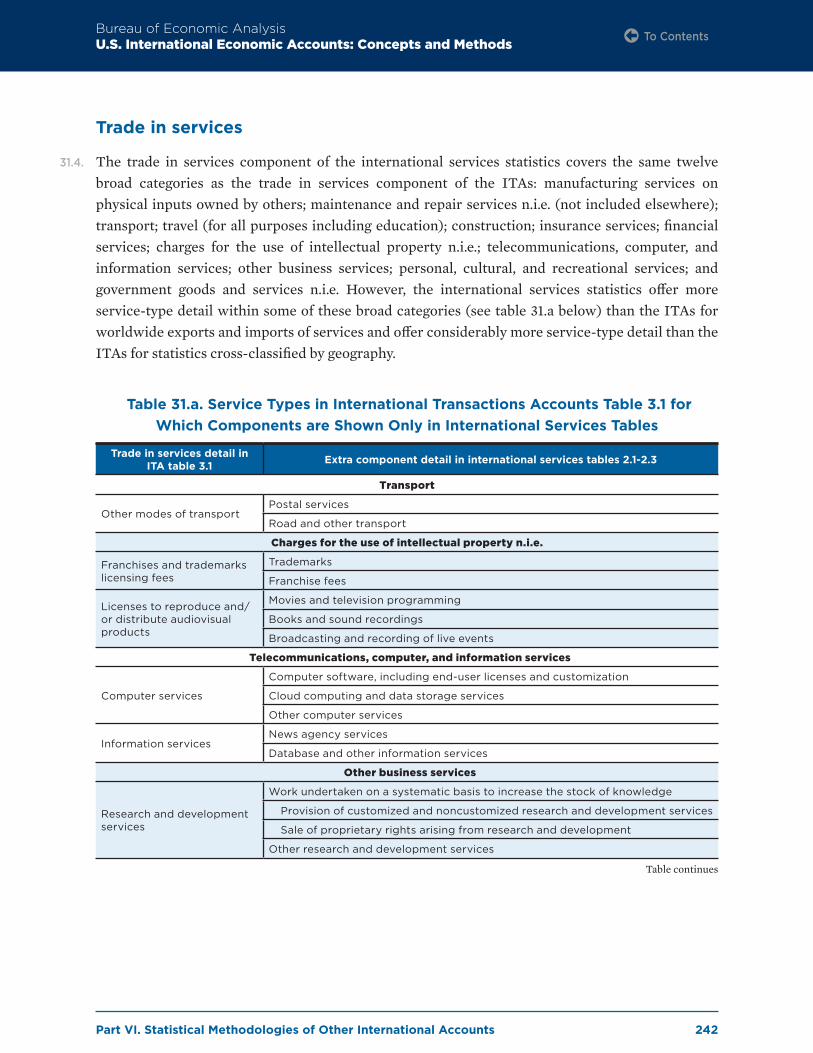
Part VI. Statistical Methodologies of Other International Accounts
Bureau of Economic AnalysisU.S. International Economic Accounts: Concepts and Methods
242
Trade in services
31.4. The trade in services component of the international services statistics covers the same twelve broad categories as the trade in services component of the ITAs: manufacturing services on physical inputs owned by others; maintenance and repair services n.i.e. (not included elsewhere); transport; travel (for all purposes including education); construction; insurance services; financial services; charges for the use of intellectual property n.i.e.; telecommunications, computer, and information services; other business services; personal, cultural, and recreational services; and government goods and services n.i.e. However, the international services statistics offer more service-type detail within some of these broad categories (see table 31.a below) than the ITAs for worldwide exports and imports of services and offer considerably more service-type detail than the ITAs for statistics cross-classified by geography.
Table 31.a. Service Types in International Transactions Accounts Table 3.1 for Which Components are Shown Only in International Services Tables
Trade in services detail in ITA table 3.1 Extra component detail in international services tables 2.1-2.3
Transport
Other modes of transportPostal services
Road and other transport
Charges for the use of intellectual property n.i.e.
Franchises and trademarks licensing fees
Trademarks
Franchise fees
Licenses to reproduce and/or distribute audiovisual products
Movies and television programming
Books and sound recordings
Broadcasting and recording of live events
Telecommunications, computer, and information services
Computer services
Computer software, including end-user licenses and customization
Cloud computing and data storage services
Other computer services
Information servicesNews agency services
Database and other information services
Other business services
Research and development services
Work undertaken on a systematic basis to increase the stock of knowledge
Provision of customized and noncustomized research and development services
Sale of proprietary rights arising from research and development
Other research and development services
Table continues
To Contents

Part VI. Statistical Methodologies of Other International Accounts
Bureau of Economic AnalysisU.S. International Economic Accounts: Concepts and Methods
243
Trade in services detail in ITA table 3.1 Extra component detail in international services tables 2.1-2.3
Professional and management consulting services
Legal, accounting, management consulting, and public relations services
Legal services
Accounting, auditing, bookkeeping, and tax consulting services
Business and management consulting and public relations services
Advertising and related services
Advertising services
Market research and public opinion polling services
Trade exhibition and sales convention services
Technical, trade-related, and other business services
Architectural, engineering, scientific, and other technical services
Architectural services
Engineering services
Scientific and other technical services
Waste treatment and de-pollution, agricultural, and mining services
Waste treatment and de-pollution services
Services incidental to agriculture, forestry, and fishing
Services incidental to mining, and oil and gas extraction
Operating leasing services
Trade-related services
Other business services n.i.e.
Personal, cultural, and recreational services
Audiovisual services
Audiovisual production services
Rights to use audiovisual products
Movies and television programming
Books and sound recordings
Audiovisual originals
Movies and television programming
Books and sound recordings
Other personal, cultural, and recreational services
Health services
Education services
Heritage and recreational services
n.i.e. Not included elsewhere
31.5. In addition to providing more detail on service types, the trade in services statistics break out trade by service type into affiliated and unaffiliated transactions. Affiliated trade consists of intrafirm trade within MNEs—trade between U.S. parent companies and their foreign affiliates and trade between U.S. affiliates and their foreign parent or other members of their foreign parent groups. Unaffiliated trade is with foreigners that neither own, nor are owned by, the U.S. party to the trans-action. For most types of services trade, affiliation detail is available by type of service for the total of trade with all countries; for trade in charges for the use of intellectual property n.i.e., detail is available by affiliation and by country.
To Contents

Part VI. Statistical Methodologies of Other International Accounts
Bureau of Economic AnalysisU.S. International Economic Accounts: Concepts and Methods
244
31.6. Not all transactions that flow through affiliated channels are recorded as or considered to be affiliated transactions. In particular, all insurance services are recorded as unaffiliated in BEA’s statistics. Direct insurance transactions between a U.S. (foreign) company that is not an insurance company and an affiliated foreign (U.S.) insurance company, such as a captive foreign (U.S.) insur-ance affiliate, and certain auxiliary insurance services between affiliated companies are considered to be affiliated, but data on these affiliated insurance services are not separately available. All other insurance services transactions are treated as unaffiliated. Most insurance services transactions between affiliated insurance companies are treated as unaffiliated because the services are consid-ered to be provided to the policyholders who pay the insurance premiums and who are unaffiliated with either company.
31.7. The trade in services component in the international services statistics also includes supplemental statistics on insurance transactions that are not included in the ITAs. The supplemental statistics include premiums received and paid and losses paid and recovered that underlie the trade in insur-ance services statistics. The statistics are separately available for direct insurance and reinsurance.
31.8. BEA introduced statistics on trade in ICT and potentially ICT-enabled services in 2016. These sta-tistics closely follow a 2015 proposal by the United Nations Conference on Trade and Development (UNCTAD) that was motivated, in part, by a desire to understand whether and how technological advances and reductions in costs for ICT over time have led to more remote provision and procure-ment of services across international borders. These statistics are calculated as the sum of subsets of services types included in BEA’s statistics on trade in services. ICT services consist of telecom-munications services, computer services, and charges for the use of licenses to reproduce and/or distribute computer software.
31.9. Although it is not possible to precisely identify services trade that is ICT-enabled, BEA measures a related, but more broadly defined, concept: potentially ICT-enabled services. Potentially ICT-enabled services include services that can predominantly be delivered remotely over ICT net-works. Potentially ICT-enabled services are composed of insurance services; financial services; charges for the use of intellectual property n.i.e.; telecommunications, computer, and information services; research and development services; professional and management consulting services; architectural, engineering, scientific, and other technical services; trade-related services; audio-visual services; and other personal, cultural, and recreational services. Potentially ICT-enabled services include ICT services.45
45. For more information, see Alexis N. Grimm, “Trends in U.S. Trade in Information and Communications Technology (ICT) Services and in ICT-Enabled Services,” Survey of Current Business 96 (May 2016).
To Contents

Part VI. Statistical Methodologies of Other International Accounts
Bureau of Economic AnalysisU.S. International Economic Accounts: Concepts and Methods
245
Services Supplied Through Affiliates
31.10. Services supplied through majority-owned foreign affiliates of U.S. MNEs mostly correspond to services supplied through the commercial presence mode of supply (mode 3) to the host country of the affiliate and to services supplied by the affiliate to other foreign markets. Services supplied through majority-owned U.S. affiliates of foreign MNEs mostly correspond to services supplied through mode 3 to the U.S. market. The services supplied statistics in the international services statistics provide geographic and industry detail beyond that provided in the main AMNE statistics.
31.11. For industries other than wholesale and retail trade, insurance, and banking, services supplied through affiliates are the sales of services reported by MNEs on BEA’s annual and benchmark direct investment surveys. For wholesale and retail trade, insurance, and banking, adjustments are made to reported sales of services to better capture the value of services supplied. More spe-cifically, these adjustments add 1) wholesalers’ and retailers’ distributive services, 2) insurers’ premium supplements, and 3) banks’ implicitly charged services; they subtract a proxy measure of insurers’ expected, or “normal,” losses. (See paragraphs 28.24–28.30 and table 28.a for more infor-mation on the reallocation of sales reported as goods sales, services sales, and investment income into goods supplied, services supplied, and “other” sales.)
31.12. Sales of services generally consist of intangible outputs; therefore, they exclude most of the sales by establishments in manufacturing; mining (except support activities); agriculture, forestry, fishing, and hunting (except support activities); and construction, which typically produce and sell tangi-ble goods.46 However, services supplied through affiliates can be classified in any affiliate industry because the classification of an affiliate reflects the affiliate’s primary industry of sales, and affili-ates classified in industries that typically produce goods may have secondary activities in services industries. In cases where a sale consists of both tangible and intangible output that cannot be unbundled, sales are classified based on whichever accounts for the majority of the value.
Comparing U.S. Trade in Services and Services Supplied Through Affiliates
31.13. Differences in coverage and classification make it difficult to precisely compare trade in services with services supplied through affiliates. An example of a difference in coverage is the inclusion of distributive services (wholesale and retail trade services) in services supplied through affiliates but not in the trade in services statistics. The distributive services associated with importing and exporting goods are included, but are not separately identifiable, in the value of trade in goods. The differences in classification arise because the statistics on trade in services are collected and published by type of service, but those on services supplied through affiliates are collected and published by the affiliate’s primary industry.
46. The treatment of outputs of construction establishments as mostly goods in MNE sales data contrasts with the treatment of such outputs in the trade in services statistics. In the trade in services statistics, these outputs are considered to be services.
To Contents

Part VI. Statistical Methodologies of Other International Accounts
Bureau of Economic AnalysisU.S. International Economic Accounts: Concepts and Methods
246
Chapter 32. Direct Investment by Country and Industry
32.1. The Bureau of Economic Analysis (BEA) publishes detailed quarterly and comprehensive annual statistics on direct investment financial transactions, income, and positions. These statistics are known as statistics on direct investment by country and industry, and they supplement the direct investment financial transactions and income statistics presented in the International Transactions Accounts (ITAs) and the direct investment position statistics in the International Investment Position (IIP) Accounts. Figure A.1 in appendix A shows the connections among the various U.S. International Economic Accounts.
32.2. The statistics on direct investment by country and industry are based on data collected on BEA’s quarterly, annual, and benchmark direct investment surveys. These surveys are also the main source of the statistics on direct investment income and financial transactions in the ITAs and sta-tistics on direct investment positions in the IIP Accounts. For more information on these surveys, see chapter 3.
32.3. The direct investment by country and industry statistics are generally consistent with the coun-terpart measures featured in the ITAs and the IIP Accounts, but with two important differences in terms of valuation and presentation.47 First, in the ITAs, the featured measures of direct invest-ment financial transactions and income include a current-cost adjustment. The current-cost adjustment is made only on a global basis because appropriate source data are not available at the country or industry level. Therefore, financial transactions and income in the direct investment by country and industry statistics are without current-cost adjustment. (For more information on the current-cost adjustment, see paragraph 13.14.) Similarly, in the IIP Accounts, the featured mea-sure of direct investment position is presented at market value, whereas in the direct investment by country and industry statistics, positions are available only at historical cost (or book value). Positions are presented at historical cost (or book value) because the data underlying the direct investment by country and industry statistics are only available on a historical-cost (book value) basis. For more information on alternative valuations of direct investment positions, see chapter 23. Second, the featured presentation of direct investment statistics on a global basis in both the ITAs and the IIP Accounts is on an asset/liability basis, rather than on a directional basis, which is used in the direct investment by country and industry statistics.48
47. Both the consistency of the direct investment by country and industry statistics with the direct investment portion of the ITAs and the fact that both sets of statistics are drawn from data from the same surveys are reflected by the use of the term “balance of payments data” to represent some of these statistics on the BEA website.
48. Two ITA tables that do not use the featured direct investment measures are ITA tables 1.3 and 1.4, which use measures of income and financial transactions without current-cost adjustment and on a directional basis by area and selected country. As such, the statistics in ITA tables 1.3 and 1.4 are fully consistent with the direct investment by country and industry statistics discussed in this chapter. ITA tables 4.2 and 6.1 present adjustments necessary to convert from asset/liability basis to directional basis at the global level. IIP table 2.1 includes positions at current cost and historical cost and presents adjustments necessary to convert from asset/liability basis to directional basis at the global level.
To Contents
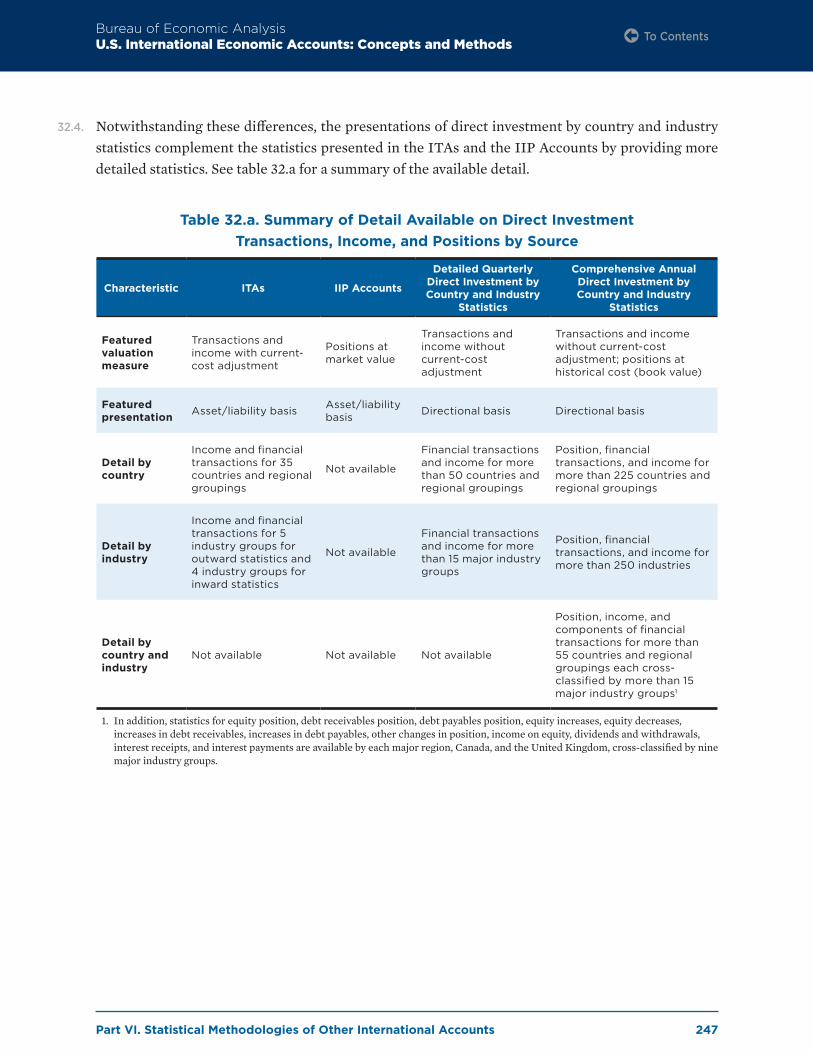
Part VI. Statistical Methodologies of Other International Accounts
Bureau of Economic AnalysisU.S. International Economic Accounts: Concepts and Methods
247
32.4. Notwithstanding these differences, the presentations of direct investment by country and industry statistics complement the statistics presented in the ITAs and the IIP Accounts by providing more detailed statistics. See table 32.a for a summary of the available detail.
Table 32.a. Summary of Detail Available on Direct Investment Transactions, Income, and Positions by Source
Characteristic ITAs IIP Accounts
Detailed Quarterly Direct Investment by Country and Industry
Statistics
Comprehensive Annual Direct Investment by Country and Industry
Statistics
Featured valuation measure
Transactions and income with current-cost adjustment
Positions at market value
Transactions and income without current-cost adjustment
Transactions and income without current-cost adjustment; positions at historical cost (book value)
Featured presentation Asset/liability basis Asset/liability
basis Directional basis Directional basis
Detail by country
Income and financial transactions for 35 countries and regional groupings
Not available
Financial transactions and income for more than 50 countries and regional groupings
Position, financial transactions, and income for more than 225 countries and regional groupings
Detail by industry
Income and financial transactions for 5 industry groups for outward statistics and 4 industry groups for inward statistics
Not available
Financial transactions and income for more than 15 major industry groups
Position, financial transactions, and income for more than 250 industries
Detail by country and industry
Not available Not available Not available
Position, income, and components of financial transactions for more than 55 countries and regional groupings each cross-classified by more than 15 major industry groups1
1. In addition, statistics for equity position, debt receivables position, debt payables position, equity increases, equity decreases, increases in debt receivables, increases in debt payables, other changes in position, income on equity, dividends and withdrawals, interest receipts, and interest payments are available by each major region, Canada, and the United Kingdom, cross-classified by nine major industry groups.
To Contents
Part VI. Statistical Methodologies of Other International Accounts
Bureau of Economic AnalysisU.S. International Economic Accounts: Concepts and Methods
248
32.5. The direct investment by country and industry statistics are presented on a directional basis to better enable analysis of certain aspects of direct investment, such as identifying the foreign coun-tries in which U.S. multinational enterprises (MNEs) invest or the U.S. industries in which foreign MNEs invest. On a directional basis, statistics are categorized as “outward” if they pertain to U.S. direct investment abroad (USDIA) or “inward” if they pertain to foreign direct investment in the United States (FDIUS). For more information on the presentation of direct investment statistics on a directional basis versus an asset/liability basis, see the relevant discussions of primary income in paragraphs 13.7–13.11, financial transactions in paragraphs 16.17–16.21, and positions in paragraphs 23.3–23.4.
32.6. At the country and industry level, in particular, financial transactions and positions are sometimes negative. For transactions, this reflects the fact that direct investment financial transactions are the (net) sum of positive and negative components. Transactions between parent and affiliate in either (or both) equity and debt can be negative if the combined negative components are larger in magnitude than the combined positive components. Figure 32.a illustrates the various positive components—also called “increases” because, in isolation, they increase the parent’s direct invest-ment position in the affiliate—and the various negative components (“decreases”).
32.7. Negative positions can occur because direct investment positions are, in large part, the cumulative sum of prior financial transactions.49 For instance, loans from an affiliate to its parent decrease the parent’s net investment in the affiliate, and losses by an affiliate results in negative reinvestment of earnings. If loans to the parent are large, or if losses are large or sustained, cumulative decreases in the position may more than offset the parent’s other investments in the affiliate, and the position may turn negative.
Quarterly statistics
32.8. The detailed quarterly direct investment by country and industry statistics on financial transac-tions and income are released concurrently with the ITAs. The statistics are presented without sea-sonal adjustment and in current dollar, not real, terms. Statistics on U.S. direct investment abroad and foreign direct investment in the United States include tabulations for more countries and regional groupings than in ITA tables 1.3 and 1.4. In addition, the detailed statistics include greater information on financial transactions and income by industry.
49. Apart from financial transactions, other flows affecting direct investment positions are termed “other changes in position.” These comprise translation adjustments, capital gains or losses of affiliates, and other changes in volume and valuation.
To Contents
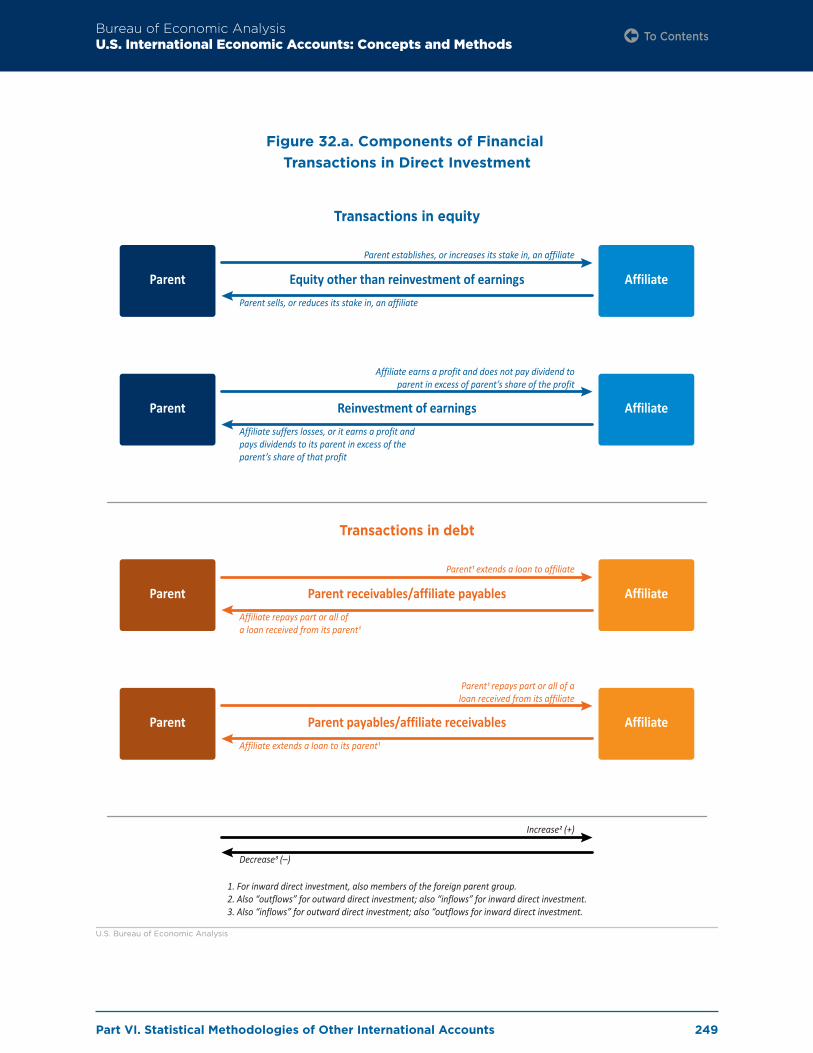
Part VI. Statistical Methodologies of Other International Accounts
Bureau of Economic AnalysisU.S. International Economic Accounts: Concepts and Methods
249
Figure 32.a. Components of Financial Transactions in Direct Investment
Parent Affiliate
Transactions in equity
Equity other than reinvestment of earnings
Parent establishes, or increases its stake in, an affiliate
Parent sells, or reduces its stake in, an affiliate
Parent AffiliateReinvestment of earnings
Affiliate earns a profit and does not pay dividend to parent in excess of parent’s share of the profit
Affiliate suffers losses, or it earns a profit and pays dividends to its parent in excess of the parent’s share of that profit
Parent Affiliate
Transactions in debt
Parent receivables/affiliate payables
Parent� extends a loan to affiliate
Affiliate repays part or all ofa loan received from its parent�
Parent AffiliateParent payables/affiliate receivables
Parent� repays part or all of aloan received from its affiliate
Affiliate extends a loan to its parent�
Increase� (+)
Decrease� (–)
1. For inward direct investment, also members of the foreign parent group.2. Also “outflows” for outward direct investment; also “inflows” for inward direct investment.3. Also “inflows” for outward direct investment; also “outflows for inward direct investment.
U.S. Bureau of Economic Analysis
To Contents

Part VI. Statistical Methodologies of Other International Accounts
Bureau of Economic AnalysisU.S. International Economic Accounts: Concepts and Methods
250
Annual statistics
32.9. The comprehensive annual statistics on direct investment by country and industry are released each July and highlighted in a news release. These detailed statistics are also highlighted in a recurring Survey of Current Business article each August.
32.10. The more comprehensive annual statistics on direct investment by country and industry provide even greater detail than the quarterly statistics, and they include country and industry cross-tab-ulations for positions, equity other than reinvestment of earnings, reinvestment of earnings, debt instruments, and income.
Reconciliation of quarterly, annual, and benchmark surveys of direct investment
32.11. Data from the quarterly direct investment surveys (Quarterly Survey of U.S. Direct Investment Abroad (BE–577) and Quarterly Survey of Foreign Direct Investment in the United States (BE–605)) are regularly reconciled with data collected on BEA’s benchmark and annual surveys of direct investment. Once every 5 years, data from the quarterly surveys are benchmarked to the data col-lected on the benchmark direct investment surveys, which are BEA’s most comprehensive surveys on such investment in terms of both the number of companies covered and the amount of informa-tion gathered. In nonbenchmark years, the quarterly surveys are reconciled to the Annual Survey of U.S. Direct Investment Abroad (BE–11) and to the Annual Survey of Foreign Direct Investment in the United States (BE–15). The annual reconciliation process resolves discrepancies among firms reporting on both quarterly and annual surveys.
32.12. For benchmarking the quarterly surveys, the basic procedures are the same for both U.S. direct investment abroad and for foreign direct investment in the United States. For U.S. direct invest-ment abroad, BE–577 quarterly data on foreign affiliates of U.S. MNEs are benchmarked to data from the Benchmark Survey of U.S. Direct Investment abroad (BE–10). For foreign direct invest-ment in the United States, data on U.S. affiliates from the BE–605 quarterly survey are bench-marked to data from the Benchmark Survey of Foreign Direct Investment in the United States (BE–12). The benchmarking process resolves discrepancies among firms reporting on both quar-terly and benchmark surveys, replaces some data estimated by universe estimation (see paragraphs 3.18–3.21) with information reported on the benchmark survey, and updates the survey frame of affiliates to reflect entries and exits to the direct investment universe that occur between bench-mark years.
Discrepancies
32.13. For affiliates that reported on both the quarterly survey and the benchmark or annual survey, data reported on the two surveys are compared and any significant discrepancies are investigated and resolved. This process typically favors the benchmark or annual survey data, which are generally
To Contents
Part VI. Statistical Methodologies of Other International Accounts
Bureau of Economic AnalysisU.S. International Economic Accounts: Concepts and Methods
251
considered more accurate because they are reported later than the quarterly survey data when companies typically have already prepared their annual financial statements. Additionally, because the benchmark or annual survey data are more comprehensive, they can be more thoroughly cross-checked.
32.14. As part of this reconciliation process, any timing differences between data from the benchmark survey, which are reported on a fiscal year basis, and data from the quarterly surveys, which are compiled on a calendar-year basis, must be resolved.50 The calendar-year basis is used to compile the ITAs and the IIP Accounts and the statistics on direct investment by country and industry.
Replacement of imputed and other estimated data
32.15. For both U.S. direct investment abroad and foreign direct investment in the United States, statistics on the direct investment position and related financial transactions and income flows are derived from data reported quarterly for all affiliates above a size-based exemption level. For affiliates that are not reported in the quarterly surveys because of size or failure to file a report, data items are estimated using data collected from the most recent benchmark survey or from a previous quar-terly survey for those specific affiliates and data for a country by industry sample of affiliates that are reported in surveys of both the previous and the reference quarters.
32.16. This imputation procedure is used for all data items except for intercompany debt investment and equity investment increases and decreases. BEA does not impute intercompany debt flows for nonrespondents because they can be infrequent, can switch from inflows to outflows, and can vary considerably in size from quarter-to-quarter and thus, do not provide a good basis for imputation. The equity increases and decreases of nonreporting affiliates are estimated at the global level by using a ratio of reference-quarter reported increases and decreases to the preceding-quarter equity position of all affiliates that reported in the reference quarter. This ratio is multiplied by the equity position in the preceding quarter for affiliates that did not report in the reference quarter. The result is added to the reference quarter’s reported flows to derive total equity increases and decreases. This method is based on the assumption that the relationship between equity transac-tions and equity position is the same for nonreporting affiliates as it is for reporting affiliates. The estimated equity increases and decreases are then allocated to countries and industries based on their relative size in terms of equity position.
32.17. During the benchmarking process, data from the benchmark survey replace the quarterly imputa-tions or other estimates for affiliates that reported on the benchmark survey but did not report on the quarterly surveys. Because the benchmark survey data are annual, not quarterly, data from the benchmark survey are distributed across quarters, where appropriate, in the quarterly statistics.
50. On the quarterly surveys, affiliates report each quarter for their fiscal quarter that ends closest the calendar quarter. BEA sums the four quarters that most closely correspond to the calendar year to compile statistics on a calendar-year basis. For the majority of affiliates, the fiscal year ends on December 31, so no reconciliation for timing differences is needed.
To Contents
Part VI. Statistical Methodologies of Other International Accounts
Bureau of Economic AnalysisU.S. International Economic Accounts: Concepts and Methods
252
Updates to the survey frame
32.18. Estimates are removed from the quarterly statistics for affiliates that the benchmark survey indicates have either left the direct investment universe or have been consolidated with another affiliate since the prior benchmark survey, and whose exit or consolidation has not already been captured by BEA’s quarterly and annual surveys.
32.19. Benchmark surveys also enable updates to the survey frame because of new reporting by firms not previously known to BEA to be a part of the direct investment universe. Improvements to the survey frame can be especially large in benchmark years for two main reasons. First, reporting on the benchmark is required of all firms that meet the reporting requirements of the survey, whether or not they are contacted by BEA (in contrast to the annual and quarterly surveys, which are only required for those contacted by BEA). Second, BEA undertakes concerted efforts in benchmark years to ensure complete coverage, including additional outreach to potential respondents, sharing of survey frame information by other government agencies, and mining of commercial datasets.
To Contents

Part VI. Statistical Methodologies of Other International Accounts
Bureau of Economic AnalysisU.S. International Economic Accounts: Concepts and Methods
253
Chapter 33. New Foreign Direct Investment in the United States
Concepts and Coverage
33.1. Statistics produced by the Bureau of Economic Analysis (BEA) on new foreign direct investment in the United States provide information on the acquisition, establishment, and expansion of U.S. business enterprises by foreign direct investors.
33.2. A U.S. business enterprise is considered to be acquired if a foreign entity acquires 10 percent or more of the voting securities of the U.S. business enterprise if it is legally incorporated, or an equiv-alent interest if it is unincorporated, either directly or indirectly through an existing U.S. affiliate. A U.S. business enterprise is considered to be established if a foreign entity, or an existing U.S. affiliate of a foreign entity, establishes a new legal entity in the United States in which the foreign entity owns 10 percent or more of the new business enterprise’s voting securities if incorporated, or an equivalent interest if it is unincorporated. A U.S. business enterprise is considered to be expanded if an existing U.S. affiliate of a foreign parent expands its operations to include a new facility where business is conducted.
33.3. The statistics on new foreign direct investment complement other statistics on foreign direct investment in the United States (FDIUS) and allow for a deeper analysis beyond that provided by the statistics on FDIUS transactions and positions and by the statistics on the activities of U.S. affil-iates of foreign multinational enterprises. Figure A.1 in appendix A shows the connections between these “new investment” statistics and the various other U.S. International Economic Accounts.
33.4. Measures of expenditures for new investments in the new FDIUS statistics partly overlap FDIUS financial transactions in the direct investment by country and industry statistics. The new invest-ment statistics include the total cost of the new investment, regardless of whether the funds were obtained from domestic or foreign sources. In the financial transactions statistics, only funds obtained from the foreign parent group are included. Financial transactions statistics measure net direct investment transactions between foreign direct investors and U.S. entities and include new investment costs paid by foreign entities. However, these statistics also include transactions not related to new investments, such as full or partial selloffs of equity, purchases of additional equity in existing U.S. affiliates, reinvestment of earnings, and intercompany lending transactions related to ongoing operations; see figure 33.a. The new investment statistics also provide information on the finances and operations of the newly acquired, established, or expanded U.S. businesses. These activities statistics cover many of the same items covered in the statistics on the activities of multi-national enterprises (AMNE) that are published annually for all U.S. affiliates.
To Contents

Part VI. Statistical Methodologies of Other International Accounts
Bureau of Economic AnalysisU.S. International Economic Accounts: Concepts and Methods
254
33.5. BEA’s statistics on new foreign direct investment include the following:
• Expenditures by foreign direct investors to acquire, establish, or expand
U.S. business enterprises.
• Balance sheet and income statement items of the newly acquired, established, or
expanded U.S. business enterprises.
• Employment of the newly acquired, established, or expanded U.S. business enterprises.
33.6. Expenditures are categorized as first-year expenditures and planned total expenditures. First-year expenditures include expenditures in the year in which the acquisition, establishment, or expan-sion occurred. Planned total expenditures include first-year expenditures for all investments plus planned future expenditures (and expenditures from past years, if any) for establishments and expansions that are multiyear investments. Planned total expenditures for newly established or expanded U.S. affiliates are broken out by the year in which the expenditures are expected to be incurred and by the class of expenditure, including expenditures for land, plant and equipment, intellectual property rights, and fees, taxes, permits, and licenses. Statistics are also compiled for actual expenditures on investments initiated in previous years and compared with the planned expenditures announced in those years.
Figure 33.a. Comparison of the Statistics onNew Investment and the Financial Transactions Statistics
Transactionsbetween foreign
direct investors andU.S. affiliatesthat are notrelated to
new investments
New investmenttransactions funded
by U.S. affiliatesof foreign
direct investorsor using funds
sourced bythe U.S. affiliate
New investmenttransactionsfunded by
foreign directinvestors
New foreigndirect investment in
the United States
Foreign directinvestment financial
transactions
U.S. Bureau of Economic Analysis
To Contents
Part VI. Statistical Methodologies of Other International Accounts
Bureau of Economic AnalysisU.S. International Economic Accounts: Concepts and Methods
255
33.7. Balance sheet items include total assets, total liabilities, and total owner’s equity of the newly acquired or established U.S. affiliate. Income statement items include sales of the newly acquired, established, or expanded U.S. affiliate and net income of the newly acquired or established U.S. affiliate.
33.8. Employment includes all full-time and part-time employees on the payroll and excludes contract workers and other workers not carried on the payroll of the U.S. business enterprise. Employment is further categorized as current employment and planned employment. Current employment includes the employment of the newly acquired, established, or expanded U.S. affiliate at the time of the acquisition, establishment, or expansion. Planned employment includes the current employ-ment for acquisitions and the projected number of employees for establishments or expansions once they are fully operational.
33.9. The statistics for each year cover the universe of transactions in which a foreign investor acquires a direct investment interest in a U.S. business, establishes a U.S. business enterprise in which it has a direct investment interest, or expands a U.S. business enterprise in which it already has a direct investment interest.
33.10. The statistics on new investments allow for separate identification of greenfield investment. Greenfield investment includes establishments of new U.S. business enterprises by foreign inves-tors and expansions of existing U.S. affiliates.
33.11. Statistics on greenfield investments also compare planned expenditures that were reported when the investment was initiated with actual expenditures that are realized in subsequent years. These statistics can help answer questions about whether greenfield projects are completed and whether there are significant differences between planned and actual costs.
Data sources
33.12. BEA’s statistics on new foreign direct investment are based on data collected on BEA’s mandatory Survey of New Foreign Direct Investment in the United States (BE-13). The survey is filed by U.S. business enterprises when (1) they are first acquired or established by a foreign direct investor or (2) when a foreign-owned U.S. business enterprise is expanded. U.S. businesses that are established or expanded and that expect to have new investment expenditures for several years provide cost updates each year until the project is completed.
To Contents
Part VI. Statistical Methodologies of Other International Accounts
Bureau of Economic AnalysisU.S. International Economic Accounts: Concepts and Methods
256
Estimation methods
33.13. BEA uses an abbreviated form to collect data on expenditures for new investments below a size-ex-emption level. BEA prepares estimates to account for data items not collected on abbreviated forms and combines them with data collected on full reports. Businesses that file abbreviated forms gen-erally have a negligible impact on the published aggregates.
Classification
Classification by country
33.14. The statistics on new foreign direct investment in the United States are primarily classified by country of ultimate beneficial owner, but BEA also presents expenditures by country of foreign parent.
Classification by industry
33.15. The statistics on new investments are classified by the primary industry of the affiliate, which is based on the industry distribution of the affiliate’s sales. As a result, any affiliate activities that take place in secondary industries are classified as activities in the primary industry.
Classification by U.S. state
33.16. The statistics on new investments are classified by U.S. state. This classification indicates the U.S. state in which the newly acquired, established, or expanded U.S. affiliate is located. If the newly acquired or established U.S. affiliate operates in more than one state, then the state where the greatest number of the employees are based is used. This is frequently, but not always, the state in which the U.S. affiliate’s headquarters is located. If there are no employees, then the state of incor-poration is used.
To Contents

Part VII. Special Topics
Bureau of Economic AnalysisU.S. International Economic Accounts: Concepts and Methods
257
Part VII. Special Topics
Chapter 34. Modes of Supply for International Services
34.1. A key initiative of the international community in response to the rapid expansion of international trade and investment was the creation in 1995 of the World Trade Organization (WTO) following the Uruguay Round of multilateral trade negotiations. The WTO provides a common framework for the conduct of trade relations among its members. Its main functions are facilitating the imple-mentation, administration, and operation of the multilateral trade agreements; providing a forum for further negotiations; reviewing national trade policies; and securing solutions to trade disputes.
34.2. The three principal WTO agreements are the General Agreement on Tariffs and Trade of 1994 (GATT), the General Agreement on Trade in Services (GATS), and the Agreement on Trade-Related Aspects of Intellectual Property Rights (TRIPS). GATS constitutes the first set of legally enforceable disciplines and rules at the multilateral level established to cover international trade in services. GATS defines the “supply of a service” to include the production, distribution, marketing, sale, and delivery of that service.
34.3. GATS defines international trade in services in terms of four modes of supply. The definition of services trade under GATS depends on the territorial presence and residence of the supplier and the consumer at the time of the transaction. The four modes include (1) cross-border supply, (2) consumption abroad, (3) commercial presence, and (4) presence of natural persons. This definition is broader than the balance of payments (BOP) concept of services trade, which is concerned only with transactions between residents of a given country and nonresidents generally corresponding to modes 1, 2, and 4.
34.4. Technological advances and reductions in costs for information and communications technology (ICT) over time have led to a greater opportunity for the remote provision and procurement of ser-vices through the channel of cross-border transactions. Nonetheless, the supply of many services
To Contents

Part VII. Special Topics
Bureau of Economic AnalysisU.S. International Economic Accounts: Concepts and Methods
258
is possible only through the simultaneous physical presence of both producer and consumer. As a result, trade is often facilitated by movements of the consumer, the establishment of a commercial presence within a market, or the temporary movement of the individual service provider.
34.5. The four GATS modes of supply are defined as follows:
34.6. Cross-border supply (mode 1). Mode 1 covers services flows from the territory of one country into the territory of another country (such as banking or architectural services transmitted via telecom-munications or mail).
34.7. Consumption abroad (mode 2). Mode 2 refers to situations where a service consumer (such as tourist or patient) moves into another country’s territory to obtain a service.
34.8. Commercial presence (mode 3). Mode 3 occurs when a service supplier of one country establishes a territorial presence, including through ownership or lease of premises, in another country’s ter-ritory to provide a service (such as domestic subsidiaries of foreign insurance companies or hotel chains).
34.9. Presence of natural persons (mode 4). Mode 4 refers to persons of one country entering the territory of another country to supply a service (such as accountants, doctors, or teachers). This mode includes self-employed persons and employees on temporary assignment (intra-corporate transferees). The terminology “natural persons” is used to differentiate between individuals and the generic use of “persons,” which covers individuals, branches, partnerships, associated groups, associations, estates, trusts, government agencies, and others.
34.10. Some of the published service categories in the International Transactions Accounts (ITAs) from the Bureau of Economic Analysis (BEA) are generally supplied via a single mode of supply. For example, telecommunications services generally correspond to cross-border supply (mode 1) and most travel services involve consumption abroad (mode 2). In addition, services supplied through affiliates to the host country, which are recorded in BEA’s statistics on the activities of multina-tional enterprises (AMNE), generally correspond with commercial presence (mode 3) regardless of the type of service provided.
34.11. However, statistics for many trade in services categories may include services delivered via multiple modes of supply. Most of the published ITA service categories correspond at least in part to cross-border supply (mode 1) but may also include services provided via the presence of natural persons (mode 4). For example, statistics for trade in research and development services may include both services provided via mode 1 and mode 4. In addition, a few types of ITA trade in services transactions can also involve an element of mode 3 through a nonresident commercial presence such as through a site office on a construction site that does not qualify as an affiliate. Such transactions would be reflected in statistics from the BEA on trade in services and not in the AMNE statistics.
To Contents

Part VII. Special Topics
Bureau of Economic AnalysisU.S. International Economic Accounts: Concepts and Methods
259
Services delivered via multiple modes of supply: the case of data recovery services
34.12. The example of provision of data recovery services to foreign markets by U.S. residents and foreign affiliates demonstrates how the same service may be delivered via each of the different modes of supply and how the mode of delivery determines how the transaction is recorded in BEA’s statis-tics. Data recovery services provide a means to retrieve data from electronic storage media when the data cannot be accessed in a normal way because of damage to electronic devices, operating system failures, or other malfunctions. The following paragraphs describe how this service is sup-plied via each of the four modes, and figure 34.a illustrates these modes for the cases of services supplied by the United States to the United Kingdom.
Uni
ted
Stat
es
UnitedKingdom
Figure 34.a. How Data Recovery Services are Supplied by the United States to the United Kingdom
Trade inservices:U.S. exports
Services supplied throughforeign affiliatesof U.S. multinationalenterprises (MNEs)
Mode 1, cross-border supply: A U.S. supplier provides services to a foreign customer remotely
Example: A U.S. data recovery firm provides services to the United Kingdom over the internet
Mode 2, consumption abroad: A foreign customer travels to a U.S. supplier
Example: A resident of the United Kingdom purchases data recovery services from a
U.S. firm while traveling in the U.S.
Mode 4, presence of natural persons: A U.S. supplier travels to a foreign customer
Example: A computer specialist resident in the U.S. travels to the United Kingdom
to provide data recovery services
Mode 3, commercial presence:A U.S. MNE owns a foreign affiliate
Example: A U.S. MNE owns a computer systems design affiliate in the United Kingdom that provides data recovery
services to customers in the United Kingdom
U.S. Bureau of Economic Analysis
To Contents

Part VII. Special Topics
Bureau of Economic AnalysisU.S. International Economic Accounts: Concepts and Methods
260
34.13. Sales by a U.S. business enterprise remotely, such as via ICT networks, to a nonresident who remains in their home country would be classified as mode 1, cross-border supply, and would be recorded in the ITAs as an export of computer services.
34.14. The provision of data recovery services to foreign residents visiting the United States would be classified as mode 2, consumption abroad, and would be recorded in the ITAs as an export of travel services. For example, if while visiting the United States a foreign visitor procures data recovery services for data stored on a damaged laptop, the transaction would be included in travel.
34.15. Sales of data recovery services to foreign residents through the foreign affiliates of U.S. multina-tional enterprises (MNEs) would be classified as mode 3, reflecting the commercial presence of the affiliate abroad. BEA’s AMNE statistics for services supplied through affiliates are classified by the primary industry of the affiliate rather than by type of service. The industry associated with data recovery services is computer systems design and related services.
34.16. Data recovery by employees of U.S. business enterprises and certain self-employed persons who travel to their nonresident customer’s location to provide the service would be classified as mode 4, presence of natural persons. These exports would be classified in the ITAs as computer services.
Estimates of modes of supply for international services
34.17. International statistical guidelines for services recommend publishing estimates of services by mode of supply and by partner country. Chapter V of the Manual on Statistics of International Trade in Services (MSITS) 2010 provides a framework for compiling services statistics by mode of supply based on published ITA and AMNE services statistics. Using these statistics, BEA has developed exploratory estimates for 2016 of international services classified by mode of supply.51 These esti-mates cross-classify international services by mode of supply and service type but not by partner country.
34.18. The exploratory estimates of modes of supply for international services make use of questions on BEA’s 2017 Benchmark Survey of Transactions in Selected Services and Intellectual Property with Foreign Persons (BE-120) for a subset of service types about the share of services performed remotely by the supplier of the service. For that subset, the reported share of services performed remotely was imputed to mode 1 (cross-border supply). The residual share was imputed to modes 2 (consumption abroad) or 4 (presence of natural persons), depending on the service type using guidance from MSITS and informed judgment. Most of the ITA services types not covered by the questions on the share of services performed remotely were imputed to modes 1, 2, or 4 based on MSITS guidance and informed judgment. One exception was construction services, which was divided between mode 3 (commercial presence) and mode 4. In certain cases, such as travel
51. See Michael A. Mann, “Measuring Trade in Services by Mode of Supply,” Bureau of Economic Analysis working paper WP2019-7 (Washington, DC: BEA, August 2019).
To Contents

Part VII. Special Topics
Bureau of Economic AnalysisU.S. International Economic Accounts: Concepts and Methods
261
services, BEA’s trade in services statistics indistinguishably include goods sold with the services. An adjustment was made to remove these goods from travel services. An adjustment was also made to include the distribution services associated with wholesale trade activities that are included in GATS trade in services but not in BOP trade in services; these services were included in mode 1.
34.19. Services supplied through majority-owned affiliates were mostly imputed to mode 3. For services supplied by U.S. MNEs through foreign affiliates, only services supplied to foreign persons in the host country were included; services supplied to other foreign persons, which are covered by the services supplied through affiliates featured in BEA’s international services statistics, are beyond the scope of the GATS definition of mode 3. In certain cases, such as construction, BEA’s AMNE statistics classify as goods supplied some products included in GATS trade in services. An adjust-ment was made to include these goods supplied by affiliates in construction in the estimates of modes of supply for international services. BEA’s AMNE statistics do not provide information on the specific service activity covered in services supplied through affiliates, so services from these statistics were assigned to service types based on BEA’s International Surveys Industry code, which identifies the primary industry of sales for affiliates.
34.20. The BEA benchmark survey of financial services (BE-180) now includes questions on the share of services performed remotely. These shares, along with information from other sources, will be used to continue refining estimates of modes of supply for international services.
To Contents

Part VII. Special Topics
Bureau of Economic AnalysisU.S. International Economic Accounts: Concepts and Methods
262
Chapter 35. Bilateral Statistics
35.1. One of the most important classifications of statistics from the U.S. International Economic Accounts are partner country or geographic classifications, which provide the basis for compiling bilateral statistics. U.S. bilateral statistics provide important measures of trade and investment between the United States and other countries and world regions. Bilateral statistics provide crit-ical information for understanding economic relationships among countries, developing trade and investment policy, managing exchange rates, and aiding business and government decisionmaking. Bilateral statistics are also a useful tool for improving international economic statistics by facilitat-ing cooperation among statistical agencies through bilateral reconciliation exercises.
35.2. The Bureau of Economic Analysis (BEA) provides several levels of geographic detail for its bilateral statistics. Major published components from the International Transactions Accounts (ITAs) are provided in ITA tables 1.3 and 1.4 for 35 areas that reflect a combination of individual countries and regional groupings.52 Greater partner country detail for trade in goods, for services trade, and for direct investment income, transactions, and positions at historical cost (book value) is available in more detailed ITA tables and in other tables published by BEA. Statistics on the activities of mul-tinational enterprises (AMNE) are classified by country at a level of detail similar to that for direct investment by country and industry. BEA’s International Investment Position (IIP) Accounts do not provide partner country detail.
35.3. While international guidelines do not provide specific recommendations for partner country detail, compiling countries are encouraged to provide detail relevant to their economies. When new coun-tries emerge or when countries cease to exist, BEA makes changes to the individual country detail and related regional groupings. These changes are made consistently for all of the major compo-nents, and statistics are provided for earlier periods when sufficient source data are available.
35.4. The basic principle for determining the partner country in the ITAs and the IIP Accounts is the location of the residence of the counterparty to the transaction or financial position. The same principles for determining residence discussed in chapter 6 apply, but they are often more difficult to implement because location information is not necessarily known by the resident counterparty. Most of the key data sources used by BEA, however, include information needed to determine the counterparty country. For example, merchandise trade statistics from the U.S. Census Bureau, source data from the Treasury International Capital (TIC) reporting system, and BEA’s direct investment and services surveys all include partner country information.
52. For more information on the countries and regional groupings for which selected ITA statistics are available quarterly, see the interactive tables on the BEA website.
To Contents

Part VII. Special Topics
Bureau of Economic AnalysisU.S. International Economic Accounts: Concepts and Methods
263
35.5. For inward AMNE statistics, country classification is based on the residence of the ultimate owner of the U.S. affiliate rather the direct counterparty. For outward AMNE statistics, BEA attributes the activities of each foreign affiliate to the country of residence of that affiliate.
35.6. Following the general principle of change of ownership that underlies the recording of interna-tional transactions, the partner country classification of goods is based on the country of the new owner for exports and the country of the former owner for imports. While BEA has attempted to follow the International Monetary Fund Balance of Payments and International Investment Position Manual, Sixth Edition (BPM6) change of ownership principle, it has not been able to implement the recommended treatment of goods-for-processing because of source data limitations. As a result, some goods with no ownership change are treated as though their ownership did change because of their inclusion in the Census-basis merchandise trade statistics. For services transactions, the geographic classification is based on the residence of the service purchaser for exports and the service provider for imports. For primary income receipts, the geographic classification is based on the debtor country that pays income on its liabilities to U.S. residents, and for investment income payments, the creditor country that receives income on its U.S. assets. For secondary income (cur-rent transfers), country classifications are based on the residence of the donor and the recipient.
35.7. The country attribution of financial-account transactions is based on the country of residence of the foreign creditor for the net incurrence of liabilities and the country of residence of the foreign debtor for the net acquisition of foreign assets. In practice, identification of the counterparty country for securities positions, income, and transactions is not always straightforward for various reasons, including that (1) the issuer is not always aware of current holders of securities, (2) trans-actors in securities markets may not be aware of the identity of the counterparty, and (3) security holders may be unaware that income on securities positions may be payable by a financial inter-mediary that created a “short” or reverse position in the security rather than by the issuer of the security.
35.8. In the TIC reporting system, data are generally classified by the foreign country or geographical area in which the foreign transactor or intermediary is located, as shown in the records of the U.S. reporting institution. The geographic distribution of the reported data may not necessarily reflect the nationality of the ultimate foreign owner of U.S. securities or the country of issue of foreign securities. Thus, securities transactions between U.S. and foreign residents effected in countries that are international financial centers—such as the United Kingdom, the Channel Islands, the Cayman Islands, the Bahamas, the Netherlands, and Hong Kong—are recorded for those countries, regardless of the country of issue of the foreign security or of the nationality of the ultimate foreign owners of U.S. securities.
To Contents

Part VII. Special Topics
Bureau of Economic AnalysisU.S. International Economic Accounts: Concepts and Methods
264
35.9. BEA provides additional geographic detail in addition to the standard 35 countries and areas for merchandise trade transactions, for services trade transactions, for direct investment transactions, positions, and income, and for AMNE statistics, because the requisite detail is available in the source data for these components. These sources include the merchandise trade statistics compiled by the Census Bureau and the direct investment and services surveys conducted by BEA. Each of the components with expanded geographic detail is further described below.
Merchandise trade
35.10. Additional partner country detail is available in the merchandise trade statistics published by the Census Bureau and provided by BEA in the detailed ITA table on U.S. trade in goods (ITA table 2.3).53 As described above, the geographic attribution of merchandise trade exports is the country where the goods are to be consumed, further processed, or manufactured, as known to the ship-per at the time of exportation. If the shipper does not know the country of ultimate destination, the shipment is credited to the last country the shipper knows that the goods will be in the same form as when exported. The geographic attribution of merchandise trade imports is the country of origin. When goods are produced in several countries and shipped through one or more countries before final shipment to the United States, the country of attribution may, in practice, be the last country of shipment.
35.11. The country of destination for goods may frequently differ from the county of payment for the goods. For example, when a foreign resident purchases an aircraft in the United States but leases it to an airline in another country, the country of destination shown on the export declaration may be that of the lessee, not that of the lessor (the owner of the equipment). In this case, the goods accounts include the commodity flow by the country of destination, and the financial accounts record the financial flow by the country of payment. In line with the change of ownership prin-ciple, the residence of the seller or purchaser of the good is the preferred concept. In practice, available data may be based on the economy of origin, consignment, destination, or other criteria that may differ from the economy of the seller or purchaser. This is especially likely in cases of merchanting and goods processed on a fee basis.
53. ITA table 2.3, like ITA tables 1.3 and 1.4, provides bilateral statistics that are not seasonally adjusted. ITA table 2.2 provides seasonally adjusted bilateral trade in goods statistics for a much smaller group of countries. The monthly goods and services statistics also include some limited bilateral detail for trade in goods at monthly frequencies—see chapter 30 for more information on these statistics.
To Contents
Part VII. Special Topics
Bureau of Economic AnalysisU.S. International Economic Accounts: Concepts and Methods
265
Services trade
35.12. Partner country detail for services trade is available in the detailed ITA table on U.S. trade in ser-vices (ITA table 3.3).54 In addition, more detailed partner country detail for services trade at annual frequencies is provided in the international services statistics—see chapter 31 for more information.
Direct investment and AMNE statistics
35.13. According to international guidelines, direct investment transactions and positions by country should be reported according to the immediate host or investing economy, based on the direct relationships between the parties, rather than according to the ultimate owner or host countries. Supplementary data on direct investment positions may be prepared according to ultimate owner and host economy (destination). Such data are useful when direct investment is channeled through intermediate entities, such as holding companies or other special purpose entities.
35.14. BEA provides statistics on bilateral direct investment transactions and positions in the statistics on direct investment by country and industry (see chapter 32). In addition, for a subset of these countries, ITA tables on bilateral transactions (ITA tables 1.3 and 1.4) include statistics on direct investment transactions. BEA’s bilateral direct investment statistics include supplemental statistics by ultimate owner but not by ultimate host country.
35.15. For BEA’s inward AMNE statistics, the primary classification is by the country of the ultimate owner, with some tabulations by the immediate investing country (that is, by the country of the foreign parent). For outward AMNE statistics, BEA attributes the activities of each foreign affiliate to the country of residence of that affiliate.
35.16. For U.S. direct investment abroad in both the direct investment and AMNE statistics, each foreign affiliate is classified by its country of location—that is, the country in which the affiliate’s physical assets are located or in which its primary activity is carried out. In most cases, the country of loca-tion of a business enterprise is the same as its country of organization or incorporation. In some cases, though, a business enterprise is incorporated in one country, but part or all of its physical assets are located, or its activities are carried out, in a second country. If all its physical assets or operations are located in a single foreign country outside its country of incorporation, the enter-prise is treated as an incorporated foreign affiliate in the country where its physical assets and operations are located. However, if an enterprise has some physical assets or operations in each country, it is considered two affiliates—an incorporated affiliate located in the country of incorpo-ration and an unincorporated affiliate located in the other country.
54. ITA table 3.3, like ITA tables 1.3 and 1.4, provides bilateral statistics that are not seasonally adjusted. ITA table 3.2 provides seasonally adjusted bilateral trade in services statistics for a much smaller group of countries. The monthly services and services statistics also include some limited bilateral detail for trade in services at monthly frequencies—see chapter 30 for more information on these statistics.
To Contents

Part VII. Special Topics
Bureau of Economic AnalysisU.S. International Economic Accounts: Concepts and Methods
266
35.17. International transactions and positions between U.S. parents and foreign affiliates are classified in the country of the affiliate with which the U.S. parent has a direct transaction or position, even if the transaction or position may reflect indirect claims on, liabilities to, or income from indirectly held affiliates in third countries. For example, if a U.S. parent company acquires all of the equity in a German manufacturer for $100 million and channels the purchase through its holding company affiliate in the Netherlands, then both the direct investment financial transaction and the direct investment position would be classified in the Netherlands, because that is the country of the affiliate with which the U.S. parent had a direct transaction. By contrast, AMNE statistics—such as employment and research and development expenditures—of the newly acquired affiliate would be classified in Germany because that is where the operations are located.
35.18. For foreign direct investment in the United States, both the foreign parent and ultimate beneficial owner (UBO) of a U.S. affiliate are each classified by country of incorporation. For most U.S. affil-iates, the country of the UBO is the same as the country of the foreign parent. However, for some UBO countries, the country of foreign parent of most affiliates differs from that of their UBO. For these countries, much of the foreign direct investment in the United States is conducted through intermediaries located in other countries. By comparing BEA’s foreign parent-based statistics with its UBO-based statistics, data users can analyze corporate structures and identify both (1) countries that often invest in the United States through intermediaries and (2) countries that are often used as intermediaries to invest in the United States.
35.19. Classification by country of UBO typically is used for AMNE statistics because the country that ultimately owns or controls a U.S. affiliate and therefore derives benefits from owning or con-trolling the affiliate is generally considered most important for analyzing these data. In supple-mental tables in the direct investment by country and industry statistics, income and positions are also classified by country of UBO. In contrast, statistics in the ITAs and in the primary presentation of foreign direct investment in the United States in the direct investment by country and industry statistics are classified by the country of each member of the foreign parent group with which there are direct transactions or positions.
35.20. Some U.S. affiliates have more than one foreign parent, more than one foreign parent group, and more than one UBO. In the AMNE statistics, an affiliate’s data is classified by the country of the UBO or foreign parent with the largest ownership share in the affiliate. In the direct investment statistics in the ITAs and the primary direct investment by country and industry statistics, an affil-iate’s data is classified by country according to its transactions and positions with each member of each foreign parent group. In supplemental tables, its income and positions are classified by coun-try of the UBO associated with that income and those positions.
To Contents
Part VII. Special Topics
Bureau of Economic AnalysisU.S. International Economic Accounts: Concepts and Methods
267
International Trade and Investment Country Facts
35.21. BEA provides an application—International Trade and Investment Country Facts—on its website that presents annual U.S. bilateral statistics with all countries for which International Economic Account statistics are produced. Data users select a country and are provided an overview page, or “factsheet,” with a time series of selected annual statistics from across the International Economic Accounts with that country. If statistics are available for an individual country, the overview page includes overall trade in goods and services, a list of the top goods and services categories, outward and inward direct investment positions, and sales and employment of majority-owned affiliates of U.S. multinational enterprises (MNEs) in that country and majority-owned U.S. affiliates of MNEs from that country. Fewer statistics may be available for smaller countries.
35.22. Statistics with more detail on trade, direct investment, AMNE, and new foreign direct invest-ment in the United States are also available. This application allows users interested in bilateral economic relationships between the United States and partner countries to quickly assemble key statistics on the extent of each relationship across several dimensions, and to assess trends in each dimension.
To Contents

Part VIII. Supplemental Information
Bureau of Economic AnalysisU.S. International Economic Accounts: Concepts and Methods
268
Part VIII. Supplemental Information
Appendix A. U.S. International Economic Accounts: Internal and External Relationships
Figure A.1. Statistics in Common Among the U.S. International Economic Accounts
InternationalInvestment
Position (IIP)Accounts
Activities ofmultinational
enterprises (AMNE)
InternationalTransactions
Accounts (ITAs)
Direct investmentby country and
industry
New foreigndirect
investment
Internationalservices
Monthly goodsand services
Statistics onservices suppliedthrough affiliates
Statistics onservices trade
Statistics ongoods trade
Statistics onfinancial transactions
Direct investment income and financial transactions on a directional basis without current-cost adjustment
Direct investment positions on adirectional basis at historical costs
New investment expenditurespartially overlap with direct
investment financial transactions
New investment statistics cover a subsetof the AMNE universe
U.S. Bureau of Economic Analysis
To Contents

Part VIII. Supplemental Information
Bureau of Economic AnalysisU.S. International Economic Accounts: Concepts and Methods
269
International investment position
Activities of multinational enterprises (MNEs)
International transactions
Direct investment by country and industry
BEAdirect
investmentsurveys
BEAservicessurveys
Departmentof the
Treasury
CensusBureau
FederalReserveBoard
BEA NationalIncome and
ProductAccounts
BEA IndustryEconomicAccounts
New foreign direct investment
International services
Monthly goods and services
Major Data Sources Accounts Major Uses
Figure A.2. Major Data Sources of, and Other Statistics that Depend on, the U.S. International Economic Accounts
• U.S. MNEs and their foreign affiliates • U.S. affiliates of foreign MNEs
• Services supplied through affiliates• Trade in services• Trade in information and communications
technology (ICT) and potentially ICT-enabled services
• Trade in financial services
• Direct investment
• Direct investment• Portfolio and other investment and
financial derivatives
• Direct investment income and financial transactions
• Trade in services• Income and financial transactions in
portfolio investment and other investment• Financial transactions in financial derivatives• Trade in financial services• Trade in goods
• Trade in services• Trade in financial services• Trade in goods
• New foreign direct investment in the United States through establishments, acquisitions, and expansions
Annual and benchmark surveys
Quarterly, annual,and benchmarksurveys
Monthly, quarterly,and annual surveys from the Treasury International Capital System
Export and importdata from theAutomated Commercial Environment
Quarterly, annual, and benchmarksurveys
Annual newinvestment survey
Basis for rest-of-world flows in Financial Accounts of the United States
Data source for input-output tables and GDP by industry
Net exports used in expenditure calculation of gross domestic product (GDP)
Rest-of-world income used in calculation of gross national product
International Transactions Accounts balances align with net lending/net borrowing and the difference between gross savings and gross domestic investment
U.S. Bureau of Economic Analysis
To Contents

Part VIII. Supplemental Information
Bureau of Economic AnalysisU.S. International Economic Accounts: Concepts and Methods
270
Appendix B. The Treasury International Capital Reporting System Prior to December 2013
B.1. Significant changes have been made to the Treasury International Capital (TIC) reporting system over the years in response to innovation in financial activity and changes to international guide-lines for preparing statistics for International Economic Accounts. This appendix describes several such changes because of the key role played by TIC source data the preparation statistics by the Bureau of Economic Analysis for earlier periods.
Other investment and short-term debt securities
B.2. Changes to the TIC B forms in February 2003 and in December 2013 increased the coverage of claims and liabilities of U.S.-resident financial enterprises with respect to their financial affiliates. These changes are noteworthy because they affect the way BEA compiles other investment statis-tics for loans and deposits. The current coverage of most U.S.-resident financial enterprises with respect to their financial affiliates on the B forms that began in December 2013 is described above.
B.3. Prior to December 2013 and beginning in February 2003, U.S. banks, bank and financial holding companies, and securities brokers and dealers reported vis-à-vis affiliates on the B forms, and all other companies, including some important financial enterprises such as investment banks and insurance companies, reported only vis-à-vis unaffiliated foreign residents on the TIC C forms.
B.4. Prior to February 2003, only U.S. banks and bank and financial holding companies reported vis-à-vis affiliates on the B forms. U.S. securities brokers and dealers reported only vis-à-vis unaffiliated foreign residents on the B forms while all other financial and nonfinancial enterprises reported only vis-à-vis unaffiliated foreign residents on the C forms.
Financial derivatives
B.5. Until the introduction of the TIC D form in March 2005, the United States did not have a com-prehensive survey dedicated to the measurement of financial derivatives transactions and positions for the International Transactions Accounts (ITAs) and the International Investment Position (IIP) Accounts. Derivatives were included as a separate component in the ITAs and the IIP Accounts for positions beginning in December 2005 and for transactions beginning in the first quarter of 2006. Prior to the introduction of statistics from the D form, BEA included transactions in exchange-traded derivatives based on data obtained from exchanges, and some derivatives were reported on BEA’s direct investment surveys.
To Contents
Part VIII. Supplemental Information
Bureau of Economic AnalysisU.S. International Economic Accounts: Concepts and Methods
271
Equity and long-term debt securities
B.6. The introduction of the TIC SLT form in 2011 was the most recent change to the group of surveys that BEA uses to measure international transactions in equity and long-term debt securities. This survey was a significant addition to the TIC system because it allows estimates of transactions from position data as an alternative to measuring transactions directly from monthly purchases and sales reported on the S forms. These S form data often were not consistent with annual position estimates.
B.7. Prior to the introduction of the SLT, the annual and benchmark surveys were introduced in their current formats, covering equity and short- and long-term debt securities, with the SHC(A) intro-duced in December 2001 and the SHL(A) introduced in June 2002. The annual surveys provided more frequent checks on position estimates and on the S form transactions.
B.8. Prior to the introduction of the SHL(A), the TIC system conducted benchmark surveys of foreign portfolio holdings of U.S. long-term securities in 1978, 1984, 1989, 1994, 1997, and 2000. Prior to the introduction of the SHC(A), the TIC system conducted a benchmark survey of U.S. portfolio hold-ings of foreign long-term securities in 1997.
To Contents

Part VIII. Supplemental Information
Bureau of Economic AnalysisU.S. International Economic Accounts: Concepts and Methods
272
Appendix C. Reliability of the Statistics
C.1. Based on an analysis of revisions to the 1999–2015 quarterly International Transactions Accounts (ITAs) statistics, early estimates by the Bureau of Economic Analysis present a consistent and accurate picture of economic activity between U.S. and foreign residents.55 Early estimates closely track later estimates, particularly for key aggregates. Revisions are small relative to the estimates themselves or relative to quarter-to-quarter variability in the estimates. Revisions rarely change the direction of movement in the accounts, and early estimates of key aggregates closely track turning points identified in later estimates.
C.2. Among the findings of the revisions analysis are the following:
• First estimates of the quarterly current-account balance show the same direction of change as
the third estimates (those estimates released with the annual update in June of the year after
the reference year) 94 percent of the time and identify a significant majority of the turning
points identified in the latest estimates.
• The comprehensive restructuring of the ITAs in 2014 led to large revisions to the levels of
several accounts, including the top-line current-account aggregates. However, quarterly
changes were largely unaffected.
• Revisions to estimates of exports of goods and services and to imports of goods and services
are particularly small, at less than 1 percent of the account value.
• Revisions to services accounts tend to be relatively larger than revisions to goods accounts.
• First estimates of the level of exports of goods and services and income receipts tend to
undershoot third estimates because of revisions to services and primary income receipts
components. First estimates of the quarterly change do not systematically undershoot or
overshoot third estimates.
• First estimates of the current-account aggregates were early identifiers of trends during the
2001 and 2008 recessions.
• Seasonal factor revisions have a larger impact on revisions to quarterly changes than on
revisions to levels.
• Revisions in the financial account are larger in dollar terms than those in the current account
but are of similar or smaller magnitude relative to the quarterly variability of both of these
accounts.
55. For details, see Ryan Howley, “An Analysis of the Reliability of BEA’s International Transactions Accounts,” Survey of Current Business 97 (February 2017).
To Contents

Part VIII. Supplemental Information
Bureau of Economic AnalysisU.S. International Economic Accounts: Concepts and Methods
273
C.3. Revisions to the components of the International Investment Position (IIP) Accounts and statistics on the activities of multinational enterprise (AMNE) were last analyzed for the 1999–2011 period.56 The range of revisions for components of the IIP Accounts and AMNE statistics is similar, on a relative basis, to the range of ITA current-account revisions. AMNE statistics are available only annually and the IIP Accounts were available only annually at the time of the 2012 revision study.
56. For details, see Daniel R. Yorgason and Sarah P. Scott, “An Analysis of Revisions to BEA’s International Economic Accounts,” Survey of Current Business 92 (November 2012).
To Contents
Part VIII. Supplemental Information
Bureau of Economic AnalysisU.S. International Economic Accounts: Concepts and Methods
274
Appendix D. Source Data Availability and Projections
D.1. Parts III–VI (chapters 10–33) of this volume detail the data sources and estimation methods that the U.S. Bureau of Economic Analysis (BEA) uses to produce the U.S. International Economic Accounts. For the estimation process, some of the source data are available to cover the most recent reference period (the “current period”57), but other source data typically are not. BEA uses a variety of projection methods to estimate its accounts in the absence of up-to-date source data for the cur-rent (or other) periods. For some accounts, more timely “indicator” series are used to project the estimates; these series have been found to move in similar ways to the missing primary source data. For other accounts, time-series methods are used to project estimates. For still others, prior periods of primary source data are used in place of the missing primary source data; this is referred to as the prior-period data being “carried forward with no change.”
D.2. Table D.1 summarizes source data availability and projection methods for the International Transactions Accounts and the International Investment Position Accounts. For statistics on the activities of multinational enterprises and on new foreign direct investment in the United States, estimates are not released until BEA has collected and processed most of the underlying survey data. For statistics on direct investment by country and industry, data availability is the same as described in table D.1 for the direct investment accounts. For the trade in services part of the international services statistics, data availability can be mostly inferred from services accounts descriptions in table D.1; for the services supplied through affiliates part of the international ser-vices statistics, estimates are not released until BEA has collected and processed the underlying survey data. For the monthly statistics on goods and services, much of the source data for goods is available for the current-month estimate; see paragraph 30.5 for information on projection of the monthly services estimates.
D.3. The projection methods described in table D.1 are the methods typically used. In certain cases, BEA assesses that the typically used methods are unlikely to provide accurate estimates. In such cases, BEA adjusts the projection procedures as necessary using available information from sources such as press reports and indicator series and based on analyst judgement. For instance, during the COVID-19 pandemic, international travel patterns changed in ways that rendered moving averages of past data an unsuitable basis for projecting certain travel and air passenger transport accounts.
57. “Current period” is a bit of a misnomer because the most recent reference period covered by BEA statistics never includes the date the statistics are released. For example, International Transactions Accounts (ITA) statistics covering the first quarter of each year (January-March) are first released in June of the same year. Despite the fact that the June release date is in the second quarter of the year, the statistics covering the first quarter are considered to be current-quarter statistics in the June ITA release.
To Contents

Part VIII. Supplemental Information
Bureau of Economic AnalysisU.S. International Economic Accounts: Concepts and Methods
275
Table D.1. Availability of Source Data for Current Quarter ITAs and IIP Accounts and Projection Methods Used When Source Data are Unavailable
The numbering in this table refers to the line number in ITA table 1.2. Lines with letters in their numbering are not separately included in ITA table 1.2 but are subcomponents of accounts in ITA table 1.2. For the financial account and IIP, primary numbering refers to the line number in ITA table 1.2 and the number in parentheses refers to the line number in IIP table 1.2. Accounts italicized in gray are included to provide context; the status of source data and projection methods for these accounts are described in their subaccounts.
Current Account
1. Exports of goods and services and income receipts (credits)
2. Exports of goods and services
3. Goods
4. General merchandise
5. Foods, feeds, and beverages Census-basis data on goods trade and data on selected balance of payments adjustments from the Census Bureau are available for the current quarter.
6. Industrial supplies and materials Census-basis data on goods trade and data on selected balance of payments adjustments from the Census Bureau are available for the current quarter. BEA survey data (BE–9) on fuel procured in U.S. ports by foreign airlines are available for the current quarter. Census Bureau data on fuel procured in U.S. ports by foreign vessels are lagged one quarter; they are projected using a moving average. Data from IHS Markit and from UN Comtrade on exports of electric energy to Mexico are lagged one quarter; they are carried forward with no change.
7. Capital goods except automotive Census-basis data on goods trade and data on selected balance of payments adjustments from the Census Bureau are available for the current quarter.
8. Automotive vehicles, parts, and engines Census-basis data on goods trade from the Census Bureau are available for the current quarter.
9. Consumer goods except food and automotive Census-basis data on goods trade and data on selected balance of payments adjustments from the Census Bureau are available for the current quarter.
10. Other general merchandise Census-basis data on goods trade and data on selected balance of payments adjustments from the Census Bureau are available for the current quarter. Data from Statistics Canada on mail orders to Canada are available for the current quarter. Historical data from the USPS are carried forward with no change.
11. Net exports of goods under merchanting BEA survey data (BE–125) are received and processed on a flow basis; survey responses not yet received are estimated using a matched sample based on received survey responses.
12. Nonmonetary gold Census-basis data on goods trade and data on selected balance of payments adjustments from the Census Bureau are available for the current quarter. FRBNY data, used to supplement Census Bureau data on nonmonetary gold, are available for the current quarter.
13. Services
14. Manufacturing services on physical inputs owned by others BEA does not currently provide estimates for this data item.
15. Maintenance and repair services n.i.e. BEA survey data (BE–125) are received and processed on a flow basis; survey responses not yet received are estimated using a matched sample based on received survey responses. Census Bureau data on the cross-border movement of equipment and other goods for repair are available for the current quarter. DOD data on repairs related to the Foreign Military Sales program are typically lagged one quarter; they are projected using a moving average.
16. Transport
16a. Transport: Sea freight CBP data on export tonnages are available for the current quarter. BEA survey data (BE–30) on freight rates and on receipts for carrying goods between foreign ports and for operating leases of transportation equipment with crew for limited periods are available for the current quarter.
Table continues
To Contents
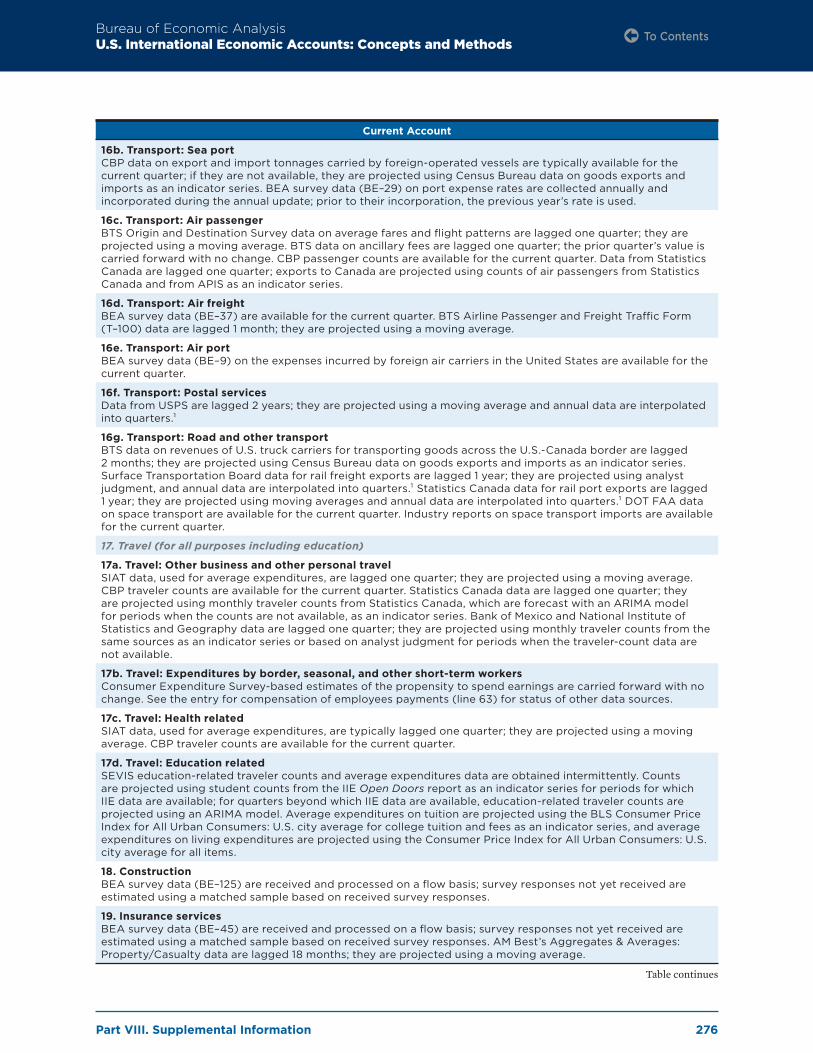
Part VIII. Supplemental Information
Bureau of Economic AnalysisU.S. International Economic Accounts: Concepts and Methods
276
Current Account
16b. Transport: Sea port CBP data on export and import tonnages carried by foreign-operated vessels are typically available for the current quarter; if they are not available, they are projected using Census Bureau data on goods exports and imports as an indicator series. BEA survey data (BE–29) on port expense rates are collected annually and incorporated during the annual update; prior to their incorporation, the previous year’s rate is used.
16c. Transport: Air passenger BTS Origin and Destination Survey data on average fares and flight patterns are lagged one quarter; they are projected using a moving average. BTS data on ancillary fees are lagged one quarter; the prior quarter’s value is carried forward with no change. CBP passenger counts are available for the current quarter. Data from Statistics Canada are lagged one quarter; exports to Canada are projected using counts of air passengers from Statistics Canada and from APIS as an indicator series.
16d. Transport: Air freight BEA survey data (BE–37) are available for the current quarter. BTS Airline Passenger and Freight Traffic Form (T–100) data are lagged 1 month; they are projected using a moving average.
16e. Transport: Air port BEA survey data (BE–9) on the expenses incurred by foreign air carriers in the United States are available for the current quarter.
16f. Transport: Postal services Data from USPS are lagged 2 years; they are projected using a moving average and annual data are interpolated into quarters.¹
16g. Transport: Road and other transport BTS data on revenues of U.S. truck carriers for transporting goods across the U.S.-Canada border are lagged 2 months; they are projected using Census Bureau data on goods exports and imports as an indicator series. Surface Transportation Board data for rail freight exports are lagged 1 year; they are projected using analyst judgment, and annual data are interpolated into quarters.¹ Statistics Canada data for rail port exports are lagged 1 year; they are projected using moving averages and annual data are interpolated into quarters.¹ DOT FAA data on space transport are available for the current quarter. Industry reports on space transport imports are available for the current quarter.
17. Travel (for all purposes including education)
17a. Travel: Other business and other personal travel SIAT data, used for average expenditures, are lagged one quarter; they are projected using a moving average. CBP traveler counts are available for the current quarter. Statistics Canada data are lagged one quarter; they are projected using monthly traveler counts from Statistics Canada, which are forecast with an ARIMA model for periods when the counts are not available, as an indicator series. Bank of Mexico and National Institute of Statistics and Geography data are lagged one quarter; they are projected using monthly traveler counts from the same sources as an indicator series or based on analyst judgment for periods when the traveler-count data are not available.
17b. Travel: Expenditures by border, seasonal, and other short-term workers Consumer Expenditure Survey-based estimates of the propensity to spend earnings are carried forward with no change. See the entry for compensation of employees payments (line 63) for status of other data sources.
17c. Travel: Health related SIAT data, used for average expenditures, are typically lagged one quarter; they are projected using a moving average. CBP traveler counts are available for the current quarter.
17d. Travel: Education related SEVIS education-related traveler counts and average expenditures data are obtained intermittently. Counts are projected using student counts from the IIE Open Doors report as an indicator series for periods for which IIE data are available; for quarters beyond which IIE data are available, education-related traveler counts are projected using an ARIMA model. Average expenditures on tuition are projected using the BLS Consumer Price Index for All Urban Consumers: U.S. city average for college tuition and fees as an indicator series, and average expenditures on living expenditures are projected using the Consumer Price Index for All Urban Consumers: U.S. city average for all items.
18. Construction BEA survey data (BE–125) are received and processed on a flow basis; survey responses not yet received are estimated using a matched sample based on received survey responses.
19. Insurance services BEA survey data (BE–45) are received and processed on a flow basis; survey responses not yet received are estimated using a matched sample based on received survey responses. AM Best’s Aggregates & Averages: Property/Casualty data are lagged 18 months; they are projected using a moving average.
Table continues
To Contents

Part VIII. Supplemental Information
Bureau of Economic AnalysisU.S. International Economic Accounts: Concepts and Methods
277
Current Account
20. Financial services BEA survey data (BE–185) are received and processed on a flow basis; survey responses not yet received are estimated using a matched sample based on received survey responses. TIC data, used to estimate transactions volumes for brokerage services on debt transactions, are lagged 1 month; they are projected using Nasdaq exchange market trading volume as an indicator series. Industry sources, used to estimate bid-ask spreads for brokerage services on debt transactions, are available for the current quarter. TIC data, used to estimate transactions volumes for market-making services, are lagged 1 month; they are carried forward with no change. Industry sources, used to estimate bid-ask spreads for market-making services, are available for the current quarter. A volume adjustment factor estimated from BE–185 and TIC data is lagged two quarters; it is carried forward with no change. TIC data, used to estimate the value of loans, deposits, and repurchase agreements for FISIM, are mostly available for the current quarter; values that are not available are projected using the most recent value. Call report data, used to estimate loan and deposit interest rates and the reference rate, are lagged one quarter; rates are projected using real-time trading information of indicator series. Interest rates, used to estimate FISIM on repurchase securities, are available for the current quarter.
21. Charges for the use of intellectual property n.i.e. BEA survey data (BE–125) are received and processed on a flow basis; survey responses not yet received are estimated using a matched sample based on received survey responses.
22. Telecommunications, computer, and information services BEA survey data (BE–125) are received and processed on a flow basis; survey responses not yet received are estimated using a matched sample based on received survey responses.
23. Other business services BEA survey data (BE–125) are received and processed on a flow basis; survey responses not yet received are estimated using a matched sample based on received survey responses.
24. Personal, cultural, and recreational services BEA survey data (BE–125) are received and processed on a flow basis; survey responses not yet received are estimated using a matched sample based on received survey responses.
25. Government goods and services n.i.e. DOD data on sales of goods and services through the Foreign Military Sales program are lagged one quarter; they are projected using a moving average. Appropriations data from OMB, used to estimate the delivery of services provided through military grant programs, are typically available for the current quarter; when the data are not available, they are projected using a moving average. State Department data provided under OMB Statistical Directive No. 19 on fees collected from overseas consulates are available for the current quarter. Data reported by government agencies under OMB Statistical Directive No. 19 on exports of certain goods and services by U.S. government operating agencies are mostly available for the current quarter; reports that are not available are carried forward with no change. Expenditures in the United States by foreign governments, foreign government employees, and international organizations are each calculated as a share of compensation of employees payments; the shares are periodically updated based on BEA research. For information on how compensation of employees payments data sources are projected, see line 63.
26. Primary income receipts
27. Investment income
28. Direct investment income Direct investment survey data (BE–577 and BE–605) are received and processed on a flow basis; survey responses not yet received are estimated using a matched sample based on received survey responses. AMNE data, used to estimate the current cost adjustment, are lagged up to 3 years; data from the BEA Fixed Assets Accounts are incorporated only for periods when AMNE data are available; for periods beyond the availability of the AMNE data, the current cost adjustment is projected using quarterly direct investment survey data and recent quarterly trends.
29. Portfolio investment income TIC data on positions are available for the current quarter. Financial services industry data on dividend yields and price indexes (from Morgan Stanley Capital International, S&P, and Merrill Lynch ICE) are available for the current quarter. DTCC data on the commercial paper market are available for the current quarter.
30. Other investment income TIC data on transactions and positions are available for the current quarter. DTCC data on the asset-backed commercial paper market are available for the current quarter. FRBNY data on interest earned on central bank liquidity swaps are available for the current quarter. FCRS data are lagged one quarter; U.S. government interest receipts from foreign residents are projected using a moving average. Some partner country data are lagged one quarter; positions are carried forward with no change. Interest rates from various sources are available for the current quarter. For information on the TIC, call report, partner country, and interest rate data, used to estimate the FISIM adjustment to other investment income, see the FISIM imports data sources in the entry for financial services imports (line 52).
Table continues
To Contents

Part VIII. Supplemental Information
Bureau of Economic AnalysisU.S. International Economic Accounts: Concepts and Methods
278
Current Account
31. Reserve asset income IMF data and FRBNY data on income receipts are available for the current quarter.
32. Compensation of employees Data on compensation of employees from NIPAs table 1.12, used to carry forward data from IRS Form 2555 in estimating the earnings of U.S. residents employed temporarily abroad, are available for the current quarter. State Department data on the number of foreign diplomats in the United States, used to estimate earnings of U.S. residents employed by foreign governments, are lagged up to 1 year; they are carried forward with no change. Partner country statistics on earnings of U.S. residents employed abroad or U.S. residents employed by foreign governments are received and processed on a flow basis; they are projected using a variety of methods, including a moving average and analyst judgment. Data from international organizations on the number of U.S. residents they employ are lagged up to 3 years; they are projected using analyst judgment.
33. Secondary income (current transfer) receipts
33a. Secondary income: general government transfer receipts
33b. Secondary income, general government transfer receipts: taxes on income, wealth, etc. IRS data, used to estimate taxes for securities, withholding taxes on direct investment, services, and compensation are lagged up to 3 years; they are projected using analyst judgement. Direct investment survey data (BE–577 and BE–605), used to estimate withholding taxes on dividends, are received and processed on a flow basis; survey responses not yet received are estimated using a matched sample based on received survey responses. BEA services survey data are received and processed on a flow basis; survey responses not yet received are estimated using a matched sample based on received survey responses. The U.S. Treasury Department’s Monthly Treasury Statement, used to estimate taxes on foreign source income of nonresident U.S. citizens, is available for the current quarter.
33c. Secondary income, general government transfer receipts: international cooperation Data submitted by the Treasury Department under OMB Statistical Directive No. 19 are available for the current quarter.
33d. Secondary income, general government transfer receipts: fines and penalties Data from U.S. government agencies, U.S. courts, other public documents, and media reports are available for the current quarter.
33e. Secondary income, general government transfer receipts: other general government transfer receipts DOE’s Foreign Gift and Contract Report is lagged three quarters; it is projected using a moving average.
33f. Secondary income: private transfer receipts
33g. Secondary income, private transfer receipts: insurance-related transfers For the status of source data used for insurance-related transfers, see the description for insurance services imports (line 51).
33h. Secondary income, private transfer receipts: fines and penalties Data from U.S. government agencies, U.S. courts, other public documents, and media reports are available for the current quarter.
33i. Secondary income, private transfer receipts: other private transfer receipts Partner country data from Statistics Canada, Deutsche Bundesbank, and the Office for National Statistics of the United Kingdom, used to estimate pensions, inheritances, and other benefits, are lagged one quarter; they are projected using moving averages. The DOE’s Foreign Gift and Contract Report, used to estimate foreign gifts to U.S. private institutions of higher learning, is lagged three quarters; it is projected using a moving average. Data from Deutsche Bundesbank, used to estimate transfers from Germany associated with World War II indemnification claims of U.S. residents, are lagged one quarter; they are projected using a moving average. SSA data on benefits paid to beneficiaries in foreign countries are lagged up to 3 years; they are projected using a moving average.
34. Imports of goods and services and income payments (debits)
35. Imports of goods and services
36. Goods
37. General merchandise
38. Foods, feeds, and beverages Census-basis data on goods trade and data on selected balance of payments adjustments from the Census Bureau are available for the current quarter.
Table continues
To Contents
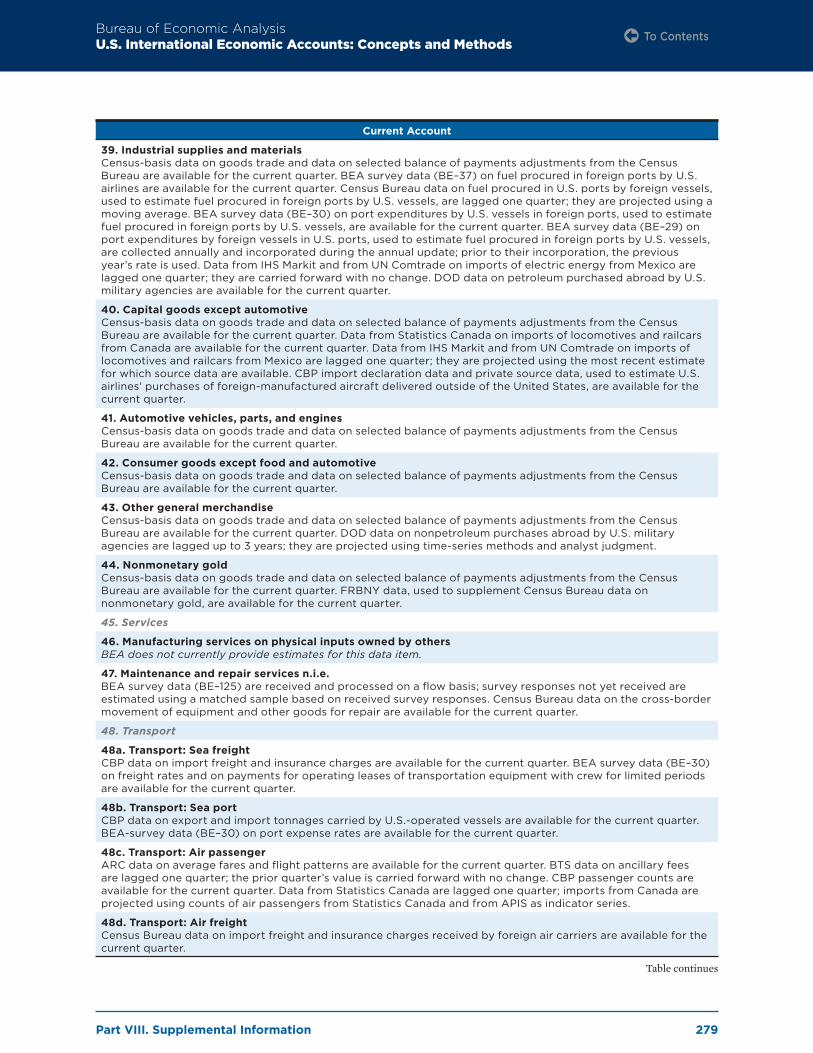
Part VIII. Supplemental Information
Bureau of Economic AnalysisU.S. International Economic Accounts: Concepts and Methods
279
Current Account
39. Industrial supplies and materials Census-basis data on goods trade and data on selected balance of payments adjustments from the Census Bureau are available for the current quarter. BEA survey data (BE–37) on fuel procured in foreign ports by U.S. airlines are available for the current quarter. Census Bureau data on fuel procured in U.S. ports by foreign vessels, used to estimate fuel procured in foreign ports by U.S. vessels, are lagged one quarter; they are projected using a moving average. BEA survey data (BE–30) on port expenditures by U.S. vessels in foreign ports, used to estimate fuel procured in foreign ports by U.S. vessels, are available for the current quarter. BEA survey data (BE–29) on port expenditures by foreign vessels in U.S. ports, used to estimate fuel procured in foreign ports by U.S. vessels, are collected annually and incorporated during the annual update; prior to their incorporation, the previous year’s rate is used. Data from IHS Markit and from UN Comtrade on imports of electric energy from Mexico are lagged one quarter; they are carried forward with no change. DOD data on petroleum purchased abroad by U.S. military agencies are available for the current quarter.
40. Capital goods except automotive Census-basis data on goods trade and data on selected balance of payments adjustments from the Census Bureau are available for the current quarter. Data from Statistics Canada on imports of locomotives and railcars from Canada are available for the current quarter. Data from IHS Markit and from UN Comtrade on imports of locomotives and railcars from Mexico are lagged one quarter; they are projected using the most recent estimate for which source data are available. CBP import declaration data and private source data, used to estimate U.S. airlines’ purchases of foreign-manufactured aircraft delivered outside of the United States, are available for the current quarter.
41. Automotive vehicles, parts, and engines Census-basis data on goods trade and data on selected balance of payments adjustments from the Census Bureau are available for the current quarter.
42. Consumer goods except food and automotive Census-basis data on goods trade and data on selected balance of payments adjustments from the Census Bureau are available for the current quarter.
43. Other general merchandise Census-basis data on goods trade and data on selected balance of payments adjustments from the Census Bureau are available for the current quarter. DOD data on nonpetroleum purchases abroad by U.S. military agencies are lagged up to 3 years; they are projected using time-series methods and analyst judgment.
44. Nonmonetary gold Census-basis data on goods trade and data on selected balance of payments adjustments from the Census Bureau are available for the current quarter. FRBNY data, used to supplement Census Bureau data on nonmonetary gold, are available for the current quarter.
45. Services
46. Manufacturing services on physical inputs owned by others BEA does not currently provide estimates for this data item.
47. Maintenance and repair services n.i.e. BEA survey data (BE–125) are received and processed on a flow basis; survey responses not yet received are estimated using a matched sample based on received survey responses. Census Bureau data on the cross-border movement of equipment and other goods for repair are available for the current quarter.
48. Transport
48a. Transport: Sea freight CBP data on import freight and insurance charges are available for the current quarter. BEA survey data (BE–30) on freight rates and on payments for operating leases of transportation equipment with crew for limited periods are available for the current quarter.
48b. Transport: Sea port CBP data on export and import tonnages carried by U.S.-operated vessels are available for the current quarter. BEA-survey data (BE–30) on port expense rates are available for the current quarter.
48c. Transport: Air passenger ARC data on average fares and flight patterns are available for the current quarter. BTS data on ancillary fees are lagged one quarter; the prior quarter’s value is carried forward with no change. CBP passenger counts are available for the current quarter. Data from Statistics Canada are lagged one quarter; imports from Canada are projected using counts of air passengers from Statistics Canada and from APIS as indicator series.
48d. Transport: Air freight Census Bureau data on import freight and insurance charges received by foreign air carriers are available for the current quarter.
Table continues
To Contents
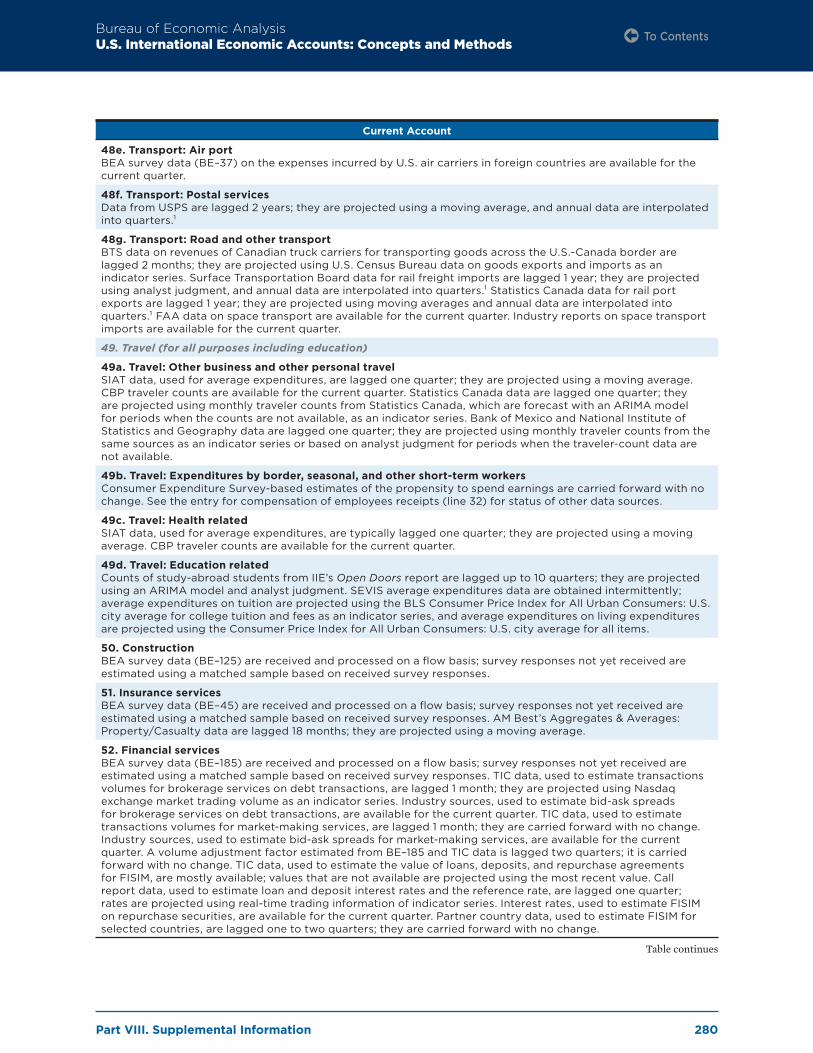
Part VIII. Supplemental Information
Bureau of Economic AnalysisU.S. International Economic Accounts: Concepts and Methods
280
Current Account
48e. Transport: Air port BEA survey data (BE–37) on the expenses incurred by U.S. air carriers in foreign countries are available for the current quarter.
48f. Transport: Postal services Data from USPS are lagged 2 years; they are projected using a moving average, and annual data are interpolated into quarters.¹
48g. Transport: Road and other transport BTS data on revenues of Canadian truck carriers for transporting goods across the U.S.-Canada border are lagged 2 months; they are projected using U.S. Census Bureau data on goods exports and imports as an indicator series. Surface Transportation Board data for rail freight imports are lagged 1 year; they are projected using analyst judgment, and annual data are interpolated into quarters.¹ Statistics Canada data for rail port exports are lagged 1 year; they are projected using moving averages and annual data are interpolated into quarters.¹ FAA data on space transport are available for the current quarter. Industry reports on space transport imports are available for the current quarter.
49. Travel (for all purposes including education)
49a. Travel: Other business and other personal travel SIAT data, used for average expenditures, are lagged one quarter; they are projected using a moving average. CBP traveler counts are available for the current quarter. Statistics Canada data are lagged one quarter; they are projected using monthly traveler counts from Statistics Canada, which are forecast with an ARIMA model for periods when the counts are not available, as an indicator series. Bank of Mexico and National Institute of Statistics and Geography data are lagged one quarter; they are projected using monthly traveler counts from the same sources as an indicator series or based on analyst judgment for periods when the traveler-count data are not available.
49b. Travel: Expenditures by border, seasonal, and other short-term workers Consumer Expenditure Survey-based estimates of the propensity to spend earnings are carried forward with no change. See the entry for compensation of employees receipts (line 32) for status of other data sources.
49c. Travel: Health related SIAT data, used for average expenditures, are typically lagged one quarter; they are projected using a moving average. CBP traveler counts are available for the current quarter.
49d. Travel: Education related Counts of study-abroad students from IIE’s Open Doors report are lagged up to 10 quarters; they are projected using an ARIMA model and analyst judgment. SEVIS average expenditures data are obtained intermittently; average expenditures on tuition are projected using the BLS Consumer Price Index for All Urban Consumers: U.S. city average for college tuition and fees as an indicator series, and average expenditures on living expenditures are projected using the Consumer Price Index for All Urban Consumers: U.S. city average for all items.
50. Construction BEA survey data (BE–125) are received and processed on a flow basis; survey responses not yet received are estimated using a matched sample based on received survey responses.
51. Insurance services BEA survey data (BE–45) are received and processed on a flow basis; survey responses not yet received are estimated using a matched sample based on received survey responses. AM Best’s Aggregates & Averages: Property/Casualty data are lagged 18 months; they are projected using a moving average.
52. Financial services BEA survey data (BE–185) are received and processed on a flow basis; survey responses not yet received are estimated using a matched sample based on received survey responses. TIC data, used to estimate transactions volumes for brokerage services on debt transactions, are lagged 1 month; they are projected using Nasdaq exchange market trading volume as an indicator series. Industry sources, used to estimate bid-ask spreads for brokerage services on debt transactions, are available for the current quarter. TIC data, used to estimate transactions volumes for market-making services, are lagged 1 month; they are carried forward with no change. Industry sources, used to estimate bid-ask spreads for market-making services, are available for the current quarter. A volume adjustment factor estimated from BE–185 and TIC data is lagged two quarters; it is carried forward with no change. TIC data, used to estimate the value of loans, deposits, and repurchase agreements for FISIM, are mostly available; values that are not available are projected using the most recent value. Call report data, used to estimate loan and deposit interest rates and the reference rate, are lagged one quarter; rates are projected using real-time trading information of indicator series. Interest rates, used to estimate FISIM on repurchase securities, are available for the current quarter. Partner country data, used to estimate FISIM for selected countries, are lagged one to two quarters; they are carried forward with no change.
Table continues
To Contents

Part VIII. Supplemental Information
Bureau of Economic AnalysisU.S. International Economic Accounts: Concepts and Methods
281
Current Account
53. Charges for the use of intellectual property n.i.e. BEA survey data (BE–125) are received and processed on a flow basis; survey responses not yet received are estimated using a matched sample based on received survey responses.
54. Telecommunications, computer, and information services BEA survey data (BE–125) are received and processed on a flow basis; survey responses not yet received are estimated using a matched sample based on received survey responses. Statistics Canada data on computer services imports from Canada are lagged up to five quarters; they are projected using a moving average.
55. Other business services BEA survey data (BE–125) are received and processed on a flow basis; survey responses not yet received are estimated using a matched sample based on received survey responses.
56. Personal, cultural, and recreational services BEA survey data (BE–125) are received and processed on a flow basis; survey responses not yet received are estimated using a matched sample based on received survey responses.
57. Government goods and services n.i.e. Data from the Defense Commissary Agency on commissary sales and from the U.S. Military Postal Service on military post office sales are both lagged by one quarter; they are carried forward with no change. Reporting by U.S. military departments within DOD is lagged by one quarter for: 1) compensation paid to U.S. personnel stationed abroad, 2) payments to foreign nationals for goods (except petroleum) and services supplied to military enclaves, and 3) imports of other goods and services not separately identifiable in the source data; it is projected using a moving average. Historical appropriations data from OMB on payments to international organizations are carried forward with no change. Data reported by U.S. Government agencies under OMB Statistical Directive No. 19 are mostly available for the current quarter; reports that are not available for the current quarter are carried forward with no change. State Department data on compensation paid to U.S. citizens and foreign nationals, used to estimate goods and services acquired in the host economy to supply nonmilitary enclaves, are available for the current quarter.
58. Primary income payments
59. Investment income
60. Direct investment income Direct investment survey data (BE–577 and BE–605) are received and processed on a flow basis; survey responses not yet received are estimated using a matched sample based on received survey responses. AMNE data, used to estimate the current cost adjustment, are lagged up to 3 years; data from the BEA Fixed Assets Accounts are incorporated only for periods when AMNE data are available; for periods beyond the availability of the AMNE data, the current cost adjustment is projected using quarterly direct investment survey data and recent quarterly trends.
61. Portfolio investment income TIC data on positions are available for the current quarter. Financial services industry data on dividend yields and price indexes (from Morgan Stanley Capital International, S&P, and Merrill Lynch ICE) are available for the current quarter.
62. Other investment income TIC data on transactions and positions are available for the current quarter. Some partner country data are lagged one quarter; positions are carried forward with no change. Interest rates from various sources are available for the current quarter. For information on the TIC, call report, partner country, and interest rate data, used to estimate the FISIM adjustment to other investment income, see the FISIM imports data sources in the entry for financial services imports (line 52).
63. Compensation of employees Estimates of compensation of Mexican workers are based on BEA research and are projected using analyst judgment. Historical partner country data from Statistics Canada on compensation of Canadian residents working in the United States are projected using analyst judgment. For the availability of SEVIS data to estimate compensation of foreign students studying in the United States, see the entry for education-related travel exports (line 17d). IIE Open Doors report data, used to estimate the share of payments to foreign students that are classified as compensation, are lagged up to six quarters; they are carried forward with no change. State Department data on the number of foreign professionals, agricultural, and nonagricultural workers temporarily residing in the United States are lagged up to 1 year; they are carried forward with no change. Data from the OFLC on wages of foreign professionals and nonagricultural workers are typically lagged one quarter; they are projected using a moving average or using the most recent estimate for which source data are available. Historical IRS data on earnings by foreign artists and athletes are projected using a moving average. NAWS data, used to estimate the share of agricultural and nonagricultural workers that are not U.S. residents, are lagged up to 5 years; they are carried forward with no change. NASS Farm Labor Survey data, used to estimate compensation of agricultural workers, are lagged one quarter; they are projected using a moving average. State Department data on the number of foreign nationals employed by U.S. diplomatic missions abroad are typically available for the current quarter; when they are not, they are projected using a moving average.
Table continues
To Contents
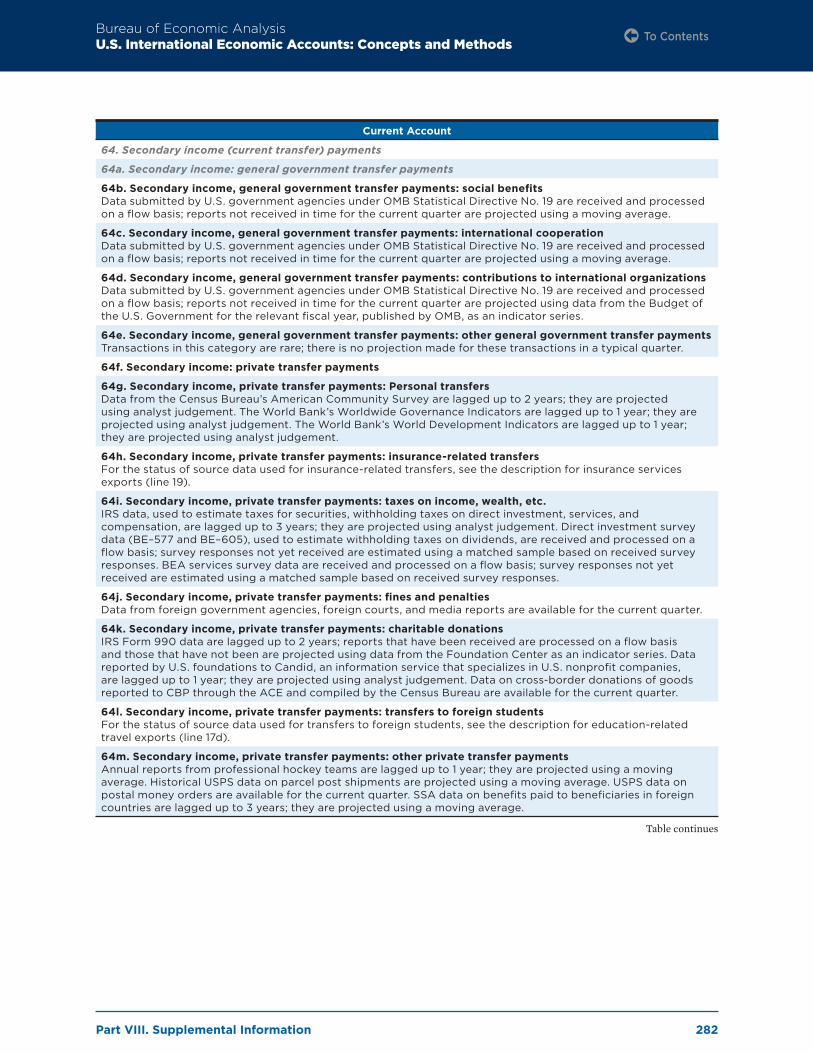
Part VIII. Supplemental Information
Bureau of Economic AnalysisU.S. International Economic Accounts: Concepts and Methods
282
Current Account
64. Secondary income (current transfer) payments
64a. Secondary income: general government transfer payments
64b. Secondary income, general government transfer payments: social benefits Data submitted by U.S. government agencies under OMB Statistical Directive No. 19 are received and processed on a flow basis; reports not received in time for the current quarter are projected using a moving average.
64c. Secondary income, general government transfer payments: international cooperation Data submitted by U.S. government agencies under OMB Statistical Directive No. 19 are received and processed on a flow basis; reports not received in time for the current quarter are projected using a moving average.
64d. Secondary income, general government transfer payments: contributions to international organizations Data submitted by U.S. government agencies under OMB Statistical Directive No. 19 are received and processed on a flow basis; reports not received in time for the current quarter are projected using data from the Budget of the U.S. Government for the relevant fiscal year, published by OMB, as an indicator series.
64e. Secondary income, general government transfer payments: other general government transfer payments Transactions in this category are rare; there is no projection made for these transactions in a typical quarter.
64f. Secondary income: private transfer payments
64g. Secondary income, private transfer payments: Personal transfers Data from the Census Bureau’s American Community Survey are lagged up to 2 years; they are projected using analyst judgement. The World Bank’s Worldwide Governance Indicators are lagged up to 1 year; they are projected using analyst judgement. The World Bank’s World Development Indicators are lagged up to 1 year; they are projected using analyst judgement.
64h. Secondary income, private transfer payments: insurance-related transfers For the status of source data used for insurance-related transfers, see the description for insurance services exports (line 19).
64i. Secondary income, private transfer payments: taxes on income, wealth, etc. IRS data, used to estimate taxes for securities, withholding taxes on direct investment, services, and compensation, are lagged up to 3 years; they are projected using analyst judgement. Direct investment survey data (BE–577 and BE–605), used to estimate withholding taxes on dividends, are received and processed on a flow basis; survey responses not yet received are estimated using a matched sample based on received survey responses. BEA services survey data are received and processed on a flow basis; survey responses not yet received are estimated using a matched sample based on received survey responses.
64j. Secondary income, private transfer payments: fines and penalties Data from foreign government agencies, foreign courts, and media reports are available for the current quarter.
64k. Secondary income, private transfer payments: charitable donations IRS Form 990 data are lagged up to 2 years; reports that have been received are processed on a flow basis and those that have not been are projected using data from the Foundation Center as an indicator series. Data reported by U.S. foundations to Candid, an information service that specializes in U.S. nonprofit companies, are lagged up to 1 year; they are projected using analyst judgement. Data on cross-border donations of goods reported to CBP through the ACE and compiled by the Census Bureau are available for the current quarter.
64l. Secondary income, private transfer payments: transfers to foreign students For the status of source data used for transfers to foreign students, see the description for education-related travel exports (line 17d).
64m. Secondary income, private transfer payments: other private transfer payments Annual reports from professional hockey teams are lagged up to 1 year; they are projected using a moving average. Historical USPS data on parcel post shipments are projected using a moving average. USPS data on postal money orders are available for the current quarter. SSA data on benefits paid to beneficiaries in foreign countries are lagged up to 3 years; they are projected using a moving average.
Table continues
To Contents

Part VIII. Supplemental Information
Bureau of Economic AnalysisU.S. International Economic Accounts: Concepts and Methods
283
Capital account
65. Capital transfer receipts and other credits BE–125 data on outright sales of trademarks and franchises and on transfer fees paid by one sporting franchise to another for the transfer of a player are received and processed on a flow basis; survey responses not yet received are estimated using a matched sample based on received survey responses. BE–45 and BE–125 data on disaster-related (catastrophic) insurance claims are lagged two quarters; they are projected based on press releases and other publicly available sources.
66. Capital transfer payments and other debits BE–125 data on outright purchases of trademarks and franchises and on transfer fees paid by one sporting franchise to another for the transfer of a player are received and processed on a flow basis; survey responses not yet received are estimated using a matched sample based on received survey responses. BE–45 and BE–125 data on disaster-related (catastrophic) insurance claims are lagged two quarters; they are projected based on press releases and other publicly available sources. Data submitted by U.S. government agencies under OMB Statistical Directive No. 19, used to estimate payments of social benefits, are received and processed on a flow basis; reports not received in time for the current quarter are projected using a moving average. The Treasury Department’s Monthly Treasury Statement, used to measure forgiveness of U.S. government loans, is available for the current quarter.
Financial account (and IIP Accounts)
67 (5). Net U.S. acquisition of financial assets excluding financial derivatives (ITA)/Assets excluding financial derivatives (IIP)
68 (7). Direct investment assets
69 (8). Equity Direct investment survey data (BE–577 and BE–605) are received and processed on a flow basis; survey responses not yet received are estimated using a matched sample based on received survey responses. ITA only:² AMNE data, used to estimate the current cost adjustment, are lagged up to 3 years and data from the BEA Fixed Assets Accounts are incorporated only for periods when AMNE data are available; for periods beyond the availability of the AMNE data, the current cost adjustment is projected using quarterly direct investment survey data (BE–577 and BE–605) and recent quarterly trends.
70 (9). Debt instruments Direct investment survey data (BE–577 and BE–605) are received and processed on a flow basis; survey responses not yet received are carried forward with no change.
71 (10). Portfolio investment assets
72 (11). Equity and investment fund shares TIC data on U.S. residents’ claims of foreign-issued equity are available for the current quarter. Morgan Stanley Capital International indexes are available for the current quarter.
73 (12). Debt securities
74 (13). Short term TIC data on U.S. residents’ claims of short-term debt securities, including negotiable certificates of deposit, are available for the current quarter. DTCC data for foreign commercial paper issued in the U.S. market are available for the current quarter.
75 (14). Long term TIC data on U.S. residents’ claims of long-term debt securities, including negotiable certificates of deposit, are available for the current quarter. Merrill Lynch ICE price indexes are available for the current quarter.
76 (21). Other investment assets
77 (22). Other equity Treasury Department data from the Monthly Treasury Statement are available for the current quarter.
78 (23). Currency and deposits TIC data on claims for deposits are available for the current quarter. FRBNY data from the Treasury and Federal Reserve Foreign Exchange Operations Report on positions in central bank liquidity swaps are available for the current quarter. Some partner country data from foreign sources are lagged one quarter; no projection is made for these transactions.
Table continues
To Contents

Part VIII. Supplemental Information
Bureau of Economic AnalysisU.S. International Economic Accounts: Concepts and Methods
284
Financial account (and IIP Accounts)
79 (24). Loans TIC data on claims for loans are available for the current quarter. U.S. Treasury Department data from the Monthly Treasury Statement are available for the current quarter. Direct investment survey data (BE–577 and BE–605), used to remove transactions in owner’s equity covered by direct investment assets, are received and processed on a flow basis; survey responses not yet received are estimated using a matched sample based on received survey responses. Data submitted by U.S. government agencies under OMB Statistical Directive No. 19 via the FCRS, used to estimate loans by the U.S. government to foreign residents, are received and processed on a flow basis; reports not received in time for the current quarter are projected using a moving average.
80 (25). Insurance technical reserves BEA does not currently provide estimates for this data item.
81 (26). Trade credit and advances TIC data on trade credit and advances are available for the current quarter.
82 (27). Reserve assets
83 (28). Monetary gold Treasury Department data on U.S. positions in monetary gold are available for the current quarter.
84 (29). Special drawing rights IMF data on the positions and transactions in the U.S. SDR account are available for the current quarter.
85 (30). Reserve position in the International Monetary Fund IMF data on positions and transactions between the United States and the IMF for the General Resources (tranche) Account and on any borrowing by the IMF are available for the current quarter.
86 (31). Other reserve assets
87 (32). Currency and deposits FRBNY data are available for the current quarter.
88 (33). Securities FRBNY data are available for the current quarter.
89 (34). Financial derivatives FRBNY data are available for the current quarter.
90 (35). Other claims FRBNY data are available for the current quarter.
91 (37). Net U.S. incurrence of liabilities excluding financial derivatives (ITA)/Liabilities excluding financial derivatives (IIP)
92 (39). Direct investment liabilities
93 (40). Equity Direct investment survey data (BE–577 and BE–605) are received and processed on a flow basis; survey responses not yet received are estimated using a matched sample based on received survey responses. ITA only:² AMNE data, used to estimate the current cost adjustment, are lagged up to 3 years and data from the BEA Fixed Assets Accounts are incorporated only for periods when AMNE data are available; for periods beyond the availability of the AMNE data, the current cost adjustment is projected using quarterly direct investment survey data (BE–577 and BE–605) and recent quarterly trends.
94 (41). Debt instruments Direct investment survey data (BE–577 and BE–605) are received and processed on a flow basis; survey responses not yet received are carried forward with no change.
95 (42). Portfolio investment liabilities
96 (43). Equity and investment fund shares TIC data on U.S. residents’ liabilities for U.S.-issued equity are available for the current quarter. S&P Dow Jones indexes are available for the current quarter.
97 (44). Debt securities
98 (45). Short term TIC data on U.S. residents’ liabilities for U.S.-issued short-term debt securities, including negotiable certificates of deposit, are available for the current quarter.
99 (48). Long term TIC data on U.S. residents’ liabilities for U.S.-issued long-term debt securities, including negotiable certificates of deposit, are available for the current quarter. Merrill Lynch ICE price indexes are available for the current quarter.
Table continues
To Contents

Part VIII. Supplemental Information
Bureau of Economic AnalysisU.S. International Economic Accounts: Concepts and Methods
285
Financial account (and IIP Accounts)
100 (57). Other investment liabilities
101 (58). Other equity BEA does not currently provide estimates for these data items.
102 (59). Currency and deposits TIC data on liabilities for deposits are available for the current quarter. FRB data on net shipments of U.S. currency into and out of the United States are available for the current quarter.
103 (60). Loans TIC data on liabilities for loans are available for the current quarter. Direct investment survey data (BE–577 and BE–605), used to remove transactions in owner’s equity covered by direct investment liabilities, are received and processed on a flow basis; survey responses not yet received are estimated using a matched sample based on received survey responses. Some partner country data from foreign sources are lagged one quarter; no projection is made for these transactions.
104 (61). Insurance technical reserves BEA does not currently provide estimates for these data items.
105 (62). Trade credit and advances TIC data on trade credit and advances are available for the current quarter. Data submitted by the DOD under OMB Statistical Directive No. 19, used to estimate advance payments for sales of military goods, are available for the current quarter.
106 (63). Special drawing rights allocations IMF information on special drawing rights are available for the current quarter.
107 (3, 6, 15-20, 38, and 51-56). Financial derivatives other than reserves, net transactions TIC data on financial derivatives are available for the current quarter.
Addendum
Seasonal adjustment factors Seasonal adjustment factors are projected annually using the Census X-13 ARIMA-SEATS program during the annual update.
1. The interpolation methodology used by BEA is the modified Denton proportional first difference method.2. Source data used for estimating the ITA but not the IIP entry are labeled as “(ITA only)”.
ACE . . . . . . . . . . . . . . . . . . . .Automated Commercial EnvironmentAMNE . . . . . . . . . . . . . . . . . .Activities of multinational enterprisesAPIS . . . . . . . . . . . . . . . . . . . .Advance Passenger Information
SystemARIMA . . . . . . . . . . . . . . . . .Auto regressive integrated moving
averageBEA . . . . . . . . . . . . . . . . . . . .U.S. Bureau of Economic AnalysisBLS . . . . . . . . . . . . . . . . . . . . .U.S. Bureau of Labor StatisticsBTS. . . . . . . . . . . . . . . . . . . . .Bureau of Transportation StatisticsCBP. . . . . . . . . . . . . . . . . . . . .U.S. Customs and Border ProtectionCensus Bureau . . . . . . . . . .U.S. Census Bureau DOD . . . . . . . . . . . . . . . . . . . .U.S. Department of DefenseDOE . . . . . . . . . . . . . . . . . . . .U.S. Department of EducationDTCC. . . . . . . . . . . . . . . . . . .Depository Trust and Clearing
CorporationFAA. . . . . . . . . . . . . . . . . . . . .Federal Aviation AdministrationFCRS . . . . . . . . . . . . . . . . . . .Foreign Credit Reporting SystemFISIM . . . . . . . . . . . . . . . . . .Financial intermediation services
indirectly measuredFRBNY . . . . . . . . . . . . . . . . .Federal Reserve Bank of New YorkICE . . . . . . . . . . . . . . . . . . . . .Intercontinental Exchange
IIE. . . . . . . . . . . . . . . . . . . . . .Institute of International EducationIIP. . . . . . . . . . . . . . . . . . . . . .International Investment PositionIMF . . . . . . . . . . . . . . . . . . . .International Monetary FundIRS . . . . . . . . . . . . . . . . . . . . .Internal Revenue ServiceITA(s) . . . . . . . . . . . . . . . . . .International Transactions Account(s)NASS . . . . . . . . . . . . . . . . . . .National Agricultural Statistics ServiceNAWS . . . . . . . . . . . . . . . . . .National Agricultural Workers Surveyn.i.e. . . . . . . . . . . . . . . . . . . . .Not included elsewhereNIPA(s) . . . . . . . . . . . . . . . . .National Income and Product
Account(s)OFLC . . . . . . . . . . . . . . . . . . .Office of Foreign Labor CertificationOMB. . . . . . . . . . . . . . . . . . . .Office of Management and BudgetSDR . . . . . . . . . . . . . . . . . . . .Special drawing rightsSEVIS. . . . . . . . . . . . . . . . . . .Student and Exchange Visitor SystemSIAT. . . . . . . . . . . . . . . . . . . .Survey of International Air TravelersSSA . . . . . . . . . . . . . . . . . . . . .U.S. Social Security AdministrationState Department . . . . . . . .U.S. Department of StateTIC . . . . . . . . . . . . . . . . . . . . .Treasury International CapitalTreasury Department . . . .U.S. Department of the TreasuryUSPS . . . . . . . . . . . . . . . . . . .United States Postal Service
To Contents

Part VIII. Supplemental Information
Bureau of Economic AnalysisU.S. International Economic Accounts: Concepts and Methods
286
Glossary
Term Definition
Accrual accounting
Accounting method that matches the time of recording with the timing of the events giving rise to economic flows. Revenues and expenses are reflected in the accounts in the period earned or expensed rather than when cash receipts or disbursements occur (cash accounting). Accrual accounting is used to compile the International Transactions Accounts, the International Investment Position Accounts, and the statistics on activities of multinational enterprises.
Activities of multinational enterprises (AMNE)
AMNE statistics relate to the operations and finances of multinational enterprises such as sales, employment, expenditures for property, plant, and equipment, balance sheets, and value added. These statistics include closely related foreign affiliates statistics (FATS). The Bureau of Economic Analysis publishes inward AMNE statistics, which pertain to foreign-owned business enterprises resident in the United States (U.S. affiliates), and outward AMNE statistics, which pertain to foreign affiliates and their U.S. parents.
Affiliate
Business enterprise that is directly or indirectly owned or controlled by an entity in another country to the extent of 10 percent or more ownership of the voting stock for a legally incorporated business or an equivalent interest for an unincorporated business.
Affiliated tradeResident-nonresident trade between entities that have a direct investment relationship with each other, such as between a parent and its affiliate. Also known as intrafirm trade or related-party trade.
Asset/liability basis
Method of presenting direct investment statistics under which the financial transactions, positions, and income are organized according to whether the investment relates to an asset or liability without any offsetting adjustments for reverse investment or investment by fellow enterprises. An alternative presentation is the directional principle.
Balance
Net measure of transactions between the United States and the rest of the world. It is calculated as credits less debits for some category of transactions. The International Transactions Accounts include balances on the current account and major current account components as well as on the capital account. A positive balance indicates a surplus and a negative balance indicates a deficit.
Balance of paymentsStatistical statement that summarizes, for a specific reference period, the economic transactions of an economy with the rest of the world. The U.S. balance of payments is referred to as the International Transactions Accounts.
Balance of payments adjustments
Additions and subtractions to goods exports and imports compiled on a customs basis (merchandise trade statistics) to meet balance of payments requirements. Adjustments are made for coverage, timing, valuation, residence, and other factors.
BD4
The Benchmark Definition of Foreign Direct Investment, Fourth Edition, published by the Organisation for Economic Co-operation and Development. This manual contains guidelines for the preparation of statistics related to direct investment financial transactions, positions, and income.
Bilateral statisticsInternational Economic Accounts statistics disaggregated according to partner-country classifications. Bilateral statistics provide important measures of trade and investment between the United States and other countries and world regions.
To Contents

Part VIII. Supplemental Information
Bureau of Economic AnalysisU.S. International Economic Accounts: Concepts and Methods
287
Term Definition
BPM6The Balance of Payments and International Investment Position Manual, Sixth Edition, published by the International Monetary Fund. This manual contains guidelines for the preparation of International Economic Accounts.
Branch Business entity that is not legally incorporated and is owned by another business entity.
Business enterpriseAny organization, association, branch, or venture that exists for profit-making purposes or to otherwise secure economic advantage, including ownership of real estate held for these purposes.
Call Reports— FFIEC 031, 041, 051—Reports of Condition and Income
Quarterly regulatory reports that U.S.-chartered commercial banks are required to file with the Federal Financial Institutions Examination Council (FFIEC). The reports collect a different level of detail depending on bank structure and size; though for all sizes, though, the call report is a thorough description of a bank’s balance sheet and income statement.
Capital accountMajor account of the International Transactions Accounts that records resident-nonresident transactions for capital transfers and for the acquisition or disposal of nonproduced nonfinancial assets.
Capital gains and losses of direct investment affiliates
The portion of the parent share of affiliate net income that is not the result of the affiliates’ primary activities and is excluded from direct investment income on equity (earnings). Capital gains and losses include gains and losses resulting from the sale or disposition of assets, excluding inventories; certain holding gains and losses on financial assets; goodwill impairment; write-downs and write-offs of assets and liabilities associated with restructuring; disposals of discontinued operations; extraordinary, unusual, and infrequently occurring items that are material, including losses from accidental damages or natural disasters after insurance reimbursement but excluding fines, penalties, and settlements; and changes in accounting principles.
Capital transfersComponent of the capital account treated as the offsetting entry to financial claims or nonfinancial assets acquired or provided without a corresponding return of economic value (quid pro quo).
Center of economic interest
Location of an institutional unit from which it engages, or intends to engage, in economic activities and transactions on a significant scale for one year or more. Determines the country of residence for International Economic Accounts.
Change in ownership
Basic principle in BPM6 for determining international transactions. Occurs when a good, nonproduced nonfinancial asset, or financial asset has been received or a service has been provided. It is generally deemed to have occurred when the two parties (resident and nonresident) record a transaction in their respective accounts.
Change in volume and valuation n.i.e. (not included elsewhere)
Change in the value of an asset or a liability in the International Investment Position Accounts from the beginning to the end of a period due to changes other than financial transactions, price changes, and exchange-rate changes.
Compensation of employees
Comprises wages, salaries, and other benefits earned by employees for work performed.
Counterparty The nonresident participant in a U.S. international transaction.
Credit
Transaction that records revenue earned (for example, exports of goods and services), receipt of income, a liquidation of U.S. assets, or an incurrence of U.S. liabilities. Treated as a positive value when calculating balances and as a negative value when calculating the statistical discrepancy.
To Contents

Part VIII. Supplemental Information
Bureau of Economic AnalysisU.S. International Economic Accounts: Concepts and Methods
288
Term Definition
Currency and depositsCurrency consists of notes and coins with fixed nominal values that are issued or authorized by central banks or governments. Deposits include all claims on deposit-taking institutional units that are represented by evidence of deposit.
Current account
Major account of the International Transactions Accounts that covers resident-nonresident transactions (that is, exchanges of economic values and transfers of current economic value without a quid pro quo) in goods, services, primary income, and secondary income.
Current cost Valuation of assets based on the prices prevailing at the time of valuation. It incorporates the effects of both depreciation and changes in market prices.
Current-cost adjustment
Adjustment to direct investment earnings that converts depreciation reported for financial accounting purposes to a measure more consistent with economic accounting principles. The adjustment converts depreciation valued at historical cost to current (replacement) cost and adds depletion of natural resources back to earnings for consistency with National Economic Accounts.
Current transfersComponent of the current account treated as the offsetting entry to current economic value acquired or provided without a corresponding return of economic value (quid pro quo).
Customs value
Valuation method used in the U.S. International Economic Accounts for U.S. imports of goods. The value is generally defined as the price actually paid or payable for goods at the foreign port of export, excluding U.S. import duties, freight, insurance, and other charges incurred in bringing the goods to the United States.
Debit
Transaction that records expense incurred (for example, imports of goods and services), payment of income, an acquisition of U.S. assets, or a repayment of U.S. liabilities. Treated as a negative value when calculating balances and as a positive value when calculating the statistical discrepancy.
DebtFinancial claim that refers to lending of funds by a creditor (lender) to a debtor (borrower). Debt comprises securities that are generally marketable and other instruments that are generally not marketable.
Debt forgivenessComponent of capital transfers in the capital account whereby a government creditor entity in one economy formally agrees with a debtor entity in another economy to extinguish all or part of the obligations of the debtor to that creditor.
Debt securities
Negotiable instruments that serve as evidence of debt including bills, bonds, notes, negotiable certificates of deposit, commercial paper, debentures, asset-backed securities, money market instruments, and similar instruments traded in financial markets.
Debtor/creditor principle
Type of geographic attribution in the International Economic Accounts whereby financial assets (claims) of the compiling economy are attributed to the country of residence of the nonresident debtor and financial liabilities are attributed to the country of residence of the nonresident creditor. An alternative approach is the transactor principle.
Deficit A negative balance of credits less debits for some category of transactions.
To Contents

Part VIII. Supplemental Information
Bureau of Economic AnalysisU.S. International Economic Accounts: Concepts and Methods
289
Term Definition
Direct investment
A category of cross-border investment associated with a resident in one economy having control or a significant degree of influence on the management of a business enterprise resident in another economy. Ownership or control of 10 percent or more of the voting securities of an entity in another economy is the threshold for separating direct investment from other types of investment. Direct investment is a functional category for primary income and the financial account of the International Transactions Accounts and for the International Investment Position Accounts. Also refers to investment transactions or positions between entities involved in a direct investment relationship. Its major components are equity investment and debt instruments investment.
Direct investment enterprise
A business enterprise in which a direct investor, who is a resident entity in another economy, owns 10 percent or more of the ordinary shares or voting power (for a corporation) or the equivalent (for enterprise that is not incorporated). Equivalent to an affiliate in the U.S. International Economic Accounts.
Direct investment debt instruments
A component of direct investment that reflects parents’ lending to and borrowing from their affiliates. For inward investment, it also covers transactions between U.S. affiliates and members of their foreign parent group other than the immediate foreign parent. Also known as intercompany debt.
Direct investment financial transactions
Transactions that change financial claims (assets) and liabilities between U.S. parents and their foreign affiliates or between U.S. affiliates and their foreign parents. Financial outflows result from transactions that increase U.S. assets or decrease U.S. liabilities. Financial inflows result from transactions that decrease U.S. assets or increase U.S. liabilities. Direct investment financial transactions consist of reinvestment of earnings, equity investment other than reinvestment of earnings, and debt instruments investment.
Direct investment position
The value of investment for the functional category of direct investment. The Bureau of Economic Analysis (BEA) presents direct investment positions on both an asset/liability basis and on a directional basis. On an asset/liability basis, the position equals the value of equity claims and outstanding loans between entities involved in direct investment relationships. On a directional basis, the position equals parents’ equity in, and net outstanding loans to, their affiliates. BEA reports statistics for positions at historical cost (book value), current cost, and market value.
Direct investor
An entity resident in one economy that owns 10 percent or more of the ordinary shares or voting power (for a corporation) or the equivalent (for a business enterprise that is not incorporated) of a business enterprise resident in another economy. A business enterprise may have one or more direct investors, either through a single chain of ownership or through multiple chains. In the U.S. economic accounts, U.S. parents are direct investors in all of their foreign affiliates and immediate direct investors in some of their foreign affiliates; foreign parents are immediate direct investors in their U.S. affiliates. Ultimate beneficial owners of U.S. affiliates are sometimes direct investors in those affiliates, and some members of U.S. affiliates’ foreign parent groups may be direct investors in the affiliates.
Directional principle
Method of presenting direct investment statistics under which the financial flows and positions are organized according to the direction of the direct investment relationship (outward versus inward). Reverse investment and certain types of investment in fellow enterprises are subtracted from gross outward and inward flows and positions. An alternative presentation is the asset/liability principle. The directional principle is used for classifying direct investment financial transactions, positions, and income by country and by industry.
Dividends and withdrawals
Distributed earnings to equity holders of incorporated private enterprises, cooperatives, and public corporations that are paid from after-tax profits, and distributed income from unincorporated entities, such as branches.
To Contents

Part VIII. Supplemental Information
Bureau of Economic AnalysisU.S. International Economic Accounts: Concepts and Methods
290
Term Definition
Double-entry accounting
Basic accounting convention whereby each recorded transaction is represented by at least two corresponding entries (credit and debit) with equal values in the accounts of the transactor. This convention is used for compiling the International Transactions Accounts.
Economic assetsResources over which ownership rights are enforced and from which future economic benefits may accrue to the owner. They include fixed assets, inventories, valuables, nonproduced assets, and financial assets.
Economic ownership Economic ownership, which may differ from legal ownership, accrues to the party that bears the risks and enjoys the rewards of ownership.
End-use systemSystem of classification of merchandise trade data developed by the Bureau of Economic Analysis for publishing U.S. goods trade statistics according to analytically meaningful categories. It is based on the Harmonized System.
EnterpriseAn institutional unit engaged in production that may be a business enterprise, a nonprofit institution, or a part of a household or government unit engaged in production.
Equity and investment fund shares
Financial instrument category that includes both equity excluding investment fund shares and investment fund shares.
Equity excluding investment fund shares
Financial instruments that represent claims to the residual values of issuing institutional units. Equity securities include common stocks, preferred stocks, restricted stocks, and depository receipts.
Equity investment other than reinvestment of earnings
Subcomponent of equity investment in direct investment financial transactions that is measured as the difference between equity increases and decreases. Equity increases result from (1) parents’ establishments of new affiliates, (2) payments by parents to unaffiliated parties for the purchase of capital stock or other equity interests when they acquire an existing business, (3) payments to acquire additional ownership interests in their affiliates, and (4) capital contributions to their affiliates. Equity decreases are the funds parents receive when they reduce their equity interests in their affiliates.
Exchange-rate changeChange in the value of a foreign-currency-denominated asset or a liability in the International Investment Position Accounts from the beginning to the end of a period due to changes in the value of foreign currencies relative to the value of the U.S. dollar.
Fellow enterprises Enterprises that have no direct investment relationship with one another but that have a common direct investor.
Financial account
Major account of the International Transactions Accounts that records resident-nonresident transactions in financial instruments classified by the functional categories of direct investment, portfolio investment, other investment, reserve assets, and financial derivatives. All financial-account transactions are recorded as net acquisition of U.S. assets, net incurrence of U.S. liabilities, or net transactions in financial derivatives other than reserves.
Financial assets Economic assets that are financial instruments. Financial assets include financial claims and, by convention, monetary gold held as gold bullion.
Financial derivatives other than reserves
Financial instruments that represent securities providing payoffs that are based on the values of other assets such as commodity prices, securities prices, or market index values. Examples are futures, forwards, options and swaps. It is also a functional category of investment.
To Contents
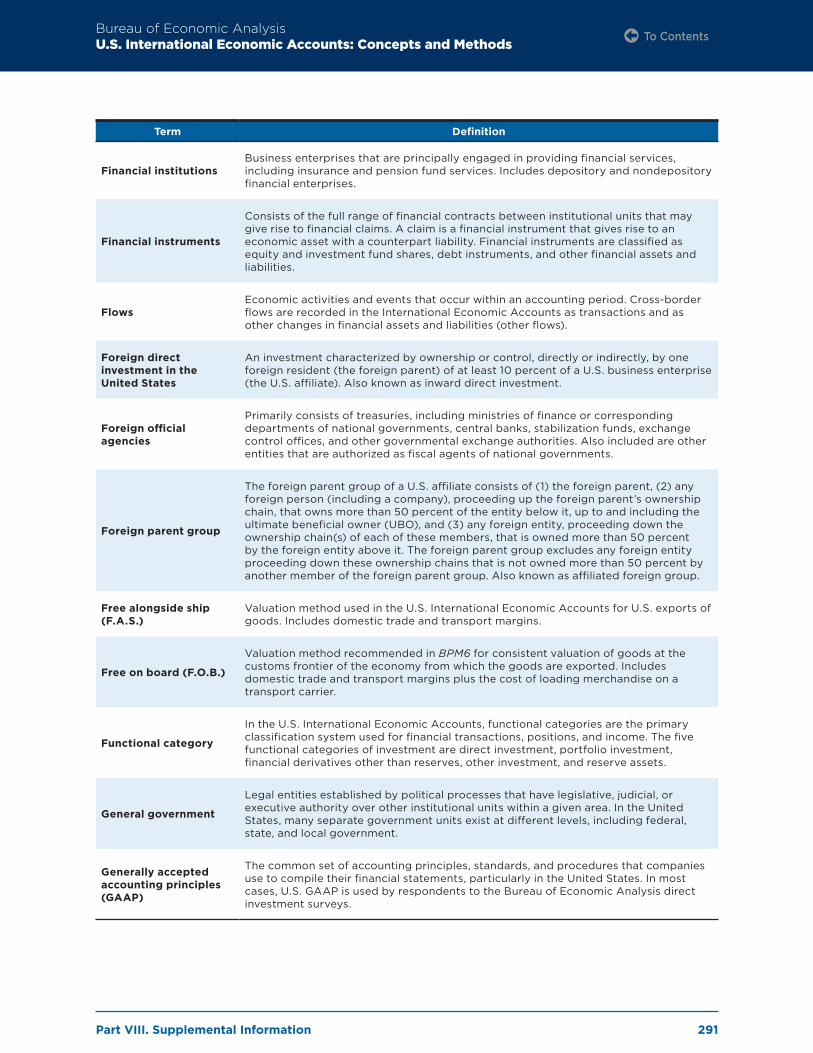
Part VIII. Supplemental Information
Bureau of Economic AnalysisU.S. International Economic Accounts: Concepts and Methods
291
Term Definition
Financial institutionsBusiness enterprises that are principally engaged in providing financial services, including insurance and pension fund services. Includes depository and nondepository financial enterprises.
Financial instruments
Consists of the full range of financial contracts between institutional units that may give rise to financial claims. A claim is a financial instrument that gives rise to an economic asset with a counterpart liability. Financial instruments are classified as equity and investment fund shares, debt instruments, and other financial assets and liabilities.
FlowsEconomic activities and events that occur within an accounting period. Cross-border flows are recorded in the International Economic Accounts as transactions and as other changes in financial assets and liabilities (other flows).
Foreign direct investment in the United States
An investment characterized by ownership or control, directly or indirectly, by one foreign resident (the foreign parent) of at least 10 percent of a U.S. business enterprise (the U.S. affiliate). Also known as inward direct investment.
Foreign official agencies
Primarily consists of treasuries, including ministries of finance or corresponding departments of national governments, central banks, stabilization funds, exchange control offices, and other governmental exchange authorities. Also included are other entities that are authorized as fiscal agents of national governments.
Foreign parent group
The foreign parent group of a U.S. affiliate consists of (1) the foreign parent, (2) any foreign person (including a company), proceeding up the foreign parent’s ownership chain, that owns more than 50 percent of the entity below it, up to and including the ultimate beneficial owner (UBO), and (3) any foreign entity, proceeding down the ownership chain(s) of each of these members, that is owned more than 50 percent by the foreign entity above it. The foreign parent group excludes any foreign entity proceeding down these ownership chains that is not owned more than 50 percent by another member of the foreign parent group. Also known as affiliated foreign group.
Free alongside ship (F.A.S.)
Valuation method used in the U.S. International Economic Accounts for U.S. exports of goods. Includes domestic trade and transport margins.
Free on board (F.O.B.)
Valuation method recommended in BPM6 for consistent valuation of goods at the customs frontier of the economy from which the goods are exported. Includes domestic trade and transport margins plus the cost of loading merchandise on a transport carrier.
Functional category
In the U.S. International Economic Accounts, functional categories are the primary classification system used for financial transactions, positions, and income. The five functional categories of investment are direct investment, portfolio investment, financial derivatives other than reserves, other investment, and reserve assets.
General government
Legal entities established by political processes that have legislative, judicial, or executive authority over other institutional units within a given area. In the United States, many separate government units exist at different levels, including federal, state, and local government.
Generally accepted accounting principles (GAAP)
The common set of accounting principles, standards, and procedures that companies use to compile their financial statements, particularly in the United States. In most cases, U.S. GAAP is used by respondents to the Bureau of Economic Analysis direct investment surveys.
To Contents

Part VIII. Supplemental Information
Bureau of Economic AnalysisU.S. International Economic Accounts: Concepts and Methods
292
Term Definition
Goods
Major component of the current account of the International Transactions Accounts that covers physical, produced items for which ownership rights can be established and transferred. Goods are classified as general merchandise, net exports of goods under merchanting, and nonmonetary gold.
Harmonized Commodity Description and Coding System (Harmonized System)
Classification system established by the World Customs Organization to secure a high degree of harmony and uniformity across countries in customs data systems. This system is used to classify U.S. trade in goods.
Historical cost (book value)
Valuation of assets based on the value recorded in the financial accounts of the enterprise at the time the asset was acquired. Historical cost, also called “book value,” is the basis on which companies can most easily report data for Bureau of Economic Analysis direct investment surveys.
HouseholdsConsists of individuals or groups of individuals who share the same living accommodation, pool some of their income, and consume certain goods and services collectively. Households include individuals living in institutional arrangements.
Institutional unitEntities that engage in transactions and other economic activities in an economic territory and that form the foundation for economic statistics compiled in National Economic Accounts and International Economic Accounts.
Insurance technical reserves
Reserves for unearned nonlife insurance premiums due to prepayment of premiums and reserves against outstanding nonlife insurance claims.
InterestIncome that is receivable by the owners of certain kinds of financial assets, namely deposits, debt securities, loans, and other accounts receivable, for placing the financial assets at the disposal of another institutional unit.
International Investment Position (IIP) Accounts
Statistical statement of the value and composition of the stock of an economy’s claims on the rest of the world and the value and composition of the stock of an economy’s liabilities to the rest of the world.
International services
The name of a set of annual statistics that covers both U.S. international trade in services and services supplied through majority-owned affiliates of multinational enterprises. The trade in services portion of the statistics covers in greater detail the same transactions covered by the services component of the current account of the International Transactions Accounts, as well as trade in information and communications technology (ICT) services and potentially ICT-enabled services. The services supplied portion of the statistics covers services provided to foreign customers by foreign affiliates of U.S. parents and services provided to U.S. customers by U.S. affiliates of foreign parents.
International Transactions Accounts (ITAs)
Official title for the U.S. balance of payments accounts, which consist of the current account, the capital account, and the financial account.
Investment fund shares
Type of collective investment that includes money market funds (MMFs) and non-MMF investment funds. Includes shares in money market, equity, and bond mutual funds, real estate investment trusts, index-linked equity unit investment trusts, and limited partnership interests.
Investment income
Component of primary income that includes income on equity and on debt. Equity income consists of profits (distributed or reinvested) on direct investment, dividends on portfolio stocks, and withdrawals from income on other equity. Debt income consists of interest from direct, portfolio, and other investment.
To Contents

Part VIII. Supplemental Information
Bureau of Economic AnalysisU.S. International Economic Accounts: Concepts and Methods
293
Term Definition
Inward direct investment
Also known as foreign direct investment in the United States. In the International Transactions Accounts and International Investment Position Accounts, inward direct investment includes equity and net debt investments by the foreign parent, and net debt investment by any other members of the foreign parent group.
Knowledge-capturing products
Outputs of information, advice, and entertainment that can be repeatedly accessed by the consumer. Knowledge-capturing products are (usually) not physical, but ownership rights for these products can be established and transferred. By virtue of not being physical, they are not fully goods. By virtue of the capability to have ownership rights attached, they are not fully services. In the current account of the International Transactions Accounts, however, knowledge-capturing products are mostly classified as services.
Loans
Financial instruments that are established when a creditor lends funds directly to a debtor and that are evidenced by nonnegotiable documents. This category includes installment loans, hire-purchase loans, and trade credit finance. Loans also include securities repurchase agreements and financial leases.
Majority-owned affiliate
An affiliate (direct investment enterprise) that is controlled by a nonresident direct investor through the ownership either directly or indirectly of more than 50 percent of the voting equity of a legally incorporated business or an equivalent interest in an unincorporated business. Known in BPM6 as a subsidiary.
Market valueAmount that willing buyers pay to acquire something from willing sellers. The exchanges are made between two independent parties and on the basis of commercial considerations only.
MaturityPeriod after which a security can be redeemed for its maturity value. Short-term is defined as payable on demand or at one year or less. Long-term is defined as payable after more than one year or with no maturity.
Maturity value The amount the issuer will pay the holder of a security at the date of redemption of the security. It is often referred to as par, face, principal, and redemption value.
Modes of supplyCategories of services transactions developed by the World Trade Organization for compiling statistics related to administration of the General Agreement on Trade in Services.
Monetary authority
Generally the central bank and other institutional units that conduct operations on behalf of the central bank. Such operations include the issuance of currency, maintenance and management of reserve assets, and the operation of exchange stabilization funds. In the United States, authority over reserve assets is shared by the U.S. Department of the Treasury and the Federal Reserve System.
Monetary gold
Reserve asset item that refers to gold owned by the monetary authorities and held as a reserve asset. Transactions in monetary gold occur only between monetary authorities and their counterparts in other economies or between monetary authorities and international monetary organizations.
Money market securities
All highly marketable debt securities with an initial term to maturity of a year or less that generally give the holder the unconditional right to receive a stated, fixed sum of money on a specific date.
Multinational enterprises (MNEs)
Enterprise groups with a direct investor resident in one country that have direct investment enterprises located in one or more other countries. In the U.S. International Economic Accounts, MNEs consist of parent companies and their affiliates.
To Contents
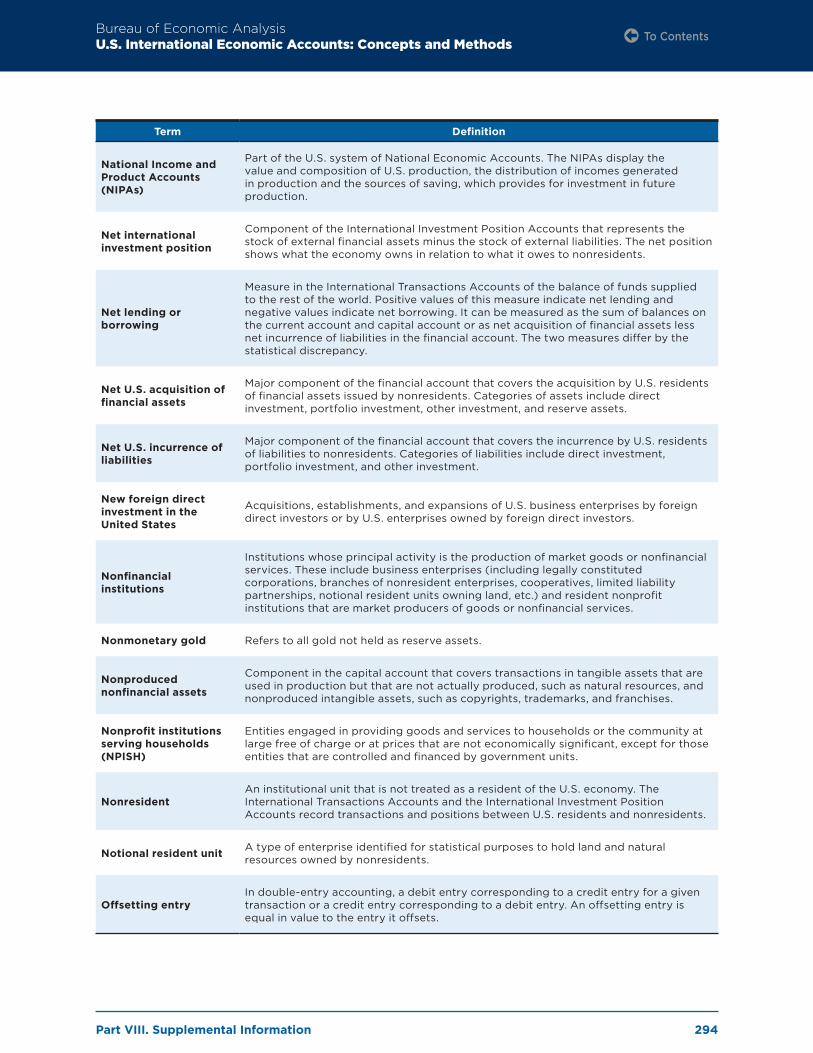
Part VIII. Supplemental Information
Bureau of Economic AnalysisU.S. International Economic Accounts: Concepts and Methods
294
Term Definition
National Income and Product Accounts (NIPAs)
Part of the U.S. system of National Economic Accounts. The NIPAs display the value and composition of U.S. production, the distribution of incomes generated in production and the sources of saving, which provides for investment in future production.
Net international investment position
Component of the International Investment Position Accounts that represents the stock of external financial assets minus the stock of external liabilities. The net position shows what the economy owns in relation to what it owes to nonresidents.
Net lending or borrowing
Measure in the International Transactions Accounts of the balance of funds supplied to the rest of the world. Positive values of this measure indicate net lending and negative values indicate net borrowing. It can be measured as the sum of balances on the current account and capital account or as net acquisition of financial assets less net incurrence of liabilities in the financial account. The two measures differ by the statistical discrepancy.
Net U.S. acquisition of financial assets
Major component of the financial account that covers the acquisition by U.S. residents of financial assets issued by nonresidents. Categories of assets include direct investment, portfolio investment, other investment, and reserve assets.
Net U.S. incurrence of liabilities
Major component of the financial account that covers the incurrence by U.S. residents of liabilities to nonresidents. Categories of liabilities include direct investment, portfolio investment, and other investment.
New foreign direct investment in the United States
Acquisitions, establishments, and expansions of U.S. business enterprises by foreign direct investors or by U.S. enterprises owned by foreign direct investors.
Nonfinancial institutions
Institutions whose principal activity is the production of market goods or nonfinancial services. These include business enterprises (including legally constituted corporations, branches of nonresident enterprises, cooperatives, limited liability partnerships, notional resident units owning land, etc.) and resident nonprofit institutions that are market producers of goods or nonfinancial services.
Nonmonetary gold Refers to all gold not held as reserve assets.
Nonproduced nonfinancial assets
Component in the capital account that covers transactions in tangible assets that are used in production but that are not actually produced, such as natural resources, and nonproduced intangible assets, such as copyrights, trademarks, and franchises.
Nonprofit institutions serving households (NPISH)
Entities engaged in providing goods and services to households or the community at large free of charge or at prices that are not economically significant, except for those entities that are controlled and financed by government units.
NonresidentAn institutional unit that is not treated as a resident of the U.S. economy. The International Transactions Accounts and the International Investment Position Accounts record transactions and positions between U.S. residents and nonresidents.
Notional resident unit A type of enterprise identified for statistical purposes to hold land and natural resources owned by nonresidents.
Offsetting entryIn double-entry accounting, a debit entry corresponding to a credit entry for a given transaction or a credit entry corresponding to a debit entry. An offsetting entry is equal in value to the entry it offsets.
To Contents
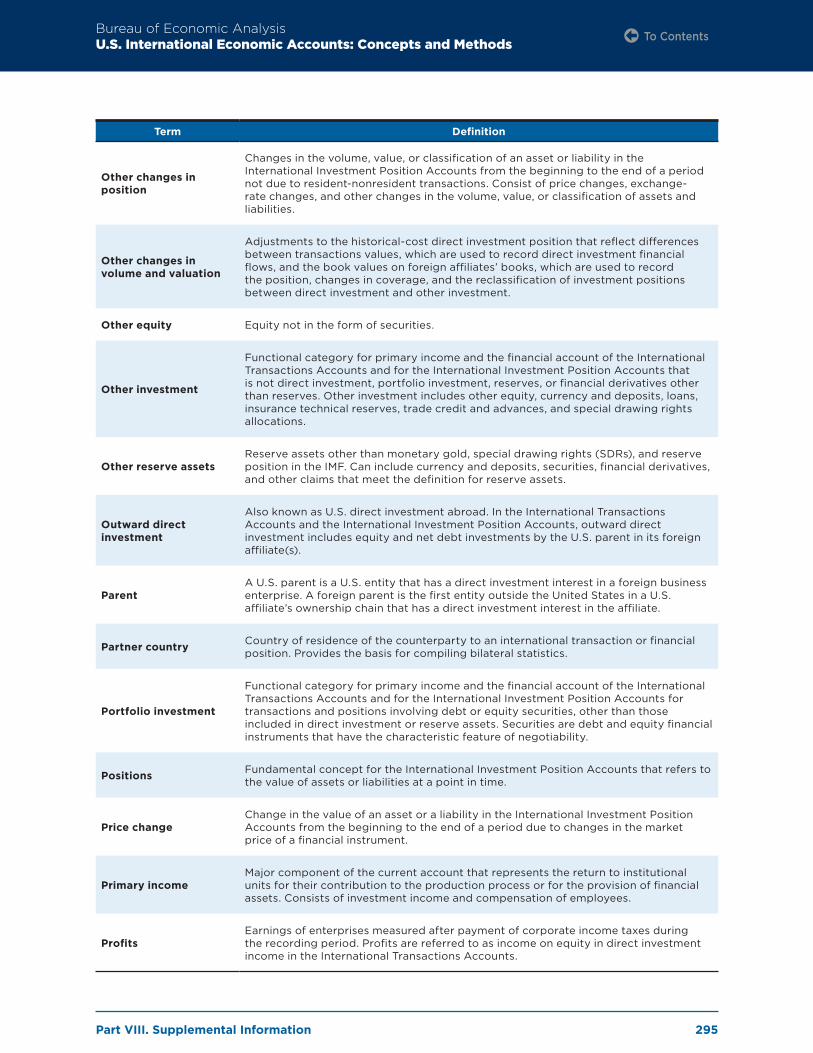
Part VIII. Supplemental Information
Bureau of Economic AnalysisU.S. International Economic Accounts: Concepts and Methods
295
Term Definition
Other changes in position
Changes in the volume, value, or classification of an asset or liability in the International Investment Position Accounts from the beginning to the end of a period not due to resident-nonresident transactions. Consist of price changes, exchange-rate changes, and other changes in the volume, value, or classification of assets and liabilities.
Other changes in volume and valuation
Adjustments to the historical-cost direct investment position that reflect differences between transactions values, which are used to record direct investment financial flows, and the book values on foreign affiliates’ books, which are used to record the position, changes in coverage, and the reclassification of investment positions between direct investment and other investment.
Other equity Equity not in the form of securities.
Other investment
Functional category for primary income and the financial account of the International Transactions Accounts and for the International Investment Position Accounts that is not direct investment, portfolio investment, reserves, or financial derivatives other than reserves. Other investment includes other equity, currency and deposits, loans, insurance technical reserves, trade credit and advances, and special drawing rights allocations.
Other reserve assetsReserve assets other than monetary gold, special drawing rights (SDRs), and reserve position in the IMF. Can include currency and deposits, securities, financial derivatives, and other claims that meet the definition for reserve assets.
Outward direct investment
Also known as U.S. direct investment abroad. In the International Transactions Accounts and the International Investment Position Accounts, outward direct investment includes equity and net debt investments by the U.S. parent in its foreign affiliate(s).
ParentA U.S. parent is a U.S. entity that has a direct investment interest in a foreign business enterprise. A foreign parent is the first entity outside the United States in a U.S. affiliate’s ownership chain that has a direct investment interest in the affiliate.
Partner country Country of residence of the counterparty to an international transaction or financial position. Provides the basis for compiling bilateral statistics.
Portfolio investment
Functional category for primary income and the financial account of the International Transactions Accounts and for the International Investment Position Accounts for transactions and positions involving debt or equity securities, other than those included in direct investment or reserve assets. Securities are debt and equity financial instruments that have the characteristic feature of negotiability.
Positions Fundamental concept for the International Investment Position Accounts that refers to the value of assets or liabilities at a point in time.
Price changeChange in the value of an asset or a liability in the International Investment Position Accounts from the beginning to the end of a period due to changes in the market price of a financial instrument.
Primary incomeMajor component of the current account that represents the return to institutional units for their contribution to the production process or for the provision of financial assets. Consists of investment income and compensation of employees.
ProfitsEarnings of enterprises measured after payment of corporate income taxes during the recording period. Profits are referred to as income on equity in direct investment income in the International Transactions Accounts.
To Contents

Part VIII. Supplemental Information
Bureau of Economic AnalysisU.S. International Economic Accounts: Concepts and Methods
296
Term Definition
Pure interest Interest without a service charge component.
Reference period
The period for which data are collected and/or for which statistics are published. Because data are not typically collected in real time and because statistics are not published in real time, statistics for a given reference period are first published sometime after the end of the reference period.
Reinvested earnings/reinvestment of earnings
Reinvested earnings of affiliates equal total earnings less dividends and withdrawals and are included in the current account within the direct investment component of primary income. Earnings are the parents’ shares in the net income of their affiliates after provision for host country income taxes. Reinvestment of earnings is an offsetting entry to reinvested earnings in the International Transactions Accounts. It represents an addition to owner’s capital and is included in the direct investment component of the financial account.
Repurchase agreements
Transactions involving a sale of securities and a simultaneous agreement to repurchase the same securities or similar securities at a specified date and price. Repurchase agreement liabilities are classified as deposits if they represent liabilities of U.S. deposit-taking institutions to foreign residents; otherwise they are classified as loan liabilities.
Reserve assets
Functional category for primary income and the financial account of the International Transactions Accounts and for the International Investment Position Accounts that consists of claims on nonresidents that are readily available to and controlled by monetary authorities. They can be used to affect the currency exchange rate and for other purposes.
Reserve position in the International Monetary Fund
Reserve asset item that refers to the sum of the reserve tranche purchases that a member of the Fund may draw upon and any indebtedness of the International Monetary Fund that is readily repayable to the member.
Resident
An institutional unit is regarded as resident when it has a center of economic interest in the economic territory of a country. The International Transactions Accounts and the International Investment Position Accounts record transactions and positions between U.S. residents and nonresidents.
Reverse investment
Investment by an affiliate (direct investment enterprise) in its direct investor(s) without meeting the direct investment threshold (10-percent voting interest). Although this investment does not establish a separate direct investment relationship, it is classified in direct investment by virtue of the existing direct investment relationship. This investment usually consists of debt rather than equity.
Revision
The difference between the values of two vintages of a published statistics. Also, prior to 2017 the event during which statistics are revised. (Starting in 2017, this event has been known as an update). The overhaul of the International Transactions Accounts and the International Investment Position Accounts in 2014 is known as the comprehensive revision.
Secondary income
Major component of the current account that presents current transfers between residents and nonresidents. Unlike an exchange, a transfer is a transaction that provides a good, service, or asset without a corresponding return of economic value (quid pro quo).
Sectors
Groupings of institutional units that have similar economic objectives and behavior for the purpose of providing analytically useful aggregates of economic statistics. For the U.S. International Economic Accounts, sectors include central bank, deposit-taking institutions except central bank, other financial institutions, nonfinancial institutions except general government (including households and nonprofit institutions serving households), and general government.
To Contents
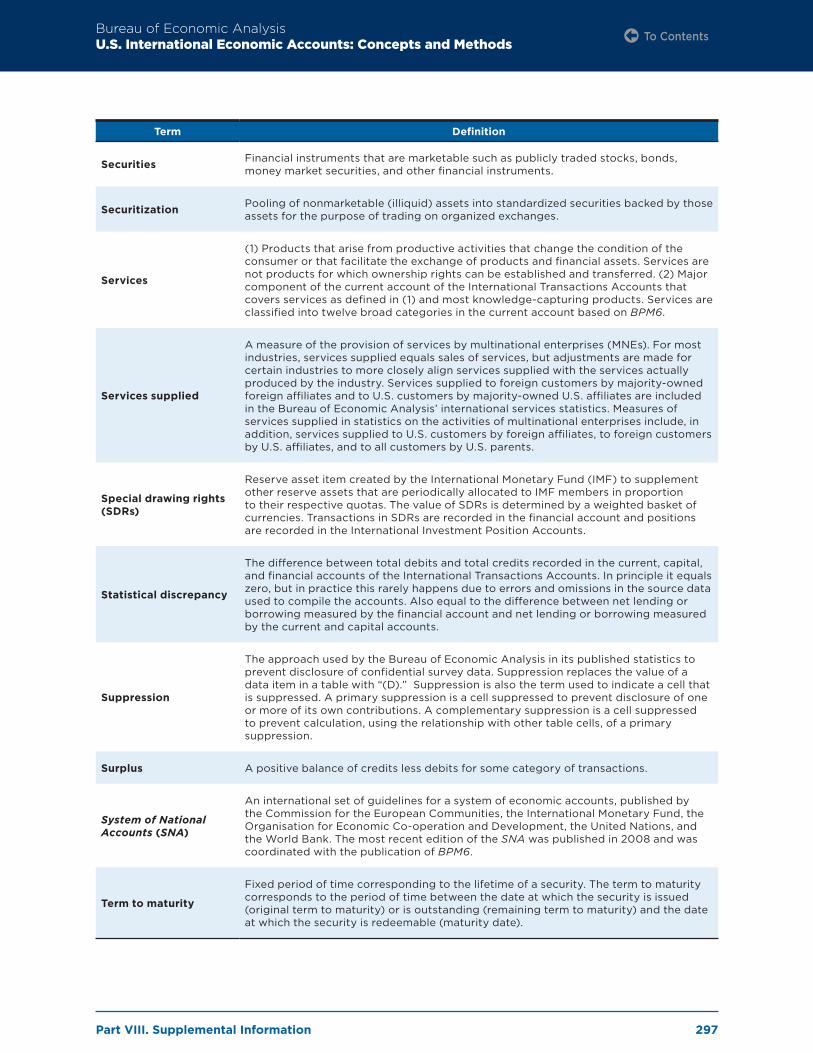
Part VIII. Supplemental Information
Bureau of Economic AnalysisU.S. International Economic Accounts: Concepts and Methods
297
Term Definition
Securities Financial instruments that are marketable such as publicly traded stocks, bonds, money market securities, and other financial instruments.
Securitization Pooling of nonmarketable (illiquid) assets into standardized securities backed by those assets for the purpose of trading on organized exchanges.
Services
(1) Products that arise from productive activities that change the condition of the consumer or that facilitate the exchange of products and financial assets. Services are not products for which ownership rights can be established and transferred. (2) Major component of the current account of the International Transactions Accounts that covers services as defined in (1) and most knowledge-capturing products. Services are classified into twelve broad categories in the current account based on BPM6.
Services supplied
A measure of the provision of services by multinational enterprises (MNEs). For most industries, services supplied equals sales of services, but adjustments are made for certain industries to more closely align services supplied with the services actually produced by the industry. Services supplied to foreign customers by majority-owned foreign affiliates and to U.S. customers by majority-owned U.S. affiliates are included in the Bureau of Economic Analysis’ international services statistics. Measures of services supplied in statistics on the activities of multinational enterprises include, in addition, services supplied to U.S. customers by foreign affiliates, to foreign customers by U.S. affiliates, and to all customers by U.S. parents.
Special drawing rights (SDRs)
Reserve asset item created by the International Monetary Fund (IMF) to supplement other reserve assets that are periodically allocated to IMF members in proportion to their respective quotas. The value of SDRs is determined by a weighted basket of currencies. Transactions in SDRs are recorded in the financial account and positions are recorded in the International Investment Position Accounts.
Statistical discrepancy
The difference between total debits and total credits recorded in the current, capital, and financial accounts of the International Transactions Accounts. In principle it equals zero, but in practice this rarely happens due to errors and omissions in the source data used to compile the accounts. Also equal to the difference between net lending or borrowing measured by the financial account and net lending or borrowing measured by the current and capital accounts.
Suppression
The approach used by the Bureau of Economic Analysis in its published statistics to prevent disclosure of confidential survey data. Suppression replaces the value of a data item in a table with “(D).” Suppression is also the term used to indicate a cell that is suppressed. A primary suppression is a cell suppressed to prevent disclosure of one or more of its own contributions. A complementary suppression is a cell suppressed to prevent calculation, using the relationship with other table cells, of a primary suppression.
Surplus A positive balance of credits less debits for some category of transactions.
System of National Accounts (SNA)
An international set of guidelines for a system of economic accounts, published by the Commission for the European Communities, the International Monetary Fund, the Organisation for Economic Co-operation and Development, the United Nations, and the World Bank. The most recent edition of the SNA was published in 2008 and was coordinated with the publication of BPM6.
Term to maturity
Fixed period of time corresponding to the lifetime of a security. The term to maturity corresponds to the period of time between the date at which the security is issued (original term to maturity) or is outstanding (remaining term to maturity) and the date at which the security is redeemable (maturity date).
To Contents

Part VIII. Supplemental Information
Bureau of Economic AnalysisU.S. International Economic Accounts: Concepts and Methods
298
Term Definition
Trade credit and advances
Credit extended directly by suppliers of goods and services to their customers and advances for work in progress and prepayment by customers for goods and services not yet provided.
Trade in potentially ICT-enabled services
A subset of trade in services. Potentially ICT-enabled services are services that can predominantly be delivered remotely over information and communications technology (ICT) networks. Potentially ICT-enabled services include ICT services themselves.
Transaction
An exchange or transfer of value between two institutional units that occurs by mutual agreement or by law. Transactions are classified according to the nature of the economic value provided—namely, goods or services, primary income, secondary income, capital transfers, nonproduced nonfinancial assets, financial assets, or liabilities.
Transactor principle
Type of geographic attribution in the International Economic Accounts whereby financial assets and liabilities of the compiling economy are attributed to the country of residence of the nonresident counterparty to the transaction. An alternative approach is the debtor-creditor principle.
Transfer pricing Valuation of transactions between affiliated parties. Transfer prices often differ from market prices.
Translation adjustments
A type of valuation adjustment to investment positions that results from changes in exchange rates used to translate foreign-currency-denominated assets and liabilities into U.S. dollars.
Treasury International Capital (TIC) reporting system
System of monthly, annual, and benchmark surveys conducted by the Federal Reserve Bank of New York on behalf of the U.S. Department of the Treasury to collect cross-border transactions and positions for financial assets and liabilities. Major data source for both the International Transactions Accounts and the International Investment Position Accounts.
Ultimate beneficial owner (UBO)
Entity that ultimately owns or controls and thus ultimately derives the benefits and assumes the risks from owning or controlling an affiliate. The UBO is often but not always the same as the foreign or U.S. parent.
Unaffiliated trade Resident-nonresident trade between two entities that do not have a direct investment relationship with one another.
Universe estimation
A process used by the Bureau of Economic Analysis in constructing statistics from surveys it conducts in which a complete microdata set is constructed for the known survey universe. In universe estimation, imputations or other estimates are generated for all survey nonresponses and nonsurveyed units. Universe estimation allows statistics to be compiled by simple addition of observations in the constructed data set.
Update
To revise a published statistic with the intent of providing a more accurate estimate, or a statistic or set of statistics that has been revised. Also refers to the event during which statistics are revised—especially the annual update. Statistics are updated to incorporate newly available or revised source data (including benchmark surveys), new data sources, improved estimation methodologies, and new definitions. Presentational and classificational improvements to the accounts are typically introduced in an annual update. Prior to 2017, annual updates were known as annual revisions.
To Contents

Part VIII. Supplemental Information
Bureau of Economic AnalysisU.S. International Economic Accounts: Concepts and Methods
299
Term Definition
U.S. direct investment abroad
An investment relationship characterized by ownership or control, directly or indirectly, by one U.S. resident (the U.S. parent) of at least 10 percent voting ownership of a foreign business enterprise (the foreign affiliate). Also known as outward direct investment.
ValuationThe determination of asset, liability, and transaction values. Different methods of valuation (transaction value, market price, issue price, book value, maturity value, etc.) often reflect applicable accounting principles, legal restrictions, and other factors.
Value added
A measure of the value of production. Value added represents the contribution of labor and capital to the production process. In the U.S. statistics on activities of multinational enterprises, value added is derived as the sum of the costs incurred (except for intermediate inputs) and the profits earned in production. It can also be derived as gross output (revenue) less intermediate inputs (purchased goods and services used in production).
To Contents

(301) 278-9004 [email protected] www.bea.gov @bea_news