u.s. lighting market characterization: volume ii -...
TRANSCRIPT

U.S. Lighting Market Characterization
Volume II: Energy Efficient Lighting Technology Options
Prepared for:
Building Technologies Program Office of Energy Efficiency and Renewable Energy
U.S. Department of Energy
Prepared by:
Eugene Hong, L.C. Louise A. Conroy
Michael J. Scholand
Navigant Consulting, Inc. 1801 K Street, NW, Suite 500
Washington, DC 20006
September 30, 2005

Comments from the U.S. Department of Energy’s Lighting Research & Development Manager
This report on Energy-Efficient Lighting Technology Options (the U.S. Lighting Market Characterization Volume II) provides a snapshot of the technical and market status of about 50 technology options. For each option, the report includes a technology description and information on technology maturity, energy savings potential, and more. Each option has a reference section for further investigation. The fifty options provide an initial screening of a large number of options, and as such, may require further evaluation before decisions can be made. With a very wide purview of options, many knowledgeable people from the lighting community contributed their time and thoughts to enrich the content and direction of this report. See the Acknowledgements for a complete listing of report contributors. We are appreciative of their insightful comments. The assembly, merging, and documenting of these inputs was carefully facilitated by Navigant Consulting, who also provided some assessment of the options. The findings of Volume II do not necessarily represent the Department’s top choices of lighting options for future development. Instead, the findings point to opportunities that contributing stakeholders believe have the greatest potential to reduce lighting energy consumption. The options cover a range of programmatic actions: research, product development, demonstration, market support activities, and standards development. Some of these options fall within the mission of the Lighting Research and Development area of the Building Technologies Program, which sponsored this analysis. Some options will fit better within the commercialization support activities of the Office of Energy Efficiency and Renewable Energy, and still others appear to have a fit with other agencies, such as the National Science Foundation or the National Institute of Health.
James R. Brodrick Manager

i
Disclaimer This report was prepared as an account of work sponsored by an agency of the United States Government. Neither the United States Government, nor any agency thereof, nor any of their employees, nor any of their contractors, subcontractors, or their employees, makes any warranty, express or implied, or assumes any legal liability or responsibility for the accuracy, completeness, or usefulness of any information, apparatus, product, or process disclosed, or represents that its use would not infringe privately owned rights. Reference herein to any specific commercial product, process, or service by trade name, trademark, manufacturer, or otherwise, does not necessarily constitute or imply its endorsement, recommendation, or favoring by the United States Government or any agency, contractor, or subcontractor thereof. The views and opinions of authors expressed herein do not necessarily state or reflect those of the United States Government or any agency thereof.
Copies of this Report Electronic (PDF) copies of this report are available to the public from:
National Technical Information Service (NTIS) U.S. Department of Commerce 5285 Port Royal Road Springfield, VA 22161 Tel: 1-800-553-6847 Web: www.ntis.gov
Building Technologies Program
U.S. Department of Energy Web: www.eren.doe.gov/buildings/documents/
Comments
The Department of Energy is interested in receiving input on the material presented in this report. If you have suggestions of better data sources and/or comments on the findings presented in this report, please submit your feedback to Dr. James R. Brodrick by March 30, 2006 at the following address:
James R. Brodrick, Ph.D. Program Manager – Lighting Research and Development EE-2J / Forrestal Building U.S. Department of Energy 1000 Independence Avenue SW Washington, D.C. 20585

ii
Acknowledgments
The authors would like to acknowledge the valuable support, guidance, and input offered in the preparation of this report. James R. Brodrick, Ph.D., of the U.S. Department of Energy, Building Technologies Program provided oversight of the assignment, helping to shape the approach, execution, and documentation. The authors are also grateful to the following list of experts for their respective contributions, guidance, and review, which proved invaluable in preparing this report.
Name Company David Bay Osram Sylvania Rolf Bergman General Electric Lighting Peter Bleasby Osram Sylvania Howard Brandston Illuminating Engineering Society of North America Tim Brumleve Advanced Lighting Technologies, Inc Voitek Byszewski Consultant John Davenport Fiberstars Anil Duggal General Electric Ian Ferguson Georgia Institute of Technology Ronald Gibbons Virginia Tech Rita Harrold Illuminating Engineering Society of North America Joe Howley General Electric Lighting Steve Johnson Lawrence Berkeley National Laboratory Scott Jordan Square D Jeannine Komonosky Pacific Gas & Electric Mike Krames Lumileds Sarah Kurtz National Renewable Energy Laboratory Frank Latassa Philips Lighting Les Levine Consultant Alan Lewis NE College of Optometry Brian Liebel AfterImage and Space Scott Mangum Honeywell Terry McGowan General Electric Lighting Steve Nadel American Council for an Energy Efficiency Economy N. Narendran Lighting Research Center Yoshi Ohno National Institute of Standards and Technology David Peterson Watt Stopper Edward Petrow Lincoln Technical Services Kyle Pitsor National Electrical Manufacturers Association Mark Rea Lighting Research Center Vic Roberts General Electric Kurt Riesenberg National Electrical Manufacturers Association Bill Ryan Philips Lighting Sameer Sodhi Osram Sylvania Michael Stein Consultant Milan Stolka Consultant David Strip Eastman Kodak Tim Summer General Electric Lighting Christopher Summers Georgia Institute of Technology Jeffrey Tsao Sandia National Laboratories Dale Work Philips Lighting

iii
D.C. 20585-0121
EXECUTIVE SUMMARY
The Lighting Market Characterization is a multiyear study to evaluate light sources in the United States, and identify opportunities for saving energy. Sponsored by the United States Department of Energy’s (DOE) Building Technologies Program (BT), the Lighting Market Characterization consists of two phases. Phase one involved evaluating building audit data and preparing a national inventory and energy consumption estimate. This phase was completed in September 2002, with the findings published in a report on DOE’s website.1
This report, U.S. Lighting Market Characterization Volume II: Energy Efficient Lighting Technology Options contains the findings from phase two, which looks broadly at energy-efficient options in lighting and identifies leading opportunities. This report presents fifty-two lighting technology options that promise to save energy or demonstrate energy savings potential. These fifty-two lighting technologies were selected by a group of lighting experts from a preliminary list of 209 lighting technology options. This report does not represent DOE’s top-choices of lighting research and development, instead it encompasses the opportunities that are promising measures to reduce lighting energy consumption.
The three main categories for the fifty-two technology options are light sources, utilization, and human factors. The largest category, light sources, contains thirty-six options. These options are subdivided into five categories: incandescent, fluorescent, high intensity discharge (HID), light-emitting diode (LED), and organic light-emitting diode (OLED). The second category, utilization, includes fourteen options, which are subdivided into three categories: fixture, distribution and controls. The third category, human factors, consists of two options, which are part of visual performance and impacts. Table ES-1 presents the category/subcategory breakdown and the number of technology options within each subcategory.
Table ES-1: Breakdown of the Fifty-two Technology Options into General Categories
Description Number of Technology Options
Incandescent 2
Fluorescent 5
HID 10
LED 12
Light Sources
OLED 7
Fixtures 6
Distribution 3 Utilization
Controls 5
Human Factors Visual Performance and Impacts
2
Total 52
1 A PDF copy of the U.S. Lighting Market Characterization Volume I: National Lighting Inventory and Energy Consumption Estimate is available on the following website: http://www.netl.doe.gov/ssl/publications

iv
For each of the fifty-two technology options, this report provides a brief technical description, describes the energy savings principle, estimates the technical-potential energy savings, discusses promising applications and provides other details and information relevant to the technology. This report draws from many sources, including lighting product catalogs, scientific research papers, energy-efficient lighting studies, and input from lighting manufacturers and researchers.
The report does not assess the relative technical risk or the resources required to make progress in each technical area. The energy savings estimate represents the full technical potential of the technology. Each option is treated independently, and the potential effect of the development of one option on others is not considered. Light Sources
The light source chapter is subdivided into five basic technologies: incandescent, fluorescent, HID, and emerging organic and inorganic solid-state light (SSL) sources. The chapter presents two incandescent technology options, five fluorescent, ten HID, twelve inorganic, and seven organic SSL technology options.
Table ES-2 presents the two technology options selected by the lighting experts for incandescent light sources.
Table ES-2. Summary Table for Light Sources: Incandescent
Description Technology Maturity Stage Technical Potential Energy Savings
Higher Temperature Incandescent Light Sources
Applied Research 1.5 quads
Selective (and Pseudo-Selective) Radiators
Basic Science Research Applied Research, Commercialization & Sales
2.8 quads
These technology options for incandescent light sources can be improved by increasing the operating temperature or by confining the emission of radiation to the visible spectrum. For instance, the first technology option in Table ES-2, Higher Temperature Incandescent Light Sources, has the potential to save 1.5 quads of energy per year. Novel materials would allow incandescent lamps to operate at higher blackbody temperatures, resulting in a more efficient lamp. This technology option falls within the applied research stage. The second technology option, Selective (and Pseudo-Selective) Radiators, has the potential to save 2.8 quads annually. Selective radiators tailor the spectrum of the emission to maximize emission in the visible spectrum. This technology option is transitioning from Basic Science Research to Applied Research, and is also commercially available in halogen infrared reflector (HIR) lamps.
Table ES-3 presents five technology options relating to improving the efficacy of fluorescent light sources.

v
Table ES-3: Summary Table for Light Sources: Fluorescent
Description Technology Maturity Stage Technical Potential Energy Savings
Fluorescent Electrode Research Advanced Development 0.3 quad
Small Diameter Lamps Commercialization & Sales 0.6 quad
Dimmable Instant-Start Ballasts Product Demonstration
Commercialization & Sales 0.4 quad
Efficient Ballasts Product Demonstration 0.01 quad
Multi-Photon Phosphors Basic Science Research Applied
Research 3.5 quads
These technology options focus on: reducing electrode deterioration and sputtering, the development of small diameter lamps, increasing the range of dimming of certain fluorescent technologies to encourage their use with lighting controls, the elimination of unnecessary electrode heating, and increasing phosphor efficiency. Some of these technologies such as small diameter lamps and dimmable instant-start ballasts are already at or are very near the commercialization technology maturity stage. The highest energy savings for fluorescent light sources is multi-photon phosphors, but this technology option also has the highest technical risk as it is at a very low relative level of technical maturity.
Table ES-4 presents ten technology options relating to improving the performance of HID light sources.
Table ES-4: Summary Table for Light Sources: HID
Description Technology Maturity Stage Technical Potential Energy Savings
HID Restrike Issues Advanced Development 0.6 quad
HID Integral Ballast Advanced Development 0.7 quad
HID Low-Wattage Engineering Development 0.7 quad
HID Novel Gas Applied Research 0.7 quad
HID Ceramic Arc Tube Research Commercialization & Sales 1.2 quads
HID Electrode Research Applied Research Exploratory
Development 0.2 quad
HID Electrodeless Lamp Engineering Development 0.6 quad
Metal Halide Electronic Ballast (HF)Engineering Development Commercialization & Sales
0.2 quad
HID Dimmable Ballast Engineering Development Commercialization & Sales
0.4 quad
Sulfur Lamp Advanced Development 0.8 quad These technology options focus on: improving the starting/re-start/warm-up characteristics of HID lamps to enable competition with less efficient technologies, increasing the range of dimming to allow use with lighting controls, improving the range of available wattages, and electrode research to improve lumen maintenance. Many of the HID technology options fall in or around the middle of the technology maturity stage continuum. The option with the highest technical potential energy savings is also the least

vi
developed on the technology maturity stage, and therefore has a higher degree of risk associated with whether those energy savings could be realized.
Table ES-5 presents twelve technology options relating to improving the efficacy of LEDs. The technical potential energy savings is difficult to quantify for these technology options because many of them are research activities on components of the LED system which are in a very early stage of the technology maturity continuum.
Table ES-5: Summary Table for Light Sources: LED
Description Technology Maturity Stage Technical Potential Energy Savings
Reflector Lamp Exploratory Development Product
Demonstration 0.2 quad
Integrated White LED Package Applied Research Product
Demonstration 1.1 quads
White-Light Systems Advanced Development 1.1 quads
High Lumen Package Applied Research 1.1 quads
Device Electronics Applied Research Product
Demonstration 0.2 quads
Substrate Research Applied Research 0.6 quad
Buffer Research Applied Research 0.6 quad
Novel Epimaterials Applied Research 0.6 quad
Etching, Chip-Shaping, and Texturing Applied Research 0.6 quad
Configuration Research Applied Research 0.6 quad
Phosphor Materials Applied Research
Commercialization & Sales 0.6 quad
Optical Research Tools Engineering Development n/a The LED light source technology options focus on: reducing defect density by improving buffers and substrates, improving phosphors, creating high lumen packages, improving optical design, and reducing the cost to make LEDs competitive with conventional light sources. Several of the LED technology options are in the applied research stage of technology maturity.
Table ES-6 presents seven technology options relating to improving the efficacy of organic light-emitting diodes (OLEDs). As with LEDs, the technical potential energy savings is difficult to quantify for the OLED technology options because many of them are research activities on components of the OLED system which are in a very early stage of the technology maturity continuum.

vii
Table ES-6: Summary Table for Light Sources: OLED
Description Technology Maturity Stage Technical Potential Energy Savings
White-Light Systems Applied Research 1.1 quads
Manufacturing Issues Applied Research 0.6 quads
Novel Structures Applied Research 0.6 quads
Degradation and Failure Processes Applied Research 0.6 quads
Light Extraction Issues Applied Research 0.6 quads
Large Area Current Distribution Applied Research 0.6 quads
Photonic Emission from Triplets Applied Research 0.6 quads The OLED technology options focus on: improving the operating life by gaining a better understanding of its physics and degradation processes, improving internal and external quantum efficiencies, and reducing the cost to make OLEDs competitive with conventional light sources. Due to the fact that there are no OLED light sources at or near commercialization, all the technology options identified for this light source are in the applied research stage of technology maturity. Utilization
The utilization chapter is disaggregated into three subcategories: fixtures, distribution, and controls. In total, there are six fixture, three distribution, and five controls technology options.
Table ES-7 presents six technology options relating to developing more efficient lighting fixtures. These technology options focus on: integrating sensors into luminaires, designing fixtures to exploit the characteristics of LEDs in appropriate applications, and designing light fixtures that can be used off-grid.

viii
Table ES-7: Summary Table for Utilization: Fixtures
Description Technology Maturity Stage Technical Potential Energy Savings
Integrated Photosensor Luminaire Product Demonstration
Commercialization & Sales 0.9 quad
Integrated Occupancy Sensor Luminaire
Product Demonstration Commercialization & Sales
0.9 quad
SSL Signage Fixtures Commercialization & Sales 0.1 quad
LED Fixture Efficiency Engineering Development Product
Demonstration 0.6 quad
LED Fixtures for Monochromatic Illumination
Product Demonstration Commercialization & Sales
0.5 quad
Off-Grid Luminaires Product Demonstration 0.6 quad
Table ES-8 presents three technology options relating to improving the distribution of light. These technology options focus on: novel methods of light distribution, improving fiber optic performance and coupling to a distributive light source.
Table ES-8: Summary Table for Utilization: Distribution
Description Technology Maturity Stage Technical Potential Energy Savings
Street Markers Commercialization & Sales 0.1 quad
Fiber Optic for General Illumination Commercialization & Sales 0.1 quad
Light Source Coupling to Optical Fiber
Product Demonstration Commercialization & Sales
0.1 quad
Table ES-9 presents five technology options relating to improving the utilization of control. These technology options focus on: the standardization of lighting control systems and their interface with building control systems, and improving the ease of commissioning of control systems, and other attributes that encourage use and promote rapid adoption.

ix
Table ES-9: Summary Table for Utilization: Controls
Description Technology Maturity Stage Technical Potential Energy Savings
Robust Controls Algorithms Product Demonstration
Commercialization & Sales 0.1 quad
Personal Lighting Controls Product Demonstration
Commercialization & Sales 0.7 quad
Standard Protocols for Lighting Products
Product Demonstration Commercialization & Sales
1.3 quads
Standardized Building Automation Systems
Product Demonstration Commercialization & Sales
1.6 quads
Standardized Wireless Controls Product Demonstration
Commercialization & Sales 1.6 quads
Human Factors
It is important to understand the physical, physiological, and perceptual characteristics of the visual system. Table ES-10 presents two technology options relating to improving visual performance and impact. These options focus on: developing tailored light sources to maximize the effectiveness of the human visual system, and metrics to compare the performance of disparate light sources for specific application.
Table ES-10: Summary Table for Human Factor: Visual Performance and Impact
Description Technology Maturity Stage Technical Potential Energy Savings
Scotopic Enhanced Lighting Commercialization & Sales 0.4 quad
New Metrics: CRI and Light Output Commercialization & Sales n/a Overall, this report identifies areas where new technologies could be developed and where incremental improvements in existing technologies could be targeted. Through the data provided in the technical potential energy savings, technical maturity, price, and performance information, non-energy benefits, and other information, the reader can make an assessment of which areas would be their preferred lighting R&D options. The Department of Energy will use this resource, in conjunction with other material and expert opinion, to prioritize and drive its lighting research and development activities.

x

xi
TABLE OF CONTENTS
1. Introduction.................................................................................................. 1
1.1. Department of Energy’s Lighting Research and Development Program .................... 1
1.2. National Lighting Energy Consumption.................................................................... 1
1.3. Objective and Purpose of this Report ........................................................................ 4
2. Methodology ................................................................................................. 5
2.1. Topics for Each Technology Option.......................................................................... 6 2.1.1. Technology Description and Energy Saving Principle..................................... 6 2.1.2. Technical Maturity Stages .............................................................................. 6 2.1.3. Issues with Existing Lighting Products and Systems ....................................... 7 2.1.4. Technical Potential and Primary Energy Consumption Impact ........................ 7 2.1.5. Performance Information: Data and Source..................................................... 8 2.1.6. Cost Information: Data and Source ................................................................. 8 2.1.7. Non-Energy Benefits of Technology............................................................... 9 2.1.8. Notable Developers/Manufacturers of Technology ......................................... 9 2.1.9. Peak Demand Impact Potential ....................................................................... 9 2.1.10. Promising Applications .................................................................................. 9 2.1.11. Perceived Barriers to Market Adoption........................................................... 9 2.1.12. Data Gaps and Next Steps............................................................................... 9
3. Technologies to Improve Performance of Light Sources ......................... 10
3.1. Incandescence and Selective Radiators ................................................................... 11 3.1.1. Higher Temperature Incandescent Light Sources .......................................... 12 3.1.2. Selective (and Pseudo-Selective) Radiators................................................... 17
3.2. Fluorescent ............................................................................................................. 22 3.2.1. Fluorescent Electrode Research .................................................................... 24 3.2.2. Small Diameter Lamps ................................................................................. 29 3.2.3. Dimmable Instant-Start Ballasts.................................................................... 33 3.2.4. Efficient Ballasts .......................................................................................... 37 3.2.5. Multi-Photon Phosphors ............................................................................... 41
3.3. High-Intensity Discharge (HID).............................................................................. 45 3.3.1. HID Restrike Issues ...................................................................................... 46 3.3.2. HID Integral Ballast...................................................................................... 50 3.3.3. HID Low-Wattage........................................................................................ 55 3.3.4. HID Novel Gas............................................................................................. 60 3.3.5. HID Ceramic Arc Tube Research ................................................................. 65 3.3.6. HID Electrode Research ............................................................................... 70 3.3.7. HID Electrodeless Lamp............................................................................... 75 3.3.8. Metal Halide Electronic Ballast (HF)............................................................ 79 3.3.9. HID Dimmable Ballast ................................................................................. 83 3.3.10. Sulfur Lamp ................................................................................................. 87

xii
3.4. Light-Emitting Diode (LED)................................................................................... 92 3.4.1. Reflector Lamp............................................................................................. 93 3.4.2. Integrated White LED Package..................................................................... 97 3.4.3. White-Light Systems ...................................................................................101 3.4.4. High Lumen Package...................................................................................104 3.4.5. Device Electronics.......................................................................................107 3.4.6. Substrate Research.......................................................................................110 3.4.7. Buffer Research...........................................................................................115 3.4.8. Novel Epimaterials ......................................................................................119 3.4.9. Etching, Chip-Shaping, and Texturing .........................................................122 3.4.10. Configuration Research ...............................................................................126 3.4.11. Phosphor Materials ......................................................................................129 3.4.12. Optical Research Tools................................................................................132
3.5. Organic Light-Emitting Diode (OLED)..................................................................135 3.5.1. White-Light Systems ...................................................................................137 3.5.2. Manufacturing Issues...................................................................................141 3.5.3. Novel Structures..........................................................................................145 3.5.4. Degradation and Failure Processes...............................................................149 3.5.5. Light Extraction Issues ................................................................................153 3.5.6. Large Area Current Distribution ..................................................................157 3.5.7. Photonic Emission from Triplets..................................................................161
4. Utilization ..................................................................................................166
4.1. Fixture ...................................................................................................................167 4.1.1. Integrated Photosensor Luminaire................................................................168 4.1.2. Integrated Occupancy Sensor Luminaire......................................................173 4.1.3. SSL Signage Fixtures ..................................................................................177 4.1.4. LED Fixture Efficiency ...............................................................................182 4.1.5. LED Fixtures for Monochromatic Applications ...........................................186 4.1.6. Off-Grid Luminaires....................................................................................192
4.2. Distribution ...........................................................................................................196 4.2.1. Street Markers .............................................................................................197 4.2.2. Fiber Optic for General Illumination............................................................201 4.2.3. Light Source Coupling to Optical Fiber .......................................................207
4.3. Controls.................................................................................................................212 4.3.1. Robust Controls Algorithms ........................................................................213 4.3.2. Personal Lighting Controls ..........................................................................216 4.3.3. Standard Protocols for Lighting Products.....................................................220 4.3.4. Standardized Building Automation Systems ................................................224 4.3.5. Standardized Wireless Controls ...................................................................228
5. Human Factors..........................................................................................232
5.1. Visual Performance ...............................................................................................233 5.1.1. Spectrally Enhanced Lighting ......................................................................234

xiii
5.1.2. New Metrics: CRI and Light Output ............................................................240
6. Summary ...................................................................................................246
6.1. Light Sources.........................................................................................................247
6.2. Utilization..............................................................................................................252
6.3. Human Factors ......................................................................................................255
Appendix A. Technology Option Voting Results........................................256

xiv
LIST OF FIGURES
Figure 1-1: U.S. Primary Energy Consumption for Lighting by Sector, 2001 ............................. 3 Figure 1-2: Lighting Energy Consumption by Sector & Source, 2001 ........................................ 3 Figure 2-1: Technology Maturity Stage Continuum .................................................................... 6 Figure 2-2: Flowchart of Technical Potential Energy Savings Calculation .................................. 8
LIST OF TABLES
Table 1-1: U.S. National Energy Use for Lighting, Disaggregated by Sector............................... 2 Table 2-1: Topics and Questions for Each Technology Option.................................................... 5 Table 3-1: Technical Potential Energy Savings of Higher Temperature Incandescent Sources... 13 Table 3-2: Current Prices of Typical Incandescent Lamps......................................................... 14 Table 3-3: Technical Potential Energy Savings of Selective Radiators ...................................... 18 Table 3-4: Current Prices of Typical Incandescent Lamps......................................................... 19 Table 3-5: Tube Diameter for Typical Linear Fluorescent Lamps.............................................. 22 Table 3-6: Technical Potential Energy Savings of Electrode Materials Research....................... 25 Table 3-7: Power, Life, Light Output, and Efficacy for Fluorescent Lamps............................... 25 Table 3-8: Price Comparison for Fluorescent Lamps................................................................. 25 Table 3-9: Technical Potential Energy Savings for Small Diameter Lamps ............................... 30 Table 3-10: Power, Lumen Output, CRI, and Efficiency for Fluorescent Lamps ....................... 30 Table 3-11: Luminous Intensity of Small Diameter Lamps in a Typical 2'x 2' Troffer ............... 30 Table 3-12: Price of Linear Fluorescent Lamps with Rare-Earth Phosphors .............................. 31 Table 3-13: Technical Potential Energy Savings of Dimmable Instant-Start Ballasts................. 34 Table 3-14: Ballast Price, by Type ............................................................................................ 34 Table 3-15: Technical Potential Energy Savings of Energy Efficient Ballasts ........................... 38 Table 3-16: Ballast Price, by Type ............................................................................................ 38 Table 3-17: Technical Potential Energy Savings of Multi-photon Phosphors............................. 42 Table 3-18: Performance of Fluorescent Lamps with Rare-Earth Phosphors ............................. 42 Table 3-19: Price of Fluorescent Lamps with Rare Earth Phosphors, T5, T8, and T12............... 42 Table 3-20: Technical Potential Energy Savings of HID with Short Restrike/Warm-up............. 47 Table 3-21:General Start and Restrike Times of HID Lamps .................................................... 47 Table 3-22: Restrike/Warm-up Characteristics of HPS Lamp with Instant Restrike Ignitor ....... 48 Table 3-23: Technical Potential Energy Savings of HID Integral Ballast................................... 51 Table 3-24: Performance of Sample Base and Substitute Lamps ............................................... 51 Table 3-25: Price of Self-Ballasted MV Lamps and Substitute Lamps....................................... 52 Table 3-26: Technical Potential Energy Savings of Low-Wattage MH Lamps .......................... 56 Table 3-27: Performance of Low Wattage MH Lamp vs. Equivalent Incandescent Technology 56 Table 3-28: Halogen Lamp vs. Low Wattage HID Source for Automobile Headlights .............. 57 Table 3-29: Price of Low Wattage HID Lamp vs. Equivalent Incandescent Technology ........... 57 Table 3-30: Technical Potential Energy Savings Potential of HID Novel Gas ........................... 61 Table 3-31: Supplementary Technical Potential Energy Savings for HID Novel Gas ................ 61 Table 3-32: Performance Specifications of Competitive Technologies ...................................... 62 Table 3-33: Cost of Competitive Technologies ......................................................................... 62

xv
Table 3-34: Technical Potential Energy Savings of Ceramic Metal Halide ................................ 66 Table 3-35: Lamp Wattage, Arc Tube Type, Life, Lumen Output, CRI, and Efficacy ............... 67 Table 3-36: Price Comparison of Ceramic and Silica MH Lamps.............................................. 67 Table 3-37: Technical Potential Energy Savings of HID Electrode Advancement ..................... 71 Table 3-38: Lamp Type, Start Time, Restrike Time, and Percent Dimmable ............................. 71 Table 3-39: Performance Specifications for Several Types of HID Lamps ................................ 72 Table 3-40: Technical Potential Energy Savings of Electrodeless HID Systems ........................ 76 Table 3-41: Performance Specifications for Conventional Metal Halide Lamps ........................ 76 Table 3-42: Price Information for Conventional Metal Halide Lamps ....................................... 76 Table 3-43: Technical Potential Energy Savings of MH Electronic Ballasts (HF)...................... 80 Table 3-44: Performance Information for High Frequency, Pulse Start, and MH Lamps ........... 80 Table 3-45: Technical Potential Energy Savings of HID Dimmable Ballasts ............................. 84 Table 3-46: Performance Information for High Frequency, Pulse Start, and MH Lamps ........... 84 Table 3-47: General Warm-up and Restrike Time, and Dimming Levels of HID Lamps ........... 84 Table 3-48: Technical Potential Energy Savings of Molecular Discharge Lamps ...................... 88 Table 3-49: Efficacy and Life for MV, MH and Sulfur Lamps .................................................. 88 Table 3-50: Potential Energy Savings of OLED Technology................................................... 138 Table 4-1: Price List for Existing Fluorescent Fixtures............................................................ 170 Table 4-2: Price List for Existing Fluorescent Fixtures............................................................ 174 Table 4-3: Energy Savings Potential of LED Signage Fixtures................................................ 178 Table 4-4: A Study on the Lumen Output per Meter for LED and Neon.................................. 178 Table 4-5: Energy and Cost Savings of GE Tetra System over a Neon System per Year ......... 179 Table 4-6: Performance of Various LED Fixtures ................................................................... 183 Table 4-7: Prices of Various LED Fixtures ............................................................................. 183 Table 4-8: Energy Consumption and Savings in 2002 of Applications Evaluated .................... 187 Table 4-9: Potential and Cumulative Energy Savings of Applications Evaluated..................... 188 Table 4-10: LED Specifications for Railway, Aviation, and Bridge Navigation Lights............ 189 Table 4-11: LED Performance Specifications for Railway Signals and Traffic Signals ........... 189 Table 4-12: Price of LED Products for Color-Critical Applications......................................... 190 Table 4-13: Total Cost of Small Wind Turbine Power System ................................................ 194 Table 4-14: Price for Cat's Eye Reflectors and Solar Powered LED Roadway Studs ............... 198 Table 4-15: Light Output Comparison, Incandescent Reflector Lamp versus Fiber Optic ........ 202 Table 4-16: Price Comparison of Incandescent Reflector Lamp versus Fiber Optic................. 203 Table 4-17: Price per Foot of Fiber Optic Cable for Lighting .................................................. 203 Table 4-18: Technical Potential Energy Savings of Self-Commissioning Algorithms.............. 214 Table 4-19: Technical Potential Energy Savings of Personal Controls Over Lighting.............. 217 Table 4-20: Price Information, Dimming Ballast vs. Non-Dimming Ballast ............................ 221 Table 4-21: Technical Potential Energy Savings of Building Controls Systems....................... 225 Table 4-22: Energy Savings Potential of Wireless Control Standards...................................... 229 Table 5-1: S/P Ratios of Common Light Sources .................................................................... 235 Table 5-2: Photopic and Scotopic Efficacy for Linear Fluorescent Lamps............................... 235 Table 5-3: Price of Lamps, Spectrally Enhanced vs. Non-Spectrally Enhanced ....................... 236 Table 5-4: S/P Ratios of Common Light Sources .................................................................... 242 Table 5-5: Photopic and Scotopic Efficacy for Linear Fluorescent Lamps............................... 242 Table 5-6: Price of Lamps, Scotopically Enhanced vs. Non-Scotopically Enhanced................ 242 Table 6-1: Summary Table for Light Source: Incandescent ..................................................... 247

xvi
Table 6-2: Summary Table for Light Sources: Fluorescent...................................................... 248 Table 6-3: Summary Table for Light Sources: HID................................................................. 249 Table 6-4: Summary Table for Light Sources: LED ................................................................ 250 Table 6-5: Summary Table for Light Sources: OLED ............................................................. 251 Table 6-6: Summary Table for Utilization: Fixtures ................................................................ 252 Table 6-7: Summary Table for Utilization: Distribution .......................................................... 253 Table 6-8: Summary Table for Utilization: Controls ............................................................... 253 Table 6-9: Summary Table for Human Factor: Visual Performance ........................................ 255

xvii
LIST OF ACRONYMS AND ABBREVIATIONS
AC alternating current AFM atomic force microscopy ASHRAE American Society of Heating, Refrigerating and Air-Conditioning Engineers ASSIST Alliance for Solid-State Illumination Systems and Technologies BA beam angle BACnet building automation and controls network BR bulged reflector BWRC Berkeley Wireless Research Center CBCP center beam candlepower CCFL cold cathode fluorescent lamp CCT correlated color temperature cd Candela CFL compact fluorescent lamp CIE Commission Internationale de l'Eclairage CMH ceramic metal halide CRI color rendering index CWA constant-wattage transformer DALI Digital Addressable Lighting Interface DARPA Defense Advanced Research Projects Agency DC direct current DCRC double crystal rocking curve DOE United States Department of Energy ELO epitaxial lateral overgrowth EM Electromagnetic EML emissive layer thickness EQE external quantum efficiency ER ellipsoidal reflector ETRI Electronics and Telecommunications Research Institute EU European Union FCLEDs flip-chip light emitting diodes GE General Electric HF high frequency HID high intensity discharge HIR halogen infrared reflector HPS high pressure sodium HT high temperature HVAC Heating, ventilation and air conditioning Hz Hertz IAEEL International Association for Energy Efficient Lighting IEEE Institute of Electrical and Electronics Engineers

xviii
IESNA Illuminating Engineering Society of North America INFM Instituto Nazionale di Fisica IQE internal quantum efficiency IR Infrared IT intermediate temperature K degrees Kelvin KBN Komitet Badan Naukowych (Polish Committee of Scientific Research) LAN local area network LBNL Lawrence Berkeley National Laboratory LCD liquid crystal display LDs laser diodes LED light-emitting diode LFL linear fluorescent lamp LFSW low frequency square wave LGN lateral geniculate nucleus lm lumen lm/W lumens per Watt LPS low pressure sodium LR&D Lighting Research and Development LRC Lighting Research Center LT low temperature MH metal halide MIT Massachusetts Institute of Technology MOCVD Metallo Organic Chemical Vapor Deposition MOVPE metalorganic vapor phase epitaxial MQW multiple quantum well MV mercury vapor NCI Navigant Consulting, Inc. NEMA National Electrical Manufacturers Association NIST National Institute of Standards and Technology NLPIP National Lighting Product Information Program nm Nanometers Nmiles nautical miles NNL National Nanotechnology Laboratory NSF National Science Foundation OIDA Optoelectronics Industry Development Association OLED organic light-emitting diode PAR parabolic aluminized reflector PDA personal digital assistant PG&E Pacific Gas and Electric PL Photoluminescence PLEDs polymeric light-emitting devices PNNL Pacific Northwest National Laboratory

xix
PSE&G Public Service Electric and Gas Company PV Photovoltaic QSP quantum splitting phosphors QW quantum well R Reflector RFD retinal flux density RGB red-green-blue RHT retinal hypothalamic tract SAD seasonal affective disorder SCE Southern California Edison SCFL screw base compact fluorescent lamp SCN suprachiasmatic nuclei SEM scanning electron microscopy SL Superlattice SMUD Sacramento Municipal Utility District SP surface plasmon SPD spectral power distribution SSL solid-state lighting Tbtu trillion British Thermal Units TIP truncated-inverted-pyramid TIR total internal reflection TWh terawatt hours U.S. United States UCSD University of California at San Diego UK United Kingdom USC University of Southern California UV Ultraviolet V Volts VCSEL Vertical Cavity Surface Emitting Laser W Watts WECA Wireless Ethernet Compatibility Alliance


1
1. Introduction
The Lighting Market Characterization study is a multiyear effort to evaluate light sources in the United States and identify opportunities for saving energy. Sponsored by the United States Department of Energy’s (DOE’s) Building Technologies Program (BT), the Lighting Market Characterization consists of two phases. In September 2002, the Department of Energy published the U.S. Lighting Market Characterization Volume I: National Lighting Inventory and Energy Consumption Estimate. This report, U.S. Lighting Market Characterization Volume II: Energy Efficient Lighting Technology Options identifies fifty-two different lighting technology options that promise to save energy.
Section 1.1 of this chapter provides information on the DOE’s Lighting Research and Development program. Section 1.2 presents the findings of the Volume I study. These findings were used as the baseline inventory for the energy savings estimates in Volume II.
1.1. Department of Energy’s Lighting Research and Development Program
The mission statement of the DOE Lighting Research and Development (LR&D) portfolio is “To increase end-use efficiency in buildings by aggressively researching new and evolving lighting technologies, in close collaboration with partners, to develop viable methodologies that have the technical potential to conserve 50% of electric lighting consumption by 2025.”
In order to achieve this ambitious goal, DOE conducts research and development in three critical areas: light sources, light utilization, and human factors.
• Light sources: research conventional and revolutionary technologies that promise to improve light source efficiency by 20% to 50%, and develop revolutionary technologies that can potentially double efficiency.
• Light utilization: develop technologies and control systems that will save 25% to 33% of energy by improving light quality and delivery, and meeting occupant needs.
• Human factors: advance the basic understanding of the complex interrelationship between human vision, acuity and efficient light utilization that may yield energy savings of 20 to 30%.
Managing the lighting research and development activities in order to achieve these goals is challenging and requires a focused approach in order to minimize waste, and maximize and leverage effective investments in research and development (R&D). The Department of Energy is using this resource, in conjunction with other material and expert opinion to design and manage its lighting R&D portfolio.
1.2. National Lighting Energy Consumption
In Volume I: U.S. Lighting Market Characterization, end-use lighting installations in the U.S. were classified into four sectors made up of three building categories (residential, commercial, industrial) and one category called ‘outdoor stationary’ which incorporated lighting installations such as street lighting, airport runway lighting systems, traffic signals, and billboard lighting. Light sources in this study were grouped into four broad categories: incandescent, fluorescent, high intensity discharge and solid-state.
Table 1-1 summarizes the lighting energy consumption estimate for the four general lighting market sectors in terms of both delivered (end-use site energy) and primary (source) energy. Primary energy

2
refers to the total energy required to generate and supply electricity to the customer site.2 Table 1-1 shows the annual total lighting electricity consumption as 765 Terawatt-hours (TWh) at the building site, or 8.2 quadrillion British thermal units (quads) of primary energy.3
Table 1-1: U.S. National Energy Use for Lighting, Disaggregated by Sector
Sector
Electricity Use per Building (kWhr/yr)
Number of Buildings
Site Energy (TWh/yr)
Primary Energy (quads) Percent of Total
Residential 1,946 106,989,000 208 2.2 27%
Commercial 83,933 4,657,000 391 4.2 51%
Industrial 475,063 227,000 108 1.2 14%
Outdoor Stationary n/a n/a 58 0.6 8%
Totals 765 8.2 100%
Figure 1-1 provides a breakdown by end-use sector of the energy consumption for lighting homes, offices and other metered applications around the country. The figure shows that the commercial sector was the largest energy user, consuming more than half of the lighting energy. In addition, lighting in this sector can contribute to a building’s internal heat generation and subsequent air-conditioning loads at peak times. The residential sector consumed about twenty-seven percent, or 2.2 quads of energy for lighting. The industrial and outdoor stationary sectors constitute the remaining fourteen percent and eight percent, respectively.
2 The factor used to convert the site-use electrical energy to primary energy consumed at the generating power plant is 10,768 BTU/kWh (DOE, 2002). This conversion factor incorporates generation, transmission and distribution losses on an average basis for the U.S. Note that the conversion efficiency varies from year to year, depending on the mix of electrical generating power plants used in a given year.
3 In the United States, total energy consumption in 2001 was 98.3 quadrillion BTU’s, of which about a third – 37 quads – is for electricity production (Annual Energy Outlook, 2002; Table 2 Energy Consumption by Sector and Source).

3
Figure 1-1: U.S. Primary Energy Consumption for Lighting by Sector, 2001
While Figure 1-1 presents the end-use energy for lighting in terms of primary energy consumption (quads), Figure 1-2 presents the same data, disaggregated by sources, in terms of site energy consumption, measured in terawatt-hours per year (TWh/yr). Figure 1-2 provides the end-use electricity consumed by incandescent, fluorescent and high intensity discharge lamps.
Figure 1-2: Lighting Energy Consumption by Sector & Source, 2001
Figure 1-2 presents a breakdown of lighting technologies within the four sectors. Fluorescent sources in the commercial sector are the single largest energy consuming segment in the U.S., slightly greater than residential incandescent. In the residential sector, approximately 90% of the energy is consumed by incandescent sources.

4
1.3. Objective and Purpose of this Report
The objective of this report, U.S. Lighting Market Characterization Volume II: Energy Efficient Lighting Technology Options, was to look broadly at energy-efficient options in lighting and identify leading opportunities for energy savings. This report started with 209 technology options, which were then narrowed down to a list of fifty-two by a group of lighting experts. This report presents those fifty-two lighting technology options that promise to save energy or demonstrate energy savings potential. This report does not represent DOE’s top-choices of lighting research and development, instead it encompasses the opportunities that are promising measures to reduce lighting energy consumption.
The three main categories for the fifty-two technology options are light source, utilization, and human factors. The largest category, light source, contains thirty-six options. These options are further divided into five subcategories: incandescent, fluorescent, high intensity discharge (HID), light-emitting diode (LED), and organic light-emitting diode) (OLED). The second category, utilization, includes fourteen options, which are subdivided into three subcategories: fixture, distribution and controls. The third category, human factors, consists of two options, classified under the subcategory of visual performance. The report presents a broad range of technology options, spanning from basic and applied research to deployment and market transformation. This report provides guidance to the DOE decision makers in planning the Lighting R&D portfolio.
As mentioned previously, there are several caveats that accompany the findings presented in this report. For instance, the full technical energy savings potential of the options was identified, but realistic market potential (and associated energy savings) was not assessed. Additionally, the risks associated with developing these technology options were not quantified. Evaluation of technical risk may be needed for certain technology options for program planning purposes.

5
2. Methodology
The Department of Energy drafted an initial list of 209 technology options for increasing energy efficiency in lighting, which was then refined and prioritized by twenty-five experts in the fields of conventional and solid-state lighting. This report looks into the fifty-two lighting technologies chosen by these experts, and provides information on twelve topics for each of the technologies. Table 2-1 presents the twelve topics, and the associated questions. The report draws from many sources which are referenced for each technology option, including lighting product catalogs, scientific research papers, energy-efficiency lighting experts.
Table 2-1: Topics and Questions for Each Technology Option
Topics Questions
Technology Description and Energy Saving Principle
How does the technology work? How can this technology save energy?
Technical Maturity Level In what stage of technical maturity is this technology? (e.g., from Basic Science Research to Commercialization)
Issues with Existing Lighting Products and Systems
How easily can this technology be implemented/adopted?
Technical Potential and Primary Energy Consumption Impact
What is the projected full technical energy savings potential of the technology option (100% market penetration)?
Performance Information: Data and Source
What is the efficacy/efficiency of the new technology? How does it compare to existing technology?
Cost Information: Data and Source What is the cost of this technology? If it isn’t available, what is the cost of existing technology that new products will compete/replace?
Non-Energy Benefits of Technology Are there non-energy benefits to this technology (e.g., safety, environment, etc.)?
Notable Developers/Manufacturers of Technology
Who are the key researchers/manufacturers of this technology?
Peak Demand Impact Potential Can this technology provide peak demand relief?
Promising Applications What are some promising applications where this technology, once brought to market, can make an immediate impact?
Perceived Barriers to Market Adoption What barriers to market adoption does this technology face?
Data Gaps and Next Steps Based on what we know, what are the next steps required to bring this technology to market? What are the issues preventing development?

6
2.1. Topics for Each Technology Option
The following subsections provide further information on each topic.
2.1.1. Technology Description and Energy Saving Principle
Under this heading, the report provides a brief summary highlighting the key elements of each technology option and how its development will result in energy savings. 2.1.2. Technical Maturity Stages
The LR&D program created a technology continuum4, as a tool to assist in guiding the research, technical and business actions and decisions that are necessary to move a concept from a scientific phenomenon to a marketable product. As a technical concept advances through the continuum, it must demonstrate that it meets the criteria at each stage before it advances to the next stage.
The technology continuum is divided into seven technology maturity stages. Figure 2-1 presents the seven technology maturity stages that comprise the technology maturity continuum. This graphic is repeated for each of the fifty-two technology options in the “Technical Maturity Level” section, with a gray diamond representing the stage in which each technology option falls. For instance, Figure 2-1 would represent a technology option in the applied research stage.
Technology Maturity Stage Basic Science
Research Applied Research Exploratory Development
Advanced Development
Engineering Development
Product Demonstration
Commercialization and Sales
Figure 2-1: Technology Maturity Stage Continuum
The following text provides a short description of each stage.
Technology Maturation Stage 1 – Basic Science Research Fundamental science exploration is performed to expand the knowledge-base in a given field. Scientific principles (with data-empirical and/or theoretical derivation) are formulated and proven. The output from these projects would generally be peer-reviewed papers published in recognized scientific journals. Specific applications are not necessarily identified in Stage 1.
Technology Maturation Stage 2 - Applied Research Scientific principles are demonstrated, an application is identified, and the technology shows potential advantages in performance over commercially available technologies. Lab testing and/or math modeling is performed to identify the application(s), or provide the options (technical pathways) to an application. Testing and modeling add to the knowledge base that supports an application and point to performance improvements.
4 Based on Robert Cooper’s stage-gate process, a widely used and followed method used to move products from concept to commercial launch. Robert Cooper, “Winning at New Products, Accelerating the Process from Idea to Launch.” 2nd Edition. 1993.

7
Technology Maturation Stage 3 – Exploratory Development A product concept addresses an energy efficiency priority. From lab performance testing, down select from alternative technology approaches for best potential performance, via selection of materials, components, processes, cycles, and so on. With lab performance testing data, down select from a number of market applications to the initial market entry ideas. This product concept must exhibit cost and/or performance advantages over commercially available technologies. Technical feasibility should be demonstrated through component bench-scale testing with at least a laboratory breadboard of the concept.
Technology Maturation Stage 4 – Advanced Development Product concept testing is performed on a fully functional lab prototype – “proof of design concept” testing. Testing is performed on prototypes for a number of performance parameters to address issues of market, legal, health, safety, etc. Through iterative improvements of concept, specific applications and technology approaches are refocused and “down selected.” Product specification (for manufacturing or marketing) is defined. Technology should identify clear advantages over commercially available technologies, and alternative technologies, from detailed assessment.
Technology Maturation Stage 5 – Engineering Development “Field ready prototype” system is developed to refine product design features and performance limits. Performance mapping is evaluated. Performer conducts testing of a field-ready prototype/system in a representative or actual application with a small number of units in the field. The number of units is a function of unit cost, market influences (such as climate), monitoring costs, owner/operator criteria, etc. Feedback from the owner/operator and technical data gathered from field trials are used to improve prototype design. Further design modifications and re-testing are performed as needed.
Technology Maturation Stage 6 – Product Demonstration Operational evaluation of the demonstration units in the field is conducted to validate performance as installed. Third party monitoring of the performance data is required, although less data is recorded relative to the “field ready prototype” test in Stage 5. Pre-production units may be used. Size of demo is a function of unit cost, monitoring cost, etc., and involves relatively more visibility. Energy savings are measured, with careful analysis of economic viability and field durability for specific applications.
2.1.3. Issues with Existing Lighting Products and Systems
This section identifies key issues with existing infrastructure and market factors that may delay or impede the adoption of this technology option. For example, most incandescent lamps used in the residential sector have an Edison screw base. A coupling based on anything other than an Edison screw base could be construed as having more complex and costly retrofits. In addition, incandescent lamps typically have a color temperature of 2800K. If a replacement technology has a different color temperature, e.g., 3500K, the public may be reluctant to adopt the new technology.
2.1.4. Technical Potential and Primary Energy Consumption Impact
The energy savings estimate is a key element of the report. It represents the full technical potential5 of the technology. Each option is treated independently, and the effect of the development of one option on others is not considered. The graphic in Figure 2-2 shows the process used to determine the technical potential of each technology option.
5 A calculation of full technical potential assumes 100% market penetration and does not account for the economic (e.g., payback, life-cycle cost) or market potential (other market barriers).

8
Figure 2-2: Flowchart of Technical Potential Energy Savings Calculation
To calculate the energy savings potential, it was first determined whether the technology simply improves upon existing technology, or whether it is a novel technology that enables expansion into markets beyond its current boundaries. For technology options that simply improve upon existing technology, the calculations confined the energy savings to the current market share of the existing technology; the energy savings is simply the improvement in efficacy/efficiency over the existing technology. For novel technology options, the analysis first identified applications and sectors likely to be impacted. Then, the appropriate applications and sectors in which the new technology would serve as a viable alternative were identified. The calculated energy savings estimate would be the improvement in efficacy/efficiency over existing technologies and replacement technologies. Volume I provided the data to calculate the baseline energy consumption from which energy savings was calculated.
The inorganic and organic SSL sources required a different methodology to determine their energy savings potential. Because SSL research encompasses a wide range of disciplines and technologies that are interdependent, no single technology option is solely responsible for the successful development of SSL sources. It is the cumulative success of many technology options that will ultimately determine its energy savings potential, including, but not limited to, the options presented in this report. Therefore, the report presents single energy savings estimate for LED technology options and a single estimate for OLED technology options. These estimates represent the scenarios where the LED and OLED light sources achieve their target performance and market penetration of 160 lm/W and 100%, respectively. While LED light sources are expected to impact all lighting sectors, the impact of OLED sources are expected to be confined to the fluorescent and general service incandescent sectors of the commercial sector due to its unique characteristics as a large-area, low-luminance light source.
The report does not assess the relative technical risk or the resources required to make progress in each technical area. Depending on the level of technical maturity and the barriers to overcome, this risk can be substantial. 2.1.5. Performance Information: Data and Source
This section provides available performance data on the technology option (e.g., correlated color temperature, color rendering index, efficacy, and luminance), if available. 2.1.6. Cost Information: Data and Source
The commoditization of lighting has made some lighting consumers extremely sensitive to first cost when faced with a purchasing decision. This section provides some cost/price estimates of lighting products resulting from this technology option. If cost/price estimates are not available, then the cost/price of existing lighting technologies that the new technologies would replace are provided.

9
2.1.7. Non-Energy Benefits of Technology
This section identifies the non-energy related benefits of each technology option. For example, if a technology enables light sources to do away with a hazardous substance such as mercury, that information would be identified in this section. 2.1.8. Notable Developers/Manufacturers of Technology
The notable manufacturers of the technology options are identified in this section. If this technology is not close to commercialization, the report identifies researchers who are active in investigating this technology. 2.1.9. Peak Demand Impact Potential
In addition to the total energy savings potential, peak demand reduction is a key area of interest to utilities, particularly in light of the rolling blackouts experienced by California and other parts of the country. The ability to reduce energy consumption during periods of peak demand could provide immediate relief to utilities who are already operating at peak capacity, and delay the construction of costly power plants to meet the increasing demand for power. 2.1.10. Promising Applications
This section identifies the most promising applications where consumers would most likely adopt new products resulting from development of the technology options. It also identifies the applications and sectors where manufacturers would most likely introduce new products. 2.1.11. Perceived Barriers to Market Adoption
This section identifies key barriers that would impede market adoption (e.g., technical and marketing issues). 2.1.12. Data Gaps and Next Steps
This section identifies the key gaps in the development of the technology option. In addition, the report suggests steps required in order to continue towards the development of commercial products based upon a particular technology.

10
3. Technologies to Improve Performance of Light Sources
The lumen (lm) is the International Unit of luminous flux, and represents the weighted radiant energy of a light source.6 Efficacy is the measure of efficiency of a light source. It is the quotient of the total luminous flux, in lumens, divided by its total input power, in watts; its units are lumens per watt (lm/W).
Two lighting metrics commonly used to describe the quality of light are correlated color temperature (CCT) and color rendering index (CRI). The CCT is the temperature of a blackbody that best matches the color of a given light source. It describes the color appearance of the source, measured on the Kelvin (K) scale. Lamps with a CCT below 3500 K are "warm", and appear more reddish in color. Lamps above 4000 K are "cool" sources, and appear whiter7 in color. CRI is the measure of the effect of a light source on the color appearance of objects in comparison to a reference case with the same CCT. Incandescent is the reference light source used for light sources with CCT less that 5000 K, and daylight is used for sources with CCT greater than 5000 K.
This chapter presents thirty-six technology options that could improve the efficacy of existing light sources. The chapter disaggregates the options into five basic technologies: incandescent, fluorescent, HID, and emerging inorganic and organic solid-state light (SSL) sources. There are two incandescent technology options, five fluorescent, ten HID, twelve inorganic, and seven organic SSL technology options.
6 One lumen is the amount of light emitted in a solid angle of 1 steradian, from a source that radiates to an equal extent in all directions, and whose intensity is 1 candela.
7 They may appear ‘bluish’ if the eye has adapted to a lower color temperature source.

11
3.1. Incandescence and Selective Radiators
A blackbody radiator is an ideal body that absorbs all radiation impinging upon it, and, consequently, emits radiation perfectly. The radiation emitted at any wavelength is dependent only on its temperature. Planck’s law gives the total radiated power from a blackbody of a given size, and when applied to the spectral sensitivity of the eye to visible radiation determines the amount of light (in lumens). From such calculations, the luminous efficacy of a blackbody is nearly 100 lm/W at a temperature of about 6500 K. At a temperature of 2800 K, (approximately that of a 75-W incandescent lamp) the luminous efficacy of a blackbody is 15 lm/W, while at a temperature of 3200 K the efficacy is 27 lm/W. Thus, the efficacy of blackbody radiators depends very strongly on temperature.
In 1879, Joseph Swan and Thomas Edison independently developed the first electric lamp based on principles of a blackbody radiator. In the United States, Thomas Edison developed the first incandescent lamp using a carbonized sewing thread taken from his wife’s sewing box. His first commercial product, using carbonized bamboo fibers, operated at about 60 watts for about 100 hours and had an efficacy of 1.4 lm/W. Joseph Swan is credited with the invention of the incandescent lamp in the United Kingdom. Twenty-five years later, the efficacy of the carbon filament lamp has increased by a factor of three to 4.5 lm/W.
These first designs utilized a carbon fiber filament derived from cotton. The next stage of development of the incandescent lamp focused on extending its practical life. The invention of ductile tungsten by William Coolidge in 1906, a much improved filament material, sparked the development of the modern tungsten filament incandescent light bulb. 8 The first tungsten filament lamps had efficacies of approximately 10 lm/W, more than a factor of two higher than the commercial carbon lamp. Further improvements over time raised the efficacy of the current 120-volt, 60-watt incandescent lamp to 15 lm/W with an average lifetime of 1,000 hours.
In spite of the availability and economic sensibility of more efficacious alternatives, incandescent lamps continue to persist as a major source of illumination, particularly in the residential sector. Although incandescent sources are only responsible for 12% of all light generated in the United States, they are responsible for 42% of all lighting energy consumed.9 Incandescent lamps remain in wide use because they possess many attractive properties that more efficient light sources cannot reproduce easily. The following sections present two technology options relating to incandescence and selective radiators.
8 “The History of Fluorescent Lighting.” Mary Bellis. The History of Lighting; accessed on February 4, 2004 at http://inventors.about.com/library/inventors/bl_fluorescent.htm.
9 U.S. Lighting Market Characterization Volume I: National Lighting Inventory and Energy Consumption Estimate. Prepared by Navigant Consulting, Inc. for the Department of Energy. Washington D.C. September 2002.

12
3.1.1. Higher Temperature Incandescent Light Sources
The technical potential energy savings (primary) estimate for higher temperature incandescent light sources is 1.5 quads. Incandescent light sources are the least efficient sources of illumination and have the greatest potential for energy savings. Other technologies (i.e., fluorescent and HID) are already available with significantly greater efficacies.
Technology Description and Energy Saving Principle
Incandescent lamps have a filament that, when heated, emits radiation in the visible spectrum. Although tungsten10 is technically a selective emitter11, its emissivity is sufficiently constant in the visible range that it is an example of a filament material that operates as a near-blackbody radiator. This is true of most metals heated to an incandescent mode, i.e., where heating a filament by an electric current to high temperatures emits light. Because the emissivity of tungsten is slightly higher in the visible than in the infrared, the efficacy of a tungsten filament lamp is higher than a blackbody at the same temperature. Thus the radiant efficiency of a tungsten filament at 2800 K is about 19 lm/W compared to the 15 lm/W of a blackbody.
The efficacy of commercially available incandescent lamps, at constant lamp life, increases as the tungsten wire diameter is increased. Thus, at 120 volts, 100-watt lamps have a higher efficacy than 60-watt lamps because they can operate at a higher temperature to reach the same lamp life. Similarly, lowering the lamp voltage at constant power can lead to increased lamp efficacy at constant life. For this reason, a 60-watt lamp at 120 volts (US product) has a higher efficacy than a comparable 60-watt lamp at 230 volts (Europe). While increasing the temperature of the tungsten filament increases the luminous efficacy, it reduces the lamp life at a faster rate. For example, a lamp design that increases the efficacy of a lamp at a given wattage and voltage by 10%, causes a decrease in life to less than half the life of the original lamp design.
At present, incandescent lamps convert only 5% to 10% of the input power to light. The remaining energy converts to heat and IR radiation. The reason for low efficacy at lower temperatures is that almost all emission is in the infrared region of the spectrum. As the blackbody temperature increases, the fraction of visible emissions increases much faster than the emitted power. Therefore, raising the operating temperature of a near-blackbody radiator increases the efficacy of incandescent sources.
New methods and materials that enable lamp operation at higher blackbody temperatures would result in higher efficacy and energy savings. By improving the efficacy of an incandescent light source, incandescent technology can achieve higher light output with less energy input.
Technical Maturity Level
The important temperature limit for an incandescent filament is the point at which tungsten evaporates. A high-pressure gas surrounding the filament reduces the net evaporation rate of the filament. Furthermore, adding a halogen such as bromine to the space around the filament promotes the regenerative halogen cycle. In this cycle, halogen deposits evaporated tungsten molecules back onto the filament, enabling the tungsten filament to operate at higher temperatures without shortening its operating life. In 1959, engineers Elmer G. Fredrick and Emmett H. Wiley developed the first tungsten halogen lamp,
10 The emission from a tungsten filament becomes visible from around 873 K (600oC).
11 Emissivity is not constant, and hence does not emit at all wavelengths equally. Reference is a blackbody, whose emissivity is unity for all wavelengths.
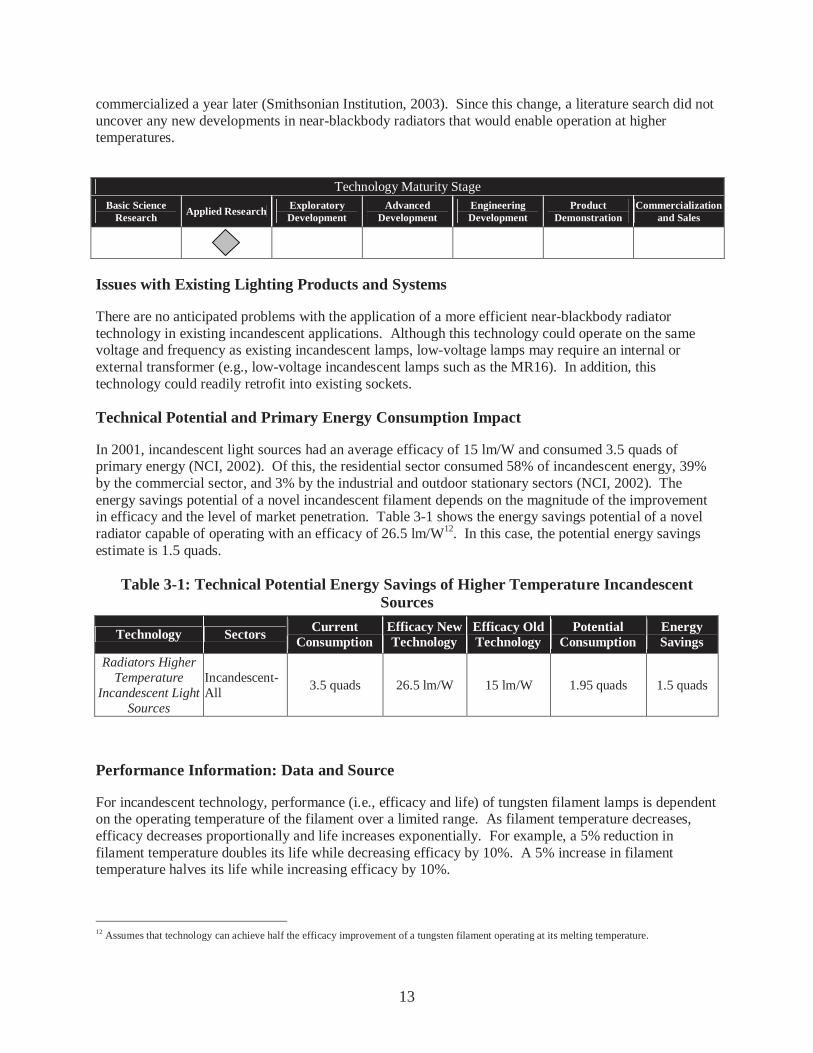
13
commercialized a year later (Smithsonian Institution, 2003). Since this change, a literature search did not uncover any new developments in near-blackbody radiators that would enable operation at higher temperatures.
Technology Maturity Stage
Basic Science Research
Applied Research Exploratory Development
Advanced Development
Engineering Development
Product Demonstration
Commercialization and Sales
Issues with Existing Lighting Products and Systems
There are no anticipated problems with the application of a more efficient near-blackbody radiator technology in existing incandescent applications. Although this technology could operate on the same voltage and frequency as existing incandescent lamps, low-voltage lamps may require an internal or external transformer (e.g., low-voltage incandescent lamps such as the MR16). In addition, this technology could readily retrofit into existing sockets.
Technical Potential and Primary Energy Consumption Impact
In 2001, incandescent light sources had an average efficacy of 15 lm/W and consumed 3.5 quads of primary energy (NCI, 2002). Of this, the residential sector consumed 58% of incandescent energy, 39% by the commercial sector, and 3% by the industrial and outdoor stationary sectors (NCI, 2002). The energy savings potential of a novel incandescent filament depends on the magnitude of the improvement in efficacy and the level of market penetration. Table 3-1 shows the energy savings potential of a novel radiator capable of operating with an efficacy of 26.5 lm/W12. In this case, the potential energy savings estimate is 1.5 quads.
Table 3-1: Technical Potential Energy Savings of Higher Temperature Incandescent Sources
Technology Sectors Current Consumption
Efficacy New Technology
Efficacy Old Technology
Potential Consumption
Energy Savings
Radiators Higher Temperature
Incandescent Light Sources
Incandescent- All
3.5 quads 26.5 lm/W 15 lm/W 1.95 quads 1.5 quads
Performance Information: Data and Source
For incandescent technology, performance (i.e., efficacy and life) of tungsten filament lamps is dependent on the operating temperature of the filament over a limited range. As filament temperature decreases, efficacy decreases proportionally and life increases exponentially. For example, a 5% reduction in filament temperature doubles its life while decreasing efficacy by 10%. A 5% increase in filament temperature halves its life while increasing efficacy by 10%.
12 Assumes that technology can achieve half the efficacy improvement of a tungsten filament operating at its melting temperature.

14
Tungsten filament lamps typically operate at a blackbody temperature of 2850 K, which results in an efficacy of 16 lm/W and an operational life of 1,000 hours. Placing the same tungsten filament in a halogen capsule enables the temperature to rise to 3100 K, improving the efficacy by 25% (to 20 lm/W) while extending the operating life to 2,000 hours. At its melting point of 3650 K, the efficacy of a tungsten radiator is 53 lm/W (IESNA, 2000). Thus, lamps must operate at temperatures well below the filament’s melting point in order to operate for reasonable lifetimes. New materials with higher melting points may enable greater efficacies and performance improvements.
Cost Information: Data and Source
Research into novel filaments is preliminary, and cost estimates are not available for lamps incorporating this technology. However, Table 3-2 below shows current prices of incandescent lamps that the technology would have to compete with in order to gain market share.
Table 3-2: Current Prices of Typical Incandescent Lamps Lamp Type Price Range
A19 60W 120V $0.25-$1.00
BR30 65W 120V $1.75-$3.49
60BT 60W 120V Halogen $2.49-$6.86
PAR38 60W 120V $3.59-$7.47 Source: Bulbs.com, 2003; Kwhlighting.com, 2003.
Non-Energy Benefits of Technology
Raising the operating temperature of the blackbody radiator would result in a light source with a higher color temperature, which would appear whiter than current incandescent light sources, which may be desirable in certain applications such as in commercial displays.
Notable Developers/Manufacturers of Technology
A literature search did not reveal any activity by researchers (i.e., publications, press releases, etc.) to increase the nominal operating temperature of incandescent filaments.
Peak Demand Impact Potential
When used in sockets that operate during peak hours, energy consumption of this light source would be coincident with peak, and an improvement in lamp efficacy would result in peak demand reduction. In addition, during peak demand summer periods, the new technology would reduce a building’s internal heat load, and in turn reduce the energy consumed by the air-conditioning system.
Promising Applications
The development of a novel filament capable of operating at higher temperatures provides a potential alternative to the traditional tungsten filament lamp. Lamps based on this technology would maintain familiar shapes and compatibility with existing sockets. Although its higher color temperature may hinder some of its impact, this technology could replace tungsten filament incandescent and halogen light sources in general “white-light” applications, primarily in the residential and commercial sectors. The commercial sector, characterized by longer lamp operating hours that result in shorter payback periods,

15
would most likely be the first to embrace this new technology. However, the greatest energy savings potential exists in the residential sector, where incandescent technology dominates.
Perceived Barriers to Market Adoption
Operating incandescent lamps at higher temperatures also increases the color (color temperature) of the lamp, which may impact its adoption. In addition, the two issues anticipated to be the most significant barriers to market adoption are first cost and reliability, based on lessons learned from the slow adoption of screw-base compact fluorescent lamp technology.
Data Gaps and Next Steps
There are two ways to improve the efficacy of incandescent lamps. One method would be to find new materials or other means to raise filament temperature without encountering the usual loss of lamp life. The other would be to find means to significantly reduce unwanted radiated power in the infrared spectrum that normally occurs when tungsten or other metals incandesce. Researchers must identify and develop materials and methods suitable for higher operating temperatures to achieve higher efficacy, while still maintaining structural integrity. Researchers must also consider barriers to immediate use such as the ability of a new technology to retrofit into current user sockets and the ability to produce the technology on current manufacturing equipment, etc.
References
DOE, 2000. “Efficient Incandescent Lighting Based on Selective Thermal Emitters.” Grant to Foster-Miller. Office of Science, Small Business Innovation Research Program, Department of Energy; accessed on September 2, 2003 at http://www.er.doe.gov/sbir/awards_abstracts/sbirsttr/cycle18/phase1/121.f.htm.
Fleming et al., 1999. “Photonic Band Gap Microcavity in Three Dimensions.” Fleming et al. Sandia National Laboratories. Phys. Rev. B., 59, p. 15579. 1999.
IESNA, 2000. The IESNA Lighting Handbook: Reference and Application, 9th Edition. M.S. Rea. Illuminating Engineering Society of North America. New York. 2000.
Johnston, 1999. “Photonic Frenzy.” Saren Johnston. Inquiry 1999. Ames Laboratory; accessed on July 23, 2003 at http://www.external.ameslab.gov/News/Inquiry/99/photonic.html.
NCI, 2002. U.S. Lighting Market Characterization Volume I: National Lighting Inventory and Energy Consumption Estimate. Prepared by Navigant Consulting, Inc. for the Department of Energy. Washington D.C. September 2002.
Sekine, 1997. “Theoretical Evaluation of Spectral Power Distributions of Radiant Energy from Microcavities.” Seishi Sekine. Journal of Light and Visual Environment. Volume 22, Number 1. 1997.
Singer et al., 2003. “Tungsten Photonic Lattice Developed at Sandia Changes Heat to Light.” Neal Singer. Sandia National Laboratories; accessed on July 21, 2003 at http://www.sandia.gov/LabNews/LN05-03-02/key05-03-02_stories.html#lattice.
Smithsonian Institute, 2003. “Inventing Six Modern Electric Lamps.” Lighting a Revolution. Smithsonian Institute; accessed on September 3, 2003 at http://americanhistory.si.edu/lighting/20thcent/invent20.htm.
Tiax, 2003. “Novel Materials.” Technical Area of Expertise. Tiax; accessed September 2, 2003 at http://www.tiax.biz/technologies/pdfs/novel_materials.pdf.

16
Waymouth, 1989. John Waymouth. Journal of Light and the Visual Environment, Volume 13(2), pp. 51-68. 1989.
Wyszecki, 1982. Color Science: 2nd Edition. A Wiley-Interscience Publication. Gunter Wyszecki and W.S. Stiles. 2000.

17
3.1.2. Selective (and Pseudo-Selective) Radiators
The technical potential energy savings estimate (primary energy) for selective radiators is 2.8 quads. Incandescent light sources are the least efficient source of illumination and have the greatest potential for energy savings; other technologies (i.e., fluorescent and HID) are already available with significantly greater efficacies.
Technology Description and Energy Saving Principle
There are two methods of achieving selective radiator lamps with high efficacy. One is to use optics to maximize the fraction of radiation that reflects back to the filament by placing a filter on the filament tube surface. At present, there are commercially available products that use long cylindrical or compact elliptical tubes with infrared reflective, visible transmitting multi-layer dichroic filters on the surface of a halogen filament tube. In the future, manufacturers could use photonic bandgap materials that consist of a crystal lattice structure whose spacing defines the photonic bandgap. By controlling the lattice spacing, photonic bandgap materials will reflect a specific range of wavelengths while transmitting all other frequencies of electromagnetic energy.
Another method to increase filament efficacy involves an actual source radiator (i.e., microcavity resonators and photonic bandgap materials) that tailors its emission to the visible region. These radiators inherently improve incandescent light emission by conserving wasted energy so that it does not emit much IR radiation. For example, microcavity resonators are another type of selective radiator that confines electromagnetic waves in cavities, preventing their emission. For example, a microcavity resonator with cavities having a diameter of 400 nm will not emit electromagnetic waves with a wavelength of 800 nm or greater. Creating appropriate-sized cavities in a radiator can optimize light emission to the visible region while minimizing wasted emission in the non-visible range.
To increase the efficacy of an incandescent light source, selective radiators can tailor the spectrum of the emission to maximize emission in the visible spectrum. By improving the efficacy of an incandescent light source, incandescent technology can achieve higher light output with less energy input. Additionally, improvements in device efficacy would reduce internal heat loads in buildings, saving energy that the air-conditioning system would consume.
Technical Maturity Level
Halogen IR reflector technology is the most efficacious commercially available incandescent source. In addition to operating the tungsten filament within a quartz capsule under high pressure with a halogen fill-gas, this lamp uses a thin film coating on the quartz capsule surrounding the filament to reflect a portion of the infrared radiation back toward the filament. In so doing, this coating recycles some of the infrared energy, which is normally wasted. This enables the filament to maintain its operating temperature while consuming less power. However, this technology is more costly to manufacture and its higher price limits its market impact. Photonic bandgap and microcavity resonators represent the next step in the development of a more efficient incandescent light source capable of conserving wasted infrared energy. However, many challenges remain for both these selective radiators, and researchers are unsure of how this process coverts heat to visible light (Singer et al., 2003).

18
Technology Maturity Stage Basic Science
Research Applied Research Exploratory Development
Advanced Development
Engineering Development
Product Demonstration
Commercialization and Sales
Issues with Existing Lighting Products and Systems
There are no anticipated problems with the application of a more efficient incandescent technology. Incandescent light sources based on selective radiators could operate on the same voltage and frequency as existing incandescent lamps. In addition, this technology could readily retrofit into existing sockets.
Technical Potential and Primary Energy Consumption Impact
In 2001, Incandescent light sources had an average efficacy of 15 lm/W and consumed 3.5 quads of primary energy (NCI, 2002). Of this, 58% of incandescent energy was in the residential sector, 39% in the commercial sector, and 3% in the industrial and outdoor stationary sectors (NCI, 2002). The energy savings potential of a selective radiator depends on the magnitude of the improvement in efficacy and the level of market penetration. Table 3-3 shows the energy savings potential of this technology at an efficacy of 80 lm/W with full market penetration. The potential energy savings estimate is 2.8 quads.
Table 3-3: Technical Potential Energy Savings of Selective Radiators
Technology Sectors Current Consumption
Efficacy New Technology
Efficacy Old Technology
Potential Consumption
Energy Savings
Selective Radiators
Incandescent- All
3.5 quads 80 lm/W 15 lm/W 0.66 quads 2.8 quads
Performance Information: Data and Source
The performance (i.e., efficacy and life) of a near-blackbody radiator such as tungsten is dependent on its operating temperature over a limited range. As filament temperature decreases, efficacy decreases proportionally and life increases exponentially. For example, a 5% reduction in filament temperature doubles its life while decreasing efficacy by 10%. A 5% increase in filament temperature halves its life while increasing efficacy by 10%. Typical 60-watt tungsten filament lamps operate at a blackbody temperature of approximately 2850 K at an efficacy of 15 lumens per watt (lm/W) and an operational life of 1,000 hours. Encapsulating the filament of tungsten lamps of equal wattage in a halogen capsule improves efficacy by about 25% (20 lm/W), while extending the operating life to 2,000 hours. Although multi-layer filter technology used in halogen infrared reflector (HIR) lamps could increase efficacy to 35 lm/W without reducing operating life (IESNA, 2000), it is more cost effective to sacrifice some gain in efficacy for a much larger gain in increased operating life. Therefore, commercially available HIR lamps have about twice the operating life and 35% improvement in efficacy (efficacy is about 25 lm/W) over an equivalent wattage halogen lamp.
Using microcavity resonators, Waymouth et al. reported efficacy enhancements in the range of 60 to 80 lm/W (Waymouth, 1989), while Sekine et al. reported improvement to as high as 118 lm/W (Sekine, 1997). Researchers at Sandia National Labs used mathematical models to show that an improvement in blackbody radiator efficiency from 12.5% to 51% is possible from photonic bandgap devices (Singer et

19
al., 2003). However, the stability of materials at high temperatures is a formidable problem for any approach that relies on patterning the emitter at the sub-micron scale. There would still be a tradeoff between efficiency and life.
Cost Information: Data and Source
Research into selective radiators is preliminary, and cost estimates are not available. Table 3-4 shows current prices of incandescent lamps that the technology would have to compete with in order to gain market share.
Table 3-4: Current Prices of Typical Incandescent Lamps Lamp Type Price Range
A19 60W 120V $0.25-$1.00
BR30 65W 120V $1.75-$3.49
60BT 60W 120V Halogen $2.49-$6.86
PAR38 60W 120V $3.59-$7.47
PAR38HIR 45W 120V $9.95-$11.50 Source: Bulbs.com, 2003; Kwhlighting.com, 2003.
Non-Energy Benefits of Technology
Since this technology would generate light more efficiently than current versions of the tungsten filament, it would generate less heat for the same light emission, making it safer to operate.
Notable Developers/Manufacturers of Technology
Private, government, and university-based research facilities evaluate microcavity resonators and photonic bandgap materials. However, exploration of their potential as a novel material or method for general illumination incandescence is not usually a priority.
In 1990, researchers at Ames Laboratories pioneered the study of photonic bandgap materials. Since then, they have teamed up with other facilities such as Iowa State University and Sandia National Laboratories to continue research in this area (Johnston, 1999). Notably, Sandia National Labs conducts research into photonic band gap and microcavity resonator materials on tungsten-based materials. Foster Miller and TIAX, Inc. are private companies that also conduct specific research with microcavity resonator technology as a light source.
Peak Demand Impact Potential
Similar to the blackbody radiator option discussed in section 3.1.1, when used in sockets that operate during peak hours, energy consumption of this light source would be coincident with peak, and an improvement in lamp efficacy would result in peak demand reduction. In addition, during peak demand summer periods, the new technology would reduce a building’s internal heat load, and in turn reduce the energy consumed by the air-conditioning system.
Promising Applications
The development of a selective radiator provides a potential alternative to the traditional tungsten filament lamp. Similar to the option discussed in section 3.1.1, this technology would impact general illumination

20
applications, primarily in the residential and commercial sectors. The commercial sector, characterized by longer lamp operating hours that result in shorter payback periods, would most likely be the first to embrace this new technology. However, the greatest potential impact exists in the residential sector, where incandescent technology dominates.
Perceived Barriers to Market Adoption
Similar to the blackbody radiator option discussed in section 3.1.1, based on the slow adoption of screw-base compact fluorescent lamp technology, the two issues anticipated to be the most significant barriers to market adoption are first cost and reliability. In addition, any change in the color appearance of a new light source may impede its adoption.
Data Gaps and Next Steps
Although research by laboratories, such as Sandia National Laboratories, demonstrates the potential of selective radiators (i.e., photonic bandgap devices and microcavity resonators) as efficient light sources, “the theory for the effect—re-partitioning energy between heat and visible light—remains unexplained (Singer et al., 2003).” In addition, not only are the intricate microstructures difficult to manufacture with current materials, researchers must identify new materials and composites that can maintain structural integrity at higher blackbody temperatures.
References
DOE, 2000. “Efficient Incandescent Lighting Based on Selective Thermal Emitters.” Grant to Foster-Miller. Office of Science, Small Business Innovation Research Program, Department of Energy; accessed on September 2, 2003 at http://www.er.doe.gov/sbir/awards_abstracts/sbirsttr/cycle18/phase1/121.f.htm.
Fleming et al., 1999. “Photonic Band Gap Microcavity in Three Dimensions.” Fleming et al. Sandia National Laboratories. Phys. Rev. B., 59, p. 15579. 1999.
IESNA, 2000. The IESNA Lighting Handbook: Reference and Application, 9th Edition. M.S. Rea. Illuminating Engineering Society of North America. New York. 2000.
Johnston, 1999. “Photonic Frenzy.” Saren Johnston. Inquiry 1999. Ames Laboratory; accessed on July 23, 2003 at http://www.external.ameslab.gov/News/Inquiry/99/photonic.html.
NCI, 2002. U.S. Lighting Market Characterization Volume I: National Lighting Inventory and Energy Consumption Estimate. Prepared by Navigant Consulting, Inc. for the Department of Energy. Washington D.C. September 2002.
Sekine, 1997. “Theoretical Evaluation of Spectral Power Distributions of Radiant Energy from Microcavities.” Seishi Sekine. Journal of Light and Visual Environment. Volume 22, Number 1. 1997.
Singer et al., 2003. “Tungsten Photonic Lattice Developed at Sandia Changes Heat to Light.” Neal Singer. Sandia National Laboratories; accessed on July 21, 2003 at http://www.sandia.gov/LabNews/LN05-03-02/key05-03-02_stories.html#lattice.
Tiax, 2003. “Novel Materials.” Technical Area of Expertise. Tiax; accessed September 2, 2003 at http://www.tiax.biz/technologies/pdfs/novel_materials.pdf.
Waymouth, 1989. Jeff Waymouth. Journal of Light and the Visual Environment, Volume 13(2), pp. 51-68. 1989.

21
Wyszecki, 1982. Color Science: 2nd Edition. A Wiley-Interscience Publication. Gunter Wyszecki and W.S. Stiles. 2000.

22
3.2. Fluorescent
In 1901, Peter Cooper Hewitt, an American inventor, patented the first low-pressure mercury vapor discharge lamp. It was the first prototype of today’s modern fluorescent lamp. George Inman improved upon this original design and created the first practical fluorescent lamp, introduced at the New York and San Francisco World’s Fairs in 1939. Today, many varieties and brands of fluorescent lamps are available to consumers.
The fluorescent lamp is a gas discharge light source that produces visible light by converting UV radiation from the arc discharge by means of phosphors. The arc discharge ionizes mercury vapor, which emits ultraviolet (UV) radiation with emission peaks at 254 nm and 185 nm. Phosphors, which coat the tube wall, absorb and convert the UV radiation into visible light. At the advent of fluorescent lamp technology, halophosphors (calcium halophosphates) coated fluorescent tubes. The color rendering from these lamps was not good enough for people to consider using fluorescent lamps in living areas of their home so consumers resigned these early lamps to basements or garages. Recently, fluorescent lamp manufacturers began coating bulb walls with more costly rare-earth phosphor blends. These phosphors not only increased the efficacy but also improved color-rendering properties of the lamp.
There are two methods of generating the electric field necessary to initiate and maintain an arc discharge: by voltage or magnetic induction. The more common and prevalent method is to impose a voltage between electrodes. Here, the arc discharge occurs between two electrodes placed at each end of a hermetically sealed bulb. Fluorescent lamp electrodes consist of a coiled tungsten wire coated with a low work function material. The electrode is typically a double-coiled tungsten wire, but some high current electrodes are triple-coiled. A mixture of alkaline earth oxides (i.e., barium oxide, strontium oxide, and calcium oxide) coat the tungsten wires to enhance electron emission. During operation, the coil and its coating can reach temperatures of approximately 1100oC at their hotspot. At this temperature, the electrode coating thermally emits sufficient quantities of electrons that initiate and maintain a low-pressure arc discharge. This high operating temperature slowly evaporates the tungsten wire coating, which eventually contributes to reduced performance and failure. During ignition, a small portion of the emissive coating is lost from the filament due to sputtering. The rate of loss of this coating impacts the overall operating life of the lamp; the lamp expires when the coating becomes non-emissive.
In discharge lamps with electrodes, the bulbs are tubular in shape and available in a variety of lengths, diameters, and wattages. Manufacturers can bend the bulbs to form U-tube or circle-line lamps, as well as formed them into spirals and other compact forms, often referred to as compact fluorescent lamps (CFL). Table 3-5 shows the nomenclature and tube diameter for the most common linear fluorescent lamps (LFL).
Table 3-5: Tube Diameter for Typical Linear Fluorescent Lamps
Nomenclature T2 T5 T8 T12
Tube Diameter ¼ inch 5/8 inch 1 inch 1 ½ inch
Proposed by J.J. Thompson in 1891 at the Royal society of London, an electrodeless lamp operates without electrodes. Instead, it derives its electric field from magnetic induction. Faraday’s Law of Induction states that alternating currents create alternating magnetic and electric fields. Therefore, high-frequency AC current flowing through wire wrapped around a ferrite core generates the electric field. Because there are no electrodes, there are no electrode-related life-limiting mechanisms. The results are

23
potentially longer lamp life and better lumen maintenance. Additionally, electrodeless lamps could use different and potentially more efficient fill materials since there is no possibility of interaction with electrodes.
Regardless of whether discharge lamps have electrodes, they require a ballast to provide current regulation because the arc discharge has a negative volt-ampere characteristic. For fluorescent lamps with electrodes, ballasts are available in three basic configurations: switch-start (preheat), rapid-start, and instant-start. Switch-start and rapid-start ballasts employ a four-wire design. This design enables the ballast to perform discrete filament heating, which augments lamp performance. The ability to independently provide filament heating enables the lamp to reliably control its light output (dimming); all commercially available dimming ballasts employ a four-wire system. Instant-start ballasts employ a simple two-wire system, and lack the capability to independently control the electrode filament temperature. Therefore, arc initiation in instant-start lamps depends on the application of a higher voltage (400 to 1000 volts) across the electrodes. This higher voltage ejects electrons from the electrodes by field emission without the assistance of electrode heating. These electrons flow through the tube and ionize the gas molecules, initiating an arc discharge. After startup, this discharge current provides the electrode heating.
The following sections present five technology options relating to improving the efficacy of fluorescent light sources.

24
3.2.1. Fluorescent Electrode Research
Research of electrode and electrode-related fluorescent discharge efficiencies has the technical potential of 0.3 quad energy savings (primary energy).
Technology Description and Energy Saving Principle
The discharge regions between a fluorescent lamp’s electrode and its positive column do not contribute to production of visible light. These regions, also known as “cathode fall” and “anode fall”, as well as the electrode body itself represent significant energy loss components without concomitant production of visible light. While it had long been known fluorescent lamps operate more efficiently at frequencies significantly higher than the line frequency (60 Hz) of a magnetic ballast (IESNA, 2000), it was not until the 1980’s that researchers developed cost-effective, high-frequency (20 kHz to 100 kHz) electronic replacements for the magnetic ballast. Higher operating frequencies modify the fall regions such that anode fall losses are nearly eliminated. Therefore, overall lamp-operating efficiency increases. For example, a high frequency electronically ballasted T12 lamp system showed an efficiency gain of up to 10% over a magnetically ballasted system. Reducing electrode body and cathode fall losses would further increase fluorescent lamp energy conversion efficiency by reducing the energy lost in non light-producing discharge regions.
Technical Maturity Level
Researchers found that the cathode-fall provided some ancillary benefits necessary for proper operation of the lamp. The collisions of the ions with the electrode material provided a portion of the necessary filament heating for thermal emission of electrons. This is critical for instant-start lamps that do not have any provisions for independent cathode heating. DOE is not aware of any significant publications regarding this topic since the late 1970’s.
Technology Maturity Stage
Basic Science Research Applied Research Exploratory
Development Advanced
Development Engineering Development
Product Demonstration
Commercialization and Sales
Issues with Existing Lighting Products and Systems
Any new product designs would likely be compatible with existing industry standards on lamp shape, size, and sockets. However, issues with the development of a new electrode may necessitate a new ballast design. For example, lamps with novel electrodes may have different heating voltage requirements that make them incompatible with existing lamp and ballast standards.
Technical Potential and Primary Energy Consumption Impact
Table 3-6 shows the potential energy saving from improved performance of electrodes in fluorescent lamps. For typical 32-watt high-frequency operation (> 20 kHz) of a four-foot F32T8 lamp at approximately 220 mAmp of lamp current, the cathode fall voltage will be approximately 10 to 12 volts resulting in cathode fall losses of approximately 2½ watts. Elimination of cathode fall losses would increase the energy conversion efficiency of fluorescent lamps by approximately 10%. However, cathode voltage plays an important role in current continuity. Although it most likely cannot be eliminated, it could possibly be lowered. While significant, such an increase in efficiency would not drastically

25
increase the ability of fluorescent lighting to displace other lighting technologies against which it currently competes. Thus, assuming this efficacy increase will only impact the fluorescent market and cathode fall reduces by one half, the energy savings potential is approximately 0.3 quad.
Table 3-6: Technical Potential Energy Savings of Electrode Materials Research
Technology Sectors Current Consumption
Efficacy New Technology
Efficacy Old Technology
Potential Consumption Energy Savings
Electrode Materials Research
Fluorescent-All Sectors
3.4 quads 70.2 lm/W 63.8 lm/W 3.1 quads 0.3 quad
Performance Information: Data and Source
Table 3-7 lists the performance information of typical fluorescent lamps that could benefit from successful electrode and cathode fall research. The data table includes power, lifetime, light output and efficacy ratings for typical fluorescent lamps.
Table 3-7: Power, Life, Light Output, and Efficacy for Fluorescent Lamps
Lamp Type Power Life Initial Light Output Initial Efficacy
F40T12 40 W 9,000 – 20,000 hrs. 2,880-3,400 lumens 72-85 lm/W*
F32T8 32 W 20,000 hrs. 2,800-2,950 lumens 87-92 lm/W*
F28T5 28 W 20,000 hrs. 2,610-2,900 lumens 93-103 lm/W
F54T5 HO 54 W 20,000 hrs. 4,400-5,000 lumens 81-92 lm/W
4-Pin CFL 32 W 10,000 – 12,000 hrs. 2,200-2,400 lumens 68-75 lm/W Source: GE, OSRAM, and Philips Online Catalogs, 2004. * Published efficacy measured on 60 Hz reference ballast. For F32T8, add 9% to account for operation at high frequency (Roberts, 2003).
Cost Information: Data and Source
Since the technology is not yet developed, prices of mass-produced lamps having more efficient electrodes or lower cathode fall voltages do not exist. However, Table 3-8 lists 2003 prices of typical fluorescent lamps that the technology would likely replace.
Table 3-8: Price Comparison for Fluorescent Lamps
Lamp Type Power Price
F40T12 40 W $3.99
F32T8 32 W $1.76
F28T5 28 W $5.70
F54T5 HO 54 W $7.74
4-Pin CFL 32 W $11.20 Source: Kwhlighting.com

26
Non-Energy Benefits of Technology
Sputtering (emitter material loss mechanism) is the primary cause of loss of electrode material. Due to the potential difference across the lamp, emitted electrons accelerate from the electrode, through the cathode fall voltage (the “cathode sheath”), toward the lamp’s light-producing positive column. If an electron collides with a mercury atom while transitioning the cathode sheath, it is likely to convert some into a mercury ion. Mercury ions, which have a net positive charge, accelerate back to the electrode by the potential voltage across the cathode sheath. The relatively heavy mercury ions reaching the electrode (cathode) frequently have sufficient kinetic energy to eject a small quantity of emissive material. An electrode depleted of its emissive material becomes unable to emit electrons; therefore, lamp life ends when the electrode’s emitter material is depleted (Narendran et al., 2000). Increased rates of sputtering decreases lamp life while decreased sputtering rates increases lamp life. One of the variables that influence the sputtering process is the cathode-fall voltage (Szuba, 1991). Therefore, results of this research could increase the useful operating life of fluorescent lamps, which would reduce the frequency of relamping and associated labor and disposal costs.
Notable Developers/Manufacturers of Technology
Although the following topics relate to improving the life of fluorescent lamps (not improving efficacy), they represent activity involving electrodes. A literature search did not reveal any recent publications regarding relating to electrode research and improved efficacy.
A study on electrode wear diagnostics by photoemission spectroscopy found that optical spectroscopy is a convenient way to monitor electrode wear during different operating conditions of a discharge lamp. Work is underway to develop a model for the discharge near electrodes by detailed modeling of the relevant atomic processes (Huldt et al., 2001).
Research efforts focused on electrode erosion include investigations by GE Corporate R&D to map the atomic barium density rates and the evolution rate of barium from the electrode. They determined that a major limiting factor in the life of fluorescent lamps is the evaporation of barium from the emission mixture on the cathode (Michael, 2001). Another study tested the effects of auxiliary heating on barium loss from fluorescent lamp electrodes during high frequency operation. The model predicted that suitable auxiliary heating reduces barium losses from the electrodes, thereby extending the operating life of the lamp (Misono and Katsuhide, 2001).
Another area involves the impact of ballast performance on electrode erosion. Product testers are developing and testing new predictors of lamp life for frequently switched instant-start fluorescent systems (Bierman et al., 2002; Narendran et al., 2000; Davis et al., 1996). In addition, there are other studies focused on the overall system efficacy and light output of T5 fluorescent lamps (Gu et al., 2002) and the performance and operating cycles of CFLs (O’Rourke and Figueiro, 2000; Ji et al., 1998).
Peak Demand Impact Potential
Fluorescent lighting applications commonly include commercial buildings (e.g., offices and retail stores). Their energy consumption occurs during peak demand hours. An improvement in lamp efficacy would result in peak demand reduction.

27
Promising Applications
Due to the extended lifetime that could result from reducing cathode-fall voltage, the best applications for this type of lighting are areas where changing lamps is extremely costly, difficult, or disruptive. Possible applications include: overhead office lighting, retail store lighting, and industrial warehouse lighting.
Perceived Barriers to Market Adoption
Electrodes currently represent only a very small fraction of the overall lamp cost. Therefore, even if lamp with improved electrodes cost twice as much as current lamps, they would create a negligible increase in total lamp cost.
Data Gaps and Next Steps
Understanding phenomena such as the cathode-fall voltage is critical to the development of better electrodes and lamps. However, reduction in cathode-fall voltage is a function of many factors. It is still an open question whether the cathode-fall voltage can be further reduced by any change to the electrode itself. Rather, the cathode-fall voltage may be determined entirely by the ionization potential of the gases in the lamp (possibly a rare gas and mercury mix), and may require development of a new electrode-ballast system.
A better understanding of electrode erosion in fluorescent lamps may lead to the identification and development of new and enhanced electrode materials that would further improve fluorescent lamp performance. Better materials may also reduce the impact of cathode-fall voltage on performance.
Furthermore, the impact of the ballast on fluorescent lamp performance is not well understood. Gaining an understanding of how ballasts impact the process of sputtering and evaporation is also vital to improving lamp performance.
References
Bellis, 2003. “The History of Fluorescent Lighting.” Mary Bellis. The History of Lighting; accessed on February 4, 2004 at http://inventors.about.com/library/inventors/bl_fluorescent.htm.
Bierman et al., 2002. “Testing A Lamp Life Predictor For Instant-Start Fluorescent Systems” by A. Bierman, C. O'Rourke, Deng, and N. Narendran. Illuminating Engineering Society of North America. 2002 Annual Conference: Proceedings, pp. 141-156. New York, NY.
Davis et al, 1996. “Rapid Cycle Testing for Fluorescent Lamps: What Do the Results Mean?” R.G. Davis, Y. Ji, and W. Chen. Illuminating Engineering Society of North America. 1996 Annual Conference: Proceedings, pp. 460-481. New York, NY.
Gu et al., 2002. “Performance Characteristics of T5 Fluorescent Lamps.” Y. Gu, Y. Akashi, X. Lou, N. Narendran, & C. O'Rourke. Illuminating Engineering Society of North America. 2002 Annual Conference: Proceedings, pp. 133-140. New York, NY.
Huldt et al., 2001. “Fluorescent Tube and Electrode Wear Diagnostics by Photo Emission Spectroscopy.” S. Huldt, R. Hutton, and N. Svendenius. Lunds University. 9th International Symposium on the Science and Technology of Light Sources.
Ji et al., 1998. “An Investigation of the Effect of Operating Cycles on the Life of Compact Fluorescent Lamps.” Y. Ji, R.G. Davis, and W. Chen. Illuminating Engineering Society of North America. 1998 Annual Conference: Proceedings, pp. 381-192. New York, NY.
Kwhlighting.com, 2003. Lamp prices; accessed on November 13, 2003 at http://www.kwhlighting.com.

28
Michael, 2001. “Measurement of Barium Evaporation Rates for F-Lamp Cathodes Using Laser Induced Fluorescence.” J. Darryl Michael. GE Corporate R&D. 9th International Symposium on the Science and Technology of Light Sources.
Misono and Katsuhide, 2001. “Effect of Auxiliary Heating on Barium Loss from the Fluorescent Lamp Electrode under HF Operation” Misono and Katsuhide. Toshiba Lighting and Technology Corporation. 9th International Symposium on the Science and Technology of Light Sources. August 2002.
Narendran et al., 2000. “A Lamp Life Predictor for Frequently Switched Instant-Start Fluorescent Systems.” N. Narendran, T.Yin, C. O’Rourke, A. Bierman, and N. Maliyagoda. Lighting Research Center. IES Paper #48, pp.141-156. New York, NY.
NCI, 2002. U.S. Lighting Market Characterization Volume I: National Lighting Inventory and Energy Consumption Estimate. Prepared by Navigant Consulting, Inc. for the Department of Energy. Washington D.C. September 2002.
O’Rourke and Figueiro, 2003. “Long-Term Performance of Screwbase Compact Fluorescent Lamps.” C. O'Rourke and M. Figueiro. Illuminating Engineering Society of North America. 2000 Annual Conference: Proceeding, pp. 369-381. New York, NY.
Roberts, 2003. Letter from Roberts Research & Consulting, Inc. to the editor of Lighting Design + Application regarding the Research Recap column in the January 2003 issue.
Szuba, 1991. “Phase-Resolved Thermal Modeling of a Fluorescent Lamp Electrode as a Function of Current Waveshape and Frequency.” Stefan Szuba. Institute of Electrical and Electronics Engineers. Transactions on Industry Applications, Volume 27, No. 3.
Thijssen et al., 2001. “Investigations on Barium Depletion from Electrodes in Low-Pressure Mercury/Noble Gas Discharge Lamps Using Barium Tracer Techniques, Fast Photography, and SEM.” Thijssen, van der Heijden, Buijsse, and van den Hoek. Philips Lighting, B.V. 9th International Symposium on the Science and Technology of Light Sources. August 2002.
Waymouth, 1971. Electric Discharge Lamps. MIT Press.

29
3.2.2. Small Diameter Lamps
Small diameter linear fluorescent lamps have less surface area, making rare-earth phosphor coatings more cost-competitive. In addition, they could improve the efficiency of a luminaire. This research has a technical potential energy savings of 0.6 quad (primary energy).
Technology Description and Energy Saving Principle
Inexpensive halophosphors (calcium and halophosphate) coat large-diameter T12 lamps. However, a rare-earth phosphor blend would increase the efficacy and CRI of the lamp (IESNA, 2000). Rare-earth phosphors are more efficient in converting UV radiation into visible light, and these narrow-band emitting phosphors have emission peaks spanning the entire visible spectrum, e.g., the red, blue, and green sections of the spectrum. Coating the bulb with these phosphors improves lumen maintenance, color rendition, and efficacy resulting in energy savings (IESNA, 2000). The introduction of small diameter lamps, such as T5s, makes rare-earth phosphor blends cost-effective because the total surface area covered by phosphors is reduced.
In addition, reducing the diameter of linear fluorescent bulbs reduces its surface area, which results in an increase in photon density, or luminance. Although the increase in luminance does not improve the efficacy of a light source, it would increase the efficiency and effectiveness of the light source in a fixture with the proper optical control resulting in energy savings.
Technical Maturity Level
Fluorescent lighting is a mature technology. Most installed fluorescent lamps are T12 and T8 lamps (NCI, 2002); however, the market share of T5 lamps is increasing. All major lamp manufacturers produce fluorescent lamps that use triphosphor blends. Lamps with diameters as small as half an inch (T4) are now commercially available.
Technology Maturity Stage
Basic Science Research Applied Research Exploratory
Development Advanced
Development Engineering Development
Product Demonstration
Commercialization and Sales
Issues with Existing Lighting Products and Systems
The main issue is that smaller diameter linear fluorescent lamps are not interchangeable with existing lighting products. For example, T5 lamps are manufactured in different lengths than T8 and T12, and require different sockets. Nominal four-foot T5 lamps are shorter than equivalent T8 or T12 lamps, and they require miniature bi-pin sockets, whereas T8 and T12 lamps need medium bi-pin sockets. In addition, different diameter lamps have different electrical requirements. For example, T5 lamps require high frequency ballasts because they operate at frequencies greater than 20 kHz. Similarly, T8 and T12 lamps typically cannot operate on the same ballast. However, some luminaires can accept T5 or T8 lamps with appropriate sockets and ballasts (NLPIP, 2002). In order to replace a 400W MH lamp with a T5 requires an entirely new luminaire.

30
Technical Potential and Primary Energy Consumption Impact
Fluorescent light sources consumed 3.4 quads of primary energy in the U.S. in 2001. Of this, T12 lamps consumed 2.2 quads in all sectors (NCI, 2002). Smaller diameter lamps compete for market share primarily with these existing T12 installations. Assuming an efficacy of 90 lm/W for small diameter lamps, and an efficacy of 66 lm/W for T12 lamps (NCI, 2002), the potential energy savings of 100% market replacement across all sectors is 0.6 quad.
Table 3-9: Technical Potential Energy Savings for Small Diameter Lamps
Technology Sectors Current Consumption
Efficacy New Technology
Efficacy Old Technology
Potential Consumption
Energy Savings
Smaller Diameter Lamps
T12 Fluorescent (C/I/O)13 2.2 quads 90 lm/W 66 lm/W 1.6 quads 0.6 quad
Performance Information: Data and Source
Table 3-10 lists wattage, lifetime, CRI, lumen output and efficacy of commercially available T12, T8 and T5 diameter fluorescent lamps. In part, the T8 and T5 diameter lamps are more efficient than T12 because of their use of the more costly rare-earth phosphors.
Table 3-10: Power, Lumen Output, CRI, and Efficiency for Fluorescent Lamps
Lamp Type Power Life CRI Initial Light Output Mean Efficacy
F40T12 40 W 9,000 – 20,000 hrs. 62 2,880-3,400 lumens 72-85 lm/W*
F32T8 32 W 20,000 hrs. 75 2,800-2,950 lumens 87-92 lm/W*
F28T5 28 W 20,000 hrs. 82 2,610-2,900 lumens 93-103 lm/W Source: Sylvania, 2003; GE, 2004; Philips, 2004. * Published efficacy measured on 60 Hz reference ballast. For F32T8, add 9% to account for operation at high frequency (Roberts, 2003).
Another advantage of smaller diameter lamps is an improvement in optical control of light. Table 3-11 shows a comparison of T5 and T12 lamps with equivalent light output and the improvement in luminous intensity of luminaires with T5 lamps. Since the luminance of small diameter lamps is potentially greater than larger diameter lamps, lighting fixtures outfitted with a well-designed reflector could significantly improve the ability to place light where needed. The example in Table 3-11 shows a 146% increase in maximum luminaire intensity from a 2’ x 2’ troffer with reflector.
Table 3-11: Luminous Intensity of Small Diameter Lamps in a Typical 2'x 2' Troffer
Lamp Type
Power Light Output
Diameter Length Exitance Luminance Maximum Intensity
T12 20 W 1,190 lm 1 ½ in. 24 in. 10.5 lm/ft2 3.4 candelas/ft2 1,931 candelas
T5 14 W 1,220 lm 5/8 in. 24 in. 25.9 lm/ft2 8.2 candelas/ft2 4,752 candelas
% Increase of maximum luminous intensity of luminaire at nadir 146% Source: Sylvania, 2003.
13 C = Commercial, I = Industrial, O = Outdoor

31
Cost Information: Data and Source
Table 3-12 shows the price of 4 ft. nominal fluorescent lamps. The T8 lamp in the table below only uses rare-earth phosphors, but it is cheaper than the rare-earth/halo-phosphor blend lamps14 used in the T12. A combination of high production volumes, smaller size, and thinner phosphor coatings (T12 require thicker coating) makes this possible. Although T5 lamps are more expensive than T8 lamps, prices should be more competitive as production volumes increase.
Table 3-12: Price of Linear Fluorescent Lamps with Rare-Earth Phosphors
Lamp Type Power Phosphor CRI Price
T12 40 W Blend 80 $4.51
T8 32 W Rare-earth 82 $2.31
T5 28 W Rare-earth 82 $5.70 Source: Sylvania, 2003; Kwhlighting.com, 2003.
Non-Energy Benefits of Technology
The smaller size of T5 and T8 lamps, when compared to T12 lamps, reduces the amount of material needed to manufacture the product, which reduces impact on the environment. The reduced surface area of T5 lamps, compared to T12 lamps, reduces glass and phosphor use by 60%, and packaging materials by up to 50% (NLPIP, 2002). In addition, smaller diameter lamps have less mercury content. Reduction in luminaire size would further decrease raw materials needed for packaging and shipping.
Lighting designers and installers can hide smaller lamps and fixtures, which makes the lighting system more aesthetically pleasing (Simkar, 2003).
Notable Developers/Manufacturers of Technology
General Electric, OSRAM Sylvania, and Philips Lighting, Panasonic, and Matsushita all produce fluorescent T5 and T8 lamps coated with rare-earth phosphors.
Peak Demand Impact Potential
Because of the coincidence between fluorescent lamp operation and peak demand periods, most of the energy consumption occurs during peak demand hours. An efficacy improvement would result in peak demand reduction.
Promising Applications
Smaller diameter lamps are well suited for applications such as hospitality, commercial display cases, upscale retail, wall washing, and other places where light output control is important. Their smaller size also allows this type of light to be used in fluorescent direct/indirect pendant fixtures and mountings (Simkar, 2003).
14 The blends, or double-coated lamps, have a coat of halo-phosphor and a coat of rare-earth phosphors. Double-coat lamps, which have a thick tri-phosphor coat, are expensive but have very good color rendering properties. Double-coat lamps with a thin tri-phosphor coat are much less expensive, but still have full light output and reasonably good color rendering.

32
Perceived Barriers to Market Adoption
The major barrier to market adoption is high initial cost. The exclusive use of rare-earth phosphors in T5 lamps is one reason for higher cost, when compared to T815 and T12 lamps, for which there may be a mix of rare-earth and the cheaper halo-phosphor (NLPIP, 2002). However, as demand for T5 lamps increase, economies of scale may eventually lower costs down to be equal or cheaper than T8 lamps.
Data Gaps and Next Steps
To further increase the market acceptance of smaller diameter lamps, their initial cost must fall to a more competitive level. In addition, manufacturers must continue to develop luminaries with better optics to exploit the optical potential of small diameter lamps. See section 4.1, Fixtures.
References
IESNA, 2000. The IESNA Lighting Handbook: Reference and Application, 9th Edition. M.S. Rea. Illuminating Engineering Society of North America. New York: 2000.
Kwhlighting.com, 2003. Lamp prices; accessed on November 13, 2003 at http://www.kwhlighting.com.
OSRAM Sylvania, 2003. “Pentron HO High Output T5 Fluorescent Lamps.” Lighting News. OSRAM Sylvania; accessed on August 27, 2003 at http://www.sylvania.com/business/news/1101.htm.
NLPIP, 2002. “T5 Fluorescent Systems.” Lighting Answers. National Lighting Product Information Program. The Lighting Research Center. Volume 6, Issue 1.
Roberts, 2003. Letter from Roberts Research & Consulting, Inc. to the editor of Lighting Design + Application regarding the Research Recap column in the January 2003 issue.
Simkar, 2003. “T5 Technology Sheet.” Lighting Education. Simkar Lighting Corporation; accessed on August 27, 2003 at http://www.simkar.com/t5.htm.
Sylvania, 1999. “Quicktronic QT-FM T2 Fluorescent Systems.” Lighting News. September 1999. OSRAM Sylvania; accessed on September 4, 2003 at http://www.sylvania.com/business/news/0999.htm#one.
Sylvania, 2003. Online Product Catalog. OSRAM Sylvania; accessed on December 2, 2003 at http://ecom.mysylvania.com/sylvaniab2c/b2c/z_login.do.
15 At present, almost all T8 lamps use rare-earth phosphors, not a mix of rare-earth and halophosphate.

33
3.2.3. Dimmable Instant-Start Ballasts
The technical potential energy savings estimate for dimmable instant-start ballasts is 0.4 quad (primary energy). The range that an instant-start fluorescent lamp can dim is limited because it does not have provisions for discrete electrode heating.
Technology Description and Energy Saving Principle
Fluorescent lamps designed specifically for instant-start operation were: (a) introduced in 1944, (b) dubbed “slimline lamps” (DiLouie and Lane, 2003) and (c) had only one electrical contact pin at each end of the lamp. Because single-pin lamps lack the ability to have their electrodes heated by circulating current, they were not recommended for operation on dimmable ballasts (IESNA, 2000). Operating these lamps at reduced current (less than full light output) could significantly decrease its useful life. However, it may be possible to operate a fluorescent lamp at high ballast factor, thereby providing adequate range of dimming with minimal impact on lamp life for use with lighting control systems.
Instant-start ballasts do not waste energy by continually heating a lamp’s electrodes. If instant-start lamps could dim and if they could operate in conjunction with lighting controls (e.g. occupancy sensors), energy savings would result.
Technical Maturity Level
While instant-start ballasts have been available for almost sixty years, there are no commercially available dimmable instant-start ballasts. However, there has been renewed interest, particularly in California, in this technology in recent years due to the energy crisis. In response, ballast manufacturers and the Lighting Research Center at Rensselaer Polytechnic Institute are developing a dimmable instant-start ballast system (LRC, 2003).
Technology Maturity Stage
Basic Science Research Applied Research Exploratory
Development Advanced
Development Engineering Development
Product Demonstration
Commercialization and Sales
Issues with Existing Lighting Products and Systems
Today’s four-pin T8 fluorescent lamps have both a rapid-start and an instant-start rating with most operated on instant-start electronic ballasts. Although instant-start lamp and ballast systems can integrate with a majority of existing lighting controls and infrastructures, there may be significant short-term and long-term compatibility issues when ballasts (e.g., instant-start ballast) dim lamps without external electrode heating. Current fluorescent lamps require the electrodes to maintain a certain temperature to remain emissive to prevent the arc discharge from extinguishing. In addition, long-term effects of operating these lamps at less than full light output without tertiary electrode heating are not known.
Technical Potential and Primary Energy Consumption Impact
There are approximately 3.18 billion linear fluorescent lamps in use in the commercial and industrial sector in the United States (NCI, 2002). Although there are no data available tracking the breakdown of lamps, data exist on ballast shipments disaggregated into three categories: rapid-start, instant-start, and dimming. From 1997 to 2003, the proportion of instant-start ballasts to other types of ballasts remained

34
relatively constant at greater than 80% (DOC, 2003). Applying this breakdown to fluorescent lamps, there are approximately 2.54 billion lamps operating under instant-start ballasts in the U.S. commercial and industrial sector. These lamps also represent 80% of the energy consumption in the commercial and industrial sector. This corresponds to an energy consumption estimate of 1.8 quads in the commercial sector and 0.6 quad in the industrial sector (NCI, 2002). The combination of lighting controls and instant-start dimmable ballasts could reduce U.S. annual energy consumption by 15% (LRC, 2003), or 0.4 quad.
Table 3-13: Technical Potential Energy Savings of Dimmable Instant-Start Ballasts
Technology Sectors Current Consumption
% Energy Savings
Potential Consumption Energy Savings
Commercial 1.8 quads 15% 1.50 quad 0.3 quad
Industrial 0.6 quad 15% 0.5 quad 0.1 quad Dimming
Instant-Start Ballasts Total Energy Savings 0.4 quad
Performance Information: Data and Source
Typical efficiencies of electronic fluorescent ballasts are in the range of 85% to 90%. Approximately 10% to 15% of the energy inputted to the ballast is lost as heat. The best high-efficiency ballasts have an efficiency of approximately 92% (Lightfair, 2003).
Although dimming instant-start systems are not currently available, researchers at the Lighting Research Center were able to dim instant-start lamps without providing any tertiary heating to the electrodes to 30% of full light output.
Cost Information: Data and Source
Since this technology does not yet exist, cost information is not available. Instead, Table 3-14 shows price data for current systems indicative of what the market would bear.
Table 3-14: Ballast Price, by Type
Ballast Type Lamp Type Number of Lamps Price
Instant-Start Ballast F32T8 1 and 2 $8.91
Rapid-Start Ballast F32T8 N/a $12.87
Dimming Ballast F32T8 N/a $31.19 Source: DOC, 2003.
Non-Energy Benefits of Technology
Dimming capabilities for instant-start fluorescent lamps would allow freedom in lighting design. In multi-use spaces, the lighting can adjust for distinct situations that require different lighting levels. In addition, instant-start systems utilizing electronic ballasts provide instantaneous and flicker-free light.
Notable Developers/Manufacturers of the Technology
The Lighting Research Center (LRC) believes load-shedding systems utilizing dimmable instant-start ballasts are a viable method for reducing energy consumption by lighting during periods of peak demand.

35
To this end, the LRC is developing dimmable instant-start ballasts, and has succeeded in dimming light output 30% to 60% in lamps controlled by these ballasts (LRC, 2003).
Peak Demand Impact Potential
Application of this technology in conjunction with a control system that monitors and responds to energy demand could result in a peak demand reduction. Since short-term reductions in light levels may not have impact on worker performance, this technology could reduce lighting energy consumption during peak demand by up to 50% for short time periods (LRC, 2003).
Promising Applications
Promising applications for instant-start lamps include discount stores, supermarkets, storage areas, industrial applications, display cases, and other applications where lamps are not frequently cycled (Sylvania, 2003).
Perceived Barriers to Market Adoption
While dimmable instant-start ballasts do not yet exist, high first cost is expected to be the most significant barrier to market adoption. Next, reliability of the product and its impact on lamp life would impact its long-term growth and penetration potential. In addition, this technology is very similar in function to existing four-wire systems, and it may be difficult for consumers to differentiate.
Data Gaps and Next Steps
Developers need to demonstrate a commercially viable low-cost design. For example, a three-level discrete-dimming system could be accomplished by operating an instant start lamp at current levels corresponding to those of commercial instant start ballasts with low, nominal and high ballast factor. Dimming control and communication could be as simple as a two-bit signal setting the ballast power level to: off, low, nominal and high.
The long-term effects of dimming on lamp performance are not known. Therefore, studies need to characterize the impact of dimming on lamp performance. Then, manufacturers need to develop lamps designed to dim without added electrode heating while maintaining reasonable lamp life. In addition, the impact of ambient temperature on dimming performance of lamps without cathode heating is not fully understood.
The impact of repeated short-term dimming on worker performance is not known and may warrant further research
References
DiLouie and Lane, 2003. “Light Sources.” Lighting Library. Search Spec; accessed on February 4, 2004 at http://www.searchspec.com/library/articles-indoor012.html.
DOC, 2003. “Fluorescent Lamp Ballasts: 2002.” Current Industrial Reports. MQ335C (02)-5. May 2003. U.S Census Bureau. Department of Commerce; accessed on February 4, 2004 at http://www.census.gov/industry/1/mq335c025.pdf.
IESNA, 2000. The IESNA Lighting Handbook: Reference and Application, 9th Edition. M.S. Rea. Illuminating Engineering Society of North America. New York. 2000.

36
Lightfair, 2003. Personal Communication with manufacturers of lighting devices. Lightfair 2003 in Javits Convention Center, Manhattan, New York on May 3-8, 2003.
LRC, 2003. “Load Shedding Systems May Reduce Power Outages.” LRC News. Lighting Research Center; accessed on October 9, 2003 at http://www.lrc.rpi.edu/resources/news/enews/Oct03/general93.html.
NCI, 2002. U.S. Lighting Market Characterization Volume I: National Lighting Inventory and Energy Consumption Estimate. Prepared by Navigant Consulting, Inc. for the Department of Energy. Washington D.C. September 2002.
MagnaTek, 1999. “Understanding the Benefits of Instant Start Ballasts.” Bright Ideas. Volume 2, Issue 3. MagneTek Lighting Products Group; accessed on August 29, 2003 at http://www.universalballast.com/pdf/5581_99.pdf.
Philips, 2002. “Alto Advantage T8 Fluorescent Lamps.” Product Sheet. Philips Lighting; accessed on August 29, 2003 at http://www.lighting.philips.com/nam/products/fluor/pdf/p-5369b.pdf.

37
3.2.4. Efficient Ballasts
The development of rapid-start and dimming ballasts that do not continuously heat lamp electrodes during full light, steady-state operation has the technical potential to save 0.01 quad of energy per year (primary energy).
Technology Description and Energy Saving Principle
Existing rapid-start and dimming systems employ a two-pin connection to each end of each four-pin lamp for a total of four connections per lamp (IESNA, 2000). Each of the two wires connected to each end of the four-pin lamp carry a combination of electrode heating and discharge currents.
Instant-start systems, whether they incorporate a two-pin lamp or a four-pin lamp, use a simple one-wire connection to each end of each lamp (total of two connections per lamp). Product developers have developed instant-start dimming ballasts that do not provide current to heat the lamp’s electrodes. The dimming function of such ballasts is controlled by two low-voltage wires considered to be electrical inputs to the ballast. The two-wire dimming control circuitry consumes approximately two watts per ballast during ballast operation (MagneTek, 1999).
If rapid-start and dimming systems were developed for four-pin lamps to provide electrode heating current only during starting and during times of reduced lamp current operation when additional electrode heat is needed, such systems would consume less energy. Additional energy savings would be realized if the electrode heating versus dimming level were optimized.
Technical Maturity Level
Currently, there are no commercially available fluorescent systems that dim without discrete electrode heating. Fluorescent dimming systems use four-wire electronic ballasts and permit dimming typically down to 10% of full light output; some are even capable of dimming lamps down to 1%. In general, a low-voltage signal (0-10V) instructs the ballast to change the current to the lamp (PG&E, 2003).
Technology Maturity Stage
Basic Science Research
Applied Research Exploratory Development
Advanced Development
Engineering Development
Product Demonstration
Commercialization and Sales
Issues with Existing Lighting Products and Systems
There may be serious short-term and long-term compatibility issues when ballasts (e.g., an instant-start ballast) dim lamps without external electrode heating. Current fluorescent lamps require the electrodes to sustain sufficient temperature to maintain the arc discharge. In addition, long-term effects of operating these lamps at less than full light output without tertiary electrode heating are not known.
Technical Potential and Primary Energy Consumption Impact
The decrease in power consumption due to the elimination of continuous cathode heating is approximately two watts per lamp for rapid-start lamps (Magnatek, 1999). There are approximately 3.2 billion linear fluorescent lamps in use in the U.S. commercial and industrial sectors (NCI, 2002).

38
Although there are no data about the breakdown of lamps, data exist on ballast shipments, disaggregated into three categories: rapid-start, instant-start, and dimming. Approximately 7.11% of ballasts shipped in 2002 were rapid-start and dimming (DOC, 2003). Applying this proportion to lamps, there are approximately 225 million rapid-start and dimming linear fluorescent lamps in the commercial and industrial sectors. Assuming rapid-start and dimming ballasts represent approximately 7.11% of the total linear fluorescent lamp population, they would represent 7.11% of the energy consumption in that lighting category. This corresponds to 0.16 quads in the commercial and industrial sector (NCI, 2002). The average wattages of linear fluorescent lamps in the commercial and industrial sectors are 39 watts and 40 watts, respectively. With the elimination of constant electrode heating, these values would decline to 37 watts and 38 watts, respectively, correlating to a 5% decrease in energy consumption. A 5% decrease in energy consumption would result in energy savings of 0.01 quad per year. Table 3-15 shows the results of this calculation below.
Table 3-15: Technical Potential Energy Savings of Energy Efficient Ballasts
Technology Sectors Current Consumption
Percent Savings
Potential Consumption
Energy Savings
Commercial 0.16 quads 5 % 0.15 quads 0.008 quad
Industrial 0.06 quads 5 % 0.05 quads 0.003 quad Energy Efficient Rapid-Start/Dimming Ballasts
Total 0.01 quad
Performance Information: Data and Source
Commercially available fluorescent dimming systems use four-wire electronic ballasts and are capable of dimming lamps down to 1% of full light output.
Typical efficiencies of electronic fluorescent ballasts are in the range of 85% to 90%. Approximately 10% to 15% of the input energy to the ballast is lost as conducted heat. The best high-efficiency ballasts have an efficiency of approximately 92% (Lightfair, 2003).
Cost Information: Data and Source
Existing rapid-start ballasts, dimming ballasts and possibly fluorescent lamps (e.g. – electrode, fill gas, etc.) may require modification if the new systems, with or without greatly reduced and controlled electrode heat, maintain life and performance of existing fluorescent lamp systems. Since such systems are not available, market price information is not available. Instead, Table 3-16 includes market price data for existing systems to give the reader an indication of what price the market would bear.
Table 3-16: Ballast Price, by Type
Ballast Type Lamp Type Number of Lamps Price
Instant-Start Ballast F32T8 1 and 2 $8.91
Rapid-Start Ballast F32T8 N/a $12.87
Dimming Ballast F32T8 N/a $31.19
Source: DOC, 2003.

39
Non-Energy Benefits of the Technology
Since this technology would only apply filament heating when necessary, it would reduce the evaporation rate of electrode emissive material. That would result in increased life of the lamp.
Notable Developers/Manufacturers of Technology
Fluorescent ballast manufacturers with significant U.S. market presence include: OSRAM Sylvania, General Electric, Philips Lighting, Advance Transformer Company, Tridonic, Robertson Worldwide, and Universal Lighting.
Peak Demand Impact Potential
Most of the energy consumption occurs during peak demand hours, and an improvement in lamp/ballast system efficacy would result in peak demand reduction.
Promising Applications
This technology would replace existing dimming and rapid-start ballasts. Typical applications include offices, schools, retail stores, and hospitals.
Perceived Barriers to Market Adoption
Potentially higher initial costs will hinder rapid adoption of this technology. In addition, the compatibility and reliability of efficient dimming ballasts in a wide variety of environments and applications will determine long-term growth, size and penetration of this technology.
Data Gaps and Next Steps
Manufacturers need to make available rapid-start and dimming ballasts that can perform dimming more efficiently, without continuously heating lamp electrodes.
The long-term effects of dimming on lamp performance are not known. Additional research may help manufacturers understand the relationship between dimming and lamp performance to design better systems.
Sources
DOC, 2003. “Fluorescent Lamp Ballasts: 2002.” Current Industrial Reports. MQ335C (02)-5. May 2003. U.S Census Bureau. Department of Commerce; accessed on February 4, 2004 at http://www.census.gov/industry/1/mq335c025.pdf.
IESNA, 2000. The IESNA Lighting Handbook: Reference and Application, 9th Edition. M.S. Rea. Illuminating Engineering Society of North America. New York. 2000.
Kwhlighting.com, 2003. Lamp prices; accessed on November 13, 2003 at http://www.kwhlighting.com.
MagnaTek, 1999. “Understanding the Benefits of Instant Start Ballasts.” Bright Ideas. Volume 2, Issue 3. MagneTek Lighting Products Group; accessed on August 29, 2003 at http://www.universalballast.com/pdf/5581_99.pdf.
NCI, 2002. U.S. Lighting Market Characterization Volume I: National Lighting Inventory and Energy Consumption Estimate. Prepared by Navigant Consulting, Inc. for the Department of Energy. Washington D.C. September 2002.

40
NLPIP, 1999. “Dimming Electronic Ballasts.” Specifier Reports. National Lighting Product Information Program. The Lighting Research Center. 1999.
PG&E, 2003. “Energy Efficient Fluorescent Ballasts.” A Pacific Energy Center Factsheet. Pacific Gas and Electric Company; accessed on December 4, 2003 at http://www.pge.com/003_save_energy/003c_edu_train/pec/info_resource/pdf/ballasts.pdf.
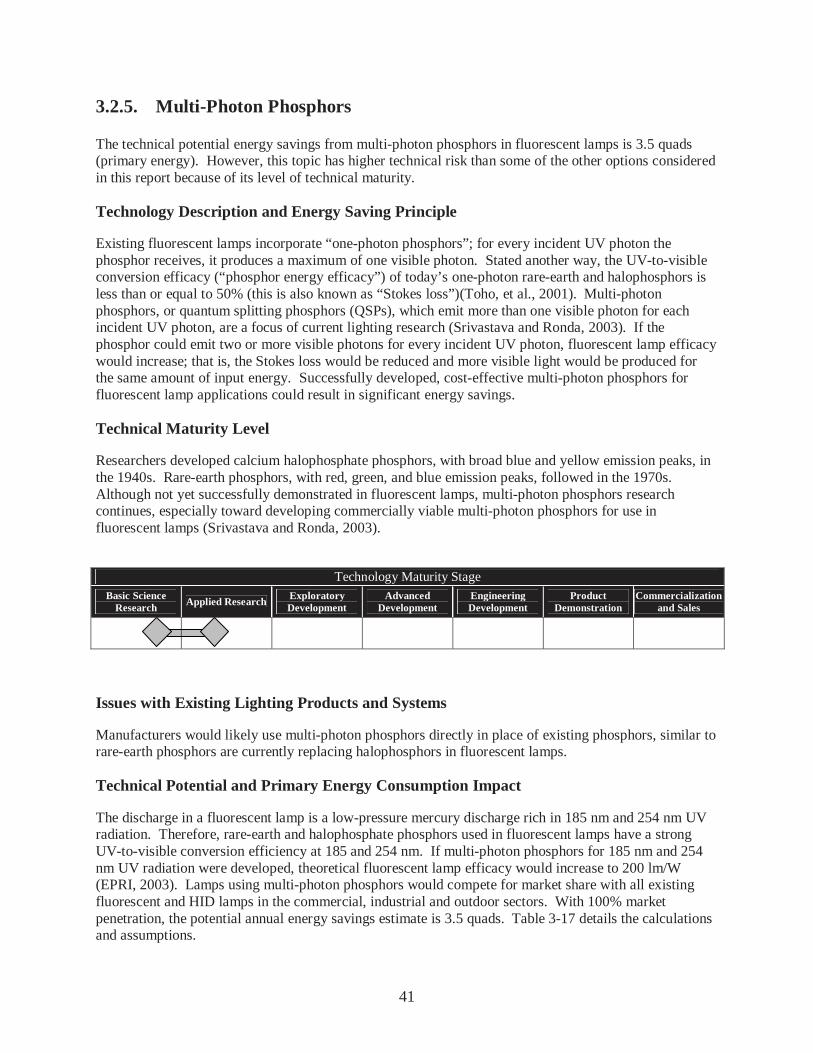
41
3.2.5. Multi-Photon Phosphors
The technical potential energy savings from multi-photon phosphors in fluorescent lamps is 3.5 quads (primary energy). However, this topic has higher technical risk than some of the other options considered in this report because of its level of technical maturity.
Technology Description and Energy Saving Principle
Existing fluorescent lamps incorporate “one-photon phosphors”; for every incident UV photon the phosphor receives, it produces a maximum of one visible photon. Stated another way, the UV-to-visible conversion efficacy (“phosphor energy efficacy”) of today’s one-photon rare-earth and halophosphors is less than or equal to 50% (this is also known as “Stokes loss”)(Toho, et al., 2001). Multi-photon phosphors, or quantum splitting phosphors (QSPs), which emit more than one visible photon for each incident UV photon, are a focus of current lighting research (Srivastava and Ronda, 2003). If the phosphor could emit two or more visible photons for every incident UV photon, fluorescent lamp efficacy would increase; that is, the Stokes loss would be reduced and more visible light would be produced for the same amount of input energy. Successfully developed, cost-effective multi-photon phosphors for fluorescent lamp applications could result in significant energy savings.
Technical Maturity Level
Researchers developed calcium halophosphate phosphors, with broad blue and yellow emission peaks, in the 1940s. Rare-earth phosphors, with red, green, and blue emission peaks, followed in the 1970s. Although not yet successfully demonstrated in fluorescent lamps, multi-photon phosphors research continues, especially toward developing commercially viable multi-photon phosphors for use in fluorescent lamps (Srivastava and Ronda, 2003).
Technology Maturity Stage
Basic Science Research Applied Research Exploratory
Development Advanced
Development Engineering Development
Product Demonstration
Commercialization and Sales
Issues with Existing Lighting Products and Systems
Manufacturers would likely use multi-photon phosphors directly in place of existing phosphors, similar to rare-earth phosphors are currently replacing halophosphors in fluorescent lamps.
Technical Potential and Primary Energy Consumption Impact
The discharge in a fluorescent lamp is a low-pressure mercury discharge rich in 185 nm and 254 nm UV radiation. Therefore, rare-earth and halophosphate phosphors used in fluorescent lamps have a strong UV-to-visible conversion efficiency at 185 and 254 nm. If multi-photon phosphors for 185 nm and 254 nm UV radiation were developed, theoretical fluorescent lamp efficacy would increase to 200 lm/W (EPRI, 2003). Lamps using multi-photon phosphors would compete for market share with all existing fluorescent and HID lamps in the commercial, industrial and outdoor sectors. With 100% market penetration, the potential annual energy savings estimate is 3.5 quads. Table 3-17 details the calculations and assumptions.
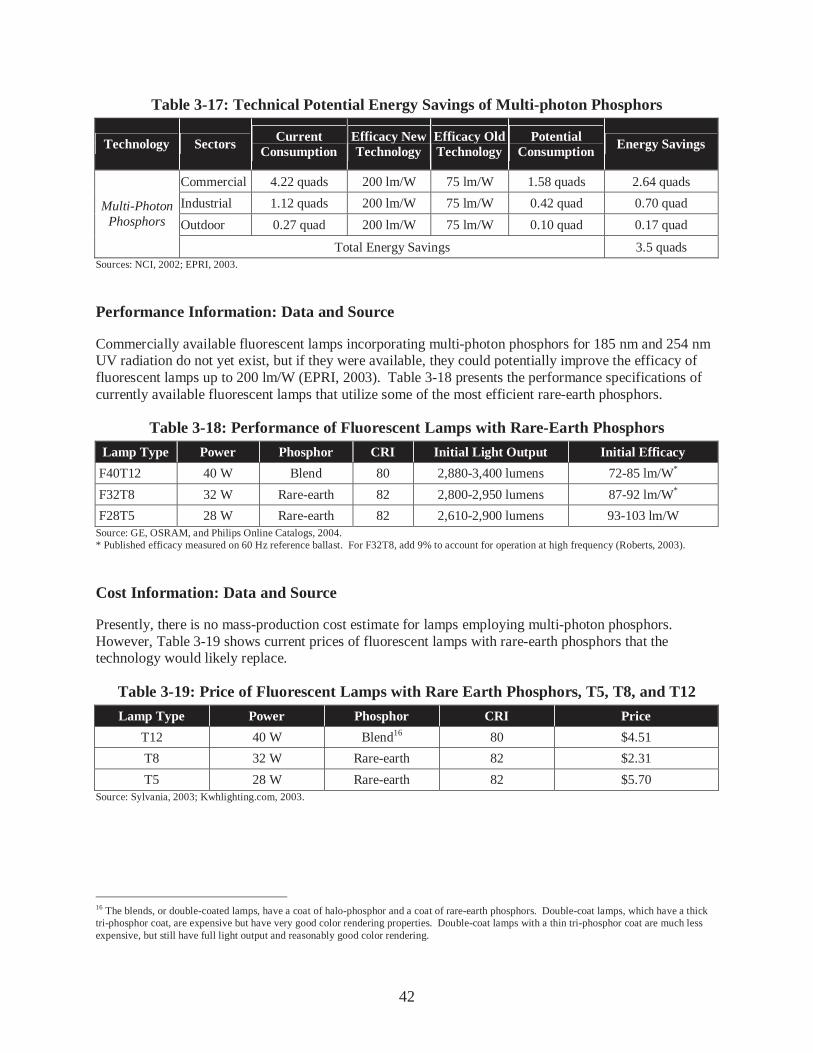
42
Table 3-17: Technical Potential Energy Savings of Multi-photon Phosphors
Technology Sectors Current Consumption
Efficacy New Technology
Efficacy Old Technology
Potential Consumption Energy Savings
Commercial 4.22 quads 200 lm/W 75 lm/W 1.58 quads 2.64 quads
Industrial 1.12 quads 200 lm/W 75 lm/W 0.42 quad 0.70 quad
Outdoor 0.27 quad 200 lm/W 75 lm/W 0.10 quad 0.17 quad
Multi-Photon Phosphors
Total Energy Savings 3.5 quads Sources: NCI, 2002; EPRI, 2003.
Performance Information: Data and Source
Commercially available fluorescent lamps incorporating multi-photon phosphors for 185 nm and 254 nm UV radiation do not yet exist, but if they were available, they could potentially improve the efficacy of fluorescent lamps up to 200 lm/W (EPRI, 2003). Table 3-18 presents the performance specifications of currently available fluorescent lamps that utilize some of the most efficient rare-earth phosphors.
Table 3-18: Performance of Fluorescent Lamps with Rare-Earth Phosphors
Lamp Type Power Phosphor CRI Initial Light Output Initial Efficacy
F40T12 40 W Blend 80 2,880-3,400 lumens 72-85 lm/W*
F32T8 32 W Rare-earth 82 2,800-2,950 lumens 87-92 lm/W*
F28T5 28 W Rare-earth 82 2,610-2,900 lumens 93-103 lm/W Source: GE, OSRAM, and Philips Online Catalogs, 2004. * Published efficacy measured on 60 Hz reference ballast. For F32T8, add 9% to account for operation at high frequency (Roberts, 2003).
Cost Information: Data and Source
Presently, there is no mass-production cost estimate for lamps employing multi-photon phosphors. However, Table 3-19 shows current prices of fluorescent lamps with rare-earth phosphors that the technology would likely replace.
Table 3-19: Price of Fluorescent Lamps with Rare Earth Phosphors, T5, T8, and T12
Lamp Type Power Phosphor CRI Price
T12 40 W Blend16 80 $4.51
T8 32 W Rare-earth 82 $2.31
T5 28 W Rare-earth 82 $5.70 Source: Sylvania, 2003; Kwhlighting.com, 2003.
16 The blends, or double-coated lamps, have a coat of halo-phosphor and a coat of rare-earth phosphors. Double-coat lamps, which have a thick tri-phosphor coat, are expensive but have very good color rendering properties. Double-coat lamps with a thin tri-phosphor coat are much less expensive, but still have full light output and reasonably good color rendering.

43
Non-Energy Benefits of the Technology
Multi-photon phosphors would be more expensive than current phosphors, and would likely use small diameter lamps. The smaller surface area of T5 and T8 lamps, compared to T12 lamps, reduces the amount of phosphor material needed to coat the bulb wall, which reduces impact on the environment. Smaller T5 lamps, compared to T12 lamps, reduce glass and phosphor use by 60%, and packaging materials by up to 50% (NLPIP, 2002). Reduction in luminaire size would further decrease raw materials needed for packaging and shipping. In addition, lighting designers can easily hide the smaller lamp and fixture, which makes the lighting system more aesthetically pleasing (Simkar, 2003).
Notable Developers/Manufacturers of the Technology
A number of institutions and manufacturers conduct research on multi-photon phosphors including: Electric Power Research Institute (EPRI), OSRAM Sylvania, Los Alamos National Lab, NASA, Boston College, College of the Holy Cross, MIT, LBNL, Oregon State University, Pennsylvania State University, UCSD, University of Georgia and Utrecht University (DOE, 2003).
Peak Demand Impact Potential
Most of the energy consumption of fluorescent lighting systems occurs during peak hours. Thus, the energy consumption of this light source would be coincident with peak demand, and an improvement in lamp efficacy would result in peak demand reduction.
Promising Applications
The anticipated high cost of novel phosphors would limit their use to small diameter fluorescent lamps. Therefore, applications that utilize luminaires with optical control would be the first to benefit from this technology because these luminaires typically command a higher premium and would be better equipped to absorb the higher cost of these new lamps.
Perceived Barriers to Market Adoption
Multi-photon phosphors for commercial applications are not yet available. However, their anticipated high cost would present a significant barrier to market adoption. Additionally, the high efficiencies may present challenges in retrofit applications. Because this technology will likely result in lamps with twice the efficacy and hence twice the light output for the same wattage lamp, end-users may not be able to simply replace current lamps and get the same light for half the energy. Instead, new lamps, ballasts, and fixtures may need to be designed and installed to realize the energy savings.
Data Gaps and Next Steps
Some distinction needs to be drawn between the technical risk and benefit of developing a quantum-splitting phosphor for lamps in general and developing one that can double the efficiency of current fluorescent lamps, which requires compatibility with mercury and mercury’s 254 nanometer radiation. A DOE sponsored workshop to develop research directions for multi-photon phosphor research identified the following technical areas for further research in that area:
• Trivalent lathanide ions. Little is known of the spectroscopy of higher energy levels
leading up to dissociation energies in these ions. It has been proposed that theoretical and spectroscopic studies could reveal important potential pathways for radiative

44
recombination and relaxation. This could yield the desired result of a multi-photon emission (DOE, 2003).
• Fluorides. Fluorides are a promising candidate system for efficient multi-photon emission processes. It was decided that basic theoretical and spectroscopic research should explore these candidate systems and continue to identify efficient radiative emission pathways. If quantum mechanically possible and efficient photonic pathways are identified, more applied research into important practical issues like synthesis and stability could begin (DOE, 2003).
• Alternate pathways. Research could be completed to explore desirable radiative transitions using conventional oxide-based phosphors with appropriate sensitizers, activators and/or suitable hosts. A systematic survey of candidate possibilities has not yet been reported. Moreover, the workshop identified gaps in the knowledge base and recommended exploration of certain known cascade ions that might produce favorable multi-photon radiative pathways with suitable sensitizers (DOE, 2003).
References
DOE, 2003. “Advanced Light Source Development: Multi-Photon Phosphor Research.” Office of Building Technologies Program, Department of Energy; accessed on September 23, 2003 at http://www.eere.energy.gov/buildings/research/lighting/multiphoton.cfm.
EPRI, 2003. “The Efficiency Challenge - Making Business Sense with Technology Innovation.” Project Opportunity. Electric Power Research Institute; accessed on October 2, 2003 at http://www.epri.com/journal/details.asp?doctype=features&id=596.
Kwhlighting.com, 2003. Lamp prices; accessed on November 13, 2003 at http://www.kwhlighting.com.
NCI, 2002. U.S. Lighting Market Characterization Volume I: National Lighting Inventory and Energy Consumption Estimate. Prepared by Navigant Consulting, Inc. for the Department of Energy. Washington D.C. September 2002.
Setlur et al., 2001. “Advances in the Development of Quantum Splitting Phosphors.” A..A. Setlur, H.A. Comanzo, A.M. Srivastava, W.W. Beers, W. Jia, S. Huang, L. Lu, X. Wang, and W.M. Yen, W.M. GE Corporate R&D. Luminescence and Luminescent Materials Symposium. Materials Research Society Proceedings. April 2001.
Srivastava and Ronda, 2003. “Phosphors.” A.M. Srivastava and C.R. Ronda. The Electrochemical Society Interface, pp.48-51. Summer 2003.
Toho et al., 2001. “Feasibility of New Phosphor with Metal Atom Activator Isolatedly Fixed in Matrix.” M. Toho, H. Kimura, and S. Yamada. Lighting Products R&D Center. Matsushita Electric Works. The Japan Institute of Metals. 2001.
Wegh et al., 2000. “Quantum Cutting through Downconversion in Rare-Earth Compounds.” R.T. Wegh, H. Donker, E.V.D. van Loef, A. Oskam, and A. Meijerink. Journal of Luminescence.

45
3.3. High-Intensity Discharge (HID)
In 1810, Sir Humphry Davy, an English chemist, demonstrated a discharge lamp to the Royal Institution of Great Britain by creating a small arc between two charcoal rods connected to a battery. Although magnetic induction can also be used to generate the electric field necessary to initiate and maintain an arc discharge, there are no commercially available electrodeless HID lamps that use magnetic induction as the mode of operation. At present, all commercial HID lamps impose a voltage between rods (electrodes). The electrodes are typically solid tungsten with coiled tungsten over-wraps, and are contained within a hermetically sealed arc tube. An emissive coating, composed of several metallic oxides embedded within the turns of the tungsten coil, may also cover the electrodes.17
There are three types of high intensity-discharge (HID) lamps: mercury vapor (MV), metal-halide (MH), and high-pressure sodium (HPS). MV lamps produce light by exciting mercury atoms and ions, and were first sold in 1932. In 1961, Gilbert Reiling patented the first MH lamp, which produces light by exciting several different types of atoms.18 This lamp was introduced at the 1964 World's Fair, and demonstrated an increase of lamp efficacy and color properties, which made it more suitable for commercial, street and industrial lighting.19 HPS lamps produce light by exciting sodium atoms and ions, and were introduced soon after in 1965.
HID lamps require a ballast to supply sufficient starting voltage to ionize gas in the arc tube to initiate the arch discharge, and to regulate current during operation. HID ballasts can be either electromagnetic or electronic. Electromagnetic ballasts operate at the 60 Hz line frequency. Although electronic ballasts can operate at high frequencies, the majority of commercially available electronic ballasts operate at low frequencies due to acoustic resonance issues. In addition, the arc tube of HID lamps contains starting gases that easily ionize at low pressure and temperature as an emission aid during ignition and warm up. The precise mix and content of the starting gas depends on the type of lamp.
The following sections present ten lighting technology options relating to energy savings potential of HID sources.
17 HID electrodes for MV and HPS often have low work function oxide coating materials, but most MH lamps use no emissive coatings.
18 The IESNA Lighting Handbook: Reference and Application, 9th Edition. M.S. Rea. Illuminating Engineering Society of North America. New York. 2000.
19 “Two Centuries of Electric Light Source Innovations” Maxime F. Gendre. Department of Applied Physics, Eindhoven University of Technology; accessed on February 18, 2004 at http://www.einlightred.tue.nl/lightsources/history/light_history.pdf

46
3.3.1. HID Restrike Issues
The technical potential energy savings for this technology is 0.6 quad (primary energy). This research focuses on technology that would enable HID lamps to replace less efficient light sources in applications that it previously could not.
Technology Description and Energy Saving Principle
Any interruption in the power supply or even a voltage dip for a few cycles could cause the arc of an HID lamp to extinguish. The internal temperature of the capsule containing the electrodes and gas filling must cool and, accordingly, the internal vapor pressure must decrease to the point where an arc discharge can reinitiate. This, in addition to a necessary warm-up time for the lamp to reach full output, creates a long delay (Knisley, 2002). Although there are HID systems with hot-restrike capability, they require a high-voltage ignitor that generates a voltage pulse of approximately 20,000 volts to restart a hot lamp. This characteristic of HID lamps has excluded their use in applications where occupants need light instantaneously or need to turn lights on and off frequently. However, the use of instant restart and instant warm-up Xenon Metal Halide HID lamps for automotive headlamps, in use for more than a decade, demonstrate the safety and economic viability of metal halide sources even in demanding off/on applications.
Research and development of ignition aids (e.g., electrode placement and new starting gas mixtures) for HID lamps would enable HID sources to compete in general illumination applications where instant restrike and safety are a concern. HID technology could replace less efficient light sources in these applications, resulting in energy savings.
Technical Maturity Level
The major ballast manufacturers market hot-restrike ignitors for low and medium wattage HPS lamps, and for some single-and double-ended MH lamps. This ignitor instantly restarts a lamp in less than 2 seconds. This restrike accessory can restart the MH lamp’s arc almost immediately following a momentary voltage dip (Knisley, 2002).
Instant restrike MH ballasts are available which include a special high voltage ignitor that supplements standard ballasts so that lamps can restart instantaneously after any power interruption (Venture, 2003). Instant restrike lamps are available in high wattages and generally used for sports lighting and in low wattages generally used for automotive headlamps. No HID lamps have instant restrike capability without the application of a high-voltage pulse across the electrodes.
Technology Maturity Stage
Basic Science Research Applied Research Exploratory
Development Advanced
Development Engineering Development
Product Demonstration
Commercialization and Sales

47
Issues with Existing Lighting Products and Systems
Currently, instant restrike and short warm-up capability for HID lamps requires dedicated ballasts that include a high voltage ignitor. These also require special lamps and a fixture with electromechanical interlocks (Venture Lighting, 2003).
Technical Potential and Primary Energy Consumption Impact
MH lamps with instant on, short warm-up, and instant restrike capabilities could replace a portion of existing fluorescent lamps in the commercial sector with similar requirements for color rendering. Assuming an efficacy of 85 lm/W for MH lamps and an efficacy of 72 lm/W for all fluorescent lamps, this technology could save 0.5 quad of energy with a 100% replacement rate (NCI, 2002). Low-wattage Xenon MH lamps (typically 35 watts) with suitable adjustments in metal halide dose could also replace MR16 and halogen lamps in applications with similar requirements for color rendering. Assuming an efficacy of 85 LPW for MH lamps and an efficacy of 16 LPW for all MR16 and halogen, this technology could save an additional 0.1 quad of energy with a 100% replacement rate for a total of 0.6 quad (NCI, 2002). Table 3-20 presents this calculation.
Table 3-20: Technical Potential Energy Savings of HID with Short Restrike/Warm-up
Technology Sector Current Consumption
Efficacy New Technology
Efficacy Old Technology
Potential Consumption
Energy Savings
Fluorescent – Commercial and Industrial
3.15 quads 85 lm/W 72 lm/W 2.67 quads 0.5 quad
Incandescent/ Halogen – Commercial and Industrial
0.16 quad 85 lm/W 16 lm/W 0.03 quad 0.1 quad
HID Instant Restrike
Total 0.6 quad
Performance Information: Data and Source
Table 3-21 provides standard warm-up and restrike times of several types of HID lamps.
Table 3-21:General Start and Restrike Times of HID Lamps
Lamp Type Start Time Restrike Time
Mercury Vapor 3-9 min. 5-10 min.
Metal Halide 3-5 min. 4-20 min.
High-Pressure Sodium 0.5-1 min. 3-4 min.
Xenon Metal Halide < 1 second < 1 second Source: IESNA, 2000.
Table 3-22 presents the restrike/warm-up characteristics of an instant restart HPS lamp used in conjunction with an instant restrike ignitor. This ignitor replaces the standard ignitor in the ballast circuit. If the system voltage dips, then the ignitor pulses the lamp. It does not restrike the lamp if it extinguishes due to age, which prevents lamp cycling. The restrike time is less than 2 seconds (instantaneous under

48
most conditions), but does not instantly warm up. This delay varies according the length of time that the lamp was extinguished (Universal Ballast, 2002).
Table 3-22: Restrike/Warm-up Characteristics of HPS Lamp with Instant Restrike Ignitor
Time Lamp Extinguished
Restrike Time Light Output of
Re-ignition Lamp Warm-up Time
1 s 2 s 87% 35 seconds
5 s Instant 83% 70 seconds
15 s Instant 76% 130 seconds
30 s Instant 62% 190 seconds
60 s Instant 46% 255 seconds
Cold start Instant 36% 360 seconds Source: Universal Ballast, 2002.
Cost Information: Data and Source
The prices for HPS and MH ignitors range from $16-$33 (PFO Lighting, 2003; Growgear, 2003). This is in addition to the normal lamp and ballast prices.
Non-Energy Benefits of the Technology
Excessively high voltages such as those required by today’s instant restrike HID systems pose significant safety risks. Exposure to these extreme voltages could cause severe pain, heart failure, and even death.
Notable Developers/Manufacturers of the Technology
All major HID ballast manufacturers (Advance Transformer, Venture Lighting, OSRAM Sylvania, GE, Philips, and Universal Ballast, Cooper Lighting, Halophane, EYE Lighting) offer instant restrike ignitors for HPS lamps. Restrike ignitors are also available for MH lamps.
Peak Demand Impact Potential
Most of the energy consumption occurs during peak demand hours. Thus, replacement of less efficient light sources (e.g., incandescent lamps) with HID lamp of higher efficacy would reduce peak demand.
Promising Applications
Current applications for instant restrike/short warm-up HID lamps include sports lighting (i.e., golf courses, horse racing tracks, and ski runs). For stadium lighting, the trend is moving away from large and costly pylon installations towards roof-mounted spot lamps (OSRAM, 2003). Other promising applications include emergency lighting applications, and general illumination of commercial and industrial buildings.
Perceived Barriers to Market Adoption
It is anticipated that the potentially high initial cost of HID lamps with instant restrike and short warm-up would hinder rapid adoption of this technology.

49
Data Gaps and Next Steps
Research into novel starting gas mixtures, such as those used in LPS lamps, must continue towards the objective of developing a lamp with instant strike and restrike characteristics.
References
Growgear, 2003. Lamp prices; accessed on December 5, 2003 at http://www.growgear.com/gg_product_light_accessories.htm.
IESNA, 2000. The IESNA Lighting Handbook: Reference and Application, 9th Edition. M.S. Rea. Illuminating Engineering Society of North America. New York. 2000.
Knisley, 2002. “Metal Halides Offer HID Alternative.” Joe Knisley. Electrical Construction & Maintenance; accessed on December 5, 2003 at http://www.ecmweb.com/ar/electric_metal_halides_offer.
Lithonia, 2003. “Pulse Start HID Lamp/Ballast Systems.” Lithonia Lighting; accessed on December 5, 2003 at http://www.lithonia.com/Energy/EnergyCalculators/PulseStart/default.htm.
OSRAM, 2003. “Lighting Up the World of Sport.” OSRAM Sylvania; accessed on December 5, 2003 at http://www.sylvania.com/aboutus/stories/120199e.htm.
PFO Lighting, 2003. Product listing; accessed on December 5, 2003 at https://www.pfolighting.com/pfoweb/productslist.aspx?WebGroupId=26&selection=8.
Universal Ballast, 2002. HID Ignitors. Catalog. Universal Lighting Technologies; accessed on December 5, 2003 at http://www.universalballast.com/literature/navigator/2002_nav_pdfs/sec5-hid/hid_ignitors.pdf.
Venture Lighting, 2003. “HID Ballasts.” Venture Lighting Power Systems; accessed on December 5, 2003 at http://www.venturelighting.com/Ballast%20Frame%20Page.htm.

50
3.3.2. HID Integral Ballast
Development of HID lamps with integral ballasts would enable them to directly replace incandescent lamps. The technical potential energy savings of this technology option is 0.7 quad (primary energy).
Technology Description and Energy Saving Principle
High-pressure mercury vapor (MV) lamps are already available with integral ballasts. Although self-ballasted MV lamps can directly replace incandescent lamps in the same socket (Star Lighting Products, 2000), these lamps offer little efficacy improvement over incandescent lamps. The self-ballasted MV lamps utilize a continuous tungsten filament to vaporize the mercury, helping to initiate the arc discharge. Additionally, the tungsten filament acts as both an incandescent light source and a current limiting device (Philips, 2003).
If manufacturers packaged conventional ballasts with HID lamps, similarly to integrally ballasted compact fluorescent lamps, they could gain the benefits of an HID lamp without the inefficiencies associated with self-ballasted MV lamps. Integrally ballasted CFLs greater than 100 watts are now available. Manufacturers could adapt these designs for HID lamps, leading to a more efficacious direct replacement for incandescent lamps thereby reducing energy savings. Additional energy savings would result from superior optical control and light output of HID lamps. These characteristics offer the end user the option of reduced power consumption for equivalent utility.
Technical Maturity Level
First introduced in the 1940s, self-ballasted MV lamps are available in the following wattages: 160, 250, 450, and 750 watts (Vantage Lighting, 2003). Other types of HID lamps with integral electronic or magnetic ballasts, such as MH or HPS, are not currently available.
Technology Maturity Stage
Basic Science Research
Applied Research Exploratory Development
Advanced Development
Engineering Development
Product Demonstration
Commercialization and Sales
Issues with Existing Lighting Products and Systems
This technology would operate on the same voltage and frequency of existing incandescent lamps, and could be readily retrofitted into existing incandescent sockets.
Technical Potential and Primary Energy Consumption Impact
Incandescent light sources consumed 3.5 quads of primary energy in 2001 (NCI, 2002). Of this, 58% of incandescent energy was consumed by the residential sector, 39% by the commercial, and 3% by the industrial and outdoor stationary sectors (NCI, 2002).
This technology would target the portion of incandescent lamps that are 60 W or above. The approximate annual energy consumption of these types of lamps is 0.8 quad (NCI, 2002). The energy savings potential of an integral ballast HID depends on the magnitude of the efficacy improvement over incandescent lamps and the level of market penetration. Based on 100% market penetration, an efficacy

51
of 85 lm/W (current efficacy of low wattage ceramic metal halide) and ballast losses of approximately 10%, the technical potential energy savings estimate is 0.7 quad. The base technology is a 100-watt 1,000-hour incandescent lamp with an efficacy of 17 lm/W. Table 3-27 shows the results of this calculation.
Table 3-23: Technical Potential Energy Savings of HID Integral Ballast
Technology Sectors Current Consumption
Efficacy New Technology
Efficacy Old Technology
Potential Consumption
Energy Savings
HID Integral Ballast
Inc. > 60 W 0.8 quad 85 lm/W 17 lm/W 0.1 quad 0.7 quad
Performance Information: Data and Source
Table 3-24 summarizes the performance characteristics of self-ballasted MV lamps, incandescent lamps, low-wattage HID lamps, and screw-base CFL lamps (SCFL). While the efficacy and lumen output of incandescent lamps and self-ballasted MV lamps are comparable, self-ballasted MV lamps may be more efficient when used with optics due to the point source nature of HID lighting (Holophane, 2002).20 This quality allows for superior optical control, resulting in less wasted light. As shown in the table, low-wattage HID lamps are significantly more efficacious than incandescent, self-ballasted MV lamps, and even screwbased CFLs. However, they do not yet exist with integral electronic/magnetic ballasts.
Table 3-24: Performance of Sample Base and Substitute Lamps
Lamp Type Power Life CRI Initial Light Output
Mean Light Output Efficacy
Self-Ballasted MV 160 W 12,000 hrs 50 2,300 lm 1,600 lm 14 lm/W
Self-Ballasted MV 250 W 12,000 hrs 50 5,000 lm 3,750 lm 20 lm/W
Self-Ballasted MV 450 W 16,000 hrs 50 9,100 lm 8,280 lm 20 lm/W
Incandescent Lamp 150 W 750 hrs 100 2,850 lm - 19 lm/W
Incandescent Lamp 200 W 750 hrs 100 3,800 lm - 19 lm/W
Incandescent Lamp 500 W 2,500 hrs 100 8,750 lm - 18 lm/W
Low-Wattage HID Ceramic MH G8.5 20 W 9,000 hrs21 85 1,700 lm 1,200 lm 85 lm/W
SCFL 20 W 10,000 hrs 82 1,200 lm 1,032 lm 52 lm/W
Source: GE, 2003. Online Lighting Catalog.
20 Although HID arc tubes may be somewhat smaller than an incandescent filament of the same light output, they are not point sources.
21 Life is rated in the vertical burning position. If lamp operates in a horizontal configuration, life reduces to 7,500 hrs.

52
Cost Information: Data and Source
Since integral ballast HID lamps do not exist, no cost estimates are available. However, the table below shows a small sampling of current prices for typical B, incandescent, and CFL lamps that the technology would likely replace.
Table 3-25: Price of Self-Ballasted MV Lamps and Substitute Lamps
Lamp Type Power Price
Self-Ballasted MV 160 W $36.50
Self-Ballasted MV 250 W $36.50
Self-Ballasted MV 450 W -
Incandescent Lamp, A Type 150 W $0.98
Incandescent Lamp, A Type 200 W $1.80
Incandescent Lamp, PS Type 500 W $3.05
Low-Wattage HID Ceramic MH G8.5 20 W $91.79
SCFL 30 W $8.91 Source: Bulbco.com, 2003; Kwhlighting.com, 2003.
Non-Energy Benefits of Technology
HID lamps have a longer operating life than incandescent lamps. For example, low wattage HID lamps have a lifetime ten times that of incandescent A-type lamps. The B lamp, a type of integral ballast HID lamp, has a considerably longer life than incandescent lamps- up to 12 times as long. HID lamps also have a weather resistant outer bulb and no fragile filament22, making them more shock resistant (Star Lighting Products, 2000).
HID lamps provide a concentrated light source. This enables HID technology to compete with incandescent technology in applications that require precise optical control of its light output (NLPIP, 1999).
HID lamps are available with higher initial lumen output than CFLs while maintaining their small form factor (NLPIP, 1999). The size of higher power CFLs prohibits use in applications with volume constraints.
Notable Developers/Manufacturers of Technology
General Electric, Philips Lighting, and OSRAM Sylvania produce several self-ballasted MV lamps of different wattages. However, these companies do not market HID lamps with integral electronic/magnetic ballasts. The following companies are NEMA members, and listed as domestic electromagnetic ballast manufacturers: Advance Transformer Company, Cooper Lighting, EYE Lighting International of North America, Genlyte Thomas Group LLC, Holophane, OSRAM Sylvania Electronic Controls Systems, and Universal Lighting Technologies. Electronic HID ballast manufacturers include: Advance Transformer Company, GE Lighting, Universal Lighting Technologies, and Venture Lighting Power Systems.
22 with the exception of the B lamp which has a filament.

53
Peak Demand Impact Potential
For applications listed in the promising applications section, most of the energy consumption occurs during peak hours. Thus, an improvement in lamp efficacy would reduce peak demand.
Promising Applications
Situations with considerable light demand, such as yard lighting, garage lighting, deck lighting, and walkway lighting, offer promising applications for this technology (Bulbco.com, 2003). Other appropriate applications are those in which there are few on/off cycles per day and long operating hours, as is the case in many commercial and industrial applications. However, any current incandescent application that does not incorporate incandescent control systems is a likely candidate for replacement.
Perceived Barriers to Market Adoption
The reliability of integrated electronics that drive lamps of higher wattages is a serious concern. When integral ballast lamps operate in the base-up configuration, they have very short life due to excessive heat. These heat issues do not affect current self-ballasted MV lamps because they use an incandescent filament for the ballast instead of an electronic circuit.
The high initial cost of integral ballast HID lamps compared to incandescent lamps may also be a significant barrier to market adoption, particularly in residential applications. In addition, issues concerning hot restrike and warm-up time must be addressed to pave the way for consumer acceptance, particularly in the residential market.
Data Gaps and Next Steps
In order to exploit the energy savings which would result from HID integral ballast technology, the first step is to develop small and inexpensive disposable ballasts that can be packaged integrally with an HID lamp, similar to existing SCFLs.
Manufacturers must overcome the limitations of electronic ballast technology to allow reliable high temperature operation. Presently, electronic ballasts integrated with HID lamps (i.e., HID lamps in excess of 50 watts) would not likely survive operation in a base-up configuration in typical fixtures. Therefore, major advances in high temperature electronic ballast technology are required.
There is also a need for a greater variety of low-wattage HID lamps that could effectively replace the appropriate incandescent technology.
References
Antón et al., 2003. “Measurement System for Characterization of High Intensity Discharge Lamps (HID) Operating at High Frequency.” J.C. Antón, C. Blanco, F. Ferrero, J.C. Viera, and G. Zissis. IEEE, 1359-1363.
Bulbco.com, 2003. “Self-Ballasted Mercury Vapor Lamp.” Online Product Catalog. Bulbco.com; accessed on September 8, 2003 at http://www.bulbco.com/hselfballasted.html.
Halophane, 2002. “Light Sources and Lamp Characteristics.” Lighting Fundamentals. Halophane; accessed on September 8, 2003 at http://www.holophane.com/product/pdfs/7-8.pdf.
IESNA, 2000. The IESNA Lighting Handbook: Reference and Application, 9th Edition. M.S. Rea. Illuminating Engineering Society of North America. New York: 2000.

54
Kwhlighting.com, 2003. Lamp prices; accessed on November 13, 2003 at http://www.kwhlighting.com.
Krasco and Maher, 2003. “Energy Balance of Metal Halide Lamps in Quartz and Ceramic Envelopes.” Krasco and Maher. ICOPS 2000. 27th IEEE International Conference on Plasma Science. IEEE Conference Record - Abstracts, p. 256.
NCI, 2002. U.S. Lighting Market Characterization Volume I: National Lighting Inventory and Energy Consumption Estimate. Prepared by Navigant Consulting, Inc. for the Department of Energy. Washington D.C. September 2002.
NLPIP, 1999. “Screwbase Compact Fluorescent Lamp Products.” Specifier Report. National Lighting Product Information Program. Volume 7, Number 1. June 1999.
Philips, 2003. “H.I.D Lamps.” OEM General Lighting. Lighting Product Catalog. Philips Europe; accessed on August 28, 2003 at http://www.eur.lighting.philips.com/int_en/oem/ca/general/products/catalogue/Chapter_04/5237s.pdf.
Residential Landscape Lighting & Design, 2003. “Mercury Vapor Fixtures.” Product List. Residential Landscape Lighting & Design; accessed on August 28, 2003 at http://www.residential-landscape-lighting-design.com/store/PPF/Category_ID/39_6/products.asp.
Star Lighting Products, 2000. “Self-Ballasted Mercury Vapor Lamps.” Star Lighting Products; accessed on September 8, 2003 at http://www.starlightingproducts.com/products/mercury.asp.
Vantage Lighting, 2003. “Self Ballasted Mercury.” Product Catalog. Vantage Lighting; accessed on September 5, 2003 at http://www.vanltg.com/georder/ge-page18.htm.

55
3.3.3. HID Low-Wattage
Low wattage MH lamps could potentially replace incandescent lamps in many applications. The technical potential energy savings of this technology option is 0.7 quad (primary energy).
Technology Description and Energy Saving Principle
Incandescent lamps are significantly less efficient than HID sources. Only 5% to 10% of the total input power consumed by incandescent lamps converts into light. More efficient low power HID lamps can directly or indirectly replace incandescent lamps in several applications. In addition, the smaller size of a low wattage HID lamp and higher luminance of the arc discharge can improve optical control. Therefore, in certain applications, a fixture can use a lamp with lower lumen light output without sacrificing utility.
Almost all current HID lamps are mid/high wattage. These higher power lamps are not a realistic substitute for many incandescent applications that do not require high light output. If low-wattage HID technologies replaced incandescent lamps, it could result in significant energy savings.
Technical Maturity Level
During the last two decades, manufacturers have worked to develop lower wattage HID lamps. Currently, GE manufactures the lowest wattage HID lamp, a 20-watt ceramic MH lamp for use in retail and display lighting, where smaller size lamps are advantageous. The compact size of this 20-watt lamp permits small luminaire size and very precise optics while producing a high level of light output (GE, 2003).
Technology Maturity Stage
Basic Science Research Applied Research Exploratory
Development Advanced
Development Engineering Development
Product Demonstration
Commercialization and Sales
Issues with Existing Lighting Products and Systems
Replacing incandescent lighting with an HID lighting system requires the addition of a ballast (NLPIP, 1999). In addition, a dedicated luminaire is necessary in order to take advantage of optical improvements.
Technical Potential and Primary Energy Consumption Impact
Incandescent light sources consumed 3.5 quads of primary energy in 2001 (NCI, 2002). HID low power technology would target the portion of incandescent lamps greater than 60 watts. The approximate annual energy consumption of these types of lamps is 0.8 quads (NCI, 2002). The energy savings potential of low power HID depends on the magnitude of efficacy improvement over incandescent lamps and the level of market penetration. Based on 100% market penetration, an efficacy of 85 lm/W (current efficacy of low wattage ceramic metal halide lamps) and ballast efficiency of approximately 90%, the potential energy savings estimate is 0.7 quads over the baseline technology, assumed to be a 100-watt 1,000-hour incandescent lamp with an efficacy of 17 lm/W. Table 3-27 shows the results of this calculation.

56
Table 3-26: Technical Potential Energy Savings of Low-Wattage MH Lamps
Technology Sectors Current
Consumption Efficacy New Technology
Efficacy Old Technology
Potential Consumption
Energy Savings
Low-Wattage HID
Inc. > 60 W 0.8 quad 85 lm/W 17 lm/W 0.1 quad 0.7 quad
Performance Information: Data and Source
The GE ceramic MH lamp has an efficacy of 85 lm/W, and would replace a miniature halogen lamp that has an efficacy of 21 lm/W. The lifetime of a low wattage HID lamp is approximately four times longer than a comparable halogen lamp (GE, 2003), but CRI is lower.23 Table 3-27 shows the performance of a low wattage ceramic MH lamp against equivalent incandescent technology.
Table 3-27: Performance of Low Wattage MH Lamp vs. Equivalent Incandescent Technology
Lamp Type Power Initial Light Output Life CRI Efficacy
Ceramic Metal Halide G8.5 20 W 1,700 lm 9,000V hrs24 80 85 lm/W
Halogen Low-Voltage Capsule 75 W 1,600 lm 2,000 hrs 100 21 lm/W
Incandescent, A19 Medium Base 60 W 850 lm 1,000 hrs 100 14 lm/W
Halogen Low-Voltage IR Capsule 50 W 1,200 lm 4,000 hrs 100 24 lm/W Source: GE, 2003. Sylvania, 2003.
Currently, automobile headlights represent the most common application for low-wattage HID lamps. Table 3-28 outlines specifications for two types of HID headlight lamps and one standard halogen bulb headlight (OSRAM, 2003). The HID headlight lamp are MH lamps with a high pressure xenon starting gas that provides high light output when first started, which can provide a brighter, whiter light at energy savings of 36%.
23 The CRI is a biased metric that uses an incandescent source as the bases for comparison. Therefore, all incandescent sources would have a perfect CRI of 100 by definition.
24 Life is rated in the vertical burning position. If lamp operates in a horizontal configuration, life reduces to 7,500 hrs.

57
Table 3-28: Halogen Lamp vs. Low Wattage HID Source for Automobile Headlights
Standard Halogen Bulb XENARC Standard HID Light Source
XENARC D-HC HID Light Source
Light Source Filament Arc Discharge Arc Discharge
Color Temperature ~3,000 K 4,100 K 5,400 K
Lumens/Light Output 700 - 1,000 3,200 2,600
Light Source Watts 55W 35W 35W
Efficacy 13-18 lm/W 91 lm/W 74 lm/W
Life 320 – 1,000 hours Up to 3,000 hours Up to 3,000 hours Source: OSRAM, 2003.
Color temperature for current HID lamps are available from 3000 K (warm) to 6000 K (cool) with CRI values ranging from 70 to 95.
Cost Information: Data and Source
The cost of low wattage ceramic MH lamps is currently much higher than halogen lamps. Table 3-29 shows prices for an HID lamp and equivalent incandescent lamps with similar initial lumen output. The MH lamp costs over 100 times that of a comparable incandescent A-type lamp, without accounting for the cost of a ballast.
Table 3-29: Price of Low Wattage HID Lamp vs. Equivalent Incandescent Technology
Lamp Type Power Price
Ceramic Metal Halide G8.5 20 W $91.79
Halogen Miniature Capsule 75 W $7.58
Incandescent, A19 Medium Base 60 W $0.25 - $1.00
Halogen Low-Voltage Capsule 50 W $13.00 Source: Kwhlighting.com
Non-Energy Benefits of Technology
Low power HID lamps offer several advantages other than energy savings including, compact size, longer life, whiter light, and less UV radiation than halogen lamps (Kiesa, 1999).
Notable Developers/Manufacturers of Technology
GE developed the lowest wattage HID lamp, a 20W ceramic MH lamp for use in retail, offices, studios, architectural lighting, display cabinets and hotels. Philips Lighting, General Electric, and OSRAM Sylvania each developed low wattage HID lamps (35W) for their automotive lighting division. Microsun, a division of Venture Lighting, currently manufacturers consumer luminaires using quartz 68W MH lamps. Welch Allyn makes miniature HID lamps that are rated for operation down to 18 watts.
58
Peak Demand Impact Potential
The baseline low voltage halogen lamps are typically found in commercial/retail establishments, therefore, energy consumption of this light source would be coincident with peak, and replacing less efficacious lamps with HID lamps of higher efficacy would result in a peak demand reduction.
Promising Applications
A promising application of low wattage MH arc lamps is in the surgical field. The bright, white, easily focusable high intensity light makes HID a better option than halogen lamps, which emit heat and UV radiation (Kiesa, 1999). However, these advantages should be carefully weighed against a dearth of emissions in longer wavelengths, hindering its ability to render the color red (e.g., blood).
Due to its high efficacy and promising market potential, HID lamp use is expanding rapidly in vehicle headlight systems (Yan, 2003). MH arc lamps can also be used in portable or remote applications, such as bike lights and news camera lights (Kiesa, 1999).
Due to developments in new ceramic arctube technology, which resulted in an improved CRI, low wattage HID lamps may eventually replace general service incandescent lamps.
Perceived Barriers to Market Adoption
For the first few minutes after start-up, HID lamps, with the exception of Xenon Metal Halide lamps, provide only a small amount of their maximum light output. Additionally, if power is lost to the arc, it will extinguish and several minutes must pass before it can restrike (NLPIP, 1999). Extended warm-up and restrike times may prohibit widespread consumer adoption of this technology.
Currently, the lower CRIs of HID lamps, relative to incandescent lamps, may prohibit market adoption. Additionally, it’s possible that consumers may be reluctant to choose the higher color temperatures of HID lamps.
Higher initial cost, including the costs of ballasts and associated fixtures, may also hinder rapid adoption of low wattage HID lamps. Low voltage accent lighting systems often use one large transformer to power several lamps; the low wattage HID replacement would require one ballast for each lamp.
Data Gaps and Next Steps
New lamp technologies and research could pave the way for low power HID lamps with shorter start-up and re-strike times (NLPIP, 1999). Operation of high-pressure HID lamps with high-frequency ballasts can cause acoustic resonance, or standing pressure waves. Acoustic resonance can lead to changes in arc position and light color (Yan, 2003). Further research could also help to solve the acoustic resonance issue. Mass production of these lamps is an essential step in lowering first costs.
References
GE, 2001a. “20W CMH-TC Miniature Ceramic Metal Halide.” General Electric Lighting; accessed on August 27, 2003 at http://www.lamptech.co.uk/Spec%20Sheets/GE%20CMH20.htm.
GE, 2001b. “Lighting Specification Bulletin.” General Electric Lighting; accessed on August 27, 2003 at http://catalog.gelighting.com.

59
GE, 2003. “Constant Color CMH™- Single Ended Ceramic Metal Halide Lamps Product Information for Original Equipment Manufacturers.” General Electric Lighting; accessed August 27, 2003 at http://www.gelighting.com/na/downloads/cmh_mini.pdf.
Kiesa, 1999. “Metal Halide Arc Lamps- Outperform Halogen Lamps in Specialized Medical Instruments.” Medical Equipment Designer; accessed on August 28, 2003 at http://www.manufacturingcenter.com/med/archives/0399/399arc.asp.
Kwhlighting.com, 2003. Lamp prices; accessed on November 13, 2003 at http://www.kwhlighting.com.
Lighting Dimensions, 2001. “The Latest in Lamps- Make Room for Metal Halide.” Lighting Dimensions on Architecture. Website accessed on August 27, 2003 at http://architecture.lightingdimensions.com/products.
Mucklejohn and Preston, 2000. “Developments in Low Wattage High Intensity Discharge Lamps.” S.A. Mucklejohn and B. Preston. General Electric, UK. IEEE Industry Applications Conference.
NCI, 2002. U.S. Lighting Market Characterization Volume I: National Lighting Inventory and Energy Consumption Estimate. Prepared by Navigant Consulting, Inc. for the Department of Energy. Washington D.C. September 2002.
OSRAM, 2002. “POWERSTAR HCI- Ceramic Technology.” OSRAM Sylvania; accessed August 27, 2003 at www.osram.com/pdf/service_corner/powerstarhci.pdf.
OSRAM, 2003. “Xenarc HID Products.” OSRAM Sylvania; accessed on September 23, 2003 at http://www.sylvania.com/xenarc/prodinfo.htm.
Yan, 2001. “Stability Study and Control Methods for Small Wattage High Intensity Discharge (HID) Lamps.” W. Yan. IEEE Transactions on Industry Applications, pp. 1522-30. September-October 2001.

60
3.3.4. HID Novel Gas
Improvements in HID lamp efficacy and integration with lighting controls has the technical potential to save approximately 0.7 quad per year.
Technology Description and Energy Saving Principle
HID lamps employ various metals and halides under high pressures to generate light, but any gas under the right circumstances could emit light. Researchers are currently investigating novel fill-gases to enhance the performance and efficacy of HID lamps. There are indications that elements in columns III and V of the periodic table of elements may lead to the development of more efficacious discharge lamps. HID lamps with novel gas fills could then replace less efficient incandescent, fluorescent and HID sources resulting in energy savings.
Considering the significant energy savings associated with dimming, there is strong motivation to develop HID sources that retain their rated power performance even when dimmed (Gu et al., 2000). However, reducing input power does not proportionally reduce light output. Instead, the percentage reduction in light output will be greater than the percentage reduction in input power. Thus, dimming the will decrease the lamp’s efficacy (NLPIP, 1994). Using different gases within the arc tube could solve this problem. For example, HID lamps with cesium can dim without negative effects on performance, but the efficacy is lower than typical HPS lamps because of the amount of energy emitted in the IR spectrum, instead of the visible spectrum (Gu et al., 2000). Therefore, novel HID gas fills could greatly improve dimming performance resulting in additional energy savings.
Technical Maturity Level
Research in gas plasma is centered on finding alternatives to mercury as the primary gas fill while maintaining performance. Although HID lamps currently use mercury, sodium and metal halide as principle gas fills, mercury-free alternatives are already available. For example, the sulfur lamp is a mercury-free HID lamp. Mercury free HPS lamps are already commercially available.
Researchers identified cesium as a possible gas fill at the advent of high-pressure alkali discharge lighting (1950s-1960s) due to its relatively white spectrum. However, HPS lamps gained prominence because they offered a good compromise between color characteristics and efficacy (Gendre, 2002). The majority of published work was with cesium, and is in a more advanced stage of technical development. However, research is not limited to that particular element, but includes all elements from column III and V of the periodic table of elements.
Technology Maturity Stage
Basic Science Research Applied Research Exploratory
Development Advanced
Development Engineering Development
Product Demonstration
Commercialization and Sales
Issues with Existing Lighting Products and Systems
Along with developing lamps with novel gas fills, investigators must develop suitable ballasts to complete the lighting system.

61
Technical Potential and Primary Energy Consumption Impact
In laboratory prototypes, the efficacy of HID lamps with novel gases, such as cesium, did not exceed 40-50 lm/W because of considerable energy losses in the infrared spectral region (Gu et al., 2000; Zivec, 2002). Thus, present high-pressure pulsed cesium discharge lamps would not save energy over existing HID or fluorescent sources. However, one major application of high-pressure cesium lamps may be to replace tungsten-halogen lamps in commercial/retail locations (Gu et al., 2000). Assuming an efficacy of 45 lm/W for very high-pressure sodium and high-pressure cesium lamps, and an efficacy of 20 lm/W for tungsten-halogen lamps, the potential energy savings of HID lamps with a novel fill gas would be 0.7 quad.
Table 3-30: Technical Potential Energy Savings Potential of HID Novel Gas
Technology Sectors Current Consumption
Efficacy New Technology
Efficacy Old Technology
Potential Consumption
Energy Savings
HID Novel Gas
Incandescent – Commercial
1.3 quads 45 lm/W 20 lm/W 0.6 quad 0.7 quad
Sources: NCI, 2002; Gu et al., 2000; Zivec, 2002.
HID lamps with cesium fill gas are promising because they can dim without negative side effects, such as color shift (Gu et al., 2000). This would enable use with lighting controls, which could result in energy savings of 15% from the baseline energy consumption (Richman et al., 1996) in the commercial, industrial, and outdoor sectors. Therefore, a novel gas fill (i.e., high-pressure cesium lamp) with equivalent efficacy to current HID lamps, incorporating lighting controls, would add 0.2 quad to the energy savings estimate. Table 3-31 presents the potential savings.
Table 3-31: Supplementary Technical Potential Energy Savings for HID Novel Gas
Technology Sectors Current Consumption
Percent Savings from Baseline Potential Savings
HID- Commercial 0.5 quad 15% 0.08 quad
HID- Industrial 0.36 quad 15% 0.05 quad
HID- Outdoor 0.54 quad 15% 0.08 quad HID Novel Gas
Total Energy Savings 0.2 quad
Performance Information: Data and Source
HPS lamps are the most efficient “white light” source available today. However, these lamps have poor color characteristics during normal operation, which are exacerbated when the lamp operates at less than full output. When dimmed, HPS lamps exhibit color shift, changes in CRI, and reduction in lamp efficacy. Therefore, dimming is currently limited to about 50% of full light output (PG&E, 1997). However, very high-pressure sodium lamps exhibit excellent color characteristics at reduced efficacies.
Cesium is a promising novel gas fill because the portion of light from a cesium lamp in the visible spectrum is close to blackbody radiation. In a laboratory setting, high-pressure cesium lamps exhibited efficacies of 40 to 50 lm/W and stable CRI and CCT (Gu et al., 2000). In order to increase the efficacy of the cesium lamp, the amount of energy emitted in the visible spectrum, as opposed to the IR spectrum,

62
must increase (Gu et al., 2000). Pulse modulation is used to achieve a spectral shift of this nature. When operated on continuous and multiple pulse modulated sources, the light output is nearly Planckian. Application of this technique to HPS lamps enhances radiation in the blue region of the spectrum, which results in significant color improvement and luminous efficacy reduction (Gu et al., 2000). Although efficacy of this lamp is much lower than typical HPS lamps, the CRI of cesium lamps is far superior (CRI > 95). Since HID lamps with cesium are not commercially available, Table 3-32 shows the performance of technologies against which cesium and other novel gas fill HID lamps would need to compete.
Table 3-32: Performance Specifications of Competitive Technologies
Lamp Type Power Initial Light Output
Mean Light Output Efficacy Life CCT CRI
HPS Eco 150 W 16,000 lm 14,400 lm 106 lm/W 30,000 hrs 2200 K 22
Very High-Pressure Sodium
100 W 5,200 4,430 52 lm/W 10,000 2700 K 85
Ceramic MH 150 W 12,000 lm 9,000 lm 80 lm/W 7,000 hrs 3000 K 89
Metal Halide 150 W 12,900 lm 10,000 lm 86 lm/W 10,000 hrs 4000 K 75
Incandescent, A Type
150 W 2,640 lm - 18 lm/W 750 hrs 2850 K 100
Source: Philips Lighting and OSRAM Sylvania, 2003.
Cost Information: Data and Source
Since high-pressure cesium lamps are not commercially offered, no cost estimates are available. However, the table below shows a sampling of current HPS lamp prices, since they are a technology similar to high-pressure cesium lamps.
Table 3-33: Cost of Competitive Technologies
Lamp Type Power Price
HPS Eco 150 W $41.00
Ceramic MH 150 W $42.27
Metal Halide 150 W $26.38
Incandescent, A Type 150 W $0.98
Source: Kwhlighting.com
Non-Energy Benefits of Technology
The appropriate handling of expired lamps is an issue faced by light source users. In January, 2000, the Federal Universal Waste Rule25 added hazardous waste lamps to the federal list of regulated waste. 25 “Part IV, Environmental Protection Agency, 40 CFR Parts 260, 261, 264, etc., Hazardous Waste Management System; Modification of the Hazardous Waste Program; Hazardous Waste Lamps; Final Rule.” Federal Register. July 6, 1999. Environmental Protection Agency; accessed on February 13, 2004 at http://www.epa.gov/epaoswer/hazwaste/id/merc-emi/merc-pgs/fedreg.pdf.

63
Although the Federal Universal Waste Rule is a federally mandated rule that requires all states to comply, many states choose to enforce their own more rigorous standards for lamp disposal.26 Mercury is the primary hazardous material of concern. Use of novel gases may reduce environmental impacts of lamp disposal by eliminating the use of harmful materials such as mercury. In addition, lamps using alternative gases, such as cesium, may generate light with higher CRI than presently available improving light quality.
Notable Developers/Manufacturers of Technology
The goal of present laboratory research on cesium gas fills is to analyze spectra near the UV, visible, and infrared regions, and to gain knowledge of spectral phenomena in alkali plasmas that can be used to perform lamp tailoring (Zivcec, 2002). Several lamp modifications are being studied with the ultimate goal of making cesium lamps more efficient (Zivcec, 2002).
Peak Demand Impact Potential
For applications listed below, most of the energy consumption occurs during peak demand hours, and an improvement in lamp efficacy would result in peak demand reduction. The use of dimming controls with this light source could also potentially reduce peak demand.
Promising Applications
Applications for HID lamps include street lighting, track lighting, industrial and security lighting, or other applications where color rendering is not important (PG&E, 1997). With improvements in color rendering, this technology could be used in color critical applications, such as indoor lighting, and commercial display applications. High color rendition lamps may also replace tungsten-halogen lamps in commercial and retail applications (Gu et al., 2000).
Perceived Barriers to Market Adoption
The potentially higher initial cost of HID lamps with novel gas fills would hinder rapid adoption of this technology. In addition, if the new lamp does not have equivalent operational life, it will also hinder adoption. The MV lamp serves as an example of such likely barriers. Although it is significantly less efficacious than newer HPS and MH lamps (and lower CRI than MH), its market success persists due to a low initial cost and the ability to operate almost indefinitely without failure.27
Data Gaps and Next Steps
In order to improve the efficacy of cesium lamps, research needs to focus on analyzing spectra near the UV, visible, and infrared regions for the purpose of tailoring the cesium lamp to emit more light in the visible spectrum (Zivcec, 2002), hence making it more efficient.
Investigators must also develop suitable ballasts to complete the lighting system.
26 Alaska, Hawaii and Iowa do not have their own UWR.
27 MV lamps do not typically fail. Instead its light output decreases steadily over time. Therefore, lamp manufacturers define the end-of-life for MV lamps when its light output decreases to either 40% or 50% (manufacturers vary) of its initial value.

64
References
Ban et al., 2001. “High Resolution Studies of the Cs High Pressure Lamp.” T. Ban, H. Skenderovic, G. Pichler, J. Liu, and K. Gunther. Institute of Physics, Zagreb, Croatia. The 9th International Symposium on the Science and Technology of Light Sources. Symposium Proceedings. August 2001.
Gu et al., 2000. “Pulse Modulated High-Pressure Cesium Discharge Lamp.” H. Gu, M.E. Muzeroll, J. C. Chamberlain, and J. Maya. Plasma Sources Science and Technology. Volume 10. Institute of Physics Publishing. August 25, 2000.
Gendre, 2002. “Two Centuries of Electric Light Source Innovations,” Maxine F. Gendre. Department of Applied Physics, Eindhoven University of Technology.
Kwhlighting.com, 2003. Lamp prices; accessed on November 13, 2003 at http://www.kwhlighting.com.
NLPIP, 1994. Dimming Systems for High-Intensity Discharge Lamps. National Lighting Product Information Program. Lighting Answers. Volume 1, Number 4.
PG&E, 1997. “High Pressure Sodium Lamps.” A Pacific Energy Center Factsheet. Pacific Gas and Electric Company; accessed on December 4, 2003 at http://www.pge.com/003_save_energy/003c_edu_train/pec/info_resource/pdf/High_Pressure_Sodium_Lamps.pdf.
Pichler et al., 2001. “Near Infrared Molecular Continua in a Pulsed Cs High Pressure Lamp.” G. Pichler, T. Ban, and H. Skenderovic. Institute of Physics, Zagreb, Croatia. The 9th International Symposium on the Science and Technology of Light Sources. Symposium Proceedings. August 2001.
Richman et al., 1996. “Field Analysis of Occupancy Sensor Operation: Parameters Affecting Lighting Energy Savings.” E.E. Richman, A. L. Dittmer, and J. M. Keller. Journal of the Illuminating Engineering Society 25(1): 83-92.
Zivcec et al., 2002. “High Pressure Cesium Discharge Lamp,” V. Zivcec, T. Ban, H. Skenderovic, and G. Pichler. Institute of Physics, Croatia. The Brijuni Conference.
65
3.3.5. HID Ceramic Arc Tube Research
Ceramic MH lamps of low to medium wattages (<400 W) are commercially available from major lamp manufacturers. Current production units are already more efficient than its traditional quartz arc tube counterpart. The technical potential energy savings of this technology is 1.2 quads per annum (primary energy).
Technology Description and Energy Saving Principle
The shape and material properties of an HID lamp can significantly impact its performance. For example, changing the arc tube material from quartz to ceramic improves lamp efficacy. Ceramic arc tubes offer three advantages over fused silica (quartz) arc tubes: higher operating temperatures, improved resistance to corrosion by metal-halide salts, and better dimensional control (Mucklejohn, 2000). These advantages translate directly into higher efficacy and improved color rendering properties, reduced sodium loss in HPS technology resulting in stable color throughout lamp life, and improved voltage control (Mucklejohn, 2000). Ceramic lamps also exhibit better lumen maintenance over the life of the lamp (Philips, 2003). This allows users to specify lamps with lower initial light output specifications, resulting in energy savings.
The shape of the arc tube can also significantly impact the performance of HID lamps (both ceramic and quartz envelopes). Therefore, manufacturers design arc tubes in a variety of shapes, depending on the desired application and intended operating orientation of the lamp. For example, in applications that require horizontal operation of these lamps, manufacturers developed specially shaped arc tubes to compensate for the bowing of the arc discharge that occurs in lamps operated horizontally. The size and shape of the arc tube can affect performance in other ways. For example, manufacturers also design arc tubes in an ovoid shape, called formed body arc tubes. Formed body tubes have a smaller pinch area, which minimizes cooling at the ends of the tube. Thus, the operating temperature of the lamp is higher, which corresponds directly to a higher lamp efficacy (IESNA, 2000). Improvements in arc tube shape allow higher operating temperatures, which improves efficacies resulting in a more energy efficient light source.
Optimizing the shape of the arc tube with the best materials maximizes the energy savings potential of HID lamps (Venture Lighting, 2003). In addition, improved color rendering from ceramic metal halide lamps enables this technology to compete with incandescent and fluorescent light sources.
Technical Maturity Level
Ceramic metal halide (CMH) lamps were introduced into the market in the mid 1990s (GE, 2003). The technology is currently available in low and middle wattage lamps (<400 watts). New potential products fall in the advanced development stage.

66
Technology Maturity Stage Basic Science
Research Applied Research Exploratory Development
Advanced Development
Engineering Development
Product Demonstration
Commercialization and Sales
Issues with Existing Lighting Products and Systems
This technology is anticipated to operate on the same voltage and frequency as existing MH lamps with quartz arc tubes. However, new ballasts designed to meet their starting and operating characteristics may be required. In addition, there may be socket and optical incompatibilities that require new sockets and fixtures. To replace incandescent or halogen PAR lamps, they will require the addition of a ballast. If used to replace fluorescent lighting, both a ballast and fixture replacement are necessary.
Technical Potential and Primary Energy Consumption Impact
The energy savings potential of ceramic arc tubes depends on the magnitude of the efficacy improvement over the baseline technology and the affected market size. Ceramic metal halide lamps could directly replace MV or MH lamps. Although MV lamps have relatively low efficacy, there is little potential for energy savings since its share of the market is small and continues to diminish. Furthermore, there is little headroom for improvement over MH lamps. The greatest potential for energy savings is in the commercial sector with the replacement of incandescent technology. With 100% market penetration into these markets, the technical potential energy savings estimate is 1.2 quads. Table 3-34 presents the results.
Table 3-34: Technical Potential Energy Savings of Ceramic Metal Halide
Technology Sectors Current Consumption
Mean Efficacy New Technology
Mean Efficacy Old Technology
Potential Consumption
Energy Savings
MV and MH –all sectors
0.94 quad 67.5 lm/W 56 lm/W 0.78 quad 0.2 quad
Incandescent –Commercial
1.36 quads 67.5 lm/W 13.7 lm/W 0.28 quad 1.0 quads
Ceramic Metal Halide
Total Energy Savings 1.2 quads
Performance Information: Data and Source
Standard MH lamps operate up to 950° C, while CMH lamps operate at approximately 1,150° C. CMH lamps are 10-20% more efficacious than standard MH lamps of equivalent wattage (IAEEL, 1997). Table 3-35 shows the performance of four different wattage MH and CMH lamps. In addition to having higher efficacy, CMH lamps have superior CRI. Furthermore, the development of formed ceramic arc tubes may provide some additional improvements in performance of ceramic arc tube lamps.

67
Table 3-35: Lamp Wattage, Arc Tube Type, Life, Lumen Output, CRI, and Efficacy
Lamp Type Power Life Initial Light Output
Mean
Light Output CRI
Initial
Efficacy
Mean
Efficacy
Ceramic Metal Halide 50 W 20,000 hrs. 3,600 lm 2,450 lm 92 72 lm/W 49 lm/W
Ceramic Metal Halide 150 W 20,000 hrs. 13,500 lm 9,450 lm 92 90 lm/W 63 lm/W
Metal Halide 150 W 10,000 hrs. 12,500 lm 8,500 lm 65 83 lm/W 57 lm/W
Metal Halide 400 W 20,000 hrs. 38,000 lm 25,000 lm 70 95 lm/W 63 lm/W Source: Philips, 2003.
Cost Information: Data and Source
Although current prices of MH lamps with fused quartz arc tubes are lower than ceramic arc tube lamp prices, they are competitive. Table 3-36 shows a price comparison for various types and wattages of silica and ceramic arc tube MH lamps.
Table 3-36: Price Comparison of Ceramic and Silica MH Lamps
Lamp Type Power Price
Ceramic Metal Halide 50 W $32.95
Ceramic Metal Halide 150 W $42.27
Quartz Metal Halide 150 W $34.50
Quartz Metal Halide 400 W $35.12 Source: Bulbs.com
Non-Energy Benefits of Technology
As a population of standard pinched body quartz metal halide (MH) lamps ages, a marked shift in color can become apparent, particularly if one lamp in a batch is replaced. While this shift is significantly reduced for formed body quartz metal halide lamps (Venture, 2003), ceramic arc tubes reduce the drastic change in color appearance over the life of a MH lamp, especially in low wattage MH lamps (Sylvania, 2002; Snedden, 2001).
Ceramic lamps use significantly less mercury than their quartz counterparts.
Notable Developers/Manufacturers of Technology
OSRAM Sylvania markets their CMH products under the “MetalArc Ceramic” brand (39-150W). GE’s version is “ConstantColor CMH” (39-150W) and Phillips markets their ceramic metal halides as the “MasterColor” series (39-400W). At Lightfair 2003, GE introduced the first dual-wattage (300/320W) ceramic metal halide lamp. Philips Lighting, along with other lamp manufacturers, has been researching ceramic manufacturing processes and ceramic envelope materials (van Lierop et al., 2000).
Peak Demand Impact Potential
In the applications listed in the next section, energy consumption occurs during peak hours. Thus, the energy consumption would be coincident with peak demand, and an improvement in lamp efficacy would reduce peak demand.

68
Promising Applications
CMH lamps can be used in a wide variety of color critical (i.e. where color rendering is important) applications due to its high efficacy, high CRI, comparable lumen maintenance, and long lifetime. CMH lamps are already used in retail stores, malls, offices, and for accent, display, and studio lighting (OSRAM Sylvania, 2002). It is also an excellent alternative as a white-light source in outdoor application, such as street lighting, area lighting, landscape lighting, and floodlighting.
Perceived Barriers to Market Adoption
While ceramic MH lamps decrease the incidence of color shift in a population of lamps compared to a quartz version, color shift is not completely eliminated and may remain a barrier to market adoption. It is also anticipated that the higher initial cost of commercially available ceramic based lamps will slow market adoption of this technology. Ceramic MH lamps require a ballast for each spot when replacing halogen MR or PAR lights.
Next Steps and Data Gaps
Manufacturers need to provide a wider range of available wattages. In addition, manufacturing methods and processes need to be improved in order that more efficient tube shapes can be fabricated, while reducing cost to produce a more cost-competitive product.
As wattage and arc tube size decrease, acoustic resonance becomes a greater issue with high-frequency electronic ballasts. Currently, most electronic ballasts for the lower wattage lamps use low frequency square waves to drive the lamp.
References
Electrolink, 1999. “The ‘Heart’ of Metal Halide- the Arc Tube.” Electrolink Magazine. May/June 1999. Electrolink; accessed on August 28, 2003 at http://www.electrolink.co.nz/CC256A1C0073A9F5/DCB530D95C0C8EBFCC2569280012C8A6/182BC3E56D420997CC256A1C0082CF05!Open.
Electrolink, 2000. “Metal Halide the Move to Ceramics.” Electrolink Magazine. July/August, 2000. Electrolink; accessed on August 28, 2003 at http://www.electrolink.co.nz/Electrolink/Magazine.nsf/326bbd36b5c35184cc256a9a0005a592/99a3cad6c003c717cc256a1c0082ced6!OpenDocument&Highlight=0.
GE, 2000a. “GE HID Lamps.” Product Sheet. General Electric Lighting; accessed on August 28, 2003 at http://www.gelighting.com/na/downloads/hidfamil.pdf.
GE, 2000b. “GE Constant Color CMH Lamps.” Product Sheet. General Electric Lighting; accessed on August 28, 2003 at http://www.gelighting.com/na/downloads/hidfamil.pdf.
GE, 2003. “Lighting: The Last One Hundred Years.” GE Lighting North America; accessed on September 3, 2003 at http://www.gelighting.com/na/institute/ul_last100.html.
Kwhlighting.com, 2003. Lamp prices; accessed on November 13, 2003 at http://www.kwhlighting.com.
Mucklejohn, 2000. “Developments in Low Wattage High Intensity Discharge Lamps.” S.A. Mucklejohn and B. Preston. General Electric, UK. IEEE Industry Applications Conference.
NCI, 2002. U.S. Lighting Market Characterization Volume I: National Lighting Inventory and Energy Consumption Estimate. Prepared by Navigant Consulting, Inc. for the Department of Energy. Washington D.C. September 2002.

69
OSRAM Sylvania, 2002. “Side-by-Side Comparison at Wilson’s Leather Outlet Demonstrates Sylvania Powerball Ceramic Lamp Color Benefits.” Press Xpress. OSRAM Sylvania; accessed on August 28, 2003 at http://www.sylvania.com/press/06032002c5.html.
OSRAM Sylvania, 2002. “Sylvania Metalarc Ceramic Metal Halide Lamps.” Lighting News. OSRAM Sylvania; accessed August 28, 2003 at http://www.sylvania.com/business/news/0402.htm.
Philips, 2003. Technical Data Sheets. Product Information. The Light Site North America. Philips Lighting; accessed September 4, 2003 at http://www.lighting.philips.com/nam/product_database.
van Lierop et al., 2000. “4000 K Low Wattage Metal Halide Lamps with Ceramic Envelopes: A Breakthrough in Color Quality.” van Lierop, Rojas, Nelson, Dielis, and Suijker. Journal of the Illuminating Engineering Society, 29 (2), pp. 83-8.
Venture Lighting, 2003. “The Advantages of MH Formed Body Arc Tubes.” Tom Harding. Online Exclusive EC&M. Venture Lighting; accessed on September 3, 2003 at http://www.ecmweb.com/ar/electric_advantages_mh_formed.
Venture Lighting, 2003. “The Advantages of MH Formed Body Arc Tubes.” By Tom Harding. Online Exclusive EC&M. Website accessed on September 3, 2003 at http://www.ecmweb.com/ar/electric_advantages_mh_formed/

70
3.3.6. HID Electrode Research
Research to overcome limitations imposed by existing electrode materials has a technical potential energy savings of 0.2 quad per annum (primary energy).
Technology Description and Energy Saving Principle
In conventional HID lamps, the electric field required to generate an arc discharge occurs between two electrodes. An HID lamp electrode is typically a solid shank (or rod) with coiled tungsten over-wraps. The electrodes may have an emissive coating, composed of several metallic oxides, embedded within the turns of the tungsten coil (IESNA, 2000). 28 The anode acts only as an electron collector, so the processes in this region are simpler. The processes in the cathode region are more complex. Between the anode and cathode is a gas filling, which allows current transfer between the anode and cathode with sufficient ionization (Coulomb, 1998).
New and exotic fill-gases have the potential to increase the efficacy of HID lamps. However, incompatibilities with existing electrode materials limit manufacturers to the fill gas used in today’s HID lamps. One method to overcome this challenge is to remove the electrode (e.g., electrodeless lamps). However, this would require radical changes in lamp manufacturing and ballast systems. A more subtle and less obtrusive alternative would involve developing novel electrodes and electrode materials that would enable more efficacious fill-gas chemistries, previously excluded due to incompatibilities with existing electrode materials, resulting in energy savings.
Improvements in electrode material could also help improve lumen maintenance and save energy. When the lamp warms up, some of the coating and electrode material itself sputters off the electrode. This degradation of electrodes is a significant factor in arc tube wall darkening that causes light depreciation (loss of lumen output over the life of the lamp) and eventual lamp failure. .
New high emissive materials may enable the development of HID lamps which are capable of instantaneous ignition and short restrike, enabling direct competition with incandescent and fluorescent sources. Furthermore, it could smooth the progress of an improved dimming lamp, resulting in energy savings.
Technical Maturity Level
All major lamp manufacturers and a host of research institutions are currently researching electrode advancement in HID lamps in an effort to increase lamp efficacy and life.
Technology Maturity Stage
Basic Science Research
Applied Research
Exploratory Development
Advanced Development
Engineering Development
Product Demonstratio
Commercialization and Sales
28 Most MH lamps do not have emissive coatings on their electrodes.

71
Issues with Existing Lighting Products and Systems
There are no anticipated issues with incorporating HID lamps with improved electrodes into the current population of HID lamps. If incandescent light sources are replaced a ballast addition or replacement will be necessary.
Technical Potential and Primary Energy Consumption Impact
In the near term, HID electrode advancement would result in an improvement of current MH lamps. In the long term, if electrode advancement leads to the development of HID lamps with higher efficacy, dimming, and instant restrike capabilities, these lamps could replace fluorescent and incandescent sources.
Lighting designers consider mean lumen values when performing lighting calculations. Lumen maintenance values for a typical 400-watt MH lamp and a 400-watt HPS lamp are 66% and 90%, respectively (IESNA, 2000). If MH lamps could maintain 90% lumen maintenance, the current value for HPS lamps, the mean efficacy of the lamp would increase by 20%. Assuming a mean efficacy of 78 lm/W for the improved MH lamp, and mean efficacies of 65 lm/W and 43 lm/W for existing MH and MV lamps, respectively, the potential energy saved annually replacing all current MH and MV lamps in the commercial, industrial, and outdoor sectors is 0.2 quads. Table 3-37 presents the results of this calculation below.
Table 3-37: Technical Potential Energy Savings of HID Electrode Advancement
Technology Sectors Current Consumption
Efficacy New Tech.
Efficacy Old Tech.
Potential Consumption
Energy Savings
Mercury Vapor (C/I/O) 0.23 quad 78 lm/W 43 lm/W 0.13 quad 0.1 quad
Metal Halide (C/I/O) 0.70 quad 78 lm/W 65 lm/W 0.58 quad 0.1 quad HID
Electrode Advancement
Total 0.2 quads
Performance Information: Data and Source
Table 3-38 shows dimming levels, warm-up times, and restrike times currently attainable for HID lamps. The table also shows the room available for improvement in those areas.
Table 3-38: Lamp Type, Start Time, Restrike Time, and Percent Dimmable
Lamp Type Start Time Restrike Time Percent Dimmable
Mercury Vapor 3-9 min. 5-10 min. 40%
Metal Halide 3-5 min. 4-20 min. 60%
High-Pressure Sodium 0.5-1 min. 3-4 min. 60%
Source: IESNA, 2000.

72
Table 3-39 shows performance specifications for several HID lamps to illustrate typical efficacy and lumen maintenance. The lumen depreciation for all MH lamps is poor and there remains significant room for improvement.
Table 3-39: Performance Specifications for Several Types of HID Lamps
Lamp Type Power Initial Lumens Mean Lumens Efficacy Life
HPS Eco 400 watts 50,000 lm 45,000 lm 112 lm/W 30,000 hrs
HPS Eco 150 watts 16,000 lm 14,400 lm 96 lm/W 30,000 hrs
HPS Eco 70 watts 6,300 lm 5,600 lm 80 lm/W 30,000 hrs
Ceramic MH 50 watts 3,600 lm 2,450 lm 72 lm/W 20,000 hrs
Ceramic MH 150 watts 12,000 lm 9,000 lm 80 lm/W 20,000 hrs
Metal Halide 150 watts 12,000 lm 7,900 lm 80 lm/W 10,000 hrs
Metal Halide 400 watts 38,000 lm 25,000 lm 95 lm/W 20,000 hrs
Source: Philips, 2003. Sylvania, 2003.
Cost Information: Data and Source
Although lamps with improved electrode materials would likely be more expensive than existing HID lamps, they would have to be competitively priced in order to penetrate the market. With electrode advancement, HID lamps may compete in applications currently dominated by fluorescent lamps.
Non-Energy Benefits of the Technology
Improvements in the performance of the electrodes of an HID lamp could decrease electrode degradation. This would not only improve lumen maintenance but also extend lamp life, which would reduce the environmental impacts of lamp disposal.
Notable Developers/Manufacturers of the Technology
Notable manufacturers of HID lamps are: GE Lighting, Philips Lighting Company, Ushio America, Inc., Venture Lighting, OSRAM Sylvania, and EYE Lighting International of N.A.
The main thrust of research in the area of HID lighting is to gain a greater understanding of the process of electrode erosion, in order to combat the phenomenon and create a better lamp. For instance, OSRAM Sylvania developed a time-dependent thermionic cathode model for HID lamp starting (Li et al., 2001). The purpose of this study was to gain an understanding of the basic parameters that control electrode erosion and lamp maintenance. All the major HID lamp manufacturers also initiated studies to determine diagnostics for HID, such as temperature distribution on an electrode. Improper design of lamp electrodes will limit the useful lifetime of the lamp; therefore, it is beneficial to develop electrode diagnostics to allow early detection of potential failure modes (Adler, 2001). Electrodes that operate too close to the melting point of tungsten will lead to premature evaporation of the electrode material. Contrastingly, electrodes that run too cold will increase sputtering. Both phenomena will result in increased wall blackening and decreased light output (Adler, 2001).

73
Philips Research Laboratories also created a model to compute electrode temperature profiles, which provides essential information to determine electrode stability. The model is based on semi-empirical considerations of plasma electrode erosion.
General Electric sponsored studies on the breakdown process in MH lamps at startup by creating a 2-D model to simulate the densities of neutrals, ions, and electrons (Sommerer, 2001).
Other research has focused on numerical modeling of temperature distribution in the cathode of HID lamps (Benilov and Cunha, 2001) in order to develop calculation methods for this interaction in order to understand the factors that effect lamp performance and lifetime.
Peak Demand Impact Potential
For the applications listed below, the energy consumption occurs during peak demand hours. Thus, an improvement in lamp efficacy would result in peak demand reduction.
Promising Applications
With improved electrode performance, HID lamps will have a longer life and better lumen maintenance. Novel electrodes may help in the development of instant restrike and dimming HID lamps. This would enable HID lamps to be used in applications beyond outdoor and industrial sectors and into markets currently dominated by fluorescent lighting, such as office or retail spaces.
Perceived Barriers to Market Adoption
Products that emerge from research and development of HID electrodes will likely have a higher first cost, creating a barrier to market adoption.
Data Gaps and Next Steps
In order to improve the performance of HID lamps, current and future research on electrode performance should focus on electrode modeling, electrode plasma interactions, understanding the effect of cathode-fall voltage on lamp performance, the effects of ballast design on electrode lifetime, and methods of enhancing electrode lifetime. Current electrode materials are not immune to high temperatures chemical processes, and significant research may be required to overcome issues of electrode-gas interactions.
Novel electrode materials research should also be explored in conjunction with other research (e.g., HID novel gas mixtures and device electronics) in HID technologies to enable it to compete with fluorescent and incandescent lamps. For example, it is unclear how HID lamps will achieve dimming and instantaneous ignition and reignition, and whether it would occur through novel gas mixtures, device electronics, or some combination of the various investigations in HID technology.
References
Adler, 2001. “Electrode Diagnostics for HID Lamps” H.G. Adler. OSRAM Sylvania Inc. 9th Annual Symposium on the Science and Technology of Light Sources. August 2001.
Benilov, 2000. “Near-Electrode Phenomena in HID Lamps.” Conference Record of the 2000 IEEE Industry Applications Conference. Thirty-Fifth IAS Annual Meeting and World Conference on Industrial Applications of Electrical Energy, pt. 5, pp. 3301-8.
Benilov, 2001. “Near-Cathode Phenomena in HID Lamps.” Mikhail Benilov. IEEE Transactions on Industry Applications, Vol. 37, No. 4, pp. 986-93. July-Aug. 2001.

74
Benilov and Cunha, 2001. “Modeling the Temperature Distribution in Cathodes of HID Lamps.” Mikhail Benilov and Mario Cunha. 9th Annual Symposium on the Science and Technology of Light Sources. August 2001.
Coulomb, 1998. “A Model for the Arc Attachment on the Cathode of High Intensity Discharge (HID) Lamps.” S. Coulombe. Corporate Research and Development. General Electric. October 1998.
Flesch and Neiger, 2001. “Time-Dependent Modeling of High Pressure Discharge Lamps Including Electrodes.” Peter Flesch and Manfred Neiger. Lighting Technology Institute, University of Karlsruhe. 9th International Symposium on the Science and Technology of Light Sources. August 2001.
IESNA, 2000. The IESNA Lighting Handbook: Reference and Application, 9th Edition. M.S. Rea. Illuminating Engineering Society of North America. New York: 2000.
Kwhlighting.com, 2003. Lamp prices; accessed on November 13, 2003 at http://www.kwhlighting.com.
Kruken, 2001. “Simulations of Electrode Temperatures in HID Lamps” Thomas Kruken. Philips Research Laboratories. 9th International Symposium on the Science and Technology of Light Sources. August 2001.
Lenef et al., 2002. “Arc Spot Formation on Cold Cathodes in High Intensity Discharge Lamps” Lenef, A., Budinger, B., and Peters, C. IEEE Transactions on Plasma Science, Volume 30, No. 1, pt.2, pp. 208-18. February 2002.
Li et al., 2001. “Time Dependent Thermionic Cathode Model for High Intensity Discharge Lamp Starting.” Yan-Ming Li and Bowman Budinger. OSRAM Sylvania, Inc. 9th International Symposium on the Science and Technology of Light Sources. August 2001.
Lichtenberg et al., 2002. “Observation of Different Modes of Cathodic Arc Attachment to HID Electrodes in a Model Lamp” Lichtenberg, Nandelstadt, Dabringhausen, Redwitz, Luhmann, and Mentel. Journal of Physics D (Applied Physics), Vol. 35, No. 14.
NCI, 2002. U.S. Lighting Market Characterization Volume I: National Lighting Inventory and Energy Consumption Estimate. Prepared by Navigant Consulting, Inc. for the Department of Energy. Washington D.C. September 2002.
Philips, 2003. Technical Data Sheets. Product Information. The Light Site North America. Philips Lighting; accessed September 4, 2003 at http://www.lighting.philips.com/nam/product_database.
Sommerer et al., 2001. "Breakdown Processes in Metal Halide Lamps." Timothy J. Sommerer, David Wharmby, J. Gary Eden, and Mark J. Kushner. 9th International Symposium on the Science and Technology of Light Sources (LS-9), Ithaca, NY, August 2001.
Sylvania, 2003. Online Product Catalog. OSRAM Sylvania; accessed on December 2, 2003 at http://ecom.mysylvania.com/sylvaniab2c/b2c/z_login.do.
Uemura et al., 2000. “Improved Characteristics of Inductively Coupled Electrodeless Metal Halide Lamps.” K. Uemura T. Ishigami, A. Itoh, I. Yokozeki, K. Shimizu, and A. Inouye. The Abstracts of the Papers Journal of Illuminating Engineering Institute of Japan. Vol. 84, number 2. 2000.

75
3.3.7. HID Electrodeless Lamp
The technical potential energy savings for HID electrodeless lamp is 0.6 quad of primary energy, replacing all mercury vapor and metal halide technologies. However, significant advances in ballast technology need to occur to produce a cost-competitive product.
Technology Description and Energy Saving Principle
In traditional HID lamps, an electric field generated between the electrodes initiates and maintains the arc discharge. However, this method of initiating the arc and maintaining current flow puts a lot of stress on the electrodes resulting in degradation and failure. When the lamp starts and during warm-up, the coating on the electrode and some of the electrode material itself sputters off. This leads to darkening of the arc tube and eventual failure of the lamp. Since an electrodeless lamp does not have any electrodes, it does not suffer from these degradation and failure mechanism. Instead, a magnetic field initiates and maintains the arc discharge. The high frequency generator power supply provides a current to an induction coil. The current that passes through the coil generates an EM field, which excites the gas fill and emits light (IESNA, 2000). Furthermore, the absence of electrodes enables manufacturers to use more efficacious fill-gas chemistries without worry to compatibility issues with electrodes. Therefore, electrodeless lamps could have higher efficacy and improved lumen maintenance over their lifetime, which would result in energy savings.
Technical Maturity Level
OSRAM Sylvania, General Electric, and Philips Lighting manufacture electrodeless fluorescent lamps. However, research performed on the characteristics of inductively coupled electrodeless metal halide lamps (Uemura et al., 2000) has yet to produce commercially available electrodeless HID lamps.
Technology Maturity Stage
Basic Science Research Applied Research Exploratory
Development Advanced
Development Engineering Development
Product Demonstration
Commercialization and Sales
Issues with Existing Lighting Products and Systems
This lamp technology necessitates a new generator, power coupler and lamp, as well as a dedicated fixture due to its different operating and thermal requirements. In addition, high operating frequencies raise concerns over possible electronic device interference. Induction systems must abide by FCC regulations, averting any interference with navigation, radio, or cell phone communication. Wireless LANs (802.11b and 802.11g), Bluetooth, portable telephones and other equipment designed to operate in the 2.4 GHz ISM band may be susceptible to interference, making performance a concern as this part of the spectrum becomes increasingly crowded.
Technical Potential and Primary Energy Consumption Impact
Electrodeless HID lamps will initially compete for market share with other HID sources, such as mercury vapor and metal halide. In the case of 100% market penetration in the commercial, industrial, and outdoor sectors, the potential energy savings estimate is 0.6 quads. This estimate is based on a mean

76
efficacy of 151 lm/W for electrodeless MH systems (Uemura et al., 2000), and 53 lm/W for conventional MH technologies (NCI, 2002). The first row of Table 3-40 summarizes this calculation.
Eventually, electrodeless HID technology may enter other markets and replace incandescent and fluorescent sources. In the case of 100% market penetration in the commercial, industrial, and outdoor sectors, the potential energy savings estimate is 0.6 quads. This estimate is based on an efficacy of 151 lm/W for electrodeless HID systems, and an average efficacy of 53 lm/W for the other technologies.
Table 3-40: Technical Potential Energy Savings of Electrodeless HID Systems
Technology Sectors Current Consumption
Efficacy New Technology
Efficacy Old Technology
Potential Consumption
Energy Savings
Electrodeless HID
MV and MH (C/I/O)
0.94 quad 151 lm/W 53 lm/W 0.33 quad 0.6 quad
Performance Information: Data and Source
Table 3-41 gives performance information for conventional metal halide lamps. Electrodeless HID lamps must meet or surpass these specifications in order to compete for market share. One study of inductively coupled electrodeless metal halide lamps in Japan claims the efficacy of a high efficacy MH lamp is 180 lm/W. After accounting for induction coil and power losses, the effective efficacy of the system reduces to 151 lm/W (Uemura et al., 2000). This drastic increase in efficacy over electrode technology is achieved by adopting a discharge method that differs from electrode technology and optimizes filling materials and discharge parameters (Uemura et al., 2000).
Table 3-41: Performance Specifications for Conventional Metal Halide Lamps
Lamp Type Power Life Initial Light Output
Mean Light Output CRI Initial
Efficacy Mean
Efficacy
Metal Halide 400 W 15,000 hrs 38,000 lm 25,000 lm 65 95 lm/W 62 lm/W
Metal Halide 250 W 10,000 hrs 20,000 lm 14,100 lm 65 80 lm/W 56 lm/W
Metal Halide 175 W 7,500 hrs 12,800 lm 9,300 lm 65 73 lm/W 53 lm/W Source: Philips, 2003a; Sylvania, 2003
Cost Information: Data and Source
Commercialization of this technology is nascent, thus no mass production costs estimates are available. However, Table 3-42 shows current prices of typical metal halide lamps that the technology would likely replace.
Table 3-42: Price Information for Conventional Metal Halide Lamps
Lamp Type Wattage Price
Metal Halide MH 400 $14.97
Metal Halide 250 watts $14.97
Metal Halide 175 watts $17.00 Source: Sylvania, 2003; Kwhlighting.com, 2003.

77
If electrodeless HID technology follows the trend of electrodeless fluorescent technology, products emerging from this technology will have far higher initial costs than conventional lamps.
Non-Energy Benefits of Technology
There are many failure modes for HID lamps (i.e. sodium loss, Alumina transport, quartz devitrification etc.), but electrode degradation is a significant and important factor in the failure of HID lamps. Since induction lamps do not have electrodes, it may significantly extend the lifetime of the lamp. HID lamps may also exhibit less color shift over the life of the lamp because of the elimination of electrode sputtering and lamp darkening (Philips, 2003).
Notable Developers/Manufacturers of Technology
Scientists in Japan have researched the characteristics of inductively coupled electrodeless metal halide lamps with the goal of creating a practical light source. They have also investigated methods to improve the characteristics of such lamps to the point where the efficacy can reach 151 lm/W with white color (Uemera et al., 2000).
Researchers are studying the process of bulb deterioration, a factor that limits the life of this technology (Uemura et al., 2000). Itoh et al. believed that this iodine gas results from the reaction of Na and Sc with the quartz bulb (Itoh et al., 2000). By dosing the lamp with SnI2, they discovered that the reaction slows, generating less free iodine, and increasing the life of the inductively coupled metal halide lamp (Itoh et al., 2000).
Research is also being performed on the dimming characteristics of inductively coupled metal halide lamps. Dimming of conventional metal halide lamps causes changes in the lamp’s color, and reduces the efficacy and lifetime. Uemura developed an electrodeless lamp that is dimmable to 30%, while only changing the CCT by 300K while limiting the reduction in efficacy to 11% (Uemura et al., 2001).
Peak Demand Impact Potential
For the applications listed below, most of the energy consumption occurs during peak demand hours. Thus, an improvement in lamp efficacy would result in a peak demand reduction.
Promising Applications
In addition to the potential of higher efficacy, electrodeless HID lamps have potential for very long lifetime. Thus, the best applications for this type of lighting are in areas where changing lamps is extremely costly, difficult, or disruptive. Possible applications include: street, roadway, parking lot, commercial office buildings, and factory production areas.
Perceived Barriers to Market Adoption
The major barriers to market adoption of electrodeless HID lamps are potentially higher first cost, bulkier and heavier fixtures (PSE&G, 2003), and issues with electromagnetic radiation.
Data Gaps and Next Steps
Innovative cost-cutting methods in manufacturing and volume production need to be developed to make electrodeless HID lamps competitive on a first cost basis. Case studies on energy savings and user acceptance would help guide manufacturers to producing products that meet consumers need and demand.

78
References
Itoh et al., 2000. “Theoretical Effect of SnI2 Dosing on Lifetime of Inductively Coupled Electrodeless Metal Halide Lamps.” A Itoh, K. Uemura, T. Ishigami, A. Inouye, and S. Sekine. The Abstracts of the Papers Journal of Illuminating Engineering Institute of Japan, Vol. 85, Number 2. 2000.
Kwhlighting.com, 2003. Lamp prices; accessed on November 13, 2003 at http://www.kwhlighting.com.
IESNA, 2000. The IESNA Lighting Handbook: Reference and Application, 9th Edition. M.S. Rea. Illuminating Engineering Society of North America. New York. 2000.
NCI, 2002. U.S. Lighting Market Characterization Volume I: National Lighting Inventory and Energy Consumption Estimate. Prepared by Navigant Consulting, Inc. for the Department of Energy. Washington D.C. September 2002.
Philips, 2003. “Highway Sign Lighting and QL Induction Lamp.” A Case Study. Philips Lighting; accessed on December 2, 2003 at http://www.lighting.philips.com/nam/products/hid/studies/p5638.php.
Philips, 2003a. Technical Data Sheets. Product Information. The Light Site North America. Philips Lighting; accessed September 4, 2003 at http://www.lighting.philips.com/nam/product_database.
PSE&G, 2003. “Induction Lamp Considerations: What You Should Know About This Technology.” PSE&G Customer Service; accessed on September 2, 2003 at http://www.pseg.com/customer/business/small/outdoorlighting/induction.html.
Sylvania, 2003. Online Product Catalog. OSRAM Sylvania; accessed on December 2, 2003 at http://ecom.mysylvania.com/sylvaniab2c/b2c/z_login.do.
Uemura et al., 2000. “Improved Characteristics of Inductively Coupled Electrodeless Metal Halide Lamps.” K. Uemura T. Ishigami, A. Itoh, I. Yokozeki, K. Shimizu, and A. Inouye. The Abstracts of the Papers Journal of Illuminating Engineering Institute of Japan. Vol. 84, number 2. 2000.
Uemura et al., 2001. “Analysis of the Characteristics of Inductively Coupled Electrodeless Metal Halide Lamps.” K. Uemura. The Abstracts of the Papers Journal of Illuminating Engineering Institute of Japan. Volume 85, Number 8A. 2001.

79
3.3.8. Metal Halide Electronic Ballast (HF)
The technical potential energy savings estimate for metal halide electronic ballasts is approximately 0.2 quad of primary energy. This technology option has achieved commercialization, as several manufacturers have already introduced HF ballasts based on proprietary hardware capable of operating metal halide (MH) lamps up to 450 watts.
Technology Description and Energy Saving Principle
MH lamps require a large starting voltage sufficient to ionize gas in the arc tube, and a ballast to regulate current during operation. The ballast can either be electromagnetic (using transformers) or electronic. There are two types of electronic ballasts: low-frequency square-wave (LFSW) and high-frequency (HF). HF electronic ballasts typically operate at frequencies above 20kHz and are smaller in size and weigh less than magnetic and LFSW ballasts. However, during HF operation of MH lamps (ƒ >1 kHz), standing pressure waves, referred to as acoustic resonance, can occur in the discharge tube due to rapid fluctuation in the plasma temperature. This phenomenon may lead to visible arc distortions, resulting in decreased lamp life and, in some cases, cracking of discharge tubes and lamp failure (Antón, 2003).
When HID lamps operate on HF, they convert the input power to light output more efficiently, resulting in an increase in luminous efficacy (Campbell, 1969). HF operation also improves lumen maintenance, life, and dimming capabilities of MH lamps (Delta, 2003). Such improvements would result in a population of more efficacious and efficient MH systems, and would result in energy savings.
Technical Maturity Level
Electronic ballasts using solid-state electronic components in place of core-coil transformers for fluorescent lamps were introduced in the 1980s (Advance Transformer, 2003a). However, acoustic resonance issues impeded the introduction of HF ballasts for MH lamps for many years. It was not until 2002 that Delta Power Supply, Inc. introduced the first commercially available HF ballast for high power MH lamps (150 to 450 watts), receiving a patent for their method of avoiding acoustic resonance that same year (Delta, 2003). Advance Transformer quickly followed suit and introduced their HF electronic ballasts for metal halide lamps under the DynaVision line, available for 320-watt, 350-watt, and 400-watt metal halide lamps (Advance Transformer, 2003b). Several of the challenges are in the engineering development stage.
Technology Maturity Stage
Basic Science Research Applied Research Exploratory
Development Advanced
Development Engineering Development
Product Demonstration
Commercialization and Sales
Issues with Existing Lighting Products and Systems
Electronic ballasts can replace traditional magnetic ballasts on existing MH lamps. However, there may be some compatibility issues with high-frequency electronic ballasts due to acoustic resonance.

80
Technical Potential and Primary Energy Consumption Impact
MH Electronic Ballasts lamps would replace magnetic MH ballasts in all sectors, which would result in a technical potential energy savings estimate of 0.2 quads. This estimate is based on 100% market penetration and a conservative efficacy improvement of 25% over conventional magnetic ballast MH systems (Advance Transformer, 2003a). Table 3-43 presents the results of the calculations.
Table 3-43: Technical Potential Energy Savings of MH Electronic Ballasts (HF)
Technology Sectors Current Consumption
Efficacy Improvement of New Technology
Technical Potential Energy Savings
MH Electronic
Ballasts (HF) MH-All sectors 0.7 quad 25% 0.2 quad
Performance Information: Data and Source
Energy savings can stem from using fewer fixtures or lower wattage lamps to achieve the desired light level. Advance Transformer quotes an improvement of 25% to 50% for an HF electronic system over a magnetic system (Advance Transformer, 2003a).
Table 3-44 shows the performance of pulse start, high frequency metal halide lamps developed by Advance Transformer. For the sake of comparison, lumen maintenance of magnetic pulse-start metal halide and probe-start metal halide lamps are 75% and 64%, respectively (Advance Transformer, 2003). As shown in the table, lamps operated under electronic (HF) ballast exhibit improved lumen maintenance. The ballast can also dim the lamps to 50% of their nominal power value (30% light output) using continuous 0-10V dimming (Advance Transformer, 2003b).
Table 3-44: Performance Information for High Frequency, Pulse Start, and MH Lamps
Lamp Type Power Input Voltage Lumen Maintenance
Maximum THD
Minimum PF
Pulse-Start HF MH Ballast 320 W 200 to 277 volts 86 % 15 % .9
Pulse-Start HF MH Ballast 350 W 200 to 277 volts 86 % 15 % .9
Pulse-Start HF MH Ballast 400 W 200 to 277 volts 86 % 15 % .9 Source: Advance Transformer, 2003b.
MH lamps operating on a Delta electronic ballast can achieve even better results, up to 110 initial lm/W and 88 mean lm/W, with a ballast efficiency of up to 95% (Delta, 2003).
Cost Information: Data and Source
In order to show cost savings associated with HF electronic ballasts, Advance Transformer proposes the following scenario for consideration in its literature: a new 300 ft. X 300 ft. retail space with a 24 ft. ceiling, requiring a level of 100 foot-candles at a work-plane height of 30 inches (Advance Transformer, 2003b). Over a ten-year period, the electronic pulse-start ballast system results in cost savings of 36% over a probe-start magnetic probe-start ballast system and 17% over a magnetic pulse-start ballast system.

81
Non-Energy Benefits of Technology
High frequency electronic ballasts for MH lamps improve the lamp ballast system by: • Eliminating of the 60 cycle electromagnetic hum, • Improving color consistency and longer lamp life due to greater control of the arc tube
wattage over the life of the lamp, • Lowering installation costs because there can be more fixtures per circuit due to greater
ballast efficiencies and current control, • Offering greater design flexibility due to lighter weight and compact footprint compared
to magnetic ballasts, and • Reducing lamp maintenance costs by 20%, ten-year ownership costs by 36%, and energy
costs by 41% (Advance Transformer, 2003a).
Notable Developers/Manufacturers of Technology
Researchers are focusing on resolving acoustic resonance, the biggest barrier to HF electronic ballasts for MH lamps. Several methods to eliminate acoustic resonance have been studied, including, operating in a frequency window free of acoustic resonance, supplying the lamp with a low frequency square wave (< 1 kHz) source, modulation of the switching frequency, supplying the lamp with a high frequency square wave source, supplying the lamp with a very high frequency (>500 kHz) and modulation of switching frequency with acoustic resonance feedback control. Each of these methods resulted in decreased efficacy, higher cost, or unreliable performance (Shen, 2002).
Leading ballast manufacturers include: Advance Transformer, Delta Power Supply, Sylvania, GE, Howard, and Venture Lighting. Delta Power Supply and Advance Transformer have already introduced HF ballasts capable of operating MH lamps up to 450 watts.
Peak Demand Impact Potential
For the applications listed below, most of the energy consumption occurs during peak demand hours. Thus, an improvement in lamp efficacy would result in peak demand reduction.
Promising Applications
Typical MH lamp applications are low-bay and high-bay industrial and commercial applications. Their long life makes them appealing in applications where accessibility can be problematic. In addition, the appeal of MH lamps driven by electronic ballasts increased in commercial and retail applications due to improvements in color consistency.
Perceived Barriers to Market Adoption
Initially, higher first cost, by approximately a factor of two (Advance Transformer, 2003a), over magnetic MH ballasts will be a barrier to market adoption. The technology used by HF ballast manufacturers such as Delta Power Supply is proprietary and protected by patents. Although the intellectual property issue will not keep other manufacturers from developing HID ballast products, it may slow the adoption of this technology.
Electronic ballasts of all types may have serious life and reliability issues. They are less reliable and robust compared to magnetic ballasts, and may further impede adoption.
82
Data Gaps and Next Steps
The next steps are to develop HF electronic ballasts for the entire family of MH lamps (i.e., HPS, LPS, MH and MV) in all wattages while reducing the price of these ballasts so they are cost-competitive with their magnetic counterparts.
References
Advance Transformer, 2003a. “DynaVision Electronic HID Ballast ABC’s of eHID.” Advance Transformer; accessed on February 5, 2004 at http://www.advancetransformer.com/dynavision/abc.html.
Advance Transformer, 2003b. Dynavision Brochure. Advance Transformer; accessed on February 5, 2004 at http://www.advancetransformer.com/dynavision/ADV-3209_dynavision_bro.pdf.
Antón et al., 2003. “Measurement System for Characterization of High Intensity Discharge Lamps (HID) Operating at High Frequency.” J.C. Antón, C. Blanco, F. Ferrero, J.C. Viera, and G. Zissis. IEEE, pp. 1359-1363.
Campbell, 1969. “High-Intensity Discharge Lamps on High-Frequency Power.” John H. Campbell. Illuminating Engineering Society (IES) – Transactions. December 1969.
Correa et al., 2002. “Dimming in Metal Halide Lamps Operating at HF: Effects and Modeling.” Correa, J. Ponce, J. Arau and J.M. Alonso. IEEE.
Delta, 2003. Personal Communication with Debbie Swain and Rodney Thiemann. Delta Power Supply, Inc. in Cincinnati, Ohio on October 31, 2003.
Kwhlighting.com, 2003. Lamp prices; accessed on November 13, 2003 at http://www.kwhlighting.com.
NCI, 2002. U.S. Lighting Market Characterization Volume I: National Lighting Inventory and Energy Consumption Estimate. Prepared by Navigant Consulting, Inc. for the Department of Energy. Washington D.C. September 2002.
Ohguchi et al., 2001. “A Study of High Frequency Electronic Ballast for HID Lamps Based on Immittance Conversion Theory with a Hot Restarting Circuit.” H. Ohguchi, R. Shimotaya, T. Shimizu, H. Takagi, and M. Ito. Transactions of the Institute of Electrical Engineers of Japan, Part D. Volume 121-D, Number 12, pp.1295-6.
Shen et al., 2002. “A Novel Two Stage Acoustic Resonance Free Electronic Ballast for HID Lamps.” M.S. Shen, Z.M. Qian, and F.Z. Peng. IEEE Industry Applications Society Meeting 2002.
Shen et al., 2003. “Design of a Two-Stage Low-Frequency Square-Wave Electronic Ballast for HID lamps.” M.S. Shen, Z.M. Qian, and F.Z. Peng. IEEE Transactions on Industry Applications, 39 (2), pp. 424-430.
Yamada et al., 1995. “Characteristics of Ballasts for HID Lamps with Single-Ended Resonant-Type Inverter Circuits using Leakage Inductance of Transformers.” Tsutomu Yamada, Masato Ohsato, Toshihsa Shimizu, Gunji Kimura, and Takeshi Kanaoka. Tokyo Metropolitan University. IEEE. Proceedings of the 1995 International Conference, 21-24 Feb. 1995. Vol. 1, pp. 246-250.
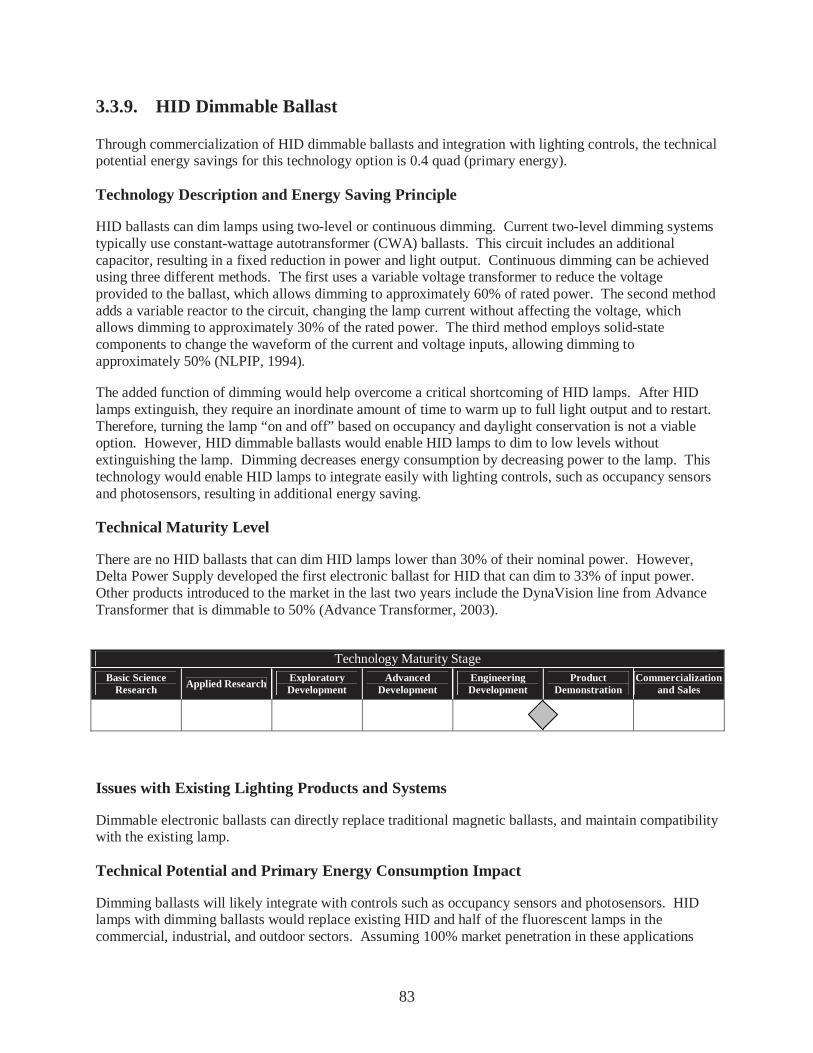
83
3.3.9. HID Dimmable Ballast
Through commercialization of HID dimmable ballasts and integration with lighting controls, the technical potential energy savings for this technology option is 0.4 quad (primary energy).
Technology Description and Energy Saving Principle
HID ballasts can dim lamps using two-level or continuous dimming. Current two-level dimming systems typically use constant-wattage autotransformer (CWA) ballasts. This circuit includes an additional capacitor, resulting in a fixed reduction in power and light output. Continuous dimming can be achieved using three different methods. The first uses a variable voltage transformer to reduce the voltage provided to the ballast, which allows dimming to approximately 60% of rated power. The second method adds a variable reactor to the circuit, changing the lamp current without affecting the voltage, which allows dimming to approximately 30% of the rated power. The third method employs solid-state components to change the waveform of the current and voltage inputs, allowing dimming to approximately 50% (NLPIP, 1994).
The added function of dimming would help overcome a critical shortcoming of HID lamps. After HID lamps extinguish, they require an inordinate amount of time to warm up to full light output and to restart. Therefore, turning the lamp “on and off” based on occupancy and daylight conservation is not a viable option. However, HID dimmable ballasts would enable HID lamps to dim to low levels without extinguishing the lamp. Dimming decreases energy consumption by decreasing power to the lamp. This technology would enable HID lamps to integrate easily with lighting controls, such as occupancy sensors and photosensors, resulting in additional energy saving.
Technical Maturity Level
There are no HID ballasts that can dim HID lamps lower than 30% of their nominal power. However, Delta Power Supply developed the first electronic ballast for HID that can dim to 33% of input power. Other products introduced to the market in the last two years include the DynaVision line from Advance Transformer that is dimmable to 50% (Advance Transformer, 2003).
Technology Maturity Stage
Basic Science Research Applied Research Exploratory
Development Advanced
Development Engineering Development
Product Demonstration
Commercialization and Sales
Issues with Existing Lighting Products and Systems
Dimmable electronic ballasts can directly replace traditional magnetic ballasts, and maintain compatibility with the existing lamp.
Technical Potential and Primary Energy Consumption Impact
Dimming ballasts will likely integrate with controls such as occupancy sensors and photosensors. HID lamps with dimming ballasts would replace existing HID and half of the fluorescent lamps in the commercial, industrial, and outdoor sectors. Assuming 100% market penetration in these applications

84
and a conservative overall energy savings of 15% of the baseline (Richman et al., 1996), achieved through the integration of occupancy and photosensors with electronic dimming ballasts, approximately 0.4 quad of energy could be saved per year. Table 3-45 presents this estimate.
Table 3-45: Technical Potential Energy Savings of HID Dimmable Ballasts
Technology Sectors Current Annual Consumption Savings Potential Technical Potential
Potential Savings
Fluorescent – Commercial, Industrial, Outdoor (partial)
1.5 quads 15% 0.2 quad
HID – Commercial, Industrial, Outdoor
1.4 quads 15% 0.2 quad
HID Dimmable Ballasts
Total Energy Savings 0.4 quad
Performance Information: Data and Source
Table 3-46 presents performance information for lamps operated with Advance Transformer’s High Frequency (HF) metal halide (MH) ballasts. Delta Power Supply also markets HF metal halide ballasts, capable of dimming lamps to 33% of full light output.
Table 3-46: Performance Information for High Frequency, Pulse Start, and MH Lamps
Lamp Type Power Input Voltage Lumen Maintenance Dim Level
Pulse-Start HF MH Ballast 320 W 200 to 277 volts 86 % 50 %
Pulse-Start HF MH Ballast 350 W 200 to 277 volts 86 % 50 %
Pulse-Start HF MH Ballast 400 W 200 to 277 volts 86 % 50 % Source: Advance Transformer, 2003.
Table 3-47 provides general warm-up times, restrike times, and dimming characteristics of several types of HID lamps.
Table 3-47: General Warm-up and Restrike Time, and Dimming Levels of HID Lamps Lamp Type Warm-up Time Restrike Time % Dimmable
Mercury Vapor 3-9 min. 5-10 min. 40%
Metal Halide 3-5 min. 4-20 min. 60%
High-Pressure Sodium 0.5-1 min. 3-4 min. 60% Source: IESNA, 2000.
Cost Information: Data and Source
A 400-watt magnetic CWA ballasts cost approximately $98 (1000bulbs.com, 2003). A cost estimates for a400-watt electronic ballast is $223, approximately $125 more than a 400-watt CWA ballast (Advance Transformer, 2003).
85
Non-Energy Benefits of the Technology
Increased dimming capabilities of HID lamps enable more flexibility in lighting design. In multi-use spaces, the lighting scene can be adjusted for distinct situations with different optimum lighting levels.
In outdoor applications, dimming reduces the amount of wasted light, resulting in less light pollution.
Notable Developers/Manufacturers of the Technology
HID ballast manufacturers include: Advance Transformer, OSRAM Sylvania, General Electric, Howard, Robertson Worldwide, Venture Lighting and Delta Power Supply.
Peak Demand Impact Potential
For the applications listed below, most of the energy consumption occurs during peak demand hours. Thus, a decrease in power draw due to dimming would reduce peak demand. In addition, the potential exists for utilities to dim lights during peak demand through remote ballast control.
Promising Applications
Promising applications for two-level dimming systems include those in the outdoor sector, (i.e., parking lots, roadways, pathways) because lights can be significantly dimmed during off hours.
Continuous dimming is suitable for multi-use applications where different levels of light are needed for different situations, for example: gymnasiums, classrooms, sporting arenas. Dimmable HID lamps also enable integration with lightings controls, such as photo sensors and occupancy sensors.
Perceived Barriers to Market Adoption
One of the major deficiencies of HID lighting is color shift of the lamp. This is due to the reduction in arc tube temperature, which lowers the vapor pressure of the metal halide dose materials and reduces the radiative atom population. Color shift may occur near the end of lamp life, and when lamps are dimmed to lower light output levels (IESNA, 2000).
Although life-cycle costs are compatible, the high first cost of electronic HID dimming ballasts may impede adoption.
Data Gaps and Next Steps
There is a lack of information regarding the effects of dimming on lamp performance. It is unknown how dimming impacts the life of the electrodes in these lamps. Issues include: electrode sputtering due to low hot spot temperature, lamp color shift, and arc instability. Furthermore, these technologies are relatively new to the market, and it is unknown whether these ballasts will live up the claims of manufacturers, especially regarding reliability and ballast life.
Development of HF reference ballasts for product testing would supply industry with the tools necessary to gain information on lamp and ballast interaction, aiding ballast engineers in the design of better ballasts.
Functionality alone will not transform the market. Industry must decrease cost and increase availability of these ballasts to compete effectively against existing ballast designs.

86
References
Advance Transformer, 2003. Dynavision Brochure. Advance Transformer; accessed on February 5, 2004 at http://www.advancetransformer.com/dynavision/ADV-3209_dynavision_bro.pdf.
Kwhlighting.com, 2003. Lamp prices; accessed on November 13, 2003 at http://www.kwhlighting.com.
IESNA, 2000. The IESNA Lighting Handbook: Reference and Application, 9th Edition. M.S. Rea. Illuminating Engineering Society of North America. New York: 2000.
NCI, 2002. U.S. Lighting Market Characterization Volume I: National Lighting Inventory and Energy Consumption Estimate. Prepared by Navigant Consulting, Inc. for the Department of Energy. Washington D.C. September 2002.
NLPIP, 1994. Dimming Systems for High-Intensity Discharge Lamps. National Lighting Product Information Program. Lighting Answers. Volume 1, Number 4.
Richman et al., 1996. “Field analysis of occupancy sensor operation: Parameters affecting lighting energy savings” Richman, E. E., A. L. Dittmer, and J. M. Keller. Journal of the Illuminating Engineering Society, 25(1): 83-92.

87
3.3.10. Sulfur Lamp
Sulfur lamps have the technical potential to save 0.8 quad of primary energy. This technology has some degree of technical risk as its situationed at the advanced development technical maturity stage.
Technology Description and Energy Saving Principle
A sulfur lamp consists of a quartz sphere filled with several milligrams of sulfur and an inert noble gas, usually argon. A small magnetron, which is a microwave generator, produces microwaves at a frequency of 2.45 GHz, transforms the sulfur into diatomic gaseous molecules called dimers. In the process known as molecular emission, these dimers emit energy in the form of visible light as they drop back to lower energy states. In the first commercial products, the small bulb rotated at 600rpm and was force-air cooled to prevent melting (DiChristina, 1995). Molecular sulfur emits light in almost the entire visible portion of the electromagnetic spectrum, 380nm to 780nm. Microwave powered sulfur lamps emit in the 300nm to 900nm spectrum, which overlaps well with the eye-sensitivity curve (Johnston, 2002). Therefore, the light produced by exciting sulfur molecules is similar to sunlight.
Sulfur lamps can also be used with reflectors to light larger areas. The relative small size of the bulbs allows for the optical design of more efficient reflectors, so less light is wasted (IAEEL, 1994). In addition, sulfur lamps do not exhibit drastic lumen depreciation over the life of the lamp, generally caused by the sputtering of electrodes onto the arc tube wall over time. This allows users to specify lamps with lower initial lumen and wattage ratings, resulting in energy savings.
Technical Maturity Level
Fusion Lighting, located in Rockville, MD, initially developed the sulfur lamp in 1990.29 The DOE sponsored two high-profile installations of the technology (5,900W lamps), one in the Smithsonian Air & Space Museum and the other in the Forrestal Building at DOE Headquarters. In order to demonstrate the effectiveness of sulfur lighting, two 5,900-watt sulfur lamps illuminating each end of a light tube replaced 240 175-watt lamps in the building overpass in the Department of Energy's Forestall Building (ETDE, 1995) – a savings of 30,200 watts.
These installations proved successful, and Fusion Lighting began manufacturing lamps for commercial and industrial use (Smithsonian Institute, 2003). They introduced two standard models in 1997, the Light Drive 1000™ and the Solar 1000™, but all production came to a halt indefinitely in 1998 (Innovative Lighting, 2002).
Technology Maturity Stage
Basic Science Research
Applied Research Exploratory Development
Advanced Development
Engineering Development
Product Demonstration
Commercialization and Sales
29 The engineering of the Light Drive and the Solar 1000 involved partial support from DOE.

88
Issues with Existing Lighting Products and Systems
Sulfur lamps require completely different fixtures than the HID or fluorescent lamps they would replace. In addition, sulfur lamps are generally used in combination with a light pipe system to distribute light. Furthermore, there is concern that sulfur lamps may cause electromagnetic interference in the 2.4 GHz spectrum band. Devices that use this spectrum include wireless LANs (802.11b and 802.11g) and cordless phones (Stroh, 2001). The quality of many of these devices is extremely sensitive to interference, and performance might be a concern as this part of the spectrum becomes more crowded. However, recent advances in spread spectrum technology mitigate some of these concerns.
Technical Potential and Primary Energy Consumption Impact
Table 3-48 summarizes the energy savings calculation for molecular discharge lamps. Molecular discharge lamps would initially compete for market share with other HID sources. In the commercial, industrial, and outdoor sectors, the potential energy savings are 0.42 quad. This estimate is based on an efficacy of 110 lm/W for molecular discharge systems, and an average efficacy of 77 lm/W for HID systems. Molecular discharge technology may also replace some replace fluorescent sources in the commercial and industrial sectors, with a potential energy savings of 0.4 quads. This estimate is based on an efficacy of 110 lm/W for molecular discharge systems, and an average efficacy of 72 lm/W for fluorescent systems in the commercial and industrial sector. Combined, the technical potential energy savings for molecular discharge lamps is approximately 0.8 quads.
Table 3-48: Technical Potential Energy Savings of Molecular Discharge Lamps
Technology Sectors Current Consumption
Efficacy New Technology
Efficacy Old Technology
Potential Consumption
Potential Energy Savings
All HID (C/I/O) 1.41 quads 110 lm/W 77 lm/W 0.99 quad 0.42 quad
Fluorescent – C&I (partial)
1.15 quads 110 lm/W 72 lm/W 0.75 quads 0.40 quad Sulfur Lamps
Total Energy Savings 0.8 quad
Performance Information: Data and Source
Molecular discharge sulfur lamps would be an appropriate replacement for MH and MV lamps. Table 3-49, below, shows the superior efficacy and longer life of sulfur lamps over alternative technologies.
Table 3-49: Efficacy and Life for MV, MH and Sulfur Lamps
Lamp Type Efficacy Life
Mercury Vapor 60 lm/W 24,000 hours
Metal Halide 70-102 lm/W 15,000-20,000 hours
Sulfur Lamps 110 lm/W 60,000 hours Source: OSRAM Lightpoint, 2003; Discover, 1995.
Sulfur lamps do not use electrodes, and they are able to maintain 90% lumen output over lifetime, as opposed to other light sources that use electrodes, whose light output may degrade 50-70% over their lifetime (LBNL, 1995).

89
Cost Information: Data and Source
The DOE sponsored two high-profile installations of the technology (5,900W lamps), one in the Smithsonian Air & Space Museum and the other in the Forrestal Building at DOE Headquarters. These installations proved successful, and their cost was approximately half the amount it would have taken to replace the conventional technology (DiChristina, 1995).
Non-Energy Benefits of Technology
Unlike incandescent, fluorescent, and HID lamps, sulfur lamps contain no mercury. Therefore, sulfur lamps do not pose a threat to the environment or require special disposal (Innovative Lighting, 2002). Sulfur lamps also have a long lifetime (60,000+ hrs) as well as the ability for quick-starts and re-strikes in seconds. In addition, the lamps are also not orientation sensitive; therefore, they operate in any position without diminished performance.
Museums, such as the National Air and Space Museum in Washington, D.C., use sulfur lamps because of their low UV emission, which protects exhibits from damage.
Notable Developers/Manufacturers of Technology
Fusion Lighting, Inc. developed the Solar 1000™ lamp and the Light Drive™ 1000 with assistance from the US Department of Energy (DOE). They introduced the Solar 1000™ lamp in 1994 replacing it in the fall of 1997 with an improved model, the Light Drive™ 1000. However, all production of this technology came to a halt indefinitely in 1998 (Innovative Lighting, 2002; IESNA, 1998).
Hochi et al. (Matsushita Electr. Ind. Co. Ltd., Kyoto) investigated downsizing the luminous part of the lamp using a vane-type resonator (Hochi, 2001).
Peak Demand Impact Potential
For applications listed below, most of the energy consumption occurs during peak demand hours. Thus, an improvement in lamp efficacy would result in peak demand reduction.
Promising Applications
Sulfur lamps can be used both indoors and outdoors. Promising applications include: lighting large buildings like malls, factories, manufacturing facilities, inspection lines, aquariums, and stadiums, and plant growth applications.
Sulfur lamps can be used in conjunction with light tubes, which reflect light and distribute it over the length of the tube. Light pipes attach to remote single point light sources, in this case a sulfur lamp, to put uniform light where it is needed while placing the source where it is wanted (Innovative Lighting, 2002). One or two sulfur lamps can replace an entire row of HID or fluorescent lamps.
Perceived Barriers to Market Adoption
A high first cost would act as a barrier to the adoption of sulfur lamps. The development of an affordable, efficient, and long-lived microwave source is a technological hurdle to cost reduction.
The lamp prototypes were also only available in high wattages (1000+ W), which may impede adoption in applications where light output demands are not great.

90
The sulfur lamp had problems with the life of the magnetron and the motor that rotates the arc tube. Because the technology requires moving parts, reliability remains a technology barrier to adoption. Therefore, ballast life and system maintenance issues may impede market adoption of this technology.
There is concern that sulfur lamps emit wavelengths that interfere with other devices in the nearby EM spectrum. Satellite companies, specifically Sirius Satellite Radio and XM Satellite Radio, claim that sulfur lamps used for street lighting emit radio waves that interfere with satellite radio broadcasts in the 2.3Ghz range. The FCC attempted to negotiate a compromise, and Fusion Lighting agreed to put a metal casing around its microwave generator to block 95% of the emissions. The satellite radio companies demanded 99.9% blockage, which Fusion claimed would put them out of business (Schroeder and Dreazen, 2001). With the advent of wireless fidelity systems (e.g., 802.11b and 802.11g) on the 2.4 GHz band, the same as sulfur lamps, the issue of interference is much greater (Stroh, 2001). However, these devices were intentionally designed to operate in an ISM band to avoid licensing procedures and costs to get spectrum space in the communication bands. Therefore, according to FCC regulations, these devices have no “rights” in the ISM bands. With spectrum space such a hot commodity, this issue could be a large barrier to market adoption.
Data Gaps and Next Steps
In order to bring the technology to market and realize the potential energy savings above, affordability and reliability are paramount. Researchers need to identify and develop smaller, cheaper and better resonators while also addressing the issues of reliability and long life. It is also necessary to develop microwave sources that will not interfere with other products in the same part of the spectrum.
References
DiChristina, 1995. “Bright Light, Small Bulb.” Mariette DiChristina. Popular Science. February 1995.
ETDE, 1995. “1995 Discover Awards for Technological Innovation.” Energy Technology Data Exchange; accessed on September 23, 2003 at http://www.etde.org/html/secretry/tp950429.html.
Hochi, 2001. “Vane-type Electrodeless HID Lamp.” Hochi, A.; Hashimotodani, K.; Katash, K. Matsushita Technical Journal, Volume 47, Number 4, pp 42-6. August 2001.
IAEEL, 1994. “Sun on Earth.” IAEEL Newsletter 1994. International Association for Energy Efficient Lighting; accessed on September 3, 2003 at http://195.178.164.205/IAEEL/iaeel/newsl/1994/tre1994/LiTech_3_94.html.
IAEEL, 1998. “Fusion Calls ‘Timeout’ in Sulfur Lamp Race.” IAEEL Newsletter 1998. International Association for Energy Efficient Lighting; accessed on September 2, 2003 at http://www.iaeel.org/IAEEL/NEWSL/1998/tva1998/LiMa_a_2_98.html.
Innovative Lighting, 2002. “Frequently Asked Questions.” SulfurLamp.Com; accessed on September 3, 2003 at http://www.sulfurlamp.com/slq&a1.htm.
LBNL, 1995. “Sulfur Lamps—The Next Generation of Efficient Light?” Center for Building Science Newsletter. Environmental Energy Technologies Division. Spring 1995.
NCI, 2002. U.S. Lighting Market Characterization Volume I: National Lighting Inventory and Energy Consumption Estimate. Prepared by Navigant Consulting, Inc. for the Department of Energy. Washington D.C. September 2002.
Pacific Northwest National Labs, 1998. “Demonstration and Assessment of a Sulfur Lamp Retrofit Lighting System at Hill Air Force Base, Utah.” Pacific Northwest National Labs; accessed on September 23, 2003 at http://www.pnl.gov/buildings/exsumhafbrpt.PDF.

91
Schroeder and Dreazen, 2001. “Tech Skirmish: Energy-Saving Light Bulbs Mar Satellite Radio.” Michael Schroeder and Yochi Dreazen. Wall Street Journal. August 6, 2001.Stroh, 2001. “A Potential ‘Extinction Level Event’ for Communications Users of the 2.4GHz Band.” Steve Stroh. Focus on Broadband Wireless Internet Access.
Smithsonian Institute, 2003. “Inventing Six Modern Electric Lamps.” Lighting a Revolution. Smithsonian Institute; accessed on September 3, 2003 at http://americanhistory.si.edu/lighting/20thcent/invent20.htm.

92
3.4. Light-Emitting Diode (LED)
In 1962, the first practical visible-spectrum light-emitting diode (LED) was invented at the Advanced Semiconductor Laboratory of General Electric (Holonyak and Bevaqcua, Applied Physics Letter, Volume 1, pp.82-83). This LED consisted of a GaAsP alloy with a p-n homojunction. The development of this technology accelerated over the next few years, culminating in the commercial product release of red LEDs in the late 1960s. While the efficacy of these first LEDs was extremely low (~ 0.1 lm/W), researchers continued to improve the technology over the next three decades, achieving higher efficiencies and expanding the range of available emission wavelengths through the engineering of new III-V alloy systems, thus providing the wide array of high-brightness LEDs that we see today.
Compared to incandescent or discharge lamps, LEDs produce light using a fundamentally different principle. They are semiconductors that consist of similar materials with slightly different electronic properties that are brought together to create a “p-n junction”. In a p-n junction, the “p” material contains an excess of positive charges (also called holes) due to the absence of electrons. The “n” material contains an excess of negative charges due to the presence of electrons. When a voltage is applied to this p-n junction, the electrons and the holes combine, releasing energy that can take the form of light.
LEDs emit light in a narrow wavelength band, making the emission appear colored. Therefore, LEDs require multiple elements (e.g., 3-color or 4-color device) or some form of broadband conversion (e.g., near-UV or blue emission with phosphors) to produce “white” light for general illumination applications. This ability to tailor its emission not only gives LEDs tremendous flexibility to create a “white light” source of virtually any color temperature, but it also enables control of the visual appearance of illuminated surfaces through the illuminant. For example, LED light sources whose color appearance is identical (same color temperature) may have a different color-rendering index (CRI) and, therefore, may appear different to the human visual system.
On February 3rd and 4th, 2005, the Department of Energy (DOE) held its Second Annual Workshop to shape and prioritize its solid-state lighting (SSL) research activities for the next one to two years. A Workshop Report was published in April 2005 which provides an overview of the discussion, findings, and outcomes from this consultative Workshop.30 Held in San Diego, CA the Workshop included 170 technology leaders from industry, universities, trade associations, research institutions, and national laboratories. These participants reviewed and discussed research topics, clarified technological research needs and objectives, and prioritized tasks and subtasks that will form the basis of future DOE solicitations. For more information on this workshop, including a copy of the workshop report, visit the DOE’s SSL website: http://www.netl.doe.gov/ssl/
The following sections present twelve technology options relating to LED lighting for general illumination.
30 The Workshop report is available on DOE’s SSL web site: http://www.netl.doe.gov/ssl/PDFs/DOE_SSL_Workshop_Report_Feb2005.pdf

93
3.4.1. Reflector Lamp
This option represents an annual technical potential energy savings of 0.2 quad of primary energy. However, initial costs are presently very high and LED products with light output equivalent to all typical incandescent reflector lamps has not yet occurred.
Technology Description and Energy Saving Principle
A reflector (R) lamp is any lamp that has a reflective coating, and is broadly classified into two types. The first type is the R lamp identified by single bulb construction where the reflective coating is applied to the inside of the glass. Variations of the R lamp include ER and BR designations, distinguished by their elliptical and “bulged” shapes respectively. The second type is the PAR (parabolic aluminized reflector) lamp, distinguished by a two-piece construction made up of a pressed bulb sealed to a separate lens. A reflective coating is applied to the pressed glass bulb. The shape of the reflective coating directs the light in a given direction with a specific distribution (NLPIP, 1994).
Typically, tungsten filament is the material used in incandescent reflector lamps due to its low cost and good point source approximation. A point source simplifies the design of optics to control the direction and distribution of light. An LED emitting light from a semiconductor chip is an excellent point source approximation. In addition, optics typically built into the LED package make its light directional and eliminate the need for specialized optics in the bulb (or luminaire) to efficiently direct and distribute light. Therefore, a cluster of LEDs can replace the less efficacious tungsten filament as the light source for reflector lamps. The LED system retains the same (equivalent) form-factor in order to directly replace the incandescent reflector lamp.
Utilization of LEDs as an alternative light source for reflector lamp applications will lead to energy savings due to their high device efficacy. The continued improvements in LED device technology will only increase the energy savings potential of this alternative light source.
Technical Maturity Level
Reflector lamps using clusters of LED light sources are available in MR-16, R20, R30, R38 and R40 packages. However, current LED device technology does not produce sufficient light to provide the same utility as that of current reflector lamps.
Technology Maturity Stage
Basic Science Research Applied Research Exploratory
Development Advanced
Development Engineering Development
Product Demonstration
Commercialization and Sales
Issues with Existing Lighting Products and Systems
LED reflector lamps have an equivalent form-factor to incandescent reflector lamps, enabling direct replacement. However, heat dissipation of LED light sources rely on conduction and convection, whereas incandescent sources radiate heat away. Therefore, LED PAR lamps place within an incandescent fixture may not be able to transfer sufficient heat and may experience negative effects (i.e., shorter life, color shift).

94
Technical Potential and Primary Energy Consumption Impact
The estimated energy consumption of incandescent reflector lamps is 0.2 quad of primary energy in 2001 (NCI, 2002). The energy savings potential of an LED PAR lamp depends on the magnitude of the improvement in efficacy and the level of market penetration. Assuming the current level of technology, replacing all incandescent reflector lamps (~12 lm/W) with LED PAR lamps (~ 30 lm/W)31 will result in an annual energy savings potential of 0.1 quad – a 60% reduction in energy consumption. However, if LEDs achieve a device efficacy of 160 lm/W, then the technical potential energy savings is 0.16 quad.
Performance Information: Data and Source
The light output of a reflector lamp is directional. Describing its light output in terms of both quantity and distribution provides the most useful information for maximum utilization in its intended application. A candlepower distribution curve provides the greatest detail, but a center beam candlepower (CBCP) rating and beam angle are sufficient to characterize its output. The CBCP is the maximum intensity of the light in candelas (cd). The beam angle (BA) is the angle in which the intensity does not fall below 50% of its maximum value.
The best typical performance of current high-brightness LED devices is about 30 lm/W. That is about a 150% improvement over the baseline incandescent technology of 12 lm/W, and about a 100% improvement over tungsten-halogen technology at 15 lm/W. It is on par with the best available HIR coated reflector lamps, whose efficacy is also about 30 lm/W. However, the light output of the best commercially available LED reflector lamp package is only equivalent (equivalent CBCP, BA, and intensity) to a 20-watt incandescent reflector lamp (LEDtronics, 2003). The performance of LED devices, however, is improving rapidly. As better devices become available, original equipment manufacturers can quickly integrate these new LEDs into commercially available reflector lamp packages.
Cost Information: Data and Source
A 65-watt incandescent reflector lamp is available at a local Home Depot for approximately $2.50 (Home Depot, 2003). An equivalent halogen PAR lamp is approximately $5.00 (Home Depot, 2003). An HIR lamp costs approximately $11.00 (Bulbs.com, 2003). An LED cluster in a PAR20 package costs around $150.00 (LEDtronics, 2003). Chinese vendors at Lightfair 2004 demonstrated LED based PAR lamps for as low as $20. However, even at $150, the LED alternative does not offer equivalent light output (equivalent CBCP, BA, and intensity).
Non-Energy Benefits of the Technology
The extremely long life of LEDs may eliminate waste that fills up landfills. Since there are virtually no surges of current associated with LEDs unlike discharge sources, which require extreme starting voltages to initiate the arc, LEDs have some inherent safety benefits. In rough applications and harsh environments, the intrinsic shock and vibration resistance of SSL technology also offers safety advantages over existing light sources. LEDs can be manufactured to emit zero UV and IR, which makes it an ideal light source in UV and IR sensitive applications. Furthermore, development of this technology would catalyze the development of a completely new solid-state lighting industry.
31 Assumes wall-plug efficiency that includes LED driver losses, typically 10% to 35%.

95
Notable Developers/Manufacturers of the Technology
An Internet search through the Lightsearch search engine identified the following LED reflector lamp manufacturers (Lightsearch, 2003):
LEDtronics makes LED reflector lamps in the PAR20, R20 and R30 packages. Their most powerful unit uses 123 discrete LEDs in an R30 package
Color LED makes them in a PAR20 and PAR30 package.
WATT-MANTM L.E.D. Lighting (limited style, only in medium base cluster)
Act One Communications Inc. (limited style, only in medium base cluster)
Barron Manufacturing Corporation (limited style, only in medium base cluster)
Boca Flasher (limited styles, PAR available)
Delta Light (not PAR, just cluster)
Peak Demand Impact Potential
Part of the energy consumption of this light source would be coincident with peak, and an improvement in lamp efficacy would result in peak demand reduction. In addition, during peak demand summer periods, the new technology would reduce a building’s internal heat load, reducing the energy consumed by the air conditioning system.
Promising Applications
As the LED reflector lamp achieves light output equivalence with incandescent and fluorescent reflector lamps, it can replace the reflector lamp in all existing applications. Initially, this lamp type would impact monochromatic applications (i.e., indicator lamps, sign lighting). Next, as technology improves it would likely impact niche applications where its directionality, long-life, no power surge, low heat generation, shock/vibration resistance, DC operation, and low voltage capability would be an asset. For example, in museums where objects sensitive to UV and IR energy are displayed, LED light sources can provide illumination free of UV and IR energy. Also, in off-grid applications with a DC power source, LED light sources can operate with a minimal amount of electronics used for power regulation.
Perceived Barriers to Market Adoption
The major factor that will prevent rapid adoption of LED lights sources is price. LEDs cost up to 100 times more than halogen lamps in terms of the price per lumen emitted. Therefore, customers are still opting for traditional, established technologies rather than paying a premium for LEDs. "In reasonable volumes, LEDs cost a little over 10 cents per lumen. It's our goal to get the LED cost down to one or two cents per lumen over the next few years," Frank Steranka, vice president of research and development at Lumileds, told Opto & Laser Europe (Opto, 2003).
Data Gaps and Next Steps
To achieve its energy savings potential, the efficacy of a typical LED device needs to improve dramatically. Internal quantum efficiencies must approach 100%. Also, the extraction efficiency must be improved significantly to increase device efficiency.

96
Heat generated by LEDs is conductive and heat rapidly degrades its performance. However, the packaging materials, encapsulants, lens materials, and silicone binders cannot withstand the flux density, wavelength, and temperatures of LED devices. Therefore, manufacturers must derate LED devices to accommodate for these limitations. Manufacturers need to improve the materials, manufacturing processes, and thermal design of these devices to adequately handle this issue.
Costs must fall substantially for this technology to compete effectively against existing light sources. In addition, the light output of an LED system needs to provide equivalent light in the same form-factor as existing reflector lamps. For example, if an LED reflector lamp cannot put out the same amount of light as a 65-watt BR30 lamp, then it does not provide the same utility.
References
Bulbs.com, 2003. Lamp prices; accessed on September 22, 2003 at http://bulbs.com.
Home Depot, 2003. Inspection of Home Depot store located in Fairfax, VA on September 21, 2003.
LEDtronics, 2003. LEDtronics, Inc; accessed on September 22, 2003 at http://www.ledtronics.com.
Lightfair, 2003. Personal Communication with manufacturers of LED devices. Lightfair 2003 in Javits Convention Center, Manhattan, New York on May 3-8, 2003.
Lightsearch, 2003. Website accessed on September 22, 2003 at http://lightsearch.com.
NCI, 2002. U.S. Lighting Market Characterization Volume I: National Lighting Inventory and Energy Consumption Estimate. Prepared by Navigant Consulting, Inc. for the Department of Energy. Washington D.C. September 2002.
NLPIP, 1994. National Lighting Product Information Program (NLPIP), Specifier Reports: Reflector Lamps. Volume 3, Number 1. Lighting Research Center. Troy, NY.
Opto, 2003. “Cost Hinders LED Uptake.” An interview with Frank Steranka (vice president of research and development at Lumileds) by Jacqueline Hewitt. Opto & Laser Europe. May 2003.

97
3.4.2. Integrated White LED Package
LEDs represent a technology with a technical potential energy savings potential of up to 1.1 quads. Development of monolithic white LEDs could result in significant manufacturing cost reductions paving the way for rapid market adoption.
Technology Description and Energy Saving Principle
The total cost of a typical lighting system consists of two major components. Approximately one-third of the cost is the lamp, while the remaining two-thirds is the fixture and the drive electronics. Thus, there are strong cost motivations for integrating the function of these two components onto a single chip. Shifting functionality from the die or package to the wafer or chip can be an important means for reducing cost for all white-light LED systems. Discrete color mixing will inherently benefit due to a reduction of the multi-chip process necessary to create the multiple discrete colors, but hybrid and conversion approaches also stand to benefit. In principle, wavelength conversion can occur in thin film materials deposited during chip fabrication. Therefore, the development of a monolithic white light LED device will pave the way for SSL to compete with and replace existing light sources (i.e., incandescent, fluorescent, HID).
Other semiconductor technologies have proven that a single chip is always much less expensive than discrete packaging, because chip fabrication is done at the wafer-level. A parallel process over the entire wafer is less costly than a serial process done die-by-die (or package-by-package). In addition, monolithic integration at the wafer level would enable fabrication of compact microsystems with higher functionality and enhanced yield and reliability (OIDA, 2002). Since white light LEDs have the potential to achieve significantly higher efficacies than these existing light sources, their use would result in energy savings.
Technical Maturity Level
The predominant method currently used by manufacturers is the hybrid approach. Although the total light output of these nascent LED devices cannot yet match commercially available incandescent lamps, manufacturers produced white LEDs with efficacies exceeding incandescent technologies. At Lightfair 2003 in New York, several key manufacturers demonstrated monolithic white-light LED devices utilizing these various techniques. GELcore demonstrated a UV LED with phosphors. Lumileds and Nichia both demonstrated white LEDs under the hybrid approach using a blue LED with phosphors (Lightfair, 2003).
Technology Maturity Stage
Basic Science Research Applied Research Exploratory
Development Advanced
Development Engineering Development
Product Demonstration
Commercialization and Sales
Issues with Existing Lighting Products and Systems
Solid-state lighting (SSL) is a disruptive technology with the potential to replace incandescent and discharge (i.e., fluorescent and HID) light sources (OIDA, 2002). However, LEDs can mimic existing light sources in both shape and function making possible the development of interim products to help phase in this technology into the existing infrastructure.

98
Technical Potential and Primary Energy Consumption Impact
LEDs have the potential to impact the entire lighting industry, but because of their high initial cost, their market penetration is expected to be gradual. LED devices would initially impact incandescent sources while displacing fluorescent and HID sources at a more gradual rate as the technology matures (Opto, 2003). The integrated white LED package would be competitive in particular niches of the larger lighting market.
In 2001, the annual energy consumption for lighting in all sectors was 8.3 quads; incandescent light sources consumed 3.5 quads of primary energy while fluorescent and HID consumed 3.4 and 1.4 quads respectively (NCI, 2002). If this integrated white LED package achieves 160 lm/W and has access to 20% of the sockets in the lighting market, the technical potential energy savings potential is 1.1 quads.
Performance Information: Data and Source
Irrespective of the method, the best performance for commercially available white-light LED sources is about 30 lm/W. That is about a 150% improvement over the baseline incandescent technology at 12 lm/W, and about a 100% improvement over tungsten-halogen technology at 15 lm/W. However, 30 lm/W is par with the best available HIR coated reflector lamps.
Industry believes that a white-light approach using a UV LED with phosphors is capable of producing 150 lm/W, and a hybrid approach is capable of producing 80 lm/W. Because 160 lm/W is possible using multiple LED devices with different peak wavelengths, some manufacturers believe that discrete color mixing will gain prominence as the wavelength-conversion approaches reach their theoretical limits (Lightfair, 2003).
Cost Information: Data and Source
Although a cost estimate breakdown is not available that would show the discrete financial contribution of each area of LED research, a single high-brightness LED element from Luxeon costs about $8 (Lumileds, 2003). However, this does not include the added costs of drive electronics, system package, and distributor mark ups.
Non-Energy Related Benefits of the Technology
See “Non-Energy Related Benefits of the Technology” in section 3.4.1.
Notable Developers/Manufacturers of the Technology
There are hosts of companies in this field trying to make white light LEDs better and more affordable. The following companies are several of the producers of this technology: GELcore, a joint venture between GE Lighting and Emcore; Lumileds, a joint venture between Agilent Technologies and Philips Lighting; Nichia; and OSRAM Optoelectronic.
Peak Demand Impact Potential
The expected operating hours for this technology would be coincident with the time of peak energy demand. Therefore, an improvement in lamp efficacy would result in peak demand reduction, all other things being equal. In addition, during peak demand summer periods, the new technology would reduce a building’s internal heat load, reducing the energy consumed by the air conditioning system.

99
Promising Applications
In an interview by Jacqueline Hewitt in the May 2003 issue of Opto & Laser Europe, Frank Steranka (vice president of research and development at Lumileds) had the following to say about the promise of white-light LEDs.
“Small portable applications using white light LEDs, such as handheld torches and bicycle lamps, are already available and are likely to grow in popularity as performance improves and prices fall”. Another promising sector is the medical industry. Steranka believes that surgeons could soon be wearing white LED spotlights on their heads while performing operations. Moreover, as energy savings, life-cycle costs and payback periods are better understood, the commercial sector is starting to consider white LEDs. A car using LEDs as its sole source of lighting is not far away. "I think in 2006 we will see the first headlights and then by 2010 there will be a reasonable number (of vehicles equipped with LED headlights)," says Steranka. Penetration into the general lighting market will be more gradual. Steranka says, "I believe you will see LED illumination applications in the 10-year timeframe, but you will still see incandescent out there. Getting into the home is going to be the most challenging, where upfront cost is vitally important." Breaking into the fluorescent market will be an even greater challenge. The low price and high efficiency of fluorescent lamp sources will be very hard to beat, he adds.
Perceived Barriers to Market Adoption
See “Perceived Barriers to Market Adoption” in section 3.4.1.
Data Gaps and Next Steps
Primarily, costs must fall substantially for this technology to compete effectively against existing light sources. One approach is to increase the performance of the device, either by making it more efficient or enabling it to operate at a higher current. Another approach is to decrease the cost of manufacturing through improvements in bulk processing and assembly.
To achieve its energy savings potential, the efficacy of LED devices needs to improve dramatically. Internal quantum efficiencies need to approach 100% while the extraction efficiency must also improve to more than 75% to increase device efficiency to established goals.
Because LEDs are monochromatic light sources, practical materials and fabrication processes need to be identified to enable this technology to compete as a white-light source. For wavelength conversion, phosphor materials need to be identified and processes developed to design and build these monolithic devices cheaply and reliably. For discrete color mixing, methods and processes need to be developed to manufacture the dissimilar and discrete components for each color as a single device. That may require the development of a single novel material that can reproduce the entire visible spectrum. Also, the performance of each element in a discrete system must operate in a consistent and predictable fashion in order to generate a reliable white light source. An alternative method may be to use the drive electronics to compensate for disparate elements and allow them to operate as a single reliable system.
Heat generated by LEDs is conductive and rapidly degrades device performance. However, the packaging materials, encapsulants, lens materials, and silicone binders cannot withstand the flux density, wavelength, and temperatures of LED devices. Therefore, manufacturers must derate LED devices to accommodate for these limitations. Manufacturers need to improve the materials, manufacturing processes, and thermal design of these devices to adequately handle this issue.
100
References
Lightfair, 2003. Personal Communication with manufacturers of LED devices. Lightfair 2003 in Javits Convention Center, Manhattan, New York on May 3-8, 2003.
Lumileds, 2003. Personal Communication with Luxeon Sales Department on September 15, 2003.
NCI, 2002. U.S. Lighting Market Characterization Volume I: National Lighting Inventory and Energy Consumption Estimate. Prepared by Navigant Consulting, Inc. for the Department of Energy. Washington D.C. September 2002.
OIDA, 2002. Light Emitting Diodes (LEDs) for General Illumination: An OIDA Technology Roadmap Update 2002. Optoelectronics Industry Development Association. November 2002.
Opto, 2003. “Cost Hinders LED Uptake.” An interview with Frank Steranka (vice president of research and development at Lumileds) by Jacqueline Hewitt. Opto & Laser Europe. May 2003.

101
3.4.3. White-Light Systems
LEDs are an exciting light source technology with the potential for very high efficacies. The technical potential energy savings for these white-light systems is 1.1 quads.
Technology Description and Energy Saving Principle
LEDs are discrete devices that emit radiation in a narrow band in the visible spectrum. Therefore, the monochromatic light must transform into broadband white-light for general illumination applications. Presently, there are three primary approaches to generate white light from these discrete devices: color mixing, wavelength-conversion, and a hybrid approach. In color mixing, the combination of discrete wavelengths from multiple LEDs of different colors generates white light. In the wavelength-conversion, UV emitted from the LED excites luminescent materials that emit light at visible wavelengths. In the hybrid approach, the combination of emissions from a blue LED, emitting at 460nm, and wavelengths emitted from luminescent materials (down-converted from the blue) produces white light.
Of the current methods for producing white light, discrete color mixing strategies may likely be the most efficient since there is no power-conversion losses associated with an energy conversion process. However, this approach will likely need to accommodate multi-chip mounting, and sophisticated optics for blending the discrete colors to make white light.
An efficient and practical method for producing white light will help enable LEDs to achieve the highest efficacies. Replacing lower efficacy light source with LEDs would result in significant energy savings.
Technical Maturity Level
The predominant method used by manufacturers to produce white light is the hybrid approach. It offers a good compromise in cost and performance considering the current state of development of LED technology. Although color mixing has the potential to achieve the highest efficacy, the challenges in mixing discrete colors to generate white light are significant. Color mixing of discrete sources is relegated to the laboratory, at least for now, and is still years away from commercialization.
Technology Maturity Stage
Basic Science Research Applied Research Exploratory
Development Advanced
Development Engineering Development
Product Demonstration
Commercialization and Sales
Issues with Existing Lighting Products and Systems
See “Issues with Existing Lighting Products and Systems” in section 3.4.2.
Technical Potential and Primary Energy Consumption Impact
See “Technical Potential and Primary Energy Consumption Impact”in section 3.4.2.

102
Performance Information: Data and Source
See “Performance Information: Data and Source” in section 3.4.2.
Cost Information: Data and Source
See “Cost Information: Data and Source” in section 3.4.2.
Non-Energy Related Benefits of the Technology
See “Non-Energy Related Benefits of the Technology” in section 3.4.1.
Notable Developers/Manufacturers of the Technology
See “Notable Developers/Manufacturers of the Technology” in section 3.4.2.
Peak Demand Impact Potential
See “Peak Demand Impact Potential” in section 3.4.2.
Promising Applications
Investigations of LED color mixing are a critical step towards the realization of SSL as a general illumination light source. See “Promising Applications” in section 3.4.2.
Perceived Barriers to Market Adoption
See “Perceived Barriers to Market Adoption” in section 3.4.1.
Data Gaps and Next Steps
The technical challenge is to develop methods and materials that result in an adequate blend of white light. In addition, color constancy must be achieved with respect to visual angle and device operating temperature. This is less of an issue with the wavelength-conversion approach, but is a significant barrier to discrete color mixing and hybrid approaches.
For wavelength conversion, phosphor materials need to be identified that more efficiently convert short wavelength radiation to the longer wavelengths. In addition, methods and processes must be developed that more effectively combine the discrete wavelengths to generate white light.
In the hybrid approach, color non-uniformity occurs because the light from the blue LED is directional while the light from the phosphor radiates over a 2π solid angle. In addition, since chip and phosphor efficiency may change with temperature, the ratio of the colors that are being blended may also change with temperature.
In discrete color mixing, each discrete wavelength must adequately combine to give the appearance of white light. This is complicated due to variations in emission peak and amplitude with temperature. Each discrete wavelength does not behave in a consistent manner with respect to each other. Therefore, methods and processes need to be developed to manufacture the dissimilar and discrete components for each color as a single device. That may require the development of a single novel material that can reproduce the entire visible spectrum. In addition, the performance of each element in a discrete system must operate in a consistent and predictable fashion in order to generate a reliable white light source. An

103
alternative method may be to use the drive electronics to compensate for disparate elements and allow them to operate as a single reliable system.
In addition, heat generated by LEDs is conductive and rapidly degrades device performance. However, the packaging materials, encapsulants, lens materials, and silicone binders cannot withstand the flux density, wavelength, and temperatures of LED devices. Therefore, manufacturers must derate LED devices to accommodate for these limitations. Manufacturers need to improve the materials, manufacturing processes, and thermal design of these devices to adequately handle this issue.
References
Lightfair, 2003. Personal Communication with manufacturers of LED devices. Lightfair 2003 in Javits Convention Center, Manhattan, New York on May 3-8, 2003.
Lumileds, 2003. Personal Communication with Luxeon Sales Department on September 15, 2003.
NCI, 2002. U.S. Lighting Market Characterization Volume I: National Lighting Inventory and Energy Consumption Estimate. Prepared by Navigant Consulting, Inc. for the Department of Energy. Washington D.C. September 2002.
OIDA, 2002. Light Emitting Diodes (LEDs) for General Illumination: An OIDA Technology Roadmap Update 2002. Optoelectronics Industry Development Association. November 2002.
Opto, 2003. “Cost Hinders LED Uptake.” An interview with Frank Steranka (vice president of research and development at Lumileds) by Jacqueline Hewitt. Opto & Laser Europe. May 2003.

104
3.4.4. High Lumen Package
High-lumen package light-emitting diodes (LEDs) are a technology option with a technical potential energy savings of up to 1.1 quads. The development of high lumen output devices would facilitate replacement of niche markets currently illuminated by incandescent technologies.
Technology Description and Energy Saving Principle
The first applications for commercial LEDs were limited to low light output indicator light applications. As LED light output increased, their potential as general illumination devices also increased. Currently, their small size necessitates packaging LEDs into large clusters to achieve the light output required for general illumination. This requires fabrication of complex arrays, which limits the total light output of the LED system by its form-factor. In addition, using arrays creates challenges for the system architecture and drive electronics to provide equal power for equal luminance to each discrete element in the array. For example, imbalances in the delivery of current to the devices in the array would overdrive some of the discrete LEDs. Not only would the overdriven LEDs burn brighter than the others, but their useful life would also decrease at a much faster rate than the rest of the LEDs in the cluster. Furthermore, thermal gradients within the system would also cause performance variations. Not only would these effects cause noticeable luminance variations in the array, but they may also lead to premature failure of the LED system.
The development of high lumen packages would alleviate limitations imposed by LED arrays. If a single chip device could replace an array, it would eliminate the problematic issues of variations in thermal and current characteristics. This would improve reliability of LED devices, and would facilitate development of LED products with sufficient light output capable of competing with and possibly replacing fluorescent and HID sources. In addition, the increased light output could potentially reduce the cost per unit of light of these devices. The replacement of less efficacious light sources with high efficacy LEDs would result in energy savings.
Technical Maturity Level
Tremendous progress has been made in increasing the light output of LED devices. However, the most significant and practical advances are consigned to the laboratory and are far from commercialization. For example, an LED manufacturer demonstrated a single chip monolithic white-light LED device generating the light output equivalent to a 60-watt incandescent light bulb (Lightfair, 2003).
Technology Maturity Stage
Basic Science Research Applied Research Exploratory
Development Advanced
Development Engineering Development
Product Demonstration
Commercialization and Sales
Issues with Existing Lighting Products and Systems
See “Issues with Existing Lighting Products and Systems” in section 3.4.2.

105
Technical Potential and Primary Energy Consumption Impact
See “Technical Potential and Primary Energy Consumption Impact” in section 3.4.2.
Performance Information: Data and Source
Luxeon Star Power Light Sources are capable of generating 120 lumens per device and available in a variety of configurations. Lumileds also demonstrated a prototype LED capable of emitting 600 lumens.
Cost Information: Data and Source
See “Cost Information: Data and Source” in section 3.4.2.
Non-Energy Benefits of the Technology
See “Non-Energy Benefits of the Technology” in section 3.4.1.
Notable Developers/Manufacturers of the Technology
See “Notable Developers/Manufacturers of the Technology” in section 3.4.2.
Peak Demand Impact Potential
See “Peak Demand Impact Potential” in section 3.4.3.
Promising Applications
The development of an efficient and low cost high-lumen device will be a significant step in realizing LEDs as an alternative general illumination light source. A high-lumen package could accelerate development of LED products for applications where high light output is necessary such as where HID and some high-output fluorescent sources are currently used. The increase in light output per package could also help reduce manufacturing costs. Since more light is generated from a single element, it would reduce the required number of components in a system. A reduction in components may lead to a reduction in overall manufacturing costs.
See further applications in “Promising Applications” in section 3.4.2.
Perceived Barriers to Market Adoption
See “Perceived Barriers to Market Adoption” in section 3.4.1.
Data Gaps and Next Steps
The biggest challenge to developing single chip LEDs capable of producing high output is thermal management. Since any conversion of electrical energy in the chip that does not produce visible light is converted to heat, increasing the external quantum efficiency of LED devices will decrease the amount of heat generated by the device. In addition, parasitic resistance at the contact points and in LED materials contributes to the generation of heat. Although the proportionality of heat to light may decrease, the increase in total light output of the package would offset reduction in heat accomplished through gains in efficiency. Thermal management is a critical issue that still needs addressing.

106
Furthermore, as chip size increases, current distribution through the chip becomes more important. An uneven distribution of current causes uneven generation of light within the device. A less than optimal operation of the device results in a reduction in efficiency.
Fabrication of large low-defect crystals is another major challenge to developers of LED technology. Limitations of current manufacturing processes limit the quality of the crystal, which limits its performance.
In addition, heat generated by LEDs is conductive and rapidly degrades device performance. However, the packaging materials, encapsulants, lens materials, and silicone binders cannot withstand the flux density, wavelength, and temperatures of LED devices. Therefore, manufacturers must derate LED devices to accommodate for these limitations. Manufacturers need to improve the materials, manufacturing processes, and thermal design of these devices to adequately handle this issue.
References
Lightfair, 2003. Personal Communication with manufacturers of LED devices. Lightfair 2003 in Javits Convention Center, Manhattan, New York on May 3-8, 2003.
NCI, 2002. U.S. Lighting Market Characterization Volume I: National Lighting Inventory and Energy Consumption Estimate. Prepared by Navigant Consulting, Inc. for the Department of Energy. Washington D.C. September 2002.
OIDA, 2002. Light Emitting Diodes (LEDs) for General Illumination: An OIDA Technology Roadmap Update 2002. Optoelectronics Industry Development Association. November 2002.
Opto, 2003. “Cost Hinders LED Uptake.” An interview with Frank Steranka (vice president of research and development at Lumileds) by Jacqueline Hewitt. Opto & Laser Europe. May 2003.

107
3.4.5. Device Electronics
Development of better LED device electronics represents an annual energy savings potential of 0.2 quads. There are no notable technology gaps in the development of LED device electronics. However, their development is important in meeting the singular needs of SSL devices.
Technology Description and Energy Saving Principle
Semiconductors are typically low-voltage DC devices. Therefore, drive electronics are necessary to convert high-voltage AC power from the grid to an appropriate power source (low-voltage DC). Device electronics also provide power regulation to the device. The extremely long expected life of an LED (100,000 hours) makes design of the electronics challenging.32 The drive electronics also perform valuable functions such as dimming, integration with photo and occupancy sensors, and integration with building controls.
Typical configurations for the drive electronics include a front end that converts AC power from the grid to DC voltage. Next, the drive electronics reduce the DC voltage to the appropriate level. The converter typically operates in current mode, supplying the LED device with a constant current source. The electronics can be integrated into the light source package or they can be separate. An integrated design allows operation of lamp and ballast as a single system. In a discrete design, the ballast functions through multiple generations of lamps, and its design becomes very challenging due to the long operational life of an LED.
The losses incurred during the conversion and delivery of electrical energy to the LED affects the efficiency of the device electronics. Minimizing these parasitic losses will increase efficiency. Novel and intelligent circuit design as well as improvements in the quality of the discrete electronic components can minimize parasitic losses. Dimming also impacts energy savings by enabling the LED system to deliver only the light necessary for a given application. When used in conjunction with sensors and building automation systems, the energy savings potential is significant.
Technical Maturity Level
Power electronic design is a mature industry whose basic circuit architecture has not changed since the 1960s. The AC to DC conversion is accomplished using some form of the basic half- or full-bridge converter. The reduction in voltage and regulation is accomplished using a step-down converter. These circuit topologies have been used in power electronics for decades, and only need to be adapted to this specific technology.
Control systems such as DALI are already used in electronic fluorescent ballasts for integrated control of fluorescent lighting systems with building automation systems. Integrated and non-integrated photo and occupancy sensors are also commonly available with incandescent, fluorescent, and some HID light sources.
32 In contrast, drive electronics for conventional discharge light sources (i.e., fluorescent and HID) are designed to operate for 50,000 hours.

108
Technology Maturity Stage Basic Science
Research Applied Research Exploratory Development
Advanced Development
Engineering Development
Product Demonstration
Commercialization and Sales
Issues with Existing Lighting Products and Systems
See “Issues with Existing Lighting Products and Systems” in section 3.4.2. In addition, smart LED device electronics could alleviate some of the retrofit and compatibility issues of light sources and controls (i.e., building automation systems, daylight sensors, motion sensors, individual controls)
Technical Potential and Primary Energy Consumption Impact
LEDs have the potential to impact the entire lighting industry. Because of their high initial cost, their market penetration is expected to be gradual. Incandescent sources would be impacted first, while fluorescent and HID sources would be impacted later and more gradually, as the technology reaches maturity (Opto, 2003).
The energy savings potential of LED device electronics would be a portion of the energy consumed by a transformed lighting market. The annual energy consumption for all lighting in all sectors is estimated to be about 8.3 quads: incandescent light sources consumed 3.5 quads of primary energy in 2001 while fluorescent and HID consumed 3.4 and 1.4 quads respectively (NCI, 2002). The energy savings potential resulting from improvements to LED electronics, assuming they become a major light source in the market, would be approximately 0.2 quads: about 0.13 quads from dimming and controls, and an additional 0.04 quads from improvements in drive electronics.
Performance Information: Data and Source
Typical LED drive electronics operate at efficiencies in the range of 75% to 85%. For comparison, the most efficient ballasts for fluorescent lamps operate at a little better than 90% efficiency, with single digit losses (Lightfair, 2003).
Cost Information: Data and Source
An LED driver capable of delivering 20 watts of power is available for approximately $50 (LEDsupply, 2003).
Non-Energy Benefits of the Technology
See “Non-Energy Benefits of the Technology” in section 3.4.1.
Notable Developers/Manufacturers of the Technology
See “Notable Developers/Manufacturers of the Technology” in section 3.4.2. Out of the primary LED manufacturers, only OSRAM makes LED power supplies.

109
Peak Demand Impact Potential
Since LED light output is proportional to power consumption, the LED power supply could interface with building automated controls to proportionally reduce power consumption during periods of peak demand.
Smart LED device electronics could communicate with building controls and possibly even directly with utilities for reducing lighting loads during peak demand. See “Peak Demand Impact Potential” in section 3.4.1.
Promising Applications
The operating characteristics of LED devices may vary over temperature and time. LED device electronics are necessary to ensure optimal operation over device lifetime. See “Promising Applications” in section 3.4.2.
Perceived Barriers to Market Adoption
The technology behind LED power supplies is not new. They are adopted from the power supply industry from existing AC-DC and DC-DC power supplies. Therefore, the anticipated issues to market adoption would apply higher up the chain with the LED itself.
Also, see “Perceived Barriers to Market Adoption” in section 3.4.1.
Next Steps and Data Gaps
There are no notable technology gaps in the development of LED device electronics. However, their development is important in meeting the singular needs of SSL devices.
The efficiency of the drive electronics for LEDs can improve. Innovations from the power supply industry (i.e., power supplies for laptop computers) may be applied to improve the efficiency of the LED drive circuit. In addition, the ability to integrate with sensors and building control systems needs to improve to realize increased energy savings.
References
Azuhata et al., 2003. “InGaN-Based Single-Chip Multicolor Light-Emitting Diodes.” T. Azuhata, T. Homma, Y. Ishikawa, and S.F. Chichibu (Hirosaki University in Japan/University of Tsukuba in Japan). Japanese Journal of Applied Physics Part 2-Letters, 42(5B): L497-L498, 2003.
LEDsupply, 2003. LEDsupply; accessed on August 12, 2003 at http://www.ledsupply.com/led-drivers.html.
Lightfair, 2003. Personal Communication with manufacturers of LED devices. Lightfair 2003 in Javits Convention Center, Manhattan, New York on May 3-8, 2003.
NCI, 2002. U.S. Lighting Market Characterization Volume I: National Lighting Inventory and Energy Consumption Estimate. Prepared by Navigant Consulting, Inc. for the Department of Energy. Washington D.C. September 2002.
Opto, 2003. “Cost Hinders LED Uptake.” An interview with Frank Steranka (vice president of research and development at Lumileds) by Jacqueline Hewitt. Opto & Laser Europe. May 2003.

110
3.4.6. Substrate Research
LEDs represent a promising new light source technology. Improvement to substrates, a component of the diode, has the technical potential to contribute approximately 0.6 quad of energy savings. The development of suitable lattice-matched substrates with compatible thermal expansion profiles may lead to dramatic increases in LED performance.
Technology Description and Energy Saving Principle
The performance of LEDs is directly impacted by how closely the crystal structure of the substrate matches the epimaterial. A large mismatch in the crystal lattice constant results in large numbers of certain types of defects. An increase in defect density leads to an increase in nonradiative recombination, negatively impacting the efficiency and life of LEDs.
Two epimaterials systems are the focus of most attention for solid-state lighting (SSL): AlGaInN (the column-III nitrides) and AlGaInP (the column-III phosphides) (OIDA, 2002). Both materials systems are examples of III-V compound semiconductors, which are combinations of elements from columns III and V of the periodic table. Phosphide based materials are relatively mature, and high-quality, low-cost GaAs substrates are available that are well matched chemically, crystallographically, and structurally for AlGaInP materials. On the other hand, nitride-based materials are relatively immature. Currently, AlGaInN epimaterials are typically grown epitaxially on sapphire or 6H-SiC. However, the crystal lattice structures of sapphire and SiC do not match up well with the epimaterial. In the interim, “buffers” bridge the mismatches between epimaterial and the substrate on which it is grown, but a substrate such as GaN that could provide a perfect match for Nitride based epimaterials would be a more elegant solution. However, there does not yet exist commercial technology to produce low-defect-density single-crystal substrates of GaN at low cost (OIDA, 2002).
The reduction in defects would lead to dramatic increases in the performance of LED devices. For AlGaInP materials, defects play a critical role in the materials’ performance. Although the impact of defects on the performance of AlGaInN materials is not well understood, the structural quality of crystals has consequences, especially in respect to long-term performance. Furthermore, development of improved alternative substrates could accelerate cost reductions leading to rapid development and adoption of these more energy efficient devices, all resulting in energy savings.
Technical Maturity Level
Current commercially available high-performance LEDs are manufactured predominantly on sapphire or silicon-carbide substrates. The growth of bulk GaN or AlN substrates is in its infancy, with only preliminary results and limited success to this point. Bulk GaN substrates are intrinsically very difficult to grow because nitrogen has a high vapor pressure at the melting point of GaN. These crystals are only currently available for basic physics and demonstration. Hence, LED novel substrate research was identified as a high priority by attendees of the SSL workshop (SSL Workshop, 2003).
Technology Maturity Stage
Basic Science Research Applied Research Exploratory
Development Advanced
Development Engineering Development
Product Demonstration
Commercialization and Sales

111
Issues with Existing Lighting Products and Systems
See “Issues with Existing Lighting Products and Systems” in section 3.4.2.
Technical Potential and Primary Energy Consumption Impact
Substrates are a component of an LED lighting system, and improvements to the substrate will result in better performing LED sources overall. To prepare a technical potentialenergy savings estimate for this component, DOE assumed a portion of the overall system efficacy improvement was attritutable to substrate research. If LED lighting systems become widely used in the lighting industry, replacing 50% of the available sockets with 160 lm/W devices, it would contribute to as much as 2.9 quads of primary energy savings. Some portion of those savings would be due to better quality substrates developed through targeted research and development activities. For this technical potential energy savings estimate, DOE assumes 20% of a 2.9 quad energy savings, or approximately 0.6 quad of primary energy savings from this technology option.
Performance Information: Data and Source
For AlGaInN epimaterial grown on typical sapphire substrates, typical defect densities are in the range of 109/cm2 to 1011/cm2. Epimaterials grown on matched substrates such as GaN or AlN could reduce defect densities to 103/cm2 (OIDA, 2002). Unipress of Poland successfully obtained dislocation-free layers grown on bulk GaN crystals through a high-pressure method. They are now developing MOCVD growth technology to enable commercialization.
Dmitriev et al. reported AlN substrates grown by vapor phase techniques, which have so far resulted in 35 mm diameter substrates. They expect to grow 50 mm materials by the end of 2003.
A high-pressure growth technique for bulk GaN substrates resulted in 12mm diameter samples with excellent low dislocation densities of about 100/cm2 (Balmer, 2003a).
Cost Information: Data and Source
For AlGaInP materials, GaAs substrates are approximately $5/cm2. To further reduce costs, alternative germanium substrates are possible at a cost of roughly $3/cm2. For AlGaInN materials, sapphire substrates are relatively inexpensive at $10/cm2. Silicon carbide is a better, but more expensive, substrate material, estimated to cost $40/cm2 (OIDA, 2002). Although these represent the best estimates available, these are 2002 estimates and substrate costs have come down significantly since then. Navigant Consulting estimates GaAs substrates at about $1.50/ cm2, sapphire substrates at $3/ cm2, and silicon carbide at $12/ cm2 for 2004.
Non-Energy Benefits of the Technology
See “Non-Energy Benefits of the Technology” in section 3.4.1.
Notable Developers/Manufacturers of the Technology
Commercialization of LED technology is underway. Although industry was reluctant to risk its resources on some of the necessary high-risk technology research that may not have immediate payoffs, it is beginning to assume greater responsibility as focus shifts from basic to applied research and product development. Private entities are unlikely to detail their accomplishments to protect their investments in this industry.

112
The following are examples of some current research in substrates:
Researchers at the High Pressure Research Center “Unipress” in Warsaw, Poland fabricated the first dislocation-free laser realized on true GaN bulk substrate. They performed this research under the Polish Governmental Strategic Program, “Development of Blue Optoelectronics” (established by KBN and the Ministry of Economics), with individual KBN grants and support by the “Center of Excellence” EU project. A high temperature, high-pressure growth process produced GaN single crystals about 1 cm2 (Osinski, 2002).
Researchers at Boston University successfully fabricated GaN epimaterials on SiC substrates without buffers (Osinski, 2002). At present, devices based on silicon carbide are manufactured without buffer layers.
Researchers at the University of California Los Angeles, Northrop Grumman Space Technology, and the University of South Carolina addressed how defects in SiC substrates influence the crystallographic properties of AlGaN/GaN layers deposited by metallorganic vapor phase epitaxy and by molecular beam epitaxy. This study established a clear correlation between SiC substrate defects and GaN defects (Poust et al., 2003).
At the University of Florida, researchers showed that the high melting temperature of GaN and thermal decomposition of the compound into Ga metal and diatomic nitrogen gas prohibits standard semiconductor-industry bulk crystal growth processes from producing suitable GaN substrates. Instead, a novel hydrostatic pressure system grows GaN crystals in a very high pressure ambient (Kelly et al., 2003).
Cree currently dominates SiC wafer production, commanding about 85% of the global market. About 94% of SiC wafer production is domestic, with Cree and several smaller companies dominating (Roussel, 2003). Other notable domestic manufacturers include Dow Corning and II-VI Inc.; foreign producers include Okmetic, Hoya, and Soitec (Roussel, 2003).
Peak Demand Impact Potential
See “Peak Demand Impact Potential” in section 3.4.1.
Promising Applications
See “Promising Applications” in section 3.4.2.
Perceived Barriers to Market Adoption
See “Perceived Barriers to Market Adoption” in section 3.4.2.
Data Gaps and Next Steps
Fabrication of large low-defect crystals is a major challenge to developers of LED technology. Limitations of current substrate materials and manufacturing processes limit the quality of the crystal, which limits LED performance.
Substrate research could follow two different yet parallel paths. It could focus on developing substrate materials that complement, or match, the epimaterial. Bulk GaN or AlN are a perfect or near-perfect match to AlGaInN. If such substrates were available, they would bypass the need for buffers. Alternatively, research could focus on developing conventional substrates that would be used in

113
conjunction with a buffer. For example, Si is a poor physical match with AlGaInN, but it is an attractive option due to the maturity and low cost of Si based technology (OIDA, 2002).
Focusing on the substrate, researchers need to identify and investigate suitable materials for use as substrates. For example, although bulk Si substrates have yet to be demonstrated, many groups are pursuing this possibility with some success. Furthermore, research needs to develop new and practical methods for fabricating and applying suitable substrate materials for GaN-based epimaterials. For lattice-matched substrates such as GaN or AlN, no practical method exists.
References
Balmer, 2003. “Nitrides Leap Ahead at ICNS-5.” Richard Balmer. August 2003. Compound Semiconductor; accessed on November 12, 2003 at http://compoundsemiconductor.net/magazine/article/9/8/1/1.
Borges, 2003. “GaN HFETs on Silicon Target Wireless Infrastructure Market.” Jeff Ricardo Borges. Compound Semiconductor; accessed on August 2003 at http://compoundsemiconductor.net/magazine/article/9/8/2/1.
Kelly et al., 2003. “Crystal Growth of Gallium Nitride and Manganese Nitride Using a High-Pressure Thermal Gradient Process.” University of Florida. F. Kelly, D.R. Gilbert, R. Chodelka, R.K. Singh, and S. Pearton. Solid-State Electronics, 47(6), pp. 1027-1030. 2003.
Lightfair, 2003. Personal Communication with manufacturers of LED devices. Lightfair 2003 in Javits Convention Center, Manhattan, New York on May 3-8, 2003.
NCI, 2002. U.S. Lighting Market Characterization Volume I: National Lighting Inventory and Energy Consumption Estimate. Prepared by Navigant Consulting, Inc. for the Department of Energy. Washington D.C. September 2002.
OIDA, 2002. Light Emitting Diodes (LEDs) for General Illumination: An OIDA Technology Roadmap Update 2002. Optoelectronics Industry Development Association. November 2002.
Opto, 2003. “Cost Hinders LED Uptake.” An interview with Frank Steranka (vice president of research and development at Lumileds) by Jacqueline Hewitt. Opto & Laser Europe. May 2003.
Osinski, 2002. “Gallium-Nitride-based Technologies: A Critical Review.” Marek Osinski. The International Society for Optical Engineering. Proceedings of a conference held January 21-22 in San Jose, CA. 2002.
Poust et al., 2003. “SiC Substrate Defects and III-N Heteroepitaxy.” UC- Los Angeles/Northrop Grumman Space Technology/University of South Carolina. B.D. Poust, T.S. Koga, R. Sandhu, B. Heying, R. Hsing, M. Wojtowicz, A. Khan, and M.S. Goorsky. Journal of Physics D-Applied Physics, 36(10A), A102-A106. 2003.
Roussel, 2003. “Silicon Carbide Material, Devices and Applications: Evaluating the Current Market and Future Trends.” Philippe Roussel. Compound Semiconductor. September 2003.
SSL Workshop, 2003. Solid State Lighting Workshop. Building Technologies Program, Office of Energy Efficiency and Renewable Energy, U.S. Department of Energy. Washington, D.C. November 13-14, 2003.
Stringfellow and Craford, 1997. “High Brightness Light Emitting Diodes: Semiconductors and Semimetals.” G.B. Stringfellow and M. George Craford. Academic Press, Volume 48. San Diego, CA. 1997.

114
Torrison et al., 2003. “Growth and Optical Properties of Epitaxial Gan Films on Si (111) Using Single Gas-Source Molecular Beam Epitaxy.” L. Torrison, J. Tolle, I.S.T. Tsong, and J. Kouvetakis. Arizona State University. Thin Solid Films, 434(1-2): 106-111. 2003.
Zukauskas et al., 2002. Introduction to Solid-State Lighting. Arturas Zukauskas, Michael S. Shur, and Remis Caska. John Wiley & Sons, Inc., New York. 2002.

115
3.4.7. Buffer Research
LEDs represent a promising new light source technology. Improvement to buffers, a component of the diode, has the technical potential to contribute approximately 0.6 quad of energy savings. The development of suitable buffers (or heterogeneous substrates) could not only lead to increases in LED performance, but it could also lead to dramatic cost reduction facilitating its adoption into the market.
Technology Description and Energy Saving Principle
As discussed in section 3.4.6, the degree to which the crystal structure of the substrate matches the epimaterial impacts the performance of LEDs. A large mismatch in the crystal lattice constant results in large defect densities. An increase in defect density results in an increase in nonradiative recombination, negatively impacting the efficiency and life of LEDs.
Substrates for nitrides require a “buffer” to bridge the mismatch between the epimaterial and the substrate on which it is grown. The purpose of the buffer layer is to transition from the lattice constant or crystallography of the starting substrate so that it is compatible with the AlGaInN wurtzite33 alloys used for device epitaxy. For the currently dominant AlGaInN device technology, which relies on growth of GaN layers grown on c-plane sapphire, this buffer may be the most important step in the realization of device quality GaN material (OIDA, 2002).
One method of buffering requires the deposition of a nucleation layer. This is the simplest and least expensive method, but the dislocation density remains substantial. Epitaxial Lateral Overgrowth (ELO) process has emerged as a promising method of buffering sapphire substrates. Another method may be the development of thick freestanding GaN buffers. If the buffers are thick enough, it is possible to remove the original substrate, leaving a freestanding buffer that essentially becomes a new single-material substrate (OIDA, 2002).
Better buffers could reduce the density of defects and dramatically improve performance of LED devices. In addition, the development of improved buffers would facilitate the development of cost-effective devices leading to the rapid adoption of more energy efficient LED devices, resulting in energy savings.
Technical Maturity Level
Since there are no commercially viable GaN bulk single crystals, the entire commercial manufacturing of nitride-based devices relies on buffers. GaN epimaterials are currently grown epitaxially on sapphire or 6H-SiC with a buffer layer (Osinski, 2002). For example, LEDs are currently manufactured on sapphire or SiC substrates with buffers. This area was identified as high priority at the recent SSL workshop (SSL Workshop, 2003).
Technology Maturity Stage
Basic Science Research Applied Research Exploratory
Development Advanced
Development Engineering Development
Product Demonstration
Commercialization and Sales
33 Refers to a crystal structure similar to the zinc-blend structure where each atom tetrahedrally bonded to its four nearest neighbors. However, the relative orientation of penetrating tetrahedrons is different, and the wurtzite unit cell has hexagonally symmetry with two lattice parameters, perpendicular and parallel to the optical axis (Zukauskas 2002).

116
Issues with Existing Lighting Products and Systems
See “Issues with Existing Lighting Products and Systems” in section 3.4.2.
Technical Potential and Primary Energy Consumption Impact
Buffer systems are a component of an LED lighting system, and improvements to the buffer will result in better performing LED sources overall. To prepare a technical potentialenergy savings estimate for this component, DOE assumed a portion of the overall system efficacy improvement was attritutable to buffer research. If LED lighting systems become widely used in the lighting industry, replacing 50% of the available sockets with 160 lm/W devices, it would contribute to as much as 2.9 quads of primary energy savings. Some portion of those savings would be due to better quality buffers developed through targeted research and development activities. For this technical potential energy savings estimate, DOE assumes 20% of a 2.9 quad energy savings, or approximately 0.6 quad of primary energy savings from this technology option.
Performance Information: Data and Source
The insertion of low-temperature GaN or AlN nucleation layers reduces dislocation densities down to the low 1x10⁸/cm2. Epitaxial lateral overgrowth (ELO) processes for GaN/sapphire technology have resulted in defect densities in the mid 1x10⁷/cm2. Thick freestanding GaN buffers have resulted in defect densities in the low 1x10⁷/cm2. Finally, combinations of ELO processes and thick layers have resulted in defect densities in the mid 1x10⁵/cm2 (Osinski, 2002).
Cost Information: Data and Source
See “Cost Information: Data and Source” in section 3.4.2.
Non-Energy Benefits of the Technology
See “Non-Energy Benefits of the Technology” in section 3.4.1.
Notable Developers/Manufacturers of the Technology
The following are examples of current research in buffers:
Researchers at Arizona State University used a novel single-source precursor with composition D2GaN3 to grow GaN films on Si (1 1 1) substrates via AlN buffer layers by gas-source molecular beam epitaxy (Torrison et al., 2003).
Improvements of crystal orientations of GaN thin films grown on such polycrystalline metal-foils have been tried using several kinds of intermediate layers. Aluminum nitride (AlN), GaN, silicon dioxide (SiO2), and Si have been chosen as materials for the intermediate layers (Sato et al., 2003).
A novel dislocation reducing mechanism was successfully introduced into the conventional 2-step metalorganic vapor phase epitaxial (MOVPE) growth method of GaN/sapphire wafer by inserting an additional intermediate-temperature (IT)-GaN buffer between the low-temperature (LT)-GaN buffer and the main high-temperature (HT)-GaN layer (Fukikura et al., 2003).
High-quality epitaxial AlN film on sapphire (0001) improved the crystalline quality of AlGaN with high AlN molar fraction grown by low-pressure metalorganic vapor phase epitaxy (LP-MOVPE) (Ohta et al., 2003).

117
AlN also plays an important role as a buffer layer in the epitaxial growth of high-quality GaN, which is widely used in short-wavelength LEDs and laser diodes (LDs) (Ohta et al., 2003; Ohta et al., 2003; Fong et al., 2003).
The results of the double crystal rocking curve (DCRC), atomic force microscopy (AFM), scanning electron microscopy (SEM), and photoluminescence (PL) measurements showed that the GaN epilayer grown on a 3.4 nm AlN buffer layer had the best quality. These results indicate that GaN active layers grown on 3.4 nm AlN buffer layers hold promise for potential applications in optoelectronic devices (Jeon et al., 2003).
The optimized total thickness and periods of Al0.3Ga0.7N/GaN superlattice play a very important role in the improvement of quality and reducing cracks in the growth of GaN/Si (1 1 1) epitaxy (Jang and Lee, 2003).
Highly conductive and crack-free n-Al0.6Ga0.4N films with thickness up to 1 µm were achieved by using high-temperature AlN or AlGaN/AlN superlattice (SL) buffer layers (Pophristic et al., 2003).
Peak Demand Impact Potential
See “Peak Demand Impact Potential” in section 3.4.1.
Promising Applications
See “Promising Applications” in section 3.4.1.
Perceived Barriers to Market Adoption
See “Perceived Barriers to Market Adoption” in section 3.4.1.
Data Gaps and Next Steps
Fabrication of large low-defect crystals is a major challenge to developers of LED technology. Limitations of current materials and manufacturing processes limit the quality of the crystal, which limits LED performance. Novels methods of buffering Si substrates to current epimaterials could lead to large cost reductions in LED manufacturing. The large infrastructure already in place in the semiconductor industry could be utilized with minimal modification to develop cost-effective LEDs based on Si technology (Borges et al., 2003).
References
Borges et al., 2003. “GaN HFETs on Silicon Target Wireless Infrastructure Market,” Ricardo Borges, Jeff Brown, Allen Hanson, Sameer Singhal, Andrei Vescan and Paul Williams. Compound Semiconductor; accessed on December 31, 2003 at http://compoundsemiconductor.net/magazine/article/9/8/2/1.
Fukikura et al., 2003. “Realization of Low Dislocation GaN/Sapphire Wafers By 3-Step Metalorganic Vapor Phase Epitaxial Growth with Island Induced Dislocation Control.” H. Fujikura, K. Iizuka, and S. Tanaka. Hitachi Cable Ltd. (Japan)/Hokkaido University (Japan). Japanese Journal of Applied Physics Part 1-Regular Papers Short Notes & Review Papers, 42(5A), pp. 2767-2772. 2003.
Fong et al., 2003. “Characterization of Low-Frequency Noise in Molecular Beam Epitaxy-Grown Gan Epilayers Deposited on Double Buffer Layers.” W.K. Fong, S.W. Ng, B.H. Leung, and C. Surya. Hong Kong Polytechnic University (China). Journal of Applied Physics, 94(1), pp. 387-391. 2003.

118
Jang and Lee, 2003. “High-Quality GaN/Si (111) Epitaxial Layers Grown with Various Al0.3Ga0.7N/Gan Superlattices as Intermediate Layer by MOCVD.” S.H. Jang and C.R. Lee. Chonbuk National University (South Korea). Journal of Crystal Growth, 253(1-4), pp. 64-70. 2003.
Jeon et al., 2003. “Characteristics of GaN Epilayer Grown on Al2O3 with AlN Buffer Layer by Molecular Beam Epitaxy.” H.C. Jeon, H.S. Lee, S.M. Si, Y.S. Jeong, J.H. Na, Y.S. Park, T.W. Kang, and J.E. Oh. Dongguk University (South Korea)/Hanyang University (South Korea). Current Applied Physics, 3(4), pp. 385-388. 2003.
Kida et al., 2003. “Metalorganic Vapor Phase Epitaxy Growth and Study Of Stress In AlGaN Using Epitaxial AlN As Underlying Layer.” Y. Kida, T. Shibata, H. Miyake, and K. Hiramatsu. Mie University (Japan)/NGK Insulators Ltd. (Japan). Japanese Journal of Applied Physics Part 2-Letters, 42(6A), pp. L572-L574. 2003.
Lightfair, 2003. Personal Communication with manufacturers of LED devices. Lightfair 2003 in Javits Convention Center, Manhattan, New York on May 3-8, 2003.
NCI, 2002. U.S. Lighting Market Characterization Volume I: National Lighting Inventory and Energy Consumption Estimate. Prepared by Navigant Consulting, Inc. for the Department of Energy. Washington D.C. September 2002.
Ohta et al., 2003. “Growth Temperature Dependence of Structural Properties for AlN Films Grown on (Mn, Zn) Fe2O4 Substrates.” J. Ohta, H. Fujioka, S. Ito, and M. Oshima. University of Tokyo (Japan). Thin Solid Films, 435(1-2), pp. 218-221. 2003.
OIDA, 2002. Light Emitting Diodes (LEDs) for General Illumination: An OIDA Technology Roadmap Update 2002. Optoelectronics Industry Development Association. November 2002.
Opto, 2003. “Cost Hinders LED Uptake.” An interview with Frank Steranka (vice president of research and development at Lumileds) by Jacqueline Hewitt. Opto & Laser Europe. May 2003.
Pophristic et al., 2003. “High-Conductivity N-AlGaN with High Al Mole Fraction Grown by Metalorganic Vapor Phase Deposition.” M. Pophristic, S.P. Guo, and B. Peres. EMCORE Corp. Applied Physics Letters, 82(24), pp. 4289-4291. 2003.
Sato et al., 2003. “Improvements of Crystal Orientations of Wurtzite-Type GaN Thin Films Grown on Metal Surfaces.” Y. Sato, T. Hishinuma, and S. Sato. Akita University (Japan). IEICE Transactions on Electronics, E86C, pp. 1002-1006. 2003.
Shen et al., 2003. “X-Ray Diffraction Analysis of MOCVD Grown GaN Buffer Layers on GaAs (001) Substrates.” X.M. Shen, Y.T. Wang, X.H. Zheng, B.S. Zhang, J. Chen, G. Feng, and H. Yang. Chinese Academy of Sciences (China) / Guangxi University (China). Journal of Crystal Growth, 254(1-2), pp. 23-27. 2003.
SSL Workshop, 2003. Solid State Lighting Workshop. Building Technologies Program, Office of Energy Efficiency and Renewable Energy, U.S. Department of Energy. Washington, D.C. November 13-14, 2003.
Torrison et al., 2003. “Growth and Optical Properties of Epitaxial GaN Films on Si (111) Using Single Gas-Source Molecular Beam Epitaxy.” L. Torrison, J. Tolle, I.S.T. Tsong, and J. Kouvetakis. Arizona State University. Thin Solid Films, 434(1-2), pp. 106-111. 2003.

119
3.4.8. Novel Epimaterials
LEDs represent a promising new light source technology. Improvement to epimaterials, a component of the diode, has the technical potential to contribute approximately 0.6 quad of energy savings. The development of novel epimaterials may simplify system integration of white light systems (especially color mixing approaches) resulting in dramatic increases in LED performance.
Technology Description and Energy Saving Principle
Choosing an epimaterial with appropriate bandgap energy can attain the desired emission wavelength for white light devices. The photon energy is defined as the difference between electron and hole energy. Following the Boltzmann distribution, electrons and holes have an average kinetic energy based on Planck’s constant and temperature. At low temperatures, the thermal energy is small, compared to the bandgap energy, and the photon energy is approximately equal to the bandgap energy. Spontaneous recombination of electron-hole pairs results in emission of photons at a wavelength determined by its bandgap (Schubert, 2003).
Two semiconductor materials systems are the focus of most attention for solid-state lighting (SSL): AlGaInN (the column-III nitrides), and AlGaInP (the column-III phosphides). Both materials systems are examples of III-V compound semiconductors, or combinations of elements from columns III and V in the periodic table. The phosphides are a relatively mature material, and are the brightest and most efficient light emitters used to produce light in the red part of the visible spectrum. The nitrides are a relatively immature material, and used to produce the range from green to UV. However, similar kinds of bandgap engineering can be done in principle with other materials. The prime material candidate is ZnO, with the additional possibilities of GaNP and GaNAs. These materials are expected to span a very wide bandgap range, and may possibly emit red, green, and blue light by changing the ratio of mixed crystals.
A single material system that can reproduce the entire visible spectrum would simplify manufacturing of white light devices that use the color mixing approach. Currently, different material systems (nitrides and phosphides) are necessary to produce the necessary spectrum to create white light. Different material systems require different processes to overcome the mismatches in lattice constants and thermal expansion coefficients. A common material platform for all colors would enable manufacture of these white light devices at lower cost and help make this technology a cost-effective alternative to less efficient technology. Also, novel epimaterials for ultraviolet (UV) and blue light emissions could lead to more efficient phosphorescent systems, resulting in energy savings.
Level of Technical Maturity Technology
For the deep red and infrared portion of the spectrum, GaAs is the epimaterial of choice. AlInGaP is the predominant material used for the spectrum from red to yellow. GaN is the newest commercial material used to produce green to blue devices, completing the visible spectrum. GaN is also used to produce UV emissions for phosphor-based LEDs. LED novel epimaterials research was identified as a high priority by attendees of the SSL workshop (SSL Workshop, 2003).
Technology Maturity Stage
Basic Science Research
Applied Research Exploratory Development
Advanced Development
Engineering Development
Product Demonstration
Commercialization and Sales

120
Issues with Existing Lighting Products and Systems
See “Issues with Existing Lighting Products and Systems” in section 3.4.2.
Technical Potential and Primary Energy Consumption Impact
Novel epimaterials are a component of an LED lighting system, and improvements to the epimaterials will result in better performing LED sources overall. To prepare a technical potentialenergy savings estimate for this component, DOE assumed a portion of the overall system efficacy improvement was attritutable to epimaterials research. If LED lighting systems become widely used in the lighting industry, replacing 50% of the available sockets with 160 lm/W devices, it would contribute to as much as 2.9 quads of primary energy savings. Some portion of those savings would be due to better quality epimaterials developed through targeted research and development activities. For this technical potential energy savings estimate, DOE assumes 20% of a 2.9 quad energy savings, or approximately 0.6 quad of primary energy savings from this technology option.
Performance Information/Data and Source
Using ZnO for the epimaterial, researchers observed UV emissions at 394 nm at an output power density of 466 kW/cm2 (Guo 2003).
Cost Information/Data and Source
See “Cost Information: Data and Source” in section 3.4.2.
Non-Energy Benefits of Technology
See “Non-Energy Benefits of Technology” in section 3.4.2.
Notable Developers/Manufacturers of Technology
Industry is beginning to assume greater responsibility for this type of research previously done by academic institutions and national laboratories. However, private entities are less likely to detail or publish their accomplishments in order to protect their intellectual property. Some of the notable manufacturers of this technology include Cree, Lumileds, GELcore and OSRAM optoelectronics.
A team of researchers from Kumamoto University of Japan and the Indian Institute of Technology demonstrated a device using zinc oxide (ZnO), and having a wide direct band gap of 3.37 eV at room temperature, as a new potential candidate for optoelectronic devices such as UV laser, blue light-emitting diode, and phosphorescent display (Ohshima et al., 2003). Researchers from China and Hong Kong have also investigated behavior of this novel epimaterial (Guo, 2003).
Peak Demand Impact Potential
See “Peak Demand Impact Potential” in section 3.4.1.
Promising Applications
See “Promising Applications” in section 3.4.2.

121
Perceived Barriers to Market Adoption
See “Perceived Barriers to Market Adoption” in section 3.4.1.
Next Steps and Data Gaps
Fabrication of large low-defect crystals is a major challenge to developers of LED technology. Limitations of current materials and manufacturing processes limit the quality of the crystal, which limits LED performance.
A single material system does not exist that can reproduce the entire visible spectrum. Materials such as ZnO and other nitride-based materials have demonstrated potential as novel active region materials. However, further investigation is necessary to ascertain the potential of these existing material systems and to identify other novel materials (OIDA, 2002).
References
Guo, 2003. “Time-Resolved Photoluminescence Study of a ZnO Thin Film Grown on a (1 0 0) Silicon Substrate.” Bing Guo, Zhizhen Ye, and K.S. Wong. Journal of Crystal Growth, Vol. 253. 2003.
Lightfair, 2003. Observations and discussions with manufacturers of LED devices at Lightfair 2003 held at the Javits Convention Center in Manhattan, New York on May 3-8, 2003.
NCI, 2002. U.S. Lighting Market Characterization Volume I: National Lighting Inventory and Energy Consumption Estimate. Prepared by Navigant Consulting, Inc. for the Department of Energy. Washington D.C. September 2002.
Ohshima et al., 2003. “Photo-Excited Photonic Characteristics of ZnO Thin Films Deposited by Laser Ablation Method.” T. Ohshima, T. Ikegami, and K. Ebihara of Kumamoto University of Japan, and R.K. Thareja of Indian Institute of Technology. Electrical Engineering in Japan. 144(3), pp. 1-7. 2003.
OIDA, 2002. Light Emitting Diodes (LEDs) for General Illumination: An OIDA Technology Roadmap Update 2002. Optoelectronics Industry Development Association. November 2002.
Opto, 2003. “Cost Hinders LED Uptake.” An interview with Frank Steranka (vice president of research and development at Lumileds) by Jacqueline Hewitt. Opto & Laser Europe. May 2003.
SSL Workshop, 2003. Solid State Lighting Workshop. Building Technologies Program, Office of Energy Efficiency and Renewable Energy, U.S. Department of Energy. Washington, D.C. November 13-14, 2003.

122
3.4.9. Etching, Chip-Shaping, and Texturing
LEDs represent a promising new light source technology. Improvement to etching, chip-shaping and texturing has the technical potential to contribute approximately 0.6 quad of energy savings. Improving an LED device’s ability to extract light generated within its reactor will result in significant gains in device efficiency.
Technology Description and Energy Saving Principle
Chip shaping and texturing can play a critical role in increasing the efficiency of the LED. Although LEDs convert electrical energy to photons, it is not light until the photons enter the eye and stimulate the retina for sight. The external efficiency of the LED depends primarily on its internal quantum efficiency and its light-extraction efficiency. Early designs were poor light sources due to extremely poor light-extraction efficiencies. Light extraction efficiencies were just a few percent, much lower than the internal quantum efficiencies. Light extraction is difficult because of the large ratio of the refractive indices of the semiconductor and the surrounding media. When the angle of incidence exceeds a value defined by the ratio of indices of refraction, total reflection occurs (Snell’s Law). Only the photons whose angle of incidence is less than the value determined by the ratio can escape. Consequently, photons propagating outside of this “escape cone” reflect back into the semiconductor and are eventually absorbed in the chip as heat. The irreversible (parasitic) losses are due to the absorption in the substrate and the contact area (Zukauska, 2002).
Increasing the probability of escape for photons can be achieved a number of ways. Changing the geometry of the chip increases the probability of a photon entering the angular escape cone determined by the refractive index of the material. For example, if the device were in the shape of a sphere, photons generated at its center would all enter the angular escape cone, resulting in light-extraction efficiencies of 100%. Likewise, adding a rough texture to the smooth surface of the chip can reduce wave guiding and increase the probability of photons finding an escape cone by adding a degree of photon trajectory randomization (Schnitzer et al., 1993).
Light extraction depends strongly on the shape of the chip that surrounds the active light-emitting area, and the texture of the surfaces through which light is being emitted. Therefore, maximizing extraction of photons from the semiconductor material results in higher efficacy and energy savings.
Level of Technical Maturity Technology
The best performing LEDs employ simple geometric shapes such as the inverted pyramid to increase the escape cone. However, the various manufacturing processes necessary to shape the chip are more costly than a standard approach resulting in an external quantum efficiency of up to 60% or more in the best commercially available high-brightness LEDs (Krames, 1999).
Technology Maturity Stage
Basic Science Research
Applied Research Exploratory Development
Advanced Development
Engineering Development
Product Demonstration
Commercialization and Sales

123
Issues with Existing Lighting Products and Systems
See “Issues with Existing Lighting Products and Systems” in section 3.4.2.
Technical Potential and Primary Energy Consumption Impact
Extraction efficiency is a critical component of an LED lighting system, and improvements to the etching, chip-shaping and texturing will result in better performing LED sources overall. To prepare a technical potential energy savings estimate for this component, DOE assumed a portion of the overall system efficacy improvement was attritutable to this research. If LED lighting systems become widely used in the lighting industry, replacing 50% of the available sockets with 160 lm/W devices, it would contribute to as much as 2.9 quads of primary energy savings. Some portion of those savings would be due to better etching, chip-shaping and texturing practices. For this technical potential energy savings estimate, DOE assumes 20% of a 2.9 quad energy savings, or approximately 0.6 quad of primary energy savings from this technology option.
Performance Information/Data and Source
Extraction efficiency is the other key factor (internal quantum efficiency being the other) that determines the efficiency of the LED device.
Krames et al. fabricated an AlGaInP/GaP chip in a truncated-inverted-pyramid (TIP) geometry with external quantum efficiencies exceeding 60% (Krames, 1999).
Shen et al. experimented with packaged quantum-well-heterostructure flip-chip light emitting diodes (FCLEDs) and showed that a quantum well (QW) placed at an optimal distance from its reflective metallic mirror provides approximately 2.5 times increase in total light output compared to a QW placed at a neighboring position corresponding to a minimum in overall light extraction (Shen, 2003).
Choi et al. fabricated an LED with an array of micro-lenses boosting the forward optical output and enhancing its optical power density up to five times (Choi et al., 2003).
OSRAM Optoelectronics issued a press release in September 2003 claiming an extraction efficiency of 75% in their newest generation Thin GaN LED device (EET, 2003).
Cost Information: Data and Source
See “Cost Information: Data and Source” in section 3.4.2.
Non-Energy Benefits of the Technology
See “Non-Energy Benefits of the Technology” in section 3.4.1.
Notable Developers/Manufacturers of the Technology
Researchers at Cornell reported on an InGaN-based LED with a top p-GaN surface micro roughened using the metal clusters as a wet etching mask. The micro roughening increased the light-output power of the LED chip. This indicated that the scattering of photons emitted in the active layer was much enhanced at the micro roughened top p-GaN surface of the LED due to the angular randomization of photons inside the LED structure, resulting in an increase in the probability of escaping from the LED structure. By employing the top surface micro roughened in an LED structure, the power conversion efficiency was increased by 62% (Huh et al., 2003).

124
The Industrial Technology Research Institute in Taiwan published notable results in increasing the extraction efficiency of LEDs. The first study developed a highly transparent nickel-oxide (NiOx)-indium-tin-oxide (ITO) transparent ohmic contact with excellent current spreading for p-GaN to increase the optical output power of nitride-based LEDs. Notably, the transmittance of the NiOx-ITO exceeded 90% throughout the visible region of the spectrum and approached 98% at 470 nm. The experimental results indicate that NiOx-ITO bilayer ohmic contact with excellent current spreading and high transparency is suitable for fabricating high-brightness GaN-based light-emitting devices (Taiwan, 2003a). A follow up study presented a surface-textured indium-tin-oxide (ITO) transparent ohmic contact layer on p-GaN to increase the optical output of nitride-based LED without destroying the p-GaN. The experimental results indicated that the surface-textured ITO layer is suitable for fabricating high-brightness GaN-based LEDs (Taiwan, 2003b).
Some other notable manufacturers of this technology include Cree, Lumileds, GELcore and OSRAM optoelectronics.
Peak Demand Impact Potential
See “Peak Demand Impact Potential” in section 3.4.1.
Promising Applications
See “Promising Applications” in section 3.4.2.
Perceived Barriers to Market Adoption
See “Perceived Barriers to Market Adoption” in section 3.4.1.
Next Steps and Data Gaps
In modern, GaN-based LED structures, total internal reflection (TIR) limits the light extraction, and consequently, the overall extraction efficiency of the light source. Proper chip and package material combinations as well as surface property modifications offer the opportunity to reduce the luminous flux lost due to TIR and absorption. Different separation techniques influence substrate surface properties and thus light extraction. However, producing and testing each sample is a time consuming and costly process. To mitigate these factors, computer modeling becomes an important tool in the cost effective development of LEDs. Having the ability to apply all the various factors in a robust ray-tracing model helps to refine a chip design in a fast and accurate way to significantly increase light extraction. Based on experimental data and ray trace modeling, the effects of chip size scaling, surface roughness, and encapsulation on light extraction values can be demonstrated (Stefanov et al., 2002). Next, an effective model must consider its suitability to mass production methods to determine its cost-effectiveness.
In addition, heat generated by LEDs is conductive and rapidly degrades device performance. However, the packaging materials, encapsulants, lens materials, and silicone binders cannot withstand the flux density, wavelength, and temperatures of LED devices. Therefore, manufacturers must derate LED devices to accommodate for these limitations. Manufacturers need to improve the materials, manufacturing processes, and thermal design of these devices to adequately handle this issue.
References
Choi et al., 2003. “Mechanism of Enhanced Light Output Efficiency in InGaN-based Microlight Emitting Diodes.” H.W. Choi, C.W. Jeon, M.D. Dawson, P.R. Edwards, R.W. Martin, and S. Tripathy. Journal of Applied Physics, Vol. 93, No. 10. 2003.
125
EET, 2003. “OSRAM Opto LEDs Based on Thin GaN Technology.” Electronic Engineering Times; accessed on September 15, 2003 at http://www.eetasia.com/ART_8800316849_499481,499492.HTM.5018963d.
Huh et al., 2003. "Improved Light-Output and Electrical Performance of InGaN-Based, Light-Emitting Diode by Microroughening of the P-GaN Surface." C. Huh, K.S. Lee, E.J. Kang, and S.J. Park. Cornell University/Kwangju Institute of Science & Technology (South Korea). Journal of Applied Physics, 93(11), pp. 9383-9385. 2003.
Lightfair, 2003. Observations and discussions with manufacturers of LED devices at Lightfair 2003 held at the Javits Convention Center in Manhattan, New York on May 3-8, 2003.
Krames, 1999. “High-power truncated-inverted pyramid (AlxGa1-x)0.5In0.5P/GaP light-emitting diodes exhibiting >50% external quantum efficiency.” M.R. Krames, M. Ochiai-Holcomb, G.E. Hofler, C. Carter-Coman, E.I. Chen, I.-H. Tan, P. Grillot, N.F. Gardner, H.C. Chui, J.-W. Huang, S.A. Stockman, F.A. Kish, and M.G. Craford of Hewlett-Packard Optoelectronics Division, Materials R&D Department; T.S. Tan, C.P. Kocot, and M. Hueschen of Hewlett-Packard laboratories; J. Posselt, B. Loh, G. Sasser, and D. Collins of Hewlett-Packard Optoelectronics Division, Product Development Department. Applied Physics Letter, 75 (16), pp. 2365-2367. October 18, 1999.
Ng et al., 2003. “GaN Nanotip Pyramids Formed by Anisotropic Etching.” H.M. Ng, N.G. Weimann, and A. Chowdhury. Lucent Technologies. Journal of Applied Physics, 94(1), pp. 650-653. 2003.
NCI, 2002. U.S. Lighting Market Characterization Volume I: National Lighting Inventory and Energy Consumption Estimate. Prepared by Navigant Consulting, Inc. for the Department of Energy. Washington D.C. September 2002.
OIDA, 2002. Light Emitting Diodes (LEDs) for General Illumination: An OIDA Technology Roadmap Update 2002. Optoelectronics Industry Development Association. November 2002.
Opto, 2003. “Cost Hinders LED Uptake.” An interview with Frank Steranka (vice president of research and development at Lumileds) by Jacqueline Hewitt. Opto & Laser Europe. May 2003.
Schnitzer et al., 1993. “Ultrahigh Spontaneous Emission Quantum Efficiency, 99.7% Internally and 72% Externally, from AlGaAs/GaAs/AlGaAs Double Heterostructures.” I. Schnitzer, E. Yablonovitch, C. Caneau, and T.J. Gmitter. Applied Physics Letter, Vol. 62 (2). 1993.
Shen, 2003. “Optical cavity effects in InGaN/GaN quantum-well-heterostructure flip-chip light-emitting diodes.” Y.C.Shen, J.J. Wierer, M.R. Krames, M.J. Ludowise, M.S. Misra, F. Ahmed, A.Y. Kim, G.O. Mueller, J.C. Bhat, S.A. Stockman, and P.S. Martin of Lumileds Lighting. Applied Physics Letter, 82 (14), pp. 2221-2223. April 7, 2003.
Stefanov et al., 2002. “Optimizing the External Light Extraction of Nitride LEDs.” Emil Stefanov, Bryan S. Shelton, Hari S. Venugopalan et al. Proceedings of The International Society for Optical Engineering (SPIE), Volume 4776, pp. 223-234. 2002.
Zukauskas et al., 2002. Introduction to Solid-State Lighting. Arturas Zukauskas, Michael S. Shur, and Remis Caska. John Wiley & Sons, Inc., New York. 2002.

126
3.4.10. Configuration Research
LEDs represent a promising new light source technology. Improvement to diode configuration has the technical potential to contribute approximately 0.6 quad of energy savings. Improving an LED device’s ability to extract light generated within its active region will result in significant efficiency gains.
Technology Description and Energy Saving Principle
LEDs are p-n junction devices in which electrons and holes recombine in a radiative process to emit light. All commercial LED structures are variants of two basic LED configurations. The simplest configuration is the vertical-injection configuration. In this setup, a disk-shaped top contact provides holes into a p-type semiconductor layer. The holes spread radially outward within the p-type layer, and then inject into the active layer(s). At the same time, electrons traveling from the contact on its n-type substrate through the bottom contact inject into the same active layer(s). The trapped electrons and holes, within the active layer(s), eventually recombine to emit light. A second base configuration is the lateral-injection LED. If the substrate (e.g., sapphire) is not conductive, then, in the lateral-injection configuration scheme, the electrons are also injected from a ring contact (OIDA, 2002).
The major functions that the structure must perform are: ohmic contact, current spreading and transport to the active region, injection of carriers in the active region, spontaneous recombination of carriers, and light extraction. At any particular wavelength, the available alloy compositions may be favorable to some of these properties, and compromises must be made. The art of device design is to take advantage of the properties that are available at the wavelength of interest, while compensating for the properties that are unavailable (OIDA, 2002).
At all wavelengths (red, green, blue, and UV), the common goal is to extract the maximum number of photons from the LED at high input current densities and operating temperatures. One method to achieve high extraction efficiencies is to alter the way in which the light is emitted, making it directional, not random. These kind of devices are more complex and perhaps more costly, but are potentially more efficient than devices exploiting optical characteristics. Alternative configurations include resonant-cavity and super-luminescent LEDs, edge-emitting lasers, and vertical-cavity surface-emitting lasers (OIDA, 2002). Assuming all other factors remain constant, increasing the extraction efficiency of the LED device would result in an increase in device efficiency and energy savings.
Level of Technical Maturity Technology
All commercially available white LEDs are either vertical-injection or later-injection devices. Although edge-emitting lasers are not used in general illumination LED devices, they are a moderately mature technology and are already available for infrared wavelengths at a cost, efficiency and power level comparable to current light sources (i.e., incandescent, fluorescent, HID). They have yet to be demonstrated at the visible and UV wavelengths that would be useful for white light.
Technology Maturity Stage
Basic Science Research Applied Research Exploratory
Development Advanced
Development Engineering Development
Product Demonstration
Commercialization and Sales

127
Issues with Existing Lighting Products and Systems
See “Issues with Existing Lighting Products and Systems” in section 3.4.2.
Technical Potential and Primary Energy Consumption Impact
Extraction efficiency is a critical component of an LED lighting system, and improvements to the diode configuration will result in better performing LED sources overall. To prepare a technical potential energy savings estimate for this component, DOE assumed a portion of the overall system efficacy improvement was attritutable to this research. If LED lighting systems become widely used in the lighting industry, replacing 50% of the available sockets with 160 lm/W devices, it would contribute to as much as 2.9 quads of primary energy savings. Some portion of those savings would be due to better light extraction from diode configuration. For this technical potential energy savings estimate, DOE assumes 20% of a 2.9 quad energy savings, or approximately 0.6 quad of primary energy savings from this technology option.
Performance Information/Data and Source
The goal of various system configurations is to increase the extraction efficiency of the device, thereby increasing its efficacy.
Resonant-cavity and super-luminescent LEDs can enhance the extraction efficiency by a factor of four over non-directional absorbing-substrate designs, and 2.5% to 10% better than planar transparent-substrate devices (OIDA, 2002).
Edge-emitting lasers using AlGaInP material systems now have external quantum efficiencies up to 40%. Their directionality enables extraction efficiencies to approach nearly 100%, with power outputs in the 1-3W range at 630-670nm wavelengths (OIDA, 2002).
VCSELs using AlGaInP material systems have external quantum efficiencies up to 14% at red wavelengths. Similar to edge-emitting lasers, their directionality enables extraction efficiencies to approach nearly 100%. At an emission wavelength of 850nm, external quantum efficiencies of over 50% have been achieved (OIDA, 2002).
Cost Information/Data and Source
High brightness monochromatic LEDs currently cost about 10 cents per lumen (Opto, 2003). This translates to about $2/watt at an efficacy of 20 lm/W. In contrast, the cost of resonant-cavity and super-luminescent LEDs are not expected to be much greater than that of ordinary LEDs, since they are only modestly engineered structures. Edge-emitting lasers retail for approximately $40/watt and corresponding wholesale prices of $4/watt are available at 810 nm wavelengths (OIDA, 2002).
Non-Energy Benefits of the Technology
See “Non-Energy Benefits of the Technology” in section 3.4.1.
Notable Developers/Manufacturers of the Technology
Industry is beginning to assume greater responsibility for this type of research previously done by academic institutions and national laboratories. However, private entities are less likely to detail or publish their accomplishments to protect their intellectual property. Some of the notable manufacturers of this technology include Cree, Lumileds, GELcore and OSRAM optoelectronics.

128
Peak Demand Impact Potential
See “Peak Demand Impact Potential” in section 3.4.1.
Promising Applications
See “Promising Applications” in section 3.4.2.
Perceived Barriers to Market Adoption
See “Perceived Barriers to Market Adoption” in section 3.4.1.
Next Steps and Data Gaps
Manufacturers need to improve on the ability of LED devices to generate and extract light from their package to increase device efficiency, and these novel device configurations (i.e., edge-emitting lasers, VCSEL, etc.) demonstrated the ability to approach 100% extraction efficiency. However, LED costs must fall for it to compete effectively for market share against existing light sources. For example, Lumileds’ strategy involves two key factors: increasing the device’s efficiency and moving to higher drive currents (Opto, 2003).
Also, heat generated by LEDs is conductive and heat rapidly degrades its performance. However, the packaging materials, encapsulants, lens materials, and silicone binders cannot withstand the flux density, wavelength, and temperatures of LED devices. Therefore, manufacturers must derate LED devices to accommodate for these limitations. Manufacturers need to improve the materials, manufacturing processes, and thermal design of these devices to adequately handle this issue.
References
Delbeke et al., 2001. “Electrically Pumped Grating-Assisted Resonant-Cavity Light-Emitting Diodes.” Danae Delbeke, Carl Sys, Ingrid Moerman et al. Proceedings of SPIE, Volume 4641, pp. 42-49.
Lightfair, 2003. Observations and discussions with manufacturers of LED devices at Lightfair 2003 held at the Javits Convention Center in Manhattan, New York on May 3-8, 2003.
NCI, 2002. U.S. Lighting Market Characterization Volume I: National Lighting Inventory and Energy Consumption Estimate. Prepared by Navigant Consulting, Inc. for the Department of Energy. Washington D.C. September 2002.
OIDA, 2002. Light Emitting Diodes (LEDs) for General Illumination: An OIDA Technology Roadmap Update 2002. Optoelectronics Industry Development Association. November 2002.
Opto, 2003. “Cost Hinders LED Uptake.” An interview with Frank Steranka (vice president of research and development at Lumileds) by Jacqueline Hewitt. Opto & Laser Europe. May 2003.
West, 2002. “Side-Emitting High-Power LEDs and Their Application in Illumination.” Robert S. West. Proceedings of SPIE, Volume 4776, pp. 171-175.
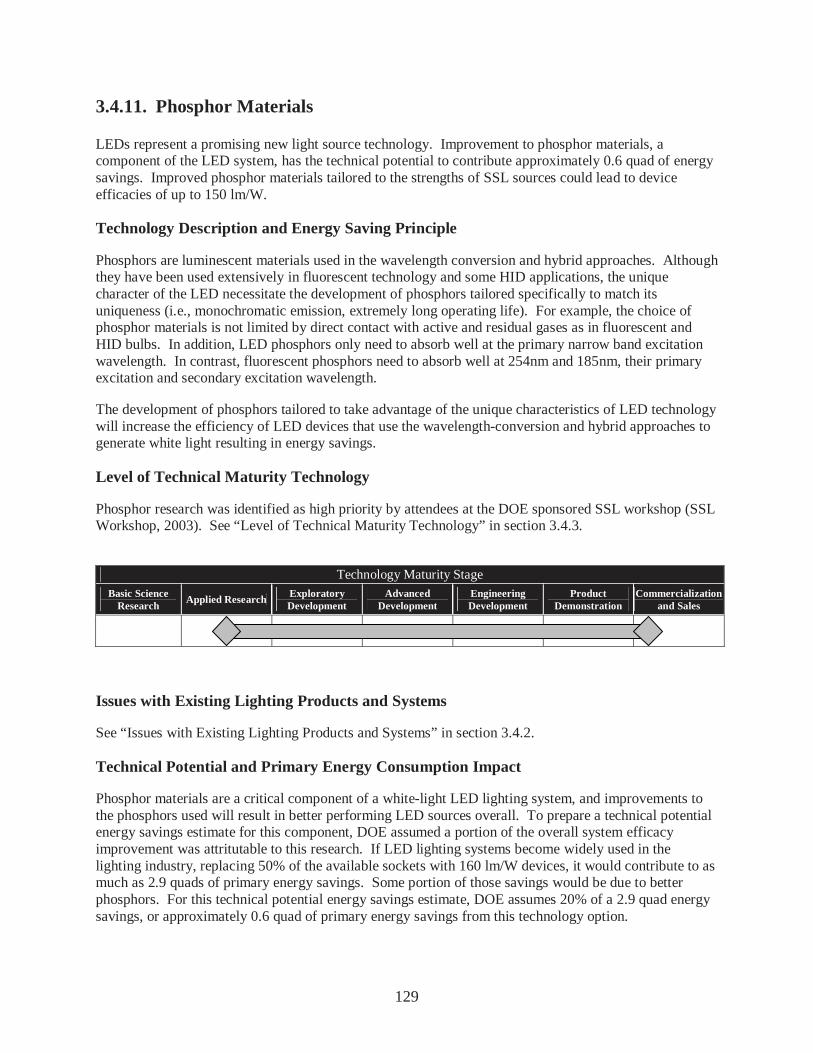
129
3.4.11. Phosphor Materials
LEDs represent a promising new light source technology. Improvement to phosphor materials, a component of the LED system, has the technical potential to contribute approximately 0.6 quad of energy savings. Improved phosphor materials tailored to the strengths of SSL sources could lead to device efficacies of up to 150 lm/W.
Technology Description and Energy Saving Principle
Phosphors are luminescent materials used in the wavelength conversion and hybrid approaches. Although they have been used extensively in fluorescent technology and some HID applications, the unique character of the LED necessitate the development of phosphors tailored specifically to match its uniqueness (i.e., monochromatic emission, extremely long operating life). For example, the choice of phosphor materials is not limited by direct contact with active and residual gases as in fluorescent and HID bulbs. In addition, LED phosphors only need to absorb well at the primary narrow band excitation wavelength. In contrast, fluorescent phosphors need to absorb well at 254nm and 185nm, their primary excitation and secondary excitation wavelength.
The development of phosphors tailored to take advantage of the unique characteristics of LED technology will increase the efficiency of LED devices that use the wavelength-conversion and hybrid approaches to generate white light resulting in energy savings.
Level of Technical Maturity Technology
Phosphor research was identified as high priority by attendees at the DOE sponsored SSL workshop (SSL Workshop, 2003). See “Level of Technical Maturity Technology” in section 3.4.3.
Technology Maturity Stage
Basic Science Research
Applied Research Exploratory Development
Advanced Development
Engineering Development
Product Demonstration
Commercialization and Sales
Issues with Existing Lighting Products and Systems
See “Issues with Existing Lighting Products and Systems” in section 3.4.2.
Technical Potential and Primary Energy Consumption Impact
Phosphor materials are a critical component of a white-light LED lighting system, and improvements to the phosphors used will result in better performing LED sources overall. To prepare a technical potential energy savings estimate for this component, DOE assumed a portion of the overall system efficacy improvement was attritutable to this research. If LED lighting systems become widely used in the lighting industry, replacing 50% of the available sockets with 160 lm/W devices, it would contribute to as much as 2.9 quads of primary energy savings. Some portion of those savings would be due to better phosphors. For this technical potential energy savings estimate, DOE assumes 20% of a 2.9 quad energy savings, or approximately 0.6 quad of primary energy savings from this technology option.

130
Performance Information: Data and Source
Irrespective of the method, the best performance for commercially available white-light LED sources is about 45 lm/W (Lumileds, 2005). That is about a 275% improvement over the baseline incandescent technology at 12 lm/W, and about a 200% improvement over tungsten-halogen technology at 15 lm/W. This is even greater than the best available HIR coated reflector lamps at 30 lm/w..
Industry believes that a white-light approach using a UV LED with phosphors is capable of producing 150 lm/W, and a hybrid approach is capable of producing 80 lm/W. Because 160 lm/W is possible using multiple LED devices with different peak wavelengths, some manufacturers believe that discrete color mixing will gain prominence as the wavelength-conversion approaches reach their theoretical limits (Lightfair, 2003).
Cost Information: Data and Source
See “Cost Information: Data and Source” in section 3.4.2.
Non-Energy Benefits of the Technology
See “Non-Energy Benefits of the Technology” in section 3.4.1.
Notable Developers/Manufacturers of the Technology
Some notable manufacturers of this technology include Nichia, Lumileds, GELcore and OSRAM optoelectronics. There are academic institutions and national labs (e.g., University of California at San Barbara, Sandia National Labs) also involved in this research. Although private entities conduct this type of research, they are less likely to detail or publish their accomplishments to protect their intellectual property.
Peak Demand Impact Potential
Part of the energy consumption of this light source is coincident with peak, and an improvement in system efficacy would result in peak demand reduction, all other things equal. In addition, during peak demand summer periods, the new technology would reduce a building’s internal heat load, decreasing the energy consumed by the air conditioning system. Furthermore, utilities may remotely control an LED lighting system to reduce peak demand as necessary. The peak demand would ebb proportionally to the reduction in light output.
Promising Applications
See “Promising Applications” in section 3.4.1.
Perceived Barriers to Market Adoption
See “Perceived Barriers to Market Adoption” in section 3.4.1.
Next Steps and Data Gaps
LED costs must decrease if the technology is to compete effectively for market share against existing light sources. Lumileds’ strategy involves two key factors: increasing a device’s efficiency and moving to higher drive currents (Opto, 2003). Internal quantum efficiencies need to approach 100% while the extraction efficiency must also increase to improve device efficiency.

131
Traditional phosphor research on mercury based fluorescent lighting has focused on phosphors that are excited by either 254 nm or 365 nm radiation. If efficient LEDs in the deeper UV were developed, then many of the phosphors that were developed for traditional fluorescent lighting could also be used in LED systems. However, current LEDs have emission energies too low (380-500 nm) for efficient excitation of traditional fluorescent lighting phosphors. Consequently, it is necessary to develop new phosphors that efficiently convert emission from these LEDs into high quality white light. That includes minimizing losses due to Stoke’s Shift. In addition to traditional metrics such as phosphor absorption and quantum efficiency, these phosphors will also have to have high conversion efficiencies and lifetimes within the LED package. Reducing phosphor degradation becomes critical due to the much longer expected life of LEDs (OIDA, 2002). Finally, high efficiency LED+phosphor systems will also require improved optical design and phosphor geometry within the LED package. Currently, there are no computer simulators capable of accurately modeling phosphors. Accurate and robust models would expedite the development of better LED devices.
Also, heat generated by LEDs is conductive and heat rapidly degrades its performance. However, the packaging materials, encapsulants, lens materials, and silicone binders cannot withstand the flux density, wavelength, and temperatures of LED devices. Therefore, manufacturers must derate LED devices to accommodate for these limitations. Manufacturers need to improve the materials, manufacturing processes, and thermal design of these devices to adequately handle this issue.
References
Lightfair, 2003. Personal Communication with manufacturers of LED devices. Lightfair 2003 in Javits Convention Center, Manhattan, New York on May 3-8, 2003.
Lumileds, 2003. Personal Communication with Luxeon Sales Department. Luxeon on September 15, 2003.
Lumileds, 2005. “Luxeon Emitter Power Light Source.” Technical Datasheet DS25. Accessed on May 12, 2005 at: http://www.lumileds.com/pdfs/DS25.PDF
NCI, 2002. U.S. Lighting Market Characterization Volume I: National Lighting Inventory and Energy Consumption Estimate. Prepared by Navigant Consulting, Inc. for the Department of Energy. Washington D.C. September 2002.
OIDA, 2002. Light Emitting Diodes (LEDs) for General Illumination: An OIDA Technology Roadmap Update 2002. Optoelectronics Industry Development Association. November 2002.
Opto, 2003. “Cost Hinders LED Uptake.” An interview with Frank Steranka (vice president of research and development at Lumileds) by Jacqueline Hewitt. Opto & Laser Europe. May 2003.
SSL Workshop, 2003. Solid State Lighting Workshop. Building Technologies Program, Office of Energy Efficiency and Renewable Energy, U.S. Department of Energy. Washington, D.C. November 13-14, 2003.
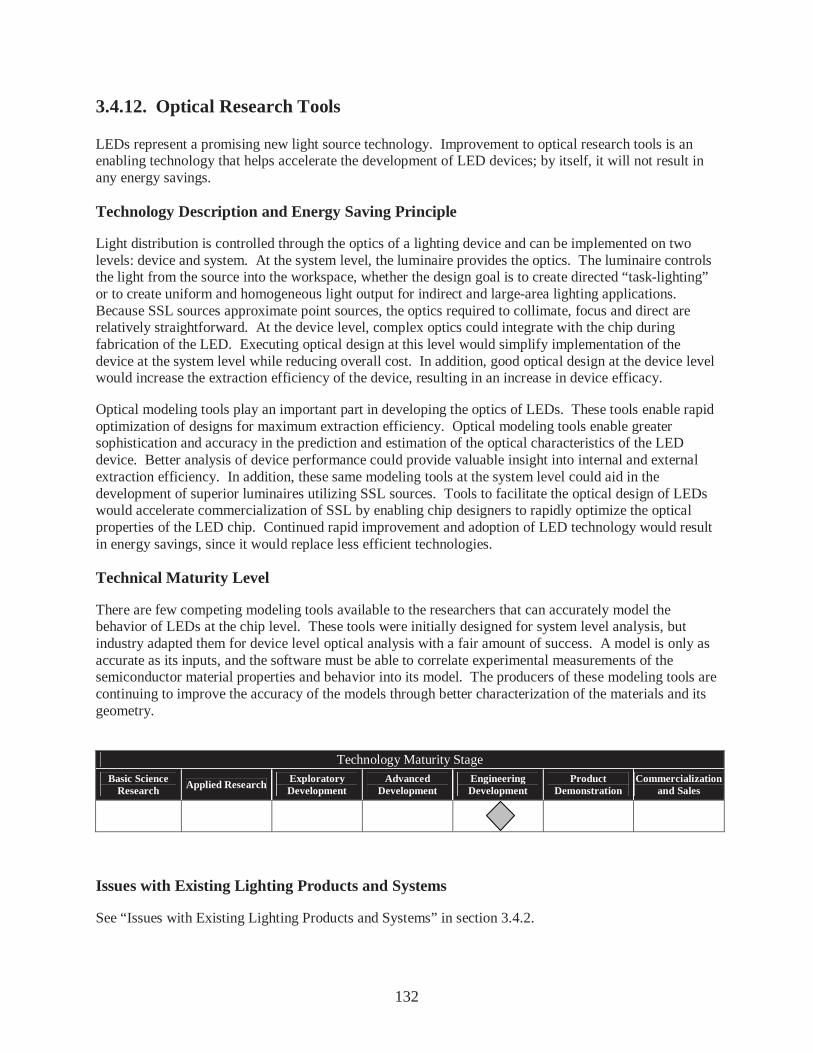
132
3.4.12. Optical Research Tools
LEDs represent a promising new light source technology. Improvement to optical research tools is an enabling technology that helps accelerate the development of LED devices; by itself, it will not result in any energy savings.
Technology Description and Energy Saving Principle
Light distribution is controlled through the optics of a lighting device and can be implemented on two levels: device and system. At the system level, the luminaire provides the optics. The luminaire controls the light from the source into the workspace, whether the design goal is to create directed “task-lighting” or to create uniform and homogeneous light output for indirect and large-area lighting applications. Because SSL sources approximate point sources, the optics required to collimate, focus and direct are relatively straightforward. At the device level, complex optics could integrate with the chip during fabrication of the LED. Executing optical design at this level would simplify implementation of the device at the system level while reducing overall cost. In addition, good optical design at the device level would increase the extraction efficiency of the device, resulting in an increase in device efficacy.
Optical modeling tools play an important part in developing the optics of LEDs. These tools enable rapid optimization of designs for maximum extraction efficiency. Optical modeling tools enable greater sophistication and accuracy in the prediction and estimation of the optical characteristics of the LED device. Better analysis of device performance could provide valuable insight into internal and external extraction efficiency. In addition, these same modeling tools at the system level could aid in the development of superior luminaires utilizing SSL sources. Tools to facilitate the optical design of LEDs would accelerate commercialization of SSL by enabling chip designers to rapidly optimize the optical properties of the LED chip. Continued rapid improvement and adoption of LED technology would result in energy savings, since it would replace less efficient technologies.
Technical Maturity Level
There are few competing modeling tools available to the researchers that can accurately model the behavior of LEDs at the chip level. These tools were initially designed for system level analysis, but industry adapted them for device level optical analysis with a fair amount of success. A model is only as accurate as its inputs, and the software must be able to correlate experimental measurements of the semiconductor material properties and behavior into its model. The producers of these modeling tools are continuing to improve the accuracy of the models through better characterization of the materials and its geometry.
Technology Maturity Stage
Basic Science Research Applied Research Exploratory
Development Advanced
Development Engineering Development
Product Demonstration
Commercialization and Sales
Issues with Existing Lighting Products and Systems
See “Issues with Existing Lighting Products and Systems” in section 3.4.2.

133
Technical Potential and Primary Energy Consumption Impact Improvement to optical research tools is an enabling technology that helps accelerate the development of LED devices. As a stand-alone technology option, optical research tools will not result in energy savings.
Performance Information: Data and Source
As LED modeling becomes more complex with the use of novel material systems and configurations, the accuracy of available optical modeling software is questionable. Breault Research Organization explored computer simulations of various volume-based light sources and compared them to actual experimental data. They found that manufacturing tolerances played a significant role in the validity of simulations done on standardized incandescent and HID sources (Breault, 1999). However, a study conducted at the Lighting Research Center investigating the use of light guides as mixing elements for mixed-color white LED systems, researchers found that the measured results matched well with the simulation. As part of the experiment, results from a computer simulation (Light Tools, optical analysis software from Optical Research Associates) were compared to results obtained from an actual experiment (Feng et al., 2002).
Cost Information: Data and Source
Version 7.1 of the Advanced Systems Analysis Program (ASAP) from Breault Research Organization costs $480.
Non-Energy Related Benefits of the Technology
The long life of LEDs may result in far less landfill waste.
In rough applications and harsh environments, the intrinsic shock and vibration resistance of SSL technology also offers some safety and reliability advantages over existing light sources.
Implementation of optics at the device level may result in reduced susceptibility to degradation due to environmental factors resulting in more robust and longer-life LEDs. In addition, the implementation of optics at the device level could potentially reduce the cost of an LED system.
LEDs can be manufactured to emit zero UV and IR, which make them an ideal light source in UV and IR sensitive applications.
Notable Developers/Manufacturers of Technology
Some of the notable manufacturers of optical design and analysis tools include Breault Research Organization and Optical Research Associates. Lawrence Berkeley National Labs also conducted some optical modeling of LEDs using these tools.
Peak Demand Impact Potential
See “Peak Demand Impact Potential” in section 3.4.1.
Promising Applications
Optical modeling and analysis tools can model virtually every type of light source. This type of software could enhance modeling of LEDs at the chip level.

134
Perceived Barriers to Market Adoption
See “Perceived Barriers to Market Adoption” in section 3.4.1.
Data Gaps and Next Steps
All optical analysis software used in LED research is adapted from existing programs that was used previously for analyzing other light sources (e.g., incandescent, sunlight, fluorescent, HID). The next generation of analysis and design software needs to accurately model the behavior of LED light sources at the chip level. The software must be robust enough to handle a variety of semiconductor material systems and other novel materials including phosphors. Consequently, various materials used in LEDs need to be characterized accurately for input.
New software tools suitable for color analysis, in particular spatial separation issues, need to be developed. At present, one must trace over several billion rays to achieve accurate color information, which makes the method both difficult and impractical for analysis.
References
Breault, 1999. “Computer Simulation of Asymmetric Arc Lamp Volume Emitters.” Michael A. Stevenson, Marie Cote, Christopher J. Campoillo, David G. Jenkins. Denver, Colorado. Proceedings of the Society of Photo-Optical Instrumentation Engineers Annual Conference. July 1999.
Feng et al., 2002. “Optical Elements for Mixing Colored LEDs to Create White Light,” Zhao Feng, Nadarajah Narendran, and John VanDerlofske. Presented at the International Society for Optical Engineering (SPIE) Conference. Seattle, Washington. July 9-11. 2002.
Lightfair, 2003. Personal Communication with manufacturers of LED devices. Lightfair 2003 in Javits Convention Center, Manhattan, New York on May 3-8, 2003.
NCI, 2002. U.S. Lighting Market Characterization Volume I: National Lighting Inventory and Energy Consumption Estimate. Prepared by Navigant Consulting, Inc. for the Department of Energy. Washington D.C. September 2002.
OIDA, 2002. Light Emitting Diodes (LEDs) for General Illumination: An OIDA Technology Roadmap Update 2002. Optoelectronics Industry Development Association. November 2002.
Opto, 2003. “Cost Hinders LED Uptake.” An interview with Frank Steranka (vice president of research and development at Lumileds) by Jacqueline Hewitt. Opto & Laser Europe. May 2003.

135
3.5. Organic Light-Emitting Diode (OLED)
Ching W. Tang and Steven A. Van Slyke of Eastman Kodak invented the first organic LED (small molecules) in 1987. Tang noticed a surprising green glow coming from an organic solar cell he was working with. The two men quickly realized that by passing an electrical current through two organic materials, one a good conductor of holes and the other a good conductor of electrons, that photon emission would take place near the contact area of the two materials, similar to an LED.34
OLEDs are thin-film multi-layer devices based on organic carbon molecules or polymers. They consist of: 1) a substrate foil, film or plate (rigid or flexible), 2) an electrode layer, 3) layers of active materials, 4) a counter electrode layer, and 5) a protective barrier layer.35 At least one of the electrodes must be transparent to light. Materials used in OLED devices have broad emission spectra. This gives OLEDs an advantage over LEDs in that minor changes in the chemical composition of the emissive structure can tune the emission peak of the device. Therefore, getting good quality white light from OLEDs is relatively simple and that quality will gradually improve. The focus of research will be on improving operational life.
OLED research is in a nascent stage of development and experts agree that without a substantial infusion of capital, it will take 12 – 15 years for the technology to reach commercialization. In that time, foreign industry, heavily funded by their governments, could develop an insurmountable lead in the technology, making it very difficult for U.S. manufacturers to compete. However, with the appropriate support of government, academia and industry, commercialization can occur in as little as 5 – 8 years. 36
Much of the work for this technology is exploratory and far from commercialization. Therefore, most of the research is concentrated in research institutions and academia, both domestically and abroad. Although general illumination applications are still many years away, the solid-state lighting divisions of General Electric, OSRAM Sylvania, and Philips Electronics remain poised to exploit this technology.37 At the November 2003 SSL workshop sponsored by the U.S. Department of Energy, researchers revealed that the best OLED devices have lifetimes of about 500 hours and efficacies of 5 lm/W. That is still far short of the roughly 50,000 hour and 100 lm/W necessary for OLED based general illumination.
On February 3rd and 4th, 2005, the Department of Energy (DOE) held its second Workshop to shape and prioritize its solid-state lighting (SSL) research activities for the next one to two years. A Workshop Report was published in April 2005 which provides an overview of the discussion, findings, and outcomes from this consultative Workshop.38 Held in San Diego, CA the Workshop included 170 technology leaders from industry, universities, trade associations, research institutions, and national laboratories. These participants reviewed and discussed research topics, clarified technological research 34 “Better Displays with Organic Films.” Scientific American; accessed on February 19, 2004 at http://www.sciam.com/article.cfm?articleID=0003FCE7-2A46-1FFB-AA4683414B7F0000&pageNumber=4&catID=2
35 Light Emitting Diodes (LEDs) for General Illumination: An OIDA Technology Roadmap Update 2002. Optoelectronics Industry Development Association. November 2002.
36 Light Emitting Diodes (LEDs) for General Illumination: An OIDA Technology Roadmap Update 2002. Optoelectronics Industry Development Association. November 2002.
37 For the display industry, more than 70 companies--ranging from the OLED pioneer, Eastman Kodak, to DuPont and eMagin, a small microdisplay company based in New York--are ready to bring OLED displays to market. In March 2003, Kodak launched the first digital camera incorporating a full color OLED display.
38 The Workshop report is available on DOE’s SSL web site: http://www.netl.doe.gov/ssl/PDFs/DOE_SSL_Workshop_Report_Feb2005.pdf

136
needs and objectives, and prioritized tasks and subtasks that will form the basis of future DOE solicitations.
The following sections present seven technology options relating to OLEDs for general illumination.

137
3.5.1. White-Light Systems
OLEDs represent a promising new light source. Improvement to white-light systems has the technical potential to contribute approximately 1.1 quad of energy savings. However, many fundamental improvements in OLED device performance need to occur prior to the development of viable white-light OLED systems.
Technology Description and Energy Saving Principle
Current research focuses on five basic methods of producing white light from OLEDs: 1) single layer emission, 2) multi-layer emission, 3) horizontal stacks (or pixels), 4) monomer-excimer complex, and 5) wavelength conversion. Single layer emission involves mixing two or more different emitters (or polymers), which emit different colors, into a single layer. Multi-layer emission separates each dopant into discrete layers. In this approach, the triplet excitons, which have long diffusion lengths, cross several layers before transferring their energy to an emitter. The horizontal stack device is an extension of the approach used in liquid crystal flat-panel displays, where an array of individual pixels addresses each discrete color separately and independently. The monomer-excimer phosphorescent OLED is a novel concept which employs a lumophore which forms a broadly emitting state, and a lumophore which forms excimers (wave function extends over two identical molecules) or exciplex (wavefunction extends over two dissimilar molecules). The wavelength conversion method couples a blue or UV emitting OLED with one or more down-conversion layers, one of which contains inorganic light-scattering particles (OIDA, 2002).
An efficient and practical method for producing white light will help enable OLEDs to achieve the highest efficacies. Since white light OLEDs have the potential to achieve significantly higher efficacies than existing light sources (i.e., incandescent, fluorescent, HID), this technology would result in significant energy savings.
Technical Maturity Level of the Technology
In 2003, OLEDs took a significant step towards commercial competitiveness with the introduction of a phosphorescent material utilizing triplet states to achieve near unity quantum efficiency in the conversion of electrical energy to photons. This has dramatically improved the efficiency of white organic light-emitting devices (Li et al., 2003). At present, the highest performance illumination-quality white OLED has been demonstrated by GE Global Research. They demonstrated a 4 square foot white OLED that generated 1200 lumens of light with an efficacy of 15 lm/W. The OLED has a color temperature of 4000K and a CRI of 88 (DOE, 2004). However, it is only one step towards the realization of a commercially viable product.
Technology Maturity Stage
Basic Science Research Applied Research Exploratory
Development Advanced
Development Engineering Development
Product Demonstration
Commercialization and Sales

138
Issues with Existing Lighting Products and Systems
Although OLED technology could retrofit some existing lighting systems, an entirely new infrastructure would likely need to be developed to take full advantage of its potential attributes (e.g., high flexibility and large size). These new attributes will challenge designers and manufacturers who are accustomed to designing for light sources that are essentially point source (or line source in the case of linear fluorescent lamps) approximations. In contrast, OLEDs may take the form of large panels or sheets that can be molded into a variety of shapes.
Technical Potential and Primary Energy Consumption Impact
Portions of the market sector most likely impacted by this technology are portions of the commercial and industrial sectors using fluorescent technology. These sectors are better equipped to absorb the anticipated high initial cost of OLED products because other factors influence choice of light source, such as aesthetics of the light source and visual impact of the lit environment. Commercial and industrial sector purchasers are more tolerant of longer payback periods in lieu of these other factors. Assuming that OLEDs achieve 160 lm/W, the technical potential energy savings is estimated at 1.1 quads.
Table 3-50: Potential Energy Savings of OLED Technology
Sector Current Consumption
Efficacy Old Technology
Efficacy New Technology
Potential Consumption
Potential Energy Savings
Fluorescent (C/I) (portion)
2.1 quads 75.0 lm/W 160 lm/W 1.0 quads 1.1 quads
Performance Information: Data and Source
Researchers from China demonstrated phosphorescent white-light OLEDs with a maximum efficiency and luminance of 6.8 cd/A and 11,200 cd/m2, respectively. The pure white light with CIE coordinates of approximately x=0.34 and y=0.33 achieved a luminance of 1000 cd/m2, which shifted only slightly when the bias voltage changes from 8 volts to 20 volts (Li et al., 2003).
Researchers at the Electronics and Telecommunications Research Institute (ETRI) in South Korea demonstrated stable white-light OLED devices fabricated as a single organic white-light emitting layer with a maximum luminance of 20,400 cd/m2 at 810 mA/cm2, external quantum efficiency of 2% at 200 cd/m2 (~3 mA/cm2), power efficiency of 2.3 lm/W at 67 cd/m2 (~1 mA/cm2), and a Commission Internationale de l'Eclairage (CIE) chromaticity coordinates of x=0.34 and y=0.39 at 1.8 mA/cm2, to x=0.31 and y=0.38 at 36 mA/cm2 (Wook Ko et al., 2003).
Researchers from GE demonstrated a white OLED with and efficacy of 15 lm/W at a brightness of 1000 cd/m2. The color coordinates were on the blackbody locus at 4000K and the CRI was 88 (DOE, 2004).
Cost Information: Data and Source
There are no commercially available OLED general illumination devices.
Non-Energy Benefits of Technology
The promise of long life for OLEDs, projected to be up to 50,000 hours, may result in less landfill waste. The organic materials used in the fabrication of these devices may also prove to be more environmentally friendly than mercury required in discharge sources. In rough applications and harsh environments, the

139
intrinsic shock and vibration resistance of SSL technology offers safety advantages over existing light sources. OLEDs can be manufactured to emit zero UV and IR radiation, which makes them an ideal light source in UV and IR sensitive applications. Furthermore, OLED devices have potential to save space in applications such as airplanes where space is a premium.
Notable Developers/Manufacturers of the Technology
The following presents a sampling of OLED research related to OLED white light systems.
GE published the first paper focused on demonstrating illumination-quality OLEDs in 2002 (GE, 2002). In April of 2003, Domercq et al. published a paper in Chemistry of Materials describing a multi-layer device fabrication method (Domercq et al., 2003).
Research scientists from Buffalo University fabricated organic electroluminescence (EL) single layer devices using electroactive dyes incorporated in poly-vinylcarbazole, and presented their observations and its impact on the design of light-emitting devices using these organic dyes (Pan et al., 2003).
In another study published by Princeton University, researchers reported the quantum efficiency of triplet excimer-based white organic light-emitting devices and the impact of emissive layer thickness (EML) on performance (D’Andrade et al., 2003a).
Researchers at the Electronics and Telecommunications Research Institute (ETRI) in South Korea, Jilin University in China and City University of Hong Kong in Hong Kong are conducting substantive research on white-light OLED devices.
Peak Demand Impact Potential
The expected operating hours for this technology would be coincident with the time of peak energy demand. Therefore, an improvement in lamp efficacy would result in peak demand reduction. In addition, during peak demand summer periods, the new technology would reduce a building’s internal heat load, reducing the energy consumed by the air-conditioning system.
Promising Applications
OLEDs may take the form of large panels or sheets, providing a non-directional, large-area, low-luminance light source. Therefore, likely applications may include general illumination in commercial and industrial sectors through an array of large panels. Other likely applications include illuminated commercial signs, on- and off-grid indicators, and some high-design commercial and residential applications.
Perceived Barriers to Market Adoption
Lighting is largely viewed as a commodity industry. Therefore, initial cost is anticipated to be the primary barrier to adoption of this new and novel light source.
Data Gaps and Next Steps
No fundamental limitations exist that would prevent researchers from achieving the needed efficacy and lifetime. However, the present operational life of white-light OLEDs is unacceptably short. Specifically, the operational life of short wavelength (blue) emitters must improve to at least match the performance of the longer wavelength (i.e., red and green) emitters.

140
The internal efficiency must also exceed 25%, the fundamental limit of fluorescent OLEDs, if the technology is to be competitive. The development of phosphorescent OLEDs utilizing triplet excitons appears vital since they can achieve internal quantum efficiencies approaching unity.
It is unknown which of the existing methods for generating white-light from OLEDs will be the best solution. In fact, it may be a yet undiscovered method that proves most suitable. The cost of OLED-based white-light sources needs to decrease through economies of scale and new manufacturing processes tailored to the technology’s specific requirements.
References
Color Science, 1982. Color Science. 2nd Edition, Gunter Wyszecki and W. S. Stiles. A Wiley-Interscience Publication. 1982.
Domercq et al., 2003. “Photo-Patternable Hole-Transport Polymers for Organic Light-Emitting Diodes.” B. Domercq, R.D. Hreha, Zhang Ya-Dong, N. Larribeau, J.N. Haddock, C. Schultz, S.R. Marder, and B. Kippelen. Chemistry of Materials, Volume 15, Number 7, pp. 1493-8. April 2003.
D’Andrade et al., 2003. “Effects of Exciton and Charge Confinement on The Performance Of White Organic P-I-N Electrophosphorescent Emissive Excimer Devices.” B.W. D'Andrade, (Department of Electrical Eng., Princeton Univ., NJ, USA); Forrest, S.R. Journal of Applied Physics, Volume 94, Number 5, pp. 3101-9. September 2003.
DOE, 2004. Department of Energy meeting on February 24, 2004. http://biz.yahoo.com/bw/040304/45516_1.html.
Duggal et al., 2003. “Illumination Quality OLEDs for Lighting.” Anil R. Duggal, Joe J. Shiang, Christian M. Heller et al. Proceedings of SPIE, Volume 4800, 2003, pp. 62-68.
Economist, 2003. “Coming Soon to a Laptop Near You.” The Economist; accessed on February 6, 2004 at http://www.economist.com/printedition/displayStory.cfm?Story_ID=1841020.
GE, 2002. “Organic Light-Emitting Devices for Illumination Quality White Light.” Anil R. Duggal, J.J. Shiang, Christian M. Heller, and Donald F. Foust. Applied Physics Letter, Volume 80, pp 3470-2. May 13, 2002.
Li et al., 2003. “White Organic Light-Emitting Devices Using a Phosphorescent Sensitizer.” Feng Li, Yu Duan, Jing Feng, Shiyong Liu, Song Qiu, Dong Lin, Yuguang Ma, Lee S.T. Gang Cheng (National Laboratory of Integrated Optoelectronics, Jilin University, Changchun, China). Applied Physics Letters, Volume 82, Number 24, pp. 4224-6. June 16, 2003.
NCI, 2002. U.S. Lighting Market Characterization Volume I: National Lighting Inventory and Energy Consumption Estimate. Prepared by Navigant Consulting, Inc. for the Department of Energy. Washington D.C. September 2002.
OIDA, 2002. Light Emitting Diodes (LEDs) for General Illumination: An OIDA Technology Roadmap Update 2002. Optoelectronics Industry Development Association. November 2002.
Pan et al., 2003. “A New Approach to Design Light Emitting Devices Using Electroactive Dyes, Polymer/Metal Interfaces and Defect Mediated Phenomena in Ordered Polymers.” M. Pan, A. Patra, C.S. Friend, T. Lin, A.N. Cartwright, P.N. Prasad, Symposia (Material Research Society Symposium Proceedings Vol.734), 2003, pp. 273-8.
Wook Ko et al., 2003. “Efficient White Organic Light Emission by Single Emitting Layer.” Young Wook Ko, Choong-Heui Chung, Jin Ho Lee, Yong-Hae Kim, Choong-Yong Sohn, Bong-Chul Kim, Chi-Sun Hwang, Yoon-Ho Song, Jongtae Lim, Young-Joo Ahn, Gi-Wook Kang, Namheon Lee, Changhee Lee. Thin Solid Films, Volume 426, Number 1-2, 24, pp. 246-9. February 2003.

141
3.5.2. Manufacturing Issues
OLEDs represent a promising new light source technology. Improvement to manufacturing processes, one aspect of building a consumer product, has the technical potential to contribute approximately 0.6 quad of energy savings. However, many fundamental improvements in OLED device performance need to occur prior to the development of viable white-light OLED systems.
Technology Description and Energy Saving Principle
OLEDs are thin-film multi-layer devices consisting of: 1) a substrate foil, film or plate (rigid or flexible), 2) an electrode layer, 3) layers of active materials, 4) a counter electrode layer, and 5) a protective barrier layer. This simplified device architecture translates to four primary manufacturing steps in fabrication of OLED devices: substrate fabrication, OLED deposition, encapsulation, and assembly.
The first step is the production of the substrate, also known as the backplane. During this stage, the electrode and thin-film transistor circuits are placed onto a substrate in preparation for the addition of the organic layer. For small molecule devices, the substrate material is typically glass or silicon; for polymeric devices, the substrate is typically a plastic. The deposition and patterning take place in a clean room and the process is similar to that used to make integrated circuits. The next step is the fabrication of the OLED part of the device, or OLED deposition. This involves the deposition of the active light-emitting layers by either vacuum (for small molecule) or wet (polymeric) process deposition techniques. The cathode electrode is included in this step and is deposited by a vacuum or sputtering process. Next, it is necessary to protect the electronics and active OLED layer from exposure to water vapor and oxygen. Through a step called encapsulation, these parts are hermetically sealed in a protective package to maximize device performance and lifetime. Finally, all the parts of the device are assembled to create a complete module (Optics, 2003).
Further development of OLED technology and resolution of its manufacturing challenges, such as realization of roll-to-roll processing, will enable OLEDs to be a viable and competitive alternative to existing light sources, resulting in energy savings that will be multiplied through increasing market share.
Level of Technical Maturity Technology
The OLED display industry is poised to begin commercialization using small molecule materials. Current manufacturing processes only suit mass-production of small or medium-sized displays up to about 15 inches in diameter, but companies such as Kodak began limited production of OLED devices for niche applications. In March of 2003, Kodak launched the first digital camera incorporating a full color OLED display (Economist, 2003). However, OLEDs for general illumination are still under development.
Technology Maturity Stage
Basic Science Research Applied Research Exploratory
Development Advanced
Development Engineering Development
Product Demonstration
Commercialization and Sales

142
Issues with Existing Lighting Products and Systems
See “Issues with Existing Lighting Products and Systems” in section 3.5.1.
Technical Potential and Primary Energy Consumption Impact
Manufacturing issues must be resolved in order to have reliable, quality consumer products. Research and development to improve the performance of this technology option will benefit the overall white-light OLED lighting system. To prepare a technical potential energy savings estimate for this technology option, DOE assumed a portion of the overall system efficacy improvement would be attritutable to this research. If OLED lighting systems become widely used in the lighting industry, replacing 50% of the available sockets with 160 lm/W devices, it would contribute to as much as 2.9 quads of primary energy savings. Some portion of those savings would be due to improvements in the manufacturing processes. For this technical potential energy savings estimate, DOE assumes 20% of a 2.9 quad energy savings, or approximately 0.6 quad of primary energy savings from this technology option.
Performance Information: Data and Source
Researchers from Japan fabricated very smooth, high-quality indium tin oxide (ITO) layers at room temperature through low-energy, oxygen-ion-beam assisted electron-beam evaporation of ITO bulk material in a vacuum. Using this method, a very smooth surface of only 0.6 nm roughness (root mean square), almost one order smaller than that prepared by other methods, low resistivity of 7.0x10⁻⁴ ohms/cm, high carrier density of 6.1x1020cm-3, and high optical transmittance of 85% at wavelength 550 nm (including the glass substrate) could be repeatedly achieved at room temperature (Liu at al., 2003).
Researchers from China conducted a systematic study to optimize the processing conditions in oxygen-plasma treatments on ITO substrates used in OLEDs. The treatment led to a decrease in the surface content of carbon and an increase in the surface content of oxygen. Consequently, enhanced hole-injection, increased luminance efficiency, and improved operational stability were observed in OLEDs having an ITO anode treated at the optimized conditions (Lu et al., 2003).
Researchers Markham et al. demonstrated the viability of spin coating through conjugated dendrimers as a promising new class of solution-processible materials for use as the active layer in highly efficient organic LEDs. By optimizing the choice of device structure, host material, and electron transport layer, one can obtain efficiencies of 55 cd/A and power efficiencies of 40 lm/W (Markham et al., 2003).
Cost Information: Data and Source
There are no commercially available OLED general illumination devices.
Non-Energy Benefits of Technology
See “Non-Energy Benefits of Technology” in section 3.5.1.
Notable Developers/Manufacturers of Technology
The following presents a sampling of OLED research related to manufacturing.
Researchers at Princeton University demonstrated mechanically flexible OLEDs through vacuum deposition on a transparent, lightweight, thin plastic substrate precoated with a transparent, conducting indium tin oxide thin film. The performance of flexible OLEDs is comparable with that of conventional OLEDs deposited upon glass substrates and does not deteriorate after repeated bending (Gu et al., 1997).

143
Researchers at Soonchunhyang University in South Korea are investigating a deposition method of organic films of Alq3 by pulsed laser as an alternative to traditional thermal evaporation and spin coating techniques (Hong et al., 2002).
Researchers at the National Nanotechnology Laboratory (NNL) of Instituto Nazionale di Fisica della Materia (INFM) are investigating room-temperature nanoimprint lithography as a powerful and straightforward fabrication technique for oligomer-based nanostructured optoelectronic devices (Pisignano et al., 2003).
Ames Laboratory in conjunction with Iowa State University’s Department of Physics & Astronomy, and the Institute for Polymers & Organic Solids at the University of California, Santa Barbara are some other notable research institutions studying OLED technology.
Peak Demand Impact Potential
See “Peak Demand Impact Potential” in section 3.5.1.
Promising Applications
See “Promising Applications” in section 3.5.1.
Perceived Barriers to Market Adoption
See “Perceived Barriers to Market Adoption” in section 3.5.1.
Data Gaps and Next Steps
The following are the key issues concerning OLED manufacturing.
Novel substrate materials need to be identified that are compatible with bulk manufacturing processes (i.e., roll-to-roll) resulting in reduced costs while maintaining quality, size, and volume production.
Novel electrode materials need to be investigated with suitable current handling capabilities. Suitable deposition methods also need to be developed that are compatible with bulk manufacturing processes.
Current flow issues need investigation with the goal of controlling the flow of current through large-area OLED panels. An even distribution of current is critical to the development of OLED light sources.
Novel materials for use in the active layer to convert electrical energy to photons need to be investigated. Here, the understanding of triplet states is critical to achieve unity quantum efficiencies in OLEDs.
Finally, development of materials suitable for protecting OLED devices against the detrimental effects of oxygen and water degradation is critical to the progress of OLEDs as commercial products.
References
Becker et al., 2002. “Developments in Polymer Materials for Electroluminescence.” Heinrich Becker, Arne Buesing, and Aurelie Falcou. Proceedings of SPIE, Volume 4464, pp. 49-58. February 2003.
Economist, 2003. “Coming Soon to a Laptop Near You.” The Economist; accessed on February 6, 2004 at http://www.economist.com/printedition/displayStory.cfm?Story_ID=1841020.
Gelson, 2003. “Organic Displays Enter Consumer Electronics.” Olaf Gelsen. June 2003. Opto & Laser Europe; accessed on December 12, 2003 at http://optics.org/articles/ole/8/6/6/1.

144
Gu et al., 1997. “Vacuum-Deposited, Nonpolymeric Flexible Organic Light-Emitting Devices.” G. Gu (Dept. of Electrical Engineering, Princeton University, NJ), P.E. Burrows, S. Venkatesh, S.R. Forrest, and M.E. Thompson. Optics Letters, Volume 22, Number 3, pp. 172-4. February 1997.
Hong et al., 2002. “The Possibility of Pulsed Laser Deposited Organic Thin Films for Light-Emitting Diodes.” C. Hong (Dept. of Phys., Soonchunhyang Univ., Asan, South Korea, H.B. Chae, K.H. Lee, S.K. Ahn, C.K. Kim, T.W. Kim, N.I Cho, S.O. Kim. Thin Solid Films, Volume 409, Number 1, pp. 37-42. April 2002.
Liu at al., 2003a. “Room-Temperature Growth of Crystalline Indium Tin Oxide Films On Glass Using Low-Energy Oxygen-Ion-Beam Assisted Deposition.” C. Liu (Nat. Inst. of Adv. Ind. Science & Technology, Ikeda, Japan;), T. Matsutani, T. Asanuma, K. Murai, Kiuchi, E. Alves, M. Reis. Journal of Applied Physics, Volume 93, Number 4, 15, pp. 2262-6. February 2003.
Lu et al., 2003. “Surface Treatment of Indium Tin Oxide by Oxygen-Plasma for Organic Light-Emitting Diodes.” Dan Lu (Key Lab. for Supramolecular Structure & Spectroscopy Jilin Univ., Changchun, China), Ying Wu, Jianhua Guo, Guang Lu, Yue Wang, Jiacong Shen. Materials Science & Engineering B (Solid-State Materials for Advanced Technology), Volume B97, Number 2, 25 Jan. 2003, pp. 141-4.
Markham et al., 2003. “Highly Efficient Solution-Processible Phosphorescent Dendrimers for Organic Light-Emitting Diodes.” J.P.J Markham, S.C. Lo, T.D. Anthopoulos, N.H. Male, E. Balasubramaniam, O.V. Salata, P.L. Burn, and I.D.W. Samuel. Journal of the Society for Information Display, Volume 11, Number 1, pp. 161-6. 2003.
OIDA, 2002. Light Emitting Diodes (LEDs) for General Illumination: An OIDA Technology Roadmap Update 2002. Optoelectronics Industry Development Association. November 2002.
Pisignano et al., 2003. “Oligomer-Based Organic Distributed Feedback Lasers by Room-Temperature Nanoimprint Lithography.” Dario Pisignano (NNL, National Nanotechnology Laboratory of Istituto Nazionale di Fisica della Materia (INFM)), Luana Persano, Paolo Visconti, Roberto Cingolani, Giuseppe Gigli, Giovanna Barbarella and Laura Favaretto. Applied Physics Letter, Volume 83, Number 13. September 29, 2003.
Shim, 2003. “Spoiling for a Display Battle Royale.” Richard Shim. CNET News.com; accessed on September 19,2003 at http://news.com.com/2008-1082-955929.html.

145
3.5.3. Novel Structures
OLEDs represent a promising new light source technology. Improvement to the OLED structure has the technical potential to contribute approximately 0.6 quad of energy savings. Novel structures represent one critical step to increasing the performance and efficiency of OLED devices.
Technology Description and Energy Saving Principle
In its simplest form, the OLED structure consists of a substrate, an electrode layer, an active layer, a counter electrode layer, and a protective barrier layer. To facilitate charge injection, manufacturers may employ additional electron and hole transport layers to help balance the injection rates of both charge carriers to maximize recombination. A key challenge in the design and fabrication of efficient OLEDs is the achievement of balanced charge injection and transport in the emissive layer. Common organic materials generally only transport one type of carrier (hole or electron), and the existence of different injection barriers between two electrodes for electrons and holes will cause unbalanced electron and hole injection. This imbalance can easily result in the diffusion or drift of the excess electrons or holes into the opposite electrode without recombining radiatively, leading to low device efficiency (Ma et al., 2002).
The investigation and development of novel OLED structures such as the single-layer, multilayer and MQW structures is critical to optimize recombination, and to the future development and commercialization of OLED technology as an alternative energy-efficient general illumination light source.
Technical Maturity Level of the Technology
Multilayer structures can significantly enhance device efficiency by improving minority carrier injection and transport, and preventing majority carriers from moving into the opposite electrodes. Recently, OLEDs with multiple-quantum-well (MQW) structures have been fabricated, demonstrating efficient control of the carrier transport resulting in improved electron-hole balance.
Technology Maturity Stage
Basic Science Research
Applied Research Exploratory Development
Advanced Development
Engineering Development
Product Demonstration
Commercialization and Sales
Issues with Existing Lighting Products and Systems
See “Issues with Existing Lighting Products and Systems” in section 3.5.1.
Technical Potential and Primary Energy Consumption Impact
Research and development on novel structures to improve the performance of this technology option will benefit the overall white-light OLED lighting system. To prepare a technical potential energy savings estimate for this technology option, the DOE assumed a portion of the overall system efficacy improvement would be attritutable to this research. If OLED lighting systems become widely used in the lighting industry, replacing 50% of the available sockets with 160 lm/W devices, it would contribute to as much as 2.9 quads of primary energy savings. Some portion of those savings would be due to

146
improvements in the OLED structure. For this technical potential energy savings estimate, DOE assumes 20% of a 2.9 quad energy savings, or approximately 0.6 quad of primary energy savings from this technology option.
Performance Information: Data and Source
Researchers at Tsinghua University in Beijing, China demonstrated that a diode with a MQW number of 4 exhibited up to 8.1 cd/A, which is four times greater than conventional diodes without the MQW structure (Qiu et al., 2002). Following that demonstration, the National Laboratory of Integrated Optoelectronics at Jilin University in Changchun, China, investigated the effect of the MQW structure on the efficiency of OLED devices with different numbers of MQWs. They found that compared with the maximum efficiency of the conventional heterostructure device with a 42-nm-thick emitting layer, the device with seven quantum wells has higher efficiency by about a factor of two (Cheng et al., 2003).
Researchers from the School of Physics & Astronomy at the University of St. Andrews in the UK demonstrated a novel heterolayer structure containing a conjugated dendrimer prepared by spin coating. They obtained a peak electroluminescence (EL) external quantum efficiency of 0.16% at 600 cd/m2. Not only did these graded devices improve EL efficiency by a factor of 8 over multilayer devices, they also exhibited a threefold increase in efficiency over single-layer blended devices (Ma et al., 2002).
In January 2003, researchers from the Massachusetts Institute of Technology produced an OLED with a novel structure that integrates organic and inorganic materials at the nanometer scale. The result was a 25-fold improvement in luminescence efficiency (1.6 cd/A at 2,000 cd/m2) over the best quantum dot LED (Coe et al., 2002).
Cost Information/Data and Source
There are no commercially available OLED general illumination devices.
Non-Energy Benefits of Technology
See “Non-Energy Benefits of Technology” in section 3.5.1.
Notable Developers/Manufacturers of Technology
The following presents a sampling of OLED research related to novel structures.
The National Laboratory of Integrated Optoelectronics at Jilin University in China is investigating MQW structures for applications in OLEDs.
In the field of optical interconnects, the Department d'Optoelectronique in France is studying resonant-cavity (RC) OLEDs made on silicon substrates.
The School of Physics & Astronomy at the University of St. Andrews in the UK is investigating devices with a graded bilayer structure. These devices do away with the heterojunction interface present in conventional multilayer OLEDs. Instead, the graded layer consists of a single dendrimer with a graded doping profile of electron and hole transporting components (Ma et al., 2002).
Researchers from the Massachusetts Institute of Technology are investigating hybrid structure OLEDs that combines the diversity of organic materials with the electronic and optical properties of inorganic crystals.

147
Peak Demand Impact Potential
See “Peak Demand Impact Potential” in section 3.5.1.
Promising Applications
See “Promising Applications” in section 3.5.1.
Perceived Barriers to Market Adoption
See “Perceived Barriers to Market Adoption” in section 3.5.1.
Data Gaps and Next Steps
The characteristics of novel OLED structures are not well understood, particularly the reasons for long-term degradation of luminous output and efficiency.
Fabrication processes for the novel structures also warrant investigation. For example, researchers at the School of Physics & Astronomy at the University of St. Andrews in the UK are investigating spin-coating as a process to form organic multilayer devices. However, they found that some organic solvents used for the formation of the upper organic layer might completely dissolve the previously coated underlayer, which destroys the multilayer structure (Ma et al., 2002). There are few reports of efficient multilayer structure OLEDs prepared by spin coating.
References
Cheng et al., 2003. “Effect of Multiple-Quantum-Well Structure on Efficiency of Organic Electrophosphorescent Light-Emitting Devices.” Gang Cheng (Nat. Lab. of Integrated Optoelectronics, Jilin Univ., Changchun, China), Song Qiu, Feng Li, Jing Feng, Yuguang Ma, Shiyong Liu. Japanese Journal of Applied Physics, Part 2 (Letters), Volume 42, Number 4A, 1 pp. L376-8. April 2003.
Coe et al., 2002. “Electroluminescence from Single Monolayers of Nanocrystals in Molecular Organic Devices.” Seth Coe, Wing-Keung Woo, Moungi Bawendi and Vladimir Bulovic. Nature, Volume 420, Number 19, 26 December 2002, pp. 800-803.
Jean et al., 2002a. “Microcavity Organic Light-Emitting Diodes on Silicon.” F. Jean, J. Mulot, B. Geffroy, C. Denis, and P. Cambon. Applied Physics Letters, Volume 81, Number 9, pp. 1717-19. 2002.
Jean et al., 2002b. “Resonant-Cavity Organic Light-Emitting Diodes For Low-Cost Optical Interconnects On CMOS Silicon Circuits” F. Jean, F. (Department d'Optoelectronique, ISEB, Brest, France;), J.-Y. Mulot, B. Geffroy, C. Denis, P. Cambon, and J.-M. Nunzi. Proceedings of the SPIE - The International Society for Optical Engineering, Volume 4798, pp. 142-50. 2002.
Juang and Laih, 2001. “Angular Dependence of Two Color Emission Intensity from Organic Light Emitting Diodes with Microcavity Structures.” Fuh-Shyang Juang and Li-Hong Laih. New Materials for Electrochemical Systems IV, Extended Abstracts of the Fourth International Symposium on New Materials for Electrochemical Systems, pp. 452-4. 2001.
Ma et al., 2002. “Novel Heterolayer Organic Light-Emitting Diodes Based on a Conjugated Dendrimer.” D. G. Ma, J. M. Lupton, R. Beavington, P. L. Burn and I. D. W. Samuel. Advanced Functional Materials, Volume 12, Number 8, pp. 507-11. August 2002.

148
NCI, 2002. U.S. Lighting Market Characterization Volume I: National Lighting Inventory and Energy Consumption Estimate. Prepared by Navigant Consulting, Inc. for the Department of Energy. Washington D.C. September 2002.
OIDA, 2002. Light Emitting Diodes (LEDs) for General Illumination: An OIDA Technology Roadmap Update 2002. Optoelectronics Industry Development Association. November 2002.
Qiu et al., 2002. “High-Efficiency Organic Light-Emitting Diodes with Tunable Light Emission by Using Aromatic Diamine/5,6,11,12-tetraphenylnaphthacene Multiple Quantum Wells.” Yong Qiu (Dept. of Chem., Tsinghua Univ., Beijing, China), Yudi Gao, Liduo Wang, Peng Wei, Lian Duan, Deqiang Zhang, and Guifang Dong. Applied Physics Letters, Volume 81, Number 19, pp. 3540-2. November 2002.

149
3.5.4. Degradation and Failure Processes
OLEDs represent a promising new light source technology. Better comprehension of the OLED structure, the degradation and failure mechanisms has the technical potential to contribute approximately 0.6 quad of energy savings.
Technology Description and Energy Saving Principle
Organic light-emitting diodes (OLEDs) have improved significantly over the years. However, perhaps the single most significant obstacle to full-scale commercialization is the limited operational life39 and reliability of the device (Kondakov et al., 2003). This problem stimulated a number of studies on aging mechanisms leading to the degradation of organic device performance. For example, Eastman Kodak published a study in the Journal of Applied Physics investigating electrical aging of OLED devices (Kondakov et al., 2003).
A better understanding of OLED degradation processes would lead to more reliable devices with longer operating lifetimes and reduced decay rates allowing OLEDs to compete with existing light sources as an energy saving alternative.
Level of Technical Maturity Technology
There is very little understanding of the degradation and failure mechanisms that has hampered the development of OLEDs with adequate lifetime and performance characteristics.
Technology Maturity Stage
Basic Science Research Applied Research Exploratory
Development Advanced
Development Engineering Development
Product Demonstration
Commercialization and Sales
Issues with Existing Lighting Products and Systems
See “Issues with Existing Lighting Products and Systems” in section 3.5.1.
Technical Potential and Primary Energy Consumption Impact
Research and development on degradation and failure processes will improve performance and benefit the overall white-light OLED lighting system. To prepare a technical potential energy savings estimate for this technology option, DOE assumed a portion of the overall system efficacy improvement would be attritutable to this research. If OLED lighting systems become widely used in the lighting industry, replacing 50% of the available sockets with 160 lm/W devices, it would contribute to as much as 2.9 quads of primary energy savings. Some portion of those savings would be due to improvements in degradation and failure processes. For this technical potential energy savings estimate, DOE assumes 20% of a 2.9 quad energy savings, or approximately 0.6 quad of primary energy savings from this technology option.
39 At present, the OLED community defines the “end of life” as a point at which the luminance decays to 50% of its initial value.

150
Performance Information: Data and Source
The following presents a sampling of the research results from investigations of degradation and failure mechanisms of OLED devices.
The extrapolated life of red and green polymeric OLEDs with fluorescence emission at a luminance of 100 cd/m2 is 50,000 hours. The extrapolated life with 20% reduction of luminance starting at a luminance of 850 cd/m2 is around 3,000-5,000 hours. White-light devices at the same specifications have less than 1,000 hours of useful life (OIDA 2002).
Small molecule devices with fluorescent emitters have life spans of approximately 7,000 and 5,000 hours for red and green devices respectively at 850 cd/m2. White-light devices have life spans of 3,000 – 4,000 hours. Small molecules with phosphorescent dopants are estimated at 8,000 hours for green and 5,000 hours for red (OIDA, 2002).
At the Xerox Research Centre in Canada, researchers are studying the temperature dependence of electroluminescence degradation in OLEDs. They have projected a half-life of about 78,500 hours, 18,700 hours, and 8,600 hours for operating temperatures of 22 degrees C, 70 degrees C, and 100 degrees C, respectively, at an initial device luminance of 100 cd/m2. Devices showed better high temperature stability, which means that they have higher activation energies of degradation. These results are consistent with the proposed degradation mechanism based on the unstable cationic AlQ3 species (Popovic et al., 2003).
Cost Information: Data and Source
There are no commercially available OLED general illumination devices.
Non-Energy Benefits of Technology
See “Non-Energy Benefits of Technology” in section 3.5.1.
Notable Developers/Manufacturers of Technology
The following presents a sampling of OLED research investigating OLED degradation and failure mechanisms.
In 2003, Eastman Kodak published a paper investigating the effects of aging in OLEDs. Kodak found that electrical aging either generates hole traps (and trapped holes) or drives metal ions into the OLED device, and that either species act as nonradiative recombination centers. To estimate the accumulating immobile charge and determine its location, researchers used a variant of a recently introduced capacitance versus voltage technique. The phenomena reported may be common to a wider variety of OLED structures and compositions (Kondakov et al., 2003).
Researchers from the Department of Electrical & Electronic Engineering at Hong Kong University investigated issues of lifetime and stability of Tris (8-hydroxyquinoline) aluminum (AlQ3) active layer. The effects of exposure to air, nitrogen, and oxygen were studied. This material is one of significant interest for electron transport and/or light-emitting layer applications in OLEDs, and studies on its properties remain scarce (Djurisic et al., 2003).
Researchers from the Institute of Materials Research & Engineering in Singapore used secondary ion mass spectroscopy to examine the dark, non-emissive defects in organic light-emitting devices. They

151
demonstrated that the presence of cathode imperfection and interface roughness of different layers correlates well with the formation of device dark spots (Ke et al., 2003).
The Research & Development Center of LG Philips LCD in South Korea continues to investigate degradation and failure mechanisms of OLEDs. In June 2003, they published a paper showing that thermal annealing of OLED materials during fabrication resulted in remarkable improvement in the long-term stability of an OLED device. Annealing of the emitting polymer layer resulted in greater than an order of magnitude increase in the half-life, in spite of a decrease in the efficiency of the device as the annealing temperature increased (Kim et al., 2003a).
At the Xerox Research Centre in Canada, researchers are studying the temperature dependence of electroluminescence degradation in OLEDs containing an emitting layer composed of a mixture of different hole transport molecules and Tris (8-hydroxyquinoline) aluminum (AlQ3) electron transport and emitter molecules. The emitting layer is sandwiched between hole and electron transport layers. Devices containing the hole transport molecule N, N’-di (naphthalene-1-yl)-N, N’-diphenyl-benzidine (NPB), doped with quinacridone (DMQ) green emitter showed remarkable temperature stability (Popovic et al., 2003).
Researchers from Simmons College and the Cornell Center for Materials Research published results of their study in Volume 734 of the Materials Resource Society Symposium Proceedings specifically tracking the degradation of devices using polythiophene sandwiched between aluminum electrodes. They investigated both OLEDs based on small molecule as well as polymeric layers (Goldberg et al., 2003).
The Department of Applied Physics at the Eindhoven University of Technology in the Netherlands investigated the influence of oxygen exposure on three chemically different poly para-phenylene vinylene (PPV) derivatives used in polymeric light-emitting devices (PLEDs) (Janssen et al., 2002).
Peak Demand Impact Potential
See “Peak Demand Impact Potential” in section 3.5.1.
Promising Applications
See “Promising Applications” in section 3.5.1.
Perceived Barriers to Market Adoption
See “Perceived Barriers to Market Adoption” in section 3.5.1.
Data Gaps and Next Steps
There is a lack of understanding of the processes responsible for the gradual reduction of light output over an OLED’s operational lifetime, and its failure mechanisms. Investigation of these matters is necessary to develop materials and methods to deal with them and improve reliability and operational lifetimes of OLED devices. Among the factors that could reduce device lifetimes are:
Electrochemical degradation involving the electrode-transport interface, charge transporting small molecules, and polymers, excitons, emitters, and dopants.
Photochemical degradation involving singlet or triplet excitons and stability of materials used.
Local electrical breakdown (current induced damage) or local thermal dissipation (heat induced damage).

152
Instabilities of the interfaces between organic material and electrodes or between different organic layers in heterojunction structures that produce reduced carrier injection.
Formation of dissipation paths or luminescence quenching as a result of chemical degradation of OLED materials initiated by oxygen and/or water, or by the instability of certain charge-carrying species.
Migration of mobile ions within the device, particularly metal cations.
Reorientation of molecular dipoles.
Formation of charge traps in the emissive material that act as nonradiative recombination centers.
Crystallization and thermal expansion of low glass transition temperature hole transport layer (TPD), especially above the glass transition temperature, resulting in a high strain in the device and strain driven device degradation.
References
Djurisic et al., 2003. “Evolution Of Optical Properties Of Tris (8-hydroxyquinoline) Aluminum (AlQ/sub3/) with Atmosphere Exposure.” A.B.bDjurisic, T.W. Lau, C.Y. Kwong, L.S.M. Lam, and W.K.K. Chan. Proceedings of the SPIE- The International Society for Optical Engineering, v 4800, pp. 200-7.
Goldberg et al., 2003. “Current-Induced Degradation in Polythiophene.” V. Goldberg, M Kaplan, L. Soltzberg, J. Genevich, E. Coombs, E. Giacoomozzi, V. Kwasnik, S. Naeem, E. Pham, and G. Malliaras. Polymer/Metal Interfaces and Defect Mediated Phenomena in Ordered Polymers. Materials Research Society Symposium Proceedings, Volume 734, pp. 219-224.
Janssen et al., 2002. “Degradation Effects in Poly Para-phenylene Vinylene Derivatives Due to Controlled Oxygen Exposure.” F.J.J. Janssen, L.J. van IJzendoorn, H.F.M. Schoo, J.M. Sturm, G.G. Andersson, A.W. Denier van der Gon, H.H. Brongersma, M.J.A de Voigt. Synthetic Metals, 131, pp. 167-174.
Ke et al., 2003. “Secondary Ion Mass Spectroscopy Study of Failure Mechanism in Organic Light Emitting Devices.” Lin Ke (Inst. of Materials Res. & Eng., Singapore, Singapore), Keran Zhang, N. Yakovlev, Soo-Jin Chua, and Peng Chen. Materials Science & Engineering B (Solid-State Materials for Advanced Technology), Volume B97, Number 1, pp. 1-4. January 2003.
Kim et al., 2003a. “Effect of Thermal Annealing on the Lifetime of Polymer Light-Emitting Diodes.” Jinook Kim (Res. & Dev. Center, LG Philips LCD, Gyonggi-Do, South Korea), Jaeyoon Lee, C.W. Han, N.Y. Lee and In-Jae Chung. Applied Physics Letters, Volume 82, Number 24, pp. 4238-40. June 2003.
Kim et al., 2003b. “Wet Process Encapsulation for Longevity of Organic Light-Emitting Devices.” Gi Heon Kim (Basic Res. Lab., Electron. & Telecommunications Res. Inst., Daejon, South Korea), Jiyoung Oh, Hye Yong Chu, Yong Suk Yang, Jeong-Ik Lee, Lee-Mi Do, and Taehyoung Zyung. Journal of the Korean Physical Society, Volume 42, supplemental, pt.1, pp. S376-8. February 2003.
Kondakov et al., 2003. “Nonradiative Recombination Centers and Electrical Aging of Organic Light-Emitting Diodes: Direct Connection between Accumulation of Trapped Charge and Luminance Loss.” D.Y. Kondakov (Eastman Kodak Co., Rochester, NY, USA;); J.R.Sandifer, C.W. Tang, R.H. Young. Journal of Applied Physics, Volume 93, Number 2, pp. 1108-19. January 2003.
Popovic et al., 2003. “OLEDs with Enhanced High Temperature Operational Stability.” Z.D. Popovic, G. Vamvounis, H. Aziz, Nan-Xing Hu. Organic Light Emitting Materials and Devices VI, 8-10 July 2002. Proceedings of the SPIE- The International Society for Optical Engineering, v 4800, pp. 87-92.

153
3.5.5. Light Extraction Issues
OLEDs represent a promising new light source technology. Improving light extraction techniques has the technical potential to contribute approximately 0.6 quad of energy savings. OLEDs face similar challenges with its inorganic counterpart, LEDs, with regard to the issue of light extraction.
Technology Description and Energy Saving Principle
The OLED converts electrical energy to photons. However, it has no value has a source of illumination unless the photons escape out of the device. The process of transforming electrical energy to photons determines its internal quantum efficiency (IQE), and the ratio of photons that escape out of the device determines its light extraction efficiency. The internal quantum efficiency and its light extraction efficiency determine the external quantum efficiency (EQE) of the OLED. Early designs were poor light sources due to extremely poor light extraction efficiencies. Although internal quantum efficiency has been increasing, light extraction efficiency has remained nearly unchanged since Ching W. Tang and Steven A. Van Slyke invented the first organic LED in 1987.
The main physical reason light extraction is difficult is due to the large ratio of the refractive indices of the semiconductor and the surrounding media. When the angle of incidence exceeds a certain value according to the relationship defined by the ratio of indices of refraction, total reflection occurs. Only the photons whose angle of incidence is less than the value determined by the ratio can escape. Consequently, photons propagating outside of this “escape cone” are reflected back into the semiconductor and are eventually absorbed in the chip. The irreversible (parasitic) losses are due to the absorption in the substrate and the contact area (Zukauska, 2002). Poor light extraction is now the single most important factor limiting the external quantum efficiency of OLED devices.
The techniques used to increase the extraction efficiency of OLEDs include surface texturing and substrate modification by index matching. In surface texturing, creating a rough texture, with many peaks and valleys on the surface of the OLED, gives the photons multiple opportunities to reflect and eventually propagate outside the escape cone. The texturing does not need to be random. Controlled surface texturing (i.e., adding a lamination layer of an array of microlenses) will increase the escape cone. Another surface texturing technique uses an ordered layer of silica microspheres. Substrate modification by index matching increases the angle of the escape cone by matching the index of refraction of the substrate and epimaterials (i.e., using low-refractive index substrates) (OIDA, 2002).
New methods to improve extraction efficiency would result in the direct improvement of EQE. This presents a significant opportunity to increase the emission efficiency of OLEDs through device engineering resulting in more efficient devices.
Level of Technical Maturity Technology
Although the ongoing investigation of photon extraction continues to increase the extraction efficiency of semiconductor devices, work with organic devices began only recently. Snell’s Law and the intrinsic emissivity of current OLED materials impose physical limits on device performance, and materials research and fabrication methods and processes have yet to mature to the point where the potential of OLED devices for general illumination can be realized.

154
Technology Maturity Stage Basic Science
Research Applied Research Exploratory Development
Advanced Development
Engineering Development
Product Demonstration
Commercialization and Sales
Issues with Existing Lighting Products and Systems
See “Issues with Existing Lighting Products and Systems” in section 3.5.1.
Technical Potential and Primary Energy Consumption Impact
Research and development on light extraction techniques will improve performance and benefit the overall white-light OLED lighting system. To prepare a technical potential energy savings estimate for this technology option, DOE assumed a portion of the overall system efficacy improvement would be attritutable to this research. If OLED lighting systems become widely used in the lighting industry, replacing 50% of the available sockets with 160 lm/W devices, it would contribute to as much as 2.9 quads of primary energy savings. Some portion of those savings would be due to improvements in light extraction. For this technical potential energy savings estimate, DOE assumes 20% of a 2.9 quad energy savings, or approximately 0.6 quad of primary energy savings from this technology option.
Performance Information: Data and Source
At a recent SSL workshop sponsored by the U.S. Department of Energy, researchers revealed that light extraction efficiencies are typically on the order of 20%. They project that extraction efficiencies would need to exceed 50% for OLEDs to achieve sufficient light output for consideration as a general illumination device. The following presents a sampling of other research results regarding light extraction of OLED devices.
Most materials used in OLEDs have a refractive index near 1.7, resulting in a light extraction efficiency of only ~19%. Extraction efficiency of OLEDs has been near 20% from the beginning (in 1987) and is still currently in the range of 17% to 20% (OIDA, 2002).
Schnitzer and Yablonivitch researched ways to increase the extraction efficiency of planar structures back in 1993. Although they investigated methods eventually implemented in OLEDs, their research was conducted on inorganic devices. Nevertheless, they were able to effectively double the extraction efficiency by surface texturing (Schnitzer and Yablonvich, 1993).
Researchers from Princeton University and the University of Southern California demonstrated an OLED device with about a two and a half times improvement in extraction efficiency achieved by index matching (Gu, 1997).
In work supported by the National Science Foundation (NSF) and the Defense Advanced Research Projects Agency (DARPA), Madigan et al. demonstrated a doubling of the extraction efficiency over OLED devices fabricated on planar glass substrates and a tripling over high-index plastic substrates using an array of microlenses (Madigan et al., 2000).
Yamasaki et al., of Kyushu University in Japan, applied an array of silica microspheres on conventional two-layer structure OLED devices made with vacuum sublimation. The result was about a two and a half times improvement in extraction efficiency (Yamasaki et al., 2000).

155
To improve light extraction from OLEDs, researchers from the Department of Physics at Korea’s Advanced Institute of Science & Technology introduced a photonic crystal pattern into the glass substrate of an OLED. Using an optimized photonic crystal pattern, researchers theoretically expected more than an 80% increase in the extraction efficiency of the OLED. However, they achieved an extraction efficiency increase of over 50% experimentally, without detriment to the crucial electrical properties of the OLED (Lee et al., 2003).
Researchers from the School of Physics at Exeter University in the UK investigated the problem of the low order waveguide mode in OLED structures, that is, the surface plasmon (SP) mode, and published the results of their experiment quantifying those effects. They showed that SP modes could significantly detract from device efficiency, particularly those based on small molecules (Hobson et al., 2002).
Researchers from GE Global Research have demonstrated that, with appropriate design, simply adding scattering particles to the OLED surface can increase the overall extraction efficiency to 45% (GE, 2004).
Cost Information: Data and Source
There are no commercially available OLED general illumination devices.
Non-Energy Benefits of Technology
See “Non-Energy Benefits of Technology” in section 3.5.1.
Notable Developers/Manufacturers of Technology
Princeton University, with support from the NSF and DARPA, demonstrated the potential of various light extraction techniques in improving the external quantum efficiency of OLED technology. Foreign research institutions and universities, such as Korea’s Advanced Institute of Science and Technology and Samsung’s Research and Development Center, are also conducting research in photon extraction of OLED devices.
Peak Demand Impact Potential
See “Peak Demand Impact Potential” in section 3.5.1.
Promising Applications
See “Promising Applications” in section 3.5.1.
Perceived Barriers to Market Adoption
See “Perceived Barriers to Market Adoption” in section 3.5.1.
Data Gaps and Next Steps
Much of the knowledge of photon extraction in general illumination OLEDs trickled down from similar research conducted for LEDs and OLED display applications where commercialization has already begun. Although the concepts learned from such research are valuable, the different requirements for general illumination OLEDs are significant and their applicability to current known OLED fabrication issues is still unknown. Research into the application of various extraction principles needs to be conducted along with continued research into manufacturing methods and processes for OLED

156
fabrication. In addition, modeling tools need to be developed and utilized to shorten time consuming experimentation. This would accelerate development of optimized OLED devices.
References
Economist, 2003. “Coming Soon to a Laptop Near You.” The Economist; accessed on February 6, 2004 at http://www.economist.com/printedition/displayStory.cfm?Story_ID=1841020.
GE, 2004. “Experimental Demonstration of Increased Organic Light-Emitting Device Output Via Volumetric Light Scattering.” J.J. Shiang, T.J. Faircloth, and Anil R. Duggal. Journal of Applied Physics, Volume 95, pp 2889-2895. March 1, 2004.
Ge et al., 1997. “High-External-Quantum-Efficiency Organic Light-Emitting Devices.” G. Gu, D. Z. Garbuzov, P. E. Burrows, S. Venkatesh, S. R. Forrest, and M. E. Thompson. Optics Letters, Volume 22, Issue 6, March 1997, pp. 396-398.
Gelson, 2003. “Organic Displays Enter Consumer Electronics.” Olaf Gelsen. June 2003. Opto & Laser Europe; accessed on December 12, 2003 at http://optics.org/articles/ole/8/6/6/1.
Hobson et al., 2002. “The Role of Surface Plasmons in Organic Light-Emitting Diodes.” P.A. Hobson, J.A.E. Wasey, I. Sage, W.L. Barnes. IEEE Journal of Selected Topics in Quantum Electronics, Volume 8, Number 2, pp. 378-86. March-April 2002.
Lee et al., 2003. “A High-Extraction-Efficiency Nanopatterned Organic Light-Emitting Diode.” Yong-Jae Lee (Dept. of Phys., Korea Adv. Inst. of Science & Technology, Taejon, South Korea;), Se-Heon Kim, Joon Huh, Guk-Hyun Kim, Yong-Hee Lee, Sang-Hwan Cho, Yoon-Chang Kim, and Young Rag Do. Applied Physics Letters, Volume 82, Number 21, pp. 3779-81. May 2003.
NCI, 2002. U.S. Lighting Market Characterization Volume I: National Lighting Inventory and Energy Consumption Estimate. Prepared by Navigant Consulting, Inc. for the Department of Energy. Washington D.C. September 2002.
Madigan et al., 2000. “Improvement of Output Coupling Efficiency of Organic Light-Emitting Diodes by Backside Substrate Modification.” C. Madigan, M. Lu, and J. Sturm. Applied Physics Letter, Volume 76, Number 13, pp. 1650. March 27, 2000.
OIDA, 2002. Light Emitting Diodes (LEDs) for General Illumination: An OIDA Technology Roadmap Update 2002. Optoelectronics Industry Development Association. November 2002.
Schnitzer and Yablonvich, 1993. “30% External Quantum Efficiency from Surface Textured, Thin-Film Light-Emitting Diodes.” I. Schnitzer and E. Yablonovich. Applied Physics Letter, Volume 63, Number 16, p. 2174. October 1993.
Yamasaki et al., 2000. “Organic Light-Emitting Device with an Ordered Monolayer of Silica Microspheres as a Scattering Medium.” T. Yamasaki, K. Sumioka, and T. Tsutsui Applied Physics Letter, Volume 76, Number 10, p. 1243. March 2000.

157
3.5.6. Large Area Current Distribution
OLEDs represent a promising new light source technology. The issue of large area electrical current distribution is critical, particularly as device size increases. The technical potential energy savings for this technology option is approximately 0.6 quad of energy savings.
Technology Description and Energy Saving Principle
Most of the progress in OLED technology is fueled by interest in developing flat panel displays. However, OLEDs have the potential to impact general illumination applications as well. This will require not only significant advances in efficiency and operating lifetime, but also advances in the ability to cost-effectively fabricate large-area devices. A challenge to fabrication of large-area devices comes from the fact that OLEDs are current driven devices, operating at low voltages but at high currents. The current needs to be spread evenly throughout the entire active layer of the device. Due to the finite conductivity of the electrodes, there is a resistance with this spreading. There is also an issue with the presence of local defects, which cause electrical shorts. When shorts “burn out,” it is not a major problem. However, if the shorts develop slowly over time, it can be catastrophic since current takes the path of least resistance. This prevents current flow to the active regions of the device resulting in low efficiency and rapid degradation. These issues become more problematic as device area increases (Chan et al., 2003b).
The commonly used injecting electrode for OLEDs, indium-tin oxide (ITO), is not conductive enough to deliver large currents to areas more than several square inches. Alternatives are still unknown. Significant effort is being expended to replace ITO with conductive polymers, but the results are still inadequate (OIDA, 2002).
The impact of handling large currents and low voltages, which are required for OLEDs to be considered for general illumination, is not understood and provides a major challenge in the development of general illumination OLED devices. Overcoming these challenges will enable SSL to compete with and possibly replace existing light sources (i.e., incandescent, fluorescent, HID). Since white-light OLEDs have the potential to achieve significantly higher efficacies than the existing light sources, their use would result in significant energy savings.
Technical Maturity Level of the Technology
Tremendous strides have been made in the development of OLED technology. However, this progress has been confined to the development of flat panel OLED displays. Although OLEDs for general illumination applications have benefited from this progress, the challenges are sufficiently different. Direct investigation of the specific requirements for general illumination applications is necessary.
Technology Maturity Stage
Basic Science Research Applied Research Exploratory
Development Advanced
Development Engineering Development
Product Demonstration
Commercialization and Sales
Issues with Existing Lighting Products and Systems
See “Issues with Existing Lighting Products and Systems” in section 3.5.1.

158
Technical Potential and Primary Energy Consumption Impact
Research and development on large area electrical current distribution will improve performance and benefit the overall white-light OLED lighting system. To prepare a technical potential energy savings estimate for this technology option, DOE assumed a portion of the overall system efficacy improvement would be attritutable to this research. If OLED lighting systems become widely used in the lighting industry, replacing 50% of the available sockets with 160 lm/W devices, it would contribute to as much as 2.9 quads of primary energy savings. Some portion of those savings would be due to improvements in electrical current distribution. For this technical potential energy savings estimate, DOE assumes 20% of a 2.9 quad energy savings, or approximately 0.6 quad of primary energy savings from this technology option.
Performance Information: Data and Source
The following presents a sampling of research results from investigations of large OLED devices.
Researchers from China and Hong Kong fabricated devices exhibiting high luminance efficiency of 3.45 cd/A and power efficiency of 1.27 lm/W at a current density of 200 mA/cm2. The bilayer cathode system used in the experiment may be applicable in a wide range of organic electronic/optoelectronic devices (Chan et al., 2003a).
Andersson et al. of the Netherlands fabricated devices with a liquid Ca amalgam cathode showing an increase of current (by 50%) and brightness (80%) compared to devices with an evaporated Ca cathode (Andersson et al., 2003c).
Researchers from China published details of their success in fabricating a device whose luminance and efficiency rise from 1,500 cd/m2 to 5,000 cd/m2 and from 2.0 cd/A to 3.92 cd/A, respectively, at the current density of 100 mA/cm2. The enhancements in brightness and efficiency are attributed to an improved balance of hole and electron injections due to blocking of the injected holes by the buffer layer and a more homogeneous adhesion of the hole transporting layer to the anode (Feng et al., 2003).
Cost Information: Data and Source
There are no commercially available OLED general illumination devices.
Non-Energy Benefits of Technology
See “Non-Energy Benefits of Technology” in section 3.5.1.
Notable Developers/Manufacturers of Technology
The following presents a sampling of OLED research investigating the relationship between current and performance in OLED devices.
Researchers from the Center of Super-Diamond and Advance Films at the City University of Hong Kong and Department of Physics and Materials Science in China investigated a high-performance cathode consisting of an ultra thin CsF layer and a rare-earth ytterbium (Yb) metal for application in organic electroluminescent devices.
GE Global Research Center demonstrated a monolithic series-connected OLED architecture exhibiting the same power efficiency as traditional small area OLEDs. Due to high resistivity of the transparent electrode and the increasing probability of encountering a catastrophic short-circuit defect during

159
fabrication, achieving high performance OLEDs become problematic as emitting area increases. This type of architecture should enable applications (i.e., lighting) where scalability to a large emitting area without high fabrication cost or design complexity is required (Chan et al., 2003b).
The Department of Applied Physics at Eindhoven University of Technology in the Netherlands demonstrated that liquid metals could be used as cathodes in LEDs.
Most conducting polymers used for light-emitting devices have a small electron affinity, creating a high barrier for electron injection, which results in low injection efficiency. To improve injection characteristics, researchers from University of Toronto in Canada fabricated and investigated multilayer contacts with a tunnel-transparent dielectric layer of nanometer thickness.
In 2003, researchers from the Institute of Physics in Croatia, CFG Microelectronic in Switzerland, and LOMM/IMX Ecole Polytechnique Federale of Switzerland investigated the internal electric field in multilayer OLEDs using a combination of experimental measurements and numerical device modeling. This approach resulted in a detailed understanding of the functioning of a multilayer OLED.
Peak Demand Impact Potential
See “Peak Demand Impact Potential” in section 3.5.1.
Promising Applications
See “Promising Applications” in section 3.5.1.
Perceived Barriers to Market Adoption
See “Perceived Barriers to Market Adoption” in section 3.5.1.
Data Gaps and Next Steps
There is a lack of understanding of the processes involving current flow through large area OLED devices. Investigation of these matters is necessary to develop materials and methods to deal with them and improve reliability and performance of OLED devices. Among the steps that need to be taken are:
Development of tools and methods to model and understand current flow through OLED devices.
Identification of new electrode materials that improve both current distribution and current capacity.
Development of new methods and processes to deposit electrodes for large-area OLED devices.
Development of novel fault-tolerant architecture that distributes current while remaining robust enough to handle electrical shorts for large-area devices suitable for general illumination.
References
Andersson et al., 2003c. “Liquid Metals as Electrodes in Polymer Light Emitting Diodes.” G.G. Andersson, H.H.P Gommans, A.W.D. van der Gon, H.H Brongersman. Journal of Applied Physics. Volume 93, Number 6, pp. 3299-307. March 2003.
160
Bakueva et al., 2003. “Experimental Studies and Physical Model of Efficient, Tunable Injection using Tunnel-Transparent Dielectric Contacts on Polymer Light-Emitting Devices.” L.G. Bakueva (Dept. of Electrical & Computer Eng., Toronto Univ., Ont., Canada), S.F. Musikhin, E.H. Sargent, and A. Shik. Polymer/Metal Interfaces and Defect Mediated Phenomena in Ordered Polymers. Symposia (Materials Res. Soc. Symposium Proceedings Vol.734), pp. 169-73. 2003.
Chan et al., 2003. “Efficient CsF/Yb/Ag Cathodes for Organic Light-Emitting Devices.” M.Y. Chan, S.L. Lai, M.K. Fung, S.W. Tong, C.S. Lee, S.T. Lee. Applied Physics Letters, Volume 82, Number 11, pp. 1784-6. March 2003.
Duggal et al., 2003. “Fault-Tolerant, Scalable Organic Light-Emitting Device Architecture.” A.R. Duggal, D.F. Foust, W.F. Nealon, C.M. Heller. Applied Physics Letters, Volume 82, Number 16, 21, pp. 2580-2. April 2003.
Feng et al., 2003. “A New Kind of Buffer Layer of TiO2 Self-Assembled Material in Organic Electroluminescent Devices.” Bai Feng, Deng Zhen-Bo, Zhang Meng-Xin, Zou Wei-Yan, and Cai Qiang. Chinese Physics Letters, Volume 20, Number 3. pp. 420-2. March 2003.
Lee et al., 2003. “Frequency-Dependent Electrical Properties of Organic Light-Emitting Diodes.” Yong Soo Lee (Dept. of Electrical, Inf. & Control Eng., Hongik Univ., Seoul, South Korea), Jae-Hoon Park and Jong Sun Choi. Journal of the Korean Physical Society, Volume 42, Number 2, pp. 294-7. February 2003.
NCI, 2002. U.S. Lighting Market Characterization Volume I: National Lighting Inventory and Energy Consumption Estimate. Prepared by Navigant Consulting, Inc. for the Department of Energy. Washington D.C. September 2002.
OIDA, 2002. Light Emitting Diodes (LEDs) for General Illumination: An OIDA Technology Roadmap Update 2002. Optoelectronics Industry Development Association. November 2002.
Tutis et al., 2003. “Internal Electric Field and Charge Distribution In Multilayer Organic Light-Emitting Diodes.” E. Tutis (Inst. of Phys., Zagreb, Croatia;), D. Berner, and L. Zuppiroli. Journal of Applied Physics, Volume 93, Number 8, pp. 4594-602. April 2003.

161
3.5.7. Photonic Emission from Triplets
OLEDs represent a promising new light source technology. Improvement to the photonic emission from triplets provides the breakthrough to enable OLED devices to exceed the theoretical limit of 25% internal quantum efficiencies for singlets emissions. The technical potential energy savings of this technology option is approximately 0.6 quad of energy savings.
Technology Description and Energy Saving Principle
In an OLED, excitons are responsible for transforming electrical energy to photons. An applied potential generates an electric field that causes a migration of injected charges. Holes, (injected from the anode) and electrons (injected from the cathode) move in opposite directions in the electric field until they eventually meet and recombine. The electron/hole recombination releases energy that causes a molecule or polymer segment to reach an excited state. The molecule or polymer segment that reaches this excited state is called an exciton. These excitons are not fixed in space, but migrate from molecule to molecule. Eventually, the exciton releases this energy as photons or heat (also known as a transistion). The proportion of the excitation energy released as photons determines the device’s internal quantum efficiency (IQE) (Hackman, 2002).
Two types of transitions can occur resulting in two different processes of light generation. Singlet transitions are associated with the process of fluorescence. Fluorescence is a luminescence phenomenon in which electron de-excitation occurs almost spontaneously, and emission from a luminescent substance ceases when the exciting source is removed. In fluorescent materials, the excited state has the same spin as the ground state. The triplet process is associated with phosphorescence, a quasistable electron excitation state involving a change of spin state (intersystem crossing) that decays slowly. In phosphorescence, light emitted by an atom or molecule persists after the exciting source is removed. It is similar to fluorescence, but the species is excited to a metastable state from which a direct transition to the initial state is forbidden. Emission occurs when thermal energy raises the electron to a state from which it can de-excite.
In OLEDs, only a fraction (up to 25%) of the excitons are in the singlet state. Emission of photons from the singlet state was believed to be the only applicable form of energy release, limiting the IQE of OLEDs to the singlet process. Since the energy of triplets was believed to dissipate non-radiatively as heat, triplet states in organic materials were initially considered useless. However, researchers have found that triplet can produce light by several different processes. Thus, by utilizing the triplet process in OLEDs, the quantum efficiency can dramatically improve, to nearly 100% (Thompson et al., 2001).
Level of Technical Maturity Technology
In 2003, OLEDs took a significant step towards commercial competitiveness with the introduction of a phosphorescent material utilizing triplet states to achieve near unity quantum efficiency. This has dramatically improved the efficiency of white organic light-emitting devices (Cheng et al., 2003). However, it is only one step in realizing a commercially viable product.

162
Technology Maturity Stage Basic Science
Research Applied Research Exploratory Development
Advanced Development
Engineering Development
Product Demonstration
Commercialization and Sales
Issues with Existing Lighting Products and Systems
See “Issues with Existing Lighting Products and Systems” in section 3.5.1.
Technical Potential and Primary Energy Consumption Impact
Research and development on triplet photonic emission will improve performance and benefit the overall white-light OLED lighting system. To prepare a technical potential energy savings estimate for this technology option, DOE assumed a portion of the overall system efficacy improvement would be attritutable to this research. If OLED lighting systems become widely used in the lighting industry, replacing 50% of the available sockets with 160 lm/W devices, it would contribute to as much as 2.9 quads of primary energy savings. Some portion of those savings would be due to improvements in triplet photonic emission. For this technical potential energy savings estimate, DOE assumes 20% of a 2.9 quad energy savings, or approximately 0.6 quad of primary energy savings from this technology option.
Performance Information: Data and Sources
New dopants allow the utilization of excitons in singlet and triplet states. They typically contain heavy atoms (i.e., Ir or Pt), facilitate the forbidden “intersystem crossing” from the singlets to the triplet states. For example, green phosphorescent OLEDs achieved IQE of nearly 100% at low current densities of 0.002 mA/cm2 (OIDA, 2002). The following presents a sampling of research results from investigations of photonic emissions from triplets.
Research by the University of Southern California and Princeton demonstrated OLED devices using phosphorescent dyes that utilized photonic emissions from triplets. The devices showed external and internal efficiencies of 4% and 23%, respectively (Baldo et al., 1998).
Thompson et al. believed that 25% of the excitons are in the singlet state and 75% are in the triplet state, and utilization of triplet transitions can increase the IQE of OLEDs to 100%. They fabricated saturated red, orange, yellow and green OLEDs, utilizing heavy metal phosphorescent dopants containing molecules (i.e. Pt, and Ir). The quantum efficiencies of these devices achieved external efficiencies >15% and >40 lm/W in the best (green) devices (Thompson et al., 2001).
Adachi et al. demonstrated very high efficiency electrophosphorescence in organic light-emitting devices employing a phosphorescent molecule doped into a wide energy gap host. The device achieved a maximum external quantum efficiency of 19% with luminous power efficiency of 60 lm/W. The calculated internal quantum efficiency of the device was 87% (Adachi et al., 2001b).
Researchers from the NHK Science and Technology Institute of Tokyo (Japan) significantly improved the emission efficiency in an OLED based on iridium (III) bis [(4,6-di-fluoropheny)-pyridinato-N, C2’] picolinate (FIrpic). The FIrpic-based OLED exhibited a maximum external quantum efficiency of 10.4%, corresponding to a current efficiency of 20.4 cd/A, and a maximum power efficiency of 10.5 lm/W. The efficiency was drastically improved compared to that of a previously reported FIrpic-based OLED. This

163
indicates that high efficiency is a result of efficient confinement of triplet energy on FIrpic molecules (Tokito et al., 2003b).
Cost Information: Data and Source
There are no commercially available OLED general illumination devices.
Non-Energy Benefits of Technology
See “Non-Energy Benefits of Technology” in section 3.5.1.
Notable Developers/Manufacturers of Technology
The following presents a sampling of OLED research investigating the relationship between current and performance in OLED devices.
The University of Southern California (USC) and Princeton University demonstrated the potential of harnessing energy from the triplet states to generate light through phosphorescence.
Research from Tsinghua University in China found that the triplet to singlet exciton formation ratio is dynamic, and changes as a function of the electric field (Lin et al., 2003). In another independent study conducted by the Department of Physics & Astronomy at Iowa University, researchers found a distinct difference between exciton formations in molecular devices compared to polymer devices. Therefore, the spin statistics used to determine the maximum achievable electroluminescent efficiency, derived from the study of small molecule devices, may not apply to polymeric devices. The Department of Material Science & Engineering at the University of California, Los Angeles also carried out investigations into the performance of polymeric OLEDs with respect to the triplet energy of the dopant.
Researchers from the Solid State & Structural Chemistry Unit of the Indian Institute of Science in India and the University of Arizona developed a time-dependent approach for describing intermolecular charge-transfer processes that is completely general and may be applied to many other processes. Using this approach, they developed a general theory of electron-hole recombination in OLEDs that leads to formation of emissive singlet excitons and non-emissive triplet excitons.
John M. Lupton at the Max Planck Institute for Polymer Research in Germany and his colleagues at Graz University of Technology in Austria and Universität Potsdam in Germany discovered a tool with which to investigate the physics of triplet excitons, which are notoriously difficult to measure because of their lack of coupling to readily accessible states.
Peak Demand Impact Potential
See “Peak Demand Impact Potential” in section 3.5.1.
Promising Applications
See “Promising Applications” in section 3.5.1.
Perceived Barriers to Market Adoption
See “Perceived Barriers to Market Adoption” in section 3.5.1.

164
Data Gaps and Next Steps
The process of triplet transitions is still not entirely understood. These transitions are believed to be responsible for 75% of the photons generated in an OLED. However, these conclusions have been drawn from work primarily done on small molecule OLEDs. There are an increasing number of studies that show the 25% limit on singlet transitions may not apply in polymer-based OLEDs. For example, researchers from Milan, Italy found that the efficiency of singlet formation was approximately 70%. Although this is much higher than expected from singlet transition previously believed to have a maximum efficiency of 25%, a direct application in OLEDs has not yet been made (Virgili et al., 2003). Therefore, new tools and methods of investigation are necessary to better understand the physics of singlet and triplet processes.
References
Adachi et al., 2001a. “High-Efficiency Red Electrophosphorescence Devices.” C.Adachi, M.A. Baldo, S.R. Forrest, S. Lamansky, M.E. Thompson, R.C. Kwong. Applied Physics Letters, Volume 78, Number 11, pp. 1622-4. March 2001.
Adachi et al., 2001b. “Nearly 100% Internal Phosphorescence Efficiency in an Organic Light-Emitting Device.” C. Adachi, M.A. Baldo, M.E. Thompson, S.R. Forrest. Journal of Applied Physics, Volume 90, Number 10, pp. 5048-51. November 2001.
Baldo et al., 1998. “Highly Efficient Phosphorescent Emission from Organic Electroluminescent Devices.” M.A. Baldo, D.F. O’Brien, Y. You, A. Shoustikov, S. Sibley, M.E. Thompson, and S.R. Forrest. Letters to Nature, Volume 395. September 1998.
Cheng et al., 2003. “White Organic Light-Emitting Devices Using a Phosphorescent Sensitizer.” Gang Cheng (National Laboratory of Integrated Optoelectronics, Jilin University, Changchun, China), Feng Li, Yu Duan, Jing Feng, Shiyong Liu, Song Qiu, Dong Lin, Yuguang Ma and S.T. Lee. Applied Physics Letters, Volume 82, Number 24, pp. 4224-6. June 2003.
Chen et al., 2003. “Triplet Exciton Confinement in Phosphorescent Polymer Light-Emitting Diodes.” Fang-Chung Chen (Dept. of Material Science & Eng., Univ. of California, Los Angeles, CA, USA), Gufeng He and Yang Yang. Applied Physics Letters, Volume 82, Number 7, pp. 1006-8. February 2003.
Economist, 2003. “Coming Soon to a Laptop Near You.” The Economist; accessed on February 6, 2004 at http://www.economist.com/printedition/displayStory.cfm?Story_ID=1841020.
Gaughan et al., 2002. “Conjugated Polymer Exhibits Phosphorescence.” Richard Gaughan. Photonics Spectra, December 2002.
Hackman 2002. “Luminescence in Molecules and Crystals.” M.I.T.; accessed on February 6, 2004 at http://hackman.mit.edu/6973/LHandouts/Lecture%204%20(02-26-02).pdf.
Gelsen et al., 2003. “Organic Displays Enter Consumer Electronics.” Olaf Gelsen. Opto & Laser Europe. June 2003.
Lamansky et al., 2001. “Molecularly Doped Polymer Light Emitting Diodes Utilizing Phosphorescent Pt(II) And Ir(III) Dopants.” Sergey Lamansky, Raymond C. Kwong, Matthew Nugent, Peter I. Djurovich and Mark E. Thompson. Organic Electronics, Volume 2, Issue 1, pp. 53-62. March 2001.
Lin et al., 2003. “Triplet-To-Singlet Exciton Formation In Poly(P-Phenylene-Vinylene) Light-Emitting Diodes.” L.C. Lin, H.F. Meng, J.T. Shy, S.F. Horng, L.S. Yu, C.H. Chen, H.H. Liaw, C.C. Huang, K.Y. Peng, S.A. Chen. Physical Review Letters, Volume 90, Number 3, pp. 036601/1-4. 2003.
165
NCI, 2002. U.S. Lighting Market Characterization Volume I: National Lighting Inventory and Energy Consumption Estimate. Prepared by Navigant Consulting, Inc. for the Department of Energy. Washington D.C. September 2002.
OIDA, 2002. Light Emitting Diodes (LEDs) for General Illumination: An OIDA Technology Roadmap Update 2002. Optoelectronics Industry Development Association. November 2002.
Tandon et al., 2003. “Electron Correlation Effects in Electron-Hole Recombination in Organic Light-Emitting Diodes.” Tandon, K. (Indian Inst. of Sci., Bangalore, India;); Ramasesha, S.; Mazumdar, S. Physical Review B (Condensed Matter and Materials Physics), Volume 67, Number 4, 15 Jan. 2003, pp. 45109-1-19.
Thompson et al., 2001. “High Efficiency Organic Electrophosphorescent Devices.” M.E. Thompson, S. Lamansky, P. Djurovich, D. Murphy, F. Abdel-Razzaq, S.R. Forrest, M. Baldo, P.E. Burrows, C. Adachi, T.X. Zhou, L. Michalski, K. Rajan, J.J. Brown. Proceedings of the SPIE - The International Society for Optical Engineering, Volume 4105, pp. 119-24. 2001.
Tokito et al., 2003. “Confinement of Triplet Energy on Phosphorescent Molecules for Highly-Efficient Organic Blue-Light-Emitting Devices.” S. Tokito (NHK Sci. & Tech. Res. Labs., Tokyo, Japan;), T. Iijima, Y. Suzuri, H. Kita, T. Tsuzuki, and F. Sato. Applied Physics Letters, Volume 83, Number 3, pp. 569-71. July 2003.
Virgili et al., 2003. “Understanding Fundamental Processes In Poly(9,9-Dioctylfluorene) Light-Emitting Diodes Via Ultrafast Electric-Field-Assisted Pump-Probe Spectroscopy.” T. Virgili (Dipt. di Fisica, IFN-CNR, Milan, Italy;), G. Cerullo, L. Luer, G. Lanzani, C. Gadermaier, D.D.C. Bradley. Physical Review Letters, Volume 90, Number 24, pp. 247402/1-4. June 2003.
Wohlgenannat and Vardeny, 2003. “Spin-Dependent Exciton Formation Rates in Pi -Conjugated Materials.” M. Wohlgenannt. (Dept. of Phys. & Astron., Iowa Univ., Iowa City, IA, USA;) and Z.V. Vardeny. Journal of Physics: Condensed Matter, Volume 15, Number 3, pp. R83-107. 2003.

166
4. Utilization
Light sources are typically packaged and used as a system. The system consists of the luminaire and the controls. The luminaire includes the bare light source, the fixture (housing, electrical wires and connectors, optics), and the electronics (i.e., ballasts). The controls can range from a system as rudimentary as a simple contact switch that provides power to the luminaire from a main electrical line to a system much more robust and complex, such as an integrated automatic building control system that tailors power to the luminaire based on usage and need.
Two elements determine the efficiency of a lighting system. First, there is a spatial element whose parameters include all the physical interactions within the components of the luminaire and its interaction with the space that it is illuminating. The spatial element addresses the static element of efficiency, i.e. its efficiency at a fixed moment in time. The second element is the time element, which addresses the dynamic factor of efficiency as a static lighting system interacts with constantly changing light levels and usage of the illuminated space.
The fixture and its optics affect the amount and manner by which the light leaves the luminaire; they determine the efficiency of the luminaire. Spatial parameters that affect the efficiency of a fixture are: shape, reflectance of the materials, the number of lamps and their spacing, and whether or not a lens or louver scatters or softens the light output (Lightsearch, 2003). One measure of spatial efficiency in general lighting applications is the coefficient of utilization (CU). The CU allows comparison of luminaire efficiencies in a given application, and shows the percentage of lumens produced by the light source that actually reach the work plane. It also adjusts for the room’s proportions and the ability of the room surfaces to reflect light.
Controls typically address the time element of efficiency. For example, light sensors can turn off or reduce the light output of a luminaire when there is enough ambient light (i.e., sunlight) to illuminate the space. Occupancy sensors can turn off a lighting system for energy conservation when it detects that there are no occupants in the space. Building automation systems can further optimize lighting systems and energy savings based on analysis of usage patterns and interactions with other devices and factors (i.e., peak demand).
This chapter presents fourteen energy savings technology options concerning utilization. The chapter disaggregates the options into three topic areas: fixtures, distribution and controls. There are six for fixture, three for distribution, and five for controls related technology options.

167
4.1. Fixture
The technology options related to this section on fixtures can involve both static and dynamic elements. In addition to maximizing the static elements, dynamic elements can integrate with fixtures to further increase the energy savings potential of light sources.
The following sections present six technology options relating to lighting fixtures and efficiency.

168
4.1.1. Integrated Photosensor Luminaire
The annual energy savings potential from integrated photosensor luminaires is 0.9 quad. There is skepticism stemming from the public’s poor experience with automated lighting controls that the luminaires will function as advertised (NLPIP, 2000).
Technology Description and Energy Saving Principle
Photosensor-controlled lighting systems adjust the light output of luminaires based on conditions in the surrounding environment, such as daylight. They consist of photosensors, controllers, ballasts, and lamps. The photocell and the control circuit dictate how photosensor illuminance converts into a control signal. The photosensor consists of a light sensitive photocell, (can be photodiode, phototransistor, photoconductive) input optics, an electronic circuit to convert the photocell signal to an output control signal, and housing for the device. Most photosensors operate by modulating current through the input control wires of the ballast, thereby controlling the light output of the lamp. Other photosensor-ballast systems use a digitally encoded pulse signal. By modulating the frequency of the pulse, the photosensor varies the light output from the lamp (NLPIP, 1998). The controller, which can control multiple ballasts, takes the photosensor reading as an input and sends the appropriate signal to the ballast, either decreasing or increasing light levels.
A photosensor system ensures that lamps do not produce unnecessary light; for instance, a photosensor system would dim lamps when daylight provides sufficient illumination. However, not all light sources behave the same when power is reduced. For example, the light output of incandescent sources decreases exponentially with a linear decrease in power. Discharge sources have a much more linear relationship to a decrease in power, but issues concerning sustenance of the arc discharge may limit the range it can be dimmed. Currently, the best HID sources can only dim to 50% of full light output reliably, but fluorescent systems can dim all the way down to 1% of full light output. Although the energy savings through dimming may vary on the light source technology, lighting controls have the potential to capture significant energy savings when incorporated into a lighting system. A lighting control system would decrease the electrical power demand for lighting, along with reducing the thermal load on the cooling system of a building.
Technical Maturity Level
Many of these products that integrate sensing and control are available only in Europe, but manufacturers are developing these products for distribution in the United States as well.
Technology Maturity Stage
Basic Science Research
Applied Research Exploratory Development
Advanced Development
Engineering Development
Product Demonstration
Commercialization and Sales
Issues with Existing Lighting Products and Systems
The handling and installation of luminaires equipped with lighting control elements is the same as one without controls (Philips, 2000).

169
Technical Potential and Primary Energy Consumption Impact
The use of daylighting in commercial and industrial buildings saves energy through implementation of photoelectric lighting controls that dim electric lights when sufficient daylight is available to provide adequate illumination.
The industrial and commercial sectors would most likely use an integrated photosensor luminaire. Manufacturers could potentially outfit all fluorescent and incandescent lamps in the industrial sector with photosensors. Presently, the energy consumption in this area is 0.81 quad (NCI, 2002). In the commercial sector, the most common application space for sensors would be office buildings, which consume 21% of the electricity in the commercial sector (NCI, 2002). Presently, the energy consumption of fluorescent and incandescent lighting in commercial offices is 0.77 quad (NCI, 2002). The energy savings among applications vary. A study completed by the Lighting Research Center on integrated skylight luminaires found a 40% reduction in energy consumption for that installation (LRC, 2003). Solid-state photocontrols result in an additional 1-5% energy savings over basic photocontrols (IESNA, 1998). An integrated skylight luminaire would cut energy savings by an average of 43% in the sectors listed above. Therefore, the potential energy savings is 0.9 quad, a reduction in energy consumption for these sectors from 1.6 quads to 0.7 quad.
Performance Information: Data and Source
Philips Lighting Controls performed a case study and found that the total energy savings in a classroom depends on the amount of daylight entering, the window surface, and the use of sunblinds. A luminaire positioned near a window showed energy savings by up to 60%, same for the middle of the classroom. At a position near the corridor, away from the window, a luminaire also yielded substantial energy savings (Philips, 2000).
The Lighting Research Center field-tested four prototype Integrated Skylight Luminaires in an industrial setting to determine how well the products perform on site. They found that the photosensor lighting control systems reduced energy consumption by 40% (LRC, 2003). The LRC also created a new compact wireless photosensor system to adjust light levels with changing ceiling/workplane illuminance ratios. It is self-commissioning and has the ability to switch off in addition to dimming. The estimated reduction in energy consumption is 30% (LRC, 2002).
For large outdoor lighting systems, additional energy savings associated with solid-state photo controls, as compared to basic ones, are in the range of 1-5% (IESNA, 1998).
Cost Information: Data and Source
A typical industry price for discrete photosensors not integrated into the luminaire is approximately $140. A typical price for a photosensor coupled with a controller could range from $600 to $700. Table 4-1, below, shows current prices of typical fluorescent fixtures that the technology would likely replace.

170
Table 4-1: Price List for Existing Fluorescent Fixtures
Lamp Type Lamp Shape Power Number of Lamps Price
2 X 4 Ft. T-8 Fluorescent Parabolic Troffer T8 (linear) 32 W 3 $89.98
4 ft. Fluorescent Parabolic Troffer T12 (linear) 40 W 3 $80.98
2 X 2 Ft. T-8 Fluorescent Parabolic Troffer T8 (U-shaped) 31 W 2 $79.56
4 Ft. Premium 1-Light Ceiling Fixture T8 (linear) 32 W 1 $75.41
4 Ft. 4-Light Premium Fluorescent Fixture T12 (linear) 40 W 4 $72.95
2 X 2 Ft. 2-Light Troffer T8 (U-shaped) 31 W 2 $69.95 Source: Home Depot, 2003.
Non-Energy Benefits of the Technology
This technology option could increase the operational life of the light source. Since the luminaire only provides illumination as needed, it may conserve the life of the lamp. However, the impact of dimming for discharge sources on operational life is not fully understood. In addition, the system could increase safety by automatically illuminating a space when ambient light levels fall below predetermined minimum levels.
Notable Developers/Manufacturers of the Technology
Philips Lighting Controls manufactures sensor device that can integrate into luminaires. For example, in 1996, Phillips Lighting introduced an integrated photosensor luminaire, TRIOS-Multisense, which monitors both occupancy status and daylight level (Cook, 1998). Other companies developing integrated products include Lightolier and Lightolier Controls, Lithonia and Lithonia Controls Systems, Lutron Electronics, The Watt Stopper, and Color Kinetics.
Peak Demand Impact Potential
Peak energy demand typically coincides with peak daylight availability. Since this technology minimizes energy consumption during daylight availability, it would result in peak demand reduction.
Promising Applications
Integrated photosensor luminaires would install near windows to capture maximum energy savings. Promising applications include classroom, office, and building settings (Philips, 2002).
Perceived Barriers to Market Adoption
A perceived barrier to market adoption is higher first cost than a traditional luminaire due to the added cost of dimming systems in materials and installation. In addition, there is a bias among public occupants in buildings against automatic controls because of a history of reliability issues. Generally, people believe that they do not work properly (NLPIP, 2000).
Another barrier to the implementation of control systems is the complex nature of installation and commissioning. Although pre-packaging a photosensor with a luminaire may simplify wiring, it may further complicate calibration and commissioning.

171
Buildings would also have to be designed to take advantage of daylighting. For example, the addition of a skylight would greatly enhance the availability of daylight inside a building. However, skylights are only feasible on single story buildings.
Data Gaps and Next Steps
While several case studies measured the energy savings potential of integrated photosensor luminaires, large-scale studies have not confirmed these findings.
Field testing must accurately predict the energy savings associated with dimming controls (Ehrlich, 2001), so that consumers can justify a higher first cost investment in the technology.
Methods to simulate the actual performance of photosensor systems must be developed to guarantee that installations will be effective on site (Ehrlich, 2001). Some lighting practioners believe that lamp life is adversely effected by dimming. These issues need resolution.
To take full advantage of the energy savings potential of this technology, it will require that buildings be designed to take advantage of daylighting. That includes developing and implementing technologies that bring daylight into the space (i.e., skylights, light shelves and other daylight collector technologies). In addition, researchers also need to optimize daylight integration control algorithms in order to account for both the impact of this system on occupant productivity as well as the energy savings.
References
Elrich at al., 2001. “Simulating the Operation of Photosensor Lighting Control.” Charles Elrich, Konstantinos Papamichael, Judy Lai and Kenneth Revzan. Building Technologies Program, Lawrence Berkeley National Laboratories.
Home Depot, 2003. Online Pricing, Lighting and Fans. Home Depot; accessed on September 18, 2003 at http://www.homedepot.com.
IESNA, 1998. “Guide for the Selection of Photocontrols for Outdoor Lighting Applications.” Illuminating Engineering Society of North America. IESNA DG-13-98.
LRC, 2002. “Self-Commissioning Photosensor.” Lighting Research Center; accessed on September 26, 2003 at http://www.lrc.rpi.edu/programs/lightingTransformation/improvedPhotosensors/pdf/selfCommisioningPhotosensor.pdf.
LRC, 2003. “Integrated Skylight Luminaire.” Field Test. Delta Demonstration and Evaluation of Lighting Technologies and Applications. Lighting Research Center; accessed on September 9, 2003 at http://www.lrc.rpi.edu/programs/delta/publications/pdf/fieldtestdelta.pdf.
Lutron, 2003. Personal communication with Lutron representative. Lutron on November 25, 2003.
NCI, 2002. U.S. Lighting Market Characterization Volume I: National Lighting Inventory and Energy Consumption Estimate. Prepared by Navigant Consulting, Inc. for the Department of Energy. Washington D.C. September 2002.
NLPIP, 2000. “Photosensor Tutorial.” National Lighting Product Information Program. Specifier Report. Lighting Research Center; accessed on September 9, 2003 at http://www.lrc.rpi.edu/programs/nlpip/tutorials/photosensors/index.asp.

172
Philips, 2000. “Trios Luxsense ‘Intelligent Luminaires for Basic Energy Saving’.” Philips Lighting Controls; accessed on September 17, 2003 at http://www.eur.lighting.philips.com/gbr_gb/prof/prod/luminaires/ecs/tech_data/Luminairebased/Luxsense/luxsense.html.

173
4.1.2. Integrated Occupancy Sensor Luminaire
The annual potential energy savings estimate for integrated occupancy sensor luminaires ranges is approximately 0.9 quad. Although these products are available in Europe, the market has not yet grown in the U.S.
Technology Description and Energy Saving Principle
Integrated occupancy sensor luminaires consist of a sensor and a controller. The location of the sensor is such that it can receive signals without obstruction. The controller typically mounts at the base of the luminaire and processes the sensor signals. The luminaire adjusts light output based on conditions in the surrounding environment, in this case, room occupancy (Philips, 2000).
The luminaire can use three types of sensors to detect occupancy: an infrared (IR) sensor, an ultrasonic sensor (US), and an acoustic sensor (Santa Monica Green Buildings Program, 2003); however, application determines the most appropriate technology. IR technology senses body heat and requires straight “line-of-sight” in order to operate properly. Because these types of sensors offer good cutoff, they are typically used to distinguish motion within an office and hallway. US technology emits a high-frequency sound that reflects off room surfaces to detect small motions. Therefore, US sensors are good for areas without clear line of sight between the sensor and the occupant, such as a bathroom stall. Acoustic or audible sensors rely on voices, machinery sounds, keyboard tapping or other typical daily noises. However, acoustic sensors are poor at distinguishing ambient and occupancy noise. Hence, they area a poor fit to most applications. The controller connects to one of these sensors for automatic on/off switching, where power interrupts give the central on/off commands (Santa Monica Green Buildings Program, 2003).
The main purpose of occupancy sensor systems is to ensure that lamps do not produce unnecessary light. For instance, an occupancy sensor system would dim (or shut off) lamps when a room is unoccupied. When incorporated into a lighting system, lighting controls have the potential to capture significant energy savings. A lighting control system would decrease the electrical power demand for lighting, along with reducing the thermal load on a building’s cooling system.
Technical Maturity Level
These types of products are already commercially available in Europe, and manufacturers will develop and introduce these types of products for distribution in the United States as well.
Technology Maturity Stage
Basic Science Research
Applied Research Exploratory Development
Advanced Development
Engineering Development
Product Demonstration
Commercialization and Sales
Issues with Existing Lighting Products and Systems
A major barrier to implementation of control systems is the complex nature of installation and commissioning. However, pre-packaged luminaires with integrated occupancy sensors will encourage use of the technology. The handling and installation of a luminaire equipped with lighting control
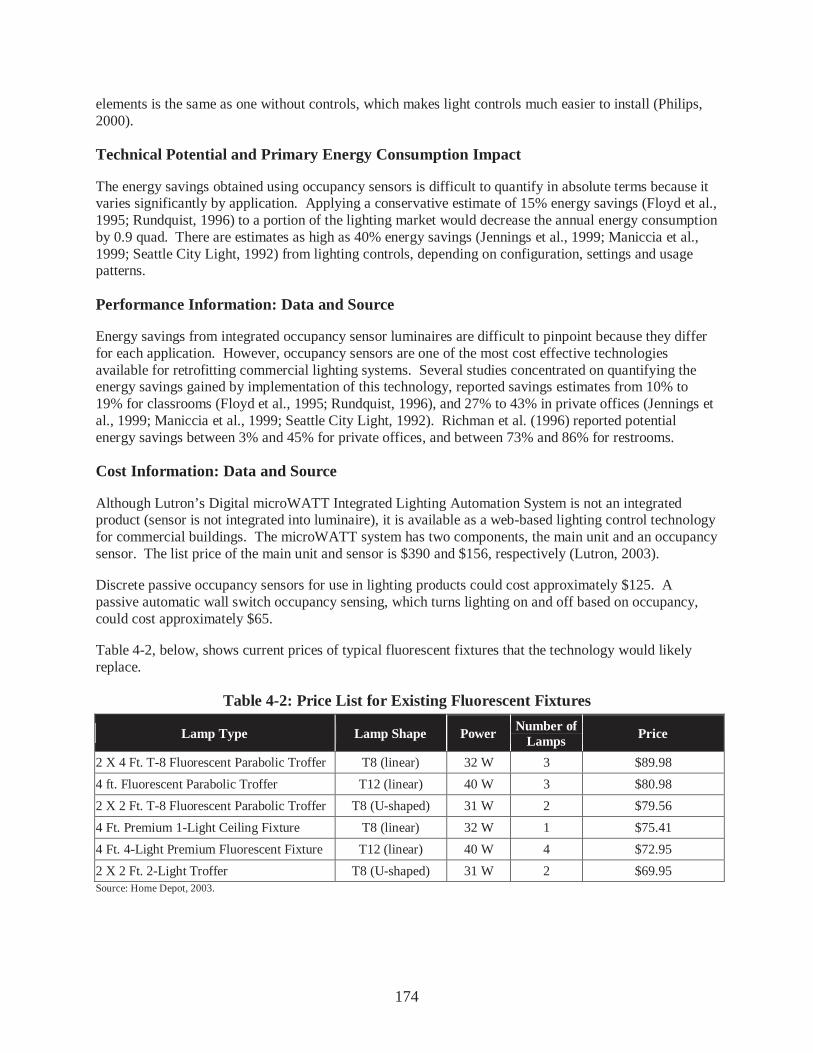
174
elements is the same as one without controls, which makes light controls much easier to install (Philips, 2000).
Technical Potential and Primary Energy Consumption Impact
The energy savings obtained using occupancy sensors is difficult to quantify in absolute terms because it varies significantly by application. Applying a conservative estimate of 15% energy savings (Floyd et al., 1995; Rundquist, 1996) to a portion of the lighting market would decrease the annual energy consumption by 0.9 quad. There are estimates as high as 40% energy savings (Jennings et al., 1999; Maniccia et al., 1999; Seattle City Light, 1992) from lighting controls, depending on configuration, settings and usage patterns.
Performance Information: Data and Source
Energy savings from integrated occupancy sensor luminaires are difficult to pinpoint because they differ for each application. However, occupancy sensors are one of the most cost effective technologies available for retrofitting commercial lighting systems. Several studies concentrated on quantifying the energy savings gained by implementation of this technology, reported savings estimates from 10% to 19% for classrooms (Floyd et al., 1995; Rundquist, 1996), and 27% to 43% in private offices (Jennings et al., 1999; Maniccia et al., 1999; Seattle City Light, 1992). Richman et al. (1996) reported potential energy savings between 3% and 45% for private offices, and between 73% and 86% for restrooms.
Cost Information: Data and Source
Although Lutron’s Digital microWATT Integrated Lighting Automation System is not an integrated product (sensor is not integrated into luminaire), it is available as a web-based lighting control technology for commercial buildings. The microWATT system has two components, the main unit and an occupancy sensor. The list price of the main unit and sensor is $390 and $156, respectively (Lutron, 2003).
Discrete passive occupancy sensors for use in lighting products could cost approximately $125. A passive automatic wall switch occupancy sensing, which turns lighting on and off based on occupancy, could cost approximately $65.
Table 4-2, below, shows current prices of typical fluorescent fixtures that the technology would likely replace.
Table 4-2: Price List for Existing Fluorescent Fixtures
Lamp Type Lamp Shape Power Number of Lamps Price
2 X 4 Ft. T-8 Fluorescent Parabolic Troffer T8 (linear) 32 W 3 $89.98
4 ft. Fluorescent Parabolic Troffer T12 (linear) 40 W 3 $80.98
2 X 2 Ft. T-8 Fluorescent Parabolic Troffer T8 (U-shaped) 31 W 2 $79.56
4 Ft. Premium 1-Light Ceiling Fixture T8 (linear) 32 W 1 $75.41
4 Ft. 4-Light Premium Fluorescent Fixture T12 (linear) 40 W 4 $72.95
2 X 2 Ft. 2-Light Troffer T8 (U-shaped) 31 W 2 $69.95 Source: Home Depot, 2003.

175
Non-Energy Benefits of Technology
This technology could increase safety by automatically illuminating a space when it detects occupancy.
Notable Developers/Manufacturers of Technology
Manufacturers that have or are currently developing sensor devices that can integrate into a luminaire include Philips Lighting Controls, Lightolier and Lightolier Controls, Lithonia and Lithonia Controls Systems, Lutron Electronics, The Watt Stopper, and Color Kinetics.
For example, Philips Lighting Controls manufactures a product called TRIOS-Infrasense, which only senses occupancy using an IR sensor. Its main characteristic is its special design, which allows for mounting inside the luminaire without special provisions in the mechanical design of the luminaire. The unit clips onto the lamp by means of a special lamp clip. These products are available from Philips Lighting in Europe (Philips, 2002).
Peak Demand Impact Potential
For the applications listed below, energy consumption occurs during peak demand hours. Thus, a decrease in energy consumption would result in a peak demand reduction.
Promising Applications
Promising applications include classrooms, offices, or any location where occupancy is intermittent. For instance, in a group of cellular offices or an office divided into cubicles, lighting can tailor to the occupancy status of a specific portion of the office (Philips, 2002).
Perceived Barriers to Market Adoption
An anticipated barrier to market adoption is higher first cost due to the added cost of sensor system materials and installation. There is also a belief among the public that automatic controls are unreliable and do not work properly (NLPIP, 2000). In addition, there are no uniform performance standards or measurement methodologies to guarantee energy savings and performance.
A major barrier to the implementation of control systems is the complex nature of installation and commissioning. However, pre-packaged luminaires with integrated occupancy sensors will encourage use of the technology. The handling and installation of a luminaire equipped with lighting control elements is the same as one without controls, which makes light controls much easier to install (Philips, 2000).
Data Gaps and Next Steps
Similar to integrated photosensor luminaries (see Section 4.1.1), field-testing must accurately predict the energy savings associated with automatic controls (Ehrlich, 2001). If this is completed, then consumers can justify a higher first cost investment in the technology.
Improvements in the reliability and performance of occupancy sensors would contribute to increased market adoption. In addition, manufacturers must effectively communicate these improvements to the public.
176
References
Audin, 1999. “Occupancy Sensors: Promises and Pitfalls.” L. Audin. Esource Technical Update, TU-93-8, Boulder CO.
Floyd et al., 1995. “Energy Efficiency Technology Demonstration Project for Florida Educational Facilities: Occupancy Sensors.” David B. Floyd, Danny S. Parker, Janet E. R. McIlvaine, and John R. Sherwin. FSEC-CR-867-95. Cocoa FL: Florida Solar Energy Center, Building Design Assistance Center; accessed on February 23, 2000 at http//:www.fsec.ucf.edu/~bdac/pubs/CR867/Cr-867.htm.
Jennings et al., 1999. “Comparison of Control Options in Private Offices in an Advanced Lighting Controls Testbed.” Jennings, Judith D., Francis M. Rubinstein, Dennis DiBartolomeo, Steven L. Blanc. Proceedings of the Illuminating Engineering Society, Paper #44., pp. 275 – 298.
Lutron, 2003. Personal communication with Lutron representative. Lutron on November 25, 2003.
Maniccia et al., 1999. “Occupant Use of Manual Lighting Controls in Private Offices.” D. Maniccia, B. Rutlege, M.S. Rea and W. Morrow. Journal of the Illuminating Engineering Society, 28(2), pp. 42-56.
NCI, 2002. U.S. Lighting Market Characterization Volume I: National Lighting Inventory and Energy Consumption Estimate. Prepared by Navigant Consulting, Inc. for the Department of Energy. Washington D.C. September 2002.
NLPIP, 2000. “Photosensor Tutorial.” National Lighting Product Information Program. Specifier Report. Lighting Research Center; accessed on September 9, 2003 at http://www.lrc.rpi.edu/programs/nlpip/tutorials/photosensors/index.asp.
Philips, 2002. “Trios Infrasense 'Intelligent Luminaires for Office Lay-Out Flexibility'.” Philips Lighting Controls. Website accessed on September 18, 2003 at: http://www.controls4lighting.com/lightingcontrol/information/systems/trios_luminaire/infrasense/infrasense.asp.
R.A. Rundquist Associates, 1996. “Lighting Controls: Patterns for Design.” TR107230. Electric Power Research Institute. Palo Alto, CA.
Richman, 1996. Field Analysis of Occupancy Sensor Operation: Parameters Affecting Lighting Energy Savings. E.E. Richman, A. L. Dittmer, and J. M. Keller. Journal of the Illuminating Engineering Society, 25(1), pp. 83-92.
Santa Monica Green Buildings Program, 2003. “Incorporate Occupancy Controls in Zones with Intermittent Use.” Santa Monica Green Buildings Program; accessed on September 18, 2003 at: http://greenbuildings.santa-monica.org/controlsys/sensorcontrols.html.
Seattle City Light, 1992. “Case Study on Occupant Sensors as an Office Lighting Control Strategy.” Seattle City Light Energy Management Services Division. Seattle WA.

177
4.1.3. SSL Signage Fixtures
Light-emitting diodes (LEDs) are gradually replacing traditional sources, such as neon and fluorescent, in illuminating commercial signage. In certain colors, LEDs already offer potential energy savings of 60% over neon. With further development to increase the efficacy of technology for all colors, SSL signage fixtures could potentially save 0.1 quad per year.
Technology Description and Energy Saving Principle
Advertising signs play an important role in our national economy. They help customers locate retailers or service providers, identify products they may want to buy, or simply indicate if a shop is open for business. Colorful, actively lit signage attracts the attention of customers and can generate business for an establishment. Historically, advertising signs relied on incandescent, fluorescent, and neon light sources for illumination.
Recently, another option emerged as a light source for commercial signage- LEDs. As LEDs have advanced in color, brightness and quality, they are gradually replacing traditional sources in illuminating commercial signage. For example, LEDs are used in channel letter signage. Channel letter signs are internally illuminated signs with multiple components, each built in the shape of an individual letter with a separate translucent panel over the light source for each element (CEC, 2003). LEDs can replace less efficient neon sources to illuminate channel letter signs and building accent strips (George, 2002). However, LEDs are not an appropriate replacement for cabinet (box) signs because the efficacy and lumen output cannot compete with the fluorescent T8 lamps currently used in this application.
The monochromatic nature of LEDs provides 80-90% energy savings. For instance, if an incandescent or fluorescent light illuminates a red channel letter face, the red screen absorbs all the energy in the green and blue wavelengths, wasting light. Conversely, LEDs are monochromatic and light is not wasted through filtering (George, 2002). Neon does emit light very strongly, but not solely in red wavelengths (George, 2002). Furthermore, light emitted from an LED is directional, meaning that most of the light generated by an LED emerges through the front of the sign. In contrast, neon and fluorescent lights have a 360 degree emission range, which results in light loss as light disperses to the back of the sign (George, 2002).
Technical Maturity Level
In 2001, manufacturers introduced the first commercial LED signage system for channel letter signs.
Technology Maturity Stage
Basic Science Research
Applied Research Exploratory Development
Advanced Development
Engineering Development
Product Demonstration
Commercialization and Sales
Issues with Existing Lighting Products and Systems
LEDs for channel letters are not compatible with neon tubing or its transformers. Neon operates at 12,000-15,000 VAC, while an LED strip operates at a much lower voltage. For example, GELcore’s Tetra strip operates on an input voltage between 96 and 245 VAC (GE, 2003b), and LEDtronics LED

178
modules operate on 12V DC (LEDtronics, 2003a). However, LEDs can retrofit existing channel letter signs. Existing light sources, (i.e., neon, fluorescent, HID or incandescent) are removed and replaced with appropriate LED strips or modules.
Technical Potential and Primary Energy Consumption Impact
Since the technology was introduced few years ago, the potential energy savings calculation assumes that market penetration of LEDs into channel letter signs starts at zero percent. Table 4-3 presents the energy consumption estimate and potential energy savings for commercial advertising signs, based on current inventory estimates (NCI, 2003). Converting all the neon signs in the baseline inventory to LED would save approximately 0.1 quad per year.
Table 4-3: Energy Savings Potential of LED Signage Fixtures
Application Annual Electricity Consumption 2001
Potential Electricity Savings
Commercial Signs 0.112 quad 0.1 quad
Source: NCI, 2003.
Performance Information: Data and Source
LED fixtures for signage applications would replace neon tubing. Based on a study performed by Lumileds, a channel letter system can produce equivalent brightness with neon, while saving energy (Lumileds, 2003). Table 4-4 compares the lumen output for LED and neon per meter. In some colors, a neon source would emit more light per meter. However, due to the 360-degree radiance of neon, much of its light is lost to the back of the sign. On the contrary, the output of LEDs is directed only to the intended surface (Lumileds, 2003). Also, the output and efficacy of LEDs is improving quickly.
Table 4-4: A Study on the Lumen Output per Meter for LED and Neon
LED Color LED Cold Cathode Color Neon Lumens per Meter
White 200 lm/m 4000K 964 lm/m
Green 250 lm/m VEE Green 878 lm/m
Cyan 300 lm/m Aqua Marine 734 lm/m
Royal Blue 50 lm/m Midnight Blue 53 lm/m
Red 440 lm/m Argon Red 97 lm/m
Amber 360 lm/m Brilliant Orange 452 lm/m Source: Lumileds -Luxeon Solutions Center, 2003.
This table does not take into account luminaire efficiency, but only shows raw light output data. If the directionality of LEDs is taken into account, the efficiency of LEDs might be greater.
Based on this sample, the efficacy of an LED based system is approximately 3.6 to 37 lm/W, depending on color. In comparison, the efficacy of neon sources is approximately 1.8 to 32 lm/W (Lumileds, 2003). Now, only red LED sources are more efficacious than neon sources.
A new study performed at the Lighting Research Center found that red channel letter signs based on LEDs are more efficacious than ones based on red neon are. In this evaluation, they found that the energy

179
savings could be up to 60% for red LED channel letters. They predicted that this number could easily grow to 80% in the near future with the optimization of drivers for LEDs, better color matching of the LEDs with the acrylic face, and better optics. Conversely, white LEDs for channel letter applications were not as efficient as cold cathode lighting. The study concluded that the three most important variables with respect to the perception of brightness are contrast, spatial frequency, and luminance of the background (Freyssinier, 2003).
Cost Information: Data and Source
GELcore created an energy savings calculator to show the potential energy and cost savings of their Tetra strip system. Table 4-5 shows the cost savings for one year, from electricity savings alone, for a store that installs their LED signage system instead of neon. However, this does not take first cost or maintenance costs into account.
Table 4-5: Energy and Cost Savings of GE Tetra System over a Neon System per Year
Neon System40 GE Tetra System
Length per Store 1,000 ft. 1,000 ft.
Color Red Red neon
Electricity Price 0.10 $/KWh 0.10 $/KWh
Power Consumption 5,318 W 1,083 W
Power Savings per year 4235 W
Cost $2,329.36 $474.50
Cost Savings per year $1,854.86 Source: GE, 2003c.
Non-Energy Benefits of Technology
There are several non-energy benefits associated with LED signage, including:
Longer Lifetime - SSL operating hours (100,000 hrs.) meet or exceed those of neon (10,000 to 25,000 hrs.) and fluorescent (Dayton Signal and Lighting, 2002).
Safety - The operating voltage of SSL is low and is typically direct current. By contrast, neon sources require 12,000-15,000V of alternating current.
Ease of Installation and Maintenance - Skilled neon workers are required to install and repair neon signage. However, SSL is more robust and flexible, and could be installed by general electrical and lighting contractors.
Design Flexibility - The small size of LEDs and their mounting surface enable flexible arrangements in any desired pattern for commercial signage.
40 Transformer voltage = 9000V, Transformer Current = 30mA, Neon tube diameter = 15mm, Transformer Power Factor = 0.52.

180
Notable Developers/Manufacturers of Technology
GELcore is a joint venture between GE Lighting and EMCORE, and Lumileds is a joint venture between Agilent and Philips Lighting. Both manufacture strip LED products for signage applications. Other LED companies, such as LEDtronics and SloanLED, also manufacture this product.
Peak Demand Impact Potential
While most outdoor signs illuminate only at night, many storeowners operate them 24 hours per day. Therefore, a portion of the energy consumption for this application would be coincident with peak, and a decrease in wattage would result in peak demand reduction.
Promising Applications
Promising applications include channel letter signs, reverse channel letter signs, and large area back lighting (LEDtronics, 2003a). Front-lighted signs are also a promising application.
Perceived Barriers to Market Adoption
High first cost is the most significant barrier to market adoption. One problem with LEDs in signage applications is reliability. Their light output diminishes over time, particularly in the case of white phosphor-based LEDs. This degradation of light output depends on drive current, operating temperature, and humidity of the environment (Freyssinier, 2003). Manufacturers need to address the consistency of light output and color among LEDs to encourage acceptance by the end user.
Data Gaps and Next Steps
Currently, only red LEDs are more efficacious than neon sources. Manufacturers and laboratory researchers continue to improve the efficacy of varying colors and white light. Improved packaging may offer better quality and longer life. Furthermore, human factor studies may further enhance the energy savings of this technology by addressing questions of acceptable luminance variations (Freyssinier, 2003).
Another area that offers significant potential for further energy savings is the development of an acrylic diffuser for the sign face that lowers transmission loss (Freyssinier, 2003). Other areas for improvement include better optics to direct light, dedicated photocells or dimmer controls, and standardized luminous requirements (Freyssinier, 2003).
References
CEC, 2003. “2005 Building Energy Efficiency Standards: Joint Appendices.” Consultation Draft Report. California Energy Commission; accessed on September 5, 2003 at http://www.energy.ca.gov/2005_standards/documents/2003-02-04_workshop/2003-02-04_JOINT_APPEND.PDF.
Dayton Signal and Lighting, 2002. “ActStrip Channel Letters, Advanced Lighting Solution.” Act One; accessed on August 28, 2003 at http://daytonsignal.com/lighting/FO-LNR-CL-D_final_112702.pdf.
Fressyinier et al., 2003. “Evaluation of Light-Emitting Diodes for Signage Applications.” John Paul Freyssinier, Yutao Zhou, Vasudha Ramamurthy, Andrew Bierman, John D. Bullough and Nadarajah Narendran. Lighting Research Center; accessed on September 5, 2003 at http://www.lrc.rpi.edu/programs/solidstate/pdf/SPIE5187-41_Freyssinier.pdf.

181
GE, 2003a. “GE Tetra LED Systems for Channel Letters.” Product Overview. GELcore, General Electric; accessed on August 28, 2003 at http://www.gelcore.com/markets/channel_letter/PDFs/GEL117TetraSysWEB.pdf.
GE, 2003b. “GE Tetra Lighting Systems Technical Data.” Data Sheet. GELcore, General Electric; accessed on August 28, 2003 at http://www.gelcore.com/markets/channel_letter/PDFs/Data%20Sheets%20Modified.pdf.
GE, 2003c. “GE Tetra LED System: Energy Savings Calculator.” GELcore, General Electric; accessed on August 28, 2003 at http://www.gelcore.com/thetoolbox/channel/calculator/index.asp.
George, 2002. “LEDs for Channel Letters and Beyond.” James F. George. Signweb; accessed on August 28, 2003 at http://www.signweb.com/moving/cont/ledchanletters.html.
Jevelle, 2003. Personal Communication with Paula Jevelle. LEDtronics in Henrdon, Virginia on July 2003.
LEDtronics, 2003a. “StripLED Connectable LED Modules for Channel Letters, Signage, Display Cases, Architectural Lighting.” Data Sheet. LEDtronics; accessed on August 28, 2003 at https://www.netdisty.net/DS/STP301/default.asp.
LEDtronics, 2003b. Press Releases. LEDtronics; accessed on September 5, 2003 at http://www.ledtronics.com/pages/news_nav.htm.
LRC, 2002. “Lighting Revolution: Solid State Lighting.” Presentation. Lux Pacifica 2002, New Delhi, India; accessed on August 28, 2003 at http://www.lrc.rpi.edu/programs/solidstate/pdf/luxPacifica.pdf.
Lumileds, 2003. “Application Focus Channel Letter Signage.” Luxeon Solutions Center, Luxeon; accessed on September 3, 2003 at http://www.lumidrives.com/content/products/pdfs/ApplicationFocus-ChannelletterSignageweb.pdf.
Melchoirs, 2003. Personal Communication with Joesph Melchoirs. GELcore in Valley View, Ohio in July 2003.
NCI, 2002. U.S. Lighting Market Characterization Volume I: National Lighting Inventory and Energy Consumption Estimate. Prepared by Navigant Consulting, Inc. for the Department of Energy. Washington D.C. September 2002.
Shakir and Narendran, 2002. “White LED in Landscape Lighting Application.” Insiya Shakir and Nadarajah Narendran. Lighting Research Center; accessed on September 23, 2003 at http://luxbright.com/data/evaluatingWhiteLeds.pdf.
Universal Lighting, 2003. “Neon & Cold Cathode Transformer Watts/Ft of Tubing.” Universal Lighting; accessed on September 23, 2003 at http://www.franceformer.com/application/neon/Watts_per_foot_table.pdf.

182
4.1.4. LED Fixture Efficiency
Once LED light sources with high efficacy and performance become available, the development of LED fixtures will become a critical factor to adoption as a general illumination light source.
Technology Description and Energy Saving Principle
LED light sources pose some unique challenges to luminaire design. LED manufacturers typically add optics at the chip level, which adds a layer of complexity to fixture design. Another critical aspect of luminaire design for LEDs is thermal design. Virtually all heat generated in an LED is conductive. Since heat significantly impacts performance of LEDs, enhancing the fixture’s ability to remove this heat is paramount.
In addition, while most LED research focuses on maximizing the light output from the LED package, there has been little work to maximize the fixture efficiency. Optimizing fixture characteristics will maximize the performance of LEDs in the future. These improvements will increase the overall efficiency of LED systems, resulting in energy savings.
Technical Maturity Level
In the last several years, OEMs began marketing fixtures for white LEDs for indoor and outdoor applications. Several of these designs have been presented at the Lightfair International Conference. There is significant room for improvement of LED fixture efficiency.
Technology Maturity Stage
Basic Science Research Applied Research Exploratory
Development Advanced
Development Engineering Development
Product Demonstration
Commercialization and Sales
Issues with Existing Lighting Products and Systems
The attributes of the LED are creating new paradigms in luminaire design. New forms and shapes made possible by SSL are challenging conventional perceptions of what a light source should look like. However, this flexibility also allows it to mimic existing light sources in both shape and function making possible the development of interim products to help phase in this technology into the existing lighting infrastructure.
Technical Potential and Primary Energy Consumption Impact
Because of high initial costs, their LED market penetration is expected to be gradual. Lower light level, non-color critical incandescent sources would initially be replaced followed by fluorescent and HID sources at a more gradual rate, as the technology reaches maturity (Opto, 2003). The energy savings from improvement in LED fixtures efficiency will come only when LEDs start to achieve penetration into the general illumination, white-light market. As a component of an LED system, DOE attributes a portion of the energy savings potential to improvement in LED fixture efficiency. Using the assumption of 20% of the energy savings potential of 2.9 quads, DOE estimates that 0.6 quad is attributable to this technology

183
option. This level of energy savings is in line with other components that were analyzed in the LED light sources section in this report.
Performance Information: Data and Source
Several LED companies manufacture LED fixtures. Table 4-6 presents performance for several LED products that are currently available. While this list is clearly not exhaustive, it provides an indication of the performance for several products white light LED fixtures.
Table 4-6: Performance of Various LED Fixtures
Description Number of LEDs Power
Light Output
(if provided)
In Ground LED Fixtures 36 30 W -
Accent "Hang" Light 36 30 W 360 lumens
Outdoor Spot Light 36 30 W 360 lumens
LED Billboard Sign Light 144 100 W 1,440 lumens
Street Light 252 240 W 2,520 lumens Source: TheLEDlight.com, 2003.
Cost Information: Data and Source
A single high-brightness LED element from Luxeon, capable of producing 65 lumens, costs about $8 (Luxeon, 2003). It would be significantly cheaper for an original equipment manufacturer (OEM) that could make bulk purchases. However, this does not included the added costs of drive electronics, system package and distributor mark ups, which would significantly increase the cost of the LED system.
Several LED companies manufacture LED fixtures. Table 4-7 presents prices for several LED products that are currently available.
Table 4-7: Prices of Various LED Fixtures
Description Power Light Output Price
In Ground LED Fixtures 30 W - $200.00
Accent "Hang" Light 30 W 360 lumens $220.00
Outdoor Spot Light 30 W 360 lumens $234.00
LED Billboard Sign Light 100 W 1,440 lumens $840.00
Street Light 240 W 2,520 lumens $1,323.00 Source: TheLEDlight.com, 2003.
Non-Energy Benefits of the Technology
The potential long life of LEDs may result in far less waste to fill up landfills. Since there are virtually no surges of current associated with LEDs like there are with discharge sources that require extreme starting voltages to initiate the arc, LEDs have some inherent safety benefits. In rough applications and harsh environments, the intrinsic shock and vibration resistance of SSL technology also offer safety advantages over existing light sources. LEDs can be manufactured to emit zero UV and IR, which makes it an ideal
184
light source in UV and IR sensitive applications. Furthermore, development of this technology would catalyze the development of a completely new SSL industry.
Notable Developers/Manufacturers of the Technology
While LED fixtures do exist, there has been no major research focused on the optimization of LED fixture design. However, the Lighting Research Center (LRC) performed research on the performance characteristics of high-powered LEDs with the goal of providing this information to fixture manufacturers (LRC, 2003a).
NEMA identifies the following manufacturers of LED lighting products: Advance Transformer Company, Color Kinetics, Cree Lighting Company, Dialight Corporation, GELcore LLC, Honeywell, Inc., Lumileds Lighting, LLC, Philips Lighting Company, and Universal Lighting Technologies (NEMA, 2003). Other OEM's include: LEDtronics, The LEDlight.com and SELUX.
Peak Demand Impact Potential
The expected operating hours for this technology would be coincident with peak energy demand. Therefore, an improvement in fixture efficiency would result in peak demand reduction. In addition, during peak demand summer periods, LED lamps would reduce a building’s internal heat load, reducing the energy consumed by the air-conditioning system.
Promising Applications
White-light LEDs systems with color and efficiency comparable to or greater than halogen, fluorescent and HID would be useable in all general illumination applications. Further, as LED costs drop they will soon compete with other technologies, such as incandescent lamps, for residential, commercial, and industrial applications.
Perceived Barriers to Market Adoption
In addition to efficiency, output level per device and color quality, a major factor that will prevent rapid adoption of LED light sources is price. White light LEDs cost up to 100 times more than halogen lamps in terms of the price per lumen emitted. Therefore, customers are still opting for traditional, established technologies rather than paying a premium for LEDs (Opto, 2003).
Data Gaps and Next Steps
Although high-powered LEDs perform better than previous LEDs, the overall output can be poor if light fixtures are not properly designed. In a recent study at the Lighting Research Center regarding the performance of LEDs under different circumstances, it was noted that if light fixtures were not properly designed, the overall performance would be poor. One major issue with high power LEDs is how to handle heat dissipation. As light output from the package increases, it is important to develop a way to transfer the heat away from the LEDs to keep the LED junction temperature low. With an understanding of how LEDs perform under different circumstances, fixture manufacturers can design more efficient and reliable systems (LRC, 2003).
White light LEDs have not yet penetrated the market for general illumination. Research is focusing on increasing the lumen output and efficiency of white LEDs so they can compete with other light sources on a performance basis.

185
References
Lightfair, 2003. Personal Communication with manufacturers of LED devices. Lightfair 2003 in Javits Convention Center, Manhattan, New York on May 3-8, 2003.
Lightsearch, 2003. “Lighting Metrics: Quantity, Quality, Efficiency” Light Guide. Lightsearch; accessed on September 15, 2003 at http://www.lightsearch.com/resources/lightguides/lightmetrics.html.
Luxeon, 2003. Personal Communication with Luxeon sales department. Luxeon on September 15, 2003.
LRC, 2003. “Performance Characteristics of High-Power LEDs.” Solid State Lighting Program. Lighting Research Center; accessed on September 15, 2003 at http://www.lrc.rpi.edu/programs/solidstate/LEDperformance.htm.
NCI, 2002. U.S. Lighting Market Characterization Volume I: National Lighting Inventory and Energy Consumption Estimate. Prepared by Navigant Consulting, Inc. for the Department of Energy. Washington D.C. September 2002.
NEMA, 2003. "Solid State Lighting Products." National Electrical Manufacturers Association; website accessed on March 1, 2004 at http://www.nema.org/index_nema.cfm/567/?sectionid=8396E680%2D6D5D%2D439F%2DB13B45C30DC926BF&Nodeid=73,1428,534,640,1101
Opto, 2003. “Cost Hinders LED Uptake.” An interview with Frank Steranka (vice president of research and development at Lumileds) by Jacqueline Hewitt. Opto & Laser Europe. May 2003.
TheLEDlight.com, 2003. “AC LED Lighting.” Online Catalog. TheLEDlight.com; accessed on December 30, 2003 at http://www.theledlight.com/120-VAC-LEDbulbs.html.

186
4.1.5. LED Fixtures for Monochromatic Applications
In color-specific applications, the monochromatic emission of LEDs becomes an advantage. In these types of niche applications, LEDs have the potential to save approximately 0.5 quad of energy annually.
Technology Description and Energy Saving Principle
LEDs are solid-state semiconductor devices that convert electrical energy directly into a particular color or wavelength of light (measured in nanometers). In contrast, traditional white light sources (i.e., incandescent, fluorescent, HID) radiate a wide spectrum of electromagnetic radiation. The light emitted from an LED source is more directional than light from spherical sources, such as a typical incandescent filament (LEDtronics, 2000). Hence, the usual measure of efficacy, lumens per watt, does not fully portray the benefits of monochromatic LEDs. In color-specific and power critical applications, the monochromatic nature of LEDs, often considered a shortcoming, becomes an advantage.
Much of the light generated by an incandescent lamp is wasted in certain applications. For instance, when only directional light is need, much of the spherically emitted light from an incandescent filament is wasted because it is emitted in a direction that may be hidden from view (LEDtronics, 2000). Contrastingly, LEDs emit a directional beam of a single wavelength without the need for secondary system level optical control. The beam angle (narrow vs. wide) is determined at the device level by how the LED chip is packaged (LEDtronics, 2000). In addition, in color critical applications, the wide spectrum incandescent light must be filtered, which results in a high percentage of light loss. In contrast, monochromatic LED light does not need to be filtered (George, 2002).
Since LED products for this application consume little energy, solar (PV) cells can power these products, which means the energy consumption can be totally off-grid. This would result in significant energy savings (Carmanah, 2003).
Technical Maturity Level
LEDs have traditionally been limited to applications such as simple status indicators, however, in the last ten years, the drastic improvement in efficacy and the increase of color selection have made LEDs ideal for other applications. Today, LEDs are commonly used in back lighting, panel indication, decorative illumination, emergency lighting, and message displays (LEDtronics, 20003). Currently, the most efficient LED color is red.
Technology Maturity Stage
Basic Science Research Applied Research Exploratory
Development Advanced
Development Engineering Development
Product Demonstration
Commercialization and Sales
Issues with Existing Lighting Products and Systems
LED technology is not directly compatible with the technology it serves to replace. LED lamps require completely different fixtures than incandescent, neon, and fluorescent lamps, and, as a result, a new infrastructure to support them.

187
Technical Potential and Primary Energy Consumption Impact
A recently completed study estimated the energy savings potential of LEDs in thirteen niche lighting applications. As shown in Table 4-8, exit signs dominate the electricity savings attributable to LEDs in 2002, with an estimated 80% market penetration. This niche market represents 71% of the total energy savings attributable to LEDs in 2002. The second most significant energy saving niche market in 2002 was traffic signal heads. In this application, approximately 30% of the signals incorporate LED technology, representing approximately 15% of the total energy savings from LEDs in 2002. Other applications, such as holiday lights and commercial advertising signs have insignificant market penetration of LEDs. Commercial LED products are available in these markets, however widespread adoption has yet to occur.
Table 4-8: Energy Consumption and Savings in 2002 of Applications Evaluated
Application Annual Energy Consumption1
LED Market Penetration
Electricity Savings 2002
Fuel/Primary Energy Savings 20022
Mobile Transportation Applications
Automobile Lights 12.95 TWh 1–2% 0.17 TWh 41.3 Mgal gasoline (4.9 TBtu)
Large Truck and Bus Lights 11.80 TWh 5–7% / 41% 1.07 TWh 142.1 Mgal diesel (19.9 TBtu)
Stationary Transportation Applications Traffic Signals 3.41 TWh 30% 1.48 TWh 16.2 TBtu Railway Signals 0.025 TWh 3–4 % 0.001 TWh 0.007 TBtu Airport Taxiway Edge Lights 0.06 TWh 1–1.5 % 0.001 TWh 0.007 TBtu
Other Stationary Applications Exit Signs 2.57 TWh 80% 6.86 TWh 75.2 TBtu Holiday Lights 2.22 TWh 0% 0.0 TWh 0.0 TBtu
Total 33.1 TWh - 9.6TWh 116.1 TBtu 1 Annual energy consumption estimate for each application assumes current level of LED market penetration. 2 Mgal = million gallons; primary energy of fuel savings represents energy content of fuel only. Source: NCI, 2003.
Table 4-9 presents the potential energy savings in each market from converting the remainder of the sockets to LED technology. It also presents the cumulative energy savings (i.e., the 2002 savings plus the remaining potential) attributable to LEDs for each market for a complete conversion to LED relative to the conventional lighting technology.

188
Table 4-9: Potential and Cumulative Energy Savings of Applications Evaluated
Application Potential
Electricity Savings1
Potential Fuel / Primary Energy
Savings
Cumulative Electricity Savings2
Cumulative Fuel / Primary Energy
Savings3 Mobile Transportation Applications
Automobile Lights 5.66 TWh 1.36 Bgal gasoline (164.9 TBtu)
5.83 TWh 1.40 Bgal gasoline (170.0 TBtu)
Large Truck and Bus Lights 7.35 TWh 972.5 Mgal diesel (136.2 TBtu)
8.43 TWh 1.11 Bgal diesel (156.0 TBtu)
Stationary Transportation Applications Traffic Signals 3.02 TWh 33.1 Tbtu 4.50 TWh 49.27 TBtu Railway Signals 0.01 TWh 0.15 Tbtu 0.015 TWh 0.16 TBtu Airport Taxiway Edge Lights 0.05 TWh 0.53 Tbtu 0.05 TWh 0.53 TBtu
Other Stationary Applications Exit Signs 0.80 TWh 8.8 Tbtu 7.67 TWh 84.00 TBtu Holiday Lights 2.00 TWh 21.9 Tbtu 2.00 TWh 21.88 TBtu
Total 18.9 TWh 365.5 Tbtu 28.5 TWh 481.7 TBtu 1 Potential electricity savings represent the electricity that would be saved if the remainder of each niche market converted to LED sources. For some markets (e.g., airplane passenger lights) this represents the entire installed base as the 2002 penetration is assumed to be zero. 2 Cumulative electricity savings represent the sum of the current savings estimate (2002) and the potential electricity savings from the conversion of the remainder of each niche market to LED. 3 Mgal = million gallons; Bgal = billion gallons; primary energy of fuel savings represents energy content of fuel only. Source: NCI, 2003.
For mobile transportation applications, large truck and bus lights and automobile lights represent the greatest future savings potential from the adoption of LED sources. And, on a cumulative basis, incorporating savings already achieved in 2002, more than 1.4 billion gallons of gasoline and 1.1 billion gallons of diesel fuel could be saved if the entire fleet of automobiles, trucks, and buses were converted to LEDs (NCI, 2003).
Performance Information: Data and Source
The following tables show performance information for representative LED products in the niche applications listed above.
Carmanah Technologies produces solar powered runway lights, railway signal lights, and bridge navigation lights. Table 4-10 shows the performance characteristics of their products. Table 4-11 gives the specifications for GELcore’s railway and traffic signals.

189
Table 4-10: LED Specifications for Railway, Aviation, and Bridge Navigation Lights Intensity Visibility
Application Power Flashing Steady Flashing Steady
Life (hrs.)
3 Mile Aviation Light (Carmanah Model 701)
Green 5.6 watts 29 cd 10 cd 3.7 Nmiles 2.6 Nmiles up to 100,000
Red, Amber, White, Blue 5.6 watts 18 cd 6 cd 3.2 Nmiles 2.2 Nmiles up to 100,000
Railway Warning Light (Carmanah Model 501)
Green 0.3 watts 3.1 cd 0.5 cd 1.9 miles 0.9 miles up to 100,000
Red, Amber, White, Blue 0.3 watts 1.2 cd 0.2 cd 1.3 miles 0.6 miles up to 100,000
2 Mile Bridge Navigation Light (Carmanah Model 601)
Green 1.4 watts 11 cd 4 cd 2.9 Nmiles 2 Nmiles up to 100,000
Red, Amber, White, Blue 1.4 watts 6 cd 2 cd 2.3 Nmiles 1.5 Nmiles up to 100,000
Source: Carmanah Technologies, 2003.
Table 4-11: LED Performance Specifications for Railway Signals and Traffic Signals
Application Color (wavelength) Power Intensity
LED Railway Signal Module (GELcore 5.5")
Green 508 nm 5 watts 65 cd
Yellow 592 nm 5 watts 45 cd
Red 630 nm 5 watts 65 cd
LED Traffic Signal Module (GELcore 8")
Green 508 nm 6 watts 267 cd
Yellow 592 nm 14 watts 267 cd
Red 626 nm 5 watts 133 cd
Source: GELcore, 2003.
Cost Information: Data and Source
The first costs of Carmanah’s solar powered products, along with Forever holiday lights, are shown in Table 4-12, below.

190
Table 4-12: Price of LED Products for Color-Critical Applications
Application Price
Runway Light $999
Railway Signal $229
Bridge Navigation Light $349
Holiday Lights $14
Source: Carmanah Technologies, 2003; Christmaslights.com, 2003.
Non-Energy Benefits of the Technology
Longer Lifetime - The longer operating life of LEDs in these applications reduces maintenance and re-lamping costs compared to incandescent sources. Carmanah Technologies guarantees its LED lights for three years compared to an incandescent lifetime of 1,000 hours, which translates to only a few months of use. It also reduces the risk of liability associated with a failed signal lamp.
Better Visibility - Due to the construction of the SSL lamp, light is only projected in the intended direction, enabling lumens to be utilized more efficiently. By contrast, incandescent lamps emit light on all sides, so only half of that light is directed away from a fixture’s mounting surface (i.e., bridge or runway). As a result, higher wattages are needed to achieve visibility requirements.
Durability and Reliability- SSL sources are well suited to roadway and railroad bridges because they are vibration tolerant, and will not stop working under conditions that might cause the filament of an incandescent lamp to fail.
Notable Developers/Manufacturers of Technology
Notable manufacturers of LEDs for monochromatic applications include Carmanah Technologies (railway signals, bridge navigation lights, and airport lights), Automatic Power (bridge navigation lights), Tideland Signal (bridge navigation lights) and Forever Bright, Inc. (holiday lights). Several notable manufacturers of LED products for commercial signage include GELcore, Luxeon, and LEDtronics. GELcore also produces LED railway and traffic signals.
Peak Demand Impact Potential
A portion of the energy consumption of this technology occurs during peak demand hours. Thus, an increase in efficacy would reduce peak demand.
Promising Applications
Emerging, potential, and existing applications include: car, bus, and truck safety and signal lighting, bridge navigation lights, holiday lights, traffic signals, airport lighting, signage, and railway signals.
Perceived Barriers to Market Adoption
The largest barrier to market adoption is high first cost. Furthermore, in the case of airport operators and bridge owners, there may be hesitation in applying an unfamiliar technology to applications where they are liable for failure.

191
Data Gaps and Next Steps
The next step is to continue research to improve the efficacy of LEDs. Another critical step involves developing and implementing more efficient manufacturing methods to lower the price of these products.
References
Christmaslights.com, 2003. Product prices; accessed on October 2, 2003 at http://www.christmaslights.com.
Carmanah Technologies, 2003. Product Specification Sheets. Carmanah Technologies; accessed on September 12, 2003 at http://www.carmanah.com.
Forever Bright, 2003. Product information. Forever Bright; accessed on September 15, 2003 at http://www.foreverbright.com.GELcore, 2003. Technical data for various products. GELcore; accessed on October 2, 2003 at http://www.gelcore.com/index2.asp.
LEDtronics, 2000. “Utilizing LEDs in Today's Energy Conscious World.” LEDtronics; accessed on September 12, 2003 at http://www.ledtronics.com/pages/Utilizing_LEDs/LED_or_Incand.htm.
NCI, 2003. “Energy Savings Estimates of Light Emitting Diodes in Niche Lighting Applications.” Prepared by Navigant Consulting, Inc. for Building Technologies Program, Office of Energy Efficiency and Renewable Energy, U.S. Department of Energy, Washington D.C. November 2003.

192
4.1.6. Off-Grid Luminaires
Off-grid luminaries have the potential to save 0.6 quad of energy annually in the United States. However, significant challenges remain (e.g. inefficiencies of both the power and light source, and limitations of the energy storage device) to make them a commercially viable technology
Technology Description and Energy Saving Principle
Off-grid luminaires are stand-alone devices that operate independently of the power grid. Renewable energy sources generate the power to operate these devices.
Renewable sources of energy that generate electricity include: bioenergy, hydropower, ocean (thermal and mechanical), solar, and wind. Bioenergy, or biomass, can make fuels, which can burn like petroleum to generate electricity. Hydropower is currently the largest source of renewable power in the United States, generating nearly 10% of electricity used in the U.S. Hydropower captures and converts energy from flowing water into electricity. Thermal and tidal energy from the ocean can also be converted into electricity. Wind turbines capture wind energy to generate electricity. Solar energy uses photovoltaic cells to convert the sun’s energy into electricity (DOE, 2003a). From these identified renewable energy sources, the two most likely candidates for use with stand-alone lighting systems are wind and solar. Wind turbines capture the wind’s energy with propeller like blades, which mount on a rotor to generate electricity. Solar technologies use the sun’s light to generate energy through photovoltaic (PV) cells that convert sunlight directly into electricity. Since photovoltaic cells are made from semiconductors and do not have any moving parts, it presents a more rugged solution to off-grid power generation. A typical solar powered luminaire would consist of a solar panel, a light source and fixture, a battery, and a controller to regulate power.
System efficiency is critical since the units are self-contained, and the choice of light source would significantly impact the performance of off-grid luminaires. Although LEDs may eventually replaced fluorescent lamps as the light source of choice for these type of products, the best available candidate for use in an off-grid luminaire is the fluorescent lamp. It is among the most efficacious light sources, its cost is modest, and its electronics are relatively mature and simple to implement. In addition, its availability in low wattages is an advantage in designing optimized systems for specific applications.
Stand-alone luminaries could use solar and wind power in areas where power from utilities is not available, or as a measure to reduce electricity demand. Since solar and wind powered luminaries are completely off grid, they do not use any energy from utilities. This eliminates electricity demand from applications in which they are used.
Technical Maturity Level
Solar powered off-grid luminaries are available in the market for limited use in street lighting, parking lighting, and general area lighting. While traditionally HID technology was the source of choice for these systems, an increasing amount of LED lamps are being used and will be used in the future. LEDs are rapidly increasing in efficiency, and their low-voltage DC requirements make LEDs a good light source to use with PV modules.
Off-grid luminaries, powered by PV solar cells, are usually used in remote areas where power from utilities is not available or too costly. In populated areas, the price of solar energy cannot compete with utility companies. There are currently no off-grid luminaire systems designed to work exclusively with wind power. Currently, wind farms harness power from wind across windy unpopulated areas, and generate electricity, which is fed back into the power grid for general consumption.

193
Technology Maturity Stage
Basic Science Research Applied Research Exploratory
Development Advanced
Development Engineering Development
Product Demonstration
Commercialization and Sales
Issues with Existing Lighting Products and Systems
An off-grid luminaire system can be used independently of existing lighting products and systems.
Technical Potential and Primary Energy Consumption Impact
Off-grid luminaires would affect energy consumption in the outdoor stationary sector, essentially taking it 100% off grid, reducing energy used from 0.6 quad (NCI, 2002) to 0 quad (technical potential energy savings, primary energy).
Performance Information: Data and Source
A representative example of an off-grid luminaire is LEDtronic’s solar powered solar-powered LED 12-volt light system. It consists of three lamps (with a cluster of 24 LEDs each) used either together or individually. It also includes a battery, terminal block, voltage regulator and wiring (LEDtronics, 2003). The system provides eight to sixteen hours of continuous illumination per full charge, generates 36 lumens per LED and consumes 10 W (LEDtronics, 2003). The efficacy of the system is 10.6 lm/W.
The Selux Corporation produces an off-grid lighting system called SDS SONNE Solar Powered Lighting System. The system can be sized and customized according to light requirements and geographical area. The lamps that can be powered range from an 18 W compact fluorescent lamp to a 42 W compact fluorescent lamp (Selux, 2003).
Silicon Solar produces several solar powered outdoor lights. One variety, their Solar European Garden Light uses two LED bulbs and produces a light output of 10,000 mcd. It is powered by a 1000mAh battery connected to a 6” diameter solar panel (Silicon Solar, 2003).
Bergy Wind Power produces small wind turbines. They market a packet for a remote 1kW wind system for use in places such as typical off-grid homes, schools, clinics, or locations where delivering or storing diesel fuel is a problem. The system includes a 1 kW XL.1 Turbine, with PowerCenter, a 64 ft. Tilt-up Tower, 5.3 kWh Battery Bank, and a 1,500 W DC-AC Inverter System. This system can provide from 60 - 150 AC Kilowatt-hours (kWh's) per month, depending on wind resource (Bergey, 2003).
Cost Information: Data and Source
The cost of the LEDtronics solar-powered lighting system is $725 (960 lumen output), which equates to $755/kilolumen (LEDtronics, 2005). The cost of the Solar European Garden Light is $19.95 (Silicon Solar, 2003). Table 4-12 below breaks down the cost of a small wind turbine (1kW) power system.

194
Table 4-13: Total Cost of Small Wind Turbine Power System
Component Price
1 kW XL.1 Turbine, with PowerCenter $2,150
64 ft. Tilt-up Tower $1,090
5.3 kWh Battery Bank (B220-4) $380
1,500 W Inverter System (DR1524, with fuse) $1,044
Total Cost: $4,664 Source: Bergey Wind Power, 2003.
Non-Energy Benefits of Technology
It’s not that off-grid luminaires are great; it’s what powers them that benefit the environment. Of all the renewable energy sources available, solar cells have the least impact on the environment. Electricity produced from photovoltaic cells do not endanger animal or human health, deplete natural resources, or result in air or water pollution (NESEA, 2001).
Notable Developers/Manufacturers of Technology
LEDtronics has developed and manufactured a stand-alone, off-grid general illumination system. Smaller, specialty companies, such as the SELUX Corporation and Silicon Solar, also produce off-grid solar powered luminaires.
Peak Demand Impact Potential
Solar and wind powered luminaries are completely off grid. They do not use any energy from utilities and will eliminate electricity demand for applications in which they are used.
Promising Applications
Off-grid luminaries are particularly promising in remote areas not connected to a utility grid, such as rural areas or developing countries. Installations may be suitable in remote parking lots, country homes, rest stops, disaster areas, golf courses, boat landings, hiking trails, and remote historical sites (Selux, 2003). Other applications include portable road lighting or cabin task illumination (LEDtronics, 2003).
Perceived Barriers to Market Adoption
Price is the largest obstacle to market adoption. Factoring in all costs, solar and wind-powered luminaires are much more costly to operate than luminaires powered from a utility grid.
Wind-powered systems are inherently problematic. Moving parts make reliability a larger issue. Wind is an unpredictable source of energy.
Data Gaps and Next Steps
LED devices are an excellent fit with solar-powered systems. These devices are appearing in niche applications. However, the efficacy and lumen output of LEDs must increase dramatically, with a reduction in cost, to make them commercially viable.

195
In addition, for solar powered systems, the efficiency of PV cells needs to increase and the cost must decrease to enable use of high-wattage luminaires for expanded applications.
Battery technology also needs to improve to develop smaller, lighter, and cheaper power storage devices, along with better electronics to regulate that power more efficiently. This is especially important for solar-powered devices since energy consumption occurs almost exclusively at night.
References
Bergey, 2003. “Remote Home Value Package. 1 kW Remote System Package.” Bergy Wind Power; accessed on March 2, 2004 at http://www.bergey.com/
DOE, 2003a. Office of Energy Efficiency and Renewable Energy Website. Department of Energy; accessed on December 5, 2003 at http://www.eere.energy.gov.
DOE, 2003b. “About Photovoltaics.” U.S. Department of Energy; accessed on December 5, 2003 at http://www.eere.energy.gov/pv/pvmenu.cgi?site=pv&idx=1&body=aboutpv.html.
LEDtronics, 1999. “SolarLEDs LED Lamps Extend Renewable Energy Resources 10 to 20 Times.” November 1999. LEDtronics; accessed on December 5, 2003 at http://www.ledtronics.com/pages/News57.htm.
LEDtronics, 2005. “Solar-Powered LED 12-Volt Lighting Systems.” LEDtronics; accessed on May 10, 2005 at http://www.ledtronics.com/ds/SLL003/default.asp
NESEA, 2001. Northeast Sustainable Energy Association; accessed on December 5, 2003 at http://www.nesea.org/buildings/info/solarelectricity.html.
NCI, 2002. U.S. Lighting Market Characterization Volume I: National Lighting Inventory and Energy Consumption Estimate. Prepared by Navigant Consulting, Inc. for the Department of Energy. Washington D.C. September 2002.
Selux, 2003. “Sonne Solar Outdoor Lighting Application Guide.” Selux Corporation.

196
4.2. Distribution
This section deals with mechanisms that transport light from a source to the visual task area. The following sections present three technology options relating to the distribution of light for general illumination.

197
4.2.1. Street Markers
The annual energy savings potential for street markers is 0.1 quad. However, there are concerns over their impact on safety that remain unresolved.
Technology Description and Energy Saving Principle
Although only one third of all automobile trips take place at night, almost one half of all driving accidents occur during those hours of darkness. Appropriate road lighting has been shown to reduce accident rates and improve driver reaction (Smith, 2002). Currently, overhead street lighting and cat’s-eye reflectors provide nighttime road illumination. Cat’s eye reflectors are reflective road markers that reflect a portion of a car’s headlights back toward the motorist and road. Cat’s eye reflectors do not generate their own light, but utilize a light source; they function by reflecting light. These are sufficient along straight portions of roadway. Overhead street lighting is necessary at bends, dips, or curves in the road (Smith, 2002).
Solar powered street marker studs can be an effective replacement for a portion of overhead street lighting. Such street marker units consist of a solar panel, a nickel hydride battery, a light dependent resistor, and a microcontroller. The solar panels capture sunlight and light from vehicle headlights to power the light source, typically an LED. Sensors within the unit detect the level of ambient light and activate the LED when daylight drops below preset levels (Optics.org, 2002).
Since the unit is solar powered, all energy consumption is off-grid. These lights provide increased forward visibility of the roadway. Street markers cannot completely replace overhead street lighting, however. Overhead street lighting illuminates the road and the surrounding areas, which provides numerous safety benefits. However, if these nighttime street marker studs can replace even a percentage of streetlights, energy savings could result.
Technical Maturity Level
The concept of night delineation units, such as solar powered street lighting, was conceived in 1992 (Smith, 2002). Street markers are now available in flush or surface mount varieties, and can be either unidirectional or bi-directional (Smith, 2002). The road studs are available in blue, amber, white, red, and green. There are sample installations throughout Europe and the United States to illustrate the benefits of the technology, but street markers are not common on U.S. roadways.
Technology Maturity Stage
Basic Science Research Applied Research Exploratory
Development Advanced
Development Engineering Development
Product Demonstration
Commercialization and Sales
Issues with Existing Lighting Products and Systems
LED street marker fixtures would increase delineation of the roadway, though their potential impact on traffic accidents and general roadway safety (e.g. accidents with pedestrians, deer) is not known. However, there are no technical issues with installation of these units on roadways.

198
Technical Potential and Primary Energy Consumption Impact
There are approximately 37.85 million streetlights in the U.S. (NCI, 2002), each operating for about 3,650 hours per year. This totals 82.75 billon hours per year for all installations. The annual energy consumption for streetlights is 0.34 quad (NCI, 2002).
Implementation of road markers would reduce the need for street lighting. Traffic controlled dimming or late night dimming could complement a marker system to reduce energy consumption. For example, a motorway in the UK has incorporated traffic-controlled dimming, where the light level is based on traffic volume. Lighting levels are reduced 50% during times of low volume (Lighting Journal, 2002). During a trial period, the study found that energy consumption fell by 24%. Application of a system in the U.S. reduced consumption by 24% would result in an estimated energy savings of 0.08 quad per year, down from the current consumption of 0.34 quad to 0.26 quad.
Alternatively, with the addition of street markers, a time-based step dimming system (proposed in London) could also incorporate into a street lighting system to save energy (Barking and Dagenham Council, 2002). If lighting levels were reduced 25% after 1AM, this would effectively reduce the energy consumption of street lighting by 25% for approximately half the operating hours. If this system were employed in the U.S., then energy consumption could be reduced to 0.3 quad, saving 0.04 quad of energy.
Performance Information: Data and Source
Conventional studs that rely on headlight reflection increase driver visibility by approximately 90 meters. LED studs provide visibility of 900 m (British Commercial News, 2002). At a speed of 100km/h (62mph), this translates to a preview time of approximately 30 seconds on a straight roadway, whereas conventional studs only provide a preview time of 3.2 seconds. This allows the driver more time to react to road conditions (Smith, 2002). Astucia’s S-Series Night Delineation unit produces up to 8 candela. Actual values depend on color (Astucia, 2003).
Cost Information: Data and Source
Table 4-14 shows price of Cat’s eye reflectors and LED roadway studs.
Table 4-14: Price for Cat's Eye Reflectors and Solar Powered LED Roadway Studs
Light Source Price
Cat's Eye Reflectors: Single Sided $4.00
Cat's Eye Reflectors: Double Sided $4.55
Astucia’s Solar Night Light (Stud) $32.00 Sources: Optics.org, 2002; US Reflector, 2003.
Although it appears that conventional cat’s eye reflectors are more cost efficient than the solar powered LED alternative, this does not take into account the cost savings that would result from installing and maintaining fewer street lights. Traditional overhead street lighting costs $50,000 to install per kilometer of roadway. The installation of solar powered road markers on the centerline and edge of the road costs $12,000 (Smith, 2002). These estimates are installation costs alone, and do not account for maintenance costs or associated energy savings.

199
Non-Energy Benefits of Technology
The major benefit of this technology is driver safety and performance. With street markers, there is increased driver visibility and improved delineation of the roadway (Optics.org, 2003). This becomes an even greater asset in bad weather.
In addition, conventional street lights cause light pollution along the nation’s roadways, which is especially bothersome to residents who live along highways. Street markers would decrease the amount of light wasted illuminating the nation’s roadways, which would preserve dark skies, along with saving energy.
Astucia developed “intelligent” road studs (Mooker, 2002). The device detects traffic and weather conditions and emits different colors depending on road conditions. The studs can also detect if drivers are too close to vehicles in front of them or indicate to drivers if there is danger ahead (Mooker, 2002).
Notable Developers/Manufacturers of Technology
Astucia, a UK based company, holds the patent and produces solar powered Intelligent Road Studs. They also manufacture markers specialized for pedestrian crossings (ITS Media, 2002) and hiking trails (Smith, 2002). Two American companies, Light Guard Systems and Traffic Safety Corporation also produce solar powered LED road units.
Peak Demand Impact Potential
Energy consumption for this application occurs at night. Therefore, it would have no impact on peak demand.
Promising Applications
Along with roadway lighting at night and during foggy conditions, street markers can illuminate pedestrian crossings, railway crossings, and hazardous features of the roadway (Astucia, 2003).
Perceived Barriers to Market Adoption
A potential barrier to market adoption is the first cost of LED road studs compared to the conventional cost of cat’s eye reflectors.
Another critical issue concerns safety on public roadways where street markers replace street lighting.
Data Gaps and Next Steps
A critical next step the development of street markers would include research to determine the impact of street markers and reduced street lighting on driver and pedestrian safety.
References
Astucia, 2003a. “SolarLite Night Road and Path Delineation.” Specification Sheet. Traffic Management Systems. Astucia, Ltd.; accessed on September 8, 2003 at http://www.astucia.co.uk/pdf/Night%20Delineation%20overview.pdf.
Astucia, 2003b. “Solar Lite Guidance System.” Product Brochure. Astucia, Ltd.; accessed on August 29, 2003 at http://www.astucia.co.uk/pdf/English%20SolarLite.pdf.
200
Barking and Dagenham Council, 2002. “Street Lighting.” Performance Plan. Barking and Dagenham Council; accessed on September 25, 2003 at http://www.barking-dagenham.gov.uk/9-council/performance-plan/perf-plan-01-02/PDF/73-Street%20Lighting.pdf.
British Commercial News, 2002. “Astucia Intelligent Road Studs Lead the Way.” Indo-British Partnership; accessed on September 8, 2003 at http://www.astucia.co.uk/news/bcn%200302.pdf.
ITS Media, 2002. “Astucia Crossing Over to Europe.” ITS Media News. June 2002; Website accessed on September 8, 2003 at http://www.astucia.co.uk/news/press_its%20media%20news%20june%202002.htm.
Lighting Journal, 2002. “Dynamic Dimming: The Future of Motorway Lighting?” The Lighting Journal. September/October 2002; accessed on September 25, 2003 at http://www.roycethompson.com/Doc/dimming.pdf.
Mooker, 2002. “Light up your Way with ‘Smart’ Road Studs.” Nivedita Mooker. The Financial Express (India). January 22, 2002; accessed on September 8, 2003 at http://www.astucia.co.uk/news/press_fe.htm.
Optics.org, 2002. “LEDs Improve Road Safety.” Jacqueline Hewitt. Optics.org; accessed on September 8, 2003 at http://www.astucia.co.uk/news/press_optics%20org%20%20-%20leds%20improve%20road%20safety.htm.
Smith, 2002, “Leading the Way in Night Delineation.” Ritchie Smith. Astucia Ltd; accessed on September 8, 2003 at http://www.astucia.co.uk/pdf/night%20Delineation%20article.pdf.
US Reflector, 2001. “Pavement Markers.” Electronic Catalog. US Reflector; accessed on September 8, 2003 at http://www.usreflector.com/PDF%20files/Catalog%202003/2003%20Individuals/Section%20B%20Pavement%20markers/Section%20B%2001%20Pavement%20markers.pdf.

201
4.2.2. Fiber Optic for General Illumination
Glass fibers for lighting have been available since the 1980’s, but their use has been limited to niche applications and all efforts to improve fibers have been for purposes of communications. However, replacing incandescent reflector lamps with metal halide fiber systems represent over 0.1 quad in potential annual energy savings.
Technology Description and Energy Saving Principle
The principal of total internal reflection (TIR) governs light transmission through an optical fiber. TIR occurs when a light ray is incident at the interface between two optical media, defined by Snell’s law. If the incident angle fulfills the condition for TIR, the ray transmits through the fiber by multiple total internal reflections. However, as light propagates through an optical fiber, it loses some of its energy.
There are three mechanisms that light is lost within an optical fiber: Fresnel reflection losses, absorption losses, and scattering losses. Any other physical abnormality such as sharp bends in the fiber would also increase scattering losses. Fresnel reflection loss occurs at the input and output faces of the fiber and is due to the difference in refractive index between the core material and the surrounding medium. This loss in air is approximately 4% for incident angles below 60o and is substantially higher at larger angles. Absorption is basically a material property, and it takes place when electronic transitions are excited within the material are followed by non-radiative relaxation processes. As a result, there is an increase in thermal energy in the material, and this could degrade the fiber performance over the period of operation. All optical fibers have imperfections and defects that result in scattering loss. These imperfections at the core-cladding interface and irregularities in fiber geometry could lead to additional light losses (Narendran et al., 1999).
Improvements that would result in reduction of losses through these mechanisms would increase the efficiency and efficacy of fiber light systems. Replacement of less efficient fibers with improved fibers would result in energy savings. In addition, most fiber optic systems use metal halide lamps as their source and deliver light in small enough increments to match halogen accent lights. With efficient coupling, most of the high efficiency of metal halide lamps can be preserved to the fixture output, allowing very high efficiency accent lighting. Using this technology along with advanced coupling methods can save as much as 80% of the energy of many types of general illumination lamps (Fiberstars, 2004d).
Technical Maturity Level
Fiber optic systems have recently become commercially viable for large-scale general illumination applications. The vast majority of modern general illumination applications use efficient plastic optical fibers because it is lower cost than glass, easier to service in the field, and has higher collection efficiency (Jenson, 2002). Large core plastic optical fiber has higher collection efficiency than the bundled stranded fiber used in fiber optic lighting in the 1990s. The higher efficiency is due to a higher numerical aperture. Over the last decade, large plastics companies such as 3M (3M, 2004; 3M, 1999) and Rohm & Haas (Rohm & Haas, 1995) have improved the transmission efficiency and robustness of large core plastic optical fiber. These systems are primarily used in custom designs and installation that can take advantage of its unique attributes. High efficiency systems are increasingly installed as alternatives to halogen lamps in order to reduce full building energy load. Outside of the general illumination market, fiber optics are being explored for applications that take advantage of the low heat load and tight beam forming optics.

202
Technology Maturity Stage Basic Science
Research Applied Research Exploratory Development
Advanced Development
Engineering Development
Product Demonstration
Commercialization and Sales
Issues with Existing Lighting Products and Systems
Fiber optic lighting systems would require a completely new infrastructure. Retrofitting these systems into existing installations would be difficult and expensive since the transport mechanism is photonic rather than electric. Instead of converting electrical energy to light locally, fiber optic systems generate light remotely in a central local. Then, fibers transport the generated light to the area to be illuminated.
Fiber optic lighting systems require different tools and procedures than electric lights. However, factory complete systems such as Caro by Magiclite (Magiclite, 2004) and Fiberjacks EFO from Fiberstars (Fiberstars, 2004d) are improving the situation by allowing a tool less installation.
Technical Potential and Primary Energy Consumption Impact
Fiber optic systems reached efficiencies required to replace halogen & incandescent reflector lamps. The estimated energy consumption of incandescent reflector lamps is 0.166 quads of primary energy in 2001 (NCI, 2002). The energy savings of fiber optics systems depends on the magnitude of the improvement in efficacy and the level of market penetration. Assuming the current level of technology, replacing all incandescent reflector lamps (~12 lm/W source, ~10 lm/W fixture) with fiber optic systems (~80 lm/W source, > 40 lm/W fixture) will result in an annual energy savings potential of 0.1 quad, a 75% reduction in energy consumption.
Performance Information: Data and Source
The light output of a reflector lamp is directional. Describing its light output in terms of both quantity and distribution provides the most useful information for maximum utilization in its intended application. A candlepower distribution curve provides the greatest detail, but a center beam candlepower (CBCP) rating and beam angle are sufficient to characterize its output. The CBCP is the maximum intensity of the light in candelas (cd). The beam angle (BA) is the angle in which the intensity does not fall below 50% of its maximum value. Table 4-15below shows one such comparison.
Table 4-15: Light Output Comparison, Incandescent Reflector Lamp versus Fiber Optic
Type CBCP BA Lamp Power Driver Power Total Power
MR16, EXZ 2700 25 50 5 55
Fiber Optic, EXZ1 3393 25 12 1 13 Source: GE technical catalogue 12/96 page 11 (GE, 1996), fiberstars.com Itl# 54430 (Fiberstars, 2004a). 1 Unit has six fiber optic spots per illuminator.
Over the last five years, significant advances have been made in the ability to couple light from light sources for use with fiber optics. There are accent lights that provide the same utility (equivalent CBCP, BA, and intensity) as that of current incandescent reflector lamps. These systems have a fixture efficacy of over 40 lm/W, based on a metal halide light source of 80 lm/W (Fiberstars, 2004a).
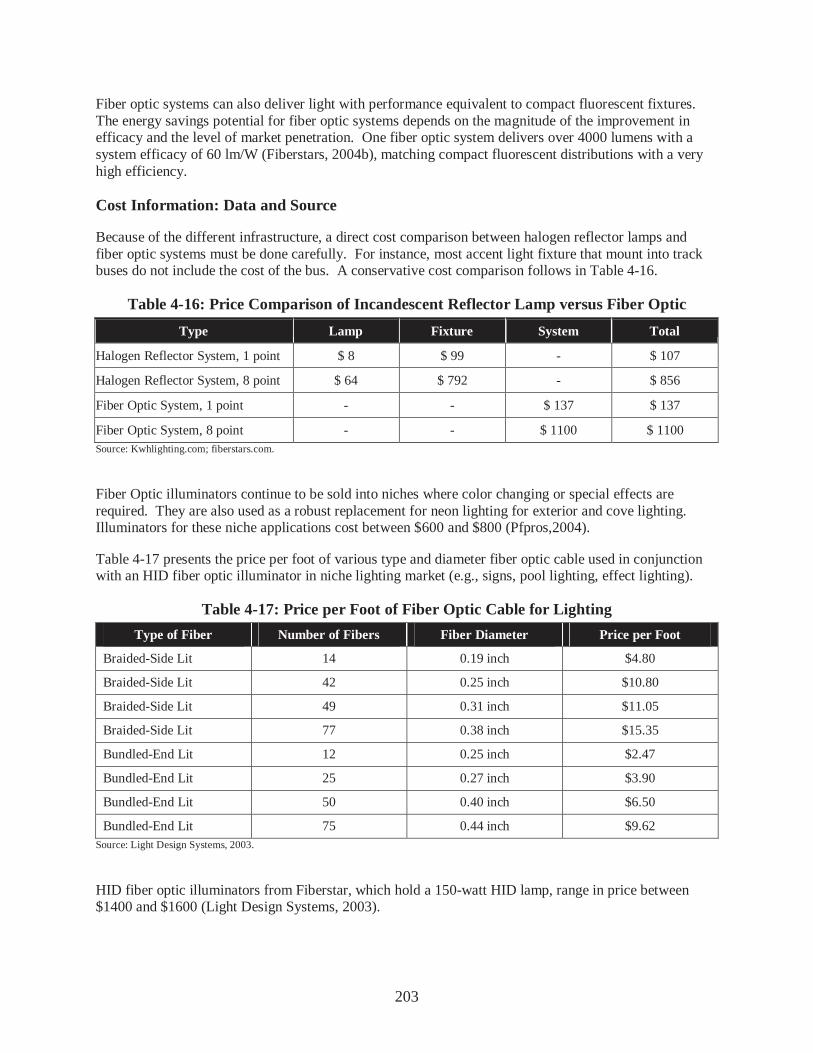
203
Fiber optic systems can also deliver light with performance equivalent to compact fluorescent fixtures. The energy savings potential for fiber optic systems depends on the magnitude of the improvement in efficacy and the level of market penetration. One fiber optic system delivers over 4000 lumens with a system efficacy of 60 lm/W (Fiberstars, 2004b), matching compact fluorescent distributions with a very high efficiency.
Cost Information: Data and Source
Because of the different infrastructure, a direct cost comparison between halogen reflector lamps and fiber optic systems must be done carefully. For instance, most accent light fixture that mount into track buses do not include the cost of the bus. A conservative cost comparison follows in Table 4-16.
Table 4-16: Price Comparison of Incandescent Reflector Lamp versus Fiber Optic
Type Lamp Fixture System Total
Halogen Reflector System, 1 point $ 8 $ 99 - $ 107
Halogen Reflector System, 8 point $ 64 $ 792 - $ 856
Fiber Optic System, 1 point - - $ 137 $ 137
Fiber Optic System, 8 point - - $ 1100 $ 1100 Source: Kwhlighting.com; fiberstars.com.
Fiber Optic illuminators continue to be sold into niches where color changing or special effects are required. They are also used as a robust replacement for neon lighting for exterior and cove lighting. Illuminators for these niche applications cost between $600 and $800 (Pfpros,2004).
Table 4-17 presents the price per foot of various type and diameter fiber optic cable used in conjunction with an HID fiber optic illuminator in niche lighting market (e.g., signs, pool lighting, effect lighting).
Table 4-17: Price per Foot of Fiber Optic Cable for Lighting
Type of Fiber Number of Fibers Fiber Diameter Price per Foot
Braided-Side Lit 14 0.19 inch $4.80
Braided-Side Lit 42 0.25 inch $10.80
Braided-Side Lit 49 0.31 inch $11.05
Braided-Side Lit 77 0.38 inch $15.35
Bundled-End Lit 12 0.25 inch $2.47
Bundled-End Lit 25 0.27 inch $3.90
Bundled-End Lit 50 0.40 inch $6.50
Bundled-End Lit 75 0.44 inch $9.62 Source: Light Design Systems, 2003.
HID fiber optic illuminators from Fiberstar, which hold a 150-watt HID lamp, range in price between $1400 and $1600 (Light Design Systems, 2003).

204
Non-Energy Benefits of Technology
A fiber optic based general illumination system with centralized generation of light has safety advantages over other more conventional light sources that require electricity to locally power its light source. The light is generated at a central location, and the fiber only acts as a transport system. Because the fiber transports lights in its pure form without any transformations, there is no chance of a short circuit in the fiber network causing any damage or the chance of electrocution. Also, a fiber based lighting system would have virtually no electromagnetic radiation associated with the fiber transport network. In addition, fibers do a very good job of filtering out most UV and IR radiation. Therefore, applications sensitive to UV and IR radiation (i.e., a museum with delicate artwork) would benefit from a fiber based lighting system. Because fiber optic systems form their beams by imaging a collimated source, fixtures can be designed with almost no uncontrolled waste light (no glare).
Notable Developers/Manufacturers of Technology
Most research of optical fibers deals with communications (Corning, JBS Uniphase) and the amount of work done with regards to general illumination is proportional to the market size (Narendran et al., 1999). 3M (through a partnership with Lumenyte), Rohm & Haas, Mitsubishi, and Fiberstars (Jenson, 2002) have all made considerable gains in fiber performance & cost over the last 5-8 years. Fiberstars has developed a new process for extruding fiber which gives permanent high performance and consistent quality. They also developed high efficiency systems around new optics and ballasts (Pfpros, 2004). Breault and Optical Research Associates are optical engineering consultants which have helped various companies improve the coupling efficiency of fiber optic systems (Fiberstars, 2004d). .
Peak Demand Impact Potential
Part of the energy consumption would be coincident with peak, and an improvement in system efficacy would result in peak demand reduction. In addition, during peak demand summer periods, fiber optic system could decrease a building’s internal heat load, reducing the energy consumed by the air conditioning system.
Promising Applications
Applications that would benefit from a light system where the actual light source and drive electronics are located elsewhere would be potential purchasers of fiber optic lighting systems. For example, Ford is considering the use of fiber optic HID systems in their automobiles. Ford says that the fibers allow engineers to play with the spectral content of light and select that which is easiest on the eye while best illuminating the road ahead (Wards, 2002).
Also, places such as museums would benefit from fiber systems. The fibers enables precise placement of light in a smooth pattern. In addition, the ability of fibers to filter light enable engineers to remove harmful UV and IR radiation, leaving only visible light that will not damage delicate paintings and objects.
Locations that operate very sensitive equipment could also benefit from fiber-based lighting. Since the light source and electronics can be stored remotely and the fiber network emits no electromagnetic radiation while transporting light, the impact on instruments sensitive to electromagnetic interference is minimal.
Applications that require lighting to operate under a highly corrosive or extreme environment may benefit from fiber-based lighting. Since glass and plastic fibers are highly resilient to oxidation, they could

205
withstand prolonged exposure to corrosive elements such as sodium, such as in a marine environment (Narendran et al., 1999).
Perceived Barriers to Market Adoption
Fiber optic systems sold into the general illumination market have the same barriers that metal halide lamps have when compared to halogen or fluorescent. These issues include high first cost, the need for dimmable or instant re-strike ballasts, reduced color shift, and improved color rendering. Fiber optic systems have the added barrier of training the industry to use a different infrastructure. As with any new lighting technology, unique fixtures need to be designed to apply efficient fiber optics in all markets.
Fiber optic systems which are sold into niche markets based on their ability to deliver light that can change color are vulnerable to improved solid state lighting (SSL) systems. SSL can tailor its spectral content easily and precisely, and can change color quicker than fiber optics systems. SSL also enables precise placement of light in a smooth pattern.
Data Gaps and Next Steps
Fibers are already very efficient at transporting light. For fiber-based lighting systems to compete, the cost of fibers and coupling systems must become competitive with alternative systems. Most modern fiber research is associated with developing lower cost fiber manufacturing processes that produce fiber of even higher optical efficiency.
The greatest improvements in efficiency have come at the coupling where the light enters the fiber. Currently, coupling efficiencies typically range from 50 – 80 percent depending upon the structure of the coupling system (Breault, 2003b). The highest efficiency commercially available systems have shown coupling efficiencies in excess of 85% (Fiberstars, 2004e). Manufacturers need to achieve higher coupling efficiencies to improve the overall efficacy of the system.
The most efficient fiber systems have only a few different output fixtures that they are compatible with. The number of fixture choices will need to increase drastically to allow wide spread proliferation of this technology.
References
3M, 2004. Accessed on 4/7/04 at http://products3.3m.com/catalog/us/en001/architecture_construction/-/node_6PQF7LG0T0be/root_GST1T4S9TCgv/vroot_S5DD9G7583ge/gvel_6DJX5C985Dgl/theme_us_lightingproducts_3_0/command_AbcPageHandler/output_html.
3M, 1999. “Illumination Waveguide and Method for Producing Same” US patent 5,898,810.
Breault, 2003a. Source Modeling. Breault; accessed on December 30, 2003 at http://www.breault.com/html/esvc_cap_srcs.html.
Breault, 2003b. “Experienced in Coherent and Diffractive Engineering.” Coherent/Diffractive Optical Systems Engineering. Breault; accessed on December 30, 2003 at http://www.breault.com/html/esvc_cap_cohopsys.html.
Davenport et al., 2004. “Efficient Fiber Optic Lighting”, EEI National Accounts Workshop, 3/23/2004 Huntington Beach, CA.
Ferzacca and Narendran, 1997. “Presenting Performance Data of End Emitting Fiber Optic Lighting Systems.” Ferzacca and Narendran. Illuminating Engineering Society of North America 1997 Annual Conference Proceedings, pp. 150-169. New York, NY.

206
Fiberstars, 2004a. Accent Light Performance accessed on 4/7/04 at http://www.fiberstars.com/revolution/ITL54430.pdf.
Fiberstars, 2004b. Compact Fluorescent Replacement Accessed on 4/7/04 at http://www.fiberstars.com/revolution/Itl51256.pdf.
Fiberstars, 2004c. Efficient Fiber Optic System Quote accessed on 4/7/04 at http://www.fiberstars.com/Merchant2/0412ds845w.htm.
Fiberstars, 2004d. Features of Modern Fiber Optic Illuminators accessed on 4/7/2004 http://www.fiberstars.com/focusefo/032604a.htm.
Fiberstars, 2004e. Optical Coupling Efficiency details accessed on 4/7/2004 http://www.fiberstars.com/revolution/LF_EFO.pdf.
GE, 1996. GE Technical Catalogue 12/96 page 11.
Jenson, 2002. "Continuously Extruded Large Core Fiber" Presented at "American Society of Composites - 17th Technical Conference", October 20th, 2002 West Lafayette, IN.
Light Design Systems, 2003. Price List. Light Design Systems; accessed on December 31, 2003 at http://www.lightdesignsystems.com/price.htm#fiber.
Magiclite, 2004. Features of Modern Fiber Optic Fixtures accessed on 4/7/2004 http://www.magiclite.com/CARO/CaroFr.html.
Narendran et al., 1999. “Propagation Characteristics of Polychromatic Light Through Polymer Optical Fibers.” N. Narendran, N. Maliyagoda, and R. Levin. Illuminating Engineering Society of North America 1999 Annual Conference: Proceedings, pp. 561-574.
ORA, 2004. Optical Modeling services accessed on 4/7/2004 at http://www.opticalres.com.
Pfpros, 2004. Niche Lighting Illuminator Cost accessed on 4/7/2004 at http://www.pfpros.com/fiberoptics/illuminators/6000%20ill/iluminators6000.html.
Rohm & Haas, 1995. “Flexible Light Pipe, Cured Composite and Processes for Preparation Thereof” US patent 5,406,641.
Wards, 2002. “Smart Headlamps Could Keep the Glare Off Drivers.” Barbara McClellan. WardsAuto.com. May 23, 2002.
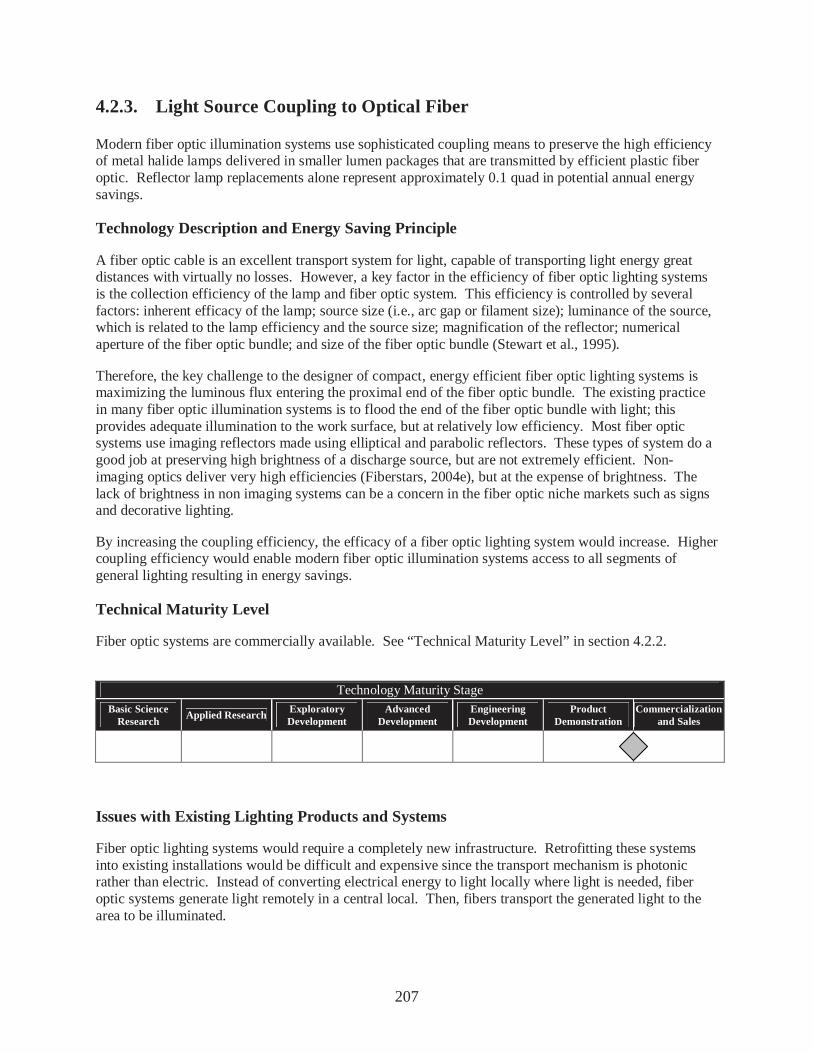
207
4.2.3. Light Source Coupling to Optical Fiber
Modern fiber optic illumination systems use sophisticated coupling means to preserve the high efficiency of metal halide lamps delivered in smaller lumen packages that are transmitted by efficient plastic fiber optic. Reflector lamp replacements alone represent approximately 0.1 quad in potential annual energy savings.
Technology Description and Energy Saving Principle
A fiber optic cable is an excellent transport system for light, capable of transporting light energy great distances with virtually no losses. However, a key factor in the efficiency of fiber optic lighting systems is the collection efficiency of the lamp and fiber optic system. This efficiency is controlled by several factors: inherent efficacy of the lamp; source size (i.e., arc gap or filament size); luminance of the source, which is related to the lamp efficiency and the source size; magnification of the reflector; numerical aperture of the fiber optic bundle; and size of the fiber optic bundle (Stewart et al., 1995).
Therefore, the key challenge to the designer of compact, energy efficient fiber optic lighting systems is maximizing the luminous flux entering the proximal end of the fiber optic bundle. The existing practice in many fiber optic illumination systems is to flood the end of the fiber optic bundle with light; this provides adequate illumination to the work surface, but at relatively low efficiency. Most fiber optic systems use imaging reflectors made using elliptical and parabolic reflectors. These types of system do a good job at preserving high brightness of a discharge source, but are not extremely efficient. Non-imaging optics deliver very high efficiencies (Fiberstars, 2004e), but at the expense of brightness. The lack of brightness in non imaging systems can be a concern in the fiber optic niche markets such as signs and decorative lighting.
By increasing the coupling efficiency, the efficacy of a fiber optic lighting system would increase. Higher coupling efficiency would enable modern fiber optic illumination systems access to all segments of general lighting resulting in energy savings.
Technical Maturity Level
Fiber optic systems are commercially available. See “Technical Maturity Level” in section 4.2.2.
Technology Maturity Stage
Basic Science Research
Applied Research Exploratory Development
Advanced Development
Engineering Development
Product Demonstration
Commercialization and Sales
Issues with Existing Lighting Products and Systems
Fiber optic lighting systems would require a completely new infrastructure. Retrofitting these systems into existing installations would be difficult and expensive since the transport mechanism is photonic rather than electric. Instead of converting electrical energy to light locally where light is needed, fiber optic systems generate light remotely in a central local. Then, fibers transport the generated light to the area to be illuminated.

208
Technical Potential and Primary Energy Consumption Impact
See “Technical Potential and Primary Energy Consumption Impact” in section 4.2.2 for details.
Assuming the current level of technology, replacing all incandescent reflector lamps with fiber optic systems will result in an annual energy savings potential of 0.12 quad. However, increasing coupling efficiency could enable fiber optics systems to achieve 60 lm/W, which would result in energy savings of approximately 0.1 quad.
Performance Information: Data and Source
Currently, coupling efficiencies typically range from 50% to 80% depending upon the structure of the coupling system (Breault, 2003b). Coupling based on non-imaging optics can achieve greater efficiencies, even above 90% (Fiberstars, 2004e).
Also, see “Performance Information: Data and Source” in section 4.2.2.
Cost Information: Data and Source
See “Cost Information: Data and Source” in section 4.2.2.
Non-Energy Benefits of Technology
A fiber optic based general illumination system with centralized generation of light has safety advantages over other more conventional light sources that require electricity to locally power its light source. The light is generated at a central location, and the fiber only acts as a transport system. Because the fiber transports lights in its pure form without any transformations, there is no chance of a short circuit in the fiber network causing any damage or the chance of electrocution. In addition, a fiber based lighting system would have virtually no electromagnetic radiation associated with the fiber transport network. Fibers also do a very good job of filtering out most UV and IR radiation. Therefore, applications sensitive to UV and IR radiation (i.e., a museum with delicate artwork) would benefit from a fiber based lighting system. Because fiber optic systems form their beams by imaging a collimated source, fixtures can be designed with minimal glare.
Notable Developers/Manufacturers of Technology
Most research of optical fibers deals with communications (Corning, JBS Uniphase) and the amount of work done with regards to general illumination is proportional to the market size (Narendran et al., 1999). 3M (through a partnership with Lumenyte) (3M, 1999; 3M,2004), Rohm & Haas (Rohn&Haas,1995), Mitsubishi, and Fiberstars (Jenson, 2002) have all made considerable gains in fiber performance & cost over the last 5-8 years. Fiberstars develops high efficiency systems around new optics and ballasts (Pfpros, 2004). Wavien (source) is another company developing cutting edge coupling optics systems (Wavien, 2004). Breault and Optical Research Associates are optical engineering consultants who help various companies improve the coupling efficiency of fiber optic systems (Fiberstars, 2004d).
Peak Demand Impact Potential
Part of the energy consumption would be coincident with peak, and an improvement in system efficacy would result in peak demand reduction. In addition, during peak demand summer periods, fiber optic system could decrease a building’s internal heat load, reducing the energy consumed by the air conditioning system.

209
Promising Applications
Applications where end users are constrained to the amount of power to be used for accent lighting are a large potential market for the most efficient fiber optic systems. Applications that would benefit from a light system where the actual light source and drive electronics are located elsewhere are also potential purchasers of fiber optic lighting systems.
Places such as museums would also benefit from fiber optic lighting systems. The fibers enables precise placement of light in a smooth pattern. In addition, the ability of fibers to filter light enable engineers to remove harmful UV and IR radiation, leaving only visible light that will not damage delicate paintings and objects.
Locations that operate very sensitive equipment could also benefit from fiber-based lighting. Since the light source and electronics can be stored remotely and the fiber network emits no electromagnetic radiation while transporting light, it would not impact instruments sensitive to electromagnetic interference.
Applications that require lighting to operate under a highly corrosive or extreme environment may benefit from fiber-based lighting. Since glass and plastic fibers are highly resilient to oxidation, they could withstand prolonged exposure to corrosive elements (i.e., sodium), such as in a marine environment (Narendran et al., 1999).
Perceived Barriers to Market Adoption
See “Perceived Barriers to Market Adoption” in section 4.2.2.
Data Gaps and Next Steps
Fibers are already very efficient at transporting light. For fiber-based lighting systems to compete, the cost of fibers and coupling systems must become competitive with alternative systems. Most modern fiber research is associated with developing lower cost fiber manufacturing processes that produce fiber of even higher optical efficiency.
The greatest improvements in efficiency have come at the coupling where the light enters the fiber. Currently, coupling efficiencies typically range from 50% to 80% depending upon the structure of the coupling system (Breault, 2003b). The highest efficiency commercially available systems have shown coupling efficiencies in excess of 85% (Fiberstars, 2004e). Manufacturers need to achieve higher coupling efficiencies to improve the overall efficacy of the system.
The most efficient fiber systems have only a few different output fixtures that they are compatible with. The number of fixture choices will need to increase drastically to allow wide spread proliferation of this technology.
References
3M, 2004. Accessed on 4/7/04 at http://products3.3m.com/catalog/us/en001/architecture_construction/-/node_6PQF7LG0T0be/root_GST1T4S9TCgv/vroot_S5DD9G7583ge/gvel_6DJX5C985Dgl/theme_us_lightingproducts_3_0/command_AbcPageHandler/output_html.
3M, 1999. “Illumination Waveguide and Method for Producing Same” US patent 5,898,810.
Breault, 2003a. Source Modeling. Breault; accessed on December 30, 2003 at http://www.breault.com/html/esvc_cap_srcs.html.

210
Breault, 2003b. “Experienced in Coherent and Diffractive Engineering.” Coherent/Diffractive Optical Systems Engineering. Breault; accessed on December 30, 2003 at http://www.breault.com/html/esvc_cap_cohopsys.html.
Davenport et al., 2004 “Efficient Fiber Optic Lighting”, EEI National Accounts Workshop, 3/23/2004 Huntington Beach, CA.
Ferzacca and Narendran, 1997. “Presenting Performance Data of End Emitting Fiber Optic Lighting Systems.” Ferzacca and Narendran. Illuminating Engineering Society of North America 1997 Annual Conference Proceedings, pp. 150-169. New York, NY.
Fiberstars, 2004a. Accent Light Performance accessed on 4/7/04 at http://www.fiberstars.com/revolution/ITL54430.pdf
Fiberstars, 2004b. Compact Fluorescent Replacement accessed on 4/7/04 at http://www.fiberstars.com/revolution/Itl51256.pdf
Fiberstars, 2004c. Efficient Fiber Optic System Quote accessed on 4/7/04 at http://www.fiberstars.com/Merchant2/0412ds845w.htm
Fiberstars, 2004d. Features of Modern Fiber Optic Illuminators accessed on 4/7/2004 at http://www.fiberstars.com/focusefo/032604a.htm
Fiberstars, 2004e. Optical Coupling Efficiency details accessed on 4/7/2004 at http://www.fiberstars.com/revolution/LF_EFO.pdf
GE, 1996. GE Technical Catalogue 12/96 page 11
Jenson, 2002. "Continuously Extruded Large Core Fiber" Presented at "American Society of Composites - 17th Technical Conference", October 20th, 2002 West Lafayette, IN.
Light Design Systems, 2003. Price List. Light Design Systems; accessed on December 31, 2003 at http://www.lightdesignsystems.com/price.htm#fiber.
Magiclite, 2004. Features of Modern Fiber Optic Fixtures accessed on 4/7/2004 at http://www.magiclite.com/CARO/CaroFr.html.
Narendran et al., 1999. “Propagation Characteristics of Polychromatic Light Through Polymer Optical Fibers.” N. Narendran, N. Maliyagoda, and R. Levin. Illuminating Engineering Society of North America 1999 Annual Conference: Proceedings, pp. 561-574.
NCI, 2002. US Lighting Market Characterization volume I: National Lighting Inventory and Energy Consumption Estimate. Prepared by Navigant Consulting, Inc. for the Department of Energy. Washington DC. September of 2002.
ORA, 2004. Optical Modeling services accessed on 4/7/2004 at http://www.opticalres.com.
Pfpros, 2004. Niche Lighting Illuminator Cost accessed on 4/7/2004 at http://www.pfpros.com/fiberoptics/illuminators/6000%20ill/iluminators6000.html.
Rohm & Haas, 1995. “Flexible Light Pipe, Cured Composite and Processes for Preparation Thereof” US patent 5,406,641.
Stewart et al., 1995. “Short Arc HID Lamps for Fiber Optic Lighting.” Charles N. Stewart, William H. Lagerway, Douglas M. Rutan, and Daniel C. Briggs. The Society of Automotive Engineers (SAE) Technical Paper Series, 950905. March 7, 1995.
Wards, 2002. “Smart Headlamps Could Keep the Glare Off Drivers.” Barbara McClellan. WardsAuto.com. May 23, 2002.

211
Wavien, 2004. Advanced coupling optics for fiber optics accessed on 4/7/2004 at http://www.wavien.com.

212
4.3. Controls
End users utilize lighting control for two major reasons: aesthetic control, and more commonly, energy management. Energy management controls for lighting systems provide energy and cost savings through the reducing power or reducing time of use. Aesthetic controls give the end user the ability to change the atmosphere of a room through the control of color, light quality, and mood.
The IESNA Lighting Handbook identifies eight strategies for energy management lighting controls: predictable scheduling, unpredictable scheduling, daylighting, brightness balance, lumen maintenance, task tuning, demand reduction, and aesthetic control. Predictable scheduling would be most effective when occupancy schedules are well defined, such as schools, offices and manufacturing plants. Unpredictable scheduling is more appropriate for an environment where occupancy is sporadic, such as a restroom, conference room, or a retail store dressing room. Daylighting can be employed when part of the desired illumination levels can be supplied by daylight, reducing the need for electric lighting. Lightness balance strategies are used in areas where brightness needs to be reduced to eliminate glare and shadows. Employing a lumen maintenance strategy will also save energy over the life of the lamp. Generally, a lighting system is designed to exceed the lighting minimum by 20-35% to account for lumen depreciation, but lumen depreciation control strategy calls for reducing the initial illumination of a new system to the minimum level and as depreciation occurs more power is applied to the lamps to maintain constant output.41 This leads to energy savings over the life of the lamp. In task tuning, the light can be adjusted to provide local illumination as need. Tuning is accomplished by dimming light in areas where less difficult visual tasks occur. Demand reduction can be accomplished by reducing lighting power demands for short time periods at peak demand hours. Aesthetic control strategies provide the means to adjust lighting to suit the purpose and change the mood of the space through switching and dimming, while maintaining visual performance.
There are several lighting control techniques to achieve these strategies, for example, switching or dimming, local or central control, and control automating or zoning. Switching controls can switch lighting loads on and off via relays, switchable circuit breakers, or occupancy sensors. In dimming control, the light level in each zone can change continuously to match the visual requirements of the area. Lighting controls can use either local control or central system control. In local control, each zone is independent of all others. Contrastingly, central systems control many local zones, along with other systems such as HVAC. Timing and sensing devices, photosensors, and occupancy sensors are equipment utilized in these techniques. However, any energy savings strategy must carefully consider its effect on human performance and worker productivity.
The following sections present five technology options relating to lighting control systems.
41 Lighting systems that use linear T8 fluorescent lamps with electronic ballasts have lumen depreciation of only several percent. Accordingly, lumen maintenance controls have nominal impact on energy savings in these types of fluorescent systems.

213
4.3.1. Robust Controls Algorithms
Robust control algorithms is an enabling technology that helps simplify installation and utilization of control systems with the potential to save 0.1 quad of energy annually in the United States.
Technology Description and Energy Saving Principle
An algorithm is a decision making process that determines the output of a system in response to one or more inputs. Two basic types of algorithms are open loop and closed loop. In a closed loop system, information (output) feeds back to the input so the system can better achieve its control objectives. In a lighting control system, the control algorithm dictates the photosensor output as a function of its input. The input to the algorithm is the signal that the sensor reads and the output is the control voltage sent to the ballast or control device. In general, photosensors use integral, open loop proportional, or closed-loop proportional.
In order for lighting controls to work properly, the system must be commissioned properly. Commissioning is “a systematic process that ensures that all elements of the daylighting system perform interactively and continuously according to a documented design intent and the needs of the building owner” (IESNA, 2000). The installer commissions the sensor device by varying the position/orientation of photocells, the time delay, and various set points for the sensor. The difficulty of this process discourages the installation and use of lighting controls. In addition, improper commissioning is the most significant reason automated lighting controls do not perform to expectations, resulting in consumer dissatisfaction. This is also the main cause of the misconception that lighting controls do not work.
While lighting controls can save significant amounts of energy, the difficulty of commissioning them is a significant obstacle to adoption. For this reason, building managers hesitate to incorporate controls into their lighting plans. If the control algorithm included a self-commissioning function, then much of the difficulty, inconvenience, and annoyance would diminish. In addition, a robust algorithm would maximize utilization of available daylight. The increased use of lighting controls with occupancy sensors and photosensors would result in energy savings.
Technical Maturity Level
Technology Maturity Stage
Basic Science Research
Applied Research Exploratory Development
Advanced Development
Engineering Development
Product Demonstration
Commercialization and Sales
Issues with Existing Lighting Products and Systems
Incorporating robust self-commissioning algorithms into current lighting control systems may simplify installation.
Technical Potential and Primary Energy Consumption Impact
This technology would primarily benefit the commercial sector, mostly in office buildings (LRC, 2002a). Office buildings consume 21% of the electricity in the commercial sector (NCI, 2002). The LRC

214
estimated a 29% savings (Bierman, 2003) in office lighting from existing installations, which would result in 0.1 quad of energy saved annually. Table 4-18 shows the results of these calculations.
Table 4-18: Technical Potential Energy Savings of Self-Commissioning Algorithms
Technology Sectors Current Consumption
Percent Savings Potential Savings
Robust Control Algorithms Fluorescent Office Lighting 0.5 quad 29 % 0.1 quad
Performance Information: Data and Source
As an example, the LRC installed its self-commissioning photosensor in nine offices in Connecticut to measure energy savings and evaluate the performance of the product. The result of a sixth month demonstration/evaluation showed an average office energy savings of 29% with the photosensor compared to a manual on/off switch.. While these products are not commercially available, commercialization efforts are underway (Bierman, 2003). Typical energy savings are in the range of 30% (Morgan, 2003).
Cost Information: Data and Source
No mass production cost estimates are available for control systems with robust self-commissioning algorithms. A typical price for discrete photosensors is approximately $140. A photosensor coupled with a controller would cost about $600 to $700.
Non-Energy Benefits of Technology
The implementation of a robust algorithm assures that the system will work properly and that there will always be sufficient light in the appropriate areas. Surveyors also hypothesize that the lack of light in interior offices during the winter has negative consequences on worker performance (Morgan, 2003). Workers in windowed offices show better rates of productivity than workers in interior offices, suggesting that bright light during the day is an important part of worker productivity because of the effects on people’s internal biological clocks (Morgan, 2003).
Notable Developers/Manufacturers of Technology
An example of a system that uses a robust algorithm is a self-commissioning sensor. It automatically calibrates itself, operates wirelessly for ease of use, can commission itself in less than two minutes at any time when relatively constant daylight is present, features automatic on/off switching and dimming, manual on/off, and user override (Bierman, 2003). They also investigated the effectiveness of various photosensor control algorithms and its impacts on energy consumption.
Controls manufacturers developing this for products include Philips Lighting, Echelon Ledalite, Lutron, Starfield Controls, The Watt Stopper, Energy Savings Inc., Honeywell, and Tridonic.
Peak Demand Impact Potential
The energy consumption occurs during peak hours. Thus, a robust control algorithm system could consider peak demand hours in its algorithm to further impact energy consumption during peak demand.
215
Promising Applications
The primary application for a robust control algorithm (e.g., a self-commissioning sensor, optimized energy savings algorithm for use with photosensors to take advantage of available daylight) would be commercial office space (Bierman, 2003). It might also be used in a classroom setting or any application where occupancy is intermittent or where daylight is available.
Perceived Barriers to Market Adoption
The high first cost of implementing a control system is a large barrier to market adoption. This technology may require more robust microcontrollers and possibly microprocessors, which adds to the cost of the product.
Data Gaps and Next Steps
Future work for the development of a self-commissioning photosensor includes: integrate photosensor and occupancy sensor for increased energy savings, collect field results and refine design based on field results, and increase market awareness and commercialization (Bierman, 2003).
Although they have been some seminal work on energy savings and (research and) development of robust control algorithms (e.g., self-commissioning controls), no studies show a direct link. Building owners will not implement this type of system without substantial proof of energy savings.
References
Bierman, 2003. “Development and Demonstration of an Improved, Energy-Efficient, Photosensor Lighting Control “ March 31, 2003. Lighting Research Center; accessed on May 10, 2005 at http://www.lrc.rpi.edu/researchTopics/reducingBarriers/pdf/developDemoPhotosensor.pdf.
LBNL, 1997. “Tips for Daylighting with Windows.” Sensors and Controls. Section 8. Lawrence Berkeley National Laboratory; accessed on October 3, 2003 at http://eande.lbl.gov/BTP/pub/designguide.
Morgan, 2003. “Lighting Device Lowers Energy Use, Increases Productivity.” Marilyn Morgan. The Business Review. April 7, 2003; accessed on October 3, 2003 at http://albany.bizjournals.com/albany/stories/2003/04/07/focus5.html.

216
4.3.2. Personal Lighting Controls
The potential energy savings from personal lighting controls is 0.7 quad. Some products are already commercially available.
Technology Description and Energy Saving Principle
Although lighting controls can save significant amounts of energy, the common marketplace perception is that they perform poorly. Difficult commissioning procedures lead to lighting controls that do not function correctly. Building owners and users will simply turn off control systems in frustration, wasting money and eliminating energy savings.
The simplest and most basic way to save energy in lighting is to just manually turn off or dim the lights. If manual control of lighting was even readily available and more accessible, it could encourage users to shut off lights when not in use. For instance, if a person could turn off some or all lights in a room, house, or office from any one location through a Personal Digital Assistant (PDA) or a cell phone without having to go to each lamp or switch individually, the added convenience may encourage people to do so. An infrared, line of sight device, similar to a TV/VCR remote, could control lighting. One could also control lighting from a computer through the Internet.
Possession of these products equates to possession of a mobile light switch, available at any location, at any time. With such ease of access, people can control lighting at their convenience on an as needed basis. As people become more apt to switch lights off, it would result in energy savings.
Technical Maturity Level
Products used for personal lighting controls are commercially available.
Technology Maturity Stage
Basic Science Research Applied Research Exploratory
Development Advanced
Development Engineering Development
Product Demonstration
Commercialization and Sales
Issues with Existing Lighting Products and Systems
Enabling of this function would require installation of appropriate controls hardware (and software) to the existing infrastructure. Because there are no standards in place, there may be issues of compatibility with integration into existing systems (i.e., DALI, BACnet, LonWorks®).
Technical Potential and Primary Energy Consumption Impact
The implementation of personal control over lighting could save energy in offices (incandescent and fluorescent) and in the home (incandescent and fluorescent).
Office buildings consume 21% of the electricity in the commercial sector (NCI, 2002). Using a conservative estimate of 25% savings for an office environment (Lutron, 2001a), the energy savings potential of personal controls over lighting is 0.19 quad annually. Applying the same percent savings to

217
lighting in the residential sector could save an additional 0.56 quad of energy. In total, the potential energy savings from personal lighting controls is 0.7 quad. Table 4-19 details these calculations.
Table 4-19: Technical Potential Energy Savings of Personal Controls Over Lighting
Technology Sectors Current Consumption Percent Savings Technical Potential Energy Savings
Commercial Office - fluorescent/incandescent
0.78 quad 25% 0.2 quad
Residential - fluorescent/incandescent
2.22 quads 25% 0.5 quad
Personal Controls Over
Lighting Total Energy Savings 0.7 quad
Performance Information: Data and Source
In a case study involving Lutron’s PerSONNA wireless control for fluorescent lighting in a small office with computer workstations, the company found that individual users dimmed their lighting from 25% to 75% of full light output (Lutron, 2001a). In another case study, the same controls in an open plan office with design/drafting tables reduced lighting costs by approximately 50% (Lutron, 2001b). These results are further supported by a study that showed people on average chose lower illuminances than recommended practice, which implies that individual controls have potential for energy savings (Boyce et al., 2003).
Cost Information: Data and Source
One application for personal control over lighting is in home. Lutron’s RadioRA Home Dimming System gives the user one-touch control of all his home lighting. Lights can be turned on and off from anywhere, including the car. There are several packages available: the basic lighting control package, the car visor lighting control package, and a 3,500 sq. ft. home lighting control package. The basic lighting control package consists of one 5-button wall-mounted master control, five 600-watt dimmers, and one RF signal repeater. The list price for this package is $1,860 (Lutron, 2003).
The car visor lighting control package consists of one 10-button tabletop master control, five 600W dimmers, two accessory dimmers, one multi-function entry master control, two car visor control transmitters, and one RF signal repeater. The list price for this package is $1,800 (Lutron, 2003).
The 3,500 Square Foot Home Lighting Control Package consists of one 5-button wall-mounted master control, one 10-button tabletop master control, eight 600-watt dimmers, two 1,000-watt dimmers, three accessory dimmers, one RF signal repeater, two car visor control transmitters, and one multi-function entry master control. The list price for this package is $4,046 (Lutron, 2003).
Lutron’s Personna System gives the individual user the ability to point a remote control at their overhead fluorescent lighting to dim it to a comfortable level, without affecting other people’s light. The system consists of a transmitter ($40), a receiver ($89), and would also be used with an Eco10 Ballast ($99). All of these prices are list prices (Lutron, 2003). This system would be employed in an office environment.
Non-Energy Benefits of Technology
With the ability to control lighting individually, office employees can tailor lighting to their liking. This minimizes glare, including the washout of computer screens, which lessens headaches, eyestrain, and

218
blurred vision that some people experience while working (Lutron, 2001b). Additionally, people with individual controls showed more sustained motivation and attention, and found they create a calmer, quieter, more comfortable environment (Boyce et al., 2003; Lutron, 2002a).
Notable Developers/Manufacturers of Technology
Philips Lighting and Echelon Corporation are two major manufacturers of products used for personal controls over lighting. The following controls manufacturers also offer personal dimming systems: Ledalite, Lutron, Starfield Controls, The Watt Stopper, Energy Savings Inc., Honeywell, and Tridonic.
Echelon Corporation develops technology for control architectures to support PDA or cellular control of electrical products, including lighting. They are experimenting with three possible device-control architectures. The first type is a three-tiered architecture. This involves connecting the client (i.e., PDA or cellular phone) over the Internet to a control network server, which in turn, connects the server to a services gateway, which controls the devices. The second type is a two-tier model, which connects the client directly to the services gateway. The third type relies on a server to connect the client to the gateway, but it can be used through any browser (Zukowski, 2001).
Other devices, such as the Pronto IR universal remote introduced by Philips Lighting in 1998, could be used to control individual luminaires
Peak Demand Impact Potential
For applications listed below, most of the energy consumption occurs during peak demand hours. Thus, an improvement in lamp efficacy would result in peak demand reduction.
Promising Applications
Personal control over lighting would provide the most energy savings in a setting where many people are sharing the same area to perform different tasks, such as an office environment. With personal controls over lighting, someone can tailor the light in their area according to personal preference and the task performed. Another promising applications is home use.
Perceived Barriers to Market Adoption
The primary barrier to market adoption is the first cost associated with providing individuals with their own control over lighting, whether it is through a light switch, remote control, or computer system.
Data Gaps and Next Steps
Manufacturers already identified many appropriate interfaces (i.e., PDA, computer, remote control, voice), but transmission methods (wireless, PLC, internet). However, they need to harmonize on protocols. They need to decide if personal lighting controls should be integrated into existing systems and standards (e.g. DALI, BACnet, LonWorks®) or be developed to stand alone. A number of manufacturers are already supporting the Digital Addressable Lighting Interface—a nonproprietary standard that defines interfaces for digital communication among the components of a lighting system (Wisconsin Public Service, 2003). These addressable ballasts can link to local area networks controlled by PCs.

219
References
Boyce et al., 2003. “Lighting Quality and Office Work: A Field Simulation Study.” Peter R. Boyce, Jennifer A. Veitch, Guy R. Newsham, Michael Myer, Claudia Hunter, Judith H. Heerwagen, and Carol C. Jones. Lighting Research Center and National Research Council of Canada, Institute for Research and Constoction. PNNL-14506, December 2003.
Lutron, 2001a. “PerSONNA Case Study: Pro-Tech Industries.” Lutron Electronics; accessed on November 15, 2003 at http://www.lutron.com/personna/ptcasestudy.htm.
Lutron, 2001b. “PerSONNA Case Study: GEHO Architects.” Lutron Electronics; accessed on November 15, 2003 at http://www.lutron.com/personna/gehocasestudy.htm.
Lutron, 2003. Personal communication with Lutron representative. Lutron on November 25, 2003.
NCI, 2002. U.S. Lighting Market Characterization Volume I: National Lighting Inventory and Energy Consumption Estimate. Prepared by Navigant Consulting, Inc. for the Department of Energy. Washington D.C. September 2002.
Wisconsin Public Service, 2003. “Lighting: Personal Dimming Controls.” Platts Research and Consulting. Wisconsin Public Service; accessed on November 15, 2003 at http://www.wisconsinpublicservice.com/business/eba_38.asp#manufacturers.

220
4.3.3. Standard Protocols for Lighting Products
The technical potential annual energy savings from development and adoption of a standard controls platform is 1.3 quads.
Technology Description and Energy Saving Principle
A protocol defines a standard for communication. Many lighting companies use proprietary lighting control protocols in order to maintain predominance in the marketplace. However, it rapidly became expensive to produce ballasts with every manufacturer’s neuron chip or royalty based software embedded in the ballast (Purdy, 2002). Thus, in an effort to standardize a lighting control protocol, European manufacturers developed a non-proprietary protocol for fluorescent lighting systems called DALI (Digital Addressable Lighting Interface) (Berjansky, 2002). Since DALI was a joint effort by many companies to develop a protocol, not just one, its acceptance in the marketplace is less controversial.
Before the introduction of DALI, lighting controls historically used analog (1 to 10-volt) interfaces. DALI uses digital signaling instead, which allows bi-directional information flow, and tracks information like energy level, luminaire state (on/off), and lamp and ballast condition (Purdy, 2002). Standardized ballasts designed to meet the DALI protocol, even between different manufacturers, guarantees consistent performance and interchangeability. These ballasts can independently turn off or dim in response to ambient light, occupancy, time, or pre-set lighting scenes through one data line (Berjanksy, 2002). Data is stored on a chip inside the ballast. Ballasts connect with wires to form a lighting loop, or bus, of up to 64 ballasts. DALI assigns an address to each ballast so that it can be controlled individually or grouped into configuration/scenes. The system can use interfaces, such as a local PC or push-button switches, to control occupancy sensors, photosensors, individual occupancy, or to select pre-programmed scenes (DiLouie, 2002).
A standard protocol in itself does not create the energy savings, but enhanced energy savings comes from the finer granularity possible. The use of a standard lighting control protocol will make it cheaper and easier for building owners to employ a lighting control system. A standard controls platform such as DALI is an enabling technology that provides: occupancy sensing, ability to tune light output, enhance daylight utilization, scheduling, and added functionality of load shedding. Therefore, a lighting control system that enables the user to effectively and efficiently utilize lighting in a building through implementing occupancy sensing, tuning and daylighting would result in energy savings.
Technical Maturity Level
DALI is an IEC standard developed in the mid 1990s as part of IED Standard 929. The first commercial products employing this standard became available in 1998. European ballast manufacturers were the first to adopt DALI as a standard. The standard is now making its way to the U.S., and DALI compatible ballasts have hit the market (DiLouie, 2002).
DALI ballasts are available in one or two lamp modules that can operate T5, T5HO, T8 linear, and compact fluorescent lamps (DiLouie, 2002). DALI compatible digital ballasts and DALI interfaces are in development for HID, incandescent, and low-voltage halogen systems (DiLouie, 2002). Although DALI is available domestically, the U.S. has not accepted DALI as a standard.

221
Technology Maturity Stage Basic Science
Research Applied Research Exploratory Development
Advanced Development
Engineering Development
Product Demonstration
Commercialization and Sales
Issues with Existing Lighting Products and Systems
If there is an existing analog dimming system, then it is only necessary to replace existing ballasts with DALI ballasts and a lighting controller (Berjansky, 2002). It is also notable that DALI is compatible with most building management systems (Berjansky, 2002). In preexisting installations, all wiring, ballasts, and controls would need upgrading for use with the DALI interface.
Technical Potential and Primary Energy Consumption Impact
All non-residential (commercial and industrial) sectors that use fluorescent and incandescent technologies could incorporate the DALI system. It is unlikely that this system would implement with current HID systems since they almost exclusively use magnetic ballasts. Developers of the DALI protocol claim that its implementation can lead to 30% to 60% energy savings (DiLouie, 2003). Therefore, a standard platform for controls would result in at least a 1.3 quad savings.
Performance Information: Data and Source
Developers of the protocol claim that implementation of a DALI system can lead to 30% to 60% energy savings (DiLouie, 2003).
Cost Information: Data and Source
Table 4-20 illustrates the differential between the list price of standard electronic ballasts and electronic dimming ballasts.
Table 4-20: Price Information, Dimming Ballast vs. Non-Dimming Ballast
Electronic Ballast Types Price
Dimming Ballast $28.55
T5 HO Electronic Ballast $16.22
32-watt 48T8 Instant-Start Ballast $9.11
69-watt 96T8 Instant-Start Ballast $13.95
32-watt 48T8 Rapid-Start Ballast 12.27
800mA Rapid-Start Ballast 34.26 Source: DOC, 2004.
A glance at some Internet vendor list prices shows that price of DALI compatible ballasts is higher than for non-DALI ballasts, two to five times higher in some cases (Sylvania, 2003; Kwhlighting.com, 2003).

222
Non-Energy Benefits of the Technology
The greatest benefit of a standard platform for lighting controls is flexibility. The control can be configured so that an individual can control the luminaires serving their workspace based on task, available daylight, and occupancy. Additionally, a standard platform for controls eliminates the need for rewiring if building layouts or utilization change (DiLouie, 2002).
The fixtures in a digital network continually provide information to the central computer. This provides the maintenance crew with immediate updates to the condition of all components in the system so they immediately know where and when a lamp or ballasts needs replacing (DiLouie, 2003).
Notable Developers/Manufacturers of the Technology
There are two industries impacted by a controls protocol: ballast manufacturers and controls manufacturers. Controls manufacturers in support of DALI technology are Lithonia, Leviton, The Watt Stopper, Lightolier, and Lutron (DiLouie, 2002). Another manufacturer, Echelon, developed a proprietary building control protocol, called LonWorks®. Although LonWorks® is a complete building controls system to manage all aspects of a building (e.g., HVAC), its lighting component is an alternative to DALI (Echelon, 2003). Ballast manufacturers include OSRAM Sylvania, Philips Lighting, Tridonic, Trilux, and Helvar.
Peak Demand Impact Potential
Lighting controls can significantly influence energy consumption during times of peak energy demand. A standard platform for lighting controls would encourage the use of photosensor-occupancy sensor dimming. Energy consumption during times of peak demand would decrease if lamps were dimmed or switched off. In addition, the system can link to utilities, which can reduce power to the lighting system when peak demand begins to exceed capacity.
Promising Applications
A standard platform for controls, such as DALI, is ideal for situations where the lighting needs change often. Applications include small or open offices where lighting can be individually controlled, conference rooms and classrooms where different lighting scenes are required, and retail spaces where merchandising and layout change often (DiLouie, 2002). It is generally suited for large installations, as it requires significant planning and time to program the system, and requires a certain amount of maintenance.
Perceived Barriers to Market Adoption
The most significant barriers to market adoption are high first cost to implement the system and complicated commissioning procedures.
Data Gaps and Next Steps
The DALI protocol is an IEC standard and is supported by NEMA. NEMA and the CEC are working on a standard for DALI controls that will make the control devices programmable. All major controls and ballast manufacturers need to adopt and endorse a standard. That would make ease the burden on building management companies, contractors, and engineers regarding issues of compatibility and obsolescence.

223
References
Berjansky, 2002. “Digital Addressable Lighting Interface Protocol.” AutomatedBuildings.com Interview with Stuart Berjansky. Advance Transformer Co; accessed on September 22, 2002 at http://www.automatedbuildings.com/news/sep02/interviews/dali.htm.
DiLouie, 2002. “Could DALI be Lighting’s Next Breakthrough?” Craig DiLouie. Energy Users News; accessed on September 22, 2003 at http://www.energyusernews.com/CDA/ArticleInformation/features/BNP__Features__Item/0,2584,76083,00.html.
DiLouie, 2003. “DALI: What’s all the Buzz About?” Craig DiLouie. Education-Key Issues. Lighting Controls Association; accessed on September 22, 2003 at http://www.aboutlightingcontrols.com/education/dalibuzz.html.
DOC, 2004. “Fluorescent Lamp Ballasts – Fourth Quarter 2003.” Current Industrial Reports. MQ335C(03)-4. U.S Census Bureau, Department of Commerce. February 2004.
LRC, 2003. “Recent (and Upcoming) Testing Results.” Presentation. Lighting Research Center; accessed on September 26, 2003 at http://www.energy.ca.gov/pier/buildings/presentations/Product_Testing-generic.pdf.
NCI, 2002. U.S. Lighting Market Characterization Volume I: National Lighting Inventory and Energy Consumption Estimate. Prepared by Navigant Consulting, Inc. for the Department of Energy. Washington D.C. September 2002.
Purdy, 2002. “Energy Efficient Lighting - Benefits of a New Technology.” Presentation. Tridonic, Inc.; accessed on September 26, 2003 at http://www.rebuild.org/attachments/presentations/TridonicCTACPresentation21302.ppt.

224
4.3.4. Standardized Building Automation Systems
The potential energy savings from building lighting control interfaces is 1.6 quads. The controls interface is an enabling technology that allows all the different components of the lighting system to communicate and execute an effective and efficient lighting schedule.
Technology Description and Energy Saving Principle
Building control has historically been a fragmented industry. Control equipment manufacturers face a choice of building control interfaces to utilize in their products. The fear is that a particular system would become useless if industry adopts a different standard protocol. Although LonWorks® and BACnet are competing protocols focused on HVAC, they are the two prevalent data communication networks for building controls (which includes lighting).
BACnet stands for Building Automation Control Network, and is a data communication protocol for building automation and control networks. BACnet enables systems from different manufacturers to share information and allows control by a single seat user interface (Tech Systems, 2003). Developed by the American Society of Heating and Refrigeration Engineers (ASHRAE) under “ANSI/ASHRAE standard 135-1995,” it is a non-proprietary set of rules for communication between devices (Polarsoft, 2002). The rules are written specifications which detail what is required to conform to the protocol, ranging from what kind of cable to use to how to form a particular request or command in a standard way (Tech Systems, 2003). The microprocessors of compatible devices understand the same language and conform to BACnet standards. BACnet control systems can control buildings with small or large systems, ranging from HVAC to security lighting (Polarsoft, 2002).
LonWorks®, a networking platform created by Echelon Corporation, employs a different set of rules for communication, using local operation networks (LON). It is possible for any control company to manufacturer and sell LonWorks® compatible products that can sense, process, communicate, and control many applications, including lighting (IEC, 2002). Each device contains a Neuron chip, which is an integrated circuit that combines the communications protocol, microprocessor, operating system, and flexible I/O. Devices manufactured with a Neuron chip can share information on a control network. This allows individual devices to become independent control networks, without dependency on centralized control panels or communication gateways (Tech Systems, 2003).
The building control interface allows all the different components of the lighting system to communicate and execute an effective and efficient lighting schedule. A building controls interface provides: occupancy sensing, ability to tune light output, enhance daylight utilization, scheduling, and added functionality of load shedding.
If the industry could agree on one standard, then various products from different manufacturers could be designed to be interoperable. Building designers would then have the choice to implement any product, based on its performance and cost, instead of being tied to specific proprietary products (PolarSoft, 2002). The increased selection and lower cost would encourage the installation and use of building control systems, resulting in energy savings.
Technical Maturity Level
In 1987, ASHRAE undertook the challenge to develop BACnet to govern communication between various devices used in building control systems, and released the standard in 1996.42 In 1989, Echelon 42 ASHRAE 90.1 includes occupancy sensing and scheduling as part of its building energy code.

225
Corporation introduced the LonWorks® platform, which may offer some advantages for products outside of HVAC, such as lighting controls (Hartman, 2002).
Technology Maturity Stage
Basic Science Research Applied Research Exploratory
Development Advanced
Development Engineering Development
Product Demonstration
Commercialization and Sales
Issues with Existing Lighting Products and Systems
Both lighting control products can work either interfaced with the building control network, for which they are designed, or as an independent discrete system. However, a product designed using LonWorks® will not understand messages from a BACnet control network, and vice versa.
Technical Potential and Primary Energy Consumption Impact
A standardized interface to building controls would encourage building owners to incorporate lighting controls into building design because there would be no fear of choosing a system that may eventually become obsolete. Building controls would typically be introduced into the commercial sector, and perhaps parts of the industrial sector. Assuming a market penetration of 100%, and energy savings of 30% (LRC, 1997), the implantation of building controls could save 1.6 quads annually. Table 4-21 shows the results below.
Table 4-21: Technical Potential Energy Savings of Building Controls Systems
Technology Sectors Current Consumption Percent Savings Potential Savings
All Commercial 4.21 quads 30% 1.3 quads
All Industrial 1.17 quads 30% 0.3 quad Develop Standardized Interface to Building
Controls Total Energy Savings 1.6 quads
Performance Information: Data and Source
With the use of a building control system, the Center for Analysis of Demonstrated Energy Technologies estimates that there would be a 30-50% building-wide reduction in energy consumption. Metra Corporation claims 25% reduction in their utility bill using a building automation system (LRC, 1997). This incorporates savings from occupancy sensors, programmable timers, and photosensors. Scheduling alone could contribute up to 30% to the total energy savings.
Cost Information: Data and Source
An example of a system that can integrate with a building controls system is Lutron’s Digital microwatt system. Lutron’s Digital microWATT Integrated Lighting Automation System is a web-based lighting control technology for commercial buildings. It combines lighting control technology with web-based software designed to create a system that integrates with and augments any type of building automation or management system (Lutron, 2003). The MicroWATT system has two components: the main unit and an

226
occupancy sensor. The main unit is $390, list price. The occupancy sensor is $156, list price (Lutron, 2003).
Non-Energy Benefits of the Technology
Open system integration can decrease installation and maintenance costs for building controls. Since devices could share information, the total number of devices in an overall system can decrease. For instance, one occupancy sensor in a room could function as a sensor for not only the lighting system, but also for the HVAC and security system (TEC Systems, 2003).
Similarly, once all system components in a building “speak the same language,” a single user interface can replace individual user interfaces for non-integrated systems, streamlining costs and reducing annoyance (TEC Systems, 2003). In addition, utilization of open protocols will allow building owners and developers to continuously purchase systems on a competitive basis, and prevent them from being stuck with original vendors (TEC Systems, 2003).
Notable Developers/Manufacturers of the Technology
ASHRAE and the Echelon Corporation are competing developers of BACnet and LonWorks®, respectively.
Peak Demand Impact Potential
For applications listed below, the energy consumption occurs during peak hours Thus, a decrease in energy consumption due to lighting controls would result in peak demand reduction. In addition, building automation systems could utilize programming to further reduce energy consumption during peak demand for added benefit.
Promising Applications
Building automation networks can be used in varied applications, such as aircraft and railway cars, single family homes or skyscrapers, or other applications, from supermarkets to petroleum plants (Smart Home Forum, 2002).
Perceived Barriers to Market Adoption
Since each of these data communication systems has a strong foothold in the building control market, it will be difficult for one to prevail as the clear industry standard. This may hinder the adoption of building control systems, while the building controls industry waits for a winner to emerge.
Data Gaps and Next Steps
The most beneficial next step would be for the lighting industry to develop and adopt a single standard governing the integration of lighting and control devices with a building controls system. Integration and standardization of the lighting components to a standard would streamline the manufacturing of the various lighting control products. This would encourage development of a greater variety of products while reducing first cost. It would also simplify integration of lighting systems with building controls.
References
Hartman, 2002. “LonWorks: Intrabuilding, Bacnet: Interbuilding.” Thomas Hartman. HPAC Engineering. August 2002.

227
IEC, 2002. “A LonWorks® Technology Tutorial.” IEC Intelligent Technologies; accessed on September 23, 2003 at http://www.connect.nl/tutorial/con_tut.htm.
LRC, 1997. “Interoperable Systems: The Future of Lighting Control.” Robert Wosley. Lighting Research Center. Lighting Futures, Volume 2, Number 2.
NCI, 2002. U.S. Lighting Market Characterization Volume I: National Lighting Inventory and Energy Consumption Estimate. Prepared by Navigant Consulting, Inc. for the Department of Energy. Washington D.C. September 2002.
PolarSoft, 2002. “Frequently Asked Questions.” Learning Center. Polar Soft; accessed on September 23, 2003 at http://www.gopolar.com/BACnet/faq.html.
Smart Home Forum, 2002. “LonWorks®.” Smart Home Forum; accessed on September 23, 2003 at http://www.smarthomeforum.com/start/lonworks.asp?ID=17.
TEC Systems, 2003. “Open/Interoperable Systems and Integration.” TEC Systems, Inc.; accessed on September 23, 2003 at http://www.tec-system.com/Open_Systems_Integration.htm.

228
4.3.5. Standardized Wireless Controls
Standardization of a wireless protocol for lighting controls is an enabling technology whose potential energy saving estimate is 1.6 quads.
Technology Description and Energy Saving Principle
The wiring of control systems for lighting presents logistical problems that increase the expense and hassle of installation (e.g., running wires, cutting holes in ceilings, fastening, etc.). For instance, finding an adequate location for photosensors is a trial and error process and involves work intensive installation procedures. If there were no wires attaching the device to the rest of the lighting equipment, it would greatly simply installation.
Information transmit wirelessly through space by electromagnetic waves at certain frequencies. There are multiple standards that exist for wireless control, both open and proprietary. Three open standards include Bluetooth™, ZigBee, and WiFi. Bluetooth™, a wireless technology developed by a special interest group, is a worldwide specification for small-form factor, low-cost radio solutions that provide links between mobile computers, mobile phones, other handheld devices, and connectivity to the Internet (Bluetooth, 2003). ZigBee, based on a recent IEEE 802.15.4 standard, is another open wireless control standard developed to address the need for a low cost, low power consuming, and reliable standard for wireless networking. Zigbee is a low bandwidth system designed specifically for sensor and control systems. The low energy consumption of the system makes it ideal for home automation applications (ZigBee, 2003). WiFi is another standard that has potential for use in lighting. It offers the greatest bandwidth and transmissions speed, and is fast becoming the de facto standard for wireless devices such as computers, PDAs, and cell phones. These standards are open and free for use by everyone. Proprietary standards, on the other hand, such as LonWorks® and X-10, are privately owned, developed and maintained by commercial companies for profit.
Wireless sensors can be located in places where it is difficult to run wire, which enables lighting control to be more effective in all areas of a building. An industry consensus on a wireless standard and protocol would enhance development and adoption of many new lighting products and control systems. The control systems would make use of occupancy and photosensors, thereby resulting in energy savings.
Technical Maturity Level
Although there are currently no commercially available lighting products that use the WiFi standard, it is the method of choice for many small devices (i.e., computers, PDA, cell phones, etc.) and offers potentially higher transmission capacity at greater distances than either Bluetooth or ZigBee.
Technology Maturity Stage
Basic Science Research
Applied Research Exploratory Development
Advanced Development
Engineering Development
Product Demonstration
Commercialization and Sales

229
Issues with Existing Lighting Products and Systems
Manufacturers can embed wireless connectivity solutions into consumer electronics, including lighting products, with the introduction of small wireless modules. Although this will entail some added complexity and cost to the product, there are no anticipated technical barriers to incorporating wireless standards for control with existing lighting product and systems.
Technical Potential and Primary Energy Consumption Impact
Because this is an enabling technology, the energy savings potential associated with wireless control would be the same as the savings that would result from a wired building control system. Building controls are typically introduced into the commercial sector, and perhaps in some cases into the industrial sector. With market penetration of 100% and energy savings of 30%, the implantation of wireless building controls could save 1.6 quads annually. Table 4-22 shows the results of this calculation below.
Table 4-22: Energy Savings Potential of Wireless Control Standards
Technology Sectors Current Consumption
Percent Savings
Potential Energy Savings
All Commercial 4.21 quads 30% 1.3 quads
All Industrial 1.17 quads 30% 0.3 quad Wireless Control
Standards Total Energy Savings 1.6 quads
Performance Information: Data and Source
The energy savings associated with wireless control would be the same as the savings that would result from a wired building control system. The Center for Analysis of Demonstrated Energy Technologies estimates that there would be a 30-50% building-wide reduction in energy consumption with the use of a wired building control system. Metra Corporation claimed a 25% reduction in their utility bill after installing a building automation system. This includes savings from occupancy sensors, programmable timers, and photosensors (LRC, 1997).
Cost Information: Data and Source
The installation of wiring can represent anywhere from 40% to 80% of the cost of a control project, thus, wireless controls have the potential to significantly reduce the cost and annoyance of installing advanced control systems (DOE, 2003).
Non-Energy Benefits of Technology
Wireless controls for lighting offer increased flexibility over their wired counterparts because sensors and controllers can be moved around without the expense and inconvenience of rewiring. This is especially advantageous in older existing building that would require installation of new wiring. Eventually, wireless controls could also support personal lighting control, even in the workplace (DOE, 2003).
Notable Developers/Manufacturers of Technology
Open wireless standards include Bluetooth, HomeRF, IEEE 802.15.4, WECA (Wireless Ethernet Compatibility Alliance) and ZigBee. Proprietary wireless network standards include (International Home

230
Automation Standards, 2003), LonWorks®, (Echelon Corporation), Shareware (Sharewave, Inc.), and Z-Wave (Zensys) (International Home Automation Standards, 2003). In 2003, a joint venture between two companies, Mobilando and Commil, began marketing a Bluetooth lighting control system called Bluesky for outdoor lighting. A wireless power control module installs at each lamppost. The Bluesky system also has value-added services to clients with standard mobile devices equipped with Bluetooth, such as PDA’s and cell phones (Commil, 2003). Four companies, Invensys, Mitsubishi, Motorola, and Philips, joined to form the ZigBee standard with plans to deploy the first ZigBee compliant products on a large-scale beginning in 2004. There are now over fifty members (ZigBee, 2003).
The Pacific Northwest National Laboratory (PNNL) conducts wireless control research. PNNL is testing a wireless temperature control system in order to determine if wireless control systems in buildings can function well. Because the building is constructed of steel-reinforced-concrete, incorporating wired control systems would be very expensive (Boy, 2002).
The University of California Berkeley formed the Berkeley Wireless Research Center (BWRC) to investigate the present and future design issues necessary to support next generation wireless communication. The BWRC is developing single chip wireless systems in advanced CMOS technology. These chips have the lowest possible energy consumption, (BWRC, 2003).
Peak Demand Impact Potential
For the applications listed below, the energy consumption occurs during peak demand hours. Thus, a decrease in energy consumption due to lighting controls would result in a peak demand reduction.
Promising Applications
Wireless controls could be incorporated into lighting controls in home and commercial lighting applications.
Perceived Barriers to Market Adoption
A quagmire of standards exists because the wireless industry is having difficulty accepting one protocol. Companies that have invested in developing proprietary systems are reluctant to adopt an open wireless standard for fear of losing their competitive advantage. However, adoption of an open wireless standard and protocol would lead to the development of compatible lighting control products, which would benefit the consumer by increasing product availability.
Data Gaps and Next Steps
The current developments in wireless control standards will allow the technology to be used in building control, including lighting.
The following next steps are necessary to accelerate the deployment of wireless sensing and control for buildings:
test and demonstrate the economic and technical performance of wireless technology in commercial buildings,
develop standards and guidelines for testing, specifying, and installing wireless controls, and
integrate wireless sensor/control technology with other energy efficient technologies.
231
References
Bluetooth, 2003. “The Official Bluetooth Website.” Bluetooth; accessed on December 12, 2003 at http://www.bluetooth.com.
Boy, 2002. “Wireless Technologies Bring Comfort to Buildings.” Rob Boy. Pacific Northwest National Laboratory; accessed on December 12, 2003. Available online: http://www.hanford.gov/reach/viewpdf.cfm?aid=956.
BWRC, 2003. Berkeley Wireless Research Center (BWRC); accessed on December 12, 2003 at http://bwrc.eecs.berkeley.edu/Default.htm.
Commil, 2003. “Mobilando and Commil Join Forces for the Development and Marketing of a Revolutionary Bluetooth™ Lighting Control System.” Commil; accessed on December 12, 2003 at http://www.commil.com/html/news.htm#JUNE,19.
DOE, 2003. “Wireless Sensors and Controls.” Research on Emerging Technologies. Building Technologies Program. Office of Energy Efficiency and Renewable Energy. Department of Energy; accessed on December 12, 2003 at http://www.eere.energy.gov/buildings/research/controls/wirelesscontrols.cfm.
LRC, 1997. “Interoperable Systems: The Future of Lighting Control.” Lighting Futures. Volume 2. Number 2; accessed on December 12, 2003 at http://www.lrc.rpi.edu/Futures/LF-BAS.
NCI, 2002. U.S. Lighting Market Characterization Volume I: National Lighting Inventory and Energy Consumption Estimate. Prepared by Navigant Consulting, Inc. for the Department of Energy. Washington D.C. September 2002.
Zigbee, 2003. “ Welcome to the Zigbee Alliance.” Zigbee; accessed on December 12, 2003 at http://www.zigbee.com.

232
5. Human Factors
Ideally, lighting should provide visual conditions in which humans can function effectively, efficiently and comfortably. An understanding of the complex interaction of the physical, physiological, and perceptual characteristics of the visual system is integral in envisaging human behavior as a function of lighting conditions. The visual system fundamentally influences human behavior as it serves to interpret the visual environment through the transmissions of signals from the eye to the visual cortex. The overall purpose of lighting, therefore, is in serving human visual needs. Such needs are complex, involving emotions, actions, perceptions and health, all of which are influenced by light. Visibility, task performance, mood and atmosphere, visual comfort, aesthetic discrimination, health, safety and well-being, and social communication are all human needs served by lighting. Consideration of the human factors in lighting enables a more complete performance comparison of disparate light sources for specific applications in which consumer justification can not be isolated from people’s specific reactions and perceptions to lighting conditions.

233
5.1. Visual Performance
The human visual system is an image processing system that involves the eye and brain working together to discriminate details and/or color in order to perform visual tasks. The optical elements of the eye form an image of the world on the retina. The photoreceptors in the retina absorb photons and convert the image to electrical signals. These signals transmit via the optic nerve and follow a number of pathways. One leads to the lateral geniculate nucleus (LGN) and then to the visual cortex for visual processing. Other pathways lead to parts of the brain that control pupil size, eye movements, and circadian rhythms.
The retina contains two main classes of light-sensitive receptors, rods and cones, which are differentiated by their morphology and by the spectral sensitivity of their photopigments. Rods are absent in the fovea, and increase in number to a maximum at about 20° of eccentricity and then gradually decrease towards the edges of the retina. Hence, rods are not sensitive along the direct line-of-sight, but sensitive along the periphery of sight. All rods contain the same photopigment (rhodopsin). Therefore, they are not capable of color discrimination. Rods have a spectral sensitivity function, V`(λ), with peak sensitivity at 507 nm, and they are the dominant photoreceptor at low (scotopic) light levels (typically below 0.01 cd/m2).
Cones are divided into three known classes, each characterized by the photopigment that it contains: erythrolabe, chlorolabe, or cyanolabe (also known as L-type, M-type, and S-type or long-, middle-, and short-wavelength type). Although there are cones in all parts of the retina, they are densely concentrated in the fovea. Hence, cone vision is responsible for line-of-sight vision and has high acuity necessary to see fine details. All three of the cone types acting together have a spectral sensitivity function, V(λ), with peak sensitivity at 555 nm. They are the dominant photoreceptors at high (photopic) light levels (typically above several cd/m2). The different photopigments in the cones make color discrimination possible.
Based on the characteristics of the human visual system, researchers developed the lighting metrics used today (i.e., the lumen, color-rendering index, correlated color temperature). The following sections present two technology options relating to visual performance.

234
5.1.1. Spectrally Enhanced Lighting
Spectrally Enhanced Lighting43 has the potential to save 0.4 quads of energy annually in the United States. However, experts continue to debate the use of this method for general lighting practice.
Technology Description and Energy Saving Principle
Spectrally enhanced lighting has more blue in its spectrum. Low color temperature lamps are generally scotopically deficient, whereas high color temperature lamps have a high scotopic output.
Currently, lighting measurements use weighting functions based on the spectral sensitivity of the cone receptors (photopic response) of the eye (IESNA, 2001). Research has shown that the photopic function does not fully describe the visual response to light (Berman et al., 1990), and that current lighting research should be supplemented with the scoptopic response to understand how the spectral effects of lighting affect pupil size and brightness perception (Berman et al., 1990; Berman et al., 1996).
Berman’s research showed that light enhanced in the scotopic portion of the spectrum causes a reduction of pupil size, leading to an improvement of visual performance (Berman et al., 1992a). Using Berman’s reasoning, energy efficiency could improve if lighting design incorporated the influence of scotopic effects. Spectrally enhanced light appears brighter, even though the (photopically measured) light level is actually lower, because both the cones and the rods are active and pupil size is smaller. While the relevance of these findings have been challenged by others in the lighting industry (Boyce et al., 2003), it may be possible to reduce lighting levels while still maintaining equivalent visual effect, thereby, saving energy.
Technical Maturity Level
The first studies demonstrating significant rod activity at interior light levels and the possible effects of these findings on lighting design were published in the Journal of Illuminating Engineering Society fifteen years ago. Several small lamp companies market spectrally enhanced fluorescent lighting products. All major lamp manufacturers offer spectrally enhanced lamps even though they do not market their products as such.
Technology Maturity Stage
Basic Science Research Applied Research Exploratory
Development Advanced
Development Engineering Development
Product Demonstration
Commercialization and Sales
Issues with Existing Lighting Products and Systems
Introducing spectrally enhanced lighting into the existing lighting infrastructure would not introduce any technical issues. However, the higher color temperature of a spectrally enhanced lamp may produce some issues with user acceptability (See “Perceived Barriers to Market Adoption).
� 43 The name “Spectrally Enhanced Lighting” is used in recognition that the visual phenomena associated with the spectral effects may
not be entirely due to the rods (Scotopic Luminous Efficiency Function), as previously believed. Recently discovered photoreceptors may contribute to the visual effects that result from changing the lighting spectrum, and the spectral sensitivity of these new photoreceptors is very similar to rods.

235
Technical Potential and Primary Energy Consumption Impact
Spectrally enhanced lighting could reduce energy consumption by 0.4 quad, based on the assumption of 20% average energy savings throughout the commercial sectors where fluorescent lighting is currently used (After Image + Space, 2004).
Performance Information: Data and Source
The functioning factor used in spectrally enhanced lighting is called the S/P ratio, which evaluates the spectrum of any lamp on the basis of the scotopic function in comparison to the photopic function. Low pressure and high-pressure sodium lamps, which have warmer correlated-color temperatures, have the lowest S/P ratios. These types of light emit less scotopic lumens than photopic lumens. Conversely, metal halide and cool white florescent lamps, which have higher correlated color temperatures, have the highest S/P ratios. These types of light emit more scotopic lumens than photopic lumens. The table below presents the typical S/P (scotopic/photopic) ratio for several common light sources.
Table 5-1: S/P Ratios of Common Light Sources
Light Source S/P Ratio
Incandescent 1.41
Yellow-filtered incandescent 1.25
High-pressure sodium 0.62
Low-pressure sodium 0.23
Warm-white fluorescent 1.0
Cool-white fluorescent 1.46
Clear mercury vapor 0.8
Metal halide (sodium-scandium) 1.49 � Source: Bullough, 2001.
The table below presents the photopic and scotopic efficacies of two types of linear fluorescent lamps; one with an S/P ratio of 2 and the other with an S/P ratio of 1.3.
Table 5-2: Photopic and Scotopic Efficacy for Linear Fluorescent Lamps
Lamp Type Life S/P Ratio CRI CCT Photopic
Light Output
Scotopic Light
Output
Photopic Efficacy
Scotopic Efficacy
F32T8 20,000 hrs. 2 86 5000 K 2660 lm 5320 lm 83 LPW 166 LPW
F32T8 20,000 hrs. 1.3 86 3000 K 2800 lm 3640 lm 87.5 LPW 113 LPW � Sources: GE, 2005.
Cost Information: Data and Source
Table 5-3 below, presents the price differential between two T8 linear fluorescent lamps, whose specifications are in Table 5-2. The lamp with the higher S/P ratio has a higher price, even though it is not marketed as a spectrally enhanced lamp.

236
Table 5-3: Price of Lamps, Spectrally Enhanced vs. Non-Spectrally Enhanced
Lamp Type S/P Ratio CRI CCT Photopic
Light Output
Scotopic Light
Output
Photopic Efficacy
Scotopic Efficacy Price
F32T8 2 86 5000 K 2660 lm 5320 lm 83 LPW 166 LPW $4.95
F32T8 1.3 86 3000 K 2800 lm 3640 lm 87.5 LPW 113 LPW $3.10 � Source: Atlanta Light Bulbs, 2005; GE, 2005. Philips, 2005; OSRAM, 2005.
Non-Energy Benefits of Technology
Developers of this technology claim that spectrally enhanced lighting results in a reduction in visibility glare and a decrease in visual fatigue, specifically in office and classroom settings.
Notable Developers/Manufacturers of Technology
Lawrence Berkeley National Laboratory and the Lighting Research Center are notable on their continuing research in the area of scotopic lighting. Lighting experts continue to debate the applicability of this method in standard lighting practice.
Research by Berman et al. at Lawrence Berkeley National Laboratory demonstrated that the spectral response of pupil size is predominantly a scotopic sensitivity (Berman et al., 1992a). A different study demonstrated that brightness perception has a prominent contribution dependent on the scotopic content of the illumination (Berman et al., 1992b). Another follow-up study showed that despite different wall colors, vertical scotopic illuminance predicts pupil size (Berman et al., 1996).
Navvab et al. has shown that visual acuity depends on the color temperature of the surround lighting (Navvab, 2002). The study showed that to obtain equality of visual acuity under two different surround spectra (CCT 7500 vs. CCT 3500) requires 4 times more task luminance when the surround lighting is provided by the low CCT lamp as compared to the high CCT lamp (Navvab, 2002). Other research shows that word reading acuity was highly significantly better under high color temperature lamps (6300K) compared to low color temperature lamps (3500K) in a fully lit surround condition. Spectrally driven pupil size changes are conjectured as the mechanism responsible for the observed effects (Navvab et al., 2001).
Research by Boyce et al. tested the hypothesis that light sources that produce smaller pupil sizes ensure better achromatic visual task performance at the same photopic illuminance. Two groups of subjects, one in the age range 18–28 years and the other in the range 61–78 years, performed a Landolt ring task for eight different gap sizes, two different illuminances, and two lamp scotopic/photopic ratios. For both age groups, pupil size was determined by both illuminance and lamp spectrum. Using a 20/30 visual acuity as the smallest size for assessing visual performance, this research found that lamp spectrum had no effect on the performance of the task (Boyce et al., 2003), which differs from the previously mentioned vision testing, which was performed using the optometric standard of 20/20 vision. This study has therefore called into question the applicability of this method in standard lighting practice.
Research by Veitch et al. has also found that light source spectral composition does not affect visual performance or visual acuity (Veitch et al., 2002), however, these studies did not consider the level of acuity to the 20/20 vision limit as the Berman and Navaab studies did.

237
Sylvania, General Electric, and Philips lighting, along with other lighting manufacturers, supports ongoing investigations related to measuring the influence of the scotopic curve on photopic vision (Sylvania, 2000).
Peak Demand Impact Potential
For the applications listed below, most of the energy consumption occurs during peak demand hours. Thus, an improvement in lamp efficacy would result in peak demand reduction.
Promising Applications
The benefits of spectrally enhanced light sources are the greatest for achromatic tasks, such as reading or examining printed materials. In addition, it has been demonstrated that the maximum benefit from the use of this method occurs for computer tasks. Thus, promising applications include offices and schools.
Perceived Barriers to Market Adoption
There still is no consensus among the lighting community on the merits of scotopic enhanced lighting with respect to the amount of energy that will be conserved. Even more problematic is user acceptance of high color temperature lamps. People in the United States are unaccustomed to (and may therefore be unhappy with) the enhanced “blue” light, especially in indoor applications such as offices and schools. However, several studies have shown the energy savings benefits of spectrally enhanced fluorescent lighting while maintaining user acceptability. For example, a study conducted in an occupied office building (University of California Office of the President, UCOP) compares the lighting of two identical floors of a modern office building, demonstrating that lighting energy consumption can be significantly reduced by switching to
spectrally enhanced, high CRI lamps and suitable ballasts, with no discernible difference in occupant satisfaction (After Image + Space, 2004).
Data Gaps and Next Steps More formal studies need to be completed on the energy savings potential of the technology. There are still conflicting studies and opinions on fundamental issues of spectrally enhanced lighting (Boyce et al., 2003). Berman’s research showed that light enhanced in this portion of the spectrum causes a reduction of pupil size, leading to better visual performance (Berman et al., 1990; Berman et al., 1996) and that this effect could be utilized to compensate for reduced light levels. Berman’s assertion of smaller pupil size leading to improved visual performance under realistic lighting conditions is controversial and has been challenged by independent research (Boyce et al, 2003). In addition, most studies in spectrally enhanced lighting have used dimming ballasts, which cost more than non-dimming ballasts. Therefore, further economic studies are required to determine more cost effective methods of implementing spectrally enhanced lighting that do not require dimming ballasts (After Image + Space, 2004).
User acceptance under high color temperature lighting conditions is still questionable (Boyce et al., 2002).
The lighting community must agree upon a standard metric to evaluate spectrally enhanced lighting. Currently, lamps are specified by photopic lumens only. Another necessary step would be for lamp companies to include scotopic metrics, such as scotopic lumens or S/P ratios, as part of their lamp specification. Then, consumers could use this information to incorporate scotopic enhanced lighting into buildings.

238
References
After Image + space, 2004. “Energy Conservation Using Scotopically Enhanced Fluorescent Lighting In An Office Environment.” Liebel and Lee; accessed on April 26, 2005 at http://www.netl.doe.gov/ssl/Docs/Final%20UCOP%20Report%20March%202004.pdf
Atlanta Light Bulbs, 2005. Lamp prices. atlantalightbulbs.com; accessed on June 9, 2005 at http://www.atlantalightbulbs.com/ecart/catalog/catf-2.html.
Berman et al., 1990. “Photopic luminance does not always predict perceived room brightness.” Lighting Research 22(1):37-41.
Berman, 1992a. “Energy Efficiency Consequences of Scotopic Sensitivity.” JIES 21(1):3-14.
Berman, 1992b. “Spectral determinants of steady-state pupil size with a full field of view.” JIES 21(2):3-13.
Berman et al., 1996. “Despite Different Wall Colors, Vertical Scotopic Illuminance Predict Pupil Size.” November 1996. JIES 26 (No. 2) 1997.
Berman, 2000a. “The Coming Revolution in Lighting Practice.” Energy Users News; accessed on September 30, 2003 at http://www.energyusernews.com/CDA/ArticleInformation/features/BNP__Features__Item/0,2584,14423,00.html.
Berman, 2000b. “Schools and Industrial Facilities are Tested for the Vision, Psychological, and Economical Benefits of Scotopically Enhanced Lighting.” Lightfair International 2000.
Boyce et al., 2002. “Perceptions of full-spectrum, polarized lighting.” Boyce, P.R., Hunter, C.M., and Carter, C.B. Journal of the Illuminating Engineering Society 31, no. 1: 119-135. 2002.
Boyce et al., 2003. “The impact of spectral power distribution of an achromatic visual task.” Boyce, P.R., Akashi, Y., Hunter, C.M., and Bullough, J.D. Lighting Research & Technology 35, no. 2: 141-161. 2003.
Bullough, 2001. “Driving in Snow: Effect of Headlamp Color at Mesopic and Photopic Light Levels.” Lighting Research Center. SAE Technical Paper Series. SAE 2001 World Congress. Detroit, Michigan. March 5-8, 2001.
DOE, 2003. “Quantification of Scotopic Lighting Effects in a Realistic Environment.” Office of Building Technologies Program. Department of Energy; accessed on September 30, 2003 at http://www.eere.energy.gov/buildings/research/lighting/human.cfm.
Duro-Test Lighting, 2003. “Benefits of Scotopic Light.” Duro-Test Lighting; accessed on September 29, 2003 at http://www.full-spectrum-lighting.com/durotest/Benefits%20Scotopic%20Light.htm.
GE, 2005. Lighting Catalog; accessed on May 2, 2005 at http://www.gelighting.com/na/business_lighting/education_resources/literature_library/catalogs/lamp_catalog/downloads/cat_fluorescent.pdf
LRC, 2002. “The Effect of Spectral Power Distribution on Task Performance.” Lighting Research Center; accessed on September 30, 2003 at http://www.lrc.rpi.edu/programs/partners/partnersOnly/pdfs/TaskPerformance.pdf.
NaturalLux, 2003. “Scotopic Enhancement.” NaturalLux; accessed on September 30, 2003 at http://www.naturalux.com/Scotopic.htm.
Navvab, 2002. “Visual Acuity Depends on Color Temperature of the Surround Lighting.” JIES. Winter 2002. J.IES, Vol. 30, No.2 pp.170-175.

239
Navvab et al., 2001. "A comparison of visual performance under high and low color temperature fluorescent Lamps". Journal of the Illuminating Engineering Society. Summer 2001. J.IES Vol.31,No.1, pp. 70-84.
NCI, 2002. U.S. Lighting Market Characterization Volume I: National Lighting Inventory and Energy Consumption Estimate. Prepared by Navigant Consulting, Inc. for the Department of Energy. Washington D.C. September 2002.
OSRAM, 2005. Product Catalog. Accessed on June 9, 2005 at: http://ecom.mysylvania.com/sylvaniab2c/b2c/readshop.do?shopId=GL-L0
Philips, 2005. Product Catalog. Accessed on June 9, 2005 at: http://www.prismaecat.lighting.philips.com/LightSite/Whirlwind.aspx?eca=LNPPLA&cpf=USNPUS&tree=0&scr_md=1111&loc=us_en
Rea et al., 2001. “Human Melatonin Suppression by Light: A Case for Scotopic Efficiency.” Mark S. Rea, John D. Bullough, and Mariana Figueiro. Lighting Research Center. Neuroscience Letters, Volume 299, Issues 1-2, pp. 45-48. February 16, 2001.
Rea et al., 2001. “A proposed unified system of photometry.” Rea, M.S., Bullough, J.D., Freyssinier-Nova, J.-P., and Bierman, A. Lighting Research & Technology 36, no. 2: in press.
Sylvania, 2000. “Lumens and Mesopic Vision.” FAQ. National Customer Support Center. OSRAM Sylvania; accessed on September 30, 2003 at www.sylvania.com/forum/pdfs/faq0016-0297.pdf.
Veitch et al., 2002. “The Effect of fluorescent lighting filters on skin appearance and visual performance” Veitch, Tiller, Pasini, Arsenault, Jaekel, and Svec. Journal of the Illuminating Engineering Society, v.31. no. 1. Winter 2002, pp. 40-60.
Verilux, 2003. “Verilux Full Spectrum Lamps.” Verilux; accessed on September 30, 2003 at http://www.verilux.net/products2.htm.

240
5.1.2. New Metrics: CRI and Light Output
There are no potential energy savings that would result from new lighting metrics.
Technology Description and Energy Saving Principle
Lighting metrics quantify the quality and amount of light emitted from a lamp. Common lighting metrics include: luminous flux, illuminance, color-rendering index (CRI), and correlated color temperature (CCT). However, these metrics developed through the first and middle part of the 20th Century, and there have been no major updates to these metrics since their inception. The bases for these metrics are decades old in some cases and may be outdated. Thus, these measures can present biased results when used comparatively, and require an understanding of the bases of measurement to have any useful meaning.
The recent development of LEDs as a source of general illumination raises an important aspect of color rendering, as it directly relates to energy efficiency. Lamps having high CRI, in general, tend to have lower lumens per watt, and vice versa (Ohno, 2004). To realize near perfect CRI, some LED makers are heading toward matching LED spectra to daylight or equal-energy white. Although such spectra would have very high CRI, it would suffer from much lower efficacy.
With the goal of improving lighting design and reducing energy consumption, new metrics must better measure how much light a system will produce and how well that light will meet the needs of the people who will use it. Better metrics are necessary in order to maximize the full energy savings potential of various lighting technology options. Better metrics would enable consumers to compare lighting products more effectively. They would free researchers and developers to exploit the full potential of novel light sources. Improved metrics would also assist government regulators and lighting organizations in developing codes and standards.(LRC, 2003).
Technical Maturity Level
The Commission Internationale de l'Eclairage (CIE) spectral luminous efficiency function V(λ) was adopted as an international standard in 1924 and is still used as the official standard for photometry (Ohno, 2000).
The CIE color-rendering index (CRI) is the only internationally agreed metric for color rendering of light sources (CIE, 1995). Defined in 1965, it went through only minor revisions since then. Some of the formulae used in the CRI are outdated, and the CIE acknowledges that CRI has some deficiencies (CIE, 1999). For years, the lighting community believed that the deficiencies were not serious. However, the recent development of white LEDs as a source of general illumination raises some serious issues to the adequacy of CRI (e.g., Narendran, 2002).
In 1909, several national laboratories agreed to use a blackbody to define the unit of luminous intensity. The CIE adopted this standard in 1921 as the international candle (Ohno, 1999). The candela was re-defined in 1979 in relation to optical power (in watts) at 555 nm, the peak of the V(λ), and thus no longer relies on a physical blackbody source.
The CIE still recommends that color correlated temperature (CCT) be calculated using the chromaticity diagram generated in 1960 (Ohno, 2000).

241
There is growing interest from industry, government, and academia to redefine existing metrics and to create new metrics for lighting. In 2003, the Defense Advanced Research Projects Agency (DARPA) began advocating a new metric for light output based on the spectrum of sunlight.
Technology Maturity Stage
Basic Science Research
Applied Research Exploratory Development
Advanced Development
Engineering Development
Product Demonstration
Commercialization and Sales
Issues with Existing Lighting Products and Systems The update or development of new lighting metrics could have significant impacts on
how manufacturers design new lighting products and how they specify these products for different applications.
Technical Potential and Primary Energy Consumption Impact
There are no potential energy savings from new metrics.
Performance Information: Data and Source
An example of a product designed to new lighting metrics is the LRC’s retinal flux density meter. The retinal flux density (RFD) meter can assess the benefits of considering more than photopic illuminance levels in lighting design. Lamps are currently rated based on the photopic function, which provides the photopic lumens found in lamp catalogs. To include the scotopic sensitivity function in lamp evaluation, a modifying factor is applied to the traditional lumen. This factor is the scotopic to photopic lumen ratio, denoted by S/P. Multiplying photopic lumens by S/P presents scotopic lumens.
In addition, the LRC researches color properties of LED light sources and found that CRI is not a good predictor of object color appearance for LEDs (Narendran and Deng, 2002). Although the CRI values can dramatically differ for two- RGB-mix LED light sources, a human subject’s response for color appearance will be almost the same (Narendran and Deng, 2002).
Table 5-4 presents the typical S/P ratio for several common light sources. Sodium lamps, which have warmer correlated color temperatures, have the lowest S/P ratios. Metal halide and cool white florescent lamps, which have higher correlated color temperatures, have the highest S/P ratios.

242
Table 5-4: S/P Ratios of Common Light Sources
Light Source S/P Ratio
Incandescent 1.41
Yellow-filtered incandescent 1.25
High-pressure sodium 0.62
Low-pressure sodium 0.23
Warm-white fluorescent 1.0
Cool-white fluorescent 1.46
Clear mercury vapor 0.8
Metal halide (sodium-scandium) 1.49 Source: Bullough, 2001.
Table 5-4 presents the photopic and scotopic efficacies of two linear fluorescent lamps, one scotopically enhanced and the other not enhanced.
Table 5-5: Photopic and Scotopic Efficacy for Linear Fluorescent Lamps
Lamp Type
Scotopically Enhanced Life S/P
Ratio CRI CCT Photopic
Light Output
Scotopic Light
Output
Photopic Efficacy
Scotopic Efficacy
F40T12 Yes 20,000 hrs. 2.16 85+ 6000 K 2,800 lm 5,800 lm 70 lm/W 145 lm/W
F40T12 No 20,000 hrs. 1 86 3600 K 2,100 lm 2,100 lm 53 lm/W 53 lm/W Sources: Verilux Lighting, 2003; OSRAM Sylvania, 2003.
In addition, the traditional measurement of lifetime for lighting products may not be applicable to LED lamps. Traditional light sources define lifetime as the time taken for 50% of the samples to burn out. However, since LEDs do not fail catastrophically, it seems more appropriate for lifetime to relate to lumen maintenance. Dr. Nadarajah Narendran of the Lighting Research Center (LRC) suggests that lifetime be defined as the time taken for light output to fall to 70% of its initial value (Whitaker, 2003).
Cost Information: Data and Source
The cost of redefining or creating new metrics depends mainly on the cost of research. For example, a tool such as the RFD meter can be manufactured for approximately $1,000 (LRC, 2002). Table 5-6 shows the list price differential between a typical F40T12 linear fluorescent lamps and a lamp marketed specifically as a scotopically enhanced F40T12 lamp (See Table 5-5 for lamp specifications).
Table 5-6: Price of Lamps, Scotopically Enhanced vs. Non-Scotopically Enhanced
Lamp Type Scotopically Enhanced Price
Verilux F40T12 Yes $13.75
Sylvania F40T12 No $5.14 Source: Kwhlighting.com, 2003; Verilux Lighting, 2003.

243
One may conclude from Table 5-6 that scotopically enhanced fluorescent lamps have significantly higher initial cost. However, lamps with spectral power distributions very similar to those claiming to be “full spectrum” can be obtained at much lower prices (Rea et al., 2003).
Non-Energy Benefits of Technology
New metrics that easily and concisely quantifies the spectrum of a light source and its effects to the consumer could lead the expanded use of lighting products such as scotopically enhanced and circadian enhanced lighting. Scotopically enhanced lighting could reduce visibility glare and visual fatigue, specifically in office and classroom settings (Verilux, 2003). A circadian enhanced light source, where the spectral sensitivity function of the lamp is matched to the circadian system, can physiologically affect people in the lighting environment. A person’s circadian rhythms can be controlled, thus alleviating sleep disorders, jet lag, and seasonal affective disorder (Nichol and Ferguson, 2002). In a work environment, a circadian enhanced lighting system can improve safety, worker productivity, and improve the quality of life of shift workers (SRI, 2003).
Notable Developers/Manufacturers of Technology
Magnaray Lighting and Philips Lighting sponsored the retinal flux density (RFD) project conducted by the LRC. The device serves as a standard illuminance meter or measure of flux density on the retina (determined using computer modeling). The meter considers both scotopic and photopic spectral responses in its calculation of flux. With this tool, researchers and practitioners can assess the benefits of considering more than photopic illuminance levels in lighting design. This product is not yet available commercially (LRC, 2002). The LRC also conducted human factors research on the effect of CRI on object color appearance with funding from the Alliance for Solid-State Illumination Systems and Technologies (ASSIST) (LRC, 2002b).
DARPA is currently collaborating with National Institute of Science and Technology (NIST) to develop a new measure for light output advocating a metric based on the spectral emission of the sun (specifically D65).
Researchers at NIST continue to evaluate new metrics for light quality, an alternative to the color-rendering index.
One feature that has no accepted metric is luminance uniformity. For large panel, low luminance light sources, this may be a significant issue. Therefore, a study conducted by the Lighting Research Center focused on testing how the uniformity monochromatic light produced by LEDs for use in outdoor signs affected user preference (Ramamurthy et al., 2003).
Peak Demand Impact Potential
Reduction in energy consumption of lighting products due to new metrics would coincide with peak demand, and would result in a proportional decrease in peak energy demand.
Promising Applications
A metric not biased towards the photopic sensitivity function would benefit scotopically enhanced lighting. Applications involving achromatic tasks, such as reading or examining printed materials, in offices and schools would stand to benefit (Duro-Test Lighting, 2003). In addition, applications that do not require high light levels (i.e., roadways, parking areas, pathways, etc.) would also benefit from scotopically enhanced light sources where the human visual system operates below photopic light levels.

244
LRC research on the luminance uniformity of LED lighting would benefit LEDs in outdoor electric signs. Research on color-properties (CRI) of LED lamps would also benefit development of this light source for specific tasks such as reading (LRC, 2002b).
Perceived Barriers to Market Adoption
Any proposal to change a standard of measurement would significantly impact an existing infrastructure, and would likely face strong opposition from manufacturers and other groups with a stake in the status quo.
Data Gaps and Next Steps
Further research is necessary to determine if development of a different set, or a redefinition, of lighting metrics is warranted. One of the key unanswered questions in this area is the energy savings benefit of a new color-rendering metric. For example, calculation indicates that RGB white LEDs can produce acceptable color rendering, and four-color white LEDs can produce excellent color rendering, both with high lm/W (Ohno, 2004). This needs to be verified by experimental studies. Guidance is needed on what level of color rendering performance is needed and what types of LED spectra (3 color, 4 color, continuous) may be appropriate or desired for what applications so that manufacturers can make technical strategies for future developments.
References
Bullough, 2001. “Driving in Snow: Effect of Headlamp Color at Mesopic and Photopic Light Levels.” Lighting Research Center. SAE Technical Paper Series. SAE 2001 World Congress. Detroit, Michigan. March 5-8, 2001.
CIE, 1995. CIE 13.3:1995, Method of Measuring and Specifying Colour Rendering Properties of Light Sources.
CIE, 1999. CIE 135/2:1999, Colour rendering (TC 1-33 closing remarks)
DOE, 2003. “Quantification of Scotopic Lighting Effects in a Realistic Environment.” Office of Building Technologies Program. Department of Energy; accessed on September 30, 2003 at http://www.eere.energy.gov/buildings/research/lighting/human.cfm.
LRC, 2002. “The Retinal Flux Density Meter.” Lighting Research Center; accessed on December 8, 2003 at http://www.lrc.rpi.edu/programs/partners/partnersOnly/pdfs/RetinalFluxDensity.pdf.
LRC, 1998. “Guide to Selecting Frequently Switched T8 Fluorescent Lamp-Ballast Systems.” National Lighting Product Information Program; accessed on December 8, 2003 at http://www.lrc.rpi.edu/Library/pdf/57-2002.pdf.
Narendran and Deng, 2002. “Color Rendering Properties of LED Light Sources.” Nadarajah Narendran and Lei Deng. Solid State Lighting II: Proceedings of SPIE. Society of Photo-Optical Instrumentation Engineers; accessed on December 8, 2003 at http://www.lrc.rpi.edu/programs/solidstate/pdf/CRIForLED.pdf.
NCI, 2002. U.S. Lighting Market Characterization Volume I: National Lighting Inventory and Energy Consumption Estimate. Prepared by Navigant Consulting, Inc. for the Department of Energy. Washington D.C. September 2002.
Ohno, 1999. OSA Handbook of Optics, Volume III Visual Optics and Vision Chapter for Photometry and Radiometry. Yoshi Ohno. Optical Technology Division. National Institute of Standards and Technology. Final Draft.

245
Ohno, 2000. “CIE Fundamentals for Color Measurements.” Yoshi Ohno. Optical Technology Division. National Institute of Standards and Technology. IS&T NIP16 Conference, Vancouver, Canada. Oct. 16-20, 2000.
Ohno, 2004. “Simulation Analysis of White LED Spectra and Color Rendering, Extended abstract for CIE Expert Symposium on LED Light Sources.” Yoshi Ohno. Tokyo, Japan. June 2004 (to be published).
Ramamurthy et al., 2003. “Determining the Contrast Sensitivity Functions for Monochromatic Light Emitted by High-Brightness LEDs.” Vasudha Ramamurthy, Nadarajah Narendran, Jean Paul Freyssinier, Ramesh Raghavan, and Peter Boyce. Lighting Research Center; accessed on December 8, 2003 at http://www.lrc.rpi.edu/programs/solidstate/pdf/SPIE5187-39_Ramamurthy.pdf.
Rea et al., 2003. Rea, M.S., Deng, L., and Wolsey, R. Lighting Answers: Full-Spectrum Light Sources. Troy, NY: Rensselaer Polytechnic Institute. 2003. http://www.lrc.rpi.edu/programs/nlpip/lightinganswers/fullspectrum/abstract.asp. Last accessed April 5, 2004.
Whitaker, 2003. “Mobile Applications Prompt Strong Growth in LED Market.” Tim Whitaker. CompoundSemiconductor.net; accessed on February 24, 2004 at http://www.compoundsemiconductor.net/articles/magazine/9/4/3/2.

246
6. Summary
The objective of this report, U.S. Lighting Market Characterization Volume II: Energy Efficient Lighting Technology Options, was to look broadly at energy-efficient options in lighting and identify leading opportunities for energy savings. This report started with 209 technology options, which were then narrowed down to a list of fifty-two by a group of lighting experts. This report presents those fifty-two lighting technology options that promise to save energy or demonstrate energy savings potential. This report does not represent DOE’s top-choices of lighting research and development, instead it encompasses the opportunities that are promising measures to reduce lighting energy consumption.
The three main categories for the fifty-two technology options are light source, utilization, and human factors. The largest category, light source, contains thirty-six options. These options are further divided into five subcategories: incandescent, fluorescent, high intensity discharge (HID), light-emitting diode (LED), and organic light-emitting diode) (OLED). The second category, utilization, includes fourteen options, which are subdivided into three subcategories: fixture, distribution and controls. The third category, human factors, consists of two options, classified under the subcategory of visual performance. The report presents a broad range of technology options, spanning from basic and applied research to deployment and market transformation. This report provides guidance to the DOE decision makers in planning the Lighting R&D portfolio.
For each technology option, this report presents its:
• Technology Description and Energy Saving Principle • Technical Maturity Level • Issues with Existing Lighting Products and Systems
• Technical Potential and Primary Energy Consumption Impact • Performance Information: Data and Source • Cost Information: Data and Source
• Non-Energy Benefits of Technology • Notable Developers/Manufacturers of Technology • Peak Demand Impact Potential
• Promising Applications • Perceived Barriers to Market Adoption • Data Gaps and Next Steps
This report draws from many sources, including lighting product catalogs, scientific research papers, energy-efficient lighting studies, and input from lighting manufacturers and researchers.
As mentioned previously, there are several caveats that accompany the findings presented in this report. For instance, the full technical energy savings potential of the options was identified, but realistic market potential (and associated energy savings) was not assessed. Additionally, the risks associated with developing these technology options were not quantified. Evaluation of technical risk may be needed for certain technology options for program planning purposes.

247
6.1. Light Sources
The light source chapter is disaggregated into five basic technologies: incandescent, fluorescent, HID, and emerging organic and inorganic solid-state light (SSL) sources. There are two incandescent technology options, five fluorescent, ten HID, twelve inorganic, and seven organic SSL technology options.
The efficacy of incandescent light sources can be improved by increasing the operating temperature and by confining the emission of radiation to the visible spectrum. Table 6-1 presents two technology options related to incandescence and selective radiators.
Table 6-1: Summary Table for Light Source: Incandescent
Description Energy Savings Principle Technology Maturity Stage
Technical Potential Energy Savings
Higher Temperature Incandescent Light Sources
New materials enable operation at higher blackbody temperatures
Applied Research 1.5 quads
Selective (and Pseudo-Selective) Radiators
Selective radiators tailor the radiative discharge to maximize emission in visible spectrum
Basic Science Research Applied Research,
Commercialization & Sales 2.8 quads
For instance, the first technology option in Higher Temperature Incandescent Light Sources, has the potential to save 1.5 quads of energy per year. Novel materials would allow incandescent lamps to operate at higher blackbody temperatures, resulting in a more efficient lamp. This technology option falls within the applied research stage. The second technology option in this category, Selective (and Pseudo-Selective) Radiators, has the potential to save 2.8 quads annually. Selective radiators tailor the spectrum of the emission to maximize emission in visible spectrum. Presently, this technology option is transitioning from the Basic Science Research (1) stage to the Applied Research stage (2).
The non-energy benefits that can be derived from the technological improvements in incandescent light sources are the availability of a larger range of color temperatures and safety improvements.
Table 6-2 presents five technology options relating to improving the efficacy of fluorescent light sources. These technology options focus on: reducing electrode deterioration and sputtering, increasing the range of dimming of certain fluorescent technologies to encourage their use with lighting controls, the elimination of unnecessary electrode heating, and increasing phosphor efficiency.

248
Table 6-2: Summary Table for Light Sources: Fluorescent
Description Energy Savings Principle Technology Maturity Stage
Techncial Potential Energy Savings
Fluorescent Electrode Research
Reducing anode and cathode fall losses increases the emissive region of the discharge arc resulting in increased efficiency
Advanced Development
0.3 quad
Small Diameter Lamps
Reducing the diameter of linear fluorescent lamps may increase luminance resulting in improved luminaire efficiency
Commercialization & Sales
0.6 quad
Dimmable Instant-Start Ballasts
Enables instant-start systems to operate with dimming controls
Product Demonstration Commercialization
& Sales 0.4 quad
Efficient Ballasts Develop rapid-start and dimming systems for four-pin lamps that provide electrode heating current only when necessary
Product Demonstration 0.01 quad
Multi-Photon Phosphors
Increase photon conversion with phosphors that emit two or more visible photons for every incident UV photon
Basic Science Research Applied
Research 3.5 quads
Non-energy benefits that can be derived from the technological improvements in fluorescent light sources include: an increase in the useful operating life of the lamp, decreased negative environmental impact (i.e., less waste material), and a wider range of design flexibility.
Table 6-3 presents ten technology options relating to improving the performance of HID light sources. These technology options focus on: improving the starting/re-start/warm-up characteristics of HID lamps to enable competition with less efficient technologies, increasing the range of dimming to allow use with lighting controls, improving the range of available wattages, and improving electrodes to increase lumen maintenance.

249
Table 6-3: Summary Table for Light Sources: HID
Description Energy Savings Principle Technology Maturity Stage
Technical Potential Energy
Savings
HID Restrike Issues Enable HID sources to replace less efficient light sources where instant restrike is an issue
Advanced Development 0.6 quad
HID Integral Ballast Enables HID sources to directly replace less efficacious incandescent lamps with an Edison screw base
Advanced Development 0.7 quad
HID Low-Wattage Enables HID sources to directly replace less efficacious incandescent lamps with equal light output
Engineering Development 0.7 quad
HID Novel Gas Novel gas fills could improve dimming performance of HID technology
Applied Research 0.7 quad
HID Ceramic Arc Tube Research
Optimizing arc tube shape and materials improves color quality and efficacy
Commercialization & Sales 1.2 quads
HID Electrode Research
New electrode material could improve dimming performance, starting characteristics, lumen maintenance, and efficiency
Applied Research Exploratory
Development 0.2 quads
HID Electrodeless Lamp
Absence of electrodes improves life and lumen maintenance, and enables more efficacious fill-gas chemistries
Engineering Development 0.6 quads
Metal Halide Electronic Ballast (HF)
High-frequency operation improves performance of HID sources, particularly in terms of lumen maintenance
Engineering Development
Commercialization & Sales
0.2 quad
HID Dimmable Ballast
Enable HID sources to dim and to integrate with lighting controls
Engineering Development
Commercialization & Sales
0.4 quad
Sulfur Lamp Absence of electrodes improves lumen maintenance, and small size of the bulbs enables design of more efficient reflectors
Advanced Development 0.8 quad
Non-energy benefits that can be derived from the technological improvements in HID light sources include: increased safety, longer operating life, improved optical control, better durability, more compact size, improved CRI, reduced environmental impacts, decreased color shift, and increased design flexibility.
Table 6-4 presents twelve technology options relating to improving the efficacy of LEDs. These technology options focus on: reducing defect density by improving buffers and substrates, improving phosphors, creating high lumen packages, improving optical design, and reducing the cost to make LEDs competitive with conventional light sources.

250
Table 6-4: Summary Table for Light Sources: LED44
Description Energy Savings Principle Technology Maturity Stage
Technical Potential Energy
Savings
Reflector Lamp
Utilization of LEDs as alternative light source for reflector lamp applications will lead to energy savings due to high device efficacy
Exploratory Development
Product Demonstration
0.2 quad
Integrated White LED Package
Monolithic integration at the wafer level would enable fabrication of compact microsystems with higher functionality and enhanced yield and reliability
Applied Research Product
Demonstration 1.1 quads
White-Light Systems
An efficient and practical method for producing white light will help enable LEDs to achieve the highest efficacies
Advanced Development 1.1 quads
High Lumen Package
High lumen packages would facilitate development of LED products with sufficient light output capable of competing with conventional light sources
Applied Research 1.1 quads
Device Electronics Novel circuit design and improved quality of discrete electronic components can minimize parasitic losses
Applied Research Product
Demonstration 0.2 quad
Substrate Research Better substrates would reduce the density of defects and improve LED performance
Applied Research 0.6 quad
Buffer Research Better buffers would reduce the density of defects and improve LED performance
Applied Research 0.6 quad
Novel Epimaterials Better materials would improve quantum efficiency and simplify manufacturing multicolor devices
Applied Research 0.6 quad
Etching, Chip-Shaping, and Texturing
Increasing the extraction efficiency of the semiconductor device results in higher efficacy
Applied Research 0.6 quad
Configuration Research
Increasing the extraction efficiency of the semiconductor device results in higher efficacy
Applied Research 0.6 quad
Phosphor Materials
Improved phosphors will increase the efficacy of LED devices that use wavelength-conversion and hybrid approaches to generate white light
Applied Research Commercialization &
Sales 0.6 quad
Optical Research Tools
Enable rapid optimization of designs for maximum extraction efficiency and rapid commercialization
Engineering Development
n/a
44 The estimated energy savings potential is based on a scenario where LED light sources achieve an efficacy of 160 lm/W and reach 100% market penetration in all lighting sectors. No single technology option is solely responsible for this estimate but is instead dependent on the cumulative success of many options, including but not limited to the ten options referenced by this footnote.

251
The non-energy benefits that can be derived from the technological improvements in LEDs are: increased safety over conventional sources, less waste due to longer lifetimes, increased durability, and decreased UV and IR emission.
Table 6-5 presents seven technology options relating to improving the efficacy of organic light-emitting diodes (OLEDs). These technology options focus on: improving the operating life by gaining a better understanding of its physics and degradation processes, improving internal and external quantum efficiencies, and reducing the cost to make OLEDs competitive with conventional light sources.
Table 6-5: Summary Table for Light Sources: OLED45
Description Energy Savings Principle Technology Maturity Stage
Technical Potential Energy
Savings
White-Light Systems An efficient and practical method for producing white light will enable OLEDs to achieve the highest efficacies
Applied Research 1.1 quads
Manufacturing Issues
Solutions to manufacturing challenges, such as roll-to-roll processing, will enable OLEDs to be cost-competitive with less efficient sources
Applied Research 0.6 quad
Novel Structures Novel OLED structures would optimize the injection rates of both holes and electrons to maximize recombination
Applied Research 0.6 quad
Degradation and Failure Processes
Understanding OLED degradation processes would lead to more reliable devices with longer operating lifetimes and reduced decay rates
Applied Research 0.6 quad
Light Extraction Issues Increasing the extraction efficiency of theOLED device results in higher efficacy
Applied Research 0.6 quad
Large Area Current Distribution
Novel electrode materials enable the development of OLED devices of practical size
Applied Research 0.6 quad
Photonic Emission from Triplets
Utilizing the triplet process improves quantum efficiency dramatically, to nearly 100%
Applied Research 0.6 quad
The non-energy benefits that can be derived from the technological improvements in OLEDs are: increased safety over conventional sources, less waste due to their longer lifetimes, increased durability, decreased UV and IR emission, and design flexibility due to their unique footprint.
45 The estimated energy savings potential is based on a scenario where OLED light sources achieve an efficacy of 160 lm/W and 100% market penetration in the fluorescent and general service incandescent sectors of the commercial sector. No single technology option is solely responsible for this estimate but is instead dependent on the cumulative success of many options, including but not limited to the options presented in this table.

252
6.2. Utilization
The utilization chapter is disaggregated into three subcategories: fixtures, distributions, and controls. There are six fixture technology options, three distribution, and five controls technology options.
Table 6-6 presents six technology options relating to developing more efficient lighting fixtures. These technology options focus on: integrating sensors into luminaires, designing fixtures to exploit the characteristics of LEDs in appropriate applications, and designing light fixtures that can be used off-grid.
Table 6-6: Summary Table for Utilization: Fixtures
Description Energy Savings Principle Technology Maturity Stage
Technical Potential Energy
Savings
Integrated Photosensor Luminaire
Photosensor integrated into the luminaire will encourage use of lighting controls
Product Demonstration Commercialization & Sales
0.9 quad
Integrated Occupancy Sensor Luminaire
Occupancy sensor integrated into the luminaire will encourage use of lighting controls
Product Demonstration Commercialization & Sales
0.9 quad
SSL Signage Fixtures Monochromatic LEDs exhibit 80-90% energy savings over neon in signage fixtures.
Commercialization & Sales 0.1 quad
LED Fixture Efficiency Optimizing fixture characteristics (optics, heat management) will maximize the system efficacy
Engineering Development Product Demonstration
0.6 quads
LED Fixtures for Monochromatic Illumination
In color-specific applications, monochromatic LEDs are very efficient, and can be powered by solar (photovoltaic) cells
Product Demonstration Commercialization & Sales
0.5 quad
Off-Grid Luminaires Stand-alone luminaries could use solar and wind power as a measure to reduce electricity demand
Product Demonstration 0.6 quad
Non-energy benefits that can be derived from the technological improvements in fixture design include: longer operating life of lamps in the fixture, design flexibility, reduced environmental impact, and ease of installation and maintenance.
Table 6-7 presents three technology options relating to improving the distribution of light. These technology options focus on: novel methods of light distribution, improving fiber optic performance and coupling to a distributive light source.

253
Table 6-7: Summary Table for Utilization: Distribution
Description Energy Savings Principle Technology Maturity Stage
Technical Potential Energy
Savings
Street Markers Solar powered street marker studs are an effective replacement for a portion of overhead street lighting
Commercialization & Sales
0.1 quad
Fiber Optic for General Illumination
Replacement of less efficient fibers with improved fibers would result in energy savings.
Commercialization & Sales
0.1 quad
Light Source Coupling to Optical Fiber
Increasing the coupling efficiency of fiber optic system increases the luminous flux entering the fiber optic bundle, increasing system efficacy
Product Demonstration Commercialization
& Sales 0.1 quad
Non-energy benefits that are to be derived from the technological improvements in distribution include: increased safety, better performance, decreased light pollution, and less UV and IR radiation.
Table 6-8 presents five technology options relating to improving the utilization of control. These technology options focus on: the standardization of lighting control systems and their interface with building control systems, and improving the ease of commissioning of control systems, and other attributes that encourage use and promote rapid adoption.
Table 6-8: Summary Table for Utilization: Controls
Description Energy Savings Principle Technology Maturity Stage
Technical Potential Energy
Savings
Robust Controls Algorithms
Include a self-commissioning function to remove difficulty of implementing control systems. Encourage use of lighting controls.
Product Demonstration Commercialization &
Sales 0.1 quad
Personal Lighting Controls
Equates to possession of a mobile light switch, Ease of access will encourage users to turn off lights.
Product Demonstration Commercialization &
Sales 0.7 quad
Standard Protocols for Lighting Products
A standard lighting control protocol will make it cheaper and easier for building owners to adopt a lighting control system.
Product Demonstration Commercialization &
Sales 1.3 quads
Standardized Building Automation Systems
Building control interface allows all the different components of the lighting system to communicate and execute effectively for maximum efficiency.
Product Demonstration Commercialization &
Sales 1.6 quads
Standardized Wireless Controls
Wireless sensors can be located in places where it is difficult to run wire, expanding applications for lighting controls
Product Demonstration Commercialization &
Sales 1.6 quads

254
The non-energy benefits that can be derived from the technological improvements in the area of lighting controls are increased worker productivity, user comfort, and design flexibility, and a decrease in installation and maintenance costs for building systems.
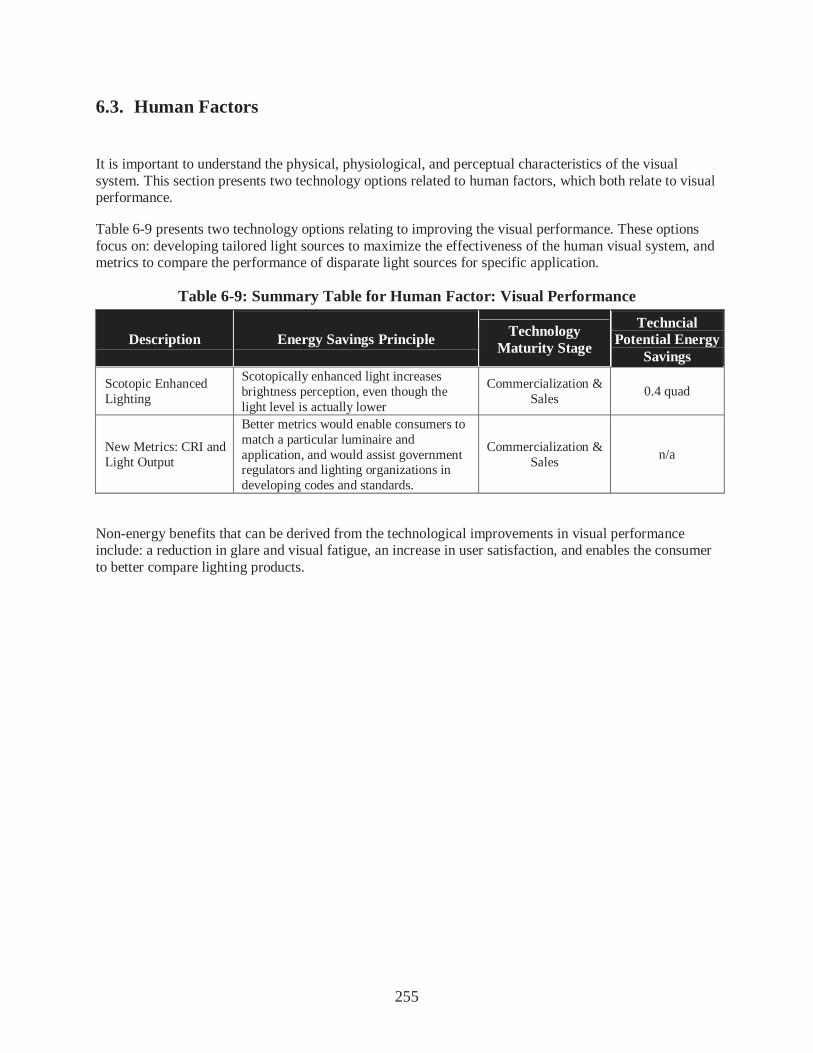
255
6.3. Human Factors
It is important to understand the physical, physiological, and perceptual characteristics of the visual system. This section presents two technology options related to human factors, which both relate to visual performance.
Table 6-9 presents two technology options relating to improving the visual performance. These options focus on: developing tailored light sources to maximize the effectiveness of the human visual system, and metrics to compare the performance of disparate light sources for specific application.
Table 6-9: Summary Table for Human Factor: Visual Performance
Description Energy Savings Principle Technology Maturity Stage
Techncial Potential Energy
Savings
Scotopic Enhanced Lighting
Scotopically enhanced light increases brightness perception, even though the light level is actually lower
Commercialization & Sales
0.4 quad
New Metrics: CRI and Light Output
Better metrics would enable consumers to match a particular luminaire and application, and would assist government regulators and lighting organizations in developing codes and standards.
Commercialization & Sales
n/a
Non-energy benefits that can be derived from the technological improvements in visual performance include: a reduction in glare and visual fatigue, an increase in user satisfaction, and enables the consumer to better compare lighting products.

256
Appendix A. Technology Option Voting Results
The options receiving the highest number of votes (and those that were studied in this report) are shaded in gray in the following series of tables. Some of the original topic items presented were combined due to similarities in technology or energy efficiency option. Other topics were not investigated in the report due to small energy savings potential.
Category Technology Option Number of Votes
New/Novel Filament 39
Halogen IR Lamp Replacement 23
Halogen Lamp Replacement 15
Inert Gas Fill 13
Phosphor Coated Incandescent Lamps 13
Improve Bulb Insulation 10
PAR Lamp Manufacturing Process 5
Reduced Voltage Integrated Lamp 4
Filter Coating 3
Incandescent
High-Frequency Integrated Lamp 2
Multi-Photon Phosphors 31
Dimmable Instant-Start Ballasts 30
Electrode Materials Research 28
T-8 Lamp Replacement of T-12 26
Develop More Efficient Dimming Ballasts 23
T-5 Lamp Replacement 21
Fluorescent Electrode Erosion 21
Low Cost Dimmable CFL 20
Improved Spectral Power Distribution 18
Plasma Quantum Efficiency 17
Mercury Free Fluorescent Lighting 16
Nano-Scale Effects of Phosphor Particle and Crystal Structure 16
Fluorescent
Integrated Chip for SCFL Ballast 13

257
Category Technology Option Number of Votes
Develop High Power CFL 12
Reduce IR Emissions In Phosphors 11
Low Loss Power Transistors 9
Phosphor Materials Degradation 8
Low Voltage Control IC 6
Improved Magnetics 6
Novel CFL Reflectors Lamps 5
Reduction In Lamp Diameter 4
Alumina Phosphor Coating 4
Low Capacitance Power Transistors 3
Fluorescent (continued)
CFL-Ni 1
Electrodeless HID Lamp Development 31
Electrode Advancement 30
Systematic Studies of Candidate Molecular Discharge Systems 30
Develop Lamp With Short Restrike 28
Improve Arc Tube Material 28
Dimmable HID to 10% 28
HF Power Ballasts 26
Improve Ceramic Arc Tube Shape 25
Ceramic Arc Tube Chemistry 24
Integral Ballast HID 21
Novel HID Gas 21
HID Electrode Erosion 20
Lower Power HID 19
Low Power EL 15
HID
Develop New Arc Tube Material 13

258
Category Technology Option Number of Votes
Integral Screwbase EL 13
New Getter Material 11
Develop High Operating Voltage MH Lamps 11
Dimming Electronic Ballast for HPS 11
Better Power Transistors 11
LFSW Power Ballasts 10
HPS Smart Ballast 10
Develop High Operating Voltage HPS Lamps 10
Feedback Controlled HID & Ballast 9
Improve RF Ballast for HID 9
integral Starter Lamp 7
Ultra High Pressure MV 7
VHF Power Ballasts 7
Small Footprint EL 7
Efficient Magnetic Ballasts 6
New Methods for Sodium Density Determination 6
Ferrite Free Ballast Design 6
Cold-Cathode Research 5
DC Power Ballasts 3
Novel Mercury Dispenser 3
Novel Electrode for Cold Cathode Fluorescent Lamp (CCFL) 3
More Efficient Metal Halide Dose Chemistry 3
HID for Non-Imaging Optics 3
Long Life Operation of Quartz MH in Air 3
Pulsed Operation of MV Lamps 1
HID
(continued)
Replace LPS for MH and HPS 0

259
Category Technology Option Number of Votes
High Power LED 37
Monolithic White LEDs 28
Phosphor Materials 28
Integrated LED Screw Base PAR 27
System and Geometry Research 26
Color-Mixing 24
Optical Research 22
Buffer Research 20
Substrate Research 19
Novel Epimaterials 19
Etching, Chip-Shaping, Texturing 19
Device Electronics 19
Discrete LEDs 17
Photon Physics 16
Phosphor Synthesis and Application 16
Encapsulants 16
Low-Voltage LED Mr16 15
Electron-Hole Physics 15
Epitaxy Tools and Mechanisms 13
Reliability and Disposal 12
Iii-V Material Properties 11
Simulation Tools 11
Wafer Bonding and Film Transfer 8
Metallization and Thin Films 6
Electronics/Optics 3
Dimming Systems for Colormixing and Intensity Control 3
LED
LED Integration 3

260
Category Technology Option Number of Votes
Phosphor Free Emitters 3
Development of Creative But Cost Effective New LED Products 1
LED (continued)
Development of PV-Powered LED Products for Outdoor Applications
1
Degradation and Failure Processes 37
White Light Systems 36
Light Extraction Issues 34
Systematic Reliability Studies 22
Large Area Current Distribution 20
Photonic Emissions From Triplets 19
Manufacturing Issues 17
Organic Wavelength Converters 16
Novel Structures: Resonant Cavities, Hybrid Inorganic/Organic Structures
16
Optical Research 14
Electrode Material Research 14
Emitter Material 14
Encapsulation Technology Research 14
Substrate Research 12
Polymer Deposition Methods 12
Anode Material Development 10
Basic & Novel Polymer Materials Research 10
Basic Small Molecule Research 9
Advanced Modeling of Complex Organometallic Systems 8
Small Molecule Deposition Methods 6
Large Area Packaging 3
Environmental Coatings Deposition Methods 2
OLED
Electrode Material Deposition Methods 1

261
Category Technology Option Number of Votes
Theory 1
Device Physics 1
Morphology 1
Doping 1
OLED
(continued)
Photonic Emission Phenomena 1
Integrated Photosensors Luminaire 36
Exploratory Fixtures for WHITE SSL 36
Integrated Occupancy Sensors Luminaire 30
Off-Grid Fixtures and Luminaires 27
Identify General Illumination Applications for Low SPD SSL (I.E., Monochrome)
24
LED Signage Fixtures 23
Task-Ambient Luminaires 17
Luminaires for T-5 and Smaller Diameter Fluorescent Lamps 16
Dedicated CFL Sockets 16
Task Light Fixtures for Low Wattage HID 16
Develop CFL Luminaires 9
CFL Insulated Cans 8
Develop EL Signs and Remote Markers 8
HID Torchieres 7
Develop Induction Lamp Luminaires 6
Fluorescent CFL Luminaires With Built-In Ballasts 3
Efficient Fiber Optic Accent Light 3
Efficient Fiber Optic Fluorescent Lamp Replacement 3
Efficient Fiber Optic Downlight 3
Develop Induction Lamp Torchieres 2
Fixture
Aperture Lamps 0

262
Category Technology Option Number of Votes
Street Markers 26
HID Optical Coupling to Fiber Optic 19
Low Cost Fiber Optic 16
Hollow Tube Guide Materials 13
Light Pipe for High Power HID 12
Power Regulation on Main Bus 7
High Voltage DC Main 5
Distribution
Low Voltage DC Main 1
Integrated Skylight Luminaires 33
Dynamic Transmission Materials 27
Novel Window Treatments 19
Novel Transport Device 11
Develop Low-Cost Tracking for Heliostat 10
Scattered Light Collector 10
Passive Tracking for Heliostat 9
Coupling From Collector to Transport 7
Control Systems That Balance Ratio Daylight/Lighting 3
Daylighting
Novel Deep Throw Perimeter Daylighting Devices 3
Power Line Control Protocol 32
Standard Platform for Controls 30
Self-Commissioning Photosensors 29
Develop Interface to Building Controls 26
Develop Power Line Communications Protocol 26
Robust Photosensor Algorithms 25
Self-Commissioning Occupancy Sensors 24
Develop Wireless Standard for Controls 22
Personal Control over Lighting 20
Controls
Develop Compliant Ballasts to Standard Protocols 17

263
Category Technology Option Number of Votes
Load Shedding Ballasts 17
Modular Wireless Photosensor 15
Modular Wireless Occupancy Sensor 14
Electronic Ballasts & Controls 14
Wireless Remote Occupancy Sensors for SCFL 7
Intelligent Streetlights 7
Integrated Streetlights 5
Wireless Remote Photo Sensor for Screw-Based Compact Fluorescent Lamp (SCFL)
3
DALI Led Controls 3
Control of Color (Esp for SSL) 3
Protocols for Placing and Calibrating Photo and Occupancy Sensors
3
Controls for Distributed Lighting 3
Controls (continued)
Color Controlled HID Dimming 3
New Metrics for Color Rendering 29
Task Driven Lighting 24
Scotopic Enhanced Lighting 23
New Metrics for Light Output & Radiometry 23
Metric for Luminaire Efficiency 18
Visual Performance
Optimized Lighting for Night-Time Applications 6
Circadian Enhanced Lighting 29
Limits of Acceptability 21
Light Level and Productivity 17
Light Color and Productivity 16
Productivity
Light Level Control and Productivity (Lightright) 3

264
U.S. Department of Energy Office of Energy Efficiency and Renewable Energy