usd 336, holton - welcome to ksde
TRANSCRIPT
USD 336, Holton

• Budget General Information (characteristics of district)
• Supplemental Information for Tables in Summary of Expenditures
• KSDE Website Information Available
• Summary of Expenditures (Sumexpen.xls)
i

1
2009-2010 Budget General Information USD #: 336
Introduction
Holton Unified School District 336 is located in Holton, Kansas, in the rolling hills of northeast Kansas and the county seat of Jackson County, just 30 miles north of the State’s Capital, Topeka, Kansas. The educational mission of the school district and the fundamental belief of the Holton Schools is that every child can learn, and the primary purpose of the staff and administration is to provide each student with the learning opportunities in order for them to establish a foundation for success, both now and in the future. The Board of Education, administration, faculty and staff accept their responsibilities for implementing and achieving the mission of Holton Unified School District 336
Board Members Allen Arnold, Board Member 15942 238th Road, Holton, KS 66436 785-364-2293 Steven Bowser, Board President 19610 P Road, Holton, KS 66436 785-364-4994 Mike Ford, Board Member, 127 Roselawn, Holton, KS 66436 785-364-2641 Todd Holaday, Board Vice-President, 11756 234th Lane, Holton, KS 66436 785-364-5007 Shelby Patch, Board Member 12738 Prairie Drive, Holton, KS 66436 785-364-5382 Bob Phillips, Board Member, 19890 Q Road, Holton, KS 66436 785-364-3489 Jay Watkins, Board Member 110 Marilyn Drive, Holton, KS 66436 785-364-4266
Key Staff Superintendent: Dr. Jim Karleskint Business Office Staff: Dee Folk, Board Clerk Doris Yonke, Accounts Payable Clerk Kelly Eck, Treasurer and Supt. Secretary Curriculum & Instruction Staff: Dr. Jim Karleskint Other Key Contacts: Mark B. Wilson, Director, Special Education Cooperative Dr. Vicki Smith, Assistant Director, Special Education Cooperative John Ernst, High School Principal Mitch Beims, Assistant High School Principal/Athletic Director Ralph Blevins, Middle School Principal Katherine Cooney, Central Elementary Principal Mark C. Wilson, Colorado Elementary Principal

2
The District’s Accomplishments and Challenges
Accomplishments: Central and Colorado Schools are again recognized and accredited by NCA-CASI and CETA and in their final year of the third cycle. Colorado put on a successful, week long Math Camp over the summer for our 1st and second graders. It will be presented at the Kansas Math conference this fall. We have also started a Healthy Celebration where our kids are learning proper health habits through fun activities throughout the year. Test scores on the ITBS increased dramatically last year with an increase of 20% reaching the 80% tile in both math and reading. Curriculum and instruction will be the focus through data analysis this year. Our Professional Learning Committees will meet as often as needed to drive any changes that need to take place. We are working to improve the use of the SIT and other programs to better target and help at-risk students. In addition, Central will work closer with Colorado to improve the use of the Site Council. As a staff we want to maintain a safe environment and develop a shared vision that will make a difference in the lives of our students. The high school has established AP Calculus and AP Chemistry, which will be taught by current staff members. Online classes for AP courses and other courses not currently taught at the high school will continue to be offered. New courses have been added in the area of science: Environmental Science and Anatomy/Physiology. The science curriculum is being aligned to state standards, and new resources for each science course have been identified. In Fine Arts, Percussions has been added in the field of music. Technology advances include equipping classrooms with projectors and several new smartboards. A new science room was prepared to meet the science needs. A daily after school program has been developed to meet needs of at- risk students. A late start schedule on Thursdays offers time to work with struggling students and address their needs early on. On-the-job training in the Special Education area includes managing a daily snack bar at the high school. As a building, Professional Learning Communities were launched and late start Thursdays were used to facilitate these groups. Challenges: We have added to our Voc-Ed staff but continue to face shortages of teaching resources within our district. We need an additional central office staff to assist in curriculum, testing, federal programs, and human resources. Implementing a more stringent math and science program K-12. The district is in need of expanding facilities. The district continues to strive for development of an all-day kindergarten program. It was necessary to place chorus and band in the same room to create additional class space. We continue the development of our Professional Learning Communities. Our greatest and most pressing challenge is to ensure that we educate our students and to prepare them for the 21st Century, and we must look at how we teach students in order to ensure expanded and diverse learning opportunities for each of our students. As a district, we strive to continue to better communicate to our Board of Education and the public what our challenges truly are as related to our curriculum and facilities.

3
Supplemental Information for the Following Tables 1. Summary of Total Expenditures by Function (All Funds) 2. Summary of General Fund Expenditures by Function 3. Summary of Supplemental General Fund Expenditures by Function 4. Summary of General and Supplemental General Fund Expenditures by Function 5. Summary of Special Education Fund by Function 6. Instruction Expenditures (1000) 7. Student and Instructional Support Expenditures (2100 & 2200) 8. General Administration Expenditures (2300) 9. School Administration Expenditures (2400) 10. Operations and Maintenance Expenditures (2600) 11. Other Costs (2500 & 2900: Other Supplemental Services) (3000: Non-Instruction Services) 12. Capital Improvements (4000) 13. Debt Services (5000) 14. Miscellaneous Information Unencumbered Cash Balance by Fund 15. Reserve Funds Unencumbered Cash Balance 16. Other Information - FTE 17. Miscellaneous Information Mill Rates by Fund 18. Other Information – Assessed Valuation and Bonded Indebtedness Note: The FTE (full time equivalency) used in this report to calculate the “Amount Per Pupil” is defined as following: Enrollment (FTE) includes the enrollment of the district used for state aid and budget authority, and all other preschool enrollment and kindergarten students attending full time.

4
KSDE Website Information Available K-12 Statistics (Building, District or State Totals) http://www.ksde.org/Default.aspx?tabid=223
• Attendance / Enrollment Reports • Staff Reports • Graduates / Dropouts Reports • Crime / Violence Reports
School Finance Reports and Publications http://www.ksde.org/Default.aspx?tabid=1870
• Certified Personnel • Enrollment • Dropouts • Graduates • Salary Reports
Kansas Building Report Card (listed on the right under Data Portal sections) http://www.ksde.org/Default.aspx?tabid=229
• Attendance Rate • Graduation Rate • Dropout Rate • School Violence • Assessments
o Reading o Mathematics o Writing
• Graduates Passing Adv. Science Courses • Graduates Passing Adv. Math Courses

USD# 336
Summary of Total Expenditures By Function
(All Funds)
% % % % %2007-2008 of 2008-2009 of inc/ 2009-2010 of inc/
Actual Tot Actual Tot dec Budget Tot dec
Instruction 12,125,721 72% 12,437,599 72% 3% 12,292,016 62% -1%
Student & Instructional Support 1,008,636 6% 923,372 5% -8% 2,834,239 14% 207%
General Administration 426,899 3% 456,000 3% 7% 478,109 2% 5%
School Administration (Building) 600,998 4% 632,860 4% 5% 623,761 3% -1%
Operations & Maintenance 1,072,988 6% 1,187,095 7% 11% 1,257,402 6% 6%
Capital Improvements 282,753 2% 152,516 1% -46% 560,000 3% 267%
Debt Services 413,253 2% 410,546 2% -1% 411,659 2% 0%
Other Costs 971,765 6% 1,073,750 6% 10% 1,330,585 7% 24%
Total Expenditures 16,903,013 100% 17,273,738 100% 2% 19,787,771 100% 15%
Amount per Pupil $15,579 $16,415 5% $18,601 13%
Note: Percentages on charts are within +-1% due to rounding used. Pie graph percentages may differ from charts for this reason also.
Further definition of what goes into each category:Instruction - 1000 Operations & Maintenance - 2600Student & Instructional Support - 2100 & 2200 Other Costs - 2500, 2900 and 3000 and all others not included elsewhereGeneral Administration - 2300 Capital Improvements - 4000School Administration (Building) - 2400 Debt Services - 5100 Transfers - 5200
The funds that are included in the categories above are: General, Supplemental General, Bilingual Education, At Risk(4yr Old), At Risk(K-12), Virtual Education, Capital Outlay, Driver Education, Extraordinary School Program, Summer School, Special Education, Vocational Education, Professional Development, Bond & Interest #1, Bond & Interest #2, No-Fund Warrant, Special Assessment, Parent Education, School Retirement, Student Materials Revolving & Textbook Rental, Tuition Reimbursement, Gifts/Grants, KPERS Special Retirement Contribution, Contingency, Special Liability Expense, Federal Funds, Adult Education, Adult Supplemental Education, Area Vocational School, and Special Education Coop.
0
2,000,000
4,000,000
6,000,000
8,000,000
10,000,000
12,000,000
14,000,000
Instruction Student & Instructional Support
General Administration
School Administration
(Building)
Operations & Maintenance
Capital Improvements
Debt Services Other Costs
Summary of Total Expenditures By Function (All Funds)
2007-2008
2008-2009
2009-2010
Instruction62%
Student & Instructional Support14%
General Administration3%
School Administration (Building)
3%
Operations & Maintenance6%
Capital Improvements3%
Debt Services2% Other Costs
7%
2009-2010 Summary of Total Expenditures By Function(All Funds)
Instruction
Student & Instructional Support
General Administration
School Administration (Building)
Operations & Maintenance
Capital Improvements
Debt Services
Other Costs
9/21/2009 4:21 PM Sumexpen.xls Page 1 of 19

USD# 336
Summary of General Expendituresby Function
% % % % %2007-2008 of 2008-2009 of inc/ 2009-2010 of inc/
Actual Tot Actual Tot dec Budget Tot dec
Instruction 3,470,404 64% 3,155,343 62% -9% 2,992,673 61% -5%
Student & Instructional Support 528,574 10% 512,138 10% -3% 516,285 11% 1%
General Administration 105,571 2% 110,014 2% 4% 110,300 2% 0%
School Administration (Building) 515,718 9% 549,149 11% 6% 527,000 11% -4%
Operations & Maintenance 401,799 7% 388,582 8% -3% 382,946 8% -1%
Capital Improvements 0 0% 0 0% 0% 0 0% 0%
Other Costs 413,017 8% 377,200 7% -9% 371,300 8% -2%
Total Expenditures 5,435,083 100% 5,092,426 100% -6% 4,900,504 100% -4%
Amount per Pupil $5,009 $4,839 -3% $4,607 -5%
The Summary of General Fund Expenditures chart information comes from pages 6-13 and only uses the 'General Fund' line items.
1 500 000
2,000,000
2,500,000
3,000,000
3,500,000
4,000,000
Summary of General Fund Expendituresby Function
2007-2008
2008-2009
2009-2010
0
500,000
1,000,000
1,500,000
2,000,000
2,500,000
3,000,000
3,500,000
4,000,000
Instruction Student & Instructional
Support
General Administration
School Administration
(Building)
Operations & Maintenance
Capital Improvements
Other Costs
Summary of General Fund Expendituresby Function
2007-2008
2008-2009
2009-2010
Instruction61%
Student & Instructional Support
10%
General Administration2%
School Administration (Building)
11%
Operations & Maintenance8%
Other Costs8%
2009-2010 Summary of General Fund Expendituresby Function
Instruction
Student & Instructional Support
General Administration
School Administration (Building)
Operations & Maintenance
Capital Improvements
Other Costs
9/21/2009 4:21 PM Sumexpen.xls Page 2 of 19

USD# 336
Summary of Supplemental General Fund Expendituresby Function
% % % % %2007-2008 of 2008-2009 of inc/ 2009-2010 of inc/
Actual Tot Actual Tot dec Budget Tot dec
Instruction 1,266,292 64% 1,447,824 63% 14% 1,228,929 55% -15%
Student & Instructional Support 101,537 5% 90,722 4% -11% 105,000 5% 16%
General Administration 461 0% 432 0% -6% 500 0% 16%
School Administration (Building) 51,735 3% 47,459 2% -8% 55,500 2% 17%
Operations & Maintenance 546,815 28% 691,159 30% 26% 735,000 33% 6%
Capital Improvements 0 0% 0 0% 0% 0 0% 0%
Other Costs 12,549 1% 9,764 0% -22% 110,500 5% 1032%
Total Expenditures 1,979,389 100% 2,287,360 100% 16% 2,235,429 100% -2%
Amount per Pupil $1,824 $2,174 19% $2,101 -3%
The Summary of Supplemental General Fund Expenditures chart information comes from pages 6-13 and only uses the 'Supplemental General Fund' line items.
800 000
1,000,000
1,200,000
1,400,000
1,600,000
Summary of Supplemental General Fund Expendituresby Function
2007-2008
2008-2009
2009-2010
Instruction55%
Student & Instructional Support
5%
School Administration (Building)
2%
Operations & Maintenance
33%
Other Costs5%
2009-2010 Summary of Supplemental General Fund Expendituresby Function
InstructionStudent & Instructional SupportGeneral AdministrationSchool Administration (Building)Operations & MaintenanceCapital ImprovementsOther Costs
0
200,000
400,000
600,000
800,000
1,000,000
1,200,000
1,400,000
1,600,000
Instruction Student & Instructional
Support
General Administration
School Administration
(Building)
Operations & Maintenance
Capital Improvements
Other Costs
Summary of Supplemental General Fund Expendituresby Function
2007-2008
2008-2009
2009-2010
9/21/2009 4:21 PM Sumexpen.xls Page 3 of 19

USD# 336Summary of General and Supplemental General Fund
Expenditures by Function
% % % % %2007-2008 of 2008-2009 of inc/ 2009-2010 of inc/
Actual Tot Actual Tot dec Budget Tot dec
Instruction 4,736,696 64% 4,603,167 62% -3% 4,221,602 59% -8%
Student & Instructional Support 630,111 8% 602,860 8% -4% 621,285 9% 3%
General Administration 106,032 1% 110,446 1% 4% 110,800 2% 0%
School Administration (Building) 567,453 8% 596,608 8% 5% 582,500 8% -2%
Operations & Maintenance 948,614 13% 1,079,741 15% 14% 1,117,946 16% 4%
Capital Improvements 0 0% 0 0% 0% 0 0% 0%
Other Costs 425,566 6% 386,964 5% -9% 481,800 7% 25%
Total Expenditures 7,414,472 100% 7,379,786 100% 0% 7,135,933 100% -3%
Amount per Pupil $6,834 $7,013 3% $6,708 -4%
The Summary of General and Supplemental General Fund Expenditures chart information comes from pages 6-13 and adds togetherthe 'General Fund' and 'Supplemental General Fund' line items.
1,500,000
2,000,000
2,500,000
3,000,000
3,500,000
4,000,000
4,500,000
5,000,000
Summary of General and Supplemental General FundExpenditures by Function
2007-2008
2008-2009
2009-2010
0
500,000
1,000,000
1,500,000
2,000,000
2,500,000
3,000,000
3,500,000
4,000,000
4,500,000
5,000,000
Instruction Student & Instructional
Support
General Administration
School Administration
(Building)
Operations & Maintenance
Capital Improvements
Other Costs
Summary of General and Supplemental General FundExpenditures by Function
2007-2008
2008-2009
2009-2010
Instruction59%
Student & Instructional Support
9%
General Administration1%
School Administration (Building)
8%
Operations & Maintenance16%
Other Costs7%
2009-2010 Summary of General and Supplemental General Fund Expenditures by Function
Instruction
Student & Instructional Support
General Administration
School Administration (Building)
Operations & Maintenance
Capital Improvements
Other Costs
9/21/2009 4:21 PM Sumexpen.xls Page 4 of 19

USD# 336
Summary of Special Education Fundby Function
% % % % %2007-2008 of 2008-2009 of inc/ 2009-2010 of inc/
Actual Tot Actual Tot dec Budget Tot dec
Instruction 1,310,535 97% 1,336,990 97% 2% 1,417,102 96% 6%
Student & Instructional Support 0 0% 0 0% 0% 500 0% 0%
General Administration 0 0% 0 0% 0% 0 0% 0%
School Administration (Building) 0 0% 0 0% 0% 0 0% 0%
Operations & Maintenance 0 0% 0 0% 0% 0 0% 0%
Capital Improvements 0 0% 0 0% 0% 0 0% 0%
Other Costs 35,146 3% 45,984 3% 31% 52,500 4% 14%
Total Expenditures 1,345,681 100% 1,382,974 100% 3% 1,470,102 100% 6%
Amount per Pupil $1,240 $1,314 6% $1,382 5%
The Summary of Special Education Fund Expenditures chart information comes from pages 6-13 and only uses the 'Special Education Fund'line items. (Total expenditures excludes Special Ed Coop Fund because it would include expenditures for all schools participating in the Coop.)
600,000
800,000
1,000,000
1,200,000
1,400,000
1,600,000
Summary of Special Education Fund Expendituresby Function
2007-2008
2008-2009
2009-2010
0
200,000
400,000
600,000
800,000
1,000,000
1,200,000
1,400,000
1,600,000
Instruction Student & Instructional
Support
General Administration
School Administration
(Building)
Operations & Maintenance
Capital Improvements
Other Costs
Summary of Special Education Fund Expendituresby Function
2007-2008
2008-2009
2009-2010
Instruction96%
Other Costs4%
2009-2010 Summary of Special Education Fundby Function
Instruction
Student & Instructional Support
General Administration
School Administration (Building)
Operations & Maintenance
Capital Improvements
Other Costs
9/21/2009 4:21 PM Sumexpen.xls Page 5 of 19

USD# 336Instruction Expenditures (1000)
% %2007-2008 2008-2009 inc/ 2009-2010 inc/
Actual Actual dec Budget dec
General 3,470,404 3,155,343 -9% 2,992,673 -5%Federal Funds 227,824 226,672 -1% 285,304 26%Supplemental General 1,266,292 1,447,824 14% 1,228,929 -15%At Risk (4yr Old) 0 0 0% 0 0%At Risk (K-12) 358,968 504,772 41% 507,100 0%Bilingual Education 0 0 0% 0 0%Virtual Education 0 0 0%Capital Outlay 208,379 52,527 -75% 55,000 5%Driver Education 6,730 20,803 209% 36,282 74%Declining Enrollment 0 0 0% 0 0%Extraordinary School Program 0 0 0% 0 0%Food Service 0 0 0% 0 0%Professional Development 0 0 0% 0 0%Parent Education Program 0 0 0% 0 0%Summer School 35,657 37,202 4% 34,693 -7%Special Education 1,310,535 1,336,990 2% 1,417,102 6%Cost of Living 0 0 0% 0 0%Vocational Education 335,023 363,993 9% 360,000 -1%Gifts/Grants 0 0 0% 6,542 0%Special Liability 0 0 0% 0 0%School Retirement 0 0 0% 0 0%Extraordinary Growth Facilities 0 0 0% 0 0%Special Reserve 0 0 0%KPERS Spec. Ret. Contribution 523,307 565,534 8% 637,752 13%Contingency Reserve 0 0 0%Text Book & Student Material 125,091 44,433 -64%Bond & Interest #1 0 0 0% 0 0%Bond & Interest #2 0 0 0% 0 0%No-Fund Warrant 0 0 0% 0 0%Special Assessment 0 0 0% 0 0%Temporary Note 0 0 0% 0 0%
SUBTOTAL 7,868,210 7,756,093 -1% 7,561,377 -3%Enrollment (FTE)* 1,085.0 1,052.3 -3% 1,063.8 1%Amount per Pupil 7,252 7,371 2% 7,108 -4%
Adult Education 0 0 0% 0 0%Adult Supplemental Education 0 0 0% 0 0%A V i l S h l 0 0 0%Area Vocational School 0 0 0%Tuition Reimbursement 0 0 0% 0 0%Special Education Coop 4,257,511 4,681,506 10% 4,730,639 1%TOTAL 12,125,721 12,437,599 3% 12,292,016 -1%
NOTE: Gifts/Grants includes private grants and grants from nonfederal sources.
Amount per pupil excludes the following funds: Area Vocational School, Adult Education, Adult Supplemental Education,Special Education Coop and Tuition Reimbursement.
*Enrollment (FTE) includes the enrollment of the district used for state aid and budget authority, and all other preschool enrollmentand kindergarten students attending full time.
0
2,000,000
4,000,000
6,000,000
8,000,000
10,000,000
12,000,000
14,000,000
2007-2008 2008-2009 2009-2010
Instruction Expenditures
0
500,000
1,000,000
1,500,000
2,000,000
2,500,000
3,000,000
3,500,000
4,000,000
2007-2008 2008-2009 2009-2010
Instruction Expenditures
General
Supplemental General
Special Education
9/21/2009 4:21 PM Sumexpen.xls Page 6 of 19

USD# 336
Student and Instructional Support Expenditures (2100 & 2200)
% %2007-2008 2008-2009 inc/ 2009-2010 inc/
Actual Actual dec Budget dec
General 528,574 512,138 -3% 516,285 1%Federal Funds 0 0 0% 0 0%Supplemental General 101,537 90,722 -11% 105,000 16%At Risk (4yr Old) 0 0 0% 0 0%At Risk (K-12) 0 0 0% 0 0%Bilingual Education 0 0 0% 0 0%Virtual Education 0 0 0%Capital Outlay 20,030 6,882 -66% 7,000 2%Driver Training 0 0 0% 0 0%Declining Enrollment 0 0 0% 0 0%Extraordinary School Program 0 0 0% 0 0%Food Service 0 0 0% 0 0%Professional Development 91,269 49,385 -46% 46,636 -6%Parent Education Program 13,100 14,300 9% 11,300 -21%Summer School 0 0 0% 0 0%Special Education 0 0 0% 500 0%Cost of Living 0 0 0% 0 0%Vocational Education 0 0 0% 0 0%Gifts/Grants 0 0 0% 0 0%Special Liability 0 0 0% 0 0%School Retirement 0 0 0% 0 0%Extraordinary Growth Facilities 0 0 0% 0 0%Special Reserve 0 0 0%KPERS Spec. Ret. Contribution 33,545 36,252 8% 41,260 14%Contingency Reserve 0 0 0%Text Book & Student Material 11,931 11,193 -6%Bond & Interest #1 0 0 0% 0 0%Bond & Interest #2 0 0 0% 0 0%No-Fund Warrant 0 0 0% 0 0%Special Assessment 0 0 0% 0 0%Temporary Note 0 0 0% 0 0%
SUBTOTAL 799,986 720,872 -10% 727,981 1%Enrollment (FTE)* 1,085.0 1,052.3 -3% 1,063.8 1%Amount per Pupil 737 685 -7% 684 0%
Adult Education 0 0 0% 0 0%Adult Supplemental Education 0 0 0% 0 0%Area Vocational School 0 0 0%Tuition Reimbursement 0 0 0% 0 0%Special Education Coop 208,650 202,500 -3% 2,106,258 940%TOTAL 1,008,636 923,372 -8% 2,834,239 207%Amount per Pupil $930 $877 -6% $2,664 204%
NOTE: Gifts/Grants includes private grants and grants from nonfederal sources.
Amount per pupil excludes the following funds: Area Vocational School, Adult Education, Adult Supplemental Education,Special Education Coop and Tuition Reimbursement.
*Enrollment (FTE) includes the enrollment of the district used for state aid and budget authority, and all other preschool enrollmentand kindergarten students attending full time.
0
500,000
1,000,000
1,500,000
2,000,000
2,500,000
3,000,000
2007-2008 2008-2009 2009-2010
Student and Instructional Support Expenditures
9/21/2009 4:21 PM Sumexpen.xls Page 7 of 19

USD# 336
General Administration Expenditures (2300)
% %2007-2008 2008-2009 inc/ 2009-2010 inc/
Actual Actual dec Budget dec
General 105,571 110,014 4% 110,300 0%Federal Funds 6,044 3,493 -42% 15,000 329%Supplemental General 461 432 -6% 500 16%At Risk (4yr Old) 0 0 0% 0 0%At Risk (K-12) 0 0 0% 0 0%Bilingual Education 0 0 0% 0 0%Virtual Education 0 0 0%Capital Outlay 0 0 0% 0 0%Driver Training 0 0 0% 0 0%Declining Enrollment 0 0 0% 0 0%Extraordinary School Program 0 0 0% 0 0%Food Service 0 0 0% 0 0%Professional Development 0 0 0% 0 0%Parent Education Program 0 0 0% 0 0%Summer School 0 0 0% 0 0%Special Education 0 0 0% 0 0%Cost of Living 0 0 0% 0 0%Vocational Education 0 0 0% 0 0%Gifts/Grants 0 0 0% 0 0%Special Liability Expense 0 0 0% 0 0%School Retirement 0 0 0% 0 0%Extraordinary Growth Facilities 0 0 0% 0 0%Special Reserve 0 0 0%KPERS Spec. Ret. Contribution 26,836 29,002 8% 33,009 14%Contingency Reserve 0 0 0%Text Book & Student Material 0 0 0%Bond & Interest #1 0 0 0% 0 0%Bond & Interest #2 0 0 0% 0 0%No-Fund Warrant 0 0 0% 0 0%Special Assessment 0 0 0% 0 0%Temporary Note 0 0 0% 0 0%
SUBTOTAL 138,912 142,941 3% 158,809 11%Enrollment (FTE)* 1,085.0 1,052.3 -3% 1,063.8 1%Amount per Pupil 128 136 6% 149 10%
Adult Education 0 0 0% 0 0%Adult Education 0 0 0% 0 0%Adult Supplemental Education 0 0 0% 0 0%Area Vocational School 0 0 0%Tuition Reimbursement 0 0 0% 0 0%Special Education Coop 287,987 313,059 0% 319,300 2%TOTAL 426,899 456,000 7% 478,109 5%
NOTE: Gifts/Grants includes private grants and grants from nonfederal sources.
Amount per pupil excludes the following funds: Area Vocational School, Adult Education, Adult Supplemental Education,Special Education Coop and Tuition Reimbursement.
*Enrollment (FTE) includes the enrollment of the district used for state aid and budget authority, and all other preschool enrollmentand kindergarten students attending full time.
0
100,000
200,000
300,000
400,000
500,000
600,000
2007-2008 2008-2009 2009-2010
General Administration Expenditures
9/21/2009 4:21 PM Sumexpen.xls Page 8 of 19
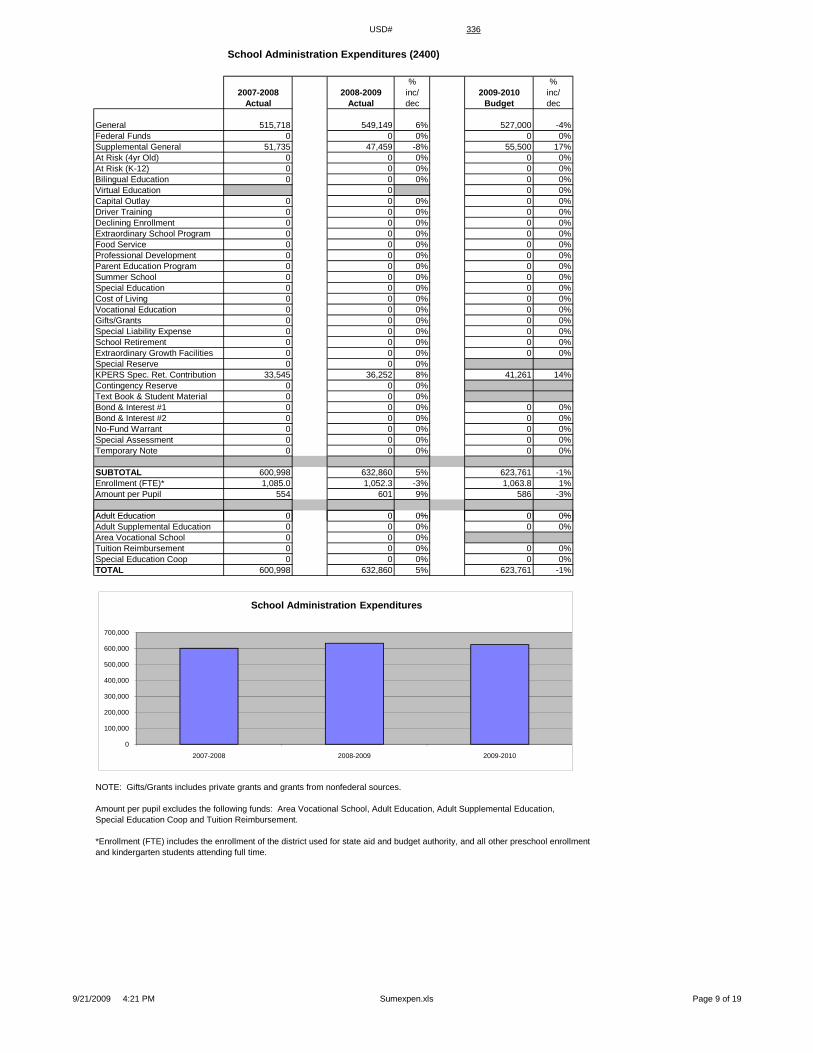
USD# 336
School Administration Expenditures (2400)
% %2007-2008 2008-2009 inc/ 2009-2010 inc/
Actual Actual dec Budget dec
General 515,718 549,149 6% 527,000 -4%Federal Funds 0 0 0% 0 0%Supplemental General 51,735 47,459 -8% 55,500 17%At Risk (4yr Old) 0 0 0% 0 0%At Risk (K-12) 0 0 0% 0 0%Bilingual Education 0 0 0% 0 0%Virtual Education 0 0 0%Capital Outlay 0 0 0% 0 0%Driver Training 0 0 0% 0 0%Declining Enrollment 0 0 0% 0 0%Extraordinary School Program 0 0 0% 0 0%Food Service 0 0 0% 0 0%Professional Development 0 0 0% 0 0%Parent Education Program 0 0 0% 0 0%Summer School 0 0 0% 0 0%Special Education 0 0 0% 0 0%Cost of Living 0 0 0% 0 0%Vocational Education 0 0 0% 0 0%Gifts/Grants 0 0 0% 0 0%Special Liability Expense 0 0 0% 0 0%School Retirement 0 0 0% 0 0%Extraordinary Growth Facilities 0 0 0% 0 0%Special Reserve 0 0 0%KPERS Spec. Ret. Contribution 33,545 36,252 8% 41,261 14%Contingency Reserve 0 0 0%Text Book & Student Material 0 0 0%Bond & Interest #1 0 0 0% 0 0%Bond & Interest #2 0 0 0% 0 0%No-Fund Warrant 0 0 0% 0 0%Special Assessment 0 0 0% 0 0%Temporary Note 0 0 0% 0 0%
SUBTOTAL 600,998 632,860 5% 623,761 -1%Enrollment (FTE)* 1,085.0 1,052.3 -3% 1,063.8 1%Amount per Pupil 554 601 9% 586 -3%
Adult Education 0 0 0% 0 0%Adult Education 0 0 0% 0 0%Adult Supplemental Education 0 0 0% 0 0%Area Vocational School 0 0 0%Tuition Reimbursement 0 0 0% 0 0%Special Education Coop 0 0 0% 0 0%TOTAL 600,998 632,860 5% 623,761 -1%
NOTE: Gifts/Grants includes private grants and grants from nonfederal sources.
Amount per pupil excludes the following funds: Area Vocational School, Adult Education, Adult Supplemental Education,Special Education Coop and Tuition Reimbursement.
*Enrollment (FTE) includes the enrollment of the district used for state aid and budget authority, and all other preschool enrollmentand kindergarten students attending full time.
0
100,000
200,000
300,000
400,000
500,000
600,000
700,000
2007-2008 2008-2009 2009-2010
School Administration Expenditures
9/21/2009 4:21 PM Sumexpen.xls Page 9 of 19

USD# 336
Operations and Maintenance Expenditures (2600)
% %2007-2008 2008-2009 inc/ 2009-2010 inc/
Actual Actual dec Budget dec
General 401,799 388,582 -3% 382,946 -1%Federal Funds 0 0 0% 0 0%Supplemental General 546,815 691,159 26% 735,000 6%At Risk (4yr Old) 0 0 0% 0 0%At Risk (K-12) 0 0 0% 0 0%Bilingual Education 0 0 0% 0 0%Virtual Education 0 0 0%Capital Outlay 70,103 38,332 -45% 40,000 4%Driver Training 341 1,124 230% 2,000 78%Declining Enrollment 0 0 0% 0 0%Extraordinary School Program 0 0 0% 0 0%Food Service 979 684 -30% 700 2%Professional Development 0 0 0% 0 0%Parent Education Program 0 0 0% 0 0%Summer School 0 0 0% 0 0%Special Education 0 0 0% 0 0%Cost of Living 0 0 0% 0 0%Vocational Education 0 0 0% 0 0%Gifts/Grants 0 0 0% 0 0%Special Liability 0 0 0% 0 0%School Retirement 0 0 0% 0 0%Extraordinary Growth Facilities 0 0 0% 0 0%Special Reserve 0 0 0%KPERS Spec. Ret. Contribution 20,127 21,751 8% 24,756 14%Contingency Reserve 0 0 0%Text Book & Student Material 0 0 0%Bond & Interest #1 0 0 0% 0 0%Bond & Interest #2 0 0 0% 0 0%No-Fund Warrant 0 0 0% 0 0%Special Assessment 0 0 0% 0 0%Temporary Note 0 0 0% 0 0%
SUBTOTAL 1,040,164 1,141,632 10% 1,185,402 4%Enrollment (FTE)* 1,085.0 1,052.3 -3% 1,063.8 1%Amount per Pupil 959 1,085 13% 1,114 3%
Adult Education 0 0 0% 0 0%Adult Education 0 0 0% 0 0%Adult Supplemental Education 0 0 0% 0 0%Area Vocational School 0 0 0%Tuition Reimbursement 0 0 0% 0 0%Special Education Coop 32,824 45,463 39% 72,000 58%TOTAL 1,072,988 1,187,095 11% 1,257,402 6%
NOTE: Gifts/Grants includes private grants and grants from nonfederal sources.
Amount per pupil excludes the following funds: Area Vocational School, Adult Education, Adult Supplemental Education,Special Education Coop and Tuition Reimbursement.
*Enrollment (FTE) includes the enrollment of the district used for state aid and budget authority, and all other preschool enrollmentand kindergarten students attending full time.
0
200,000
400,000
600,000
800,000
1,000,000
1,200,000
1,400,000
2007-2008 2008-2009 2009-2010
Operations and Maintenance Expenditures
9/21/2009 4:21 PM Sumexpen.xls Page 10 of 19

USD# 336
Other Costs(2500 & 2900: Other Supplemental Services)
(2700: Transportation)(3000: Non-Instruction Services)
% %2007-2008 2008-2009 inc/ 2009-2010 inc/
Actual Actual dec Budget dec
General 413,017 377,200 -9% 371,300 -2%Federal Funds 0 0 0% 0 0%Supplemental General 12,549 9,764 -22% 110,500 1032%At Risk (4yr Old) 0 0 0% 0 0%At Risk (K-12) 1,129 2,525 124% 2,550 1%Bilingual Education 0 0 0% 0 0%Virtual Education 0 0 0%Capital Outlay 0 122,640 0% 200,000 63%Driver Training 0 0 0% 0 0%Declining Enrollment 0 0 0% 0 0%Extraordinary School Program 0 0 0% 0 0%Food Service 425,179 435,638 2% 497,474 14%Professional Development 0 0 0% 0 0%Parent Education Program 0 0 0% 0 0%Summer School 0 0 0% 0 0%Special Education 35,146 45,984 31% 52,500 14%Cost of Living 0 0 0% 0 0%Vocational Education 0 0 0% 0 0%Gifts/Grants 0 0 0% 0 0%Special Liability 0 0 0% 0 0%School Retirement 0 0 0% 0 0%Extraordinary Growth Facilities 0 0 0% 0 0%Special Reserve 0 0 0%KPERS Spec. Ret. Contribution 33,545 36,253 8% 41,261 14%Contingency Reserve 0 0 0%Text Book & Student Material 0 0 0%Bond & Interest #1 0 0 0% 0 0%Bond & Interest #2 0 0 0% 0 0%No-Fund Warrant 0 0 0% 0 0%Special Assessment 0 0 0% 0 0%Temporary Note 0 0 0% 0 0%
SUBTOTAL 920,565 1,030,004 12% 1,275,585 24%Enrollment (FTE)* 1 085 0 1 052 3 3% 1 063 8 1%Enrollment (FTE)* 1,085.0 1,052.3 -3% 1,063.8 1%Amount per Pupil 848 979 15% 1,199 23%
Adult Education 0 0 0% 0 0%Adult Supplemental Education 0 0 0% 0 0%Area Vocational School 0 0 0%Tuition Reimbursement 0 0 0% 0 0%Special Education Coop 51,200 43,746 -15% 55,000 26%TOTAL 971,765 1,073,750 10% 1,330,585 24%
NOTE: Gifts/Grants includes private grants and grants from nonfederal sources.
Amount per pupil excludes the following funds: Area Vocational School, Adult Education, Adult Supplemental Education,Special Education Coop and Tuition Reimbursement.
*Enrollment (FTE) includes the enrollment of the district used for state aid and budget authority, and all other preschool enrollmentand kindergarten students attending full time.
0
200,000
400,000
600,000
800,000
1,000,000
1,200,000
1,400,000
2007-2008 2008-2009 2009-2010
Other Costs
9/21/2009 4:21 PM Sumexpen.xls Page 11 of 19

USD# 336
Capital Improvements Expenditures (4000)
% %2007-2008 2008-2009 inc/ 2009-2010 inc/
Actual Actual dec Budget dec
General 0 0 0% 0 0%Federal Funds 0 0 0% 0 0%Supplemental General 0 0 0% 0 0%At Risk (4yr Old) 0 0 0% 0 0%At Risk (K-12) 0 0 0% 0 0%Bilingual Education 0 0 0% 0 0%Virtual Education 0 0 0%Capital Outlay 282,753 152,516 -46% 560,000 267%Driver Training 0 0 0% 0 0%Declining Enrollment 0 0 0% 0 0%Extraordinary School Program 0 0 0% 0 0%Food Service 0 0 0% 0 0%Professional Development 0 0 0% 0 0%Parent Education Program 0 0 0% 0 0%Summer School 0 0 0% 0 0%Special Education 0 0 0% 0 0%Cost of Living 0 0 0% 0 0%Vocational Education 0 0 0% 0 0%Gifts/Grants 0 0 0% 0 0%Special Liability 0 0 0% 0 0%School Retirement 0 0 0% 0 0%Extraordinary Growth Facilities 0 0 0% 0 0%Special Reserve 0 0 0%KPERS Spec. Ret. Contribution 0 0 0% 0 0%Contingency Reserve 0 0 0%Text Book & Student Material 0 0 0%Bond & Interest #1 0 0 0% 0 0%Bond & Interest #2 0 0 0% 0 0%No-Fund Warrant 0 0 0% 0 0%Special Assessment 0 0 0% 0 0%Temporary Note 0 0 0% 0 0%
SUBTOTAL 282,753 152,516 -46% 560,000 267%Enrollment (FTE)* 1,085.0 1,052.3 -3% 1,063.8 1%Amount per Pupil 261 145 -44% 526 263%
Adult Education 0 0 0% 0 0%Ad lt S l t l Ed ti 0 0 0% 0 0%Adult Supplemental Education 0 0 0% 0 0%Area Vocational School 0 0 0%Tuition Reimbursement 0 0 0% 0 0%Special Education Coop 0 0 0% 0 0%TOTAL 282,753 152,516 -46% 560,000 267%
NOTE: Gifts/Grants includes private grants and grants from nonfederal sources.
Amount per pupil excludes the following funds: Area Vocational School, Adult Education, Adult Supplemental Education,Special Education Coop and Tuition Reimbursement.
*Enrollment (FTE) includes the enrollment of the district used for state aid and budget authority, and all other preschool enrollmentand kindergarten students attending full time.
0
100,000
200,000
300,000
400,000
500,000
600,000
2007-2008 2008-2009 2009-2010
Capital Improvements (4000)
9/21/2009 4:21 PM Sumexpen.xls Page 12 of 19
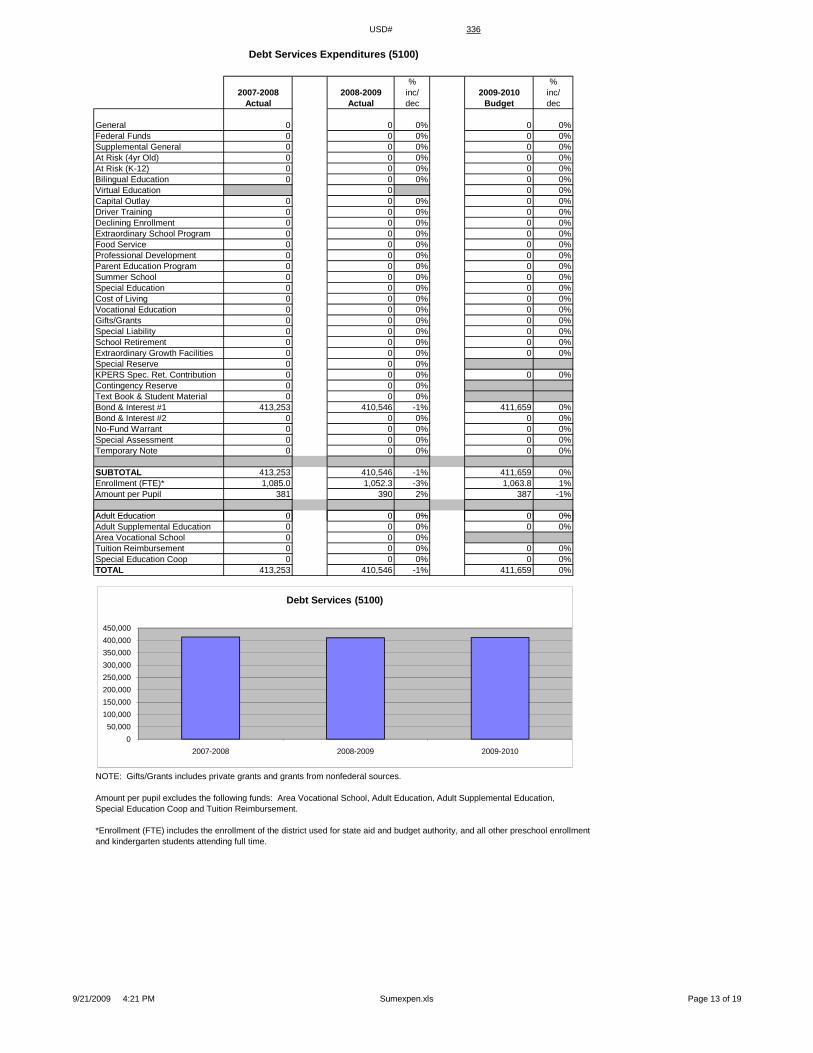
USD# 336
Debt Services Expenditures (5100)
% %2007-2008 2008-2009 inc/ 2009-2010 inc/
Actual Actual dec Budget dec
General 0 0 0% 0 0%Federal Funds 0 0 0% 0 0%Supplemental General 0 0 0% 0 0%At Risk (4yr Old) 0 0 0% 0 0%At Risk (K-12) 0 0 0% 0 0%Bilingual Education 0 0 0% 0 0%Virtual Education 0 0 0%Capital Outlay 0 0 0% 0 0%Driver Training 0 0 0% 0 0%Declining Enrollment 0 0 0% 0 0%Extraordinary School Program 0 0 0% 0 0%Food Service 0 0 0% 0 0%Professional Development 0 0 0% 0 0%Parent Education Program 0 0 0% 0 0%Summer School 0 0 0% 0 0%Special Education 0 0 0% 0 0%Cost of Living 0 0 0% 0 0%Vocational Education 0 0 0% 0 0%Gifts/Grants 0 0 0% 0 0%Special Liability 0 0 0% 0 0%School Retirement 0 0 0% 0 0%Extraordinary Growth Facilities 0 0 0% 0 0%Special Reserve 0 0 0%KPERS Spec. Ret. Contribution 0 0 0% 0 0%Contingency Reserve 0 0 0%Text Book & Student Material 0 0 0%Bond & Interest #1 413,253 410,546 -1% 411,659 0%Bond & Interest #2 0 0 0% 0 0%No-Fund Warrant 0 0 0% 0 0%Special Assessment 0 0 0% 0 0%Temporary Note 0 0 0% 0 0%
SUBTOTAL 413,253 410,546 -1% 411,659 0%Enrollment (FTE)* 1,085.0 1,052.3 -3% 1,063.8 1%Amount per Pupil 381 390 2% 387 -1%
Adult Education 0 0 0% 0 0%Adult Education 0 0 0% 0 0%Adult Supplemental Education 0 0 0% 0 0%Area Vocational School 0 0 0%Tuition Reimbursement 0 0 0% 0 0%Special Education Coop 0 0 0% 0 0%TOTAL 413,253 410,546 -1% 411,659 0%
NOTE: Gifts/Grants includes private grants and grants from nonfederal sources.
Amount per pupil excludes the following funds: Area Vocational School, Adult Education, Adult Supplemental Education,Special Education Coop and Tuition Reimbursement.
*Enrollment (FTE) includes the enrollment of the district used for state aid and budget authority, and all other preschool enrollmentand kindergarten students attending full time.
050,000
100,000150,000200,000250,000300,000350,000400,000450,000
2007-2008 2008-2009 2009-2010
Debt Services (5100)
9/21/2009 4:21 PM Sumexpen.xls Page 13 of 19

USD# 336
Transfers (5200)
% %2007-2008 2008-2009 inc/ 2009-2010 inc/
Actual Actual dec Budget dec
General 2,092,135 2,627,721 26% 2,280,219 -13%Federal Funds 0 0 0% 0 0%Supplemental General 278,775 40,231 -86% 75,000 86%At Risk (4yr Old) 0 0 0% 0 0%At Risk (K-12) 0 0 0% 0 0%Bilingual Education 0 0 0% 0 0%Virtual Education 0 0 0%Capital OutlayDriver Training 0 0 0% 0 0%Declining Enrollment 0 0 0% 0 0%Extraordinary School Program 0 0 0% 0 0%Food Service 0 0 0% 0 0%Professional Development 0 0 0% 0 0%Parent Education Program 0 0 0% 0 0%Summer School 0 0 0% 0 0%Special Education 0 0 0% 0 0%Cost of Living 0 0 0% 0 0%Vocational Education 0 0 0% 0 0%Gifts/Grants 0 0 0% 0 0%Special Liability 0 0 0% 0 0%School Retirement 0 0 0% 0 0%Extraordinary Growth Facilities 0 0 0% 0 0%Special Reserve 0 0 0%KPERS Spec. Ret. Contribution 0 0 0% 0 0%Contingency Reserve 0 0 0%Text Book & Student Material 0 0 0%Bond & Interest #1 0 0 0% 0 0%Bond & Interest #2 0 0 0% 0 0%No-Fund Warrant 0 0 0% 0 0%Special Assessment 0 0 0% 0 0%Temporary Note 0 0 0% 0 0%
SUBTOTAL 2,370,910 2,667,952 13% 2,355,219 -12%Enrollment (FTE)* 1,085.0 1,052.3 -3% 1,063.8 1%Amount per Pupil 2,185 2,535 16% 2,214 -13%
Adult Education 0 0 0% 0 0%Adult Education 0 0 0% 0 0%Adult Supplemental Education 0 0 0% 0 0%Area Vocational School 0 0 0%Tuition Reimbursement 0 0 0% 0 0%Special Education Coop 0 0 0% 0 0%TOTAL 2,370,910 2,667,952 13% 2,355,219 -12%
NOTE: Gifts/Grants includes private grants and grants from nonfederal sources.
Amount per pupil excludes the following funds: Area Vocational School, Adult Education, Adult Supplemental Education,Special Education Coop and Tuition Reimbursement.
*Enrollment (FTE) includes the enrollment of the district used for state aid and budget authority, and all other preschool enrollmentand kindergarten students attending full time.
0
500,000
1,000,000
1,500,000
2,000,000
2,500,000
3,000,000
2007-2008 2008-2009 2009-2010
Transfers (5200)
9/21/2009 4:21 PM Sumexpen.xls Page 14 of 19
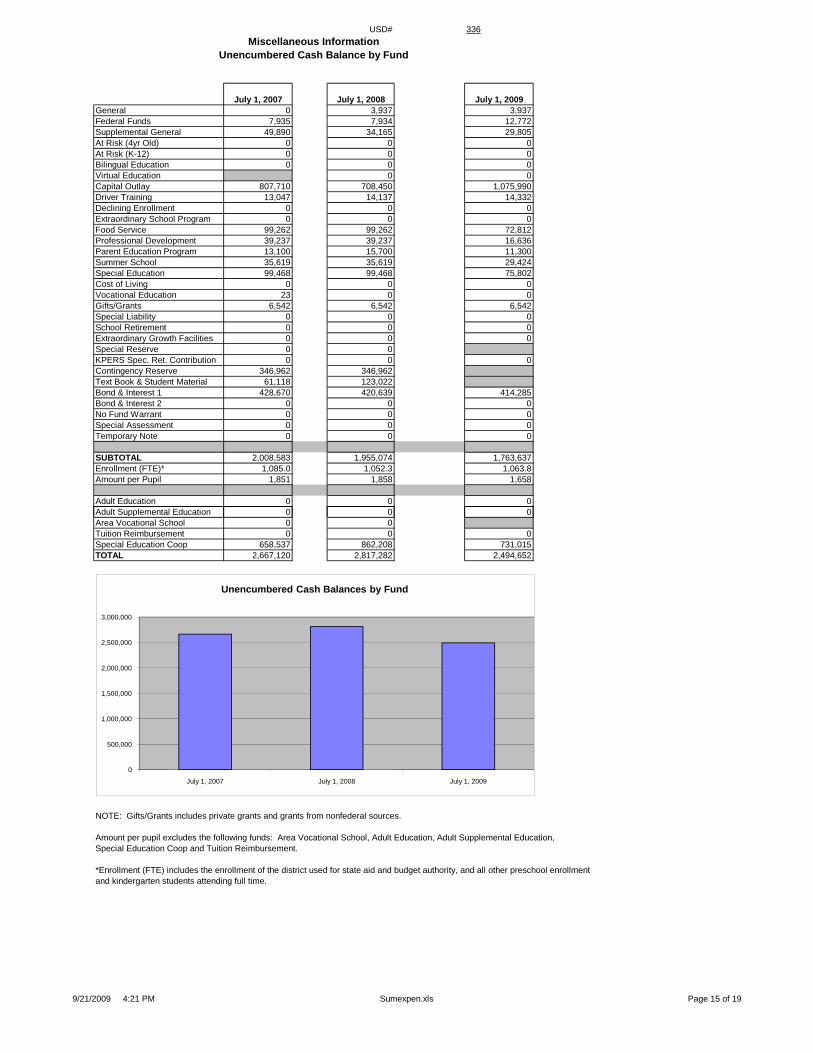
USD# 336Miscellaneous Information
Unencumbered Cash Balance by Fund
July 1, 2007 July 1, 2008 July 1, 2009General 0 3,937 3,937Federal Funds 7,935 7,934 12,772Supplemental General 49,890 34,165 29,805At Risk (4yr Old) 0 0 0At Risk (K-12) 0 0 0Bilingual Education 0 0 0Virtual Education 0 0Capital Outlay 807,710 708,450 1,075,990Driver Training 13,047 14,137 14,332Declining Enrollment 0 0 0Extraordinary School Program 0 0 0Food Service 99,262 99,262 72,812Professional Development 39,237 39,237 16,636Parent Education Program 13,100 15,700 11,300Summer School 35,619 35,619 29,424Special Education 99,468 99,468 75,802Cost of Living 0 0 0Vocational Education 23 0 0Gifts/Grants 6,542 6,542 6,542Special Liability 0 0 0School Retirement 0 0 0Extraordinary Growth Facilities 0 0 0Special Reserve 0 0KPERS Spec. Ret. Contribution 0 0 0Contingency Reserve 346,962 346,962Text Book & Student Material 61,118 123,022Bond & Interest 1 428,670 420,639 414,285Bond & Interest 2 0 0 0No Fund Warrant 0 0 0Special Assessment 0 0 0Temporary Note 0 0 0
SUBTOTAL 2,008,583 1,955,074 1,763,637Enrollment (FTE)* 1,085.0 1,052.3 1,063.8Amount per Pupil 1,851 1,858 1,658
Adult Education 0 0 0Adult Supplemental Education 0 0 0du t Supp e e ta ducat o 0 0 0Area Vocational School 0 0Tuition Reimbursement 0 0 0Special Education Coop 658,537 862,208 731,015TOTAL 2,667,120 2,817,282 2,494,652
NOTE: Gifts/Grants includes private grants and grants from nonfederal sources.
Amount per pupil excludes the following funds: Area Vocational School, Adult Education, Adult Supplemental Education,Special Education Coop and Tuition Reimbursement.
*Enrollment (FTE) includes the enrollment of the district used for state aid and budget authority, and all other preschool enrollmentand kindergarten students attending full time.
0
500,000
1,000,000
1,500,000
2,000,000
2,500,000
3,000,000
July 1, 2007 July 1, 2008 July 1, 2009
Unencumbered Cash Balances by Fund
9/21/2009 4:21 PM Sumexpen.xls Page 15 of 19

USD# 336
Reserve FundsUnencumbered Cash Balance
July 1, 2007 July 1, 2008Special Reserve 0 0TOTAL OTHER 0 0Amount per Pupil $0 $0
*School districts are authorized by law to self insure rather than purchase insurance for the following categories: Worker's Comp,Health Insurance, Life Insurance, Property and Casualty (Risk Management) and Disability Income Insurance. Monies are placedin the Self Insured Fund to pay for claims which may arise from the categories listed above.
0
0
0
0
0
1
1
1
1
1
1
July 1, 2007 July 1, 2008
Unencumbered Cash Balances by Fund (Reserve Funds Only)
9/21/2009 4:21 PM Sumexpen.xls Page 16 of 19

USD# 336Other Information
2005-2006 2006-2007 % 2007-2008 % 2008-2009 % 2009-2010 %Actual Actual inc/ Actual inc/ Actual inc/ Budget inc/
dec dec dec dec
Enrollment (FTE)* 1,112.0 1,096.4 -1% 1,085.0 -1% 1,052.3 -3% 1,063.8 1%
Enrollment (FTE)** 1,112.0 1,096.4 -1% 1,085.0 -1% 1,052.3 -3% 1,063.8 1%Number of Students - Free Meals 218 246 13% 201 -18% 234 16% 227 -3%Number of Students - Reduced Meals 89 96 8% 102 6% 96 -6% 100 4%
0.0
200.0
400.0
600.0
800.0
1000.0
1200.0
2005-2006 2006-2007 2007-2008 2008-2009 2009-2010
Enrollment (FTE)* for Budget Authority
1070.01080.01090.01100.01110.01120.0
Enrollment (FTE)** Used for Calculating "Amount Per Pupil"
*FTE for state aid and budget authority purposes for general fund (excludes 4 yr old at-risk).
** FTE includes 9/20 enrollment used for state aid purposes and adding the additional FTE for preschool programs, headstart, and all-daykindergarten. For example, preschool students attending half days on September 20th would be counted as .5 FTE. Kindergartenstudents attending full time every day would be counted as 1.0 FTE.
0.0
200.0
400.0
600.0
800.0
1000.0
1200.0
2005-2006 2006-2007 2007-2008 2008-2009 2009-2010
Enrollment (FTE)* for Budget Authority
0
50
100
150
200
250
300
2005-2006 2006-2007 2007-2008 2008-2009 2009-2010
Low Income Students
Free Meals
Reduced Meals
1020.01030.01040.01050.01060.01070.01080.01090.01100.01110.01120.0
2005-2006 2006-2007 2007-2008 2008-2009 2009-2010
Enrollment (FTE)** Used for Calculating "Amount Per Pupil"
9/21/2009 4:21 PM Sumexpen.xls Page 17 of 19

USD# 336
Miscellaneous InformationMill Rates by Fund
2007-2008 2008-2009 2009-2010Actual Actual Budget
General 20.000 20.000 20.000Supplemental General 18.661 19.268 21.524Adult Education 0.000 0.000 0.000Capital Outlay 3.997 3.713 2.250Declining Enrollment 0.000 0.000 0.000Cost of Living 0.000 0.000 0.000Special Liability 0.000 0.000 0.000School Retirement 0.000 0.000 0.000Extraordinary Growth Facilities 0.000 0.000 0.000Bond & Interest 1 4.617 4.686 4.190Bond & Interest 2 0.000 0.000 0.000No Fund Warrant 0.000 0.000 0.000Special Assessment 0.000 0.000 0.000Temporary Note 0.000 0.000 0.000TOTAL USD 47.275 47.667 47.964Historical Museum 0.000 0.000 0.000Public Library Board 0.000 0.000 0.000Public Library Brd & Emp Benf 0.000 0.000 0.000Recreation Commission 0.000 0.000 0.000Recreation Commission Employee Benefit 0.000 0.000 0.000TOTAL OTHER 0.000 0.000 0.000
10.000
20.000
30.000
40.000
50.000
60.000
Total USD Mill Rates
General42%
Supplemental General45%
Capital Outlay4%
Bond & Interest 19%
2009-2010 Miscellaneous InformationMill Rates by Fund (Total USD)
General
Supplemental General
Adult Education
Capital Outlay
Special Liability
School Retirement
Declining Enrollment
Cost of Living
Bond & Interest 1
Bond & Interest 2
Extraordinary Growth Facilities
No Fund Warrant
Special Assessment
Temporary Note
0.000
10.000
20.000
30.000
40.000
50.000
60.000
2007-2008 2008-2009 2009-2010
Total USD Mill Rates
9/21/2009 4:21 PM Sumexpen.xls Page 18 of 19

USD# 336Other Information
2007-2008 2008-2009 2009-2010Actual Actual Budget
Assessed Valuation $38,781,922 $40,284,135 $40,829,848
Bonded Indebtedness $2,361,862 $1,999,038 $1,638,743
$0
$5,000,000
$10,000,000
$15,000,000
$20,000,000
$25,000,000
$30,000,000
$35,000,000
$40,000,000
$45,000,000
2007-2008 2008-2009 2009-2010
Assessed Valuation
$0
$500,000
$1,000,000
$1,500,000
$2,000,000
$2,500,000
2007-2008 2008-2009 2009-2010
Bonded Indebtedness
$0
$5,000,000
$10,000,000
$15,000,000
$20,000,000
$25,000,000
$30,000,000
$35,000,000
$40,000,000
$45,000,000
2007-2008 2008-2009 2009-2010
Assessed Valuation
$0
$500,000
$1,000,000
$1,500,000
$2,000,000
$2,500,000
2007-2008 2008-2009 2009-2010
Bonded Indebtedness
9/21/2009 4:21 PM Sumexpen.xls Page 19 of 19