use of insect exclusion cages in soybean creates an … a changed microclimate within cages affects...
TRANSCRIPT

Agricultural and Forest Meteorology 208 (2015) 50–61
Contents lists available at ScienceDirect
Agricultural and Forest Meteorology
journa l homepage: www.e lsev ier .com/ locate /agr formet
Use of insect exclusion cages in soybean creates an alteredmicroclimate and differential crop response
Amelia C. Perilloa, Christopher J. Kucharika,b,∗, Timothy D. Meehanc, Shawn P. Serbind,Aditya Singhe, Philip A. Townsende, Kaitlin Stack Whitneyc, Claudio Grattonc
a Department of Agronomy, University of Wisconsin-Madison, 1575 Linden Drive, Madison, WI 53706, USAb Nelson Institute Center for Sustainability and the Global Environment (SAGE), University of Wisconsin-Madison, 1710 University Avenue, Madison, WI53726, USAc Department of Entomology, University of Wisconsin-Madison, 1552 University Avenue, Madison, WI 53706, USAd Brookhaven National Laboratory, Biological, Environmental & Climate Sciences Department, Bldg. 490D – P.O. Box 5000, Upton, NY 11973-5000, USAe Department of Forest and Wildlife Ecology, University of Wisconsin-Madison, 1630 Linden Drive, Madison, WI 53706, USA
a r t i c l e i n f o
Article history:Received 18 August 2014Received in revised form 16 April 2015Accepted 19 April 2015Available online 2 May 2015
Keywords:Plant-insect interactionsSoybeanAphidsMicroclimateInsect exclusion cagesPlant ecology
a b s t r a c t
Insect exclusion cages are commonly used in agricultural and ecological studies to examine plant-insectinteractions in a field setting while maintaining control over insect populations. However, these insectcages can unintentionally alter the climate inside of the cage and impact plant physiology, growth andyield as well as insect populations. This can subsequently affect interpretations of experimental resultsobtained from caged experiments. To address this concern, we measured meteorological variables inconjunction with soybean physiology, growth, and yield over a two-year period. In a 2011 field study insouthern Wisconsin, we compared photosynthetic rates, leaf area index (LAI), soil environmental condi-tions, and various components of yield for plants grown inside and outside of an industry standard insectcage (Lumite 32 × 32 mesh). Inside of cages, several variables were higher (P < 0.05) including surface(0–6 cm) soil moisture (38%), stomatal conductance (42%), and total plant biomass (30%), while LAI was20% lower (P < 0.001) inside of the cages. During the 2012 growing season, we measured wind speed,wind gusts, solar radiation, air temperature and relative humidity inside of cages compared to open fieldconditions. We found that wind speed and solar radiation were 89% and 42% lower, respectively, and airtemperature, relative humidity and vapor pressure deficit were not significantly affected. There was alsoa significant (P < 0.0001) effect of the time of day on differences in wind speed and radiation betweencages and open field plots. Our findings suggest that commonly used insect cages significantly alter themicroclimate inside of the cage, and create a radiation regime in which the amount of direct and dif-fuse radiation received by plants is altered compared to the open field. Plant physiological processes andgrowth are affected by these environmental changes, adding a confounding factor when comparing cagedto open field plants. Because the effects are likely a function of the type of cage, and mesh size and color,we recommend that future studies more thoroughly measure the microclimate for a variety of commoncage types used in experiments.
© 2015 Elsevier B.V. All rights reserved.
Abbreviations: CAD, cumulative aphid days; RUE, radiation use efficiency; VPD,vapor pressure deficit; LAI, leaf area index; A400, photosynthetic rate at 400 ppmatmospheric CO2; Amax, maximum photosynthetic rate; VWC, volumetric watercontent; PWP, permanent wilting point; LUE, light use efficiency.
∗ Corresponding author at: Department of Agronomy, University of Wisconsin-Madison, 1575 Linden Drive, Madison, WI 53706 USA. Tel.: +1 608 890 3021;fax: +1 608 262 5217.
E-mail address: [email protected] (C.J. Kucharik).
1. Introduction
Insect exclusion cages are widely used in entomological andagronomic studies to examine plant-insect interactions whileallowing for control over pest populations and their natural ene-mies (Kidd and Jervis, 2005). While exclusion cages are a usefultool, their use can lead to significant modifications of natural envi-ronmental conditions inside of the cages (Buntin, 2001; Hand andKeaster, 1967; Woodford, 1973), and subsequently can influencethe impact of insects as well as plant responses (Kidd and Jervis,2005). These effects need to be better understood to determine
http://dx.doi.org/10.1016/j.agrformet.2015.04.0140168-1923/© 2015 Elsevier B.V. All rights reserved.
A.C. Perillo et al. / Agricultural and Forest Meteorology 208 (2015) 50–61 51
whether the creation of an unintentional and altered microen-vironment has consequential effects on plant physiology (i.e.,photosynthesis and stomatal conductance), plant phenologicaldevelopment and growth (i.e., leaf area index and plant height),carbon allocation, soil environmental (moisture and temperature)conditions, and whether these effects could introduce confoundingfactors in controlled experiments and change the interpretation ofresults.
Fine mesh cages are commonly used to manipulate insect abun-dance on plants while excluding additional influences, such asnatural enemies or additional plant pests, and offer an attractivealternative to using insecticidal treatments in field experiments(Lawson et al., 1994). The porous, mesh material is used to con-struct a cage perimeter and block insects from either entering orleaving. But this physical barrier can also affect plants in otherways by reducing wind speed, solar radiation, and evaporativewater loss (Buntin, 2001; Hand and Keaster, 1967; Moller et al.,2010; Simmons and Yeargan, 1990; Tanny, 2013; Woodford, 1973).Wind speed can affect stomatal conductance and evapotranspi-ration by modifying the boundary layer resistance near the leafsurface (Campbell and Norman, 1998), and in certain conditions,water use efficiency may be altered when soil water becomes limit-ing to plant growth. Reductions in solar radiation inside cages couldeffectively reduce photosynthesis and evapotranspiration and leadto increased plant available soil moisture and cooler soil tempera-tures. For example, in more arid regions of the world, insect-proofscreen houses or agricultural screening in general is often used tointentionally reduce radiation load and wind speed when grow-ing food crops so that water loss through evapotranspiration isdecreased and water is conserved (Moller et al., 2004; Tanny, 2013).
The mesh cage material may also lead to an increase in theratio of diffuse (scattered) to direct beam radiation, altering radia-tion use efficiency (RUE) and photosynthesis (Alton et al., 2007; Guet al., 2002; Healey and Rickert, 1998; Knohl and Baldocchi, 2008;Moller et al., 2004). While a reduction in overall radiation inten-sity (i.e., photosynthetically active radiation or PAR) may decreasephotosynthesis, some plants may adapt to lower PAR levels andhave relatively high photosynthetic capacity (Boardman, 1977a,b;Healey et al., 1998). The air temperature may also be altered insideof cages due to reduced solar radiation and reduced mechanical airmixing attributed to a decrease in wind speed; a reduction in mix-ing would be more pronounced when the surface roughness lengthis higher. Changes in air temperature can also alter the biologicalrate of insect development inside of the cages, as well as photosyn-thesis and plant phenological development (Campbell and Norman,1998). All of the aforementioned factors could confound studies ofinsect effects on plants because cages contribute to a modified envi-ronmental setting. Therefore, the true impact of pest presence onplants may be difficult to ascertain because pests and the insectcages themselves simultaneously affect plant biology and ecology.
Recently, exclusion cages have been used to study the impactsof the soybean aphid (Aphis glycines Matsumura) on plant biologyand ecology where common natural enemies can reduce aphidpopulations and damage soybean (Glycine max L.) (Beckendorfet al., 2008; Catangui et al., 2009; Costamagna and Landis, 2006;Costamagna et al., 2008, 2007; Liu et al., 2004). Exclusion cagesare frequently used in entomological and agronomic research andeven the earliest published studies suggested that microclimaticconditions would likely be different between caged and open envi-ronment settings (Hand and Keaster, 1967; Lawson et al., 1994;Simmons and Yeargan, 1990; Woodford, 1973) (Table 1). How-ever, there are only a few published studies that have reportedhow insect cages could have confounded interpretation of exper-imental results (Beckendorf et al., 2008; Desneux et al., 2006; Foxet al., 2004; Lawson et al., 1994; Rhainds et al., 2007; Simmons andYeargan, 1990). One published study reported unintended effects
such as increased plant biomass, yield, and a change in the overallhealth of plants (Simmons and Yeargan, 1990). Other more recentstudies have measured either air temperature (Desneux et al., 2006)or relative humidity and air temperature (Fox et al., 2004) (Table 1),although neither of these studies made continuous measures ofthese variables over long time periods. Fox et al. (2004) concludedthat there may be small effects of increased temperature on aphidpopulations inside of cages; however, because they did not mea-sure wind speed or solar radiation inside of cages compared to openfield conditions, and only made periodic measurements of air tem-perature, it is difficult to know if differential plant responses mayhave influenced aphid growth and population dynamics.
To more fully address the question of how insect cages influencethe interpretation of plant-insect interactions, we report data fromtwo companion experiments in 2011 and 2012. The experimentswere designed to (1) quantify how exclusion cages influence themicroclimatic conditions inside cages by collecting meteorologicaldata (i.e., wind speed, solar radiation, air temperature, and relativehumidity) over the majority of a growing season, and to (2) assesshow a changed microclimate within cages affects soybean physi-ology, growth, and yield, as well as soil environmental conditions,compared to ambient conditions. We focused on testing the follow-ing hypotheses: (1) exclusion cages reduce wind speed and solarradiation, but increase air temperature, humidity, and soil mois-ture; and (2) soybean LAI, total biomass, and grain yield are lowerinside of exclusion cages due to a consistently reduced intensity ofsolar radiation.
2. Methods and materials
2.1. Site description
All measurements were performed at the University ofWisconsin-Madison’s Arlington Agricultural Research Station(Arlington, WI, 43.5◦N lat., 89.5◦W long.) during the 2011 and 2012growing seasons. Soils at this site are classified as Plano silt loams(fine-silty, mixed, superactive, mesic typic Argiudolls), which arehighly productive soils formed under the former Empire Prairieand part of the North American prairie–savanna ecotone beforeit was converted to agricultural land use in the mid-1800s. Forthe 1981–2010 period, mean annual air temperature was 6.8 ◦Cand mean annual precipitation was 869 mm. The region typicallyreceives 324 mm of precipitation during summer (June–August),with an average air temperature of 17.5 ◦C (NOAA, 2011). The aver-age air temperature during the summers of 2011 and 2012 wereboth significantly above the climatological average (+3.2 ◦C in 2011and +4.3 ◦C in 2012), and only 43% of normal summer precipitationwas received in each year. In particular, August of 2011 (38.4 mm)and June (7.4 mm) through mid-July of 2012 were very dry peri-ods and contributed to extensive drought conditions in the region.The growing degree days (GDD; base 10 ◦C) accumulated in 2011and 2012 were 1299 ◦C and 1548 ◦C, respectively, which were bothhigher than the long-term (1981–2010) average of 1260 ◦C.
2.2. Soybean experiment
A paired cage/non-caged experiment was established in May2011, whereby a 1.6 ha field was chisel plowed on May 12 andcultivated before planting. Soybean variety Dairyland 2011RR(Dairyland Seed, West Bend, WI) was planted on May 31 at a rate of72.8 kg ha−1 (65 lbs acre−1) and a depth of 3.8 cm (1.5 in) with 19 cm(7.5 in) row spacing. Plants were sprayed on July 7 with Roundup®
PowerMAX (Monsanto, St. Louis, MO) at a rate of 1.75 L ha−1
(24 oz acre−1). Insect cages (Lumite Inc., Alto, GA) with dimensionsof 2 m × 2 m × 2 m (length × width × height) and a 32 × 32 mesh
52 A.C. Perillo et al. / Agricultural and Forest Meteorology 208 (2015) 50–61
Table 1Previous studies that have measured the impact of insect exclusion cages on microclimate or plant growth.
Author(s) Year Plant Insect Cage effect on microclimate or plant growth
Hand and Keaster 1967 Not stated None Reductions in rainfall, solar radiation, wind speed andevaporation. No effects on air temperature or relativehumidity
Woodford 1973 Potato and cauliflower None Reduced wind speed and solar radiation. Slight differencein cumulative temperature; less variation in temperatureinside of the cages
Simmons and Yeargan 1990 Soybean Green stink bug Increased vegetative and reproductive plant growth andincreased seed quality inside of cages; no effect on yield;reduced apparent effect on defoliation on yield; no effecton soil water; increased leaf area in the cages
Lawson et al. 1994 Apple trees Common pests Reduction in solar radiation, evaporation, air and soiltemperature. Increased shoot elongation of apple trees,and reduction in fruit color intensity
Fox et al. 2004 Soybean Soybean aphid Minimal effects on air temperature, relative humidity orsoybean growth
Desneux et al. 2006 Soybean Soybean aphid No significant impact on growing degree-days and airtemperature
Rhainds et al. 2007 Soybean Soybean aphid Minimal effects on temperature over a 7-daymeasurement period
Collins et al. 2008 Citrus trees Queensland fruit fly Bactrocera tryoni Froggatt Cage shading intensity and color had significant effects onair temperature and solar radiation, but not relativehumidity
size (0.5 mm × 0.5 mm) were used to evaluate micrometeorolog-ical conditions inside of cages. Twelve insect cages were erectedon June 13 2011 when soybean were at development stage V0, andremained in place until harvest occurred. Insect cages were posi-tioned in two parallel rows of six cages each whereby the rowswere approximately 6 m apart, and individual cages were spaced3 m apart. During installation, soil was tilled around the perimeterof insect cages to allow for mesh material to be buried approxi-mately 30 cm belowground, which served as a physical barrier tooutside plant encroachment and for added cage stability. Mowing ofweeds to a height of approximately 10 cm around insect cages tookplace in early August during the experiment, and weeds were peri-odically hand pulled from around the perimeter of each cage plot.Twelve additional 2 m × 2 m open-air study plots were establishedin an adjacent part of the experimental field, orientated in the samemanner as the caged plots (e.g., two parallel rows of six plots eachwith similar spacing dimensions). Cage and open study plots werenot interspersed because we did not want the physical presenceand close proximity of cages influencing wind speed and direction,thereby contaminating open field microclimate conditions.
To ensure that insect damage was not a significant factor to plantgrowth and crop yields, we measured soybean aphid abundance ineach plot on a weekly basis. Weekly aphid counts on all plants in2011 were collected by visual observation from the time of intro-duction on July 5 through September 9 to determine cumulativeaphid days (CAD) in each study plot.
2.3. Biophysical measurements
Leaf area index (LAI; m2 of single sided leaf area per m2 of groundarea) of each study plot was measured weekly during the soybeanreproductive stage (July 28–September 8) using a LI-COR LAI-2000plant canopy analyzer (LI-COR Inc., Lincoln, NE) under diffuse lightconditions (e.g., sunrise or sunset). Leaf area index measurementswere replicated twice within each plot. For the caged study plots,above and below canopy measurements were collected entirelyinside of each cage. In all study plots, two above canopy readingsand four below canopy readings were used to quantify LAI.
Leaf gas exchange (photosynthesis) measurements were col-lected approximately weekly from August 2nd through September7th using a LI-COR LI-6400XT portable photosynthesis system(LI-COR Inc., Lincoln, NE) coupled with a LED light source and
CO2 injection system. Assimilation (A) vs. internal CO2 concen-tration (Ci) and light response curves (A vs. varying levels ofPAR) were performed on two upper canopy, fully expanded tri-foliate leaves for each plot, to ensure similar leaf age for theduration of the experiment. For A–Ci response curves, plants wereilluminated with 2000 !mol quanta m−2 s−1 while CO2 concentra-tion inside the leaf chamber increased from 0 !mol CO2 mol−1
to 1000 !mol CO2 mol−1. For light response curves, chamberCO2 concentration remained constant at 400 !mol CO2 mol−1
and light intensity decreased from 2000 !mol quanta m−2 s−1 to0 !mol quanta m−2 s−1. All gas exchange measurements were col-lected between 0900 and 1700 h local time. Ambient rates ofphotosynthesis (A400) were calculated using the value measured at400 !mol CO2 mol−1 in the chamber head, with light levels abovea saturation level of 1460 !mol quanta m−2 s−1.
Three replicates each of leaf temperature, 10 cm soil tempera-ture, and 0–6 cm volumetric water content were taken in each plotat the time that leaf gas exchange measurements were collected.Measurements of leaf temperature were taken on the underside oftop canopy leaves with a Fluke 574 precision infrared thermome-ter (Fluke Corp., Everett, WA). Soil temperature was measured at a10 cm depth using a hand-held temperature probe (HANNA Instru-ments, Smithfield, RI), and soil moisture was measured for a 0–6 cmdepth with a Dynamax TH300 ‘Big Stick’ Soil Moisture Probe (Dyna-max, Houston, TX).
For each plant, five leaf reflectance spectra were also collectedat 350–2500 nm from one upper and lower leaf selected at randomusing an ASD FieldSpec3 full-spectrum Spectroradiometer (Analyt-ical Spectral Devices, Boulder, CO). All leaf spectra were collectedconcurrent with gas exchange measurements. Leaf percent nitro-gen (N), percent carbon (C), percent cellulose and percent aciddissolvable lignin by dry weight were obtained by applying meth-ods and partial least squares regression (PLSR) coefficients reportedin Serbin et al. (2014) to averaged leaf spectra for each leaf.
Plots were harvested by hand on September 16th before plantsenescence occurred, but after pod fill was completed (R6 stage).All plants within plots were cut at the soil surface, transported backto a UW-Madison lab and dried at 60 ◦C for 48 h. After drying, indi-vidual plant components (i.e., seed, pod, leaf, and stem) were handseparated and weighed. Specific leaf area (SLA; m2 leaf area kg−1
of dry matter) was determined from samples collected during har-vest using a 5 cm2 of leaf area that was cut out from ten replicated
A.C. Perillo et al. / Agricultural and Forest Meteorology 208 (2015) 50–61 53
upper canopy and lower canopy leaves for each plot. Harvest indexwas also calculated using the ratio of dry seed weight to total aboveground biomass.
2.4. Micrometeorology experiment
During the week of June 11 2012, four 3 m × 3 m × 2.8 m(length × width × height) insect cages (Lumite, Inc., Alto, GA) wereerected in the field in a square pattern, approximately 9 m apartfrom each other when soybean plants were in the V1 stage. Thesecages were slightly larger than those used in the 2011 experiment toaccommodate the placement of a weather station inside, but weremade of the exact same material and mesh size. Soybean varietyDairyland 1808R2Y (Dairyland Seed, West Bend, WI) was plantedon May 23 at a rate of 89.6 kg ha−1 (80 lbs acre−1) with 19 cm (7.5 in)row spacing and a 5 cm (2 in) depth. Plants were sprayed withRoundup® Powermax (Monsanto, St. Louis, MO) on June 22 at arate of 1.75 L ha−1 (24 oz acre−1). Plants were sprayed again on July25 with Dimethoate 400 (Loveland Products, Loveland, CO) at a rateof 1.17 L ha−1 (16 oz acre−1).
Weather stations were positioned within each cage at the cen-ter point. Two additional weather stations were placed in ambientconditions outside of the cages; one was located 9 m south of theblock of cages, and one in center (between) of the four insect cages.This design was intended to mimic how paired caged and openstudy plots might be situated to study the impacts of soybeanaphids on soybean plants. Each weather station contained a suiteof meteorological instrumentation that was mounted to 2.4 m tallmetal t-posts. A solar radiation sensor (silicon pyranometer model#S-LIB-M003; Onset Computer Corp., Bourne, MA) with a spectralresponse over the 300–1100 nm wavelength band was attached toa light sensor bracket at a height of 1.7 m above the soil surfacefacing south. A wind speed smart sensor (Onset Computer Corp.,Bourne, MA) was attached at a 1.9 m height, and a 12-bit tem-perature/relative humidity smart sensor (Onset Computer Corp.,Bourne, MA) was enclosed in a solar radiation shield (model #RS3;Onset Computer Corp., Bourne, MA) and mounted at 1.7 m. Mea-surements were collected every 15 min to form hourly averagesand recorded using a HOBO® (Onset Computer Corp., Bourne, MA)micro station data logger from June 26 through September 14. Windgust values were recorded as the highest 3-s sustained wind speedduring the 15-min logging interval. Vapor pressure deficit (differ-ence in vapor pressure between ambient and saturated air) wascalculated using average hourly temperature and relative humidity(Campbell and Norman, 1998).
2.5. Statistical analyses
Statistical analyses were performed using the R software pack-age version 0.97.449 (R Development Core Team, 2014) and JMPPro (v. 11.0) (SAS, 2013). We explored the effect of cages on annualmeasures of plant productivity using the generalized least squaresfunction in the nlme package for R (Pinheiro et al., 2015). Thisapproach was chosen because it provided the ability to build lin-ear models that accounted for differences in variances across cagedand open plots. The significance of cage effects was determined byF-statistics derived from analysis of variance.
Several biophysical and physiological variables were measuredperiodically during the growing season. We explored the effect ofcages on periodic measures using the generalized additive mixed-effects model (GAMM) function in the mgcv package for R (Wood,2006). This approach was chosen because it provided the ability tomodel a smooth non-parametric effect of time and accommodatedrepeated measurements per plot and per sample date. Smoothingparameters for temporal effects were determined by optimiza-tion. Repeated measurements per plot and per sample date were
accommodated using a random intercepts model with measure-ment nested within plot. The importance of the parametric cageeffect was determined using a Wald chi-squared test. Althoughtemporal effects were pervasive in the data, we only report cageeffects because these were the focus of our study.
Micrometeorological data were obtained hourly throughout thegrowing season. For the purposes of determining daytime andnighttime averages for meteorological variables, a solar radia-tion value of 1.0 W m−2 was used as the day/night threshold. Weexplored the effect of cages on continuous, hourly micrometeoro-logical measures using the GAMM functions in the mgcv packagefor R. This approach was chosen because it provided the abilityto model a smooth non-parametric effect of time, accommodatedrepeated measurements per plot, and allowed for modeling of tem-poral autocorrelation in model residuals that was not accountedfor by other effects. Smoothing parameters for temporal effectswere determined by optimization. Repeated measurements perplot were accommodated using random intercepts terms. Tempo-ral autocorrelation in residuals was modeled with a continuous,first-order, autoregressive (AR1) error model. For five responsevariables, it appeared that the cage effect varied by hour in theday. In these cases, an additional parametric hour effect, and anhour by day interaction, was added to the model. The importanceof parametric cage and hour effects was determined using a Waldchi-squared test.
In our analyses of the cage effect on plant growth, physiology,and soil environmental conditions, only replicated caged (n = 3) andnon-caged (n = 11) plots that were determined to have not experi-enced a reduction in yield due to the presence of high soybean aphidpopulations were used (Perillo, 2014). This requirement was meantto eliminate the confounding effects on yield of large and persis-tent soybean aphid populations during the reproductive phase. Theresult was such that the CAD reached (Perillo, 2014) in these plotswere well below the reported economic threshold (10,000 CAD)that is expected to cause a yield decrease according to previouslypublished research (Ragsdale et al., 2007). We eliminated one non-cage plot and nine caged plots from our analysis because they hadextremely high CAD in the range of 114,000–341,000 CAD (Perillo,2014).
3. Results
3.1. Cage effects on microclimate
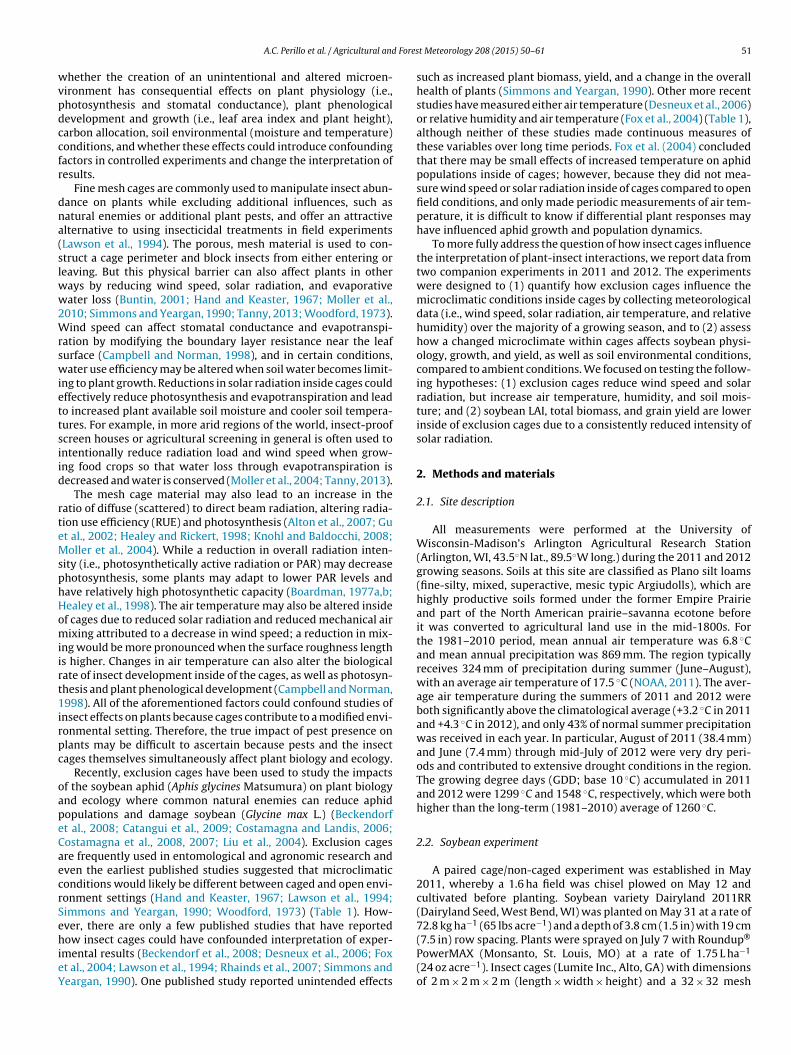
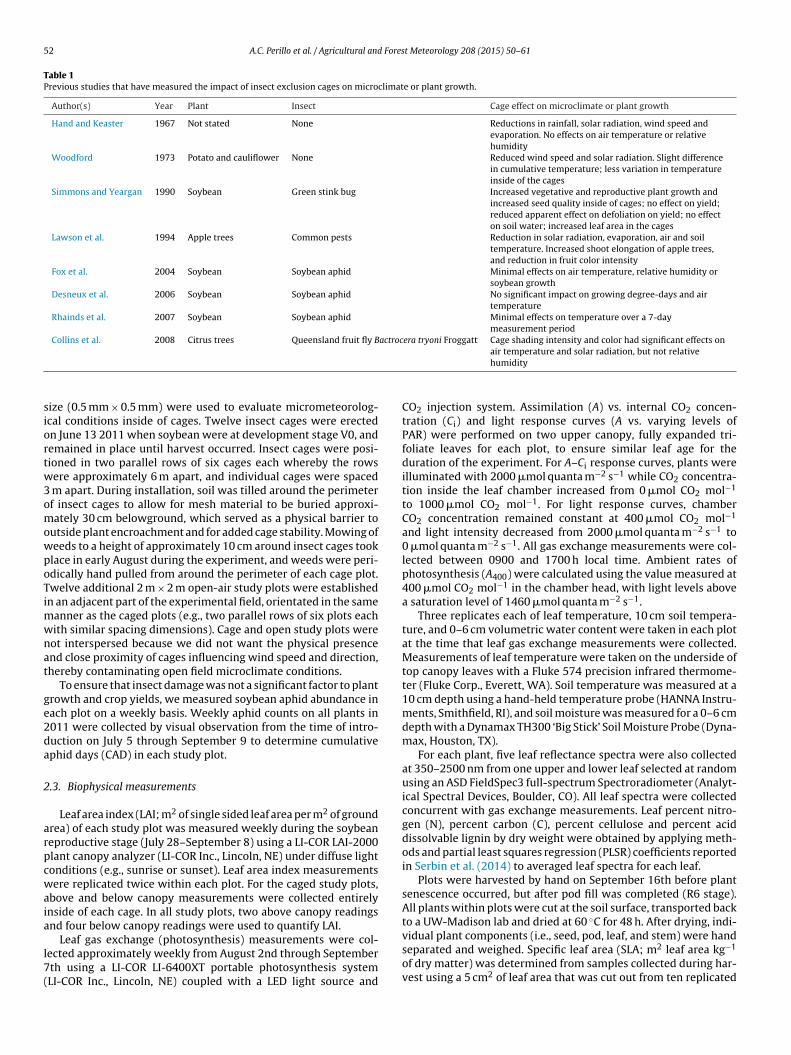
Daytime and nighttime average wind speeds were 89%(1.06 m s−1) and 96% (0.42 m s−1) lower inside cages, respectively,than outside (P < 0.0001) when compared across the entire mea-surement period (81 days with 1268 15-min observations duringthe day and 648 at night) (Table 2). Maximum 1-h averagewind speeds within cages reached 2.0 m s−1 (Fig. 1) with maxi-mum instantaneous gusts of 4.9 m s−1 (Fig. 1), whereas outsideof cages the maximum 1 h average wind speeds recorded were6.1 m s−1 (Fig. 1) with maximum gusts of 10.0 m s−1 (Fig. 1). Day-time and nighttime average wind gusts were 76% (2.3 m s−1)and 89% (1.3 m s−1) lower inside cages, respectively, than outside(P < 0.0001) (Table 2). The cumulative distributions of caged versusopen wind speeds were remarkably different (Fig. 2); approxi-mately 69% of the hourly average daytime wind speed observationswithin cages were less than 0.1 m s−1, whereas only 13% of all obser-vations outside cages were recorded at or below 0.1 m s−1 (Fig. 2).We determined that for a 1 m s−1 average wind speed to occurinside of the Lumite 32 × 32 mesh insect cages, an average windspeed of 4.3 m s−1 is required outside (Fig. 1).
Average solar radiation was 42% lower (102 W m−2; P < 0.0001)inside the cages than outside (Table 2) across all daytime
54 A.C. Perillo et al. / Agricultural and Forest Meteorology 208 (2015) 50–61
Table 2Mean values of caged and ambient micrometeorology measurements from 2012. Given are the arithmetic means ± standard errors (SE). Daytime measurements wereclassified as occurring when solar radiation readings were ≥1 W m−2. P-values are derived from Wald tests of generalized additive mixed model terms with dF = 1.
Quantity Units Cages (±SE) Ambient (±SE) X21 P-value
Daytime wind speed m s−1 0.133 (0.035) 1.19 (0.061) 305.2 <0.0001Nighttime wind speed m s−1 0.018 (0.019) 0.432 (0.032) 165.7 <0.0001Daytime wind gusts m s−1 0.73 (0.069) 3.03 (0.12) 366.2 <0.0001Nighttime wind gusts m s−1 0.16 (0.037) 1.45 (0.063) 415.4 <0.0001Daytime solar radiation W m−2 140.8 (9.3) 243.2 (16.1) 40.5 <0.0001Daytime relative humidity % 68.1 (1.2) 69.2 (2.0) 0.317 0.573Nighttime relative humidity % 82.5 (1.1) 81.3 (1.9) 0.390 0.532Daytime VPD kPa 1.161 (0.054) 1.118 (0.094) 0.204 0.651Nighttime VPD kPa 0.449 (0.040) 0.494 (0.069) 0.419 0.518Daytime air temperature ◦C 23.2 (0.38) 23.1 (0.66) 0.055 0.815Nighttime air temperature ◦C 18.4 (0.18) 18.8 (0.56) 0.566 0.452Daily maximum temperature ◦C 29.3 (0.27) 29.0 (0.46) 0.392 0.531Daily minimum temperature ◦C 15.5 (0.26) 15.6 (0.45) 0.091 0.763Diurnal temperature range ◦C 13.8 (0.18) 13.4 (0.32) 1.637 0.201
0
1
2
3
4
5
6
7
8
9
10
0 1 2 3 4 5 6 7 8 9 10
Cage
s w
ind
spee
d or
gus
ts (m
s-1
)
Ambient wind speed or gusts (m s-1)
Wind speed Wind gusts
Fig. 1. Relationship between ambient (non-caged) and caged wind speed and windgusts during measurement period in 2012. Wind gusts were calculated using thehighest 3-s wind speed during each 15-min measurement interval. Graphs includeboth daytime and nighttime measurements, and model fits (solid line for wind speedand dashed line for wind gusts) are with a 2nd degree polynomial function.
Fig. 2. Cumulative distribution function for caged and ambient daytime wind speedduring measurement period in 2012.
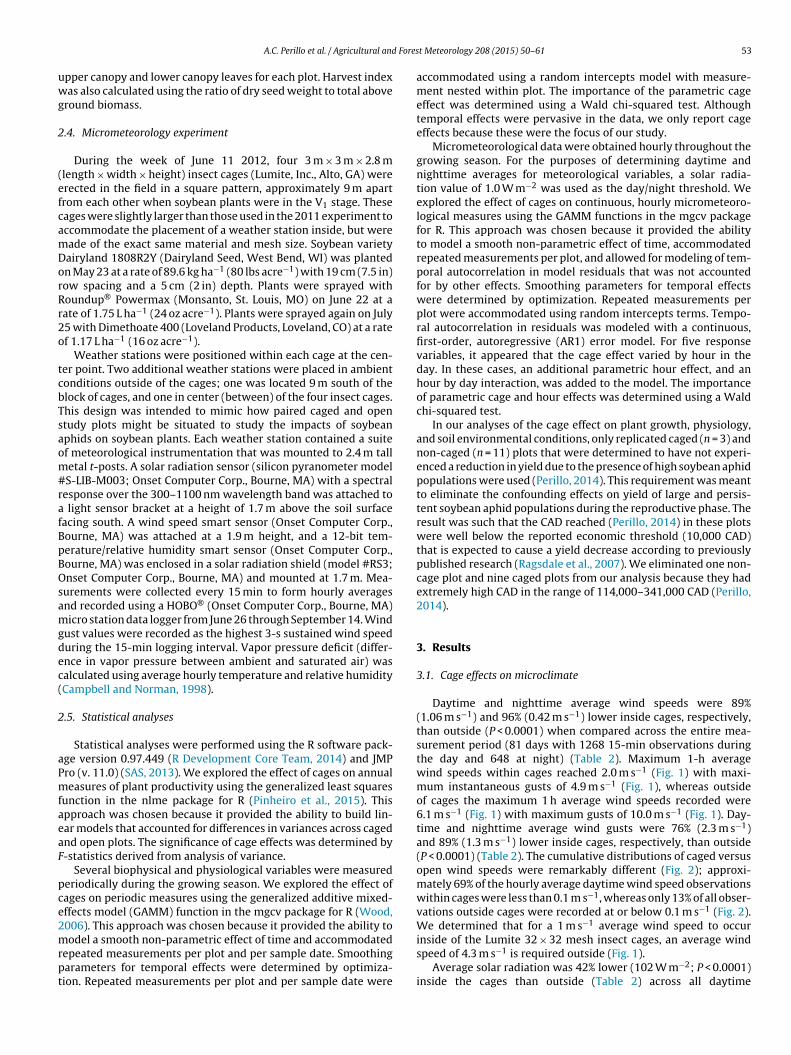
observations; however, the magnitude of the difference was a func-tion of the time of day and sky conditions (e.g., cloud cover; Fig. 3),as well as the day of year (Fig. 4a). Over the entire length of theexperiment, soybean plants within cages received 53% less totalaccumulated solar radiation than in ambient conditions (Fig. 5;slope = 0.53). On average, the peak daily difference in radiationreceived between caged and open observations occurred at 1347local time (Fig. 4b), or approximately 45 min after solar noon whenradiation was highest, with the smallest differences occurring nearsunrise and sunset under diffuse sky conditions (Fig. 3). The time ofday when the peak solar radiation difference occurred did not varyover the course of the experiment (Fig. 4b; P = 0.765); however,the absolute difference in radiation between caged and open plotsdeclined linearly as a function of total incoming radiation (Fig. 4a;P = 0.016) over the course of the experiment which was attributedto seasonal changes in sun angle. The maximum solar radiationrecorded in the cages was 507 W m−2 compared to 932 W m−2 inthe open plots.
During daytime hours, ambient VPD was higher, and at nightVPD was higher in the cages; however, the differences were notsignificant (Table 2). Average air temperature was not significantlydifferent within insect cages compared to ambient temperaturesduring either daytime or nighttime across all observations (Table 2).
Fig. 3. Hourly averaged solar radiation for caged and ambient plots during August8–12, 2011, and the hourly differences. Cloudy sky conditions prevailed on August8–9, and full sun (clear sky) conditions occurred on August 10–11.

A.C. Perillo et al. / Agricultural and Forest Meteorology 208 (2015) 50–61 55
Fig. 4. (a) Difference in daily peak solar radiation between ambient conditions andcages (ambient-cages) and (b) the local time (hours) the peak difference occurredfor each day during the experiment.
y = 0.53x + 15.89 R = 0.94
0
100
200
300
400
500
600
700
800
900
1000
0 100 200 300 400 500 600 700 800 900 1000
Cage
s so
lar r
adia
tion
(W m
-2)
Ambient solar radiation (W m-2)
Fig. 5. Scatter plot of hourly average solar radiation measured within cages com-pared to ambient conditions. Only daytime radiation values (>1 W m−2) are included.
The slope of linear regression for air temperature between cagedand open plots was 0.99 (R2 = 0.98, P < 0.0001), whereas for VPD theslope was 0.96 (R2 = 0.98, P < 0.0001). Daily average maximum andminimum temperatures as well as diurnal temperature range werenot significantly different between caged and open plots (Table 2).However, there was a weak (R2 = 0.031), but significant (P < 0.0001)positive relationship between the magnitude of the difference inair temperatures (i.e., cages – ambient conditions) and the ambientair temperatures.
3.2. Diel patterns
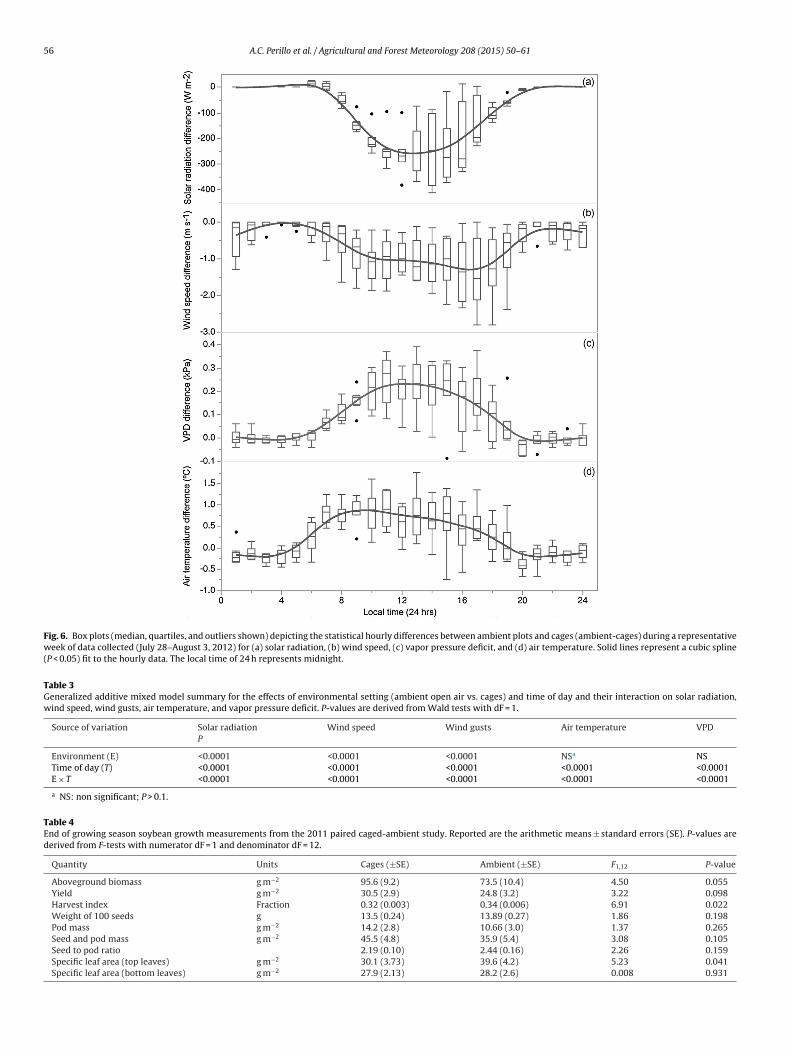
Over the course of the measurement period, the differencesbetween cage and ambient conditions exhibited consistent diel pat-terns for each of the four variables measured (Fig. 6). All variablesstudied showed an influence of time of day on their magnitude(Table 3), which was an expected result. However, all meteorolog-ical variables measured also had a significant interaction betweentime (hour of day) and the environmental setting – the cage effect(Table 3).
As previously discussed, differences in solar radiation were afunction of the ambient radiation magnitude, and therefore, thepeak differences occurred in early afternoon (Fig. 6a). Wald testsconfirmed that a significant interaction between time (i.e., houror the day) and environment (i.e., cages vs. ambient conditions)occurred for radiation differences, suggesting that the rate withwhich radiation changed over the course of a day was different foreach environmental setting (Table 3). As well, the variability of theradiation differences was much smaller during the morning hoursand increased significantly after local noon. Wind speed differenceswere smallest during the nighttime hours, reaching a minimumvalue right before about sunrise (e.g., 0500 h local time), and grad-ually increased in magnitude through the late afternoon beforebeginning a decline that coincided with approximate sunset times(e.g., 2000 h local time) (Fig. 6b). Wald tests also confirmed thata significant interaction between time and environment occurredfor wind speed (and wind gust) differences, suggesting that the ratewith which wind speed (and gusts) changed over the day was dif-ferent for each environmental setting (Table 3). For VPD and airtemperature differences, the Wald tests showed that there wasalso a significant interaction of time of day and environmental set-ting (Table 3). Vapor pressure deficit (Fig. 6c) and air temperature(Fig. 6d) differences were at a minimum during nighttime hours,and rapidly increased after sunrise, reaching a maximum differ-ence in late morning to early afternoon. For VPD differences, theleast amount of variability in those differences was observed for thenighttime hours through approximately 3–4 h after sunrise (e.g.,around 0900 h local time).
3.3. Cage effects on soybean productivity and biophysicalresponses
Total aboveground soybean biomass was increased by 30%inside of the cages (P = 0.055) and yield was 23% higher (P = 0.098)(Table 4). The harvest index (HI) inside of cages was slightly (5.9%)lower than ambient conditions (P = 0.022; Table 4). The seed weight(measured as the weight of 100 seeds), pod weight, ratio of seed topod weight, and specific leaf area (SLA) for bottom leaves were notsignificantly effected by the insect cages (Table 4). The specific leafarea for top leaves was 24% lower inside of cages (P = 0.041; Table 4).
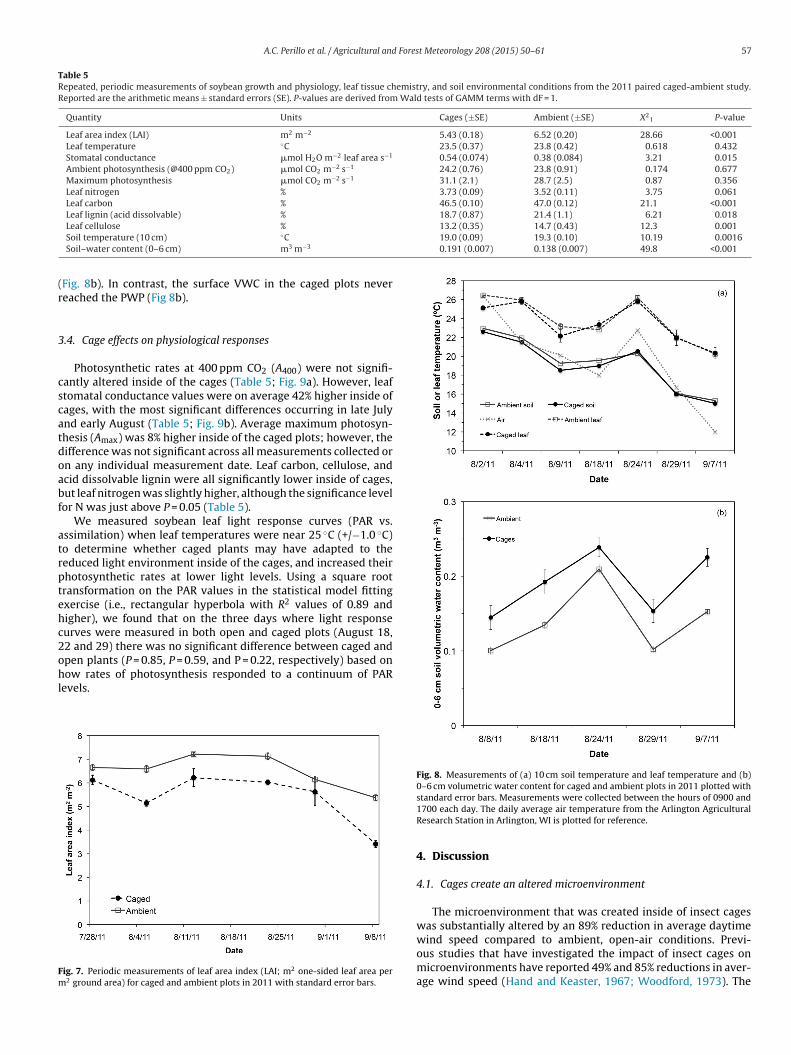
Average LAI over the measurement period was 17%(1.09 m2 m−2) lower in the cages (P < 0.001; Table 5). The aver-age difference in LAI ranged from 0.55 m2 m−2 on July 28 to2.04 m2 m−2 greater outside the cages on September 7 (Fig. 7).The LAI reached maximum values in mid-August and declinedthereafter for both caged and open plots (Fig. 7). Leaf temperatureswere not significantly different over the study period (Table 4),averaging 23.5 ◦C inside of cages and 23.8 ◦C in open plots (Table 5,Fig. 8a). Leaf temperatures were generally 3–8 ◦C warmer thanair temperature and responded similarly to daily air temperaturefluctuations in both open and caged plots (Fig. 8a).
Average 10 cm soil temperature inside of the cages was 19.0 ◦Cand 19.3 ◦C in open plots (Fig. 8a), and over the entire measure-ment period, these were significantly different (Table 5; P = 0.0016).Average surface (0–6 cm) soil volumetric water content (VWC), was38% higher inside of the cages (P < 0.001) when compared acrossthe entire measurement period (Table 5; Fig. 8b). Average VWCinside of the cages was 0.19 m3 m−3 with a maximum plot measure-ment of 0.29 m3 m−3, whereas the average VWC in open plots was0.138 m3 m−3 with a maximum plot measurement of 0.27 m3 m−3.On four measurement days during the soybean reproductive stage(8/8, 8/18, 8/29, 9/7), open plots had VWC readings below perma-nent wilting point (PWP) for the Plano silt loam soil (0.13 m3 m−3;Campbell and Norman, 1998), which contributed to the averageVWC during the entire measurement period remaining below PWP
56 A.C. Perillo et al. / Agricultural and Forest Meteorology 208 (2015) 50–61
Fig. 6. Box plots (median, quartiles, and outliers shown) depicting the statistical hourly differences between ambient plots and cages (ambient-cages) during a representativeweek of data collected (July 28–August 3, 2012) for (a) solar radiation, (b) wind speed, (c) vapor pressure deficit, and (d) air temperature. Solid lines represent a cubic spline(P < 0.05) fit to the hourly data. The local time of 24 h represents midnight.
Table 3Generalized additive mixed model summary for the effects of environmental setting (ambient open air vs. cages) and time of day and their interaction on solar radiation,wind speed, wind gusts, air temperature, and vapor pressure deficit. P-values are derived from Wald tests with dF = 1.
Source of variation Solar radiation Wind speed Wind gusts Air temperature VPDP
Environment (E) <0.0001 <0.0001 <0.0001 NSa NSTime of day (T) <0.0001 <0.0001 <0.0001 <0.0001 <0.0001E × T <0.0001 <0.0001 <0.0001 <0.0001 <0.0001
a NS: non significant; P > 0.1.
Table 4End of growing season soybean growth measurements from the 2011 paired caged-ambient study. Reported are the arithmetic means ± standard errors (SE). P-values arederived from F-tests with numerator dF = 1 and denominator dF = 12.
Quantity Units Cages (±SE) Ambient (±SE) F1,12 P-value
Aboveground biomass g m−2 95.6 (9.2) 73.5 (10.4) 4.50 0.055Yield g m−2 30.5 (2.9) 24.8 (3.2) 3.22 0.098Harvest index Fraction 0.32 (0.003) 0.34 (0.006) 6.91 0.022Weight of 100 seeds g 13.5 (0.24) 13.89 (0.27) 1.86 0.198Pod mass g m−2 14.2 (2.8) 10.66 (3.0) 1.37 0.265Seed and pod mass g m−2 45.5 (4.8) 35.9 (5.4) 3.08 0.105Seed to pod ratio 2.19 (0.10) 2.44 (0.16) 2.26 0.159Specific leaf area (top leaves) g m−2 30.1 (3.73) 39.6 (4.2) 5.23 0.041Specific leaf area (bottom leaves) g m−2 27.9 (2.13) 28.2 (2.6) 0.008 0.931
A.C. Perillo et al. / Agricultural and Forest Meteorology 208 (2015) 50–61 57
Table 5Repeated, periodic measurements of soybean growth and physiology, leaf tissue chemistry, and soil environmental conditions from the 2011 paired caged-ambient study.Reported are the arithmetic means ± standard errors (SE). P-values are derived from Wald tests of GAMM terms with dF = 1.
Quantity Units Cages (±SE) Ambient (±SE) X21 P-value
Leaf area index (LAI) m2 m−2 5.43 (0.18) 6.52 (0.20) 28.66 <0.001Leaf temperature ◦C 23.5 (0.37) 23.8 (0.42) 0.618 0.432Stomatal conductance !mol H2O m−2 leaf area s−1 0.54 (0.074) 0.38 (0.084) 3.21 0.015Ambient photosynthesis (@400 ppm CO2) !mol CO2 m−2 s−1 24.2 (0.76) 23.8 (0.91) 0.174 0.677Maximum photosynthesis !mol CO2 m−2 s−1 31.1 (2.1) 28.7 (2.5) 0.87 0.356Leaf nitrogen % 3.73 (0.09) 3.52 (0.11) 3.75 0.061Leaf carbon % 46.5 (0.10) 47.0 (0.12) 21.1 <0.001Leaf lignin (acid dissolvable) % 18.7 (0.87) 21.4 (1.1) 6.21 0.018Leaf cellulose % 13.2 (0.35) 14.7 (0.43) 12.3 0.001Soil temperature (10 cm) ◦C 19.0 (0.09) 19.3 (0.10) 10.19 0.0016Soil–water content (0–6 cm) m3 m−3 0.191 (0.007) 0.138 (0.007) 49.8 <0.001
(Fig. 8b). In contrast, the surface VWC in the caged plots neverreached the PWP (Fig 8b).
3.4. Cage effects on physiological responses
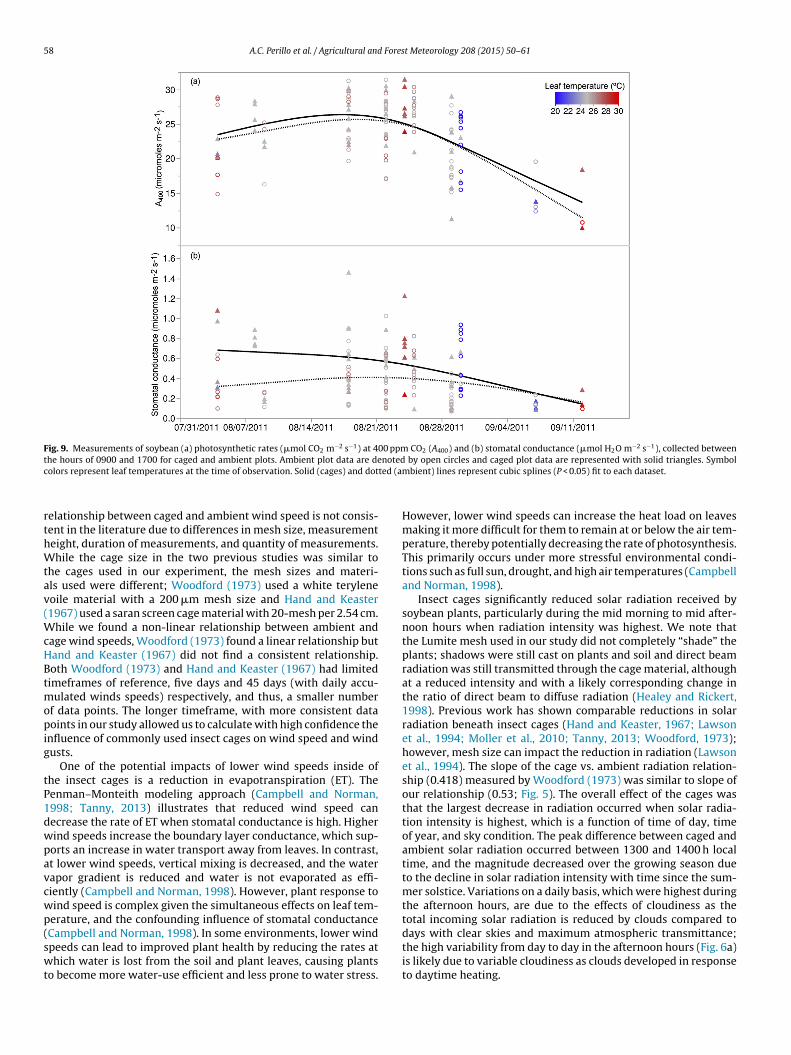
Photosynthetic rates at 400 ppm CO2 (A400) were not signifi-cantly altered inside of the cages (Table 5; Fig. 9a). However, leafstomatal conductance values were on average 42% higher inside ofcages, with the most significant differences occurring in late Julyand early August (Table 5; Fig. 9b). Average maximum photosyn-thesis (Amax) was 8% higher inside of the caged plots; however, thedifference was not significant across all measurements collected oron any individual measurement date. Leaf carbon, cellulose, andacid dissolvable lignin were all significantly lower inside of cages,but leaf nitrogen was slightly higher, although the significance levelfor N was just above P = 0.05 (Table 5).
We measured soybean leaf light response curves (PAR vs.assimilation) when leaf temperatures were near 25 ◦C (+/−1.0 ◦C)to determine whether caged plants may have adapted to thereduced light environment inside of the cages, and increased theirphotosynthetic rates at lower light levels. Using a square roottransformation on the PAR values in the statistical model fittingexercise (i.e., rectangular hyperbola with R2 values of 0.89 andhigher), we found that on the three days where light responsecurves were measured in both open and caged plots (August 18,22 and 29) there was no significant difference between caged andopen plants (P = 0.85, P = 0.59, and P = 0.22, respectively) based onhow rates of photosynthesis responded to a continuum of PARlevels.
Fig. 7. Periodic measurements of leaf area index (LAI; m2 one-sided leaf area perm2 ground area) for caged and ambient plots in 2011 with standard error bars.
Fig. 8. Measurements of (a) 10 cm soil temperature and leaf temperature and (b)0–6 cm volumetric water content for caged and ambient plots in 2011 plotted withstandard error bars. Measurements were collected between the hours of 0900 and1700 each day. The daily average air temperature from the Arlington AgriculturalResearch Station in Arlington, WI is plotted for reference.
4. Discussion
4.1. Cages create an altered microenvironment
The microenvironment that was created inside of insect cageswas substantially altered by an 89% reduction in average daytimewind speed compared to ambient, open-air conditions. Previ-ous studies that have investigated the impact of insect cages onmicroenvironments have reported 49% and 85% reductions in aver-age wind speed (Hand and Keaster, 1967; Woodford, 1973). The
58 A.C. Perillo et al. / Agricultural and Forest Meteorology 208 (2015) 50–61
Fig. 9. Measurements of soybean (a) photosynthetic rates (!mol CO2 m−2 s−1) at 400 ppm CO2 (A400) and (b) stomatal conductance (!mol H2O m−2 s−1), collected betweenthe hours of 0900 and 1700 for caged and ambient plots. Ambient plot data are denoted by open circles and caged plot data are represented with solid triangles. Symbolcolors represent leaf temperatures at the time of observation. Solid (cages) and dotted (ambient) lines represent cubic splines (P < 0.05) fit to each dataset.
relationship between caged and ambient wind speed is not consis-tent in the literature due to differences in mesh size, measurementheight, duration of measurements, and quantity of measurements.While the cage size in the two previous studies was similar tothe cages used in our experiment, the mesh sizes and materi-als used were different; Woodford (1973) used a white terylenevoile material with a 200 !m mesh size and Hand and Keaster(1967) used a saran screen cage material with 20-mesh per 2.54 cm.While we found a non-linear relationship between ambient andcage wind speeds, Woodford (1973) found a linear relationship butHand and Keaster (1967) did not find a consistent relationship.Both Woodford (1973) and Hand and Keaster (1967) had limitedtimeframes of reference, five days and 45 days (with daily accu-mulated winds speeds) respectively, and thus, a smaller numberof data points. The longer timeframe, with more consistent datapoints in our study allowed us to calculate with high confidence theinfluence of commonly used insect cages on wind speed and windgusts.
One of the potential impacts of lower wind speeds inside ofthe insect cages is a reduction in evapotranspiration (ET). ThePenman–Monteith modeling approach (Campbell and Norman,1998; Tanny, 2013) illustrates that reduced wind speed candecrease the rate of ET when stomatal conductance is high. Higherwind speeds increase the boundary layer conductance, which sup-ports an increase in water transport away from leaves. In contrast,at lower wind speeds, vertical mixing is decreased, and the watervapor gradient is reduced and water is not evaporated as effi-ciently (Campbell and Norman, 1998). However, plant response towind speed is complex given the simultaneous effects on leaf tem-perature, and the confounding influence of stomatal conductance(Campbell and Norman, 1998). In some environments, lower windspeeds can lead to improved plant health by reducing the rates atwhich water is lost from the soil and plant leaves, causing plantsto become more water-use efficient and less prone to water stress.
However, lower wind speeds can increase the heat load on leavesmaking it more difficult for them to remain at or below the air tem-perature, thereby potentially decreasing the rate of photosynthesis.This primarily occurs under more stressful environmental condi-tions such as full sun, drought, and high air temperatures (Campbelland Norman, 1998).
Insect cages significantly reduced solar radiation received bysoybean plants, particularly during the mid morning to mid after-noon hours when radiation intensity was highest. We note thatthe Lumite mesh used in our study did not completely “shade” theplants; shadows were still cast on plants and soil and direct beamradiation was still transmitted through the cage material, althoughat a reduced intensity and with a likely corresponding change inthe ratio of direct beam to diffuse radiation (Healey and Rickert,1998). Previous work has shown comparable reductions in solarradiation beneath insect cages (Hand and Keaster, 1967; Lawsonet al., 1994; Moller et al., 2010; Tanny, 2013; Woodford, 1973);however, mesh size can impact the reduction in radiation (Lawsonet al., 1994). The slope of the cage vs. ambient radiation relation-ship (0.418) measured by Woodford (1973) was similar to slope ofour relationship (0.53; Fig. 5). The overall effect of the cages wasthat the largest decrease in radiation occurred when solar radia-tion intensity is highest, which is a function of time of day, timeof year, and sky condition. The peak difference between caged andambient solar radiation occurred between 1300 and 1400 h localtime, and the magnitude decreased over the growing season dueto the decline in solar radiation intensity with time since the sum-mer solstice. Variations on a daily basis, which were highest duringthe afternoon hours, are due to the effects of cloudiness as thetotal incoming solar radiation is reduced by clouds compared todays with clear skies and maximum atmospheric transmittance;the high variability from day to day in the afternoon hours (Fig. 6a)is likely due to variable cloudiness as clouds developed in responseto daytime heating.

A.C. Perillo et al. / Agricultural and Forest Meteorology 208 (2015) 50–61 59
Temperature was not significantly altered inside of the cages.This is consistent with other cage studies that have documentedminimal changes in temperature (Collins et al., 2008; Desneux et al.,2006; Fox et al., 2004; Hand and Keaster, 1967; Lawson et al., 1994;Woodford, 1973). While there was an expectation that tempera-ture would be higher inside of cages due to a reduction in mixingwith the ambient atmosphere, the reduction in radiation poten-tially compensated for decreased turbulent mixing due to reducedwind speeds. The VPD was not significantly impacted by the pres-ence of cages, which is in agreement with previous studies thatreported minimal to no effects of cages on relative humidity (Collinset al., 2008; Fox et al., 2004; Hand and Keaster, 1967). However,relative humidity is not the best meteorological variable to usewhen assessing connections between a microenvironment, plantstomatal response, and ET; instead, VPD is preferred because unlikerelative humidity, the rate of ET is influenced by stomatal conduc-tance and its sensitivity to VPD (Ocheltree et al., 2014). Moreover,rates of ET scale nearly linearly with VPD (Campbell and Norman,1998).
4.2. Cages supported lower soil temperatures, higher surface soilmoisture and stomatal conductance
Soil moisture was consistently higher inside the cages, whichwas likely due to lower ET attributed to lower wind speeds andreduced solar radiation (Hand and Keaster, 1967; Lawson et al.,1994). This effect has been shown in previous cage studies whererates of evaporation decreased between 17 % and 34 % (Hand andKeaster, 1967; Lawson et al., 1994). Lawson et al. (1994) suggestedthat rainfall collecting on the cages and running down the sides intothe soil or the reduced radiation load (e.g., reduced ET) were able tocompensate for decreased rainfall received inside of insect cages.In our study, lower LAI inside of the cages potentially contributedto decreased plant water demand and lower total transpiration,resulting in higher VWC inside of the cages. Stomatal conductancewas likely higher inside of the insect cages due to increased avail-ability of plant available water (Brady et al., 1975; Sanchez-Diazand Kramer, 1971; Sionit and Kramer, 1976). The observed decreasein soil temperatures within cage plots was expected given a corre-sponding increase in soil moisture and significantly lower intensityof solar radiation.
Increased surface soil water inside of the cages likely supportedthe increased total above ground biomass by reducing water stresseven though solar radiation and LAI were both lower. DecreasedLAI inside of the cages was likely a result of stunted plant growthinside of the cages early in the season, potentially due to reducedsolar radiation. Later in the season, when drier conditions pre-vailed, reductions in LAI, wind speed, and solar radiation insideof the cages likely contributed to a reduction in ET and conserva-tion of additional surface soil water compared to open field plots(Tanny, 2013). Subsequently, during the reproductive stage of soy-bean growth (pod fill), plants inside the cages benefitted fromhigher VWC, likely supporting the increase in total plant biomassby the end of the season (Table 4). While Hand and Keaster (1967)reported that precipitation was 16% lower inside of their insectcages, increased surface soil moisture inside of our cages suggeststhat even if there was a reduction in precipitation inside cages,other environmental factors led to reduced ET – which is supportedby higher surface VWC inside of cages compared to ambient (openfield) conditions. In support of our findings here, Moller et al. (2004)reported that sweet pepper water use was 60% lower within aninsect proof screenhouse compared to ambient conditions, whichwas attributed to a 40–50% reduction in radiation load and lowerwindspeed.
4.3. Soybean leaves did not acclimate to lower radiation, butcages can create a radiation regime that supports increasedproductivity
An analysis of light response curves for soybean leaves showedno differences between open and caged plots. Had light responsecurves showed increased photosynthetic rates for caged plants,this might have explained the increased biomass measuredin the cages, suggesting soybean plants adapted to the lowerlight intensities inside of cages. A previous study of soybeanreported that plants acclimated to two different light regimes(550 !mol photons m−2 s−1 and 950 !mol photons m−2 s−1) andhad different photosynthetic capacity when exposed to the sameradiation intensity (Bunce, 1991; Bunce et al., 1977). In additionto these effects, Egli et al. (1985) reported that shading soybeanplants with a black shade cloth during pod and seed developmentincreased the duration of seed growth.
We found that A400 rates were not altered inside of thecages; therefore, there was likely no photosynthetic adaptationof the soybean plant to the lower light environment inside ofthe cages. Because caged plots had a reduced light environmentand typically never reached light saturation levels (∼650 W m−2 or1500 !mol photons m−2 s−1), the actual rate of photosynthesis forleaves near the top of the canopy (e.g., where the majority of sunlitleaves reside) may have been reduced inside of the cages comparedto the open plots (Pons and Pearcy, 1994; Sinclair and Horie, 1989),particularly from mid morning to mid afternoon when radiationdifferences were at a maximum (Fig. 6a). However, the averagePAR intensity on fully shaded leaves in the cage canopy environ-ment may have been higher than that in open field plots due todifferences in the ratio of direct beam vs. diffuse radiation as dif-fuse radiation has been shown to increase beneath screens used incropping systems (Moller et al., 2010).
Cages may act similarly to clouds by not only decreasing themagnitude of total incident PAR on a canopy, but by also alteringthe ratio of diffuse to beam radiation (Gu et al., 1999; Moller et al.,2010). An increase in the fraction of diffuse radiation associatedwith cloud cover can lead to an increase in light use efficiency (LUE)by plants (Alton et al., 2007; Gu et al., 2002). An increase in LUE maycompensate for lower levels of solar radiation inside of the cages,allowing plants to be as productive as those experiencing full sun-light. Diffuse radiation also does not attenuate as quickly as directbeam radiation, which allows for increased light penetration andintensities near the bottom of a plant canopy where photosynthe-sis is usually lower (Knohl and Baldocchi, 2008; Moller et al., 2010).In high LAI canopies (>6.0 m2 m−2) such as soybean, approximately75% of leaf area is shaded assuming a spherical leaf angle distribu-tion (light extinction coefficient = 0.5/cosine of sun zenith angle).Cages may cause an increase in the average diffuse and scatteredlight illumination on shaded leaves in the canopy (Campbell andNorman, 1998), which could support higher assimilation rates incaged plots because of the following two reasons: (1) there were nodifferences in light response curves between caged and open fieldplants; and (2) the majority of leaf area in higher LAI canopies isshaded. Therefore, cages could create a substantially different radi-ation regime than found in open field conditions that could supportincreased overall productivity (Moller et al., 2010).
4.4. Previous studies compared to new findings
Insect cages, similar to the ones in this study, are commonlyused in field experiments to maintain control over insect popu-lations. A few studies have performed a thorough investigationof the caged microclimate using meteorological instrumentation(Hand and Keaster, 1967; Woodford, 1973), while others have iden-tified specific impacts on their experiment (Lawson et al., 1994;
60 A.C. Perillo et al. / Agricultural and Forest Meteorology 208 (2015) 50–61
Simmons and Yeargan, 1990) (Table 1). Some studies have reportedno impacts or focused on the change in aphid populations (Chaconet al., 2008; Donaldson et al., 2007; Gardiner et al., 2009). However,most cage studies do not sufficiently identify how the outcome oftheir experiment may have been altered by the presence of thecages because they have not measured a full suite of meteorologi-cal and soil environmental variables to understand the confoundingeffects.
A few soybean aphid studies have measured temperature andrelative humidity (Desneux et al., 2006; Fox et al., 2004; Rhaindset al., 2007), but did not identify a changing radiation regimeand wind speed as being important and dominant controls on themicroenvironment, photosynthesis, ET; from the current results,these clearly influence soil moisture dynamics, stomatal response,and productivity. Some studies have relied on citing previousresults (e.g., no effects of cages), but the problem is more com-plex than represented by measures of temperature and relativehumidity (Tanny, 2013). We concluded there were still importantdifferences in the soil environment and plant growth caused bythe Lumite cages used, largely attributed to a modified radiationregime and reduced wind speeds. Two recent studies (Beckendorfet al., 2008; Riedell et al., 2013) referenced another study (Bell andBaker, 2000) that suggested the amber colored Lumite mesh mate-rial is commonly used in field studies because it is known for goodfor light penetration and wind flow; however, this referenced studydid not actually report radiation or wind speed measured directlywithin cages. The Bell and Baker (2000) study suggested that theLumite “32 × 32” screen material was classified as having “low” airresistance, ranking near the bottom of many tested screen materi-als for exerting an influence on wind flow. Clearly, the results of ourstudy demonstrated that the Lumite 32 × 32 screening significantlyimpedes air movement across plants and modifies the radiationregime and studies from arid regions using agricultural screeningalso refute this claim (Tanny, 2013). Therefore, we argue that theseprevious statements about Lumite being preferred because of goodlight penetration and wind flow should be questioned.
Lastly, the seasonal and diel patterns of differences in micro-climate between caged and open plots (Figs. 4 and 6) suggest thatthe influence of cages is not consistent across time. These differ-ences are likely a function of the time of day as well as calendardate. The latitude (e.g., sun angle and intensity of solar radiation)of a study site and the baseline climatology will likely influence themagnitude of differences between cages and ambient conditions.
5. Conclusions
Insect cages used in this study created distinctly differentmicroenvironment compared to ambient conditions by inhibitingwind flow and changing the radiation regime, which impacted sur-face soil environmental conditions, stomatal conductance, LAI, totalplant biomass and harvest index, and leaf tissue chemistry. How-ever, insect cages are an important and often relied upon apparatusin field settings as part of plant-insect relation studies in agronomyand entomology; therefore, the unintended impacts of using insectcages should be quantified to understand how they influence exper-imental results. Measurements similar to the ones collected in thisstudy (e.g., wind speed, solar radiation or PAR, air temperature,vapor pressure deficit, soil temperature and soil volumetric watercontent) are critical to provide context needed to qualify potentialimpacts on plant physiology and possibly even insect develop-ment. One of our key findings was that higher surface soil moistureinside of cages, due to reduced ET, supported increases in stomatalconductance that likely led to increased total plant biomass com-pared to plants grown in ambient conditions. In addition and maybe more importantly, the insect cages also likely contributed to a
significant change in the radiation regime, whereby shaded leavesin the caged canopy were exposed to a higher illumination levelthan those in the open field plots, which would have supportedincreased assimilation by plants.
While the outcome of our study may invoke concern for thoseusing insect cages to estimate plant responses, we stress that thedegree of impact that insect cages have is influenced by the physicalproperties of material used, as well as the ambient environmen-tal conditions. The influence of cages is likely not static; in ourmid latitude experiment, time of day and seasonal changes drivethe magnitude of measured environmental differences betweencages and ambient conditions, suggesting that a standard responseor influence of cages on experiments is unlikely. Extreme envi-ronmental conditions that exist during experiments may alsoexacerbate the degree of influence that cages have on experiments.For example, the catastrophic US drought of 2012 might have putcaged plants at a physiological advantage due the importance ofany additional soil moisture on plant growth. In our study during ashort-term (∼4 week) drought in 2011, open field plots were sub-jected to surface soil moisture at the permanent wilting point foran extended time period, but this was not the case inside of thecaged plots.
A reduction of LAI inside of cages, while at least partiallyattributed to lower solar radiation, was also potentially influencedby human disturbance while making repetitive (e.g., weekly) mea-surements of LAI or aphid counts throughout the growing season.This could also create a disturbance factor on plants that couldpotentially be confused with the impacts of insect/pest pressureif yield is the key effect being studied.
We have described numerous issues regarding use of insectcages, but also acknowledge that they are crucial to continuedresearch. As such, we urge researchers to take a more thoroughapproach to accounting for the potential influences of cages thatgo beyond simplistic measures of how temperature and relativehumidity change inside cages. A more complete understanding ofthe connections in the soil-plant-insect-atmosphere system is ulti-mately needed to determine whether insect cages are complicatingthe interpretation of plant growth or physiological responses toinsect manipulation studies that use insect cages.
Acknowledgements
The authors thank Trip Hook, Clayton Kingdon, Skye Greenler,Mike Cruse, Joey Lechelt, and Tyler Davis for assisting with field-work. We appreciate the helpful discussions and input from DanielKleinman. The research was funded through USDA Agriculture andFood Research Initiative Competitive Grant #2011-67009-3002.
References
Alton, P.B., North, P.R., Los, S.O., 2007. The impact of diffuse sunlight on canopylight-use efficiency, gross photosynthetic product and net ecosystem exchangein three forest biomes. Global Change Biol. 13 (4), 776–787.
Beckendorf, E.A., Catangui, M.A., Riedell, W.E., 2008. Soybean aphid feeding injuryand soybean yield, yield components, and seed composition. Agron. J. 100 (2),237–246.
Bell, M.L., Baker, J.R., 2000. Comparison of greenhouse screening materials forexcluding whitefly (Homoptera: Aleyrodidae) and thrips (Thysanoptera:Thripidae). J. Econ. Entomol. 93 (3), 800–804.
Boardman, N.K., 1977a. Comparative photosynthesis of sun and shade plants.Annu. Rev. Plant Physiol. Plant Mol. Biol. 28, 355–377.
Boardman, N.K., 1977b. Regulation of photosynthesis by light-intensity.Proceedings of the Australian Biochemical Society 10, Q8.
Brady, R.A., Goltz, S.M., Powers, W.L., Kanemasu, E.T., 1975. Relation of soil–waterpotential to stomatal resistance of soybean. Agron. J. 67 (1), 97–99.
Bunce, J.A., 1991. Control of the acclimation of photosynthesis to light andtemperature in relation to partitioning of photosynthate in developingsoybean leaves. J. Exp. Bot. 42 (240), 853–859.
Bunce, J.A., Patterson, D.T., Peet, M.M., Alberte, R.S., 1977. Light acclimation duringand after leaf expansion in soybean. Plant Physiol. 60 (2), 255–258.
A.C. Perillo et al. / Agricultural and Forest Meteorology 208 (2015) 50–61 61
Buntin, G.D., 2001. Techniques for evaluating yield loss from insects. In: Peterson,R.K.D., Higley, L.G. (Eds.), Biotic Stress and Yield Loss. CRC Press, Boca Raton,Florida, pp. 23–41.
Campbell, G.S., Norman, J.M., 1998. An Introduction to Environmental Biophysics.Springer-Verlag, New York, NY.
Catangui, M.A., Beckendorf, E.A., Riedell, W.E., 2009. Soybean aphid populationdynamics, soybean yield loss, and development of stage-specific economicinjury levels. Agron. J. 101 (5), 1080–1092.
Chacon, J.M., Landis, D.A., Heimpel, G.E., 2008. Potential for biotic interference of aclassical biological control agent of the soybean aphid. Biol. Control 46 (2),216–225.
Collins, S.R., Weldon, C.W., Taylor, P.W., 2008. Effects of field cage colour andsupplementary shade on environmental conditions and mating behaviour ofQueensland fruit flies, Bactrocera tryoni. Entomol. Exp. Appl. 129 (2), 142–147.
Costamagna, A.C., Landis, D.A., 2006. Predators exert top-down control of soybeanaphid across a gradient of agricultural management systems. Ecol. Appl. 16 (4),1619–1628.
Costamagna, A.C., Landis, D.A., Brewer, M.J., 2008. The role of natural enemy guildsin Aphis glycines suppression. Biol. Control 45 (3), 368–379.
Costamagna, A.C., Landis, D.A., Difonzo, C.D., 2007. Suppression of soybean aphidby generalist predators results in a trophic cascade in soybeans. Ecol. Appl. 17(2), 441–451.
Desneux, N., O’Neil, R.J., Yoo, H.J.S., 2006. Suppression of population growth of thesoybean aphid, Aphis glycines Matsumura, by predators: the identification of akey predator and the effects of prey dispersion, predator abundance, andtemperature. Environ. Entomol. 35 (5), 1342–1349.
Donaldson, J.R., Myers, S.W., Gratton, C., 2007. Density-dependent responses ofsoybean aphid (Aphis glycines Matsumura) populations to generalist predatorsin mid to late season soybean fields. Biol. Control 43 (1), 111–118.
Egli, D.B., Guffy, R.D., Leggett, J.E., 1985. Partitioning of assimilate betweenvegetative and reproductive growth in soybean. Agron. J. 77 (6), 917–922.
Fox, T.B., Landis, D.A., Cardoso, F.F., Difonzo, C.D., 2004. Predators suppress Aphisglycines matsumura population growth in soybean. Environ. Entomol. 33 (3),608–618.
Gardiner, M.M., et al., 2009. Landscape diversity enhances biological control of anintroduced crop pest in the north-central USA. Ecol. Appl. 19 (1), 143–154.
Gu, L.H., et al., 2002. Advantages of diffuse radiation for terrestrial ecosystemproductivity. J. Geophys. Res.-Atmos. 107, D5–D6.
Gu, L.H., Fuentes, J.D., Shugart, H.H., Staebler, R.M., Black, T.A., 1999. Responses ofnet ecosystem exchanges of carbon dioxide to changes in cloudiness: resultsfrom two North American deciduous forests. J. Geophys. Res.-Atmos. 104(D24), 31421–31434.
Hand, L.F., Keaster, A.J., 1967. Environment of an insect field cage. J. Econ. Entomol.60 (4), 910.
Healey, K.D., Rickert, K.G., 1998. Shading material changes the proportion ofdiffuse radiation in transmitted radiation. Aust. J. Exp. Agric. 38 (1), 95–100.
Healey, K.D., Rickert, K.G., Hammer, G.L., Bange, M.P., 1998. Radiation use efficiencyincreases when the diffuse component of incident radiation is enhanced undershade. Aust. J. Agric. Res. 49 (4), 665–672.
Kidd, N.A.C., Jervis, M.A., 2005. Population dynamics. In: Jervis, M.A. (Ed.), Insectsas Natural Enemies: a Practical Perspective. Springer, Dordrecht, TheNetherlands, pp. 435–524.
Knohl, A., Baldocchi, D.D., 2008. Effects of diffuse radiation on canopy gas exchangeprocesses in a forest ecosystem. J. Geophys. Res.-Biogeosci. 113 (G2).
Lawson, D.S., Brown, S.K., Nyrop, J.P., Reissig, W.H., 1994. Microclimate andcolumnar apple tree performance within insect-exclusionary cages.HortScience 29 (9), 1008–1015.
Liu, J., Wu, K.M., Hopper, K.R., Zhao, K.J., 2004. Population dynamics of Aphisglycines (Homoptera: Aphididae) and its natural enemies in soybean innorthern China. Ann. Entomol. Soc. Am. 97 (2), 235–239.
Moller, M., Cohen, S., Pirkner, M., Israeli, Y., Tanny, J., 2010. Transmission ofshort-wave radiation by agricultural screens. Biosys. Eng. 107 (4),317–327.
Moller, M., Tanny, J., Li, Y., Cohen, S.T., 2004. Measuring and predictingevapotranspiration in an insect-proof screenhouse. Agric. For. Meteorol. 127(1–2), 35–51.
NOAA, 2011. Climatography of the United States No. 81, Monthly Station Normalsof Temperature, Precipitation, and Heating and Cooling Degree Days1981–2010. Wisconsin., National Oceanic and Atmospheric Administration(NOAA), Asheville, NC.
Ocheltree, T.W., Nippert, J.B., Prasad, P.V.V., 2014. Stomatal responses to changes invapor pressure deficit reflect tissue-specific differences in hydraulicconductance. Plant Cell Environ. 37 (1), 132–139.
Perillo, A.C., 2014. Soybean aphid impacts on plant photosynthesis andproductivity in southern Wisconsin: effects of population density and timingof introduction. In: Masters Thesis. University of Wisconsin-Madison, Madison,Wisconsin.
Pinheiro J., Bates D., DebRoy S., Sarkar D., R Core Team, 2005. nlme: linear andnonlinear mixed effects models. R package version. 3.1-110.
Pons, T.L., Pearcy, R.W., 1994. Nitrogen reallocation and photosyntheticacclimation in response to partial shading in soybean plants. Physiol. Plant. 92(4), 636–644.
R Development Core Team, R., 2014. R: A Language and Environment for StatisticalComputing. R Development Core Team, Vienna, Austria.
Ragsdale, D.W., et al., 2007. Economic threshold for soybean aphid (Hemiptera:Aphididae). J. Econ. Entomol. 100 (4), 1258–1267.
Rhainds, M., Roy, M., Daigle, G., Brodeur, J., 2007. Toward management guidelinesfor the soybean aphid in Quebec. I. Feeding damage in relationship toseasonality of infestation and incidence of native predators. Can. Entomol. 139(5), 728–741.
Riedell, W.E., Beckendorf, E.A., Catangui, M.A., 2013. Soybean aphid injury effectson shoot nitrogen components in glycine max. Crop Sci. 53 (1), 232–239.
Sanchez-Diaz, M., Kramer, P.J., 1971. Behavior of corn and sorghum under waterstress during recovery. Plant Physiol. 48 (5), 613.
SAS, 2013. Using JMP11. SAS Institute, Inc., Cary, NC.Serbin, S.P., Singh, A., McNeil, B.E., Kingdon, C.C., Townsend, P.A., 2014.
Spectroscopic determination of leaf morphological and biochemical traits fornorthern temperate and boreal tree species. Ecol. Appl.
Simmons, A.M., Yeargan, K.V., 1990. Effect of combined injuries from defoliationand green stink bug (hemiptera, pentatomidae) and influence of field cages onsoybean yield and seed quality. J. Econ. Entomol. 83 (2), 599–609.
Sinclair, T.R., Horie, T., 1989. Leaf nitrogen, photosynthesis, and crop radiation useefficiency – a review. Crop Sci. 29 (1), 90–98.
Sionit, N., Kramer, P.J., 1976. Water potential and stomatal resistance of sunflowerand soybean subjected to water stress during various growth stages. PlantPhysiol. 58 (4), 537–540.
Tanny, J., 2013. Microclimate and evapotranspiration of crops covered byagricultural screens: a review. Biosys. Eng. 114 (1), 26–43.
Wood, S.N., 2006. Generalized Additive Models: An Introduction with R. Chapmanand Hall/CRC, Boca Raton, FL.
Woodford, J.A., 1973. Climate within a large aphid-proof field cage. Entomol. Exp.Appl. 16 (3), 313–321.