use of rounded base turns in general aviation traffic
TRANSCRIPT

University of North DakotaUND Scholarly Commons
Theses and Dissertations Theses, Dissertations, and Senior Projects
5-1-2017
Use of Rounded Base Turns in General AviationTraffic Patterns: A Quantitative AnalysisLewis Robert James Archer
Follow this and additional works at: https://commons.und.edu/theses
This Thesis is brought to you for free and open access by the Theses, Dissertations, and Senior Projects at UND Scholarly Commons. It has beenaccepted for inclusion in Theses and Dissertations by an authorized administrator of UND Scholarly Commons. For more information, please [email protected].
Recommended CitationArcher, Lewis Robert James, "Use of Rounded Base Turns in General Aviation Traffic Patterns: A Quantitative Analysis" (2017). Thesesand Dissertations. 384.https://commons.und.edu/theses/384

USE OF ROUNDED BASE TURNS IN GENERAL AVIATION TRAFFIC PATTERNS: A
QUANTITATIVE ANALYSIS
by
Lewis Robert James Archer
Bachelor of Science, University of North Dakota, 2011
A Thesis
Submitted to the Graduate Faculty
of the
University of North Dakota
in partial fulfillment of the requirements
for the degree of
Master of Science
Grand Forks, North Dakota
May
2017

i
Copyright 2017 Lewis Robert James Archer


iv
TABLE OF CONTENTS
LIST OF FIGURES ...................................................................................................................... vii
LIST OF TABLES ......................................................................................................................... ix
ACKNOWLEDGEMENTS .............................................................................................................x
ABSTRACT ................................................................................................................................... xi
CHAPTER
I. INTRODUCTION ............................................................................................................1
Statement of the Problem .........................................................................................2
Purpose of the Study ................................................................................................4
Research Questions ..................................................................................................4
Literature Review.....................................................................................................5
Loss of Control ............................................................................................5
The Traffic Pattern .......................................................................................8
The Rounded Base .....................................................................................11
Accidents and Incidents .............................................................................17
Arlington, WA – July 11, 2003 ......................................................18
Boyceville, WI – August 5, 2006...................................................18
Williamsburg, VA – April 19, 2013 ..............................................18
Aerodynamic Stalls during Base-to-Final Turn .........................................19
Definitions..............................................................................................................19
II. METHODOLOGY .........................................................................................................21

v
Introduction ............................................................................................................21
Population ..............................................................................................................23
Variables ................................................................................................................23
Data Sources and Collection ..................................................................................26
Instrument Reliability and Validity .......................................................................27
Proposed Data Analysis .........................................................................................28
Participants .............................................................................................................28
Assumptions and Limitations ................................................................................29
Protection of Human Subjects ...............................................................................31
III. RESULTS .......................................................................................................................33
Statistical Analysis .................................................................................................34
Bank Angle ................................................................................................35
Vertical Speed ............................................................................................36
Indicated Airspeed .....................................................................................38
Pitch Attitude .............................................................................................40
Runway Alignment ....................................................................................42
Chi-Square Test .........................................................................................46
IV. DISCUSSION ................................................................................................................47
Research Question 1 ..............................................................................................47
Research Question 2 ..............................................................................................49
Research Question 3 ..............................................................................................49
Research Question 4 ..............................................................................................50
Research Question 5 ..............................................................................................51
Conclusions ............................................................................................................52

vi
APPENDICES ...............................................................................................................................54
Appendix A ........................................................................................................................55
Appendix B ........................................................................................................................57
Appendix C ........................................................................................................................59
REFERENCES ..............................................................................................................................63

vii
LIST OF FIGURES
Figure Page
1. Traffic Patterns.........................................................................................................................10
2. Components of a Traffic Pattern ..............................................................................................11
3. Overhead Maneuver .................................................................................................................12
4. Landing Pattern ........................................................................................................................13
5. Normal Traffic Pattern .............................................................................................................14
6. Comparison between Traditional Rectangular Pattern and Circular Pattern ...........................15
7. Target Airspeed Determination................................................................................................16
8. Circular Landing Pattern Segments .........................................................................................17
9. Rounded Base Procedure .........................................................................................................22
10. Boxplots of Mean Bank Angles ...............................................................................................35
11. Boxplots of Maximum Bank Angles .......................................................................................36
12. Boxplots of Mean Vertical Speeds ..........................................................................................37
13. Boxplots of Maximum Vertical Speeds ...................................................................................38
14. Boxplots of Mean Indicated Airspeeds ....................................................................................39
15. Boxplots of Minimum Indicated Airspeeds .............................................................................40
16. Boxplots of Mean Pitch Attitudes ............................................................................................41
17. Boxplots of Maximum Pitch Attitudes ....................................................................................42
18. Line Chart of Pattern 22; Rectangular Method ........................................................................43
19. Line Chart of Pattern 23; Rectangular Method ........................................................................44

viii
20. Line Chart of Pattern 25; Rectangular Method ........................................................................44
21. Line Chart of Pattern 26; Rectangular Method ........................................................................45
22. Line Chart of Pattern 28; Rectangular Method ........................................................................45
23. Increase in Stall Speed and Load Factor ..................................................................................48

ix
LIST OF TABLES
Table Page
1. Adverse Conditions Leading to Part 91 I-LOC Accidents in Approach/Landing Phase of
Flight ..........................................................................................................................................6
2. Primary Cause of I-LOC in Part 91 Accidents in Approach/Landing Phase of Flight ..............7
3. Abeam Distance Estimation Chart ...........................................................................................15
4. G1000 Flight Data Logging Parameters ..................................................................................27
5. Proposed Statistical Tests ........................................................................................................28
6. Independent t-test; Bank Angle ...............................................................................................36
7. Independent t-test; Vertical Speed ...........................................................................................38
8. Independent t-test; Indicated Airspeed ....................................................................................40
9. Independent t-test; Pitch Attitude ............................................................................................42
10. Crosstabulation of Method Used and Runway Alignment ......................................................46

x
ACKNOWLEDGEMENTS
I would like to sincerely thank the AOPA Air Safety Institute for developing this procedure and
trusting me with this research opportunity. The Air Safety Institute deserves substantial
recognition for their exceptional work in promoting aviation safety. In addition, I would like to
thank my thesis committee for their efforts as well as John Walberg for putting up with my
constant requests for data. The Standards Department at the University of North Dakota deserve
special recognition for their willingness to refine this procedure, serve as participants, and take
time out of their flights to perform this procedure. I would like to thank the entire Aviation
Department faculty for their support in this endeavor – I am proud to work with you all.
Finally, I would like to thank my wife Lindsay for her patience, devotion, and unwavering
support of me. You are my motivation.

xi
ABSTRACT
Prevention of in-flight loss of control (I-LOC) in General Aviation (GA) continues to be
identified as a most-wanted safety improvement by the National Transportation Safety Board
(NTSB), with emphasis on low-altitude maneuvering. A possible technique to mitigate I-LOC is
modification of the rectangular traffic pattern used by aircraft arriving and maneuvering within
the airspace around an airport. The rectangular pattern is used to align the aircraft with the
runway for landing and consists of a “base leg” in which two 90-degree directional changes are
accomplished. A “rounded-base” could instead be conducted, consisting of a constant 180-
degree turn, potentially resulting in lower angles-of-attack (AOA), thereby keeping the aircraft
further from the critical AOA at which I-LOC may occur.
Using flight data monitoring equipment, a comparative statistical analysis was conducted
between the rectangular method and rounded base method to evaluate variables that influence
AOA and determine if the rounded-base method provides an increased level of safety. Results
suggest that the rounded base method does allow for lower bank angles, lower pitch attitudes,
lower vertical speeds, and more consistent indicated airspeeds throughout the maneuver.
Additionally, the rounded-base method considerably reduces the likelihood of runway overshoot
during the turn to final.

1
CHAPTER I
INTRODUCTION
On May 3, 2012, a Beechcraft Bonanza crashed at the Lake in the Hills Airport (3CK) in
northern Illinois upon arrival from a cross-country flight. The wind was reported out of the
south-southwest, visibility was unrestricted, and sky conditions were reported as few. In the right
seat was an 82 year-old commercial pilot with over 18,000 hours of flight experience. In the left
seat; a 62 year-old flight instructor and commercial pilot with almost 8,000 hours of flight
experience. A witness on the ground observed the aircraft in the traffic pattern for runway 26,
then witnessed the aircraft enter a very steep bank during the base-to-final turn. A scene of
horror quickly unfolded as the aircraft uncontrollably traversed into the ground, abruptly ending
the lives of the two experienced aviators. The National Transportation Safety Board (NTSB)
determined the probable cause to be “the pilot’s excessive bank angle while on approach to land,
which resulted in an inadvertent aerodynamic stall and spin”. Additionally, investigators noted
that the wind conditions during the base-to-final turn were conducive to a runway overshoot. It
was theorized that the pilot was attempting to aggressively re-align the aircraft with the runway
on final, leading to a stall and an unrecoverable flight condition (National Transportation Safety
Board, 2013).

2
Statement of the Problem
The scenario described is one of many examples of in-flight loss of control (I-LOC) in
the airport traffic pattern. Prevention of I-LOC in general aviation (GA) has been on the NTSB’s
“most wanted” list of safety improvements for the past three years (2015, 2016, and 2017).
Between 2008 and 2014, I-LOC was a factor in almost 48 percent of fixed-wing GA accidents.
Maneuvering at low altitude, such as during a traffic pattern, has been identified as an area of
concern due to the limited time and altitude in which a pilot would have to recover from an
inadvertent aerodynamic stall (National Transportation Safety Board, 2016). In 2015, a forum
hosted by the NTSB convened to gather potential solutions to the I-LOC problem. One
recommendation, proposed by the Aircraft Owner’s and Pilot’s Association’s (AOPA) Air Safety
Institute (ASI), was to promote the use of a “circular pattern” during the approach and landing
phase of flight versus the traditional rectangular (“box”) pattern, which has long been the
standard method of operating in the airport terminal environment under visual flight rules (Perry,
2016).
The standard traffic pattern, as described by the Federal Aviation Administration’s (FAA)
Airplane Flying Handbook (AFH), consists of five legs; departure, crosswind, downwind, base,
and final. All turns in the rectangular pattern consist of a 90 degree change of direction to
maneuver the aircraft into a position for landing (United States Department of Transportation,
2016). The transition from the base leg to the final leg may be the most challenging phase of the
pattern, as it requires the pilot to estimate when to begin the turn based on wind conditions
which, due to the variability of wind and its effect on aircraft performance, can be difficult to
predict. A turn that starts late will result in the pilot undershooting or overshooting the runway,

3
often leading to dangerous control inputs that increase the angle-of-attack (AOA) and place the
aircraft close to, or in, a stalled condition. A multitude of accidents have occurred in which this
scenario resulted in a low altitude stall and unrecoverable loss of aircraft control (AOPA Air
Safety Institute, 2015).
The proposed circular pattern includes a rounded base leg in which the pilot conducts a
constant 180-degree turn from downwind to final instead of the traditional squared base in which
the pilot conducts a 90-degree heading change, flies a ground track perpendicular to the extended
runway centerline, then conducts an additional 90-degree heading change to align with the
runway while making configuration changes after each turn. Moore (2015) theorized that the use
of a rounded base turn would result in a safer approach and would reduce the likelihood of
runway overshoot during the base-to-final turn which could lead to I-LOC if the pilot attempts an
aggressive correction.
Currently, the literature contains little information regarding the use of an alternative
style of traffic pattern to reduce the likelihood of I-LOC accidents. Several studies have
examined I-LOC, including a 2015 AOPA report which identified I-LOC as the cause of 40
percent of fatal general aviation accidents. While alternatives to the traditional rectangular
pattern have been proposed (Snow, 2001), a quantitative analysis of a rounded base method has
yet to be conducted. Advocates of the maneuver assert that it would increase the margin of safety
during the approach-to-landing phase of flight by reducing the maximum AOA encountered
during the procedure, thereby keeping the aircraft further away from the critical AOA at which
the aircraft stalls while also creating a more stabilized approach (Perry, 2016). Combined with

4
other safety initiatives, including the use of angle-of-attack (AOA) indicators, the rounded base
method may validate itself as a safer method of conducting a traffic pattern in a GA aircraft.
Purpose of the Study
The purpose of this study is to determine, using flight data analysis, whether the use of a
rounded base leg would result in a safer and more stabilized traffic pattern for general aviation
aircraft than the traditional squared base. Specifically, the study will determine to what extent the
use of the rounded base method would influence the following variables; bank angle, vertical
speed, indicated airspeed, pitch attitude, and runway alignment as the aircraft joins the extended
runway centerline. It is hypothesized that the use of the rounded base method will result in lower
bank angles, greater descent rates, faster indicated airspeeds, and lower pitch attitudes, while also
resulting in an increased likelihood of being aligned with the runway upon rollout on final. This
study will provide a scientific conclusion on whether the rounded base method should be further
investigated as a potential mitigation technique for reducing GA I-LOC accidents.
Research Questions
Through statistical analysis of flight data, this study will answer the following questions:
1) Is there a statistically significant difference in bank angles between the rounded base and
rectangular base methods?
2) Is there a statistically significant difference in descent rates between the rounded base and
rectangular base methods?
3) Is there a statistically significant difference in indicated airspeeds between the rounded
base and rectangular base methods?

5
4) Is there a statistically significant difference in pitch attitudes between the rounded base
and rectangular base methods?
5) Is there a statistically significant relationship between the method used (rounded or
rectangular base) and alignment with the runway upon completion of the turn to final?
LITERATURE REVIEW
Loss of Control
Several studies conducted by a variety of organizations have highlighted I-LOC as a
significant factor in aviation fatalities. A National Aeronautics and Space Administration
(NASA) study of aircraft accidents and incidents between 1988 and 2004 revealed that more than
half of all aircraft fatalities occurred in conjunction with I-LOC. Reveley, Briggs, Evans,
Sandifer, and Monica Jones (2010) found that 56 percent of 14 CFR Part 91 (general aviation)
accidents in the approach/landing phase of flight during this time period were a result of pilot-
induced control upset (Table 1).
Reveley et al. (2010) also revealed that inadequate airspeed and/or stall was the primary
cause of I-LOC in 14 CFR Part 91 operations during the approach/landing phase of flight (Table
2), indicating that AOA management during this phase of flight should be a point of emphasis in
future safety initiatives.
An analysis by Veillette (2009) of 59 I-LOC accidents in business jets between 1991 and
2007 revealed that 37 of these accidents occurred within 1000 feet of the surface and 26 occurred
during the approach-to-landing phase of flight. The most common cause of these accidents was
an unintentional stall, 16 of which occurred during approach and landing. Of the 16 approach

6
and landing stalls, 6 occurred during approaches in which the aircraft was banked. Veillette
outlined the threats encountered while banking an aircraft including less focus inside the aircraft,
sensory illusions due to the movement of the vestibular system, and increased AOA. Veillette
recommended a multi-layered approach to include the use of improved procedures to reduce the
frequency of I-LOC accidents.
Table 1
Adverse Conditions Leading to Part 91 I-LOC Accidents in Approach/Landing Phase of Flight
Adverse Condition Number of Accidents
Total system/component failure/malfunction 157 (10 percent)
Damage, fire 12
Damage, collision 62
Damage, weather 0
Damage, pilot 9
Total damage 83 (5 percent)
Control upset, pilot 921 (56 percent)
Control upset, low-altitude maneuver 0
Control upset, severe weather 111
Control upset, other events 363
Total control upset 1395
Total 1635 (100 percent)
Note. Adapted from Causal Factors and Adverse Conditions of Aviation Accidents and Incidents
Related to Integrated Resilient Aircraft Control, by Reveley, M., Briggs, J., Evans, J., Sandifer,
C., & Monica Jones, S., 2010, Technical Memorandum No. NASA/TM-2010-216261, p. 9.
National Aeronautics and Space Administration.
An analysis by Michales (2012) of 52 LOC accidents in multiengine turbine aircraft
found similar results to the 2010 NASA study; the most frequent casual factor in these accidents
was control upset in conjunction with low altitude maneuvering. The study also found that these
accidents frequently occurred in conjunction with pilot-induced loss of control, thereby
supporting the theory that these accidents were a result of pilot error, rather than other factors

7
such as flight control malfunctions. Based on these findings, Michales described the need for
increased emphasis of I-LOC avoidance in training programs.
Table 2
Primary Cause of I-LOC in Part 91 Accidents in Approach/Landing Phase of Flight
Primary Cause Number of Accidents
Inadequate airspeed and/or stall 675 (48.4 percent)
Weather (WX), icing 38
WX, thunderstorm 4
WX, wind shear 29
WX, turbulence 2
WX, adverse winds 267 (19 percent)
WX, obscuration 20
Visual flight rules into instrument meteorological conditions 18
Spatial disorientation 52
Diverted attention 8
Wake turbulence 27
Inadequate preflight 13
Incorrect weight/balance 2
Improper use of controls 54
Improper handling 4
Incorrect or unsuitable runway 1
Procedural/decision error 33
Pilot incapacitation 18
Pilot impairment 12
Control interference 0
Passenger interference 2
Aircraft performance capability exceeded 1
Lack of experience 19
Aircraft control not maintained 85
Unknown 11
Total 1395 (100 percent)
Note. Adapted from Causal Factors and Adverse Conditions of Aviation Accidents and Incidents
Related to Integrated Resilient Aircraft Control, by Reveley, M., Briggs, J., Evans, J., Sandifer,
C., & Monica Jones, S., 2010, Technical Memorandum No. NASA/TM-2010-216261, p. 16.
National Aeronautics and Space Administration.

8
As a result of the Colgan 3407 accident, Public Law 111-216 mandated that the FAA
implement the NTSB recommendations to provide stall and upset recognition and recovery
training to airline pilots. In the past, training for airline pilots has consisted of recognition and
recovery from “approaches to stalls” as described in the FAA’s Airline Transport Pilot (ATP)
Practical Test Standards (PTS). Due to the new regulation, the mindset has started to shift
towards an emphasis on AOA management during stall recovery (Chandler, 2011). While this
new perspective may help to decrease the rate of I-LOC accidents, it is primarily a teaching
method to recover from a stall rather than an operational method that may reduce the likelihood
of actually entering a stall.
As revealed by the NTSB’s “most-wanted” lists, prevention of in-flight loss of control in
general aviation continues to be a priority. The FAA defines loss of control as “an aircraft’s
unintended departure from controlled flight” that may occur as a result of pilot distraction, loss
of situational awareness, or an encounter with hazardous weather. According to the FAA,
however, the most common type of I-LOC accident is a stall often followed by a spin. The
NTSB identified the approach-to-landing, maneuvering, and initial climb as the deadliest phases
of flight for I-LOC accidents with emphasis on the traffic pattern due to the “limited time and
altitude available to recover from a stall or spin” (National Transportation Safety Board, 2016).
The Traffic Pattern
The airport traffic pattern is a standardized maneuver to allow aircraft to safely arrive,
depart, and operate within the airport (terminal) environment. Similar to the role of a highway
on- or off-ramp, the airport traffic pattern is designed to create an orderly flow of arriving and
departing aircraft traffic at both towered and non-towered airports. The maneuver has been

9
taught for at least several decades (Hartney, 1940) and continues to be a task that is required to
be evaluated for the issuance of a pilot certificate (Federal Aviation Administration, 2016).
According to the FAA’s Airplane Flying Handbook (AFH), the traffic pattern is a
procedure providing specific routes for departures and arrivals at airports to ensure an orderly
flow of traffic. Unless otherwise depicted by visual markings, all turns in a traffic pattern are
made to the left. The traffic pattern (Figure 1) consists of six segments; the entry, downwind,
base, final, departure, and crosswind leg. The focus of this study is the base leg, which is
described by the AFH as the transition between the downwind and final legs. The handbook
states that the pilot should begin a turn from the downwind to the base leg at a point
approximately 45 degrees beyond the approach end of the runway by establishing a “medium
bank turn”. Upon completion of the 90 degree turn from downwind to base, the pilot is to
maintain a flight path perpendicular to the extended runway centerline until ready to begin the
turn to final. The handbook stresses the importance of avoiding steep bank angles during the
base-to-final turn, but provides very little guidance on when to actually begin the turn (Federal
Aviation Administration, 2016a).
For all public-use runways in the US, the pattern altitude, as well as the direction if non-
standard, is indicated in the US Digital Chart Supplement (d-CS). For example, the d-CS
indicates that the traffic pattern for runway 17R at Grand Forks International Airport in Grand
Forks, ND is to the right (“right tfc.”), with a traffic pattern altitude (TPA) of 1645 feet MSL
(800 feet AGL) for light aircraft.
As depicted in Figure 2, the FAA’s Aeronautical Information Manual (AIM) describes
six legs of the traffic pattern; the upwind, crosswind, downwind, base, final approach, and

10
departure leg. The base leg is defined as “a flight path at right angles to the landing runway off
its approach end and extending from the downwind leg to the intersection of the extended
runway centerline”.
Figure 1. Traffic Patterns. From Airplane Flying Handbook, by United States Department of
Transportation, Federal Aviation Administration, Flight Standards Service, 2016, p. 7-3. United
States Department of Transportation, Federal Aviation Administration, Airman Testing
Standards Branch.

11
Figure 2. Components of a Traffic Pattern. From Aeronautical Information Manual, by United
States Department of Transportation, Federal Aviation Administration, 2014, p. 4-3-1. United
States Department of Transportation, Federal Aviation Administration.
The Rounded Base
In a 2001 article by Robert Snow published in AOPA Flight Training Magazine, the
concept of an “asymmetrical traffic pattern” is described as an alternative to the rectangular base-
to-final turn. Snow promotes the use of a shallow-banked early turn from the base leg to final, as
it provides the pilot with more time to evaluate the effects of wind and adjust the turn
accordingly to avoid overshooting the runway. By beginning the turn earlier and at a shallower
bank angle, the pilot has a greater margin of bank available that may be used to avoid
overshooting the runway without approaching the critical AOA at which the aircraft stalls.
A similar type of maneuver can be found in FAA literature. The Overhead Approach
Maneuver, seen in Figure 3, is described in the AIM as a maneuver which may be performed by
an aircraft on an IFR flight plan operating in visual meteorological conditions at airports in
which aircraft may have an operational need to conduct the maneuver. The maneuver begins
with a constant 180-degree turn from the “break point” above the runway to the downwind leg.

12
The maneuver is completed with an additional 180-degree turn from the downwind leg to roll-
out on final (Federal Aviation Administration, 2015).
Figure 3. Overhead Maneuver. From Aeronautical Information Manual, by United States
Department of Transportation, Federal Aviation Administration, 2014, p. 5-4-62. United States
Department of Transportation, Federal Aviation Administration.
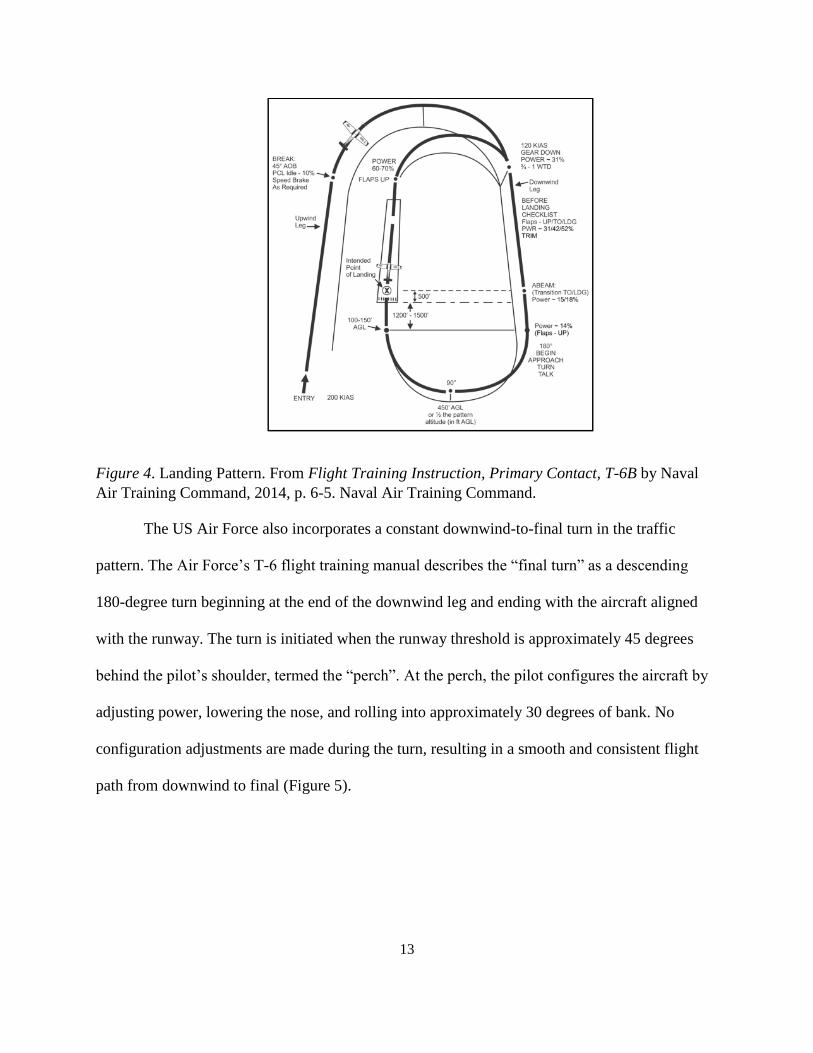
As illustrated in Figure 4, the US Navy’s T-6B flight training manual describes the
landing pattern as a “racetrack-shaped course” consisting of an upwind leg, crosswind turn,
downwind leg, approach turn, and landing line. The approach turn consists of a 180-degree turn
from the downwind to either touchdown or commencement of a go-around procedure. The
manual states that this type of approach develops “judgment and ability to control airspeed with
nose attitude and rate of descent with power, while tracking a prescribed pattern over the ground
under varying wind conditions” while developing “consistency in landing the aircraft on or near
the intended point of landing”.
13
Figure 4. Landing Pattern. From Flight Training Instruction, Primary Contact, T-6B by Naval
Air Training Command, 2014, p. 6-5. Naval Air Training Command.
The US Air Force also incorporates a constant downwind-to-final turn in the traffic
pattern. The Air Force’s T-6 flight training manual describes the “final turn” as a descending
180-degree turn beginning at the end of the downwind leg and ending with the aircraft aligned
with the runway. The turn is initiated when the runway threshold is approximately 45 degrees
behind the pilot’s shoulder, termed the “perch”. At the perch, the pilot configures the aircraft by
adjusting power, lowering the nose, and rolling into approximately 30 degrees of bank. No
configuration adjustments are made during the turn, resulting in a smooth and consistent flight
path from downwind to final (Figure 5).

14
Figure 5. Normal Traffic Pattern. From T-6 Primary Flying, by United States Air Force Flying
Operations, 2011, p. 58. Air Force Departmental Publishing Office.
The circular traffic pattern, as envisioned by the AOPA ASI in Figure 6, consists of a
constant 180-degree rounded base leg. During the rounded base, no configuration changes are
made to the aircraft, most having already been completed on the downwind leg. The procedure
does allow for a final configuration adjustment once the aircraft is established in a wings-level
condition on the final leg. This procedure was adapted from the technique used by the US Navy
and US Air Force as well as several ab initio flight training programs.
Industry experts, such as Snow (2001) and Perry (2016), theorize that the rounded base
turn will result in a safer and more stabilized approach for the following reasons; relatively
constant angles of bank, rates of descent, and power settings; avoidance of configuration changes
during the turn; and emphasis of stabilized approach concepts including energy management and
AOA awareness.

15
Figure 6. Comparison between Traditional Rectangular Pattern and Circular Pattern. Graphic
courtesy of AOPA Air Safety Institute.
Prior to beginning the maneuver, the pilot must determine the appropriate “baseline
airspeed” to be used on final prior to the roundout and flare. With the baseline airspeed
determined, the pilot calculates “target airspeeds” to be used throughout the maneuver as
illustrated in Figure 7. Based on the ground speed expected to be encountered during the
downwind leg, the appropriate abeam distance between the runway centerline and the downwind
leg must be determined using the information in Table 3.
Table 3
Abeam Distance Estimation Chart
Downwind Ground Speed 40-60
knots
60-70
knots
70-80
knots
80-90
knots
90-100
knots
100-120
knots
Abeam Distance between Runway and
Downwind Leg (miles) 0.3 0.4 0.5 0.6-0.7 0.8-1.0 1.0
Abeam Distance between Runway and
Downwind Leg (feet) 2000 2500 3000 4000 5000 6000
Note. Data courtesy of AOPA Air Safety Institute.

16
Figure 7. Target Airspeed Determination. Graphic courtesy of AOPA Air Safety Institute.
As depicted in Figure 8, the maneuver begins as the pilot configures the aircraft while
approaching the abeam point on the downwind leg. An airspeed of approximately 20 to 30
percent above baseline is maintained in level flight until reaching the “timing and descent
initiation point”. With a descent rate of approximately 300 to 400 feet-per-minute, the pilot
begins the turn at approximately 20 to 25 seconds beyond the runway threshold using a bank
angle between approximately 20 to 30 degrees. Once established in the turn, descent rate
increases slightly to approximately 500 to 600 feet-per-minute. Configuration changes are not
recommended during the turn to minimize destabilizing the aircraft. As the aircraft begins to
align with the extended runway centerline, the pilot rolls the aircraft wings-level, then makes a
final configuration adjustment to prepare the aircraft for landing.

17
Figure 8. Circular Landing Pattern Segments. Graphic courtesy of AOPA Air Safety Institute.
Accidents and Incidents
A query of the NTSB accident database provided additional insight into the frequency
and seriousness of the problem. The search criteria consisted of 14 CFR Part 91 accidents
occurring in the approach phase of flight in visual meteorological conditions in reciprocating-
powered airplanes. 35 reports were returned when results were filtered to include only those
accidents with the phrase “base to final turn” in the synopsis and narrative. Three accidents are
highlighted:

18
Arlington, WA – July 11, 2003
The first occurred on July 11, 2003, when an Archer S-18T impacted terrain during a
traffic pattern maneuver at the Arlington Municipal Airport (AWO) in Arlington, WA. The pilot
conducted an early base to final turn in which a maximum bank angle of near 60 degrees was
encountered. The airplane entered a stall, causing the aircraft to roll into a 90 degree bank angle.
The pilot was able to recover the aircraft to a normal attitude prior to impact, resulting in no
injuries or fatalities. The NTSB determined the probable cause to be “the pilot’s failure to
maintain an airspeed above Vs (stalling speed) while making a close-in base-to-final turn.”
Boyceville, WI – August 5, 2006
On August 5, 2006, a Cirrus SR22 at the Boyceville Municipal Airport (3T3) in
Boyceville, WI entered a steep bank during the base to final turn leading to an inadvertent stall.
Due to the low altitude at which the upset began, the stall was unrecoverable, causing the aircraft
to impact terrain near the runway. The accident resulted in three injuries; one serious and two
minor. The NTSB determined the probable cause to be “the pilot’s failure to maintain adequate
airspeed…which resulted in an inadvertent stall during a base to final turn to the landing
runway”.
Williamsburg, VA – April 19, 2013
On April 19, 2013, a Cessna 210E impacted terrain during a traffic pattern maneuver at
the Williamsburg-Jamestown Airport (JGG) in Williamsburg, VA. During the base to final turn,
witnesses observed the aircraft pass beyond the extended centerline of the runway, then enter a
steep bank. The aircraft then entered a steep descent, impacting terrain approximately one-half
mile away from the runway, resulting in two fatalities. The NTSB determined the probable cause

19
to be “the pilot’s failure to maintain airplane control during a base-to-final turn…which resulted
in an aerodynamic stall and collision with terrain.”
Aerodynamic Stalls during Base-to-Final Turn
These three accidents, in addition to numerous others, share a common theme; they
occurred as a result of an aerodynamic stall during the base-to-final turn. As the pilots increased
their bank angle during the turn, AOA increased to the point at which the wing exceeded the
critical AOA, causing the aircraft to stall and collide with terrain. These accidents, in addition to
the plethora of research conducted on I-LOC, indicate the need for action to alleviate the
likelihood of entering a stall during the base-to-final turn.
DEFINITIONS
Accident – An occurrence associated with the operation of an aircraft, which takes place
between the time any person boards the aircraft with the intention of flight and all such
persons have disembarked, and in which any person suffers death or serious injury, or in
which the aircraft receives substantial damage.
Angle-of-Attack – The angle at which relative wind meets an airfoil. It is the angle that is
formed by the chord of the airfoil and the direction of the relative wind or between the chord
line and the flight path. The angle of attack changes during a flight as the pilot changes the
direction of the aircraft and is related to the amount of lift being produced.
Bank Angle – The angle between the aircraft’s normal axis and the earth’s vertical plane
containing the aircraft’s longitudinal axis.
Critical Angle of Attack – The angle of attack at which a wing stalls regardless of airspeed,
flight attitude, or weight.

20
General Aviation – All flight activity of every kind except that done by the uniformed armed
services and the scheduled airlines.
In-Flight Loss of Control – The partial or complete loss of control of the airplane during an
airborne phase of flight, or the period from when the wheels lift off the ground to when the
wheels touch down.
Incident – An occurrence other than an accident, associated with the operation of an aircraft,
which affects or could affect the safety of operations.
Indicated Airspeed – The direct instrument reading obtained from the airspeed indicator,
uncorrected for variations in atmospheric density, installation error, or instrument error.
Pitch Attitude – The angle between the longitudinal axis of the aircraft and the horizon.
Spin – An aggravated stall that results in an airplane descending in a helical, or corkscrew
path.
Stall – A rapid decrease in lift caused by the separation of airflow from the wing’s surface,
brought on by exceeding the critical angle of attack. A stall can occur at any pitch attitude or
airspeed.
Vertical Speed – A measurement of the rate of climb or descent in feet per minute.

21
CHAPTER II
METHODOLOGY
Introduction
I-LOC continues to be identified as the largest contributor to general aviation fatalities.
Maneuvering at low altitudes, such as during a traffic pattern, poses considerable risk as the time
for a pilot to recover from loss of control is greatly reduced (National Transportation Safety
Board, 2016). While considerable research regarding in-flight loss of control has been
conducted, a review of the literature provided very little evidence of investigations into
alternative methods of conducting the traffic pattern. This study evaluates the use of a rounded
base leg as an alternative to the traditional rectangular base leg using statistical flight data
analysis. The independent variable is the type of method utilized (rounded base or rectangular
base). The dependent variables are bank angle, vertical speed, indicated airspeed, pitch attitude,
and runway alignment. The study uses a between-groups quasi-experimental design to analyze
differences between the experimental condition (the rounded base method) and the control (the
rectangular method).
The design of the procedure utilized in this study (Figure 9) was an adaptation of a design
created by the AOPA ASI (Figure 8). The ASI developed the procedure using guidance from
syllabi, procedures, and best practices available from sources including the US Navy and ab-
initio flight training programs. The ASI procedure was distributed to three flight instructors who

22
were managers within the Standards Department at a large collegiate flight school, two of whom
would also participate in the data collection phase of this study. Each of these individuals
conducted the maneuver several times in a Cessna 172S with the goal of validating and refining
its design. Feedback from these individuals was gathered and used to design the final version of
the maneuver to be used in the study.
Figure 9. Rounded Base Procedure.
The rounded base method utilized for this study was refined for use in the Cessna 172S
aircraft that would conduct the maneuver. The design consists of a pattern width of between 0.5

23
to 0.75 nautical miles away from the runway centerline with a target airspeed on the downwind
leg of 80 knots indicated. Upon reaching midfield downwind, the pilot sets wing flaps to 10
degrees while maintaining level flight with an engine power setting of approximately 1900 RPM.
When abeam the aim point for touchdown, the pilot reduces power to approximately 1400 to
1500 RPM, sets flaps to 20 degrees, and lowers the pitch attitude of the aircraft to allow for a
descent at approximately 80 knots indicated. At a location approximately 45 degrees beyond the
aim point, the pilot begins the constant downwind-to-final turn. During the turn, airspeed is
expected to decrease from approximately 75 knots indicated to 61 knots indicated upon rollout.
As the aircraft rolls-out on the final leg, the pilot sets flaps to the FULL position if required
while adjusting power, pitch, and airspeed as necessary to maintain a stabilized approach to the
touchdown point.
Population
The population in this study are pilots operating under the regulations of 14 CFR Part 91
(general aviation) in single-engine piston-powered aircraft such as the Cessna 172S. General
aviation encompasses a wide range of flight operations including multi-engine and turbine-
powered aircraft, however, these particular sectors were not analyzed in this study. In addition,
pilots operating under other regulations such as 14 CFR Part 121 and 135 were excluded as
traffic patterns are less common in these types of operations and, when they are utilized, usually
differ significantly in altitude and dimensions.
Variables
Five variables are analyzed in this study; bank angle, vertical speed, indicated airspeed,
pitch, and runway alignment. These variables were selected due to their influence on AOA.

24
According to the Pilot’s Handbook of Aeronautical Knowledge (United States Department of
Transportation, 2016b), a stall is “a rapid decrease in lift caused by the separation of airflow
from the wing’s surface, brought on by exceeding the critical angle of attack”. As angle-of-attack
increases, the aircraft moves closer to the critical angle-of-attack at which the stall occurs.
Bank angle, according to the Airplane Flying Handbook (United States Department of
Transportation, 2016a), is defined as “the angle formed by the airplane’s lateral axis, which
extends from wingtip to wingtip, and the natural horizon”. Simply put, bank angle is a
measurement of the angular difference between the wing and the horizon. For the purposes of
this study, both mean bank angles and maximum bank angles will be analyzed.
Vertical speed is a measurement of the rate of climb or descent of the aircraft in units of
feet-per-minute (FPM). A vertical speed above 0 FPM indicates a climb, whereas a vertical
speed below 0 FPM indicates a descent. As it is assumed the pilot is intending to descend the
aircraft during this portion of the traffic pattern, a greater vertical speed indicates the aircraft is
not descending as fast as an aircraft with a lower vertical speed. With weight, bank angle, engine
RPM, and air density held constant, a greater vertical speed may indicate the aircraft is closer to
the critical AOA as the pilot would need to add elevator force to arrest the descent. To evaluate
this variable, both mean vertical speeds and maximum vertical speeds will be analyzed.
Indicated airspeed, per the Airplane Flying Handbook (United States Department of
Transportation, 2016a), is defined as “the direct instrument reading obtained from the airspeed
indicator, uncorrected for variations in atmospheric density, installation error, or instrument
error”. Stall speeds published in Airplane Flight Manuals (AFM) or Pilot Operating Handbooks
(POH) are in units of indicated airspeed. An aircraft will stall at the same indicated airspeed

25
regardless of atmospheric conditions such as density, pressure, and temperature. Although
indicated stall speed does change with weight, load factor, and aircraft configuration, the
published indicated stall speed may be used as a baseline to determine approximately how far the
aircraft is from the stall. The lower the indicated airspeed, the closer the aircraft is to stall speed.
For the purposes of this study, both mean indicated airspeeds and minimum indicated airspeeds
will be analyzed.
Pitch is defined by the Airplane Flying Handbook (United States Department of
Transportation, 2016a) as “the rotation of an airplane about its lateral axis…” While pitch
attitude is not a direct indication of AOA, it can provide a general idea of proximity to AOA.
Generally speaking, with all other variables held constant, an aircraft at a higher pitch attitude
would be at a higher AOA than an aircraft at a lower pitch attitude. To evaluate this variable,
both mean pitch attitudes and maximum pitch attitudes will be analyzed.
Runway alignment, the only categorical variable to be analyzed in this study, refers to the
position of the aircraft with respect to the extended runway centerline upon completion of the
turn to final. It is desired that the aircraft be aligned with the runway upon rollout, however,
factors such as wind, bank angle, and poor judgment for when to begin the turn often result in the
aircraft either undershooting (as a result of turning too much) or overshooting (as a result of not
turning enough) the extended runway centerline. Each pattern will be categorized into one of two
conditions with condition 1 representing aircraft that were aligned with the runway upon
completion of the turn and condition 2 representing aircraft that were not aligned upon
completion of the turn.

26
Data Sources and Collection
The study consisted of flight data analysis from 14 CFR Part 91 flights conducted in
single-engine piston-powered Cessna 172S Skyhawks. The aircraft were operated by a large 14
CFR Part 141 collegiate flight training program located in the Upper Midwest region of the
United States. Two groups of data were utilized; an experimental group consisting of the
rounded base method as well as a control group consisting of the traditional rectangular method.
Data from both the experimental and control groups were collected by integrated flight
data monitoring (FDM) software in the Garmin G1000 avionics suite, a standard feature of the
school’s fleet of aircraft. The software is capable of recording a multitude of parameters (Table
4) with storage of up to 1,000 flight hours of data for every 1 GB of capacity on an SD card.
Data is recorded automatically at a rate of once per second whenever the Multi-Function Display
(MFD) is powered on.
The participants in the experimental group were instructed to complete a short
questionnaire upon the conclusion of each flight to allow for retrieval of the flight data. The
questionnaire asked for the registration number of the aircraft as well as the date, time, and
location in which the maneuver was conducted. In addition, the questionnaire asked if the SRA
and the organization’s existing safety controls were effective in identifying and mitigating the
risk and hazards encountered during the procedure. If the respondent answered this question in
the negative, the questionnaire asked the respondent to provide information on additional hazards
encountered that were not previously considered. Finally, the questionnaire asked for additional
input that may be helpful to the researcher when analyzing the data. This questionnaire was
distributed in an electronic format using the Qualtrics platform. A link to the questionnaire was

27
provided to the participants prior to the commencement of the flights. Upon receipt of the
completed questionnaires, the data was retrieved from the aircraft.
Table 4
G1000 Flight Data Logging Parameters
Date Pitch Attitude
Angle (degrees)
Nav1/Nav2
frequency
AFCS roll/pitch
commands Engine RPM
Time Roll Attitude
Angle (degrees) CDI deflection GPS fix
Oil Pressure
(psi)
GPS Altitude
(MSL)
Lateral and
Vertical G Force
(g)
VDI/GP/GS
deflection
GPS horizontal
alert limit
Oil Temperature
(deg. F)
GPS Altitude
(WGS84 datum)
Ground Speed
(kts)
Wind Direction
(degrees)
GPS vertical
alert limit TIT (deg. F)
Baro-Corrected
altitude (feet)
Ground Track
(degrees
magnetic)
Wind Speed
(knots)
SBAS GPS
horizontal
protection level
Manifold
Pressure (in. Hg)
Baro Correction
(in/Hg)
Latitude
(degrees;
geodetic;
+North)
Active Waypoint
Identifier
SBAS GPS
vertical
protection level
CHT
Indicated
airspeed (kts)
Longitude
(degrees;
geodetic; +East)
Distance to next
waypoint (nm)
Fuel Qty (right
& left)(gals) EGT
Vertical speed
(fpm)
Magnetic
Heading
(degrees)
Bearing to next
waypoint
(degrees)
Fuel Flow (gph)
GPS vertical
speed (fpm) HSI source
Magnetic
variation
(degrees)
Fuel Pressure
(psi)
OAT (degrees
C) Selected course
Autopilot
On/Off
Voltage 1 and/or
2
True airspeed
(knots)
Com1/Com2
frequency
AFCS roll/pitch
modes Amps 1 and/or 2
Note. Adapted from Garmin G1000 Cockpit Reference Guide for the Cessna Nav III, by Garmin
Ltd., 2011, p. 11-23. AOPA Membership Publications, Inc.
Instrument Reliability and Validity
The reliability and validity of FDM equipment has been well documented in the
literature. FDM is utilized in a variety of general aviation operations for the purposes of research,

28
education, and monitoring safety trends (PR Newswire, 2010). The FDM data came in the form
of multiple .csv files, with each file representing one flight from MFD power-up to power-down.
Filtering was conducted within each file to remove flight data not associated with the base leg of
the traffic patterns.
Proposed Data Analysis
The relevant FDM data was copied from each .csv file into IBM© SPSS© Statistics
Version 23. This software was used to produce descriptive statistics and to identify statistical
significance (α = .05). As no evidence existed in the literature of prior testing of a rounded base
method, this study utilized two-tailed tests to evaluate the hypotheses. The statistical tests
utilized are identified in Table 5.
Table 5
Proposed Statistical Tests
Dependent Variable Statistical Test
Bank Angle Independent t-test
Vertical Speed Independent t-test
Indicated Airspeed Independent t-test
Pitch Attitude Independent t-test
Runway Alignment Chi-Square
Participants
Participants for the experimental group were selected out of convenience to the
researcher. The group consisted of three flight instructors, all members of the school’s Standards
Department, who were selected due to their high-level of experience and their role in conducting
standardization flights for the flight instructor cadre. These flights were targeted by the
researcher due to their frequency of occurrence, the lack of extra cost in conducting the flights,

29
and the high level of proficiency and experience of the individuals in command of the aircraft.
Data for the control group was randomly selected from the same fleet of aircraft.
Participants within the experimental group were instructed by the researcher on how to
conduct the rounded base maneuver, to conduct the maneuver only at non-towered airports and,
to conduct the maneuver with only themselves acting as the PF. Two of the three participants had
previously conducted an earlier version of the maneuver as designed by the AOPA ASI and had
provided input in the design of the most recent version. In addition, the participants were
presented with a copy of a Safety Risk Assessment (SRA) conducted in accordance with the
school’s FAA-approved Safety Management System (SMS).
Assumptions and Limitations
It was assumed that the rounded base turns were performed solely by the participants
selected as PF by the researcher. In addition, it was assumed that the maneuver was conducted in
accordance with the procedure briefed by the researcher to the participants (Figure 9). It was
assumed that the participants in the control group were intending to conduct the traditional
rectangular base method during 14 CFR Part 91 operations.
The most significant limitation to this study was the aeronautical experience level of the
participants. For the purposes of both safety and convenience, the participants selected to
conduct the rounded base turns were experienced flight instructors with considerable proficiency
in the aircraft. Additionally, two of the three participants had assisted in the development of this
version of the maneuver by flying the procedure developed by the AOPA ASI. The data for the
control group was randomly selected without any indication of the experience level of these
pilots. These limitations do present a threat to the validity of the study.

30
First, the experience level of the pilots using the rounded base method may confound the
data as their skill may be influencing any detected advantages of the rounded base over the
rectangular base. A counterbalance may exist within the control group as the experience level of
these pilots may mirror that of the experimental group, although this cannot be determined due to
the random nature of the control group. A within-groups design using a random sampling of
participants would likely provide the counterbalance necessary to overcome this concern.
An additional threat to validity is repeated testing. As two of the three participants had
assisted in the development of the maneuver, the technique may have been learned to the extent
that errors such as excessive bank and misalignment with the runway were unlikely. This
concern is counterbalanced for two reasons; one, the pilot who had not participated in the
developmental phase was initially unfamiliar with the procedure and two, the rectangular
patterns in the control group had likely been conducted by those participants many times before
as it is currently the standard method, perhaps giving the control group a slight advantage over
the experimental group.
The experience level of the participants in the experimental group weaken the ability to
apply the results of this study to the spectrum of general aviation pilots which includes a wide
variety of experience and proficiency. In addition, the repeated testing effect may lead to a false
sense of confidence in any detected advantage of the rounded base procedure as well as the
simplicity in learning the procedure.
A further limitation of this study is the lack of feedback from the participants regarding
their perceptions of the maneuver. Anecdotal comments from pilots who have performed the
maneuver have been positive, however, feedback has not been validated through the use of any

31
type of survey instrument. Additional research is necessary to determine how the use of a
rounded base leg would be received by the GA community.
An additional concern is the extent to which the rounded base affects a pilot’s visibility in
the traffic pattern. A technique encouraged by the FAA is to visually check for traffic on final
approach prior to beginning the turn from base to final (United States Department of
Transportation, 2016b). As the aircraft does not roll into a wings-level attitude on the base leg
during this maneuver, the ability to perform this visual check may be hindered. This concern
may be alleviated by conducting the visual check on the downwind leg just prior to commencing
the turn, although further research is necessary to determine the ability to see-and-avoid traffic
while using this method.
Finally, this study lacks analysis of cognitive workload. While the data from this study
may provide evidence that the rounded base method could be a safer alternative than the
rectangular base, it is unknown whether the maneuver affects the level of cognitive workload
encountered by the pilot during the approach-to-landing phase of flight. Additional research
using survey instruments and quantitative electroencephalography (QEEG) devices will be
necessary to draw conclusions in this area.
Protection of Human Subjects
The study received approval from the Institutional Review Board (IRB) of the University
of North Dakota (UND). All participants conducting the rounded base method, including all
other occupants on the aircraft who were not acting as the Pilot Flying (PF) during the maneuver,
were asked to provide consent. Those individuals, including those occupants of the aircraft not
acting as the PF, who wished to not participate in the study were provided the opportunity to

32
either withhold or withdraw their consent at any time. All occupants of an aircraft in which a
rounded base turn was conducted had granted consent and were presented with a copy of the
Safety Risk Assessment (SRA) conducted in accordance with the school’s FAA-approved Safety
Management System (SMS).
All flight data used in this study was de-identified, with the exception of the aircraft
registration number, which did not provide any indication as to which participant was operating
the aircraft. If the participant decided not to release flight data from any particular flight, they
were instructed to avoid completing the post-flight questionnaire which would prevent retrieval
of the flight data. Participants with questions or concerns were advised to contact either the UND
IRB or the researcher via email or phone.

33
CHAPTER III
RESULTS
Data from the experimental group was obtained based on information provided by each
pilot in an online questionnaire using the Qualtrics platform. The flight data was provided in
multiple .csv files, with each file representing one flight from engine start to shutdown. An
SPSS© file was created to gather the descriptive values to be used for the analysis. For the
experimental group, the SPSS© file contained only the data recorded from the commencement
(end of downwind) to completion (beginning of final) of each turn. This filtering was
accomplished through analysis of both roll (bank) angle and aircraft track with respect to the
runway heading, which was determined by analyzing geographic coordinates provided in the
data.
Control group data was obtained a random sampling of flight data from the same 14 CFR
Part 141 collegiate flight training program. Each .csv file was analyzed to verify the presence of
traffic patterns at non-towered airports through examination of altitude, airspeed, roll (bank)
angle and aircraft track with respect to runway heading, which was determined by analyzing
geographic coordinated provided in the data. Files that did not include traffic patterns at non-
towered airports were rejected. Once an amount of rectangular patterns equal to the amount of
rounded-base patterns were identified, the data was imported into the same SPSS© file as the
experimental group. For the control group, the SPSS© file contained only data recorded from the
commencement to completion of each turn (downwind-to-base and base-to-final). Data recorded

34
between these turns (when the aircraft was approximately wings-level) was excluded as the focus
of the study is on the turn and this data would have inappropriately skewed the results and
subsequent statistical analysis.
Within SPSS©, the Compute Variable function was applied to the roll variable to
calculate the absolute value of each data point. This was accomplished because the roll data
included negative values to indicate rolls to the left and positive values to indicate rolls to the
right. As the direction of the roll was not applicable to these variables and because the negative
values would incorrectly skew the results, the absolute value of each data point was calculated
into a new variable titled “Bank Angle”.
An additional SPSS© file was created to contain only the descriptive values to be
analyzed, with each row representing one traffic pattern. In addition, the categorical variable
(runway alignment) was entered into this file. The data for the categorical variable was
determined by using a separate dataset containing the same data recorded during the turns, but
also containing data beyond the completion of each turn, terminating at aircraft touchdown. This
extra data was required to determine if the pilot made corrections to align the aircraft with the
runway after completion of the turn to final. Aircraft touchdown was determined through
analysis of vertical G-force, altitude, and airspeed. In addition, this file included the “wings-
level” data deleted from the rectangular patterns in the original dataset.
Statistical Analysis
Using an alpha level of .05, independent samples t-tests were conducted to compare bank
angle, vertical speed, indicated airspeed, and pitch attitude during rounded base turns and
rectangular base turns. The t-tests indicated significant differences for all variables.

35
Bank Angle
Mean bank angles (Figure 10) during the rounded base method ranged from 6.58° to
14.66°. Mean bank angles during the rectangular method ranged from 11.16° to 19.23°. On
average, the use of the rounded base method resulted in lower mean bank angles (M = 10.89°,
SD = 2.55°) than the rectangular base method (M = 14.88°, SD = 2.29°). This difference, -3.99°,
95% CI [-5.74°, -2.24°] was highly significant (p < .001) and represented a medium effect size, d
= .7.
Figure 10. Boxplots of Mean Bank Angles.
Maximum bank angles (Figure 11) during the rounded base method ranged from 13.62°
to 23.52° while maximum bank angles during the rectangular method ranged from 20.18° to
36.34°. On average, the use of the rounded base method resulted in lower maximum bank angles
(M = 18.32°, SD = 3.34°) than the rectangular base method (M = 26.71°, SD = 4.48°). This

36
difference, -8.39°, 95% CI [-11.24°, -5.54°] was highly significant (p < .001) and represented a
medium effect size, d = .7.
Figure 11. Boxplots of Maximum Bank Angles.
Table 6
Independent t-test; Bank Angle
Method Used
Rounded-Base Rectangular Base t df
Mean Bank Angle 10.89
(2.55)
14.88
(2.29) -4.657*** 30
Maximum Bank Angle 18.32
(3.34)
26.71
(4.48) -6.006*** 30
Note. *** = p < .001. Standard Deviations appear in parentheses below means.
Vertical Speed
As expected, vertical speeds were generally negative values, indicating that the aircraft
were descending. Mean descent rates (Figure 12) during the rounded base method ranged from -
449.69 FPM to -704.27 FPM. Mean descent rates during the rectangular method ranged from -

37
326.39 FPM to -603.27 FPM to. On average, the use of the rounded base method resulted in
greater mean descent rates (M = -568.30 FPM, SD = 60.57 FPM) than the rectangular base
method (M = -456.86, SD = 73.37). This difference, -111.44 FPM, 95% CI [-160.08 FPM, -62.81
FPM] was highly significant (p < .001) and represented a medium effect size, d = .7.
Figure 12. Boxplots of Mean Vertical Speeds.
Maximum vertical speeds (Figure 13) during the rounded base method ranged from -
433.08 FPM to -23.79 FPM. Maximum vertical speeds during the rectangular method ranged
from -206.53 FPM to 354.38 FPM. On average, the use of the rounded base method resulted in
lower maximum vertical speeds (M = -303.50 FPM, SD = 116.26 FPM) than the rectangular base
method (M = 21.07, SD = 179.38). This difference, -324.57 FPM, 95% CI [-433.70 FPM, -
215.43 FPM] was highly significant (p < .001) and represented a medium effect size, d = .7.

38
Figure 13. Boxplots of Maximum Vertical Speeds.
Table 7
Independent t-test; Vertical Speed
Method Used
Rounded-Base Rectangular Base t df
Mean Vertical Speed -568.30
(60.75)
-456.86
(73.37) -4.68*** 30
Maximum Vertical Speed -303.50
(116.26)
21.07
(179.38) -6.07*** 30
Note. *** = p < .001. Standard Deviations appear in parentheses below means.
Indicated Airspeed
Mean indicated airspeeds (Figure 14) during the rounded base method ranged from 66
knots to 72 knots. Mean indicated airspeeds during the rectangular method ranged from 66 knots
to 96 knots. On average, the use of the rounded base method resulted in lower mean indicated
airspeeds (M = 69.06 knots, SD = 1.61 knots) than the rectangular base method (M = 75.06
knots, SD = 7.63 knots). This difference, -6.00 knots, 95% CI [-10.125 knots, -1.875 knots] was
significant (p = .007) and represented a medium effect size, d = .6.

39
Figure 14. Boxplots of Mean Indicated Airspeeds.
Minimum indicated airspeeds (Figure 15) during the rounded base method ranged from
58 knots to 64 knots. Minimum indicated airspeeds during the rectangular method ranged from
59 knots to 92 knots. On average, the use of the rounded base method resulted in lower minimum
indicated airspeeds (M = 62.13 knots, SD = 1.63 knots) than the rectangular base method (M =
68.56 knots, SD = 8.10 knots). This difference, -6.44 knots, 95% CI [-10.81 knots, -2.06 knots]
was significant (p = .007) and represented a medium effect size, d = .6.

40
Figure 15. Boxplots of Minimum Indicated Airspeeds.
Table 8
Independent t-test; Indicated Airspeed
Method Used
Rounded-Base Rectangular Base t df
Mean Indicated Airspeed 69.06
(1.61)
75.06
(7.63) -3.08* 16.34
Minimum Indicated Airspeed 62.13
(1.63)
68.56
(8.10) -3.12* 16.21
Note. * = p < .05. Standard Deviations appear in parentheses below means.
Pitch Attitude
Mean pitch attitudes (Figure 16) during the rounded base method ranged from -3.77° to -
1.50°. Mean pitch attitudes during the rectangular method ranged from -3.56° to .72°. On
average, the use of the rounded base method resulted in lower mean pitch attitudes (M = -2.53°,
SD = .66°) than the rectangular base method (M = -1.25°, SD = 1.22°). This difference, -1.27°,
95% CI [-1.98, -.57] was significant (p = .001) and represented a medium effect size, d = .6.

41
Figure 16. Boxplots of Mean Pitch Attitudes.
Maximum pitch attitudes (Figure 17) during the rounded base method ranged from -1.67°
to 2.35°. Maximum pitch attitudes during the rectangular method ranged from -1.37° to 8.42°.
On average, the use of the rounded base method resulted in lower maximum pitch attitudes (M =
-.13°, SD = 1.04°) than the rectangular base method (M = 2.88°, SD = 2.50°). This difference, -
3.01°, 95% CI [-4.42, -1.59] was highly significant (p < .001) and represented a medium effect
size, d = .7.

42
Figure 17. Boxplots of Maximum Pitch Attitudes.
Table 9
Independent t-test; Pitch Attitude
Method Used
Rounded-Base Rectangular Base t df
Mean Pitch Attitude -2.53
(.66)
-1.25
(1.22) -3.68* 30
Maximum Pitch Attitude -.13
(1.04)
2.88
(2.50) -4.44*** 20.04
Note. * = p < .05, *** = p < .001. Standard Deviations appear in parentheses below means.
Runway Alignment
To determine whether the aircraft was aligned with the runway upon rollout from the turn
to final, the roll variable from each pattern was individually analyzed in the form of a line chart.
This was used to determine if the aircraft re-initiated a turn shortly after establishing a wings-
level attitude (0° roll). If the aircraft rolled no more than 5° left or right after establishing wings-
level, it was assumed that the aircraft was aligned with the runway upon rollout from the turn to
final. If the aircraft exceeded 5° of roll shortly after establishing wings-level, it was assumed that

43
the pilot was correcting for a misalignment with the runway. If the aircraft exceeded 5° of roll
shortly before touchdown, it was assumed that this was due to the pilot establishing a crosswind
correction for landing, therefore, this data was ignored.
The data revealed that all rounded-base turns ended with the aircraft aligned with the
runway upon rollout. Of the 16 rectangular patterns, 5 were not aligned with the runway upon
rollout on final (Figures 14 through 18). This information was coded into a separate SPSS© file,
with each pattern assigned a value of “1” to indicate runway alignment or a value of “2” to
indicate the aircraft was not aligned.
Figure 18. Line Chart of Pattern 22; Rectangular Method.

44
Figure 19. Line Chart of Pattern 23; Rectangular Method.
Figure 20. Line Chart of Pattern 25; Rectangular Method.

45
Figure 21. Line Chart of Pattern 26; Rectangular Method.
Figure 22. Line Chart of Pattern 28; Rectangular Method.

46
Chi-Square Test
Due to the categorical nature of the runway alignment variable, a Chi-Square Test was
conducted to determine if the method used to conduct the base turn (rounded or rectangular)
influenced the alignment of the aircraft with respect to the extended runway centerline upon
rollout on final. A significant association was discovered between the method used and whether
or not the aircraft was aligned with the runway upon rollout 𝜒2 (1) = 5.93, p = .015, however,
because 50% of the cells had an expected count less than 5, Pearson’s Chi-Square should be
considered unreliable. In this scenario, Fisher’s exact test provides a more reliable indication of
statistical significance, which in this case did report a significant association between the method
used and runway alignment (p = .043).
Table 10
Crosstabulation of Method Used and Runway Alignment
Aligned With Runway? Method Used
Rounded-Base Rectangular Base Fisher’s Exact Test
Yes 16 11 5.93*
No 0 5
Note. * = p < .05.

47
CHAPTER IV
DISCUSSION
The purpose of this study was to determine whether the use of a rounded base leg would
result in a safer and more stabilized traffic pattern for general aviation aircraft than the traditional
squared base. This chapter provides a detailed discussion of the results, the implications of the
results with respect to general aviation safety, and suggestions for future research.
Research Question 1
Research question 1: Is there a statistically significant difference in bank angles between the
rounded base and rectangular base methods?
A significant difference existed between the type of base turn conducted and the bank
angles encountered during the maneuver. Use of rounded base turns resulted in lower bank
angles, both in terms of the mean and maximum bank angles. While the difference between
means was not substantial (3.99°), the difference in maximum bank angles was much larger
(8.39°), indicating that the rounded base is beneficial in avoiding high bank angles that increase
the AOA of the aircraft. The highest bank angles encountered using the rounded base method
and rectangular method were approximately 24° and 36° respectively. As seen in Figure 23, stall
speed begins to rapidly increase as bank angles exceed 30°. The pilot of the aircraft that
encountered the maximum bank angle of 24° using the rounded base method would have
encountered about a 6% to 7% increase in stall speed, whereas the pilot of the aircraft that

48
encountered the maximum bank angle of 36° while conducting the rectangular method would
have encountered about a 12% increase in stall speed.
Figure 23. Increase in Stall Speed and Load Factor. From Pilot’s Handbook of Aeronautical
Knowledge, by United States Department of Transportation, Federal Aviation Administration,
Flight Standards Service, 2016, p. 5-26. United States Department of Transportation, Federal
Aviation Administration, Airman Testing Standards Branch.
A potential criticism of the rounded base method may be a perceived inability to perform
an effective traffic scan of the final approach path while on the base leg, due to the constant
banking nature of the maneuver. While this concern may hold some validity, the relatively low
mean bank angle (10.89°) should provide some reassurance in the ability for pilots to adequately
perform a visual check for traffic during the turn. In addition, the pilot could conduct this visual
check just prior to beginning the turn from downwind while facing in the direction of potential
oncoming traffic.

49
Research Question 2
Research question 2: Is there a statistically significant difference in vertical speeds between the
rounded base and rectangular base methods?
A significant difference existed between the type of base turn conducted and the vertical
speeds encountered during the maneuver. Use of the rounded base method resulted in lower
vertical speeds, both in terms of mean and maximum, than the rectangular method. A difference
of approximately 111 FPM between the mean values indicates that, on average, the rounded base
method results in a greater descent rate than the rectangular method. Additionally, a difference of
approximately 325 FPM between the maximum values is substantial, indicating that the rounded
base method is much more likely to produce a consistent descent throughout the maneuver. An
arrested descent is not usually desired as this likely means that pressure is being increased on the
elevator, assuming all other variables are constant, thereby increasing AOA.
Research Question 3
Research question 3: Is there a statistically significant difference in indicated airspeeds between
the rounded base and rectangular base methods?
A significant difference existed between the type of base turn conducted and the
indicated airspeeds encountered during the maneuver. Use of the rounded base method resulted
in lower indicated airspeeds, both in terms of mean and minimum, than the rectangular method.
A difference of approximately 6 knots for both measurements indicates that the rounded base
method results in slightly lower indicated airspeeds than the rectangular method. While this is
concerning, the difference in means could be a result of differences in the profiles used between
each maneuver. The rounded base turn profile used in this study (see figure 8) required the pilot

50
to maintain an airspeed of 75 knots prior to commencing the turn and a speed of 70 knots once
established in the turn, gradually reducing to a speed of 61 knots upon rollout on final.
According to the standardization manual that was assumed to have been followed by the control
group, pilots are expected to maintain a slightly higher airspeed of 80 knots prior to commencing
the turn from downwind to base and a speed of 70 knots for the duration of the base leg (UND
Aerospace, 2016). The data indicated that the participants in the experimental group were very
close to the profile (M = 69.06 KIAS) during the maneuver whereas the control group
participants appeared to be slightly faster than the profile (M = 75.06 KIAS). Although the lower
indicated airspeed values during the rounded base turns cannot be neglected, the means between
the two groups may have been slightly more equal if the control group had operated the aircraft
closer to the prescribed profile. For this reason, it is not possible to conclude that the rounded
base method provides a safety advantage over the rectangular method in terms of indicated
airspeed. Of note, the standard deviations between the mean indicated airspeeds were noticeably
different. The rounded base method resulted in a standard deviation of approximately 2 knots,
while the rectangular method resulted in a standard deviation of approximately 8 knots,
indicating that airspeed during the rounded base method was more consistent and stable.
Research Question 4
Research question 4: Is there a statistically significant difference in pitch attitudes between the
rounded base and rectangular base methods?
A significant difference existed between the type of base turn conducted and the pitch
attitudes encountered during the maneuver. Use of rounded base turns resulted in lower pitch
attitudes, both in terms of the mean and maximum pitch attitudes. While the difference between

51
means was quite small (1.27°), the difference in maximum pitch attitudes was slightly more
noticeable (3.01°). Although pitch attitude is not the most reliable indicator of angle-of-attack,
one may assume that if all conditions and forces are relatively equal, an aircraft at a higher pitch
attitude is likely to be at a higher AOA. The highest pitch attitudes encountered using the
rounded base method and rectangular method were approximately 3° and 8° respectively, again
indicating an advantage for the rounded base method.
Research Question 5
Research question 5: Is there a statistically significant relationship between the method used
(rounded or rectangular base) and alignment with the runway upon completion of the turn to
final?
As both the independent variable (method used) and dependent variable (aligned or not
aligned) were categorical, a cross-tabulation analysis was performed to determine if a
relationship existed. Fisher’s exact test revealed a significant relationship between the type of
method used and whether the aircraft was aligned with the runway upon completion of the
maneuver. 100% of the aircraft that conducted the rounded base method were aligned with the
runway upon completion, versus 69% of the aircraft that conducted the rectangular method.
Runway alignment is perhaps the most critical variable analyzed during this study as
numerous accidents have resulted from the pilot conducting an aggressive correction to re-align
the aircraft with the runway after overshooting the base-to-final turn (AOPA Air Safety Institute,
2015). The rounded base method appears to provide a solution to this scenario, which would
considerably contribute to aviation safety.

52
Conclusions
While the rounded-base method will not completely solve the I-LOC issue in general
aviation, it has proven to be an effective alternative to the rectangular base method of conducting
traffic patterns. The rounded-base method reduces bank angles and pitch attitudes encountered
during the traffic pattern while providing a more stabilized approach throughout the maneuver.
In addition, the rounded-base method considerably reduces the likelihood of runway overshoot
during the turn to final.
The purpose of this study was not necessarily to find a replacement for the rectangular
traffic pattern, but rather to test an alternative method to determine if further research is
warranted. An important aspect that necessitates additional investigation is visibility, both in
terms of the pilot’s ability to scan for traffic on the final approach path as well as the ability for
other aircraft to make visual contact with the aircraft conducting the rounded-base method.
Additionally, the ability for the rounded-base method to be conducted while other aircraft are
conducting the rectangular method should be investigated, especially at tower-controlled airports
in which the term “square the turn” is often used for traffic spacing. This study also assumed that
aircraft would be established on downwind prior to beginning the turn and descent, which would
obviously not be the case for aircraft conducting a base entry or straight-in approach.
Furthermore, this study focused only on the base leg of the pattern. A rounded-crosswind method
is likely to provide similar advantages over a rectangular crosswind, especially due to the high
angles-of-attack encountered during this phase of the pattern.
Additional potential areas of research include an analysis of cognitive load to determine
if the rounded-base method is “easier” to fly, a qualitative assessment to determine pilot’s

53
perceptions of the rounded-base method, a quantitative evaluation of the procedure using
participants with a wide range of experience, and a quantitative analysis of angle-of-attack using
data recorded from angle-of-attack indicators installed on the aircraft. Perhaps the greatest
limitations of this study were the inability to control for experience level of the participants and
the inability to gather an accurate measure of angle-of-attack, which was presumed based on the
relationship between each variable and angle-of-attack.
The general aviation community should embrace the opportunity to reduce I-LOC
occurrences by considering the use of the rounded-base method to fly a traffic pattern. I-LOC
will continue to present itself as an issue until more creative mitigation strategies such as the
rounded-base method are developed and introduced to the aviation community.

54
APPENDICES

55
APPENDIX A
Experimental Group Post-Flight Questionnaire
Q1 IMPORTANT - PLEASE READ: Information from this survey will be used to retrieve flight data from the
aircraft. Data that will be acquired will include all aircraft and engine parameters, but will NOT include
any audio or visual recordings. Once the data has been retrieved, all identifying information including
aircraft registration, date, time, and location will be removed prior to analysis with the rest of the
research team. The only individuals able to view the aircraft registration, date, time, and location will be
the Principle Investigator (Mr. Lewis Archer) and the UND Aerospace Flight Data Analyst (Mr. John
Walberg). If ANY front-seat occupant of the aircraft wishes not to release data from this particular flight,
you should NOT complete this survey.
Q2 Aircraft registration (tail number):
Q3 On what date was this circular pattern conducted? (mm/dd/yy)
Q4 At approximately what time did you begin the first circular pattern? (use local 24-hour time, ex.
13:30)
Q10 At approximately what time did you begin the second circular pattern? (leave blank if not
conducted)
Q11 At approximately what time did you begin the third circular pattern? (leave blank if not conducted)
Q5 At which airport was this circular pattern conducted? (three-letter identifier)

56
Q7 Were our current procedures and the Safety Risk Assessment effective in identifying and mitigating
the risks and hazards encountered during the circular landing pattern that was conducted during this
flight?
Yes
No
Q8 What additional risks/hazards were encountered?
Q9 Enter any other comments that may be helpful:

57
APPENDIX B
Safety Risk Assessment

58

59
APPENDIX C
Consent Form
The University of North Dakota Consent to Participate in Research TITLE: Use of Circular Landing Patterns in General Aviation PROJECT DIRECTOR: Lewis Archer PHONE # 701-777-6039 DEPARTMENT: John D. Odegard School of Aerospace Sciences –
Department of Aviation STATEMENT OF RESEARCH A person who is to participate in the research must give his or her informed consent to such participation. This consent must be based on an understanding of the nature and risks of the research. This document provides information that is important for this understanding. Research projects include only subjects who choose to take part. Please take your time in making your decision as to whether to participate. If you have questions at any time, please ask. WHAT IS THE PURPOSE OF THIS STUDY? You are invited to be in a research study about the use of circular landing patterns in general aviation because you are a qualified pilot and flight instructor. The purpose of this research study is to determine if the use of a circular landing pattern results in a more stabilized approach versus a traditional rectangular pattern. The goal is to determine whether the widespread use of circular landing patterns in the general aviation community would result in a decrease of loss-of-control accidents in the traffic pattern. HOW MANY PEOPLE WILL PARTICIPATE? Only a select few (approximately 3 to 5) people will conduct this procedure as Pilot Flying (PF) at a non-towered airport within the University of North Dakota practice areas. On each flight (of which approximately 30 to 40 are expected to be conducted), there will be an

60
additional person on board the aircraft acting as the Pilot Monitoring (PM) during a time in which this procedure is being conducted. HOW LONG WILL I BE IN THIS STUDY? Your participation in the study should last no greater than 2 months. You will need to report to the UND Aerospace campus in Grand Forks, ND on a date and time to be determined for an informational briefing. You will be advised of the specific date, time, and location approximately 1 week prior. The informational briefing will take no longer than 1 hour. WHAT WILL HAPPEN DURING THIS STUDY?
1. You will receive a briefing from the researcher which will include a background of the study, the purpose of the study, a description of the procedure that will be conducted, and a review of the Safety Risk Assessment conducted in accordance with the FAA-approved UND Aerospace Safety Management System.
2. If you are participating as the Pilot Flying (PF) for this procedure, you will conduct a circular landing pattern as the Pilot Flying (PF) in an aircraft during a normal standardization flight at a non-controlled airport.
3. If you are not participating as the Pilot Flying (PF) for this procedure, but will be on board the aircraft while this procedure is being conducted, you will observe the Pilot Flying (PF) conduct a circular landing pattern and will act as the Pilot Monitoring (PM) in accordance with UND Aerospace policies and procedures.
4. If you are participating as the Pilot Flying (PF) for this procedure, upon completion of the flight, you will complete a short survey indicating your perceptions of the procedure and the validity of our existing safety controls and the Safety Risk Assessment conducted in accordance with the FAA-approved UND Aerospace Safety Management System. In addition, you will be asked to indicate the date, time, and location in which you conducted the circular landing pattern for the purposes of acquiring flight data from the avionics system. In accordance with Appendix A of the UND Aerospace Safety Policies and Procedures, no video or voice recordings will be accessed or identified except in the event of an accident, incident, or occurrence resulting in a loss of directional control, or with the direct consent and authorization by all forward seat crew members of the aircraft. All flight data will be de-identified in accordance with Appendix A of the UND Aerospace Safety Policies and Procedures. If you prefer not to release the flight data for any particular flight to the research team, you are not required to complete the survey nor should you indicate the date, time, and location in which you conducted the circular landing pattern.
5. If you are not participating as the Pilot Flying (PF) for this procedure, you will not be asked to complete a survey. You will, however, have the ability to withdraw your consent to retrieve data from the flight. WHAT ARE THE RISKS OF THE STUDY? Participation in the study may involve unforeseen risks. A Safety Risk Assessment has been completed in accordance with the FAA-approved UND Aerospace Safety Management System. The level of physical risk has been determined as negligible and improbable. This Risk Assessment will be reviewed at the informational briefing. Subjects

61
may feel uncomfortable about the prospect of flight data being reviewed from their flight. If a subject wishes not to release flight data from any particular flight, they should avoid completing the survey and should avoid indicating the aircraft, date, time, and location of the procedure. There are no other foreseeable psychological, emotional, physical, legal, or privacy risks outside of the inherent risk encountered while operating an aircraft. WHAT ARE THE BENEFITS OF THIS STUDY? You may not benefit personally from being in this study. However, we hope that, in the future, other people might benefit from this study. Using the data collected by this study, we hope to introduce a new procedure to the general aviation community in an attempt to achieve a reduction in loss-of-control accidents in the traffic pattern. WILL IT COST ME ANYTHING TO BE IN THIS STUDY? You will not have any costs for being in this research study. WILL I BE PAID FOR PARTICIPATING? You will not be paid for being in this research study other than the compensation you normally receive as a UND Aerospace employee. WHO IS FUNDING THE STUDY? The University of North Dakota and the research team are receiving no payments from other agencies, organizations, or companies to conduct this research study. CONFIDENTIALITY The records of this study will be kept private to the extent permitted by law. In any report about this study that might be published, you will not be identified. Your study record may be reviewed by Government agencies, the UND Research Development and Compliance office, and the University of North Dakota Institutional Review Board. Any information that is obtained in this study and that can be identified with you will remain confidential and will be disclosed only with your permission or as required by law. If we write a report or article about this study, we will describe the study results in a summarized manner so that you cannot be identified. In accordance with Appendix A of the UND Aerospace Safety Policies and Procedures, you have the right to review all audio, video, and data recordings of your flight with the direct consent and authorization by all forward seat occupants of an aircraft who are crew-members. IS THIS STUDY VOLUNTARY? Your participation is voluntary. You may choose not to participate or you may discontinue

62
your participation at any time without penalty or loss of benefits to which you are otherwise entitled. Your decision whether or not to participate will not affect your current or future relations with the University of North Dakota or with any of the researchers on this study. CONTACTS AND QUESTIONS? The researchers conducting this study are Mr. Lewis Archer, Professor Jim Higgins, Professor Kent Lovelace, Professor Gary Ullrich, Mr. Michael Lents, and Mr. John Walberg. You may ask any questions you have now. If you later have questions, concerns, or complaints about the research please contact Mr. Lewis Archer at 701-777-6039 during the day and at 910-670-2893 after hours. Mr. Lewis Archer may also be reached at the following email address: [email protected]. The faculty advisor for this study is Professor Jim Higgins who may be contacted with questions, concerns, or complaints at 701-777-6793 or [email protected]. If you have questions regarding your rights as a research subject, you may contact The University of North Dakota Institutional Review Board at (701) 777-4279 or [email protected].
You may also call this number about any problems, complaints, or concerns you have about this research study.
You may also call this number if you cannot reach research staff, or you wish to talk with someone who is independent of the research team.
General information about being a research subject can be found by clicking “Information for Research Participants” on the web site: http://und.edu/research/resources/human-subjects/research-participants.cfm
Your signature indicates that this research study has been explained to you, that your
questions have been answered, and that you agree to take part in this study. You will
receive a copy of this form.
Subjects Name: ______________________________________________________
__________________________________ ___________________
Signature of Subject Date
I have discussed the above points with the subject or, where appropriate, with the subject’s
legally authorized representative.
__________________________________ ___________________
Signature of Person Who Obtained Consent Date

63
REFERENCES
AOPA Air Safety Institute. (2015). Joseph T nall report - general aviation accidents in
2013. (No. 25). Frederick, MD: Perry, George.
AOPA Air Safety Institute. (2016). The circular landing pattern: An alternative to the
traditional box pattern. Unpublished manuscript.
Chandler, J. (2011). Limiting loss of control. Air Transport World, 48(4), 37-39.
Garmin Ltd. (2011). Garmin G1000 cockpit reference guide for the cessna nav III. AOPA
Membership Publications, Inc.
Hartney, Harold E. (1940). The complete flying manual: a handbook for instructors and pupils.
New York: National Aeronautics Council Incorporated.
Moore, J. (2015). Persistent, fatal loss in spotlight - NTSB forum targets loss of control.
Retrieved from https://www.aopa.org/news-and-media/all-
news/2015/november/05/persistent-fatal-loss-in-spotlight
National Transportation Safety Board. (2013). NTSB case Number WPR11FA367. (NTSB
Accident Investigation No. WPR11FA367). Washington, D.C.

64
National Transportation Safety Board. (2016). NTSB 2017-2018 most wanted list of
transportation safety improvements - prevent loss of control in general aviation. Retrieved
from http://www.ntsb.gov/safety/mwl/Documents/2017-18/2017MWL-FctSht-LossControl-
A.pdf
Naval Air Training Command. (2014). Flight training instruction, primary contact, T-6B. NAS
Corpus Christi, TX: Naval Air Training Command.
Perry, G. (2016). Safety spotlight: A treatment for insanity. Retrieved
from https://www.aopa.org/news-and-media/all-news/2016/january/pilot/safety
PR Newswire. (2010). Purdue university to install GA-FDM flight data monitoring for training
aircraft fleet. Retrieved from http://www.aviationpros.com/news/10380131/purdue-
university-to-install-ga-fdm-flight-data-monitoring-for-training-aircraft-fleet
Reveley, M., Briggs, J., Evans, J., Sandifer, C., & Monica Jones, S. (2010). Causal factors and
adverse condtions of aviation accidents and incidents related to integrated resilient aircraft
control. (Technical Memorandum No. NASA/TM-2010-216261). Washington, DC:
National Aeronautics and Space Administration.
Snow, R. I. (2001). The asymmetrical traffic pattern - minimizing the Stall/Spin threat. Retrieved
from https://www.aopa.org/news-and-media/all-news/2001/april/flight-training-
magazine/the-asymmetrical-traffic-pattern
UND Aerospace Foundation. (2016). Cessna 172S Standardization Manual. Grand Forks, ND:
John D. Odegard School of Aerospace Sciences.

65
United States Air Force Flying Operations. (2011). T-6 primary flying. Washington, DC: Air
Force Departmental Publishing Office.
United States Department of Transportation, Federal Aviation Administration.
(2014). Aeronautical information manual. Washington, D.C.: United States Department of
Transportation, Federal Aviation Administration.
United States Department of Transportation, Federal Aviation Administration, Flight Standards
Service. (2016a). Airplane flying handbook. Oklahoma City, OK: United States Department
of Transportation, Federal Aviation Administration, Airman Testing Standards Branch.
United States Department of Transportation, Federal Aviation Administration, Flight Standards
Service. (2016b). Pilot’s Handbook of Aeronautical Knowledge. Oklahoma City, OK:
United States Department of Transportation, Federal Aviation Administration, Airman
Testing Standards Branch.
Veillette, P. R. (2009). The why and when behind loss of control. Business & Commercial
Aviation, 104(5), 60-67.