use of simple immuno-assay to detect illegal drugs by …
TRANSCRIPT

USE OF SIMPLE IMMUNO-ASSAY TO DETECT ILLEGAL DRUGS
AND RECREATIONAL DRUGS OF ABUSE IN WASTEWATER
by
Alex McKendra Fisher
A thesis submitted to the faculty of
The University of Utah
in partial fulfillment of the requirements for the degree of
Master of Science
Department of Civil and Environmental Engineering
The University of Utah
May 2013

Copyright © Alex McKendra Fisher 2013
All Rights Reserved

T h e U n i ve r s i ty o f U ta h Gr ad u a t e S c h oo l
STATEMENT OF THESIS APPROVAL
The thesis of Alex McKendra Fisher
has been approved by the following supervisory committee members:
Otakuye Conroy-Ben , Chair 3/13/2012
Date Approved
Steven Burian , Member 3/13/2012
Date Approved
Andy Hong , Member 3/13/2012
Date Approved
and by Chris Pantelides , Chair of
the Department of Civil and Environmental Engineering
and by Donna M. White, Interim Dean of The Graduate School.

ABSTRACT
Research studies indicate that drugs of abuse are prevalent in the water system
and if not properly treated, could impact the environment and future societies that use
reclaimed water as a drinking source. Although they are not currently regulated by the
Environmental Protection Agency (EPA), it would be beneficial for wastewater treatment
facilities to begin testing for drugs of abuse to determine what concentrations are present
and the facilities’ removal rates. This data could be used to help the facility begin to plan
for additional treatment methods when the EPA implements regulation. Most treatment
facilities are government based and have limited funding. A method to detect illegal
drugs in the wastewater that is cost and time effective that does not require gaining
permits from the Drug Enforcement Administration (DEA) will allow municipalities to
begin testing and preparing for drug removal. Detection by immuno-assay is more
affordable, less time consuming and does not require permits through the DEA for drug
standards as do conventional detection methods.
Wastewater samples collected from Salt Lake County sewer lines and Central
Valley Water Reclamation Facility were tested for caffeine, cocaine, cotinine,
methamphetamine, nandrolone, oxycodone, and tetrahydrocannabinol (THC). The
samples were processed and tested with Neogen Immuno-assay drug detection kits. The

iv
drugs caffeine, cocaine, methamphetamine, oxycodone, and THC were detected at
concentration ranges similar to those in other studies. The concentrations for cotinine and
nandrolone were undetectable. Immuno-assays proved to effectively detect drugs of
abuse in wastewater.

TABLE OF CONTENTS
ABSTRACT .................................................................................................................. iii
LIST OF FIGURES ....................................................................................................... vii
LIST OF TABLES ....................................................................................................... viii
ACKNOWLEDGMENTS .............................................................................................. ix
Chapters
1 INTRODUCTION ........................................................................................................ 1
2 BACKGROUND .......................................................................................................... 3
Importance of Drugs of Abuse in Wastewater .............................................................. 3
Drugs of Abuse Tested ................................................................................................. 4
How do Drugs Enter the Wastewater System? ........................................................... 11
Possible Impacts from Drugs of Abuse in Wastewater ............................................... 12
Current Detection Methods ........................................................................................ 14
Current Treatment Methods ....................................................................................... 17
Use of Reclaimed Water and Drug Effects ................................................................. 18
3 MATERIALS AND METHODS ................................................................................ 26
Sample Collection ...................................................................................................... 26
Sample Processing ..................................................................................................... 29
Immuno-Assay .......................................................................................................... 29
4 RESULTS .................................................................................................................. 36
Introduction ............................................................................................................... 36
Caffeine ..................................................................................................................... 36
Cocaine ...................................................................................................................... 37
Cotinine ..................................................................................................................... 38
Methamphetamine ..................................................................................................... 38
Nandrolone ................................................................................................................ 39
Oxycodone ................................................................................................................ 39

vi
THC........................................................................................................................... 40
Discussion ................................................................................................................. 40
5 CONCLUSION .......................................................................................................... 52
Final Remarks ............................................................................................................ 53
APPENDIX: METHOD DEVELOPMENT DETAILS .................................................. 54
REFERENCES.............................................................................................................. 66

LIST OF FIGURES
1 - Chromatographic Process Schematic ........................................................................ 23
2 - Map of Central Valley Improvement Districts .......................................................... 32
3 - Central Valley Water Reclamation Facility Schematic.............................................. 33
4 - Color Variation Related to Concentration when K-Blue Substrate is Added ............. 34
5 - Color Variation Related to Concentration after Acid is Added .................................. 34
6 - Immuno-Assay Reaction Process ............................................................................. 35
7 - Caffeine Standard Curve .......................................................................................... 43
8 - Cocaine Standard Curve ........................................................................................... 44
9 - Cotinine Standard Curve .......................................................................................... 45
10 - Methamphetamine Standard Curve ......................................................................... 46
11 - Nandrolone Standard Curve ................................................................................... 47
12 - Oxycodone Standard Curve .................................................................................... 48
13 - THC Standard Curve .............................................................................................. 49

LIST OF TABLES
1 - Drug Physical and Chemical Properties .................................................................... 21
2 - Concentration Ranges of Illegal Drugs Detected in Recent Publications ................... 24
3 - Concentrations of Illegal Drugs Detected in Groundwater in Barcelona .................... 25
4 - Caffeine Concentration Results ................................................................................ 43
5 - Cocaine Concentration Results ................................................................................. 44
6 - Methamphetamine Concentration Results ................................................................. 46
7 - Oxycodone Concentration Results ............................................................................ 48
8 - THC Concentration Results ...................................................................................... 49
9 - Average, Maximum and Minimum Concentrations in Sewer Lines .......................... 50
10 - Mass Flux per Capita .............................................................................................. 50
11 - Percent Loss of Analytes due to Filtration .............................................................. 51
12 - Percent Removal from Wastewater Treatment ........................................................ 51

ACKNOWLEDGMENTS
I must credit a number of people, for without their support and help, this thesis
may not have been completed.
First, I would like to acknowledge my parents, Keith and Stacy Fisher, who have
given unconditional love and unlimited support over the years of my education. I am
eternally grateful for the sacrifices they have made to make sure I achieve my personal,
educational, and professional goals. My sister, Abby Fisher, has always provided
emotional support and stress relief. The unlimited love and support from my
grandparents, Larry and Sylvia Fisher, and Larry and Lynette Gatlin has always been
motivating and inspirational. To my late grandfather, Stephen Sherrod, who taught me
that I could have whatever I want in life, as long as I work hard and stay dedicated to my
dreams.
Dr. Otakuye Conroy-Ben was my academic advisor for my undergraduate career
and influenced me to proceed into the graduate program. Dr. Conroy-Ben offered many
research topics that provided me with endless learning opportunities, ultimately leading
me to this research project. Dr. Conroy provided all the necessary funding for this
research and has been a great resource.
The staff at Central Valley Water Reclamation Facility was extremely helpful in
sample collection. Christi Priest and Talena Walton in pretreatment contributed several

x
hours driving me to sewer collection sites and providing valuable information on the
wastewater collection facilities.
I would like to thank all of the people who have helped me in the lab. The
relationships we have built have been very valuable and special to me.
Finally, I would like to thank my boyfriend, Vince Willis, for standing by my side
and not giving up on me even in the most stressful moments.

CHAPTER 1
INTRODUCTION
Pharmaceuticals and personal care products are a concern in wastewater treatment
and environmental research. Endocrine disrupters and specific medications have been
studied to determine how they impact the environment. Illegal and recreational drugs are
of interest due to the high concentrations found in wastewater streams. The consequences
from illegal drug exposure in the environment are not very well known, but it can be
assumed that they will most likely have a negative impact as they will eventually be
consumed by humans. Methods of detection and removal need to be implemented in
wastewater treatment facilities to monitor removal rates and to reduce the concentrations
being released into the environment. More precise monitoring of drugs in the wastewater
will also be beneficial to forensics studies by having more accurate drug usage statistics
which can be used by local law enforcement.
Current detection methods for drugs in the wastewater system are expensive and
time consuming. Municipal wastewater treatment facilities are not required to test for
drugs, and are not properly equipped to do so. Methods for fast and inexpensive detection
could be implemented at wastewater treatment facilities to determine an approximate
concentration of drugs in the wastewater and an approximate removal rate throughout the

2
wastewater treatment plant. Using a method that is less expensive and can be performed
at the site of sample collection would benefit the wastewater treatment plant operators
and inspectors by supplying rapid and accurate results.
Although the current detection methods are efficient and well known, obtaining
permission to possess and test for drugs of abuse is difficult, as they are listed under
Class II Controlled Substances with the Drug Enforcement Agency (DEA). Class II
Controlled Substances are strictly regulated due to the potential for abuse leading to
psychological or physical dependence.1 Permits are granted by registering with the DEA,
under a state license, and the registration holder is required to abide by the state and
federal rule pertaining to the controlled substance. Registration must be renewed every
three years, and the cost varies depending upon the controlled substance. Strict storage
regulations are enforced, and personnel with access to controlled substances are required
to go through thorough training. Registration can be a time consuming and expensive
process.1 As an alternative to gaining permits, the samples could be sent to a local
laboratory that holds the proper permits for testing controlled substances, but this is
costly and time consuming.
This report discusses some important issues of drugs of abuse in wastewater, how
they are currently detected, and how they are removed from wastewater using
conventional wastewater treatment methods. Tests were performed using immuno-assays
to determine if this method could be used to detect concentrations of specific drugs in
wastewater in a timely and inexpensive manner.

CHAPTER 2
BACKGROUND
Importance of Drugs of Abuse in Wastewater
The effects of drugs on people are fairly well known due to studies conducted on
human safety. The effects of illegal drugs have been tested and evaluated to understand
the dangerous effects on humans. Nicotine, which requires users to be at least 18 years of
age, and oxycodone, which requires a prescription, are examples of legal drugs that are
regulated to prevent abuse by users. However, little research has been done on the effects
of drugs found in wastewater and the surrounding environment. Some studies have been
performed on certain species, but these studies are very limited and do not represent the
concentrations or the continuous exposure rates currently found in the environment.
Some of the effects of drugs on humans may be relatively similar to the effects on the
environmental species. These assumptions are considered throughout this report.
A study in Europe that tested 19 drugs of abuse in wastewater systems proved
that wastewater analysis would also be beneficial to forensic sciences. Most drug usage
statistics are reported from surveys, which are highly dependent on consumers.
Concentrations found in wastewater lead to more accurate data for drug usage in specific
areas.2

4
Drugs of Abuse Tested
The drugs used for this research are caffeine, cocaine, cotinine,
methamphetamine, nandrolone, oxycodone, and tetrahydrocannabinol (THC). The
chemical composition, properties, and effects of these drugs are discussed below. Table 1
displays the chemical properties of each drug.
Caffeine
Caffeine is a stimulant found naturally in beverages, like coffee and tea, and can
be used as a pharmacological agent. Caffeine is one of the most commonly used drugs,
consumed by 90% of the adult population, and is found in food, drinks, and supplements.
An average of 120 mg/day of caffeine is consumed through beverages by Americans.3 A
maximum of 12 µg / mL of caffeine can be excreted in urine with standard caffeine
consumption.4 Concentrations up to 73 µg / L of caffeine have been found in wastewater
in Europe.5 As the population continues to consume more caffeine, and it becomes more
prominent in wastewater streams, the effects of caffeine on aquatic species need to be
considered.
Although caffeine is frequently used, there are some serious side effects if used in
excess. Some studies have shown that the side effects to humans are similar to other
species and plants. It can cause insomnia, nervousness, stomach irritation, and increased
heart rate and respiration. Caffeine can also aggravate anxiety disorders and bleeding
disorders. It has also been shown to increase blood pressure and weaken bones.6 Also,
caffeine is a diuretic, which causes more frequent urination.

5
There have been some studies on the effects of caffeine on specific species. The
northern leopard frog displayed behavioral and physiological effects when exposed to
caffeine. Exposure to high concentrations of caffeine also caused a change in oxygen
consumption by sea urchin fertilized eggs and impaired reproduction of a water flea
species. Most studies conducted on the effects of caffeine on aquatic species have used
high concentrations of caffeine that do not represent the environmental concentrations.7
The effects caused by long term exposure of lower concentrations need to be further
studied to gain a better understanding.
The chemical properties of caffeine are important to understand its environmental
fate in aquatic systems. The log octanol-water partitioning coefficient (Log Kow) is the
ratio of the molar concentration found in octanol verse water, which suggests the
chemicals biodegradability and solubility. In general, the larger the Log Kow, the lower
the solubility, the higher the log bioconcentration factor (Log BCF) and the water
partition coefficient (Koc).8 The Log Kow for caffeine is -0.07, which indicates that
caffeine is very soluble and biodegradable.9 This value, shown in Table 1, indicates that
caffeine will not adsorb to solids present in an aquatic system. The Log BCF, refers to the
uptake of a chemical from water by respiration or dermal contact. It is calculated using
the Log Kow value, and values less than 3 are considered nonbioaccumulative, between 3
and 3.7 are considered bioaccumulative, and greater than 3.7 are considered very
bioaccumulative. The Log BCF in aquatic organisms is low for caffeine, with a value of
3.10

6
Caffeine is removed with biological treatment and in rivers and streams.
Activated sludge treatment has proven to be effective in removing caffeine since it is
readily biodegradable.10 This study will compare the concentrations of caffeine before
and after trickling filter biological treatment at Central Valley to determine if this facility
correlates to other studies.
Cocaine/Benzoylecgonine (BE)
Cocaine is an alkaloid ester that is extracted from coca plants. Cocaine will
increase the heart rates and blood pressure while constricting the arteries. This often leads
to heart attack or causes arrhythmia. Constricted blood vessels in the brain cause strokes,
seizures, and bizarre and violent behavior. Constriction of vessels in the stomach leads to
ulcers or perforation of stomach or intestines. Cocaine has also been known to impair
sexual function.11 Benzoylecgonine (BE) is the main metabolite formed when cocaine is
consumed and contributes to many of the side effects of cocaine. The chemical properties
of benzoylecgonine are displayed in Table 1.
When cocaine is released into water, it is likely that it will adsorb to suspended
solids or sediments due to its Log Kow value. The Log Kow for cocaine is 2.31, implying
that cocaine is slightly water soluble and biodegradable. The Log BCF of cocaine is 3,
which indicates it has a low bioconcentration in aquatic species. At a pH of 7, the cocaine
half-life is 54 years.12

7
Cotinine
Cotinine is the primary urinary metabolite of nicotine. It is detected in urine to
determine the concentration of nicotine consumed by tobacco smokers, and is also found
in urine of nonsmokers exposed to second hand smoke.
Cotinine has a vapor pressure, shown in Table 1, which indicates it will be present
in both vapor and particulate form in the atmosphere, compared to nicotine which is
completely vaporized in the atmosphere. Thus, second hand smoke is more likely to
contain particles of cotinine, which will show a higher presence in urine tests than
nicotine.13 Studies have not shown any dangerous effects of cotinine in humans but the
effects of nicotine have been proven to be quite dangerous.14 Nicotine can cause a faster
and pounding heartbeat, extreme weakness, nausea, vomiting and wheezing. Tightness in
the chest, stinging in the nose, throat and mouth, blisters in the mouth, and nose bleeds
are also caused by nicotine. Life threatening coronary artery vasoconstriction and
bronchospasms are dangerous symptoms of nicotine use.15 Although cotinine does not
cause physical side effects, it does cause serious withdrawal symptoms, which makes it
one of the most difficult addictions to conquer. There are drug detection kits available for
nicotine detection, but cotinine detection was chosen because it is much more prominent
in urine samples and easier to detect in diluted sources such as wastewater.
Cotinine released into the environment by smoke vapor which will either degrade
in the atmosphere or will be removed by wet or dry deposition. The Log Kow of cotinine
indicates it will be highly mobile in soil, but it will not be adsorbed by suspended
particles in water systems. Instead, cotinine will most likely be biodegraded in the
system. The Log BCF for cotinine is 3, which indicates that the bioconcentration in

8
aquatic species is low.13 A Log Kow of 0.07 for cotinine indicates that it is quite water
soluble.16
Methamphetamine/MDMA
Methamphetamine (meth) elevates dopamine levels in the body, up to 12 times
higher than food or sexual intercourse. Meth destroys dopamine sensors, thus, making it
impossible to feel pleasure. Meth also destroys tissues and blood vessels, causes acne,
loss of elasticity and luster in skin and tooth decay by drying out salivary glands which
allows acids in the mouth to eat away teeth enamel.17
MDMA, or 3, 4-methylenedioxy-N-methylamphetamine, is commonly known as
ecstasy. It is a popular drug linked to raves and electronic music. MDMA binds to the
serotonin transporter which, prolongs the serotonin signal. This causes excessive release
of serotonin from neurons which causes heightened senses and euphoria. It can also cause
confusion, depression, sleep problems, drug cravings, and severe anxiety. MDMA
increases heart rate, blood pressure, causes muscle tension, involuntary teeth clenching,
nausea, blurred vision, faintness, chills, sweating, and hypothermia.18
Meth has a wide range of Koc values, as seen in Table 1. These values are
relatively low, indicating that meth is unlikely to be adsorbed by particles and sediments
in water systems. The Log BCF for meth is 2, which means the bioconcentration in
aquatic species is very low. The Log Kow is 2.07 meaning meth is somewhat
hydrophobic.12
9
Nandrolone
Nandrolone, also known as Deca-Durobolin, is an anabolic steroid which is
produced naturally by the human body, but only in very small concentrations.
Nandrolone is very similar to testosterone, except it is more anabolic than androgenic,
which indicates nandrolone would be beneficial for muscle building without increasing
male sexual characteristics. It has been used by athletes as a performance enhancer
because it can increase muscle mass without an increase in body hair or aggressive
behavior associated with using testosterone as a steroid. Nandrolone can still cause many
problems if abused. Fluid retention, edema, congestive heart failure, and sexual problems
may persist. Genitourinary effects including oligosperma, infertility, decreased
ejaculatory volume, and an enlarged prostate can occur in men using nandrolone. Women
may experience a deepening of the voice, hirsutism or excessive hair growth, acne, or
clitomegaly, which is the enlarging of the clitoris.19 The International Olympic
Committee set a limit of 2 ng/mL of urine as the maximum concentration produced
naturally. Some athletes have had concentrations 100 times greater than this.20
Since nandrolone is a hormone, excessive concentrations in aquatic systems can
have detrimental impacts on aquatic species. Studies have shown that exposure to some
hormones in aquatic systems have direct effects on the gonads, reproductive systems, and
sexual differentiation during early development. The effects of nandrolone have not been
highly studied, but it can be assumed that the impacts caused by other androgenic
hormones are a good indication that any hormone exposure is harmful to aquatic
species.21

10
The Koc value of nandrolone assumes that nandrolone is likely to adsorb to
particles and sediments in water bodies. The Log BCF of nandrolone is 21, indicating that
the bioconcentration in aquatic species is low.13 Nandrolone is somewhat water soluble,
with a Low Kow of 2.62.8
Oxycodone
Oxycodone is a narcotic, or an opioid, pain reliever. Oxycodone, found in
OxyContin, has become a highly abused prescription drug. The side effects of oxycodone
include drowsiness, sedation, respiratory depression, apnea, intestinal obstruction, and
anxiety. Withdrawal symptoms are also a common side effect of oxycodone. If too much
is taken, hallucinations, psychosis, and slowing of the heartbeat can occur.22
Oxycodone is not expected to be adsorbed by suspended particles or sediments in
water bodies due to the low Koc value. The Log BCF for oxycodone is 3, which means it
has a low bioconcentration in aquatic species. A Log Kow of 0.7 implies that oxycodone
is quite water soluble.13
THC
Tetrahydrocannabinol, more commonly known as THC, is the main compound
found in marijuana. It influences pleasure of memories and thinking, concentration,
sensory and time perception and coordination. Chronic users show more impacts to
memory loss that can last for weeks.23 Although there are risks, THC is becoming more
popular in the medical industry as an antiemetic, which is a drug used to reduce nausea,
and as an appetite stimulant. As more states begin to legalize marijuana, not just for

11
medical use but also for recreational use, it will become more prominent in the
wastewater streams.
If THC is released into a water system, it is expected to be adsorbed onto
suspended particles and into sediments due to its high Koc value. THC is expected to
volatilize from water surfaces because of its Henry’s Law constant: 2.4 ∗ 10−7 (𝑎𝑡𝑚−𝑚3)
𝑚𝑜𝑙𝑒.
The Log BCF for THC is very high, indicating that the bioconcentration in aquatic
species is also very high.13 THC has a high Log Kow, 6.48, indicating that it is more
hydrophobic than other drugs.24
How do Drugs Enter the Wastewater System?
Only a portion of what is consumed is used by the human body. This includes all
drugs. The components that remain unused are excreted in urine or feces in the parent or
metabolized form. The amount excreted depends on the dose, the frequency of use, and
the person’s individual metabolism. Many drugs can be detected in urine post-ingestion
for 1.5 to 4 days with just a single dose. Drugs can be detected for up to a week after the
last dose in chronic users. Specifically, cocaine and THC can remain in the system for
even longer periods of time. The limit of detection varies for each drug as well. The limit
of detection of meth in urine is approximately 2.5 ng/ mL, while THC is 10 ng/mL.25
In 2010, it was estimated from a survey that 6.24% of Utah residents used illegal
drugs in the past month, with 3.12% reporting the use of a drug other than marijuana.
Almost 7000 Salt Lake County residents were admitted for substance abuse rehabilitation
in 2009. In 2007, 546 people passed away from a drug-induced death, which is more than

12
the 320 who died from vehicle accidents and 253 from firearms in the same year.26, 27 The
number of illicit drug users in the state is most likely higher than surveys suggest. Many
residents will not fill out surveys, and others will not respond honestly about drug usage.
The numbers shown in surveys suggest that there are still high volumes of drugs
being used in Salt Lake County and they are entering the wastewater system. Using the
concentrations found in wastewater would help local law enforcement determine a more
accurate amount of drugs being used in Salt Lake County. These concentrations also help
the wastewater treatment facility determine what further treatment is necessary to reduce
the quantity of drugs entering the Jordan River.
Possible Impacts from Drugs of Abuse in Wastewater
Very little is known about the effects of drugs on aquatic species. The effects of
specific drugs on humans are fairly well known, and it may be assumed that these effects
will be similar to other species. Only a few studies have been performed on living
specimens, with many being mammals. The few studies that have been conducted need to
be considered when developing wastewater treatment methods to remove drugs from
wastewater.
A study performed by Castiglioni et al., on zebrafish is one of the few reports on
the effects of illicit drugs on aquatic species.28 Zebrafish and zebrafish embryos were
exposed to various drugs at different concentrations to determine the effects. When the
zebrafish were exposed to 5 mg/L of cocaine, the fish would slowly circle at the bottom
of the water column with their fins extended, which indicates arousal. The zebrafish

13
embryos were also exposed to THC, which reduced the amount of spontaneous tail
muscle twitches that occur during development. At concentrations near 2.0 mg/L, the
spine would curve and the tips of the tails would form a bulbous shape. At concentrations
above 2.0 mg/L of THC, the embryo would die. Additionally, when zebrafish were
exposed to 100 mg/L of nicotine for 3 minutes, they displayed a significant decrease in
diving. When exposed to 50 mg/L for longer periods of time, the zebrafish would tend to
dwell at the bottom of the water column.28
Studies on mammals have been conducted to determine how the drug will
possibly affect humans. One study on primates showed that the effects on the serotonin
nerves after a 4 day exposure to MDMA could last 6 to 7 years.18
Insects have also been exposed to drugs to understand the impacts. Walters
performed a study on Drosophila melanogaster, a common fruit fly, using
methamphetamine, to determine how it affects the species. The flies exhibited anorexic
behavior when exposed to meth for several hours. The flies also displayed increased
movement and activity, similar to humans, when exposed to meth.29
Although these studies were performed with high concentrations of drugs, the
effects are critical to understanding how the concentrations seen in the environment can
affect the ecology. The concentrations will continue to rise in the environment as the
human population grows and more people use illegal drugs. Also, the species exposed to
the drugs are continuously exposed, not for just short periods of time. These long term
exposures can have even more detrimental effects to the surrounding environment. More
14
studies on the species specific to the areas of contamination, including plants and
migratory birds, should be performed to determine long term effects of drug exposure.
Current Detection Methods
Chromatography is the main method used to detect drugs in liquid samples. The
sample mixture is separated between two phases: a stationary phase and a mobile phase.
The stationary phase is typically fixed in place while the mobile phase carries the mixture
through the medium of the stationary phase. The mixture is controlled by the interactions
between the mixture’s components and the stationary and mobile phases. Some of the
components will slow and interact with the stationary phase, while others will increase in
speed and remain interacting with the mobile phase. The difference in the velocities
controls the separation of different species in the mixture. The mobile phase will carry
the separated species away from the stationary phase at different times, which can be
measured to determine which species are present in the mixture.
The stationary phase of chromatography is typically a substance coated on the
interior walls of the column. There are different types of columns: open tubular, capillary,
or packed column. The columns can have a variety of stationary phases and polarities and
are chosen based upon the sample mixture and species that are being detected. The
mobile phase is determined by the type of chromatography used and the column chosen.
Figure 1 is an example of a chromatographic system.
There are two types of chromatographic methods, gas-chromatography and liquid-
chromatography. Both are commonly used to detect drugs in liquid samples.
15
Gas-chromatography (GC) uses a gas carrier as the mobile phase. When samples
are injected into the GC, they are heated and converted into their vapor phase. The carrier
gases commonly used are helium, argon, or nitrogen. The carrier gas will transfer the
sample in vapor form to the stationary phase, which is typically a packed column. The
individual species will interact with the stationary phase at different rates, as discussed
above. When the gas exits the column, a detector will determine the species in the
sample. There are many detectors available to be used with a GC. The most common
detector used for drug detection is a mass spectrometer (MS). The GC will separate the
compounds from each other, and the MS will identify each species by the fragmentation
after chemical or electron ionization.30
Liquid-chromatography (LC) uses a liquid for the mobile phase. The liquid is
chosen based on the stationary phase used, which is chosen based on the compounds
being detected. Sodium chloride, methanol and water mixture, n-heptane, or ethanol are
common examples of mobile phases that are used. A liquid sample that has been
concentrated and resuspended in a compatible solution is injected into the LC. The
sample and mobile phase liquids are transported through the LC column, interact with the
stationary phase, and are then transported to the detector to determine which species are
present. There are several detectors compatible with LC, but a tandem MS detector is the
most commonly used for drug detection.31
Many studies have used other forms of GC and LC for drug detection to
determine which method is most effective. High performance liquid chromatography
(HPLC) has higher pressures within the column, forcing the solvent through and

16
completing detection at much faster rates. A high performance liquid chromatography
system with tandem mass spectrometry (HPLC-MS/MS) is often used to detect drugs at
higher concentrations. The high performance liquid chromatography-atmospheric
pressure ionization (HPLC-API-MS) uses chemical ionization at atmospheric pressure to
detect drugs. Solid phase extraction (SPE) is commonly coupled with HPLC-MS/MS for
accurate drug detection in urine. Ultra performance liquid chromatography (UPLC) uses
high pressures, similar to HPLC, coupled with increased sensitivity and resolution for
even faster detection rates and high accuracy.32, 33, 34
Although the use of chromatography provides accurate results for drug
concentrations in liquid samples, it is quite expensive and time consuming. A
chromatography machine can cost from tens to hundreds of thousands of dollars. Many
wastewater treatment facilities may have a chromatography systems, but new columns
specific to each drug tested would need to be purchased. With multiple collection sites,
the facility may want to use several machines at once to be more time efficient. The
facility may want to consider investing in multiple detectors because the composition of
wastewater may damage the machine. This can be a substantial initial cost for wastewater
treatment facilities to begin detecting illegal drugs in wastewater.
Another concern with detection of drugs in water and wastewater is the time for
sample preparation. After samples are collected, they need to be filtered and
concentrated. This process can take several hours per sample due to the high amount of
suspended solids in raw wastewater. Running the sample through the GC or LC can take
several hours as well. A lab technician would have to work several days continuously to

17
process and test one sample. It would be more convenient for wastewater treatment
operators and inspectors to be able to test the samples and have accurate results within a
couple hours of collection, rather than waiting a few days for results.
Current Treatment Methods
Although illegal drugs are currently not regulated by the U.S. Environmental
Protection Agency (EPA), conventional wastewater treatment methods partially remove
drugs from the system. Studies on the removal rates from various treatment methods have
been examined and are discussed below.
A research project in the United Kingdom tested wastewater from two rivers and
two wastewater treatment facilities for amphetamines, cocaine, and BE. Using UPLC-
MS, the study found that there were high concentrations of all three drugs present in the
rivers. The cocaine metabolite, BE, was found in concentrations up to 10 times higher
than the parent chemical. In both wastewater treatment facilities, activated sludge
removed up to 100% of amphetamine, cocaine and BE, while the trickling filter only
removed 95% of amphetamine, 25% of cocaine, and there was no noticeable removal of
BE.35
Zuccato et al. examined removal rates in wastewater treatment facilities of illegal
drugs. One study found that 85 to 99% removal of methamphetamine occurred while
another study showed 60 to 98% removal, resulting in low concentrations (ng/L) in the
effluent. MDMA was found to be removed at rates from 44 to 57%, with approximately
0.10 ng/L in the effluent. Cocaine and BE both were found to have approximately 10% of

18
the influent concentration remaining in the effluent after wastewater treatment. THC had
the most extreme removal rate range, from 11 to 99% removal. Studies also showed that
removal rates were higher in 2006 than in 2004. This is most likely due to improved
treatment methods.36 Concentrations ranges detected in wastewater influent, effluent and
receiving waters are displayed in Table 2.
From the little research performed, it can be suggested that bioreactors can
remove higher quantities of drugs from wastewater systems. Although a portion of the
drugs are removed, the concentrations being released are still of concern due to possible
effects on the environment.
Use of Reclaimed Water and Drug Effects
With growing populations and limited water resources, use of reclaimed water is
gaining importance. If the reclaimed water is supplied from a municipal wastewater
discharge area, such as a lake, river, or groundwater, drinking water may be contaminated
with the drugs that are not removed during wastewater treatment.
In Spain, the surface waters of the Ebro River and the tap water in Barcelona
were tested for various drugs including methamphetamine, MDMA, THC, cocaine and
BE. The most concentrated compound found was BE, at levels as high as 346 ng/L in the
surface water. In drinking water, 130 ng/L of BE and 1.7 ng/L of meth was detected.37
Zuccato et al. also discussed drinking water treatment removal rates of specific
drug compounds. Amphetamines were found to be almost completely removed during
treatment by prechlorination, flocculation, and sand filtration. Granulated activated

19
carbon (GAC) removed 100% of cocaine, 88% of MDMA and 72% of BE. In 22 of the
24 samples taken from the treated drinking water, BE was found in concentrations
ranging from 45 ng/L to 130 ng/L.36
A study in Barcelona proved that groundwater is being contaminated by drugs of
abuse as well. Groundwater infiltration is not removing the drugs from the wastewater.
Thirty-six groundwater samples from the Barcelona urban groundwater system were
tested for cocaine, BE, THC, methamphetamine, and MDMA. The concentration ranges
are shown in Table 3. Approximately 40% of the United States uses groundwater for
drinking water. If groundwater recharge areas are supplied with treated wastewater
contaminated with drugs, and the local municipalities use the groundwater as a culinary
source, the drinking water could be at risk for drug contamination.38
Drinking water treatment methods need to be improved to ensure that the drugs
are completely eliminated. It is alarming that traces of BE were found in all of the water
samples. More research is necessary to determine what methods could be implemented to
effectively remove BE from all of the water systems. The general public would be very
concerned if the culinary drinking water had any traces of illegal drugs. As reclaimed
water becomes more popular as a main drinking water source, the concentrations of
illegal drugs need to be reduced to nonexistent levels to protect society from
consumption.
The previous information indicates that drugs are prevalent in the water system
and if not properly treated, could impact the environment and future societies that use
reclaimed water as a drinking source. Although not currently regulated by the EPA, it

20
would be beneficial for wastewater treatment facilities to begin testing for drugs of abuse
to determine what concentrations are present and the facilities’ removal rates. This data
could be used to help the facility begin to plan for additional treatment methods when the
EPA does implement regulation. As most treatment facilities are government based and
have limited funding, a method to detect illegal drugs in the wastewater that is cost and
time effective that does not require gaining permits from the DEA will allow
municipalities to begin testing and preparing for drug removal.

21
Table 1 - Drug Physical and Chemical Properties
Benzoylecgonine Caffeine Cocaine Cotinine
Chemical
Composition 𝐶16𝐻19𝑁𝑂4 𝐶8𝐻10𝑁4𝑂2 C17H21NO4 𝐶10𝐻12𝑁2𝑂
Chemical
Structure
Molecular
Weight (g/mol)
289.33 194.1906 303.35294 176.21508
Vapor
Pressure (mm Hg @
25°C)
3.77x10⁻¹¹ 7.3x10⁻⁹ 1.91x10⁻⁷ 3.8x10⁻⁴
Koc 1.28 22 - 130
Henrys
Constant (atm-m3/mole)
1.03x10⁻¹³ 3.6x10⁻¹¹ 4.2x10⁻¹¹ 3.3x10⁻¹²
pKa 2.15 10.4 - -
Half Life in
Water - 0.8 days
54 yrs. at pH 7
5 yrs. at pH 8 -
Log BCF 1.00 3 3 3
Log Kow -1.32 -0.07 2.31 0.07
Meth MDMA Nicotine Nandrolone Chemical
Composition 𝐶10𝐻15𝑁 𝐶11𝐻15𝑁𝑂2 𝐶10𝐻14𝑁2 𝐶18𝐻26𝑂2
Chemical
Structure
Molecular
Weight (g/mol)
149.2328 193.2423 162.23156 274.39784
Vapor
Pressure (mm Hg @
25°C)
1620 0.003 0.0038 3.5x10⁻⁸
Koc 9 to 22 - 100 630
Henrys
Constant (atm-m3/mole)
7.34x10⁻³ 2.75x10⁻⁹ 3.0x10⁻⁹ 2.7x10⁻⁹

22
Table 1 (cont)
Meth MDMA Nicotine Nandrolone
pKa 11 - - -
Half Life in Water
1.0 Hrs. in
river
3.9 days in
lake
- - -
Log BCF 2 3 21
Log Kow 2.07 -0.32 1.2 2.62
Oxycodone THC
Chemical Composition 𝐶18𝐻21𝑁𝑂4 𝐶21𝐻30𝑂2
Chemical Structure
Molecular Weight (g/mol) 315.36364 314.4617
Vapor Pressure (mm Hg
@ 25°C) 2.2x10⁻¹⁰ 4.6x10⁻⁸
Koc 120 3.3x10⁵
Henrys Constant (atm-
m3/mole) - 2.4x10⁻⁷
pKa 8.3 -
Half Life in Water - -
Log BCF 3 5
Log Kow 0.7 6.48

23
Figure 1- Chromatographic Process Schematic
Mobile Phase

24
Table 2 - Concentration Ranges of Illegal Drugs Detected in Recent Publications
Drug Target
Chemical
Influent
Concentration
(ng/L)39, 40
Effluent
Concentration
(ng/L)41
Surface Water
Concentration
(ng/L)42
Oxycodone
Opioid
narcotic;
pain
reliever
ND - 220 ND NA
Cotinine
Nicotine
by-
product;
tobacco
ND - 6820 ND - 2726 ND - 516
Cocaine
Central
nervous
system
stimulant
79-860 ND - 47 ND - 10
Caffeine Stimulant ND - 120000 ND - 22848 ND - 2991
THC
Active
chemical
in
marijuana
NA NA NA
MDMA Ecstasy 13.6 - 91 ND - 67 ND - 3.5
Nicotine Tobacco NA NA NA
Benzoylecgonine
Cocaine
metabolic
by-product
0.08 - 2800 ND - 928 ND - 111
Meth Stimulant ND - 2000 ND - 3.5 NA
Nandrolone Anabolic
Steroid ND – 2.4 ND – 1.2 ND – 0.60

25
Table 3 - Concentrations of Illegal Drugs Detected in Groundwater in Barcelona
Drug Average Concentration ± Standard
Deviation (ng/L)38
Max Concentration
(ng/L)38
Cocaine 3.8±12.8 60.2
BE 1.5±4.5 19.6
THC - -
Meth - -
MDMA 3.9±6.6 36.8

CHAPTER 3
MATERIALS AND METHODS
The objective of this study was to develop a cost and time effective method to
detect drugs of abuse in wastewater. Research was conducted on sewage and treated
wastewater from Central Valley Water Reclamation Facility and adjoining collection
agencies in Salt Lake City, Utah. The samples were processed for testing with Neogen
ELISA forensic drug detection kits. The Neogen kits were used to detect caffeine,
cocaine/BE, cotinine, meth/MDMA, nandrolone, oxycodone, and THC. The materials
and methods used are discussed below.
Sample Collection
Sewer Lines
Samples were collected from the Salt Lake Valley wastewater sewer systems and
Central Valley Water Reclamation Facility (CVWRF) in Salt Lake City, Utah. Eight
sewer lines feed Central Valley from seven improvement districts: Cottonwood
Improvement District, Granger-Hunter Improvement District, Kearns Improvement
District, Murray City, Mt. Olympus Improvement District (formerly known as Salt Lake
Suburban Sanitary District One, has two sewer lines), South Salt Lake City, and
27
Taylorsville-Bennion Improvement District. Figure 2 displays the boundaries of these
improvement districts. Combined, these districts serve over 500,000 people and cover
approximately 94 square miles.43
Each sewer line has a sampling station located before it merges with other
districts’ sewer lines and enters CVWRF. A permanent pump is located at each sampling
station and samples are randomly taken daily for CVWRF testing. These pumps were
used manually to collect the samples into 1 L amber glass bottles. The glass bottles were
labeled, sealed, and stored in a cooler with ice packs.
Wastewater Treatment Facility
Central Valley Water Reclamation Facility Board was established in 1978 in
response to the Clean Water Act. The members of the board represented the five original
wastewater treatment facilities. Central Valley was designed to treat 75 million gallons of
wastewater a day.43 Figure 3 is a schematic of Central Valley’s wastewater treatment
process.
A conventional wastewater treatment plant has many components, as shown in
Figure 3. Untreated wastewater enters the treatment facility through a network of sewer
lines. The preliminary treatment includes bar screens, which capture any large debris that
will be collected and removed. Sewage is then pumped into aerated grit chambers where
smaller particles, like sand, are removed. Water is then transported to primary
sedimentation, where the heavier solids are given time to settle to the bottom of the tank.
During this process, the oils and fats are skimmed off of the surface, and 60% of the
settable material has been removed. Next, wastewater is pumped to trickling filters,

28
where biological growth degrades pollutants. After the trickling filter, the water is
transported to the solid contacts (aeration) tanks. In this process, the growth of
microorganisms converts remaining pollutants into settable solids. The wastewater and
biosolids flow into the secondary sedimentation tank, where solids form and settle to the
bottom of the tank. At this point, 95% removal of pollutants is observed. Wastewater is
then sent to disinfection, using chlorination to kill any disease causing bacteria. The
water flows through aeration tanks, where dissolved oxygen is diffused into the water
before it is discharged to Mill Creek.
The sampling locations chosen within Central Valley were the trickling filter,
solids contact, and final effluent. The trickling filter and solids contact were chosen
because they have very high removal rates of most contaminants. The effluent was tested
to make a comparison of the final concentration of drugs to those found in the sewage
lines. Samples collected at the trickling filter were taken after the first filter, and those
from the solids contact were taken from the second tank. Effluent was taken at the
discharge point, before the water merges with Mill Creek.
All samples collected within the plant were taken by using a bucket attached to a
pole, which was rinsed with the water at the sampling location prior to collecting each
sample. Samples were then poured into 1 L amber glass bottles, previously muffled at
550 °C for 6 hours, which were sealed, labeled, and stored in a cooler with ice packs. The
samples were then refrigerated and processed within 24 hours of collection.

29
Sample Processing
Samples were filtered using a 1.2 micrometer glass fiber filter within 24 hours of
collection. At least 500 mL of sample was filtered. Organics from the filtrate were
concentrated on a hydrophobic resin (C-18, octadecylsilane, Empore). Organics were
eluted from the C-18 disk with 20 mL of ethanol, after which the volume was reduced
and the analytes were re-constituted in water or buffer. Appendix A displays instructions
for sample processing for each drug kit.
Immuno-Assay
Current analytical methods used to detect drugs in the wastewater are expensive
and very time consuming. Affordable products are available for drug testing from human
urine, blood, and saliva that are relatively quick to perform and are very efficient. Testing
wastewater samples with the assay could greatly reduce time and costs for treatment
facilities to begin monitoring and reporting drugs of abuse.
Drug kits used for this experiment were purchased from Neogen Corporation. The
kits cost $160 each and only take a couple hours to perform. Each kit contains 96
reactions, at $1.67 per well on the assay plate. Including the standard curve, a sample can
be analyzed for under $30. On the other hand, quantification of opioid drugs in 1L of
water costs $800-900 as quoted by the U.S. Geological Survey.44
Enzyme-linked immunosorbent assays (ELISA) use antibodies, antigens and
enzymes to determine the concentrations of drugs. The 96-well assay plates are coated
with immobilized antibodies that are specific to the antigen of the drug being tested.

30
There are a limited number of antibodies on the plates, controlling the number of antigen
binding sites. This limitation restricts the concentration ranges that can be detected.45
The wastewater sample and drug conjugate were added to the wells and incubated
for a specified amount of time. A metalloenzyme from the root of horseradish,
horseradish peroxidase, is used as the drug conjugate. Horseradish peroxidase uses
hydrogen peroxide to oxidize organic and inorganic compounds. When reacted with
specific substrates, bright colors are produced. Using various wavelengths, “transparent”
proteins that are bound to an enzyme substrate can be detected. For the Neogen test kits,
the drug-horseradish peroxidase conjugate competes with the drugs in the sample to bind
to the antibodies that are immobilized to the plate during incubation. The higher
concentration of drug present reduces the amount of enzyme conjugates that can bind to
the plated antibodies.46
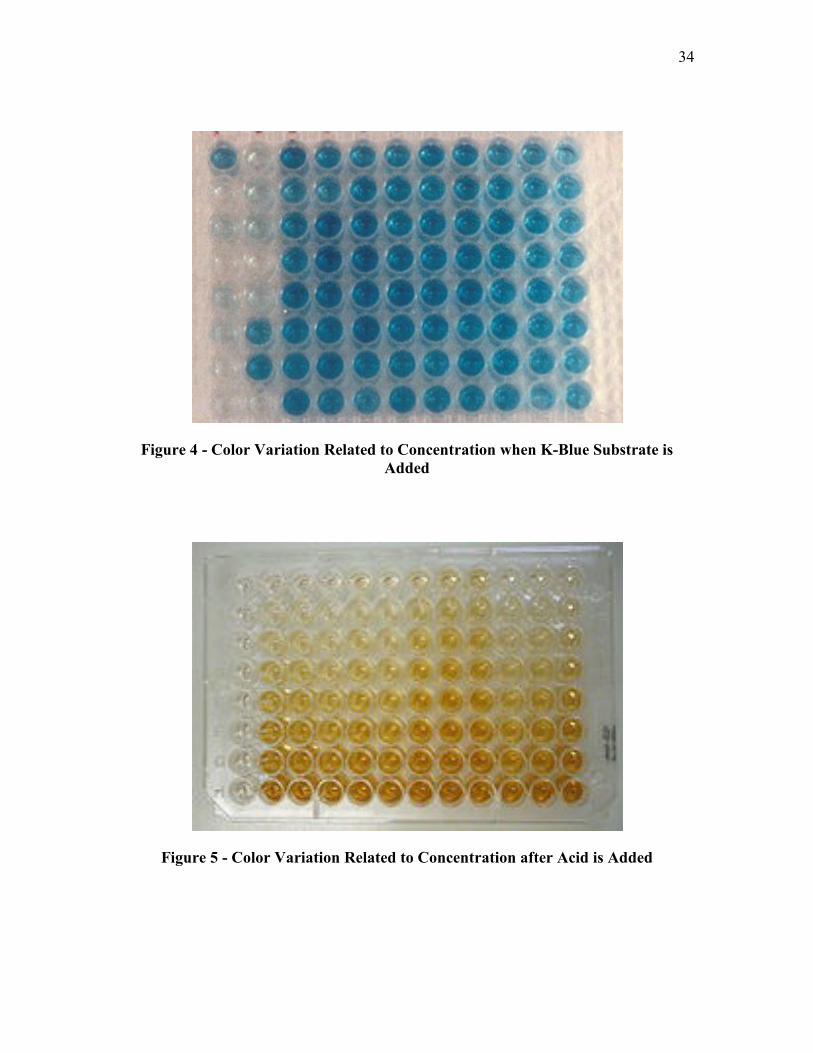
After incubation, the wells are washed to remove any unreacted conjugate and
sample. A K-Blue Substrate of 3, 3’, 5, 5’ Tetramethylbenzidine (TMB) and hydrogen
peroxide (H2O2) is then used to react with the unconjugated enzyme for color
development. This reaction produces a blue pigment in the solution. The higher
concentration of horseradish peroxidase, the brighter the solution becomes. After 30
minutes of substrate interaction with enzyme conjugate, acid, typically sulfuric acid, is
added to each well to stop the reaction. The absorbance is then read to determine the
concentration of the drugs compared to the concentration of conjugate in each well.
Samples that have high concentrations of drugs will have lower absorbance because there
is less reaction occurring between the enzymes and substrates. Figure 4 displays the color

31
variation due to concentration ranges when K-Blue Substrate has reacted. The dark blue
wells show little to zero concentration of drug, while the light blue to clear wells indicate
high concentrations of drug. Figure 5 displays a plate with a different chromogenic
substrate that has reacted with acid. The dark yellow color indicates low concentrations
while the clear wells indicate high concentrations of drug detected. Figure 6 is an
example of the process used for the Neogen Kits.47

32
Legend
Cottonwood Heights Improvement District
Granger-Hunter Improvement District
Kearns Improvement District
Mt. Olympus Improvement District
Murray City
South Salt Lake City
Taylorsville-Bennion Improvement District
Figure 2- Map of Central Valley Improvement Districts

33
Fig
ure
3 -
Cen
tral
Vall
ey W
ate
r R
ecla
ma
tion
Faci
lity
Sch
emati
c
34
Figure 4 - Color Variation Related to Concentration when K-Blue Substrate is
Added
Figure 5 - Color Variation Related to Concentration after Acid is Added

35
Testing is done in a micro-well containing
pre-plated antibodies responsive to specific
drug.
Sample and Enzyme/ Substrate conjugate
are added along with buffer
Competition-binding onto antibody site
proceeds for 1 hour.
Wells are washed with buffer.
K-Blue Substrate (yellow) is added, reacts
with enzyme/ substrate complex.
The presence of more enzyme/ substrate
converts the dye blue. Color is measure
using a spectrophotometer.
Figure 6 - Immuno-Assay Reaction Process

CHAPTER 4
RESULTS
Introduction
A standard curve was developed for each drug kit used. The standard curves were
used to determine the concentration of drug at each sampling location. The results for
each drug are discussed below.
Caffeine
Wastewater samples used for caffeine testing were filtered and diluted two-fold.
An unfiltered sample was processed to compare to the filtered results. Samples were
tested in triplicate. Figure 7 shows the standard curve developed for caffeine. The
standard curves were developed by running tests using the positive (approximately 100
µg/L) and negative controls supplied in the Neogen kit. The ratio of the wavelength of
known concentration over the wavelength of the negative sample were found and used to
scale the y-axis. Thus, at higher concentrations, the ratio would be a smaller value. To
develop a more precise standard curve, an exact caffeine standard would be more
appropriate. The standard curve was developed for each using the positive and negative

37
controls supplied to determine if it would provide the necessary results to establish the
approximate drug concentrations.
Table 4 displays the approximate concentrations found in the sewage and
wastewater samples. The concentrations found in the samples from the sewage lines that
were filtered through 1.2 µm glass fiber range from 70 to 168 µg/L. The samples that
were unfiltered had a concentration range of 90 µg/L to 194 µg/L. Caffeine levels
decreased after the trickling filter (1 µg/L), solids contact (1.5 µg/L) and effluent (0.5
µg/L).
Cocaine
Samples for cocaine/BE analysis were processed without being diluted or
concentrated. The concentration ranges found in wastewater fell within the limits of the
Neogen detection kits. The samples for cocaine testing were filtered and ran in triplicate.
Figure 8 displays the standard curve developed for cocaine. A 300 µg/L urine cutoff
calibrator supplied with the Neogen kit was used to develop the standard curve.
The concentrations of cocaine found in wastewater are listed in Table 5.
Concentrations ranged from 1 µg/L to 51 µg/L in the 1.2 µm glass fiber filtered samples
from the sewer lines, while raw samples showed concentrations ranges of 42 µg/L to 73
µg/L. The concentrations after treatment showed a slight decrease. The trickling filter had
a concentration of 44 µg/L for the filtered sample, and 65 µg/L for the raw sample. The
solids contact had concentrations of 37 µg/L and 40 µg/L for the unfiltered sample. The
effluent concentration of the filtered sample was 20 µg/L and the raw sample was 33

38
µg/L. These results show that cocaine and the metabolite BE are not effectively removed
during wastewater treatment.
Cotinine
The standard curve for cotinine was developed using the urine standards provided
with the Neogen kit. The cotinine standard curve is shown in Figure 9. Although
wastewater samples were concentrated 250:1, concentrations were not detected by the
Neogen plate. Utah has the lowest percent of cigarette smokers in the nation at 9.3%. The
low percentage of smokers and high biodegradability of cotinine likely contribute to
undetectable concentrations.
Methamphetamine
Samples for methamphetamine detection were diluted two-fold. Glass fiber
filtered samples were run in triplicate and raw samples were run individually. The
standard curve for meth, shown in Figure 10, was developed using the 500 µg/L urine
cut-off calibrator.
Methamphetamine concentrations in the sewer lines were much higher than the
treated effluent. The concentrations range was 86 µg/L to 460 µg/L for the 1.2 µm glass
fiber filtered samples. All of the raw samples displayed higher meth concentrations, 308
µg/L to 966 µg/L, indicating that the methamphetamine compounds have likely sorbed
onto the biosolids. The filtered organic particles would need to be tested to determine if
some of the meth compounds were removed by filtration. The trickling filter showed
concentrations of 32 µg/L and 54 µg/L for the filtered and unfiltered samples,

39
respectively. Solids contact showed a higher concentration, 58 µg/L and 64 µg/L. There
are some chemicals in the wastewater that may be converted into methamphetamine
during the solids contacts, such as MDMA. Any MDMA in the wastewater may be
converting to meth, thus increasing the concentrations detected by the immuno-assay.
The effluent of the filtered sample showed a concentration of 12 µg/L, while the
unfiltered effluent sample had a concentration of 54 µg/L (Table 6).
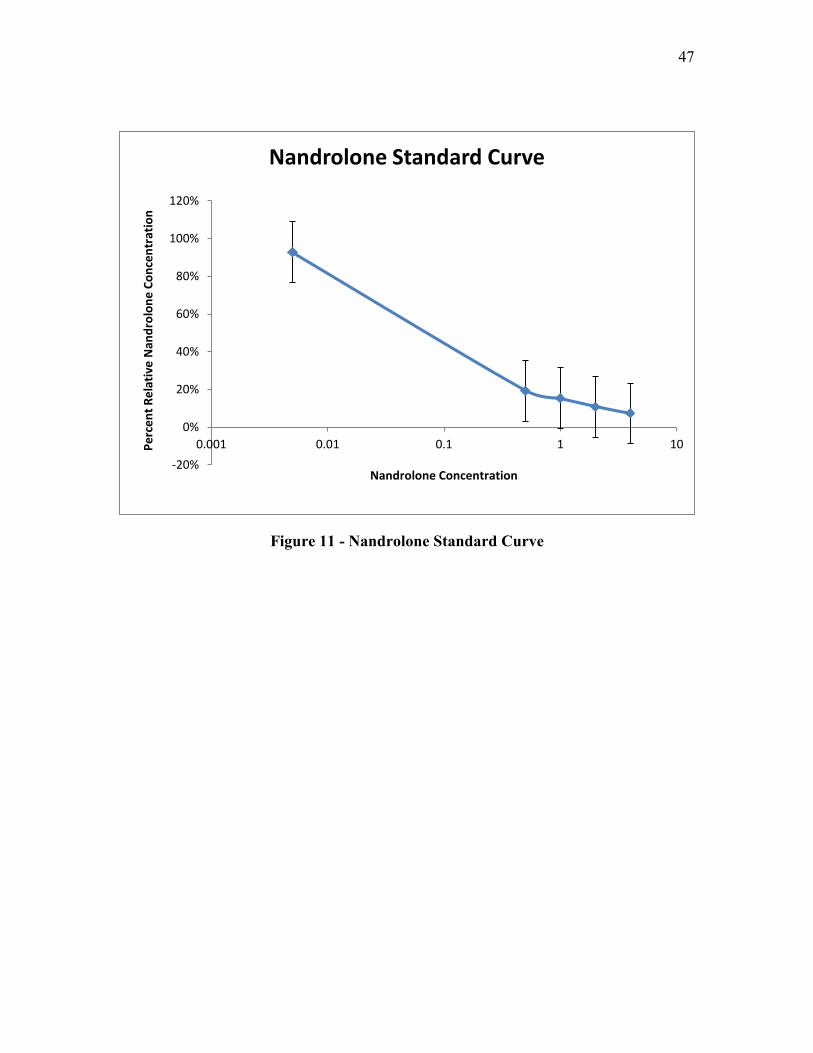
Nandrolone
The standard curve for nandrolone was developed using the positive control
provided by Neogen. Figure 11 displays the standard curve developed for nandrolone.
The wastewater samples for nandrolone were concentrated 25:1, which proved to be too
low to detect nandrolone in raw sewage and wastewater.
Oxycodone
The Neogen oxycodone testing kit provided a 100 µg/L urine cut-off calibrator,
which was used to develop the standard curve shown in Figure 12.
The samples used for oxycodone detection were concentrated 25:1. Table 7
displays the concentrations found. The concentrations in the sewer lines ranged from 0.04
µg/L to 0.13 µg/L. The wastewater treatment showed a decrease in concentration in all
three sampling locations: trickling filter (0.08 µg/L), solids contact (0.07 µg/L), effluent
(0.04 µg/L).

40
THC
The THC standard curve was developed using the urine cutoff calibrator supplied
in the Neogen Kit (Figure 13).
Samples collected for THC testing were concentrated 25:1. THC concentrations
varied in the sewer lines from 0.005 µg/L to 1.42 µg/L, as displayed in Table 8. The
concentration from the trickling filter was 0.03 µg/L. There were no detectable traces of
THC found in the samples from the solids contact and effluent, indicating that the
majority of THC was likely removed during solids contact due to its high
biodegradability.
Discussion
The drug test kits for caffeine, cocaine, methamphetamine, oxycodone, and THC
detected concentrations that are within the ranges found from the literature review, in
Table 2. Although the concentrations were on the lower end of the ranges, it can be
assumed that the Neogen kits can be effective at detecting illegal drugs in wastewater. To
verify the concentrations found, analysis with another detection method, such as GC-MS
or LC-MS/MS, would be beneficial. Drug standards that are regulated by the DEA would
be required for chromatographic detection methods, thus, comparisons were not made
with this research. After comparing concentrations found using the Neogen kits versus
another method, the practicality of using Neogen kits for testing would be determined.
The kits for cotinine and nandrolone did not have low enough detection limits for
this analysis. It can be assumed that either the concentrations in the wastewater in Salt

41
Lake County are low enough to not be of concern at this time or use of immuno-assay is
inefficient for detection in wastewater. Utah has the lowest rate of cigarette smokers in
the nation, so it may be possible that cotinine levels are just too low for detection.
The highest concentration of samples came from the raw sewage samples from
various districts. Table 9 shows that Kearns Improvement District had the highest
concentrations of caffeine and cocaine, Taylorsville-Bennion had the highest of
methamphetamine, Granger-Hunter was highest for oxycodone and Cottonwood had the
highest for THC. Drug statistic data is published per county, not city, so it is difficult to
know if these values correlate to true consumption of drugs in each of these areas.
Volumetric flow rates were taken at the time of sampling. These flow rates, used
with population of districts, were used to calculate the mass flux per capita. These values
(Table 10) can be used with forensic data to obtain more accurate estimates of
populations of users. Murray City has the highest mass flux for caffeine, cocaine, and
methamphetamine, while Kearns has the highest flux for oxycodone and Cottonwood
Heights has the highest flux for THC. It appears that Murray City is a high drug abuse
region.
Results also determined that there are losses of drug analytes during glass fiber
filtration. Table 11 displays the percent losses of drug analytes due to filtration. The
percent loss ranges from 22% to 92%. The total concentration of filtered samples could
be verified by collecting the solids from the glass fiber filter and using solid phase
extraction, followed by detection using the Neogen kit, GC-MS or LC-MS.

42
Wastewater treatment processes proved to remove a portion of the drugs in
wastewater, as shown in Table 12. The removal rates varied from 43% of cocaine to
100% removal of THC. Cocaine showed an increase in concentrations in the trickling
filter and solids contact, rather than removal. The drug test kit used for cocaine detects
concentrations of BE more accurately than that of cocaine. It is possible that any cocaine
in the wastewater was metabolized during the trickling filter and solids contact, thus
showing higher concentrations in the drug detection kits. Samples from more locations
within the wastewater treatment plant could be used to verify this hypothesis.
For further research, other types of drugs could be tested in Salt Lake County’s
wastewater, such as opioids and hallucinogens. Further testing at each process in the
wastewater treatment plant, surface waters and groundwater that are impacted by
wastewater, and drinking water sources using immune-assays, would further confirm
whether it is a sufficient method for illegal drug detection. Immuno-assay detection
coupled with chromatographic detection in future experiments will determine the
efficiency of immuno-assay concentration detection.

43
Figure 7 - Caffeine Standard Curve
Table 4 - Caffeine Concentration Results
Caffeine Concentration
from Raw Samples
(µg/L)
Caffeine Concentration
from Filtered Samples
(µg/L)
Cottonwood 194 70 ± 32.22
Granger – Hunter 90 98 ± 24.56
Kearns 192 168 ± 9.96
Murray 124 160 ± 2.50
Mt. Olympus East 160 126 ± 10.74
Mt. Olympus South 124 126 ± 1.28
South Salt Lake 132 118 ± 6.48
Taylorsville-
Bennion 136 146 ± 2.70
Trickling Filter 3 1 ± 0.59
Solids Contact 2.5 1.5 ± 0.34
Effluent 1 0.5 ± 0.02
0%
10%
20%
30%
40%
50%
60%
70%
80%
90%
100%
0.1 1 10 100 1000
Pe
rce
nt
Re
lati
ve C
affe
ine
Co
nce
ntr
atio
n
Caffeine Concentration
Caffeine Standard Curve

44
Figure 8 - Cocaine Standard Curve
Table 5 - Cocaine Concentration Results
Cocaine
Concentration from
Raw Samples (µg/L)
Cocaine
Concentration from
Filtered Samples
(µg/L)
Cottonwood 42 31 ± 10.51
Granger – Hunter 50 42 ± 11.46
Kearns 73 10 ± 2.19
Murray 45 51 ± 6.05
Mt. Olympus East 63 40 ± 13.66
Mt. Olympus South 48 50 ± 14.30
South Salt Lake 67 45 ± 5.24
Taylorsville-
Bennion 27 41 ± 3.65
Trickling Filter 65 44 ± 9.36
Solids Contact 40 37 ± 4.43
Effluent 33 20 ± 1.67
0%
20%
40%
60%
80%
100%
120%
0.1 1 10 100 1000
Pe
rce
nt
Re
lati
ve C
oca
ine
Co
nce
nta
tio
n
Cocaine Concentration
Cocaine Standard Curve

45
Figure 9 - Cotinine Standard Curve
0%
20%
40%
60%
80%
100%
120%
0.1 1 10 100 1000 10000
Pe
rce
n t
Ral
ativ
e C
oti
nin
e C
on
cen
trat
ion
Cotinine Concentration
Cotinine Standard Curve

46
Figure 10 - Methamphetamine Standard Curve
Table 6 - Methamphetamine Concentration Results
Methamphetamine
Concentration from Raw
Samples (µg/L)
Methamphetamine
Concentration from Filtered
Samples (µg/L)
Cottonwood 308 86 ± 11.17
Granger – Hunter 540 372 ± 15.59
Kearns 966 422 ± 39.53
Murray 624 414 ± 42.24
Mt. Olympus East 616 174 ± 17.66
Mt. Olympus
South 454 176 ± 4.82
South Salt Lake 588 286 ± 24.79
Taylorsville-
Bennion 940 460 ± 37.62
Trickling Filter 54 32 ± 0.71
Solids Contact 64 58 ± 4.61
Effluent 54 12 ± 0.36
0%
20%
40%
60%
80%
100%
120%
0.1 1 10 100 1000Pe
rce
nt
Re
lati
ve M
eth
amp
he
tam
ine
Co
nce
ntr
atio
n
Methamphetamine Concentration
Methamphetamine Standard Curve
47
Figure 11 - Nandrolone Standard Curve
-20%
0%
20%
40%
60%
80%
100%
120%
0.001 0.01 0.1 1 10Pe
rce
nt
Re
lati
ve N
and
rolo
ne
Co
nce
ntr
atio
n
Nandrolone Concentration
Nandrolone Standard Curve

48
Figure 12 - Oxycodone Standard Curve
Table 7 - Oxycodone Concentration Results
Oxycodone Concentration
from Filtered Samples
(µg/L)
Cottonwood 0.11 ± 0.012
Granger – Hunter 0.13 ± 0.010
Kearns 0.13 ± 0.016
Murray 0.10 ± 0.004
Mt. Olympus East 0.04 ± 0.004
Mt. Olympus South 0.08 ± 0.010
South Salt Lake 0.09 ± 0.012
Taylorsville-Bennion 0.04 ± 0.009
Trickling Filter 0.08 ± 0.010
Solids Contact 0.07 ± 0.006
Effluent 0.04 ± 0.009
0%
20%
40%
60%
80%
100%
120%
0.01 0.1 1 10 100
Pe
rce
nt
Re
lati
ve O
xyco
do
ne
Co
nce
ntr
atio
n
Oxycodone Concentratin
Oxycodone Standard Curve

49
Figure 13 - THC Standard Curve
Table 8 - THC Concentration Results
THC Concentration
(µg/L)
Cottonwood 1.42 ± 0.294
Granger – Hunter 0.68 ± 0.052
Kearns 0.92 ± 0.120
Murray 0.32 ± 0.045
Mt. Olympus East 0.38 ± 0.069
Mt. Olympus South 0.78 ± 0.202
South Salt Lake 0.03 ± 0.042
Taylorsville-Bennion 0.005 ± 0.015
Trickling Filter 0.03 ± 0.014
Solids Contact 0.0 ± 0.006
Effluent 0.0 ± 0.017
0%
20%
40%
60%
80%
100%
120%
0.1 1 10 100
Pe
rce
nt
Re
lati
ve T
HC
Co
nce
ntr
atio
n
THC Concentration
THC Standard Curve

50
Table 9 - Average, Maximum and Minimum Concentrations in Sewer Lines NA indicates that raw samples were not tested for detection of that particular drug.
Drug
Average Raw
Concentration
(µg/L)
Average
Filtered
Concentration
(µg/L)
Maximum
Concentration
(µg/L)
Minimum
Concentration
(µg/L)
Caffeine 144 127 168 - Kearns 70 –
Cottonwood
Cocaine 52 35 51 – Kearns 1 –
Cottonwood
Cotinine NA ND ND ND
Methamphetamine 630 299
460 –
Taylorsville -
Bennion
86 –
Cottonwood
Nandrolone NA ND ND ND
Oxycodone NA 0.09 0.134 –
Granger
0.041 –
Taylorsville
THC NA 0.57 1.42 -
Cottonwood
0.005 –
Taylorsville
Table 10 - Mass Flux per Capita
Mass Flux Per Capita (µg / person – day)
Population
Flow
Rate
(MGD)
Caffeine Cocaine Meth Oxycodone THC
Cottonwood
Heights 129000 12.78 26165 378 32145 41 531
Granger-
Hunter 120000 36.72 29987 12852 113827 40 208
Kearns 40000 15.90 66775 3975 175681 52 366
Mt.
Olympus
(Combined)
49.32
Murray
City 46000 21.88 75610 24100 195641 47 151
South Salt
Lake City 24000 12.04 59145 22555 143353 45 15
Taylorsville-
Bennion 70000 22.37 46661 13103 147015 13 1.6

51
Table 11 - Percent Loss of Analytes due to Filtration
% Loss in Drug from Filtering vs. Raw Samples
Caffeine Cocaine Methamphetamine
Average for Sewer Lines 87.8% 67.5% 47.5%
Trickling Filter 33.3% 67.7% 59.3%
Solids Contact 60.0% 92.5% 90.6%
Effluent 50.0% 60.6% 22.2%
Table 12 - Percent Removal from Wastewater Treatment
(Cotinine and Nandrolone were not detected)
% From Trickling
Filter
% From Solids
Contact
% Total
Removal
Caffeine 99.2% 98.8% 99.2%
Cocaine -25.7% -5.7% 42.9%
Cotinine - - -
Methamphetamine 89.3% 80.6% 96.0%
Nandrolone - - -
Oxycodone 11.1% 22.2% 55.6%
THC 94.7% 100% 100%
CHAPTER 5
CONCLUSION
This study proved that the use of immuno-assays could be used to detect some
illegal and recreational drugs of abuse in wastewater in a timely and cost effective
manner. Cotinine and nandrolone analytes were not detected by the ELISA kits. The five
remaining drugs tested were all detected within the limits of the Neogen ELISA kits used.
Caffeine, methamphetamine, and THC showed a high percentage of removal (99.2% -
100%) through the wastewater treatment process. Cocaine showed a 42.9% removal and
oxycodone showed a 55.6% removal during treatment.
To improve the studies on the use of immuno-assays for illegal drug detection in
wastewater, ELISA tests should be performed with GC or LC methods to confirm
detection accuracy. The biosolids removed during filtration with glass fiber filters could
also be tested for illegal drugs to determine an accurate percentage of analytes lost during
filtration. To determine more precise removal rates, activated sludge samples could also
be tested. To further research, the effluent and water body of discharge, the Jordan River,
could also be detected for the illegal drugs to determine the removal rates by
environmental factors.
53
Final Remarks
The EPA has not put into place discharge limits on drugs of abuse. Illegal drug
usage rates are continually rising and the effects on the environment are unknown.
European countries have begun tests to determine the impacts, but there is little research
effort in the United States. This may be due to DEA restrictions, or costs of detection
methods. As more societies begin using reclaimed water as a drinking water source,
illegal drug concentrations will become an even larger concern. When the EPA begins
enforcing discharge concentrations, wastewater facilities will need to incorporate new
detection and treatment methods. Immuno-assays may be a cost and time effective
method to begin detection.

APPENDIX
METHOD DEVELOPMENT DETAILS
Glass Fiber Filtering
1. 1.2 µm glass fiber filters are recommended.
2. Rinse filtering flask, glass frit, and filter funnel with millique water.
3. Pass 100mL of millique water through assembled filter holder.
4. Add glass fiber filter to assembly and rinse filter with 100 mL of millique water.
5. Filter sample.
6. Collect filtrate for testing and for C-18 processing.
C-18 Concentration
1. Rinse all glassware with millique water followed by ethanol.
2. Assemble filter holder and pass ethanol through glass frit.
3. Reassemble with C-18 membrane in place.
4. Soak for 1 minute in 20% ethanol, apply vacuum, and pull through.
5. Repeat with 60% ethanol and 100% ethanol.
6. Add 15 mL ethanol and soak for 1 minute. Do not allow disk to run dry at this
point.
7. Pull ethanol through until 2-3 mm above membrane surface.
8. Add 15 mL Nanopure water. Pull through until 2-3 mm above membrane
surface.
9. Add 500 mL of sample to be concentrated. Do not allow disk to run dry until
entire volume has been extracted.
10. Transfer filter assembly to smaller vacuum flask.
11. Add 10 mL ethanol, soak for 1 minute. Pull through. Repeat.
12. Transfer sample to 40 mL (muffled) vial. Dry under N2.
13. Re-suspend with provided buffer solution in ELISA kits.48
Caffeine Test Procedures
1. Filter sample with 1.2 µm glass fiber filter.
2. Dilute sample two-fold using EIA Buffer solution provided with Neogen
Caffeine/ Pentoxifylline Detection Kit.
3. Use the instructions included with the Neogen Caffeine/Pentoxifylline Detection
Kit with some alterations as shown in test procedure steps a through l listed
below:
a) Determine the number of wells to be used.

56
b) Prepare the enzyme conjugate by diluting the 180X enzyme conjugate
stock 1 to 180 in the EIA buffer provided. Mix the solution by inversion.
Do not vortex.
c) Add 20 µL of sample, laboratory calibrators, and Neogen controls to the
appropriate wells in triplicate. DO NOT dilute Neogen’s positive and
negative controls.
d) Add 180 µL of diluted drug-enzyme conjugate to each well. Use 8-
channel pipetter for rapid addition.
e) Mix by gently shaking plate.
f) Cover plate with plate cover and incubate at room temperature for 45
minutes.
g) During conjugation period, dilute concentrated wash buffer ten-fold with
deionized water. Mix thoroughly.
h) Once incubation is complete, dump the liquid from the wells. Tap the plate
on a clean lint-free towel to remove any remaining liquid in the wells.
i) Wash each well with 300 µL of diluted wash buffer. Repeat for a total of
three washings, invert and tap dry the plate following each step. After
completing the last step wipe the bottom of the wells with a lint-free towel
to remove any liquid on the outside of the wells.
j) Add 150 µL of the K-Blue Substrate to each well.
k) Incubate at room temperature for 30 minutes.

57
l) Add 50 µL of Neogen’s Red Stop Solution to each well to stop enzyme
reaction. Mix gently before measuring absorbance. Measure the
absorbance at a wavelength of 630 nm. Wells should be read within 2
hours of stopping reaction.
Cocaine/ Benzoylecgonine Test Procedures
1. Filter sample with 1.2 µm glass fiber filter (Do not dilute sample for cocaine
tests).
2. Use the instructions included with the Neogen Cocaine/ Benzoylecgonine
Detection Kit with some alterations as shown in test procedure steps a through k
listed below:
a) Determine the number of wells to be used.
b) Gently mix the ready to use conjugate solution by inversion. Do not
vortex.
c) Add 10 µL of sample, Neogen calibrators to the appropriate wells in
triplicate.
d) Add 180 µL of ready to use drug-enzyme conjugate to each well. Use 8-
channel pipetter for rapid addition.
e) Mix by gently shaking plate.
f) Cover plate with plate cover and incubate at room temperature for 45
minutes.
g) During conjugation period, dilute concentrated wash buffer ten-fold with
deionized water. Mix thoroughly.

58
h) Once incubation is complete, dump the liquid from the wells. Tap the plate
on a clean lint-free towel to remove any remaining liquid in the wells.
i) Wash each well with 300 µL of diluted wash buffer. Repeat for a total of
three washings, invert and tap dry the plate following each step. After
completing the last step wipe the bottom of the wells with a lint-free towel
to remove any liquid on the outside of the wells.
j) Add 100 µL of the K-Blue Substrate to each well.
k) Incubate at room temperature for 30 minutes.
l) Add 100 µL of Acid Stop (1N H2SO4) to each well to stop enzyme
reaction. Mix gently before measuring absorbance. Measure the
absorbance at a wavelength of 450 nm. Wells should be read within 2
hours of stopping reaction.
Cotinine Test Procedures
1. Filter sample with 1.2 µm glass fiber filter.
2. Perform C-18 Concentration to obtain a 250:1 concentrated ratio, re-suspended in
provided dilution buffer.
3. Use the instructions included with the Neogen Cotinine Detection Kit with some
alterations as shown in test procedure steps a through k listed below:
a) Allow at least 60 minutes for all test kit components and samples to reach
room temperature (20-23ºC).

59
b) Prior to using a new kit, prepare fully diluted enzyme by adding exactly
150 µL of cotinine enzyme conjugate to the enzyme diluent. Gently invert
15 times.
c) Determine the number of wells to be used.
d) Pipette 20 µL of sample and standards into wells in triplicate.
e) Add 100 µL of prepared cotinine enzyme conjugate to each well. Invert
the conjugate several times before adding to wells.
f) Cover plate with plate cover and incubate at room temperature for 30
minutes. Tap side of plate 3 to 4 times throughout incubation.
g) Dump the solution from the wells and tamp onto lint free towel. Add 350
µL of deionized water to each well. Dump the deionized water and tamp
plate again lint free towel. Repeat the wash step two more times.
h) Without allowing the wells to dry out, add 100 µL of K-Blue Substrate to
each well.
i) Incubate at room temperature for 30 minutes, tapping sides of the plate 3
to 4 times throughout incubation.
j) Add 100 µL of Stop Solution to each well to stop enzyme reaction. Mix
gently before measuring absorbance.
k) Measure the absorbance at a wavelength of 450 nm. Wells should be read
within 2 hours of stopping reaction.
Methamphetamine/ MDMA Test Procedures
1. Filter sample with 1.2 µm glass fiber filter.

60
2. Dilute sample two-fold using EIA Buffer solution provided with Neogen
Methamphetamine/ MDMA Detection Kit.
3. Use the instructions included with the Neogen Methamphetamine/ MDMA
Detection Kit with some alterations as shown in test procedure steps a through l
listed below:
a) Determine the number of wells to be used.
b) Gently mix the ready to use conjugate solution by inversion. Do not
vortex.
c) Add 10 µL of sample, Neogen calibrators to the appropriate wells in
triplicate.
d) Add 100 µL of ready to use drug-enzyme conjugate to each well. Use 8-
channel pipetter for rapid addition.
e) Mix by gently shaking plate.
f) Cover plate with plate cover and incubate at room temperature for 45
minutes.
g) During conjugation period, dilute concentrated wash buffer ten-fold with
deionized water. Mix thoroughly.
h) Once incubation is complete, dump the liquid from the wells. Tap the plate
on a clean lint-free towel to remove any remaining liquid in the wells.
i) Wash each well with 300 µL of diluted wash buffer. Repeat for a total of
three washings, invert and tap dry the plate following each step. After
61
completing the last step wipe the bottom of the wells with a lint-free towel
to remove any liquid on the outside of the wells.
j) Add 100 µL of the K-Blue Substrate to each well.
k) Incubate at room temperature for 30 minutes.
l) Add 100 µL of Acid Stop (1N H2SO4) to each well to stop enzyme
reaction. Mix gently before measuring absorbance. Measure the
absorbance at a wavelength of 450 nm. Wells should be read within 2
hours of stopping reaction.
Nandrolone Test Procedures
1. Filter sample with 1.2 µm glass fiber filter.
2. Perform C-18 Concentration to obtain a 25:1 concentrated ratio, re-suspended in
provided EIA Buffer.
3. Use the instructions included with the Neogen Nandrolone Detection Kit with
some alterations as shown in test procedure steps a through n listed below:
a) Allow at least 60 minutes for all test kit components and samples to reach
room temperature (20-23ºC).
b) Determine the number of wells to be used.
c) Prepare the enzyme conjugate by diluting the 180X enzyme conjugate
stock 1 to 180 in the EIA Buffer provided. Mix the solution by inversion.
d) Add 20 µL of sample and standards into wells in triplicate.
e) Add 180 µL of diluted enzyme conjugate to each well.
f) Mix gently by shaking plate.

62
g) Cover plate with plate cover and incubate at room temperature for 60
minutes.
h) During conjugation period, dilute concentrated wash buffer ten-fold with
deionized water. Mix thoroughly.
i) Dump the solution from the wells and tap onto lint free towel.
j) Wash each well with 300 µL of diluted wash buffer. Repeat for a total of
three washings, invert and tap dry the plate following each step. After
completing the last step wipe the bottom of the wells with a lint-free towel
to remove any liquid on the outside of the wells.
k) Add 150 µL of K-Blue Substrate to each well.
l) Incubate at room temperature for 30 minutes, tapping sides of the plate
three to four times throughout incubation.
m) Add 50 µL of Neogen’s Red Stop Solution to each well to stop enzyme
reaction. Mix gently before measuring absorbance.
n) Measure the absorbance at a wavelength of 630 nm. Wells should be read
within 2 hours of stopping reaction.
Oxycodone/ Oxymorphone Test Procedures
1. Filter sample with 1.2 µm glass fiber filter.
2. Perform C-18 Concentration to obtain a 25:1 concentrated ratio, re-suspended in
provided EIA Buffer Solution provided.

63
3. Use the instructions included with the Neogen Oxycodone/ Oxymorphone
Detection Kit with some alterations as shown in test procedure steps a through l
listed below:
a) Determine the number of wells to be used.
b) Gently mix the ready to use conjugate solution by inversion. Do not
vortex.
c) Add 10 µL of sample, Neogen calibrators to the appropriate wells in
triplicate.
d) Add 100 µL of ready to use drug-enzyme conjugate to each well. Use 8-
channel pipetter for rapid addition.
e) Mix by gently shaking plate.
f) Cover plate with plate cover and incubate at room temperature for 45
minutes.
g) During conjugation period, dilute concentrated wash buffer ten-fold with
deionized water. Mix thoroughly.
h) Once incubation is complete, dump the liquid from the wells. Tap the plate
on a clean lint-free towel to remove any remaining liquid in the wells.
i) Wash each well with 300 µL of diluted wash buffer. Repeat for a total of
three washings, invert and tap dry the plate following each step. After
completing the last step wipe the bottom of the wells with a lint-free towel
to remove any liquid on the outside of the wells.
j) Add 100 µL of the K-Blue Substrate to each well.

64
k) Incubate at room temperature for 30 minutes.
l) Add 100 µL of Acid Stop (1N H2SO4) to each well to stop enzyme
reaction. Mix gently before measuring absorbance. Measure the
absorbance at a wavelength of 450 nm. Wells should be read within 2
hours of stopping reaction.
THC Test Procedures
1. Filter sample with 1.2 µm glass fiber filter.
2. Perform C-18 Concentration to obtain a 25:1 concentrated ratio, re-suspended in
provided EIA Buffer Solution provided.
3. Use the instructions included with the Neogen THC Detection Kit with some
alterations as shown in test procedure steps a through l listed below:
a) Determine the number of wells to be used.
b) Gently mix the ready to use conjugate solution by inversion. Do not
vortex.
c) Add 10 µL of sample, Neogen calibrators to the appropriate wells in
triplicate.
d) Add 100 µL of ready to use drug-enzyme conjugate to each well. Use 8-
channel pipetter for rapid addition.
e) Mix by gently shaking plate.
f) Cover plate with plate cover and incubate at room temperature for 45
minutes.
65
g) During conjugation period, dilute concentrated wash buffer ten-fold with
deionized water. Mix thoroughly.
h) Once incubation is complete, dump the liquid from the wells. Tap the plate
on a clean lint-free towel to remove any remaining liquid in the wells.
i) Wash each well with 300 µL of diluted wash buffer. Repeat for a total of
three washings, invert and tap dry the plate following each step. After
completing the last step wipe the bottom of the wells with a lint-free towel
to remove any liquid on the outside of the wells.
j) Add 100 µL of the K-Blue Substrate to each well.
k) Incubate at room temperature for 30 minutes.
l) Add 100 µL of Acid Stop (1N H2SO4) to each well to stop enzyme
reaction. Mix gently before measuring absorbance. Measure the
absorbance at a wavelength of 450 nm. Wells should be read within 2
hours of stopping reaction.

REFERENCES
1. Rannazzisi, J. T.; Caverly, M. W. Practitioner's Manual: An Informational Outline of
Controlled Substances Act. United States Department of Justice: Drug
Enforcement Administration: Office of Diversion of Control: Springfield, VA,
2006.
2. Thomas, K. V. et al. Comparing Illicit Drug Use in 19 European Cities through
Sewage Analysis. Science of the Total Environment. 2012, 432, 432-439.
3. Knight, C. A.; Knight, I.; Michel, D. C.; Zepp, J. E. Beverage Caffeine Intake in US
Consumers and Subpopulations of Interest: Estimates from the Share of Intake
Panel Survey. Food and Chemical Toxicology. 2004, 42, 1923-1930.
4. Birkett, D. J.; Miners, J. O. Caffeine Renal Clearance and Urine Caffeine
Concentrations during Steady State Dosing. Implications for Monitoring Caffeine
Intake during Sports Events. British Journal of Clinical Pharmacology. 1991, 31,
401-408.
5. Buerge, I. J.; Poiger, T.; Muller, M. D.; Buser, H. Caffeine, an Anthropogenic Marker
for Wastewater Contamination of Surface Waters. Environmental Science
Technology. 2003, 37, 691-700
6. WebMD, LCC. Find a Vitamin or Supplement: Caffeine.
http://www.webmd.com/vitamins-supplements/ingredientmono-979-
CAFFEINE.aspx?activeIngredientId=979&activeIngredientName=CAFFEINE
(accessed Aug 21, 2012).
7. Rodriguez del Rey, Z.; Granek, E. F.; Buckley, B. A. Expression of HSP70 in Mytilus
Californianus Following Exposure to Caffeine. Ecotoxicology. 2011, 20, 855-861.
8. International Program on Chemical Safety (INCHEM). Chemical Safety Information
from Intergovernmental Organizations. http://www.inchem.org/ (accessed Dec 5,
2012).

67
9. TEVA Pharmaceuticals USA Inc. Oxycodone Hydrochloride.
http://dailymed.nlm.nih.gov/dailymed/lookup.cfm?setid=2d044a8e-8fdb-4299-
a3facd8761d9ad58 (accessed Nov 21, 2012).
10. Sui, Q.; Huang, J.; Deng, S.; Yu, G.; Fan, Q. Occurrence and Removal of
Pharmaceuticals, Caffeine and DEET in Wastewater Treatment Plants of Beijing,
China. Water Research. 2010, 44, 417-426.
11. WebMD, LCC. Mental Health Center: Cocaine Use and Its Effects.
http://www.webmd.com/mental-health/cocaine-use-and-its-effects (accessed Aug
21, 2012).
12. Sangster, James. Octanol-Water Partition Coefficients of Simple Organic
Compounds. Journal of Physical and Chemical Reference Data. 1989, 18, 1111-
1227.
13. National Center for Biotechnology Information, U.S. National Library of Medicine
(NCBI). The PubChem Project. http://pubchem.ncbi.nlm.nih.gov/ (accessed Sept
18, 2012).
14. University of California, San Francisco (UCSF). Lifecycle of Cotinine.
http://www.teensmokingstudy.com/cotinine.html (accessed Aug 21, 2012)
15. Drugs.com: Drug Information Online. Nicotine Side Effects.
http://www.drugs.com/sfx/nicotine-side-effects.html (accessed Nov 25, 2012).
16. Bones, J.; Thomas K. V.; Paull, B. Using Environmental Analytical Data to Estimate
Levels of Community Consumption of Illicit Drugs and Abused Pharmaceuticals.
Supplementary Material (ESI) for Journal of Environmental Monitoring. 2007, 7,
701-701.
17. Frontline, WGBH Educational Foundation. The Meth Epidemic: How Meth Destroys
the Body. http://www.pbs.org/wgbh/pages/frontline/meth/body/ (accessed Aug 8,
2012).
18. National Institute on Drug Abuse: The Science of Drug Abuse & Addiction.
DrugFacts: MDMA (Ecstasy).
http://www.drugabuse.gov/publications/drugfacts/mdma-ecstasy (accessed July 7,
2012).
19. Drugs.com: Drug Information Online. Nandrolone Side Effects.
http://www.drugs.com/sfx/nandrolone-side-effects.html (accessed Nov 25, 2012).

68
20. May, P. School of Chemistry, University of Bristol. Molecule of the Month-October
2000: Nandrolone. http://www.chm.bris.ac.uk/motm/nandrolone/nandh.htm
(accessed Sept 18, 2012).
21. Lange, I. G.; Daxenberger, A.; Schiffer, B.; Writters, H.; Ibarreta, D.; Meyer, H. H.
Sex Hormones Originating from Different Livestock Production Systems: Fate
and Potential Disrupting Activity in the Environment. Analytica Chimica Acta,
2002, 473, 27-37.
22. Drugs.com: Drug Information Online. Oxycodone Side Effects.
http://www.drugs.com/sfx/oxycodone-side-effects.html (accessed Nov 25, 2012)
23. National Institute on Drug Abuse: The Science of Drug Abuse & Addiction.
DrugFacts: Marijuana.
http://www.drugabuse.gov/publications/drugfacts/marijuana (accessed July 7,
2012).
24. Swartz, M. E. Ultra Performance Liquid Chromatography (UPLC): An Introduction.
Separation Science Redefined [Online] 2005, p 8-14. Chromatography Online.
http://www.chromatographyonline.com/lcgc/data/articlestandard/lcgc/242005/164
646/article.pdf (accessed Nov 21, 2012).
25. Verstraete, A. G. Detection Times of Drugs of Abuse in Blood, Urine, and Oral Fluid.
The Drug Monit. 2004, 26, 200-2005.
26. Utah Drug Control Update: 2010; Office of National Drug Control Policy Programs.
Salt Lake City, UT, 2010.
27. Division of Substance Abuse and Mental Health 2009 Annual Report; Department of
Human Services; Department of Human Services: Salt Lake City Utah, 2009.
28. Castiglioni, S.; Zuccato, E.; Fanelli R. Illicit Drugs in the Environment; Occurrence,
Analysis and Fate Using Mass Spectrometry; John Wiley & Sons, Inc. New
Jersey, pp 251-274.
29. Walters Jr. K. R.; Rupassara, S. I.; Marketz, R. C.; Leakey, A. D.; Muir, W. M.;
Pittendrigh, B. R. Methamphetamine Causes Anorexia in Drosophila
Melanogaster, Exhausting Metabolic Reserves and Contributing to Mortality. The
Journal of Toxicological Science. 2012, 37, 773-790.
30. Library 4 Science: Chromatography-Online.org. Liquid Chromatography.
http://www.chromatographyonline.org/4/contents.html (accessed Dec 14, 2012).

69
31. Doucette, W. J. Octanol/water Partition Coefficient. Presented at Introduction to
Environmental Organic Chemistry, Utah State University, Logan, UT, November
2012.
32. Dyke, T. M.; Sams, R.A. Detection and Determination of Theobromine and Caffeine
in Urine after Administration of Chocolate-Coated Peanuts to Horses. Journal of
Analytical Toxicology. 1998¸ 22, 112-116.
33. ChemGuide. High Performance Liquid Chromatography-HPLC.
http://www.chemguide.co.uk/analysis/chromatography/hplc.html (accessed Dec
14, 2012).
34. U.S. Department of Justice: Drug Enforcement Administration; Office of Diversion
Control. Controlled Substances Schedules.
http://www.deadiversion.usdoj.gov/schedules/index.html#define (accessed Dec
03, 2012).
35. Kasprzyk-Hordern, B.; Dinsdale, R. M.; Guwy, A. J. The Removal of
Pharmaceuticals, Personal Care Products, Endocrine Disruptors and Illicit Drugs
during Wastewater Treatment and its Impact on the Quality of Receiving Waters.
Water Research. 2009, 43, 363-380.
36. Zuccato, E.; Castiglioni, S. Illicit Drugs in the Environment. Philosophical
Transactions of the Royal Society A. 2009, 367, 3965-3978.
37. Valcarcel, Y. et al. Drugs of Abuse in Surface and Tap Waters of the Tagus River
Basin: Heterogeneous Photo-Fenton Process is Effective in their Degradation.
Environment International. 2012, 41, 35-43.
38. Jurado, A.; Mastroianni, N.; Vazquez-Sune, E.; Carrera, J.; Tubau, I.; Pujades, E.;
Postigo, C.; Lopez de Alda, M.; Barcelo, D. Drugs of Abuse in Urban
Groundwater. A case study: Barcelona. Sciences of the Total Environment. 2012,
424, 280-288.
39. Utah Department of Human Services. Substance Abuse and Mental Health.
http://www.dsamh.utah.gov/substanceabusetreatment.htm (accessed Nov 25,
2012).
40. Zuccato, E.; Chiabranod, C.; Castiglioni, S.; Bagnati, R.; Fanelli, R. Estimating
Community Drug Abuse by Wastewater Analysis. Environmental Health
Perspective. 2008, 116.8, 1027-1032.

70
41. Chiaia A. C.; Banta-Green, C.; Field, J. Eliminating Solid Phase Extraction with
Large Volume LC/MS/MS: Analysis of Illicit and Legal Drugs and Human Urine
Indicators in US Wastewaters. Environmental Science Technology. 2008, 42(23),
8841-8848.
42. Boleda R. M.; Galceran M. T.; Ventura F. Trace Determination of Cannabinoids and
Opiates in Wastewater and Surface Waters by Ultra-Performance Liquid
Chromatography-Tandem Mass Spectrometry. Journal of Chromatography A.
2007, 1175, 38-48.
43. Central Valley Water Reclamation Facility: A Natural Solution.
http://www.cvwrf.org/brochure/page2.php (accessed June 28, 2012).
44. Utah Water Science Center. U.S. Geological Survey, West Valley, UT. Personal
communication, 2012.
45. Neogen Corporation. Neogen Toxicology: ELISA Assay Principal.
http://www.neogen.com/Toxicology/Assay_Principle.html (accessed May 5,
2012).
46. University of California, Davis (UC-Davis). Instrumental Analysis: Chromatography.
http://chemwiki.ucdavis.edu/Analytical_Chemistry/Instrumental_Analysis/Chrom
atography (accessed Dec 14, 2012).
47. University of California, Los Angeles (UCLA). Gas Chromatography.
http://www.chem.ucla.edu/~bacher/General/30BL/gc/theory.html (accessed Nov
1, 2012).
48. Conroy, O. Estrogenic and Anti-estrogenic Activity Present in Wastewater Effluent
and Reclaimed Water. Ph.D. Dissertation, University of Arizona, Tucson, AZ,
2006.