use of soybean flour-poultry meat meal blends in …
TRANSCRIPT
1
USE OF SOYBEAN FLOUR-POULTRY MEAT MEAL BLENDS IN PRACTICAL
DIETS OF OREOCHROMIS NILOTICUS AND CLARIAS GARIEPINUS
BY
SULEIMAN O.E.SADIKU
B.Sc (Hons) Zoology (University of Benin, Benin-Nigeria)
M.Sc Fisheries (Ahmadu Bello University, Zaria-Nigeria)
Thesis submitted to the University of Stirling in fulfilment of the
requirements for the award of the degree of Doctor of Philosophy
Institute of Aquaculture
University of Stirling
Stirling, Scotland
August, 1995
ProQuest Number: 13916348
All rights reserved
INFORMATION TO ALL USERS The quality of this reproduction is dependent upon the quality of the copy submitted.
In the unlikely event that the author did not send a com p le te manuscript and there are missing pages, these will be noted. Also, if material had to be removed,
a note will indicate the deletion.
uestProQuest 13916348
Published by ProQuest LLC(2019). Copyright of the Dissertation is held by the Author.
All rights reserved.This work is protected against unauthorized copying under Title 17, United States C ode
Microform Edition © ProQuest LLC.
ProQuest LLC.789 East Eisenhower Parkway
P.O. Box 1346 Ann Arbor, Ml 48106- 1346
DEDICATION
To Humanity
DECLARATION
I do hereby declare that this thesis is a compilation of my original
research work and that it has not been presented for any other
qualification, anywhere. Information from the works of others (published
and unpublished) and their contributions have been duly
acknowledged.
SADIKU, SULEIMAN OMEIZA EKU
Institute of Aquaculture
University of Stirling
Stirling-Scotland

ACKNOWLEDGEMENTS
I wish to express my appreciation to my supervisor - Dr Kim Jauncey
for his relentless effort, guidance, support and cooperation to see the
research through, and painstaking reviewing and editing of this
compilation. I am equally grateful to the Institute administration for
their support and cooperation. The entire study programme was
made possible by the sponsorship of the Association of
Commonwealth Universities administered by the British Council and
the study leave granted by my employer. I am thankful to ACU,
London; The British Council, Manchester UK and Kaduna-Nigeria andi
my employer, Federal University of Technology, Minna-Nigeria.
The technical team contribution to this research is hereby
acknowledged. Mr Allan Porter was very helpful and cooperative with
all the laboratory analyses. Mr Keith Ranson and Mr Willie Hamilton,
both of the Tropical Aquarium, assisted greatly in providing the
systems and fishes to work with. Mr Billy Struthers assisted in mineral
determination and made available facilities in the Water Quality
Laboratory. The cooperation of Marie Thrush and Debbie Wright of
Histology Laboratory, and Dr Ralf Krueger
V
(visiting postdoctorate from Germany) made the histological
preparations possible. Mr Tom Turnbull spared his time for the
diagnostic examination of the prepared slides. Mr lain Elliott was
helpful in the photographic preparations.
Most of the research supplies came through the store with their able
and cooperative staff - Mrs Betty Stenhouse, Mr Charlie Harrower and
Mrs Jane Louis. Soybean flour and poultry meat meal were donated
by Dr Viv Crampton of Ewos UK ltd, Bathgate and Chettles UK ltd,
Nothingham respectively. Correspondence and research
communication were facilitated by the staff of the General Office -
Mrs Sheila Frize and Ms Tina Cochrane. The university library staff,
particularly the science librarian, assisted with training in the use of
library data bases. I am grateful to them all for their priceless
contribution.
My colleagues were very friendly and I enjoyed their cooperation.
Their criticisms and suggestions were helpful. Notable among these
were Dr Dapo Fagbenro, Dr Musa Adam, Dr M. Das, Dr Ali Nasir and
Mr Sedat Karayucel just to mention a few. Finally, my family/parents
have been very patient and enduring. They gave me ali their love
and kindness with their goodwill messages. I thank you all friends and
well wishers.
TABLE OF CONTENTS
Page No.
.iv
.xiv
.xxiii
.xxvii
.xxxiii
.xxxiv
CHAPT. 1:ij
GENERAL INTRODUCTION
1.0 Introduction . . . . . .1
1.1 Aquaculture Production .5
1.2 Aquaculture in Africa . . . . .6
1.3 Aquaculture in Nigeria . . . . .8
1.4 Aquaculture Feeds and Feedstuffs . .11
1.5 Fishmeal in Aquaculture .12
1.6 Soybean Products in Aquaculture .14
1.7 Poultry Products and By-Products
in aquaculture . . . . . .17
1.8 Objectives . . . . . . .18
Title
Acknowledgements
List of Tables
List of Figures
List of Plates
List of Appendices.
Abstracts
CHAPT. 2: GENERAL LITERATURE REVIEW
2.0 Introduction.
2.1 Soybean Products and Other
Vegetable Proteins in Aquaculture
2.1.1 Nutritive Value of Soybean Meal
2.1.2 Utilisation of Soybean Meal
in Aquaculture Feeds
2.2 Antinutritional Factors jn Soybean
Products and Vegetable Products
2.2.1 Trypsin Inhibitor
2.2.2 » Phytic Acid . . . .
2.2.3 Soybean Lectin (Haemaglutinin)
2.2.4 Miscellaneous Antinutritional
Factors in Soybean
2.3 Poultry Products and By-products
in Aquaculture Feeds
2.3.1 Nutritive Value of Poultry
Products and By-products
2.3.2 Utilisation of Poultry Products and
By-products in Aquaculture Feeds
2.4 Antinutritional Factors and Toxic
Substances in Poultry Products
and By-products .
2.4.1 Naturally Occuring
2.4.2 Exogenous Sources
2.5 Utilisation of Soybean Flour-Poultry
Meat Meal Blends In Aquaculture Feeds.
2.6 Tilapia and Catfish Feed and
Nutrient Requirements .
2.7 Hypotheses . . . . .
CHAPT. 3: GENERAL MATERIALS AND METHODS
3.1 4 Experimental Systems
3.1.1 ! Digestibility System
3.1.2 Feeding Trial System
3.2 Experimental Designs
3.2.1 Completely Randomised Block Design
3.2.2 Factorial Design . . . .
3.3 Experimental Fishes
3.3.1 Breeding and Rearing of Oreochromis
nilotlcus . . . . .
3.3.2 Breeding and Rearing of Clarias
ga rie p in u s ..........................................
3.4 Experimental Diets
3.4.1 Diet Formulation . . . .
ix
3.4.2 Diet Preparation .
3.5 Experimental Operation .
3.5.1 Fish Husbandry
3.5.2 Water Quality Management
3.6 Experimental Analyses .
3.6.1 Chemical Analysis
3.6.2 Biological Evaluation
3.7 Statistical analysis .
.60
.61
.61
.63
.65
.65
.70
.71
CHAPT. 4: NUTRITIVE VALUE OF FEEDSTUFFS
4.1 f Biochemical Evaluation of Soybean Flour . .74
4.1.2 Introduction . .74
4.1.3 Materials and Methods . . . . . .76
4.1.4 Results and Discussion . .80
4.2 Digestibility of Soybean Flour, Poultry
Meat Meal and Wheat Flour in Oreochromis
niloticus and Clarias gariepinus. . . . .83
4.2.1 Introduction. . . . . . . .84
4.2.2 Materials and Methods. . . . . . .85
4.2.3 Results.....................................................................................88
4.2.4 Discussion. . . . . . . . .92
X
CHAPT. 5: DIGESTIBILITY AND APPARENT AMINO ACID AVAILABILITY OF
SOYBEAN FLOUR-POULTRY MEAT MEAL BLEND BASED DIETS
FOR OREOCHROMIS NILOTICUS AND CLARIAS GARIEPINUS
5.1 Introduction . . . . . 95
5.2 Fingerlings . . . . . .96
5.2.1 Materials and Methods . .96
5.2.2 Results and Discussion . .99
5.3 Juveniles. . . . . . .109
5.3.1 Materials and Methods . .109
5.3.2 Results and Discussion . .110
CHAPT. 6: SOYBEAN FLOUR-POULTRY MEAT MEAL BLEND AS DIETARY
PROTEIN SOURCE IN PRACTICAL DIETS OF OREOCHROMIS
NILOTICUS AND CLARIAS GARIEPINUS
6.1 Introduction . . . .117
6.2 Materials and Methods . . . . . .118
6.3 Results. . . . . . . . .120
6.3.1 Experiment 1 Oreochromis nllotlcus. . . .120
6.3.2 Experiment 2 Ciarias garlepinus. . .124
6.4 Discussion. . . . . . . . .128
CHAPT. 7: SUBSTITUTION OF FISHMEAL WITH SOYBEAN FLOUR-POULTRY
MEAT MEAL BLEND IN PRACTICAL DIETS FOR
OREOCHROMIS NILOTICUS AND CLARIAS GARIEPINUS.
7.1 Introduction . .131
7.2 Materials and Methods . . 132
7.3 Results . .135
7.3.1 Experiment! Oreochromis niloticus .135
7.3.2 Experiment 2 Clarias garieplnus. .144
CHAPT. 8: SUPPLEMENTATION OF SOYBEAN FLOUR-POULTRY MEAT
MEAL BLEND BASED DIETS WITH DL-METHIONINE TOi* IMPROVE NUTRIENT UTILISATION IN OREOCHROMIS
NILOTICUS AND CLARIAS GARIEPINUS
8.1 Introduction . .153
8.2 Materials and Methods . . .155
8.3 Results . . . . . .158
8.3.1 Experiment 1 Oreochromis niloticus .158
8.3.2 Experiment 2 Clarias gariepinus . .166
8.4 Discussion . . . . .174
CHAPT. 9: EFFECT OF MINERAL PREMIX RECONSTITUTION OF SOYBEAN
FLOUR-POULTRY MEAT MEAL BLEND BASED DIETS IN
OREOCHROMIS NILOTICUS AND CLARIAS GARIEPINUS
9.1 Introduction .178
9.2 Materials and Methods . . . . . 180
9.3 Results and Discussion . . . . .183
9.3.1 Experiment 1 Oreochromis niloticus . .183
9.3.2 Experiment 2 Clarias gariepinus. .191
CHAPT. 10: EFFECTS OF DETOXIFICATION BY AUTOCLAVING RAW *J SOYBEAN FLOUR AND BLENDING WITH POULTRY MEAT
MEAL ON THEIR UTILISATION IN PRACTICAL DIETS OF
OREOCHROMIS NILOTICUS AND CLARIAS GARIEPINUS
10.1 Introduction . . . . . .200
10.2 Materials and Methods . . . . .202
10.3 Results . . . . . . .206
10.3.1 Experiment 1 Oreochromis niloticus. . .206
10.3.2 Experiment 2 Clarias gariepinus. . .214
10.4 Discussion. . . . . . . .224
CHAPT. 11: AQUACULTURE NUTRITION AND WASTE GENERATION
POTENTIAL OF AQUACULTURE OPERATION
11.1 Introduction . . . . . .227
11.2 Materials and Methods . . . . .229
11.3 Results and Discussion . . . . .230
CHAPT. 12: GENERAL DISCUSSION................................................234
CHAPT. 13: CONCLUSION AND RECOMMENDATION. . .243
i>
CHAPT. 14: REFERENCES................................................................ 247
Table No.
2.1
2.2
2.3
2.4
2.5
2.6
»
3.1
4.1
4.2
4.3
xiv
LIST OF TABLES
Page No.
Essential Amino Acid Composition of Some
Plant Seed Meals. . . . . .24
Fatty Acid Composition of the Triglyceride
Fraction of Some Plant Oils. . . . .24
Nutrient Composition of Soybean Products. .26
Mineral and vitamin Contents of Soybean. .28
Proximate Composition of Selected Poultry
Products and By-products. . . . .39
Nutrient Requirements of Tilapia and
Catfish Grower Diets . . . . .47
Percentage Proximate Composition of
Feedstuffs . . . .81
Level of Trypsin Inhibitor (Tl) Activity,
Phytate Phosphorus and Available Lysine in
the Soybean Flour (SF) Used in Experimental
Diets . . . . . . . .82
Proximate Composition (% Dry Matter)
of Feed Ingredients . . .86
Ingredients and Proximate Composition
of Reference and Test Diets Used in
Feedstuff Digestibility Study . . .87
Total Dry Matter, Protein, Lipid and
Ash digestibility Coefficients of SF,
PMM and WF Fed to Oreochromis niloticus.
Total Dry Matter, Protein, Lipid and
Ash digestibility Coefficients of SF,
PMM and WF Fed to Clarias gariepinus
Level of Inclusion of Ingredients in
the Soybean Flour-Poultry Meat Meal
Biend Based Diets of Oreochromis
niloticus and the Proximate Composition
of the Diets . . . . . .
Amino-Acid availability of soybean Flour
-Poultry Meat Meal Blend Based Diets
(Diets i-VI) in Oreochromis niloticus
Fingerlings . . . . . .
Essential Amino Acids in Soybean flour
-Poultry Meat Meal Blend Based Diets and
their requirements of Oreochromis niloticus
in Relation to their Limiting Potential.
Amino-Acid availability of soybean Flour
-Poultry Meat Meal Blend Based Diets
(Diets l-VI) in Clarias gariepinus
Fingerlings. . . . . . .
xvi
5.5 Essential Amino Acids in Soybean flour
-Poultry Meat Meal Blend Based Diets and
their requirements of Clarias gariepinus
in Relation to their Limiting Potential .
5.6 Amino-Acid availability of soybean Flour
-Poultry Meat Meal Blend Based Diets
(Diets l-VI) in Oreochromis niloticus
Juveniles . . . . .
5.7 Amino-Acid availability of soybean Flour
-Poultry Meat Meal Blend Based Diets
(Diets l-VI) in Clarias gariepinus
Juveniles . . . . .
6.1 Percentage Composition and Proximate
Nutrient Content of Diets Fed to
Oreochromis niloticus and Clarias
gariepinus . . . . .
6.2 Evaluation of soybean Flour-Poultry
Meat Meal Blend Utilisation in Practical
Diets of Oreochromis niloticus .
6.3 Amino Acid Composition of Soybean Flour
-Poultry Meat Meal blend Based Diets Fed
to Fingerlings of Oreochromis niloticus
Presented Against its Requirements .
.108
.113
.115
.119
.120
.123
xvii
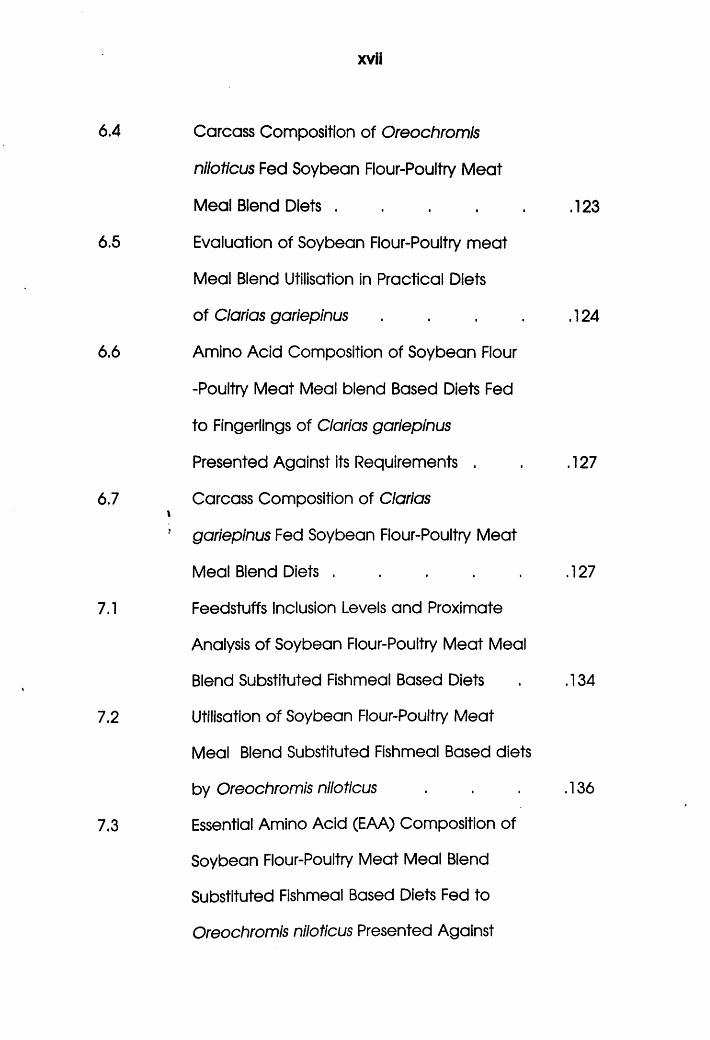
6.4 Carcass Composition of Oreochromis
niloticus Fed Soybean Flour-Poultry Meat
Meal Blend Diets . . . . .
6.5 Evaluation of Soybean Flour-Poultry meat
Meal Blend Utilisation in Practical Diets
of Clarias gariepinus . . . .
6.6 Amino Acid Composition of Soybean Flour
-Poultry Meat Meal blend Based Diets Fed
to Fingerlings of Clarias gariepinus
Presented Against its Requirements .
6.7 Carcass Composition of ClariastJ gariepinus Fed Soybean Flour-Poultry Meat
Meal Blend Diets . . . . .
7.1 Feedstuffs Inclusion Levels and Proximate
Analysis of Soybean Flour-Poultry Meat Meal
Blend Substituted Fishmeal Based Diets
7.2 Utilisation of Soybean Flour-Poultry Meat
Meal Blend Substituted Fishmeal Based diets
by Oreochromis niloticus
7.3 Essential Amino Acid (EAA) Composition of
Soybean Flour-Poultry Meat Meal Blend
Substituted Fishmeal Based Diets Fed to
Oreochromis niloticus Presented Against
.123
.124
.127
.127
.134
.136
xviii
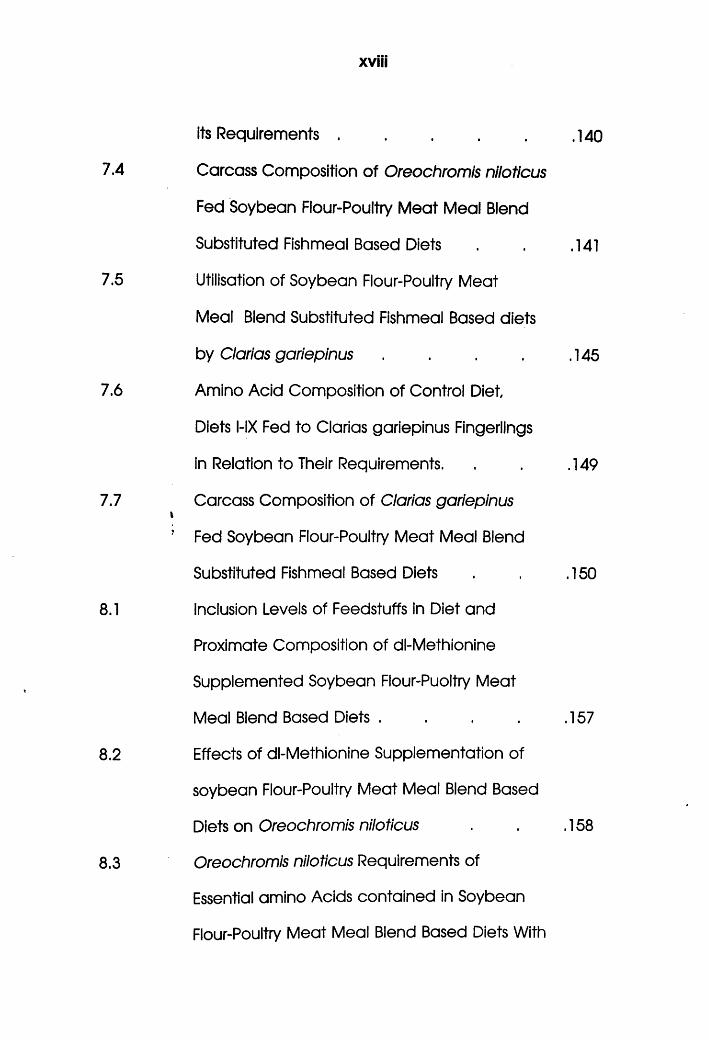
its Requirements . . . . .
7.4 Carcass Composition of Oreochromis niloticus
Fed Soybean Flour-Pouitry Meat Meal Blend
Substituted Fishmeal Based Diets
7.5 Utilisation of Soybean Flour-Poultry Meat
Meal Biend Substituted Fishmeal Based diets
by Clarias gariepinus . . . .
7.6 Amino Acid Composition of Control Diet
Diets MX Fed to Clarias gariepinus Fingerlings
in Relation to Their Requirements.
7.7 Carcass Composition of Clarias gariepinusiJ Fed Soybean Flour-Poultry Meat Meal Blend
Substituted Fishmeal Based Diets
8.1 Inclusion Levels of Feedstuffs in Diet and
Proximate Composition of dl-Methionine
Supplemented Soybean Flour-Puoltry Meat
Meal Blend Based Diets . . . .
8.2 Effects of dl-Methionine Supplementation of
soybean Flour-Poultry Meat Meal Blend Based
Diets on Oreochromis niloticus
8.3 Oreochromis niloticus Requirements of
Essential amino Acids contained in Soybean
Flour-Poultry Meat Meal Blend Based Diets With
.140
.141
.145
.149
.150
.157
.158
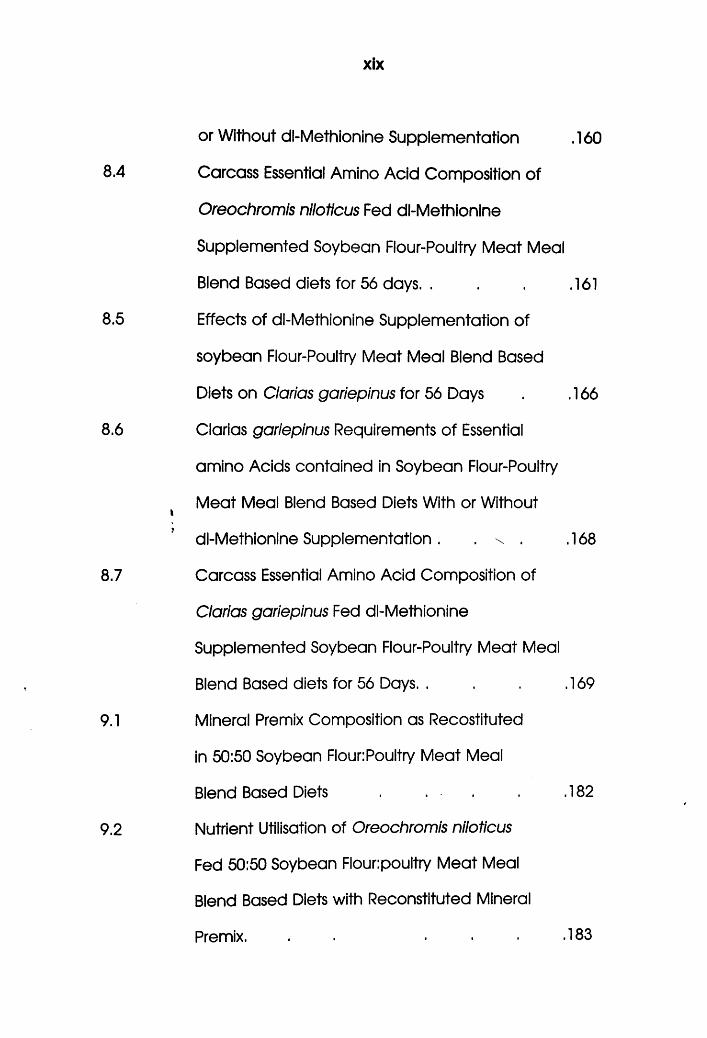
or Without dl-Methionine Supplementation . 160
Carcass Essential Amino Acid Composition of
Oreochromis niloticus Fed dl-Methionine
Supplemented Soybean Flour-Poultry Meat Meal
Blend Based diets for 56 days. . . . .161
Effects of dl-Methionine Supplementation of
soybean Flour-Poultry Meat Meal Blend Based
Diets on Clarias gariepinus for 56 Days . . 166
Clarias gariepinus Requirements of Essential
amino Acids contained in Soybean Flour-Poultry
Meat Meal Blend Based Diets With or Without
dl-Methionine Supplementation . . \ . . 168
Carcass Essential Amino Acid Composition of
Ciarias gariepinus Fed dl-Methionine
Supplemented Soybean Flour-Poultry Meat Meal
Blend Based diets for 56 Days. . . . 169
Mineral Premix Composition as Recostituted
in 50:50 Soybean Flour:Poultry Meat Meal
Blend Based Diets . . . 182
Nutrient Utilisation of Oreochromis niloticus
Fed 50:50 Soybean Flour:poultry Meat Meal
Blend Based Diets with Reconstituted Mineral
Premix. . . . . .183
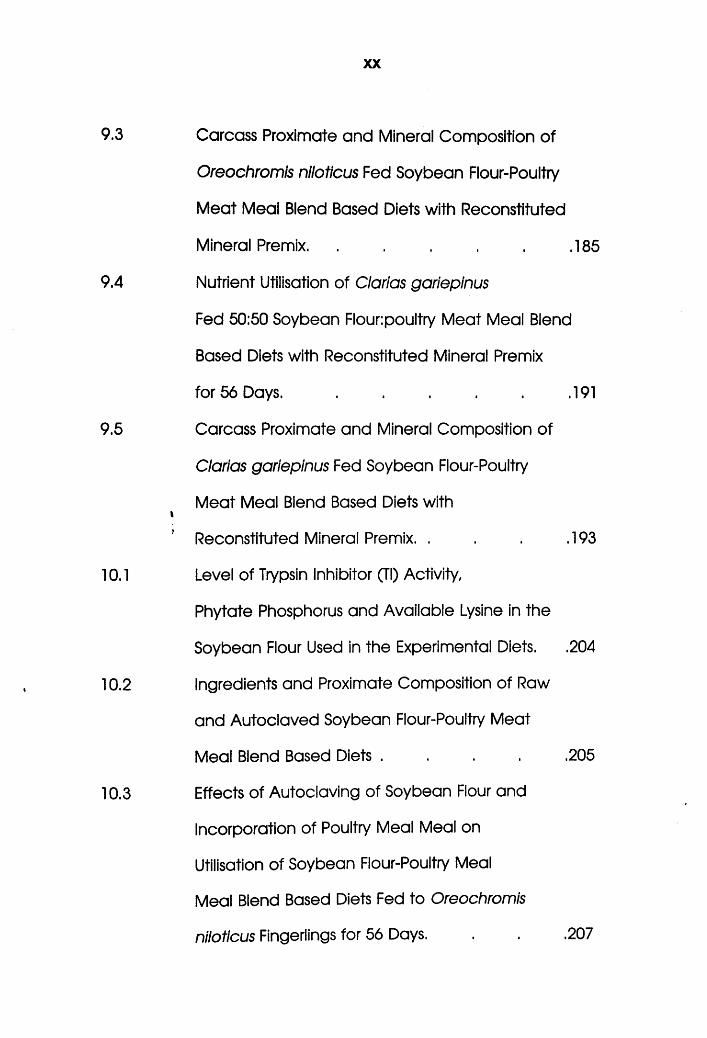
Carcass Proximate and Mineral Composition of
Oreochromis niloticus Fed Soybean Flour-Poultry
Meat Meal Blend Based Diets with Reconstituted
Mineral Premix. . .185
Nutrient Utilisation of Clarias gariepinus
Fed 50:50 Soybean Flour:poultry Meat Meal Blend
Based Diets with Reconstituted Mineral Premix
for 56 Days. . . . . . .191
Carcass Proximate and Mineral Composition of
Clarias gariepinus Fed Soybean Flour-Poultry
Meat Meal Blend Based Diets with
Reconstituted Mineral Premix. . . . .193
Level of Trypsin Inhibitor (Tl) Activity,
Phytate Phosphorus and Available Lysine in the
Soybean Flour Used in the Experimental Diets. .204
Ingredients and Proximate Composition of Raw
and Autoclaved Soybean Flour-Poultry Meat
Meal Blend Based Diets . . . . .205
Effects of Autoclaving of Soybean Flour and
Incorporation of Poultry Meal Meal on
Utilisation of Soybean Flour-Poultry Meal
Meal Blend Based Diets Fed to Oreochromis
niloticus Fingerlings for 56 Days. . . .207
xxi
10.4
10.5
10.6
10.7
10.8
11.1a
Gonadosomatic and Hepatosomatic Indices of
Oreochromis niloticus Fed Raw and Autoclaved
Soybean Flour-Poultry Meat Meal Blend Based
Diets. . . . . . . .
Carcass Composition of Oreochromis niloticus
Fed Raw and Autoclaved Soybean Flour-Poultry
Meat Meal Blend Based Diets for 56 Days .
Effects of Autoclaving of Soybean Flour and
Incorporation of Poultry Meal Meal on
Utilisation of Soybean Flour-Poultry Meal
i Meal Blend Based Diets Fed to Clarias
gariepinus Fingerlings for 56 Days.
Gonadosomatic and Hepatosomatic Indices of
Ciarias gariepinus Fed Raw and Autoclaved
Soybean Flour-Poultry Meat Meal Blend Based
Diets for 56 Days for 56 Days . .
Carcass Composition of Ciarias gariepinus
Fed Raw and Autoclaved Soybean Flour-Poultry
Meat Meal Blend Based Diets .
Daily Individual Protein Intake and Digestion
in Oreochromis niloticus Fed Soybean Flour-
Poultry Meat Meal Blend Based Diets
.209
.210
.215
.217
.220
.232
xxii
11.lb
11.2a
11.2b
Daily Individual Protein Intake and Digestion
in Clarias gariepinus Fed Soybean Flour-
Poultry Meat Meal Blend Based Diets . .232
Individual Fish Carcass Protein and Protein
Retention in Oreochromis niloticus Fed Soybean
Flour-Poultry Meat Meal Blend Based Diets . .233
Individual Fish Carcass Protein and Protein
Retention in Clarias gariepinus Fed Soybean
Fbur-Poultry Meat Meal Blend Based Diets . .233
xxiii
Figure No.
2.2.1
2.2.2
3.1
3.2
4.1
4.2
5.1a
5.1b
5.2
5.3
LIST OF FIGURES
Page No.
Enzyme-Substrate-lnhibitor Interaction. .34
Structure of Phytic Acid. . . . .36
Digestibility System . . . . .54
Feeding Trial System . . . . .56
Digestibility of Soybean Flour, Poultry
Meat Meal and Wheat Flour in Oreochromis
niloticus . . . . . . .89
Digestibility of Soybean Flour, Poultry
Meat Meal and Wheat Flour in Clarias
gariepinus . . . . . . .91
Water Stability of Soybean Flour-Poultry
Meat Meal Blend Based diets-Beaker Method .100
Water Stability of Soybean Flour-Poultry
Meat Meal Blend Based diets-Net Immersion
Method . . . . . . .100
Nutrient Digestibility of SF-PMM Blend Based
Diets Fed to Oreochromis niloticus Fingerlings. . 102
Nutrient Digestibility of SF-PMM Blend Based
Diets Fed to Clarias gariepinus Fingerlings. . .106
xxiv
5.4 Nutrient Digestibility of SF-PMM Blend Based
Diets Fed to Oreochromis niloticus Juveniles.
5.5 Nutrient Digestibility of SF-PMM Biend Based
Diets Fed to Clarias gariepinus Juveniles. .
6.1 Growth Response of Oreochromis niloticus
Fed Soybean Flour-Poultry Meat Meal Based
Diets. . . . . . . .
6.2 Growth Response of Clarias gariepinus
Fed Soybean Flour-Poultry Meat Meal Based
Diets. . . . . . . .
i
7.1 Growth Responses of Oreochromis niloticus
Fed Fishmeal Based Diets with Soybean Flour:
Poultry Meat Meal Blend (a 25:75; b, 50:50;
c, 75:25) Substitution of Fishmeal
7.2 Combined Growth Response of Oreochromis
niloticus Fed Fishmeal Based Diets with
Soybean Flour-Poultry Meat Meal Blend
Substitution of Fishmeal . . . .
7.3 Growth Responses of Clarias gariepinus
Fed Fishmeal Based Diets with Soybean Flour:
Poultry Meat Meal Blend (a 25:75; b, 50:50;
c, 75:25) Substitution of Fishmeal
.111
.114
.121
.125
.137
.138
.146
XXV
7.4 Combined Growth Response of Clarlas
gariepinus Fed Fishmeal Based Diets with
Soybean Flour-Poultry Meat Meal Blend
Substitution of Fishmeal. . . . .
8.1 Growth Response of Oreochromls niloticus
Fed dl-Methionine Supplemented SF-PMM
Blend Based Diets. . . . .
8.2 Relationship Between Dietary and Oreochromis
Carcass Essential Amino Acids.
8.3 Methionine Level in the Plasma of Oreochromis
niloticus Fed dl-Methionine Supplemented andi’ Unsupplemented Soybean Flour-Poultry Meat
Meal Blend Based Diets . . . .
8.4 Growth Response of Clarias gariepnus Fed
dl-Methionine Supplemented SF-PMM Blend
Based Di et s. . . . . .
8.5 Relationship Between Dietary and Oreochromis
Carcass Essential Amino Acids.
8.6 Methionine Level in the Plasma of Clarias
gariepinus Fed dl-Methionine Supplemented
and Unsupplemented Soybean Flour-Poultry
Meat Meal Blend Based Diets.
9.1 Growth Response of Oreochromis niloticus Fed
Mineral Reconstituted Soybean Flour-Poultry
.147
.159
.162
.162
.167
.170
.170
xxvi
Meat Meal Blend Based Diets.
9.2 Relationship Between Dietary and Carcass
Phosphorus of Oreochromis niloticus Fed
Mineral Reconstituted Soybean Flour-Poultry
Meat Meal Blend Based Diets .
9.3 Growth Response of Clarias gariepinus Fed
Mineral Reconstituted Soybean Flour-Poultry
Meat Meal Blend Based diets .
9.4a Relationship Between Dietary and Carcass
Phosphorus of Clarias gariepinus Fed
Mineral Reconstituted Soybean Flour-Poultry
Meat Meal Blend Based Diets .
9.4b Relationship Between Dietary and Carcass
Calcium of Clarias gariepinus Fed
Mineral Reconstituted Soybean Flour-Poultry
Meat Meal Blend Based Diets .
10.1 Growth Response of Oreochromis niloticus Fed
Raw and Toasted Soybean Flour-Poultry Meat
Meal Blend Based Diets . . . .
10.2 Growth Response of Clarias gariepinus Fed
Raw and Toasted Soybean Flour-Poultry Meat
Meal Blend Based Diets . . . .
.184
.187
.192
.195
.195
.208
.216
xxvii
Plate No.
8.1a
8.1b
t
8.1c
8.Id
LIST OF PLATES
Page No.
Normal Gill of Oreochromis niloticus
Fed Soybean Flour-Poultry Meat Meal
Blend Based Diets Containing Low Poultry
Meat Meal or High Soybean Flour . . ,164
Gill of Oreochromis niloticus Fed Soybean
Flour-Poultry Meat Meal Blend Based Diets
Containing High Poultry Meat Meal or Low
Soybean Flour, Showing Hypertrophy
(1° Gill Lamella) . . . .164
Normal Liver with Slight Vacuolation of the
Hepatocytes in Oreochromis niloticus Fed
dl-Methionine supplemented and
Unsupplemented Soybean Flour-Poultry Meat
Meal Blend Based Diets Containing Low
Poultry Meat Meal (See Exocrine Pancreas
at the Centre). . . 165
Liver with Pronounced Vacuolation of the
Hepatocytes in Oreochromis niloticus Fed
dl-Methionine Supplemented and Unsupplemented
Soybean Flour-Poultry Meat Meal Blend Based
xxviii
8.2a
8.2b
8.2c
8.2d
Diets Containing High Poultry Meat Meal . .165
Gill Lamellae of Clarias gariepinus
Fed Soybean Flour-Poultry Meat Meal
Blend Based Diets Containing Low Poultry
Meat Meal or High Soybean Flour . . .172
Gill Lamellae of Clarias gariepinus
Fed Soybean Flour-Poultry Meat Meal
Blend Based Diets Containing High Poultry
Meat Meal or Low Soybean Flour .172
Normal Liver with Slight Vacuolation of the
Hepatocytes in Clarias gariepinus Fed dl-
Methionine supplemented and Unsupplemented
Soybean Flour-Poultry Meat Meal Blend Based
Diets Containing High Poultry Meat Meal
(Notice Exocrine Pancreas at the Centre) . .173
Liver Showing Pronounced Vacoulation and
Lipid Deposition in the Hepatocytes of
Clarias gariepinus Fed dl-Methionine
supplemented and Unsupplemented
Soybean Flour-Poultry Meat Meal Blend
Based Diets Containing High Poultry
Meat Meal . • • *173
xxix
9.1a
9.1b
9.1c
9.2a
9.2b
9.2c
10.1a
Vertebral Column of Oreochromis niloticus
Fed Mineral reconstituted Soybean
Flour-Poultry Meat Meal Blend Based
Diets. . . . . . . .
Liver of Oreochromis niloticus Fed Mineral
Reconstituted Soybean Flour-Poultry Meat Meal
Blend Based Diets . . . .
Kidney of Oreochromis niloticus Fed Mineral
Reconstituted Soybean Flour-Poultry Meat Meal
Blend Based Diets . . . .
Vertebral Column of Clarias gariepinus Fed
Mineral Reconstituted Soybean Flour-Poultry
Meat Meal Blend Based diets .
Liver of Clarias gariepinus Fed Mineral
Reconstituted Soybean Flour-Poultry Meat
Meal Blend Based Diets (Notice the Exocrine
Pancreas to the Left) . . . .
Kidney of Ciarias gariepinus Fed Mineral
Reconstituted Soybean Flour-Poultry Meat
Meal Blend Based Diets (Notice the Well
Developed Interstitial Tissue). .
Normal Gill of Oreochromis niloticus Fed
Soybean Flour-Poultry Meat Meal Blend
.189
.189
.190
.197
.197
.198
XXX
10.1b
10.2a
10.2b
10.3a
Based Diets Containing Autoclaved
Soybean Flour. . . . . .
Gill of Oreochromis niloticus Fed
Soybean Flour-Poultry Meat Meal
Blend Based Diets Containing Raw
Soybean Flour (Notice
Hypertrophy of the Lamellae) .
Liver of Oreochromis niloticus Fed Soybean
Flour-Poultry Meat Meal Blend Based Diets
Containing Autoclaved Soybean Flour Showing
Relatively Pronounced Vacuolation of the
Hepatocytes (See Exocrine Pancreas at the
Centre) . . . . . .
Liver of Oreochromis niloticus Fed Soybean
Flour-Poultry Meat Meal Blend Based Diets
Containing Autoclaved Soybean Flour Showing
Slight Vacuolation of the Hepatocytes
(Notice the Exocrine Pancreas at the
Central Lower Half) . . . .
Testis of Clarias gariepinus Fed Soybean
Flour-Poultry Meat Meal Blend Based Diets
Containing Autoclaved Soybean Flour (Notice
Lumen of Seminiferous Tubules Containing
.212
.212
.213
.213
xxxi
Spermatogenic Cells)................................................ 218
10.3b Testis of Clarias gariepinus Fed Soybean
Flour-Poultry Meat Meal Blend Based Diets
Containing Raw Soybean Flour Showing Lumen
and Spermatogenic Cells. . . . .218
10.4a Ovary of Clarias gariepinus Fed Soybean
Flour-Poultry Meat Meal Blend Based Diets
Containing Autoclaved Soybean Flour (Notice
Oogenic Cells at Different Stages) . .219
10.4b Ovary of Clarias gariepinus Fed Soybean
Flour-Poultry Meat Meal Blend Based Dietsi, Containing Raw Soybean Flour (Notice Oogenic
Cells at Different Stages) . . . .219
10.5a Gills of Clarias gariepinus Fed Soybean
Flour-Poultry Meat Meal Blend Based Diets
Containing Autoclaved Soybean Flour. . .222
10.5b Gills of Clarias gariepinus Fed Soybean
Flour-Poultry Meat Meal Blend Based Diets
Containing Raw Soybean Flour Showing
Hypertrophy of the Lamellae. . . . .222
10.6a Liver of Clarias gariepinus Fed Soybean
Flour-Poultry Meat Meal Blend Based Diets
Containing Autoclaved Soybean Flour Showing
xxxii
Relatively Pronounced Vacuolation of the
Hepatocytes . . . . . .223
10.6b Liver of Clarios gariepinus Fed Soybean
Flour-Poultry Meat Meal Blend Based Diets
Containing Autoclaved Soybean Flour Showing
Slight Vacuolation of the Hepatocytes . .223
xxxiii
LIST OF APPENDICES
Appendix No. . . . . .
1 Comparison of the Micro-kjeldahl and
CHNSO Methods of Protein Determination
of the Feedstuffs. .
2 List of Conference Papers and Publications
from the Research.
.Page No.
.266
.266
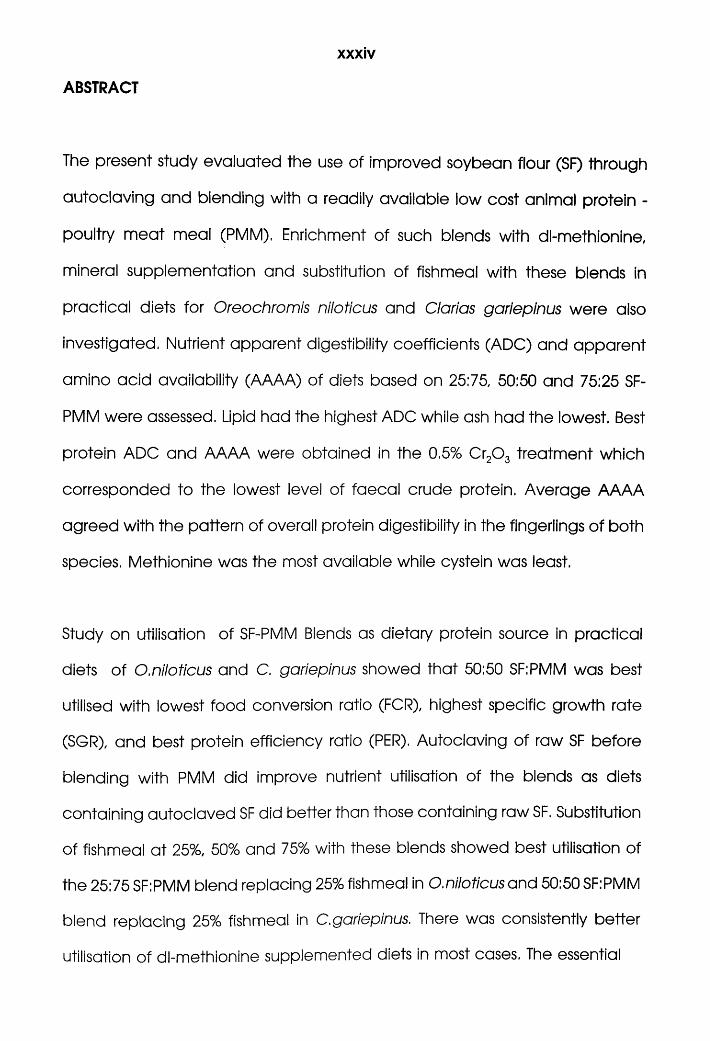
ABSTRACT
xxxiv
The present study evaluated the use of improved soybean flour (SF) through
autoclaving and blending with a readily available low cost animal protein -
poultry meat meal (PMM). Enrichment of such blends with dl-methionine,
mineral supplementation and substitution of fishmeal with these blends in
practical diets for Oreochromis niloticus and Clorias gariepinus were also
investigated. Nutrient apparent digestibility coefficients (ADC) and apparent
amino acid availability (AAAA) of diets based on 25:75, 50:50 and 75:25 SF-
PMM were assessed. Lipid had the highest ADC while ash had the lowest. Best
protein ADC and AAAA were obtained in the 0.5% Cr20 3 treatment which
corresponded to the lowest level of faecal crude protein. Average AAAA
agreed with the pattern of overall protein digestibility in the fingerlings of both
species. Methionine was the most available while cystein was least.
Study on utilisation of SF-PMM Blends as dietary protein source in practical
diets of O.niloticus and C. gariepinus showed that 50:50 SF:PMM was best
utilised with lowest food conversion ratio (FCR), highest specific growth rate
(SGR), and best protein efficiency ratio (PER). Autoclaving of raw SF before
blending with PMM did improve nutrient utilisation of the blends as diets
containing autoclaved SF did better than those containing raw SF. Substitution
of fishmeal at 25%, 50% and 75% with these blends showed best utilisation of
the 25:75 SF:PMM blend replacing 25% fishmeal in O.niloticusand 50:50 SF:PMM
blend replacing 25% fishmeal in C.gariepinus. There was consistently better
utilisation of dl-methionine supplemented diets in most cases. The essential
amino acid profile in the diet correlated positively with that of the carcass.
(P<0.05). Reconstitution of mineral premix in 50:50 blend based diet did not
affect nutrient utilisation (p>0.05). However, there was significant correlation of
dietary and carcass phosphorus in both species and that of calcium only in C.
gariepinus (P<0.05). In conclusion, there was enhanced utilisation of SF by both
fish species with these treatments.
• , ' - v . . ' ;
CHAPTER ONE
INTRODUCTION
»
1
1.0 Introduction
Fish has long been valued as a source of animal protein for human
nutrition. Consumption of fish generally cuts across ecological, socio
economic, cultural and religious boundaries, leading to its
predominant role as an animal protein. Presently fish accounts for
over 50% of total animal protein consumed in most countries of the
world (FAO, 1991a). Fish is a first class animal protein and relatively the
cheapest source (Osajuyigbe, 1981).
Present world per capita seafood consumption of fish stands at
19kg/year. The world fisheries harvest kept pace with growing
population demand for seafood, but now we are approaching the
limits of the wild fisheries. Landings from the world's capture fisheries
are expected to plateau at 100 million mt by the year 2000, and after
that the gap between supply and demand will have to be filled by
aquaculture (Chamberlain, 1993).
Aquaculture has been conducted since pre-historic times and stood
at 15.3 million mt in 1990 (De Silva and Anderson, 1995). Presently, it
accounts for 20% of the worldwide fish production and is expected to
reach 25% by the year 2000 (Ratafia, 1995). With its growth rate of
over 5% annually, production from aquaculture by the year 2000 is
projected at 20 million mt. This still leaves a negative balance
2
between consumption (demand) and supply of seafood
(Chamberlain, 1993). Intensification of aquaculture to increase the
production capacity of our aquacultural resources to match
increasing seafood demand seems a solution. It entails increasing
primary, intermediate and terminal productivity capacities of our
natural aquatic ecosystem and creation of productive artificial
aquatic ecosystems through proper planning, development and
management.
A major determinant of successful intensification of aquaculture is fish
feed. It accounts for a major part of the total operation cost of an
average fish farm (Rumsey, 1993) - of 30-70%. Fish species, unlike
domesticated terrestial farm animals are ectotherms with no energy
requirement for endothermy. Warm water fishes require 30-56% protein
in their diets (Urn and Dominy, 1993). Traditionally, animal protein
sources have been the major ingredients of fish feed, particularly
fishmeal (Urn and Dominy, 1991). Ironically, fishmeal is one of the most
expensive ingredients in prepared fish diets. In addition, fishmeal
supply is likely to be declining by 5% annually between 1900 and 2000,
and this can no longer meet the demand from the expanding fish
feed industry (Urn and Dominy, 1993; Rumsey, 1993). Therefore, there is
the need to check overdependence on fishmeal through its reduction
in fish feeds and finding suitable replacements. Replacement with
available and cheaper vegetable proteins has been the goal of
3
aquaculture (Wee and Wang, 1987; Linn and Dominy, 1989; Ng and
Wee, 1989).
Plant proteins such as soybean meal, peanut meal, cottonseed meal,
sunflower seed meal, rapeseed meal and Leucaena leaf meal have
been identified as possible alternatives to fishmeal. However, high
plant protein levels in fish diets have resulted in retarded fish growth
and poorer feed efficiency compared to fishmeal containing diets
(Urn and Dominy, 1991). This has made it seemingly impossible to
replace animal protein totally without compromising the performance
of the fish. Therefore, an economically and nutritionally viable fish diet
will require a good combination of both plant and animal protein.
Of the plant proteins, soybean meal is the most promising. Presently, it
is the major protein source in catfish diet in the United States. It has
been postulated that an economic improvement in soybean meal
based diets for catfish could be achieved by the incorporation of
lower cost animal protein than fishmeal (Mohsen and Lovell, 1990).
Whether there would be a nutritional improvement in such an
approach needs to be studied. This study is therefore intended to
investigate plant-animal protein blend nutritional improvement and its
utilisation in the diets of Oreochromis niloticus and Clarias gariepinus,
detail of which is provided in section 1.8.
4
1.1 Aquaculture Production
On the basis of common usage with practical distinctions between
hunting and gathering on one hand and agriculture on the other,
aquaculture has been defined thus: "Aquaculture is the farming of
aquatic organisms, including fish, molluscs, crustaceans and aquatic
plants. Farming implies some form of intervention in the rearing
process to enhance production, such as regular stocking, feeding,
protection from predators, etc. Farming also implies individual or
corporate ownership of the stock being cultivated. For statistical
purposes, aquatic organisms which are harvested by an individual or
corporate body which has owned them throughout their rearing
period contribute to aquaculture, while aquatic organisms which are
exploitable by the public as a common property resource, with or
without appropriate licences, are the harvest of fisheries" (FAO,1994).
Aquacultural practice antedates recorded history as it was in place
as far back as 2798 B.C. in China with the culture of milkfish. It was not
until 475 B.C. that the first treatise on aquaculture written by Fan Lai
appeared (Chackroff, 1980) and since then much attention has been
given to aquaculture. It has fastly become a high-return enterprise
over the last two decades, spreading across countries with suitable
land and water resources. It has an annual growth rate of 8.7% and
this compares favourably with other animal and plant food
5
production increments of 1.7-3.3% and 1.7-3.8% respectively (Akiyama
1991). By continent current world aquaculture production is Asia, 85%;
Europe, 7-10%; Africa, <1%; South America, <1% and Oceania, <1%.
Over 100 countries from these regions are engaged in active
aquaculture and China is presently the world leading producer of
aquaculture commodities producing 7.2 million mt annually. By
species, carps topped the list with 5 million mt production. Tilapias
and catfishes accounted for 391,000 mt and 165,000 mt respectively
(FAO, 1992). The future challenges facing the aquaculture industry are
the development of environmentally sustainable management
practices, free of disease, pollution and global warming hazards
(Chamberlain, 1993).
1.2 Aquaculture in Africa
Aquaculture in Africa is a relatively new industry, presently of minor
importance but with the prospect of becoming a major one in the
future (FAO, 1991b). Aquaculture in Africa has an ancient history
dated as far back as 2500 BC in Egypt (Maar et al., 1966). Pond fish
culture in sub-Saharan Africa first started in Kenya in 1924 and later
spread to other parts of the continent ( Huisman, 1986; Jackson,
1988). Fish contributes about half of the animal protein intake in Africa
(FAO, 1991b). Capture fisheries has been the major source of domestic
fish production. However, slow growth of African capture fisheries has
6
been projected. This, coupled with the heightened interest of both
African government and donor agencies, has led to anticipation that
priority will be accorded to aquaculture in order to meet the ever
increasing fish protein demand in the continent (FAO, 1991b).
Aquaculture accounts for less than 10% of the total domestic fish
production in Africa (Satia, 1989) and only 0.1% of the total world
aquaculture production (FAO, 1991b). Annual aquaculture production
in sub-Saharan Africa in 1990 was estimated at 12,000 mt with Nigeria,
Zambia and Zimbabwe as the major producers (FAO, 1991b). Until
recently, African aquaculture practice has been at a subsistence
level to meet animal protein demand at individual and family levels
and has been dominated by small scale subsistence farming of tilapia
species (FAO, 1991b). The active participation of African government
and donor agencies, such as FAO, has brought the benefits of
modern aquaculture and aquacultural technology to expand the
scope of African aquaculture. Additional cultivatable species now
include clariid catfishes and exotic carps (Balarin and Hatton, 1979;
Vanden Boscche & Bernacsek, 1990) enhanced with acquisition of
artificial breeding know-how. Large scale aquaculture is now in
practice in Nigeria, Kenya, Zambia, Zimbabwe and Cote d'Ivoire
(Huisman, 1986; Kutty, 1986)
7
1.3 Aquaculture in Nigeria
Fish farming has been practised at a subsistence level in Nigeria for
generations using flood plains and tidal ponds. Presently, Nigerian
aquaculture production stands at 16,588 mt. However, the history of
modern aquaculture is a recent one. In 1951, the government of
Northern Nigeria started the construction of pilot fish farm a t Panyam.
At about the same time, the governments of Western and Eastern
Nigeria encouraged the construction of homestead fish ponds. FAO
responded to federal government requests to initiate the
development of brackish water fish culture in the Niger Delta area in
1965 and another project in Lagos in 1968. Cage culture was also
initiated by FAO in Kainji Lake due to a sharp decline in the
commercial catches from the lake from 28,638 mt in 1971 to 10,905 mt
in 1973 (Ita, 1975).
Initially, seeds and fingerlings were obtained from the wild. There was
an abundance of seeds of tilapias , Mugil spp. Liza spp, and
Hemichromis spp. from the wild. About 2.5 million mullet fry per annum
were obtained from Lagos area and an adequate number to stock
10,000 ha pond yr'1 in the Niger Delta. Artificial breeding of carp was
introduced in 1954 at Panyam fish farm (Ezenwa, 1975) and its scope
is widening with time. Since then, there has been a steady growth in
8
the number of fish ponds and fish farms all over the federation (Dada
1975; Sagua, 1976). From a humble beginning with a 20 ha fish farm
at Panyam near Jos in 1954, producing less than SOOkg.ha'1 yr'1, there
were over 3000 homestead sandcrete ponds, 2,000 small earthen
ponds and 60 commercial farms (>3ha) in 1990 (Satia, 1990)
producing 7,735 mt (FAO, 1992).
Freshwater species cultured were the tilapias; Oreochromis niloticus,
Tilapia melanopleura and Sarotherodon galilaeus; carps; Cyprinus
carpio (European carp), Labeo sp. (African carp); Heterotis niloticus
(bony tongue); Gymnarchus niloticus (trunk fish); Lotes niloticus (Nile
perch) and Clariid fishes; Clorias sp. and Heterobranchus species.
Brackish water species cultured were: finfishes; Chrysichthys
nigrodigitatus (silver catfish); Gymnarchus sp.; Hemichromis fasciatus
(jewel fish); Lutjanus sp. (snappers); Bops sp.; Ethmalosa fimbriata
(bonga fish); Heterotis sp; Mugil sp (mullets); and shellfishes; Penaeus
duararum (shrimp); and Macrobrachium sp (prawn) (Dada, 1975) and
recently Ophiocephalus sp (channa, snakeheads) ( FAO, 1991c). O.
niloticus and C. gariepinus dominate aquaculture production in
Nigeria, contributing about 49.06% and 19.82% respectively of fish
production in 1990 (FAO, 1992).
Nigeria has a population of 88.5 million people and a per capita fish
consumption of 5kg yr’1 well below the official "optimum" of 11.5 kg
9
individual'1 yr'1 in 1992 (Satia, 1990). Additional 90,000 and 340,000 mt
of fish per year respectively was required in excess of the official
capture fishery MSY (estimated at 971,000 mt) to maintain these levels
with the balance expected from aquaculture (Satia, 1990).
Aquaculture development,just as in any other agricultural subsector,
reflects global and national economies. Still in its infancy, it has gone
through periods of boom and bust.
Aquaculture in Nigeria has recorded two growth patterns of steady
increase from its inception in 1951 to 1980 and fluctuation between
boom and bust from then until the present. A "bust" between 1980-83
was due to massive importation of fish that almost crippled domestic
fish production in the government's bid to supply enough protein to its
entire citizenry and correct the per capita fish consumption deficit.
After 1983, the trend maintained a plateau phase. A total of 900,000
mt of fish was imported in 1980 (lta,1986). The global oil glut of 1983
discouraged importation of fish and encouraged domestic fish
production. This attracted both the government and donor agencies
to aquaculture. Programmes such as the "Inshore Fishing Project"
(I.F.P.) to provide pond construction equipment at subsidised rate to
fish farmers, the Fish Seed Multiplication Scheme (F.S.M.S.) - aimed at
providing fish seeds and fingerlings to farmers through hatchery
development and the Homestead Fish Farming Programme (H.F.F.P.)
to promote "backyard" fish farming at the household level (Adesimi
10
and Aderinola, 1983) were floated and these culminated into
revitalised aquaculture in 1984. There has been steady production of
5-10 thousand mt since then except for 1989 when an arguably sharp
production figure of 25.5 thousand mt was recorded (FAO, 1992).
The aquaculture potential of the country has been grossly
underutilised, with only 1,000 ha used out of an available 443,406 ha
of water area suitable for aquaculture (Ita et al., 1985). With the
current effort to revitalise the economy at global and national levels,
improved active participation of the government and donor
agencies, increasing interest of fish farmers, there is every likelihood of
a significantly improved production before the end of the century.
1.4 Aquaculture Feeds and Feedstuffs
The increase in aquaculture production has been made possible by
the intensification of aquaculture that requires feed application either
as total or supplementary. There exists controversey over present
aquafeed production levels. Aquaculture feed production increased
from 1.9 to 4.0 million mt from 1980 to 1988. This has been projected to
hit 6.6 million mt by the year 2000. Asia produced 2.6 million mt with
the Peoples Republic of China, Republic of China and Japan topping
the list in descending order (Akiyama, 1992). New et al. (1993) found
th0 1933 production level an overestimation and assumed less than 3
11
million mt figure for the same year. The consensus however is that of
expanding aquaculture feed production to match aquaculture
production.
The major feedstuff in aquafeed production is fishmeal, particularly in
marine shrimp, salmon, marine fish, trout and eel industries. Fishmeal
usage is likely to increase by 50% from about 0.8 million mt in 1990 to
1.2 million mt by the year 2000, and fish oil production to 363,000 mt
(an increase of 77% from 1990) (Chamberlain, 1993). Fishmeal is most
preferred for its excellent nutritional quality and palatability (Urn and
Dominy, 1993).
1.5 Fishmeal in Aquaculture
The major fishmeal producing countries are Peru, Chile, Norway, U.S.A,
Japan, Iceland, Denmark and South Africa. Fismeal can be produced
from whole fish or fish processing wastes. The major forms of fishmeal
available are the flame dried and steam dried menhaden fishmeal
from U.S.A., mostly steam dried herring fishmeal from Canada, flame
dried and steam dried anchovy fishmeal from Peru and Chile,
pilchard fishmeal from South Africa, low temperature dried herring
and capelin fishmeal from Norway and Iceland, and sardine fishmeal
from Japan (Hardy and Masumoto, 1991).
12
Fishmeal is presently the major feedstuff in the aquaculture feed and
provides the major portion of protein in commercial diets for aquatic
animals (Urn and Dominy, 1991). Presently, aquaculture consumes only
10% of the total fishmeal production which amounts to 6 million mt/yr
(Barlow, 1989; Rumsey, 1993). 60% of fishmeal production goes to the
poultry industry mostly in China (Hardy, 1991). Fishmeal production has
increased moderately over 20 years (by 27%) and is now expected to
decline by 5% annually (FAO, 1991; IAFMM, 1991; New, 1991).
Ironically, the aquaculture industry has grown rapidly in the last
decade (Lovell, 1991). This has led to high demands for fishmeal but
the concommitant decline in fishmeal production poses an imminent
danger to the industry. Fishmeal consumption for aquaculture feeds
will double by the year 2000 while production is expected to remain
constant (Barlow, 1989; Rumsey, 1993).
Fishmeal demand is highly elastic. This has been estimated at 0.7% for
fish meal in poultry feed production (Crowder, 1990). In otherwords, a
10% price increase would lead to 7% decline in demand. Fishmeal has
a more variable demand than any other animal or plant protein, i.e
its demand is more price sensitive than others (Starkey, 1990).
Concerns over future fishmeal cost and availability for aquaculture
feeds have exerted tremendous pressure to use fishmeal as efficiently
as possible and to try and identify suitable alternatives.
13
Making efficient use of fishmeal involves its characterisation in terms of
freshness, lipid oxidation, protein digestibility, effects of cooking and
hydrolysis, and meeting fish meal quality requirements for various
aquaculture species (Chamberlain, 1993). An enormous range and
number of alternatives to fishmeal have been investigated in a wide
variety of aquaculture feeds.
1.6 Soybean Products in Aquaculture
Soybean is sometimes known as "the Miracle Crop" internationally, the
"Cow Crop" of China, the "Cinderella Crop" of the West or the "Pearls
of the Orient" and originated from China 2000 years before Christ.
Soybean is the world's most valuable and widely grown oil seed
legume (Osho, 1991). Total soybean production was 11.8 million mt in
1985 with major producing nations being the United States, 56% ;
Brazil, 18% ; Peoples' Republic of China, 10% ; and Argentina, 6%
(Vohra and Kratzer, 1991). In contrast to dwindling fish meal
production, soybean production has been on the increase for the
past 20 years with a 176% gain and is expected to increase by
another 40% by the year 2000 (Alexandratos, 1988). Some of the wide
range of commercially available soybean meals are full-fat and
toasted soybean meal, hexane extracted and extruded soybean
meal, alcohol extracted soybean meal, full-fat and puffed soybean
meal and hexane extracted soybean meal (Tacon, et al.,1983).
14
Soybean is the most widely grown oilseed with about 50% of world
oilseed production (FAS, 1991).
Despite the possible economic advantages of plant protein utilisation
in aquaculture feeds, high inclusion levels have generally resulted in
growth retardation and poorer feed efficiency than with fishmeal
controls. These results have been attributed to improper balance of
essential amino acids and minerals, presence of toxic substances or
antinutritional factors, reduced water stability and palatability (Urn
and Dominy, 1991). These inherent defects may be remedied to some
extent by processing of soybean to remove toxic substances and
antinutritional factors, and addition of deficient nutrients through
supplementation of single or combined nutrients or incorporation of
low cost animal proteins that are richer in such nutrients. Such
products include poultry by-product meal, meat and bone meal
(Hardy and Masumoto, 1991).
Soybean production and utilisation research have been going on in
Nigeria since the early seventies at the International Institute of
Tropical Agriculture, Ibadan - Nigeria. In the mid seventies, breeders
were able to overcome the barrier that frustrated earlier attempts to
adapt the American bred variety to the tropics. Roots of the US
variety were later found not to be congenial to the nitrogen fixing
bacteria of Africa. A high yielding, better nodulating variety was later
15
developed. This new variety is capable of yielding 2.5 tons per
hectare (IITA, 1990a).
The International Development Research Centre funded a research
project on soybean utilisation in 1985, carried out by IITA and Institute
of Agricultural Research and Training (I.A.R. & T) - Ibadan. Several
products and end uses of soybean in human nutrition were
developed, viz: raw soy flour, cooked soy flour, soy milk, soy
vegetable soup, soy "ogi"(cooked plain paste or milk residue of
dehulled soybean flour), soy "eba"( cooked mixture of soy "gari" and
soy paste or milk residue), soy "moinmoin"(spiced and steam-cooked
mixture of maize, wheat or cassava flour and soy paste or milk residue
from dehulled soybean - cooking oil added), soy "akara" (cake), soy
"iru" (spice from fermented soy) and soy "gari" (blend of soybean and
cassava fibrous flour) (IITA, 1990a, 1990b, 1990c; Osho, 1991).
In Nigeria, there is great enthusiasm for soybean production and
utilisation of soybean in human nutrition. Using soybean products as
fish feedstuffs in the growing Nigerian aquaculture industry may help
to convert soybean protein into much needed fish protein. With
adequate planning soybean in aquaculture nutrition in Nigeria could
complement its popular utilisation in human nutrition.
16
1.7 Poultry Products and By-products in Aquaculture
In Nigeria there is dwindling supply of poultry products and by
products as a result of a declining poultry industry. Feed supply to the
poultry industry is dependent on fishmeal as this industry consumes
60% of the total world fishmeal production (Hardy, 1991). Shortages of
fishmeal, and its rising cost, has adversely affected the poultry
industry. Invariably, the poultry industry is facing the same problem,
but much worse as the aquaculture industry.
Finding suitable alternatives to fishmeal may also boost poultry
production. This may eventually make available poultry products and
by-products which could serve as cheap sources of animal protein in
aquaculture feeds, as their demand is less elastic than that of fishmeal
(Starkey, 1990). Such products could then be incorporated into fish
feed and where combined with soybean, it would provide deficient
nutrients such as essential amino acids - methionine, and minerals -
phosphorus.
The poultry industry in Nigeria shares the same features as that in the
rest of the world. Poultry production is now in its bust cycle and is
expected to boom once the problem of feed supply is resolved. This
will make available cheaper animal protein sources to be utilised in
the aquaculture industry.
17
1.8 Objectives
From the foregoing the following points are evident: Fish meal
production and supply are declining and it is becoming unaffordable;
sourcing alternatives is a current research need; promising alternative
protein sources are low cost animal and plant protein; soybean is the
most promising vegetable protein and its production is ever
increasing, Soybean, despite its high nutritional value lacks essential
nutrients and has anti-nutritional factors.
Generally, the objectives of this study are to investigate nutritional
improvement of soybean flour through blending with poultry meat
meal, utilisation of such products and their suitability to replace fish
meal in practical diets of O. niloticus and C. gariepinus. These are
achievable through;
1. Enriching soybean flour (SF) by blending with poultry meat meal
(PMM) in different ratios, to naturally raise deficient nutrient
levels that are low in SF but high in PMM and evaluate the
digestibility, and utilisation of these blends in practical diets of
Oreochromis niloticus and Clarias gariepinus, to establish the
best blending ratio.
18
2. Establish suitable replacement levels of fish meal with these SF-
PMM blends in practical diets of O. niloticus and C. gariepinus.
3. Enrich SF-PMM blend based diets with dl-methionine as a way
of ameliorating its methionine deficiency, and evaluating its
utilisation by O.niloticus and C. gariepinus.
4. Reconstitute supplemented mineral premix, to evaluate the
effect of mineral supplementation on the utilisation of these
blends in practical diets of O.niloticus and C. gariepinus
5. Detoxifying SF through heat processing to remove heat labile
anti-nutritional factors and assess the effect of this on its
utilisation and as blends with PMM in diets of O. niloticus and C.
gariepinus.
6. Predict the environmental impact assessment of such diets using
nutritional models.
19
CHAPTER TWO
LITERATURE REVIEW
v r •; : ■
'-f-.f, i?‘ i f
2.0 Introduction
Fishmeal provides much of the protein feedstuff demand of the
animal feed industry. Much of the nutritionists attention was therefore
originally focused on fishmeal development. The dwindling fisheries
resources to provide enough feedstuff for the expanding feed industry
prompted a search for alternatives to fishmeal. Current fishmeal
research needs are therefore development of quality fishmeal,
replacement of fishmeal with vegetable proteins and the effects of
antinutritional factors on plant proteins utilisation.
Presently, quite enormous research has been conducted on plant
proteins in aquaculture feeds. This ranges from the search for suitable
plant proteins in the feed for aquaculture species, to their
development and utilisation. Several plant proteins have been
characterised and documented (See NRC, 1993). Current plant
protein research focuses on nutritional improvement of these plant
proteins and their utilisation. The American Soybean Association has
been engaged in soybean improvement and utilisation research, the
findings of which have been well documented in their biennal
conference proceedings.
Development research into soybean either through "self" improvement
by further processing and "cross" improvement by simple nutrient (pure
21
nutrient) or compound nutrient (nutrients in other feedstuffs -
complementary to soybean) supplementation is now widespread. The
terms self, cross, simple and compound used here are for
convenience and clarity. Information on the nutritive value of
soybean, improvement of soybean by supplementation and blending,
autoclaving to remove anti-nutritional factors and their utilisation in
the diets of tilapia and catfish either as sole protein source or as
partial replacer of fishmeal follows thus:
2.1 Soybean Products and Other Vegetable Proteins in Aquaculture
Feeds
Commercially formulated fish feeds contain 20-45% crude protein and
protein sources make up to 60% or more of the ingredients (Lovell,
1990) and even up to 50% crude protein - particularly diets for
salmonids. However, the maintenance energy requirements of
ectothermic fish are lower than those of endothermic land animals
and fish use fat more efficiently as an energy source than
carbohydrate (Lovell, 1990).
Historically fishmeal has provided the major portion of the protein in
fish feeds. Fishmeal production is presently predicted to decline by 5%
between 1990 and the year 2000. Fishmeal supply stagnating while
the aquaculture feed industry grows (Rumsey, 1993). There is imminent
22
danger of shortage of supply of feedstuffs to the aquaculture feed
industry. Reduction of overdependence on fishmeal, as is being
gradually done in the poultry industry, is necessary to avert-this
danger. Alternatives being investigated include animat1 by-product
meals (Lovell, 1990) and cheaper plant proteins (LirmancHDominy,
1991).
2.1.1 Nutritive Value of Soybean Meal
Of all vegetable proteins, soybean is the most widely grown, It
constitutes 50% of total oil seed production (FAS, 1991), It is equally
the most widely used in aquaculture feeds where it forms 30 - 40% of
feed for warmwater fishes. In addition, Soybean has better nutritive
value than other plant proteins in terms of essential amino acid
balance (EAA) (Urn and Dominy, 1991) and is richer in
polyunsaturated fatty acids as well (Snyder and Kwon, 1987; Lovell,
1989). Tables 2.1 and 2.2 present the EAA and trigyceride profiles of
common plant proteins.
23
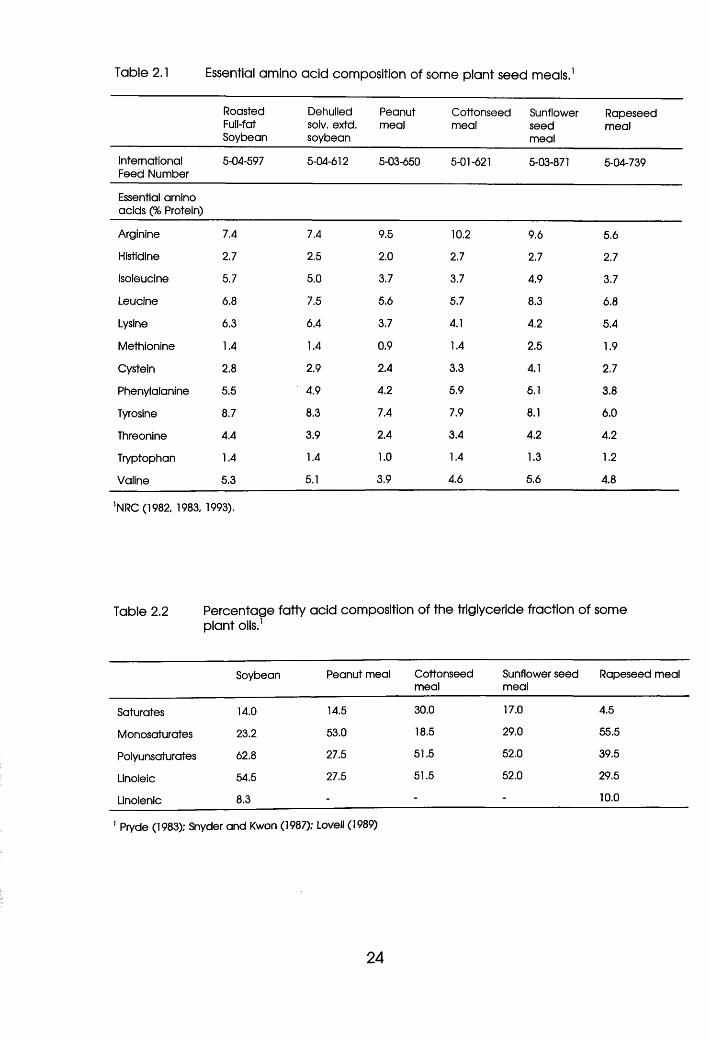
Table 2.1 Essential amino acid composition of some plant seed meals.1
RoastedFull-fatSoybean
Dehulled solv. extd. soybean
Peanutmeal
Cottonseedmeal
Sunflowerseedmeal
Rapeseedmeal
International Feed Number
5-04-597 5-04-612 5-03-650 5-01-621 5-03-871 5-04-739
Essential amino acids (% Protein)
Arginine 7.4 7.4 9.5 10.2 9.6 5.6
Histidine 2.7 2.5 2.0 2.7 2.7 2.7
Isoleucine 5.7 5.0 3.7 3.7 4.9 3.7
Leucine 6.8 7.5 5.6 5.7 8.3 6.8
Lysine 6.3 6.4 3.7 4.1 4.2 5.4
Methionine 1.4 1.4 0.9 1.4 2.5 1.9
Cystein 2.8 2.9 2.4 3.3 4.1 2.7
Phenylalanine 5.5 4.9 4.2 5.9 5.1 3.8
Tyrosine 8.7 8.3 7.4 7.9 8.1 6.0
Threonine 4.4 3.9 2.4 3.4 4.2 4.2
Tryptophan 1.4 1.4 1.0 1.4 1.3 1.2
Valine 5.3 5.1 3.9 4.6 5.6 4.8
’NRC (1982, 1983, 1993).
Table 2.2 Percentage fatty acid composition of the triglyceride fraction of some plant oils.1
Soybean Peanut meal Cottonseedmeal
Sunflower seed meal
Rapeseed meal
Saturates 14.0 14.5 30.0 17.0 4.5
Monosaturates 23.2 53.0 18.5 29.0 55.5
Polyunsaturates 62.8 27.5 51.5 52.0 39.5
Linoleic 54.5 27.5 51.5 52.0 29.5
Linolenic 8.3 - - - 10.0
1 Pryde (1983); Snyder and Kwon (1987); Lovell (1989)
24
i Protein and Amino Acids
Full fa t soybean meal is 38 - 42.2% protein (NRC, 1993), and dehulling
and defatting could enrich this to 49% (Lovell, 1990; NRC, 1982).
Soybean protein is 85% digestible in channel catfish (Lovell, 1977),
rainbow trout (Smith, 1976) and tilapia (Popma, 1982) and is high in all
EAA except methionine + cystine- a better EAA profile than other
vegetable proteins such as peanut and cottonseed that are lower in
all EAA except arginine. Soybean meal has also better essential
amino acid balance in terms of meeting the requirements of some
fishes than some fishmeal - like menhaden fishmeal that has lower
phenylalanine + tyrosine, tryptophan and histidine than soybean meal
(Lovell, 1990).
ii Lipid, Carbohydrate and Energy
Soybean (full-fat) contains 18-20% lipid (NRC, 1993) comprising a
mixture of n-3 and n-6 fatty acids whilst fish meal has predominantly n-
3 fatty acids. Soybean oil contains 8% n-3 (18:3) and 55% (18:2) fatty
acids (Castell, 1978; Snyder and Kwon, 1987). Tilapia zilii has been
found to prefer 1% 18:2n-6 or 20:4n-6 fatty acids or their combination
(Kanazawa et al, 1980; Cho et al, 1985) and has no requirements for
n-3 fatty acids. Soybean oil is thus a good lipid source in tilapia diets.
Channel catfish prefers menhaden fish oil, beef tallow oil and olive oil
25
to linseed oil (more n-3 than n-6) and sunflower oil (more n-6 than n-3)
(Cho, 1985).
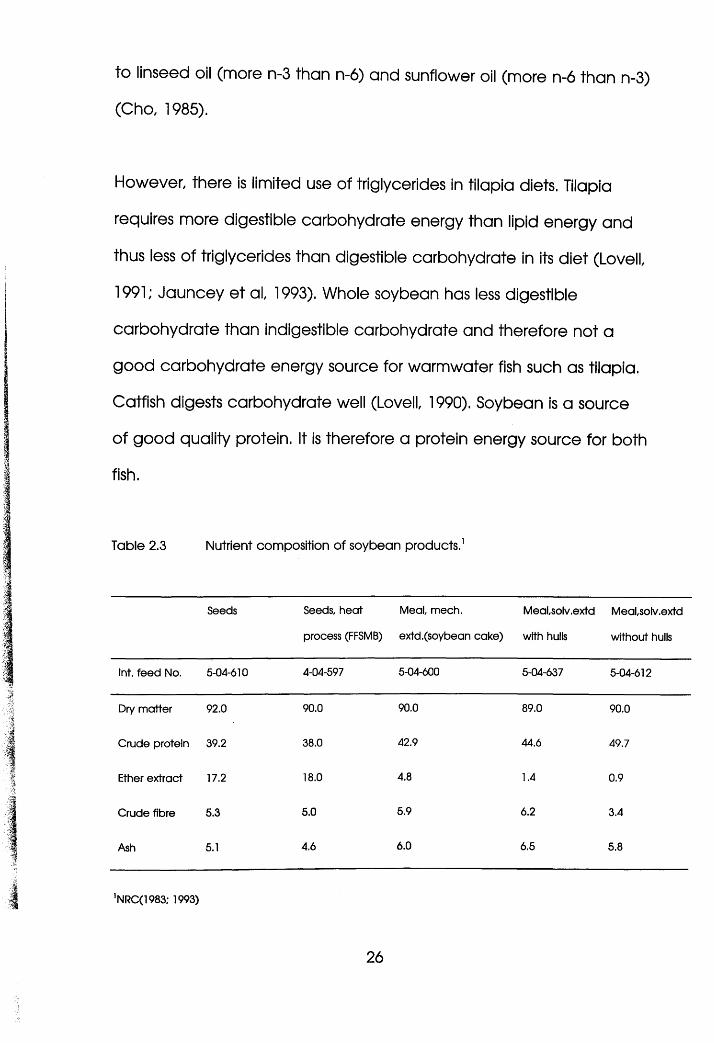
However, there is limited use of triglycerides in tilapia diets. Tilapia
requires more digestible carbohydrate energy than lipid energy and
thus less of triglycerides than digestible carbohydrate in its diet (Lovell,
1991; Jauncey et al, 1993). Whole soybean has less digestible
carbohydrate than indigestible carbohydrate and therefore not a
good carbohydrate energy source for warmwater fish such as tilapia.
Catfish digests carbohydrate well (Lovell, 1990). Soybean is a source
of good quality protein. It is therefore a protein energy source for both
fish.
Table 2.3 Nutrient composition of soybean products.1
Seeds Seeds, heat
process (FFSMB)
Meal, mech.
extd .(soybean cake)
Mealsolv.extd
with hulls
Meal.solv.extd
without hulls
Int. feed No. 5-04-610 4-04-597 5-04-600 5-04-637 5-04-612
Dry matter 92.0 90.0 90.0 89.0 90.0
Crude protein 39.2 38.0 42.9 44.6 49.7
Ether extract 17.2 18.0 4.8 1.4 0.9
Crude fibre 5.3 5.0 5.9 6.2 3.4
Ash 5.1 4.6 6.0 6.5 5.8
'NRC(1983; 1993)
26
iii Micro - nutrients (Minerals and Vitamins)
Phosphorus is the first limiting mineral in soybean meal diets for fishes
due to poor availability. Of 0.6% present, only 0.2% is available to fish
while most fish require 0.5% (Lovell, 1978). Certain trace minerals are
equally unavailable especially zinc. They are chelated by phytic acid
as detailed in 2.2.2. Consequently, trace mineral supplementation is
recommended in diets with less than 15% fishmeal or terrestial animal
by-products (Lovell, 1990). Other minerals are not so critical as they
are available and some of their requirements by fish are met from
water, viz; iron, magnesium, cobalt, potassium and sodium (NRC,
1981, 1983).
Soybean meal is a poor source of most of the 15 vitamins so far
identified, it is a good source of choline, tocopherol (vitamin E) and
menadione (vitamin K) (Tacon, 1991). Fishes require most, if not all, of
the 15 vitamins (Lovell, 1990) and therefore soybean meal based diets
need to be supplemented. However, evidence exists that tilapia may
not require vitamin premixes in their diets.
27
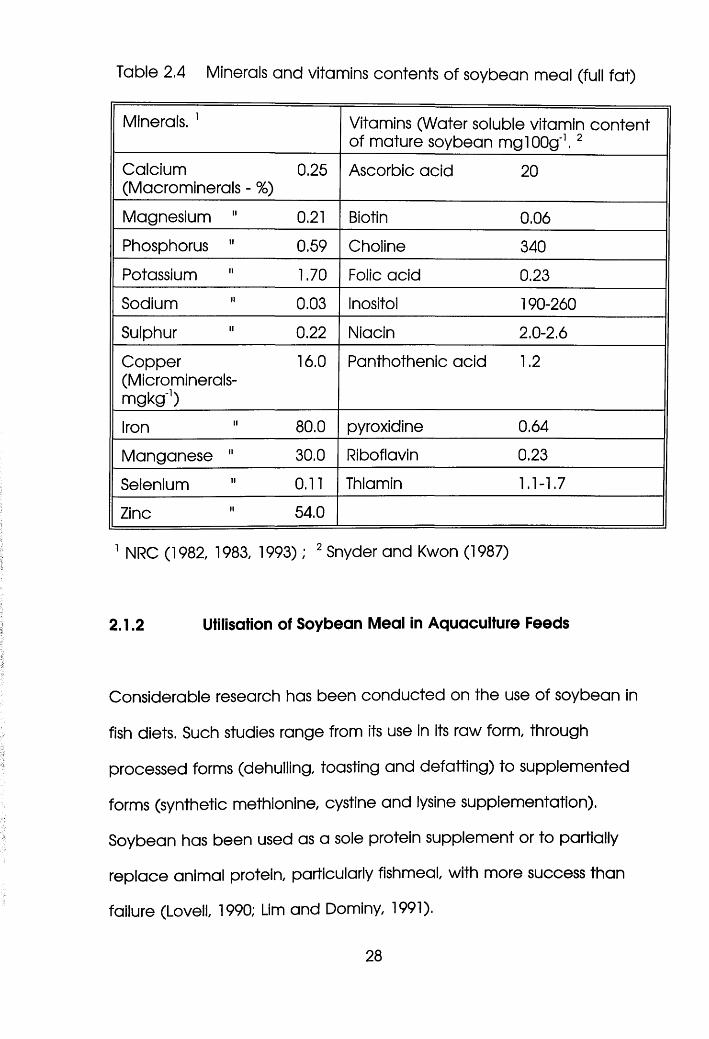
Table 2.4 Minerals and vitamins contents of soybean meal (full fat)
Minerals. 1 Vitamins (Water soluble vitamin content of mature soybean mglOOg'1. 2
Calcium(Macrominerals - %)
0.25 Ascorbic acid 20
Magnesium " 0.21 Biotin 0.06
Phosphorus " 0.59 Choline 340
Potassium " 1.70 Folic acid 0.23
Sodium " 0.03 Inositol 190-260
Sulphur " 0.22 Niacin 2.0-2.6
Copper(Microminerals-mgkg'1)
16.0 Panthothenic acid 1.2
Iron 80.0 pyroxidine 0.64
Manganese " 30.0 Riboflavin 0.23
Selenium " 0.11 Thiamin 1.1-1.7
Zinc " 54.0
1 NRC (1982, 1983, 1993); 2 Snyder and Kwon (1987)
2.1.2 Utilisation of Soybean Meal in Aquaculture Feeds
Considerable research has been conducted on the use of soybean in
fish diets. Such studies range from its use in its raw form, through
processed forms (dehulling, toasting and defatting) to supplemented
forms (synthetic methionine, cystine and lysine supplementation).
Soybean has been used as a sole protein supplement or to partially
replace animal protein, particularly fishmeal, with more success than
failure (Lovell, 1990; Urn and Dominy, 1991).
28
Viola and Arieli (1983) observed that up to 50% of fishmeal could
successfully be replaced in a 25% crude protein tilapia feed. Similarly,
fishmeal in tilapia (O. niloticus x O. aureus) diets could be partially
replaced with soybean meal at suboptimal protein level (24% crude
protein) without compromising performance but substitution at the
optimal protein level (32% crude protein) depressed growth and feed
efficiency (Shiau et al, 1987). Reduced feed efficiency and growth
response were recorded with 50% replacement of fish meal with
soybean meal in diets of Oreochromis mossambicus (Jackson et al,
1982). This was attributed to low level of sulphur amino acids and the
presence of anti-nutritional factors.
Lovell (1974) reported growth depression and lower feed efficiency in
channel catfish fed soybean meal compared to those fed diets
containing fish meal. Similarly Andrew and Page (1974) recorded
reduced feed efficiency and growth when fish meal based diet was
isonitrogenously replaced with soybean. The reverse order of
substitution in another study gave increased growth and feed
efficiency as fish meal in the diet increased to 20% (Mohsen, 1988).
This was also attributed to low sulphur containing amino acids in
soybean (NRC, 1977).
29
From the foregoing, low levels of sulphur amino acids and oil, and the
presence of anti-nutritional factors were identified as factors militating
against optimum utilisation of soybean meal. These problems have
been confirmed in further investigations. In most cases, supplementing
sulphur containing amino acids to diets containing soybean meal
improved performance (Urn and Dominy, 1989).
Supplementing soybean meal with either coated or uncoated
methionine significantly improved growth and feed efficiency of
common carp and channel catfish with coated methionine doing
better only in carp ( Murai et al, 1982). However, earlier investigations
showed no difference in the performance of channel catfish fed diets
containing soybean meal supplemented with crystalline methionine,
cystine and lysine (Andrew and Page, 1974). This discrepancy may be
attributed to the higher methionine and cystine levels in the basal
diets in the later investigation. Growth depression, caused by
methionine deficiency, in tilapia was alleviated when diets for O.
niloticus, in which 75% of the fishmeal was replaced with soybean
meal, were supplemented with 0.8% dl-methionine (Tacon et al, 1983).
Heat treatment has been identified as an effective method of
removing most antinutritional factors (ANF) in soybean.
Haemagglutinins, trypsin inhibitors, phytate, goitrogens and anti
vitamins D, E and B12 have been identified as heat labile ANF (Tacon
30
et al, 1982; Lovell, 1990). However, heat treatment reduces available
lysine levels due to the Maillard reaction (Maynard et al 1979;
Bondi, 1987). Commercial soybean meals currently in use in
aquaculture feeds are heat treated (177°C at 15 lb per inch2 for ten
minutes or 105°C at 15 lb per inch2 for 20 minutes) (Lovell, 1990). Such
heat treatment has been observed to improve soybean meal
utilisation in aquaculture feeds.
Utilisation of heat treated soybean has been studied and found
successful. Poorly heated hexane extracted soybean flour depressed
growth in channel catfish fed 25 and 35% crude protein diets with
graded levels of trypsin inhibitor (Tl) activities, brought about by
heating for different durations (Wilson and Poe , 1985). No utilisation
differentia were recorded between the control and the test diets of
channel catfish when 64% commercial soybean meal and 10% fish
meal in the control were replaced with 50% and 100% heat treated
soybean meal (Saad, 1979).
2.2 Antinutritional Factors in Soybean Products and Vegetable
Products.
Anti-nutritrional factors identified in soybean and other plant products
of agricultural importance are: i, Protein ANFs; protease inhibitors
(trypsin inhibitor) and haemagglutonins; ii, Glycosides; goitrogens,
31
cyanogens, saponins and estrogens iii, Phenols; gossypols and tannins
iv. Miscellaneous; anti-minerals, anti-vitamins, anti-enzymes, food
allergens, microbial/plant carcinogens and toxic amino acids (Liener
et al, 1981; Tacon, 1985). These have been further classified into heat
and non-heat labile ANFs. Heat labile ANFs are Haemagglutonins,
phytate, trypsin inhibitor, goitrogens and anti-vitamins while the non
heat labile ones are saponins, estrogens, lathyrus and flatulence
factors (Tacon, 1982).
2.2.1 Trypsin Inhibitor
The unparalleled nutritive value of soybean amongst the plant
proteins has been bedeviled by the presence of heat labile anti
nutritional factors in raw or inadequately heated soybean. Poor
growth and pancreatic hypertrophy are physiological responses of
animals fed unheated soybean (Kakade et al, 1973). Trypsin inhibitor
constitutes 6% of the total protein. There exists controversy over the
extent of the contribution made by trypsin inhibitor to the deleterious
effects of raw soybean. Rackis (1972) observed that only 30-50% of
the growth inhibition effect and almost all of the pancreatic
hypertrophy were due to trypsin inhibitor in rats. Earlier, Gertler et al
(1967) observed only a minor role of trypsin inhibitor in the growth
inhibition. Similarly, Saxena et al (1963) recorded pancreatic
hypertrophy with diets containing a soybean fraction devoid of
32
antitryptic activity. Kakade et al (1973) resolved this by their
observation that selective removal of trypsin inhibitor did not only
improve protein efficiency ratio but also reduced pancreas size.
High trypsin inhibitor activity in inadequately heat treated soybean
meal reduced protein and energy digestibility of soybean meal in
rainbow trout (Sandholm et al., 1979; Smith et al., 1980) growth rate in
carp (Viola et al., 1983) and channel catfish (Robinson et al., 1981).
No pancreatic hypertrophy was observed in the channel catfish
fingerlings fed for 10 weeks. The effect of the inhibitor on trypsin is
enzymatic. As in Fig 2.1, the inhibitor mimics trypsin and gets attached
to valuable substrate like peptides according to the lock and key
hypothesis of enzyme activity (Roberts, 1980), thereby increasing
non-digestion of protein. It also stimulates pancreatic oversecretion of
enzymes containing cystine and consequently triggers methionine
deficiency, all symptomised as growth retardation (Vohra and Kratzer,
1991).
33
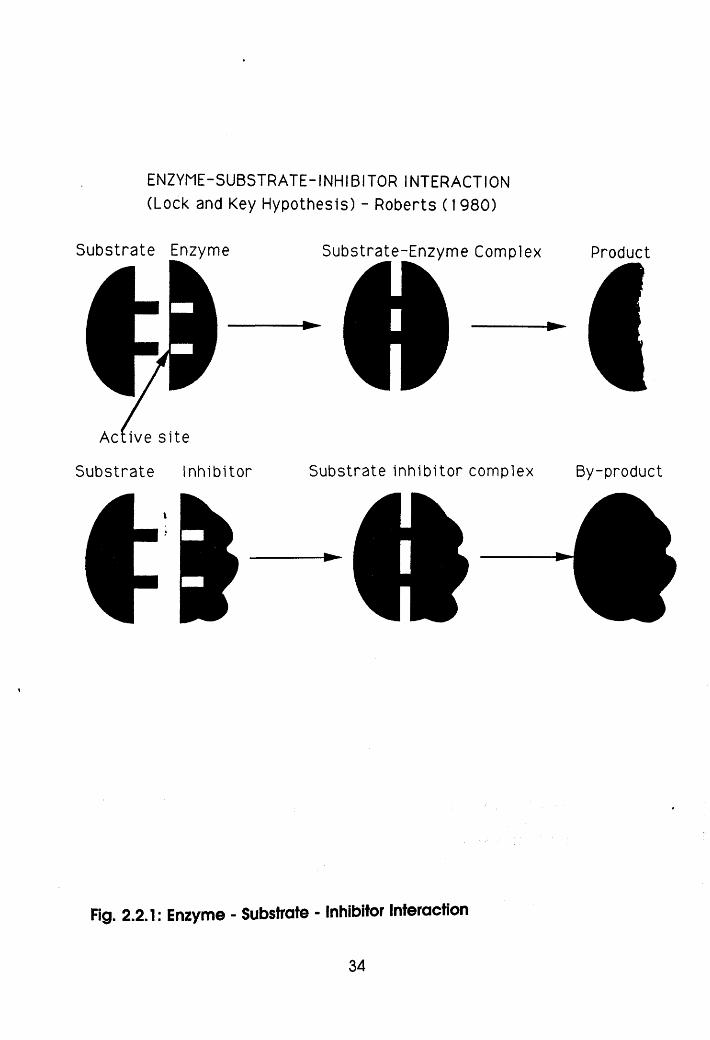
ENZYME-SUBSTRATE-INHIBITOR INTERACTION (Lock and Key Hypothesis) - Roberts (1980)
Substrate Enzyme Substrate-Enzyme Complex
Active s ite
Substrate Inhibitor Substrate Inhib itor complex
Fjg. 2.2.1: Enzyme - Substrate - Inhibitor Interaction
2.2.2 Phytic Acid
Differences in zinc availability between animal and plant protein have
been attributed to the phytate content of the latter as addition of
phytic acid to animal protein decreased zinc availability in animals
(O'Dell and Savage, 1960; Oberleas et al., 1962). Phytic acid forms
complexes with raw soybean protein which chelates zinc and other
essential minerals to cause mineral deficiencies (Rackis, 1965).
This reduces zinc bioavailability. Zinc bioavailability could be improved
upon by zinc supplementation to keep the phytate : zinc ratio at less
than 10 (Lo et al., 1981). Animals fed raw soybean diets adequately
supplemented with minerals and vitamins will exhibit growth, protein
efficiency or pancreatic hypertrophy unaffected by physiological
effects associated with perosis, rachitogenicity and mineral
deficiencies (Rackis, 1965).
Zinc requirement of channel catfish has been found to be 20 mgkg'1
using purified diets (Gatlin and Wilson, 1983) or 88mgkg_1 diet in
practical diets (Lovell, 1977) or even higher at 150 mgkg'1 (Gatlin and
Wilson, 1984). These discrepancies are due to the fact that practical
diets usually contain feedstuffs high in phytic acid (Nelson, 1968).
35
Supplementation of rainbow trout soybean meal based diets with zinc
was considered necessary (Wekell et al., 1983), as soybean meal has
apparent binding potential with zinc (Spineili et al., 1982). However,
Spinelli (1983) observed that reduced growth in rainbow trout fed
diets containing phytic acid was due to reduction in protein
availability rather than alteration in the bioavailability of zinc, iron or
copper. This observation was probably due to a favourable phytate :
mineral ratio. The phytate is a product of mineral salts - phytic acid
reaction, when the mineral component is bonded and rendered
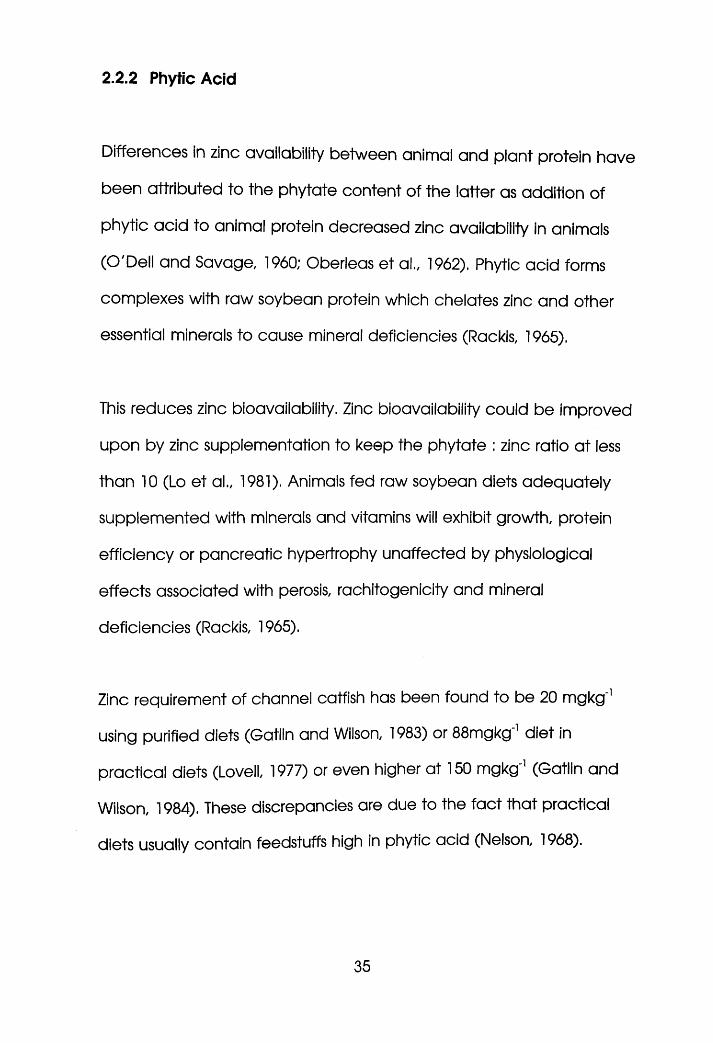
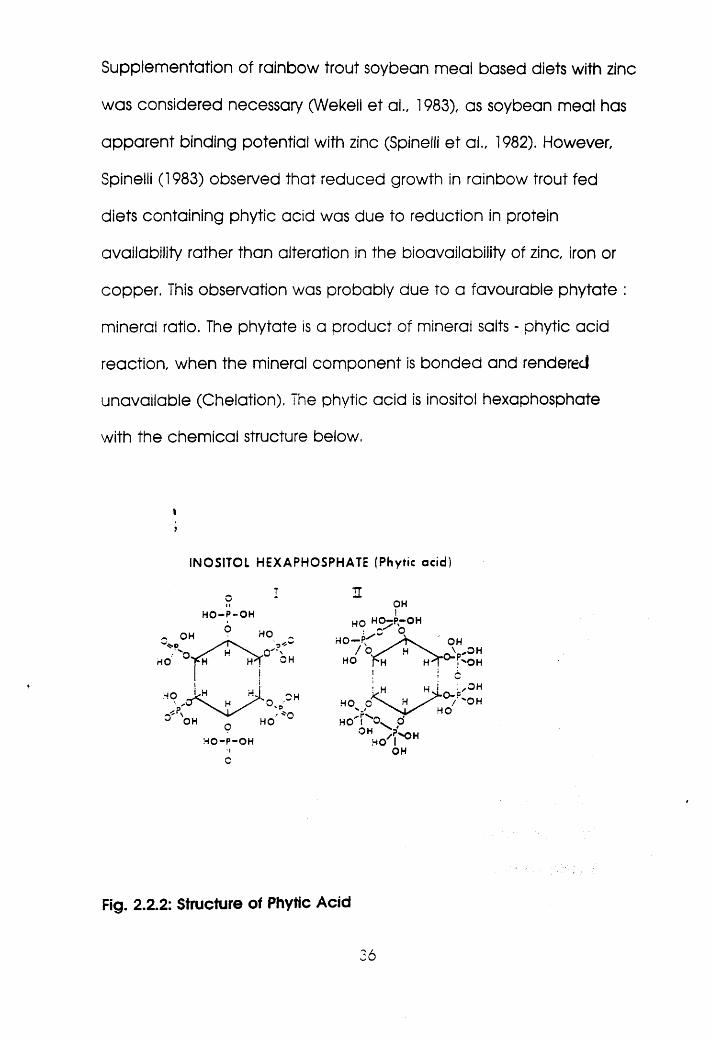
unavailable (Chelation). The phytic acid is inositol hexaphosphate
with the chemical structure below.
INOSITOL HEXAPHOSPHATE (Phytic acid)
own-p-QH
IIOH!
H j
OHC
Fig. 2.2.2: Structure of Phytic Acid
2.2.3 Soybean Lectin (Haemagglutinin)
Soybean lectin has been studied using purified lectin. It neither
caused rapid weight loss nor death when fed at high dietary levels
but slow growth rate. Unlike kidney bean lectin, haemagglutinin does
not induce acute toxic responses and as such body reserves of lipid,
glycogen or protein were not depleted (Grant, 1989). However, it
binds with the epithelium of the small intestine where it induces an
antibody response . It is absorbed into circulation at a much slower
rate than kidney bean lectin (van Kempen, 1993). Haemagglutinin
has no effect on stomach bearing fish as it is inactivated by pepsin
(NRC, 1983).
2.2.4 Miscellaneous Anti-nutritional Factors in Soybean
Other physiological effects caused by raw soybean include thyroid
enlargement (goitrogenicity), reduction in fat absorption and
metabolisable energy, decrease in transamidase activity, increased
oxygen consumption and lower glycogen content (Rackis, 1965). A
number of thermostable ANF like estrogen and saponin do not pose
danger to animals. Estrogen will only inhibit growth when fed at
relatively high levels. Saponins do not exert deleterious effects on
animals in the presence of dietary proteins as the enzyme-inhibiting
property is abolished (Rackis, 1965).
37
2.3 Poultry Products and By-products in Aquaculture Feeds
Certain nutrient deficiencies and antinutritional factors presence in
plant proteins have seemingly made animal protein utilisation in
aquaculture feeds indispensable, hence the need to search for lower
cost animal proteins that are readily available. Apart from fishmeal,
other animal proteins in use in aquaculture feeds are animal by
products, poultry by-products, meat and bone meal including poultry
meat meal, blood meal, feather meal, milk by-products, gelatin and
wet fish products including silage (Halver,1989). In view of widespread
poultry farming practice in the world, which makes available poultry
products and by-products, there is a relatively large potential for use
of these as cheaper and more readily available sources of lower cost
animal protein than fish meal.
2.3.1 Nutritive Value of Poultry Products and By-products
Poultry by-product meal has 58.7-62.8% crude protein, 13.1-14.1%
ether extract, 2.3-2.4% crude fibre and 15.7-16.8% ash. Hydrolysed
feather meal is very high in protein, but low in lipid and ash. They both
have good essential amino acid profile as in Table 2.5 (NRC, 1983).
Refinements have been made to enrich PBM resulting in a meal of
protein content 68-72% and ash content of 8-11% (Fowler, 1991).
Poultry meat meal is 63.5 % protein, 12.0% lipid and 16.3% ash and It is
38
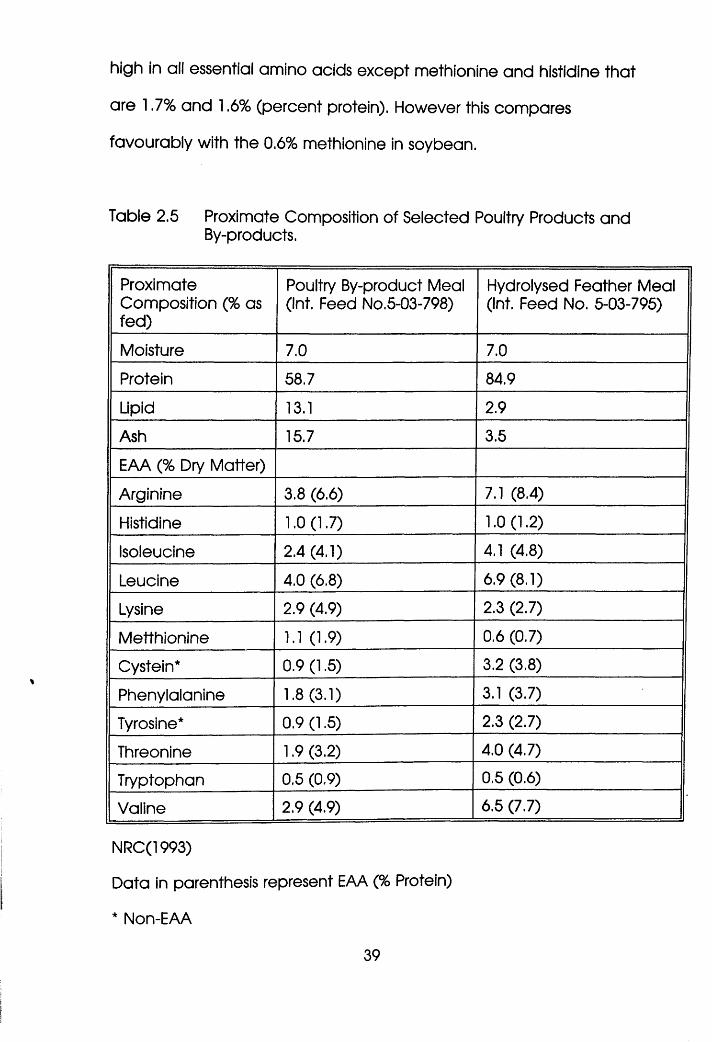
high in all essential amino acids except methionine and histidine that
are 1.7% and 1.6% (percent protein). However this compares
favourably with the 0.6% methionine in soybean.
Table 2.5 Proximate Composition of Selected Poultry Products and By-products.
Proximate Composition (% as fed)
Poultry By-product Meal (Int. Feed No.5-03-798)
Hydrolysed Feather Meal (Int. Feed No. 5-03-795)
Moisture 7.0 7.0
Protein 58.7 84.9
Lipid 13.1 2.9
Ash 15.7 3.5
EAA (% Dry Matter)
Arginine 3.8 (6.6) 7.1 (8.4)
Histidine 1.0 (1.7) 1.0 (1.2)
isoleucine 2.4 (4.1) 4.1 (4.8)
Leucine 4.0 (6.8) 6.9 (8.1)
Lysine 2.9 (4.9) 2.3 (2.7)
Metthionine 1.1 (1.9) 0.6 (0.7)
Cystein* 0.9 (1.5) 3.2 (3.8)
Phenylalanine 1.8 (3.1) 3.1 (3.7)
Tyrosine* 0.9 (1.5) 2.3 (2.7)
Threonine 1.9 (3.2) 4.0 (4.7)
Tryptophan 0.5 (0.9) 0.5 (0.6)
Valine 2.9 (4.9) 6.5 (7.7)
NRC(1993)
Data in parenthesis represent EAA (% Protein)
* Non-EAA
39
2.3.2 Utilisation of Poultry Products and By-products in Aquaculture
Feeds
Poultry by-product meal (PBM) has been used to partially replace
fishmeal in the diets chinook salmon (Westgate, 1979; Fowler,
1981a,b, 1982), coho salmon (Higgs et al., 1979), rainbow trout (Tiews
et al., 1979; Koops et al., 1982) and European eels (Gallagher and
Degani, 1978). Full-fat poultry by-product meal was observed to
perform eaqually well as herring fishmeal in the diets of coho salmon
(Oncorhynchus kisutch) while complete substitution of herring fishmeal
with defatted PBM retarded growth, lowered food conversion and
protein efficiency (Higgs, et ai 1979), PBM was also observed to
replace 50% fishmeal in diets of chinook salmon without compromising
performance (Fowler, 1982). He postulated replacement of fish meal
a t above 50% with refined poultry by-product meal in salmon diets
without compromising growth. Steffens (1994) achieved complete
substitution of fish meal with poultry by-product meal in rainbow trout
diets. Meat and bone meal was found to successfully substitute 40%
of fishmeal in a 50% (crude protein) diet of sea breams (Sporus
aurata) (Davies, et al 1993). Successful partial and complete
substitution of fishmeal with a combination of meat and bone meal,
and blood meal by varying their inclusion levels in a 36% crude
protein diet of Oreochromis mossambicus has been reported (Davies,
et al 1989).
40
2.4 Antinutritional Factors and Toxic Substances in Poultry Products
and By-products
Poultry by-product meal like other animal feedstuffs do not habour
much in the way of naturally occuring toxicants . Only avian and fish
eggs and certain kinds of shellfish and amphibians have been
identified with toxicants of animal tissue origin (Liener, 1974). However,
the presence of other toxic substances has been traced to intentional
and inadvertent source of contamination. The use of additives in the
food processing industry, the use of certain chemicals for animal and
public health reasons and the consumption of plant foodstuffs by
animals have led to the presence of a wide range of toxic substances
in animal feedstuffs (Liener, 1974). Those related to poultry products
and by-products are further discussed below:
2.4.1 Naturally Occuring
i Poultry Eggs
Avian egg whites have been found to contain the following
substances : Ovomucoid and ovoinhibitors which are protease
inhibitors with ovomucoid targeting trypsin; avidin - a glycoprotein,
binds biotin (a vitamin B) and ovotransferrin binds metallic ions and
rendering them unavailable, though it has been observed to inhibit
41
bacterial growth in its free form. The egg yolk is a rich source of
cholesterol which when in excess could lead to coronary dysfuntion in
most animals excluding fish.
ii Poultry Meat and Meat Products
Poultry meat lipid is high in cholesterol. Processed m eat particularly
broiled and grilled meat products, contain polycyclic hydrocarbons
like benzpyrenes and benzanthracenes which are carcinogenic.
These are normally generated from the incomplete combustion of
lipid and present in sooth. High intake of liver could lead to
hypervitaminosis as a result of excess of vitamin A (Liener, 1974).
2.4.2 Exogenous Sources
i Additives
The inclusion of additives to meat products, including poultry to
preserve and improve their market value has led to inadvertent
introduction of toxic substances into animal foodstuffs. Of the
additives commonly used, negative effects have been reported with
pesticides and antibiotics. Until the 1970's, the use of DDT and methyl
mercury containing pesticides was widespread and their non-
biodegradability was later found to be a problem. Similarly, there has
42
been general use of tetracycline and penicillin in meat and animal
feed industry in Argentina, U.S.A. and Canada and hypersensitivity to
these in humans has been reported (Liener, 1974).
ii Contaminants
These are toxic substances that find their way into animal foodstuffs
by accident. Public and animal health concern has led to the use of
pesticide in the environment. Pesticide residues are picked up by non
target organisms including poultry. These include non-biodegradable
pesticides and pesticide residue. The threat of radioactivity has led to
the presence of radioactive debris (radionuclides) in the environment,
from nuclear fission. These include strontium-90 in bone and milk,
cesium-137 in muscle, liver and spleen, iodine-131 in milk and
sodium-22. The radioactivity of these have been associated with
structural malformation and physiological dysfunction (Liener, 1974).
iii Toxic Substances in Plants
It is interesting to note that most toxic substances in plant feedstuffs
are present in animal foodstuffs as well, particularly poultry. This has
been brought about by their food chain link. The meat of quail was
once found to be poisonous because of its ingestion of toxic plant
feedstuffs. Similarly, poultry feeds on plants, some of these contain
43
stable toxic substances that show up later in poultry meat, products
and by-products (Liener, 1974).
2.5 Utilisation of Soybean Flour - Poultry Meat Meal Blends in
Aquaculture Feeds
Mohsen and Lovell (1990) tested some animal proteins to replace
soybean meal in channel catfish diets. It was observed that fish meal
and meat and bone meal replaced soybean meal successfully as
their levels increased in the diets. This was not possible with blood
meal. Presently, commercial catfish diets contain 5-10% fishmeal. The
bulk of the balance comes from soybean meal. In view of high cost
of fishmeal, replacing it with lower cost animal proteins would be
economical (Mohsen and Lovell, 1990).
2.6 Tilapia and Catfish Feeds and Nutrient Requirements
Lovell(l 990) reported that fish generally require higher dietary protein
levels than land animals and commercial feeds contain 25-45%
protein. Hence, high protein feedstuffs like fishmeal, animal products,
by-product meals and oilseed meals make up to 60% or more in
commercial feeds.
44
Fish, as ectotherms, do not need to maintain constant body
temperature as required by endothermic land animals and
consequently have lower maintenance energy requirements than
land animals. The heat increment associated with the assimilation of
ingested food is equally lower in fish. Dietary energy sources in fish are
primarily proteins and triglycerides. Warmwater fish digest
carbohydrate energy well while cold water fishes do so poorly (Lovell,
1990).
The performance of a feed is therefore dependent on its ability to
supply adequate protein and energy required by the fish. This could
be in terms of gross protein and energy, digestible protein and energy
and most preferably metabolisable protein and energy. However, it is
less complicated, more reliable and more generally applicable to
characterise feed quality in terms of its gross energy - protein ratio as
digestibility and metabolism are conspecific, vary also according to
fish growth stage or physiology, feed composition and environmental
condition. Mangalik (1986) observed that while protein and energy
requirements of fish changes with size, the protein - energy ratio
changes only slightly.
Though feed with an adequate supply of protein and energy will
meet the recovery and maintenance energy demands of fish, it is
desirable for such feed to supply essential minerals and vitamins to
45
meet their structural, physiological and metabolic demands by the
fish. 23 minerals have been found essential in animals. Seven of these
are macro-elements, viz; calcium, chloride, magnesium, phosphorus,
potassium, sodium and sulphur; and sixteen trace elements, viz;
aluminium, arsenic, cobalt, chromium, copper, fluorine, iodine, iron,
manganese, molybdenum, nickel, selenium, silicon, tin, vanadium and
zinc. Nine of these have been found essential in fishes (Davis and
Gatlin, 1991).
Requirements for these in fish are met from the environment,
feedstuffs and mineral premix supplements. Lovell (1990) observed
that 15 vitamins are essential in fish feed. However, all fishes do not
require all 15 of the vitamins. Requirements for these are meet from
feedstuffs and vitamin premix supplement. NRC (1993) has made a
concise summary of nutrient requirements of fishes. Excerpts for tilapia
and channel catfish (closely related to Clariid catfish) are given in the
Table 2.6.
46
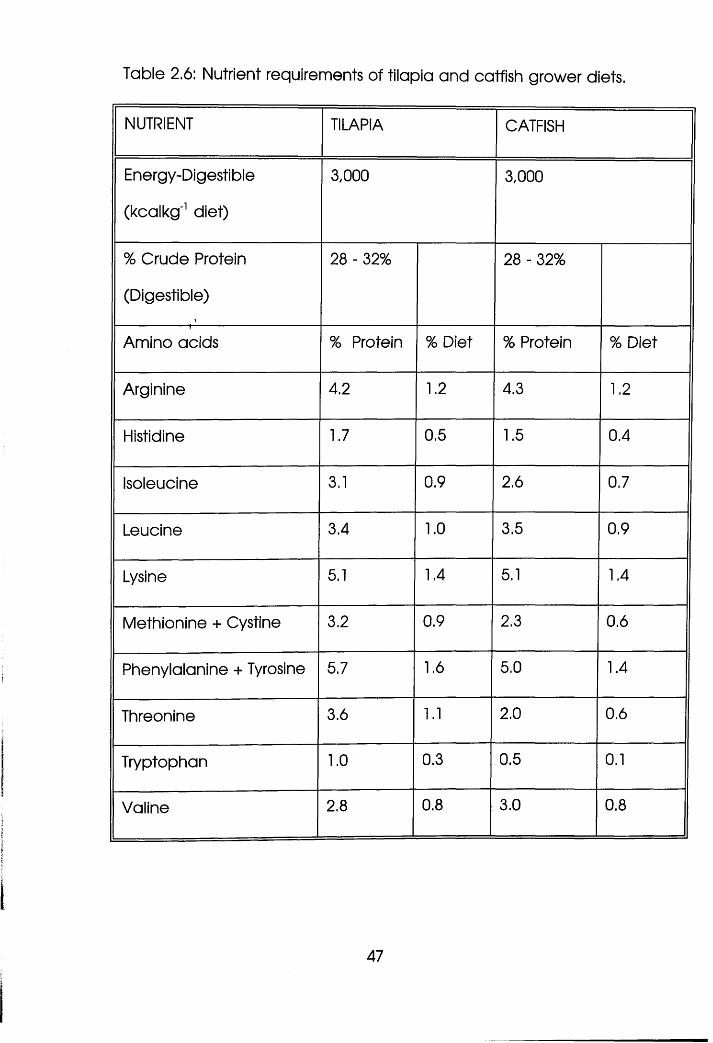
Table 2.6: Nutrient requirements of tilapia and catfish grower diets.
NUTRIENT TILAPIA CATFISH
Energy-Digestible
(kcalkg'1 diet)
3,000 3,000
% Crude Protein
(Digestible)\
28 - 32% 28 - 32%
Amino acids % Protein % Diet % Protein % Diet
Arginine 4.2 1.2 4.3 1.2
Histidine 1.7 0.5 1.5 0.4
Isoleucine 3.1 0.9 2.6 0.7
Leucine 3.4 1.0 3.5 0.9
Lysine 5.1 1.4 5.1 1.4
Methionine + Cystine 3.2 0.9 2.3 0.6
Phenylalanine + Tyrosine 5.7 1.6 5.0 1.4
Threonine 3.6 1.1 2.0 0.6
Tryptophan 1.0 0.3 0.5 0.1
Valine 2.8 0.8 3.0 0.8
47
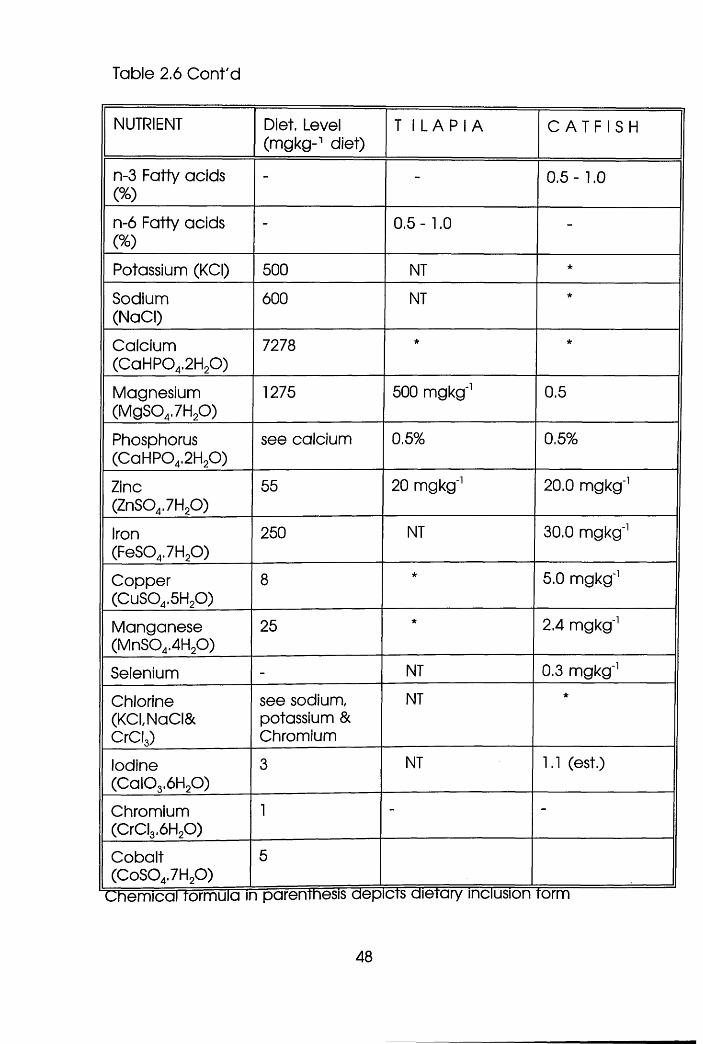
Table 2.6 Cont'd
NUTRIENT Diet. Level (mgkg-1 diet)
T 1 L API A C A T F I S H
n-3 Fatty acids (%)
- - 0.5- 1.0
n-6 Fatty acids (%)
- 0.5- 1.0 -
Potassium (KCI) 500 NT *
Sodium(NaCI)
600 NT *
Calcium(CaHP04.2H20 )
7278 * *
Magnesium(MgS04.7H20 )
1275 500 mgkg'1 0.5
Phosphorus(CaHP04.2H20 )
see calcium 0.5% 0.5%
Zinc(ZnS04.7H20 )
55 20 mgkg'1 20.0 mgkg'1
Iron(FeS04.7H20 )
250 NT 30.0 mgkg'1
Copper(CuS04.5H20 )
8 * 5.0 mgkg'1
Manganese(MnS04.4H20 )
25 * 2.4 mgkg'1
Selenium - NT 0.3 mgkg'1
Chlorine(KCI,NaCI&CrCI3)
see sodium, potassium & Chromium
NT *
Iodine(C al03.6H20 )
3 NT 1.1 (est.)
Chromium(CrCI3.6H20 )
1 - -
Cobalt(CoS04.7H20 )
5
Chemicartormula in parenthesis depicts aietary inclusion rorm
48
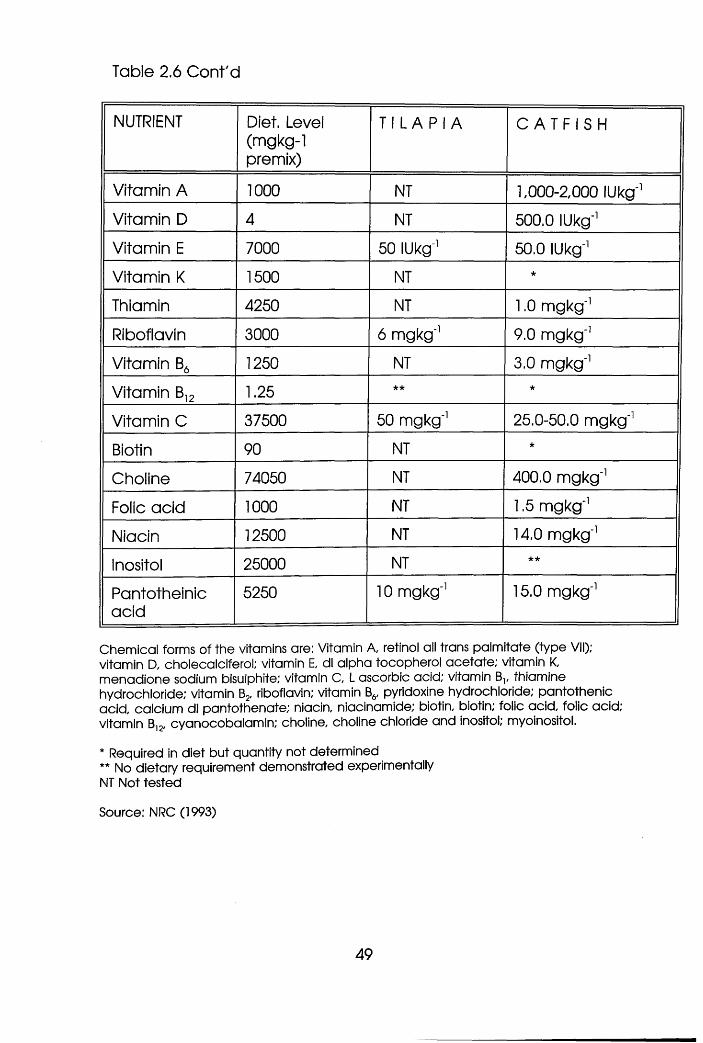
Table 2.6 Cont'd
NUTRIENT Diet. Level(mgkg-1premix)
T I L A P I A C A T F I S H
Vitamin A 1000 NT 1,000-2,000 lUkg"1
Vitamin D 4 NT 500.0 lUkg"1
Vitamin E 7000 50 lUkg1 50.0 lUkg"1
Vitamin K 1500 NT *
Thiamin 4250 NT 1.0 mgkg"1
Riboflavin 3000 6 mgkg'1 9.0 mgkg"1
Vitamin B6 1250 NT 3.0 mgkg"1
Vitamin B12 1.25 * * *
Vitamin C 37500 50 mgkg"1 25.0-50.0 mgkg"1
Biotin 90 NT •k
Choline 74050 NT 400.0 mgkg"1
Folic acid 1000 NT 1.5 mgkg"1
Niacin 12500 NT 14.0 mgkg"1
Inositol 25000 NT * *
Pantotheinicacid
5250 10 mgkg"1 15.0 mgkg"1
Chemical forms of the vitamins are: Vitamin A, retinol all trans palmitate (type VII); vitamin D, cholecalciferol; vitamin E, dl alpha tocopherol acetate; vitamin K, menadione sodium bisulphite; vitamin C, L ascorbic acid; vitamin B,, thiamine hydrochloride; vitamin B2, riboflavin; vitamin B6, pyridoxine hydrochloride; pantothenic acid, calcium dl pantothenate; niacin, niacinamide; biotin, biotin; folic acid, folic acid; vitamin B12, cyanocobalamin; choline, choline chloride and inositol; myoinositol.
* Required in diet but quantity not determined** No dietary requirement demonstrated experimentallyNT Not tested
Source: NRC (1993)
49
2.8 Hypotheses
These are experiment specific. The null hypotheses in line with the
objectives are:
i There is no difference in the digestibility of soybean flour, poultry
meat meal and wheat flour in Oreochromis niloticus and
Clarias gariepinus.
ii The digestibility, apparent amino acid availability and wastes
generation potential of soybean flour - poultry meat meal blend
based diets with 0.5% and 1.0% chromic oxide levels show no
differences in O.niloticus and C.gariepinus with blends and
Cr2Os levels.
iii The performance of all soybean flour - poultry meat meal blend
(100:00; 25:75; 50:50 and 75:25) based diets and the soybean
flour based diets fed to O.niloticus and C. gariepinus is the
same, i.e. blending has no effect.
iv Replacement of fish meal at 25%, 50% and 75% with the above
blends creates no performance differences with the diets fed to
O. niloticus and C. gariepinus, i.e. replacement is ineffective.
50
v There is no difference in the performance of the blend based
diets when each of them is supplemented with 0.5%
dl- methionine and fed to O. niloticus and C. gariepinus.
vi Mineral premix reconstitution by individual and joint removal of
calcium, phosphorus, magnesium and zinc does not change
the performance of the best blend based diet in O. niloticus
and C. gariepinus.
vii There is no difference in the performance of raw and
autoclaved soybean flour - poultry meat meal based diets fed
to O. niloticus and C. gariepinus, i.e. autoclaving does not
affect utilisation of the diets
51
* 5 ' r « * ' " * - f , ’ ,
CHAPTER THREE
GENERAL MATERIALS & METHODS
: X ;
52
3.1 Experimental Systems
Two experimental systems were used for this reseamsbhyUte:
Digestibility System and Feeding Trial System as denaribed±tel0M
3.1.1 Digestibility System
As in Fig. 3.1# this system consists of 12 units of ten litres capacity each.
Each unit has a fish holding bucket, glued to a funnel shaped lower
part onto which a rubber tubing tap is fixed. The bucket part holds
the fish while the funnel shaped part is a faecal matter collection
chamber separated from the upper part with a mesh. In each unit is
a 50W heater to keep the desired temperature of 25-28°C and an air
stone to aerate the unit. All units are supplied with water from a
header tank thermo-regulated a t 25-28°C. All units are on a work-top
below which are sewage tanks to receive sewage and waste water
from the units. The system is a static water type.
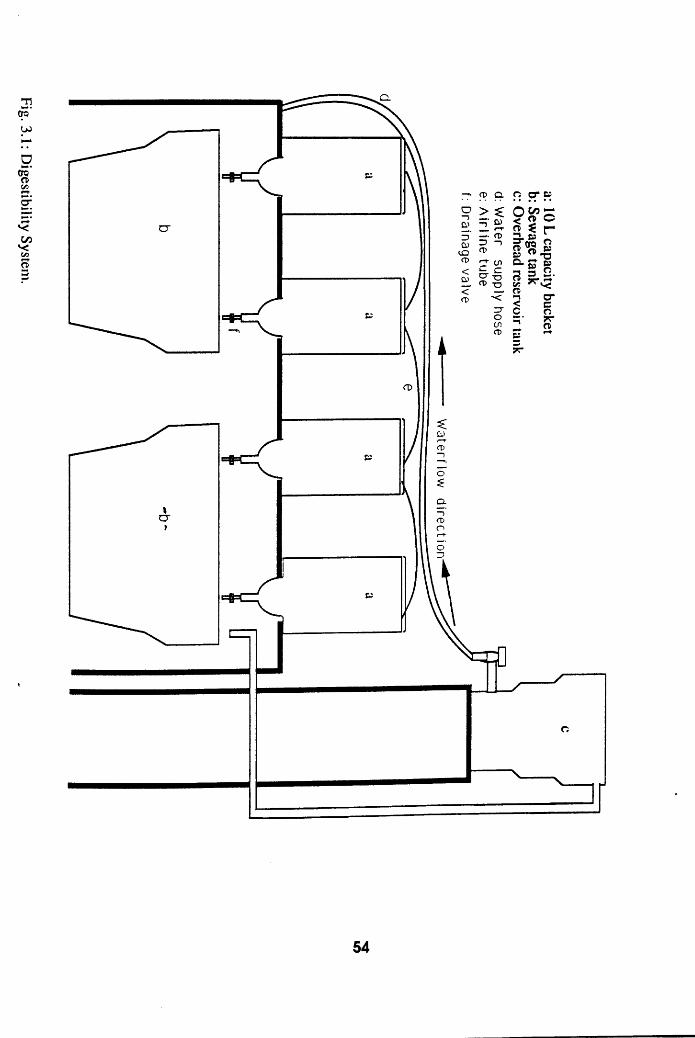
Fig. 3.1: Digestibility System
.
ci
Q.
>
Q.CT
54
a: 10
L capacity
bucket b: Sewage
tank

3.1.2 Feeding Trial System
As depicted in Fig. 3.2, this system is recirculatory. It consists o f 24 tank
units o f 50 litres capacity each. These are connected to a plumbing
system tha t supplies water continuously. Fitted internally to each unit is
an overflow and drain pipe, onto which a screen is fixed. This
maintains water level without letting out fish. The units are mounted
on a metallic framework below which are tanks to receive waste
water. In these are bio-rings and bio-filters to filter waste water. These
tanks are connected to a clean water collecting sump from which
used water is pumped overhead to a header tank where it is further
treated and recirculated. The heating system is central to the
building, maintaining temperature a t 25-28°C. The system itself was
thermoregulated by its own 3KW heater.
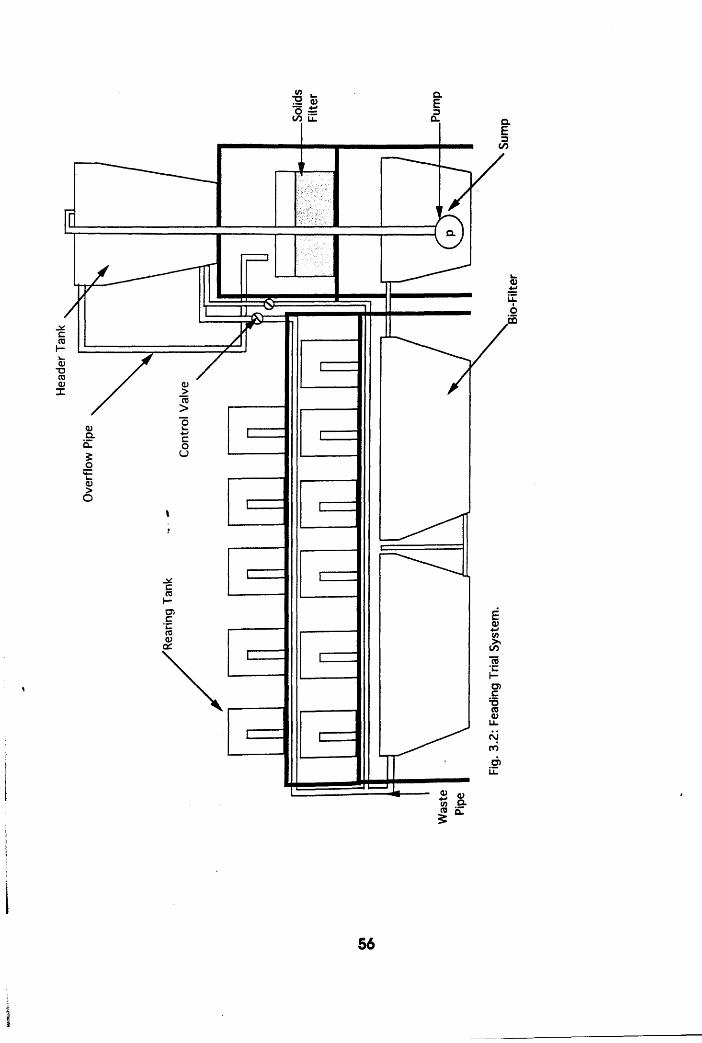
Head
er
Tank
Q.
co iZ Q.
CO
u_
Q.
to
o
UlOJroO)u.
a.
i56
3.2 Experimental Designs
Completely randomised block and factorial designs were the two
designs adopted for this research depending on the number of
treatm ent variables.
3.2.1 Completely Randomised Block Design
This was used in cases of one treatment variable as in chapters 4, 6
and 9 where ingredient incorporation, soybean flour:poultry m eat
meal blending and reconstitution of mineral premixes were the
respective variables.
3.2.2 Factorial Design
This was used in cases of two treatment variables as in chapters 5,7, 8
and 10. Blends and chromic oxide levels were the two variables in
chapter 5 , blends and levels of fish meal substitution were the two
variables in chapters 7, blend and levels of methionine supplemented
were the two variables in chapter 8 while blends and heat treatment
were the two variables in chapter 10.
57
3.3 Experimental Fishes
Two tropical fish species were used for this research, viz; Oreochromis
niloticus and Clarias gariepinus. They were bred and reared in the
tropical aquarium and hatchery complex of the institute where this
research was carried out as described below.
3.3.1 Breeding and Rearing of Oreochromis niloticus
Two methods were adopted in the breeding of Oreochromis niloticus.
The simplest being recovery of naturally fertilised eggs from the mouth
o f the fish for further incubation using an incubation system. The other
method involves stripping the eggs from a gravid broodstock female
and the sperm from a broodstock male. Gamates were mixed using a
dry or wet method. Eggs were then fertilised and the mixture ready for
incubation. Incubation takes place and in about 2-3 days, the larvae
hatched out. The larvae absorbed their yolk in 2-3 days after which
they were transferred to a rearing/nursery tank where they were fed
exogenously starting with hatched artemia till they were a month old.
They were further reared for 1-2 months on commercial trout diet
(crude protein-40%; lipid-7%) from Ewos U.K.Itd.
58
3.3.2 Breeding and Rearing of Clarias gariepinus
Breeding of catfish was carried out artificially by hypophysation
(induced breeding). A plump gravid female C. gariepinus was
selected and anaesthesised in 1 mIL"1 benzocaine solution (1 Og
benzocaine in 100ml 95% ethanol). It was then injected with lutenising
hormone releasing hormone (LHRHa) carried in vehicle solution
(Bovine serum albumin, Sigma Chemical Co. U.K. ltd) containing
pimozide. Dosage rate was 2.0cm3kg'1 of the hormone solution was
adequate to induce ovulation. A 1 cm or 2cm syringe and No. 18
needle were used to inject the hormone into the fish hypodermally
behind the base of the pectoral fin. The fish was returned to the tank
and was ready for stripping in 18 hours.
The female was then stripped of her eggs into a bowl or basin. A
mature male was sacrificed to obtain its milt. This was mixed with the
eggs of the female to fertilise. The mixture was then incubated in a
wire mesh tray on an incubation stand for 28-30 hours to hatch.
Larvae absorbed their yolk in 2-3 days and were then transferred to
rearing/nursery tank where they were reared for 2-3 months to the
desired sizes according to Haylor (1993).
3.4 Experimental Diets
This involved diet formulation and preparation as detailed below:
59
3.4.1 Diet Formulation
Two specifications were set for all the diets in all the experiments in
addition to those specific for each experiment. Diets were isocaloric
(4 kcalg-1) and isonitrogenous (38%) to give an energy : protein ratio
of 110 : 1. Equational method (Halver, 1989) was adopted for
formulation to calculate the inclusion level of each ingredient to meet
the desired specifications. Fishmeal, soybean and poultry m eat meal
were used as protein supplements, wheat flour as a carbohydrate
source, soy oil as a lipid source to reconstitute the diets to meet the
specifications and all were treated as variable ingredients. Fixed
ingredients were mineral and vitamin premixes as nutrient
supplements, carboxymethyl cellulose as binder and chromic oxide as
digestibility indicator.
3.4.2 Diet Preparation
Both fixed and variable ingredients were mixed a t computed levels
thoroughly using a Fiobert mixer. Water was added a t 30-50% v/w to
give a pelletable mixture. The steam conditioned California Pellet Mill
(CL2 model, San Francisco, California) was used to pellet the diets. An
appropriate die was used to give pellets of desired sizes of 1 mm or
2mm. The pellets were then dried by convection a t 60°C overnight in
a drying cabinet, packed in black polythene bags, sealed and stored
a t -30°C until required.
60
3.5 Experimental Operation
This could be divided into routine and non-routine management.
The routine management for the feeding trial was feeding the fish
daily, monitoring water qualify fortnightly and cleaning the system
regularly (fish husbandry). Checking the system for leaks and
malfunctions constituted the non - routine management. In addition
to these, faecal matter was collected daily for subsequent analysis in
the digestibility studies.
3.5.1 Fish Husbandry
When fish greater than 5g were used, they were fed a t 4% body
weight day'1, tw ice daily while those less than 5g were fed a t 6% body
weight day'1, thrice daily for 56 days except one day in a week in
accordance with Jauncey and Ross (1982). Fish were stocked a t
either 10 or 15 per 50 litre tank in either duplicate or triplicate per
treatm ent depending on the facilities available and the experimental
design. Fishes were weighed individually a t the beginning and end of
every feeding trial, and bulk - weighed fortnightly in between to
adjust feeding rate.
Weighing individually involved anaesthetizing a fish with 1 mIL'1 v/v
concentration 2-phenoxy-ethanol in water for 3-5 minutes. The fish was
61
then wiped dry with a tissue paper and weighed on a top-loading
Mettler balance. Fish from one tank were anaesthetized a t a time
and quickly weighed individually within a time limit of 3-5 minutes as
already described or all weighed together after drying off surface
water in the case of bulk-weighing. The digestibility studies of
feedstuffs and diets for juvenile fish that could not be conducted in
the conventional digestibility system were conducted using the
feeding trial system. Fish were stocked a t 10 per tank and weighed
only a t the beginning to calculate feeding rate. They were fed a t
10:30 every morning. Faecal matter was collected once a day a t
10:00 by siphoning from the bottom of each unit.
Digestibility of feedstuffs and diets for fingerlings was conducted in the
set-up digestibility system where fishes were stocked a t 5 per tank. In
all cases they were fed once daily for three weeks after a week
acclim ation to the diets. A t 12:00 every day, diets were placed on a
feeding dish using a feeding pipe to direct the diets into the dish. Fish
were allowed to feed for one hour after which the feeding dish was
removed and diet not eaten flushed out and clean water added to
maintain the water level. A t 11:00 every morning, faecal matter was
collected by draining from the collection chamber below. Clean
water was again added as before.
62
3.5.2 Water Quality Management
Fortnightly water parameters such as temperature, dissolved oxygen,
pH, NHg-N, N02-N, NO3-N, calcium hardness and total hardness were
measured as follows:
i Temperature
Temperature of the water in the feeding trial system was thermo
regulated with a 3 KW heater measured with a mercury bulb
thermometer. The tropical aquarium central heating system provided
a constant warm temperatrure environment of 25-28°C readable from
a digital display unit.
ii Dissolved Oxygen (DO)
Water samples from the systems were taken fortnightly for DO analysis
in the Water Quality Laboratory using an oxygen meter - YSI model 57
from YSI inc., Ohio,USA. Calibration of the meter and its use were
according to the YSI operating instructions and measurement
expressed in mgl'1
63
iii Ammonia Nitrogen (NH3-N)
This was measured using ammonia SeaTest kit from Aquarium Systems
inc., Sarrebourg, France. The direction for use on the kit was followed.
Measurement o f NH3-N was read in mgl'1.
iv Nitrite Nitrogen (NOz-N)
This was similarly measured as for ammonia except for the use of
nitrite SeaTest Kit instead and N02-N expressed in mgl"1.
v Nitrate Nitrogen (N 03-N)
The procedure was the same as for N02-N except for the use of
nitrate SeaTest kit and N03-N measured in mgl'1.
vi Calcium Hardness (Ca-Hardness)
Water samples were taken to the laboratory. 100ml was placed in a
conical flask and a calcium hardness tablet of eriochrome black-T
was added in addition to 1 ml of 0.4M sodium hydroxide. The mixture
was then stirred with a magnetic stirrer to dissolve the tablet. The
solution was titrated against the disodium salt of ethylene diamine
tetra-acetic acid (Na2EDTA) to give a purple colour end point. The
64
titre value was multiplied by ten to give the Ca-Hardness in mgl-1. This
method was according to Stirling (1985).
vii Total Hardness
100ml of water sample was measured into a conical flask, to which
2ml of ammonia buffer was added together with a total hardness
tablet. The same procedure was followed as in Ca-Hardness to give a
blue end point. Similarly, the titre value was multiplied by ten to give
the total hardness in mgl'1. This method was according to Stirling
(1985).
3.6 Experimental Analyses
This comprised chemical analysis and biological evaluation.
3.6.1 Chemical Analysis
General chemical analyses carried out were chromic oxide and
proximate analyses of feedstuffs, diets and carcass, as well as the
energy levels in the feedstuffs and diets. These were moisture, protein,
lipid, ash, carbohydrate, crude fibre, nitrogen free extracts and
energy using methods after AO AC (1990) as detailed below.
65
i Chromic Oxide Analysis
The method of Furukawa and Tsukahara (1966) was employed. It
involved acid digestion of 50mg sample with 5ml conc. nitric acid
followed by 3ml perchloric acid with digest turning from green to
yellow. Digest was diluted to 100ml and absorbance read
spectrophotometrically a t 350nm. Percentage Cr20 3 was calculated
thus:
W eight of Cr20 3 in sample = Absorbance - 0.00320.2089
%Cr20 3 in Sample = Weight of Cr2P 3 (100)Sample weight (g)
i Moisture
It is a gravimetric measurement of water in the feedstuffs, diets and
carcass - expressed as a percentage of the initial sample weight.
ii Protein
The micro-kjeldahl method according to AOAC (1990) was used for
the determination in duplicate as follows. 100-200mg sample was
digested in concentrated sulphuric acid and ammonia from the
digest was released when reacted with 40% sodium hydroxide and
distilled, trapped in 2% boric acid and quantified by titration against
0.2M hydrochloric acid - both distillation and titration were automated
66
using Kjeltec Auto 1030 Analyser and run according to operation
manual from the manufacturer. % protein was calculated using the
titre values for the blank and samples as follows;
% protein = (sample titre - blank titreM).2xl 4.007x6.25x100 Sample weight (approx. 200mg)
iii Lipid
The method was that of solvent extraction using soxhlet extractor. Ig
sample was weighed into a thimble and corked with cotton. 50ml
petroleum-ether (40-60°C) was added to a pre-weighed cup. Both
thimble and cup units were coupled to the Soxtec System 1043
Extractor and run according to the specifications of the operation
manual from the manufacturer. Extracted lipid in the cup weighed
and expressed as a percentage of the original sample.
iv Crude Fibre
Ig o f defatted sample in a pre-weighed scintaglass crucible was used
for crude fibre determination using acid-base hydrolysis. The crucible
was fitted to the Fibertec 1020 and run according to the
manufacturer's operating instructions. Hydrolysed and oven-dried
sample was later ashed in the muffle furnace a t 550°C and crude
fibre in the defatted sample expressed as a percentage of the
original undefatted sample.
67
v Ash Content
This measured the total inorganic matter by incineration. 1 g sample
was weighed into a pre-weighed crucible and incinerated overnight
a t 450°C. The increase in the final weight of crucible after Incineration
represented the ash and was expressed as percentage of the original
sample.
vi Total Carbohydrate
This summed crude fibre and nitrogen free extract. It was determined
by the difference method (Watts, 1975) after non reproducible results
were obtained from an adaptation of the Dubois method (phenol-
sulphuric acid method).
vil Total Energy
This was determined either directly or calorimetrically using adiabatic
autobom b calorimeter or calculated from carbohydrate, protein and
lipid contents.
68
a) Bomb Calorimetry
Approximately 1 g sample was molded into a tab let using briquette
press and reweigh. The calorimeter bucket was filled with water a t 21-
23°C. Benzoic acid table was coupled in a bomb and pressurised with
oxygen and combusted inside the Gallenkamp Bomb Calorimeter
following the procedures in the operation manual. The temperature
rise was substituted into the equation below to evaluate energy. The
energy value determined from such a standard of known energy
checked the caliberation accuracy. Sample combustion then took
place and its energy similarly evaluated.
Energy (kcalg'1) = (Temperature difference x 10.82) - 0.0896Sample weight (Xg) x 4.18
b) Calculated Gross Energy
Using multiplier factors of 4.1, 5.4 and 9.5 kca lg1 for carbohydrate,
protein and iipid respectively according to Jobiing (1983).
C arbohydrate, protein and lipid energy contents were summed up to
give the total or gross sample energy.
69
viii Nitrogen Free Extract
This measured the amount of acid/alkali soluble carbohydrate.
This was calculated as difference of total carbohydrate and crude
fibre.
3.6.2 Biological Evaluation
Biological parameters measured were according to Maynard e t
al.(1979) , Bondi (1989) and Halver (1989) and expressed thus:
i Specific Growth Rate (SGR) Brown (1957);
SGR = LnfMean final weiahtVLnfMean initial weight) fa ’) xlOQTime (days)
ii Food Conversion Ratio (FCR)
Computed as;
FCR = Weight of food fedfg dry weight)Weight gain of fish(g wet weight)
iii Protein Efficiency Ratio (PER) Osborne, et a l.(l 919)
Calculated as;
PER = Weight gain of fish (a wet weight)Crude protein fed (g)
iv Net Protein Utilisation (NPU) Bender & Miller, 1953 and Miller &Bender, 1955)
70
It is expressed as Apparent NPU (ANPU) and com puted as;
App. NPU (%) = Carcass protein gain (a) x 100 Protein fed(g)
v Mortality (Mort.)
Calculated as ;
Mort.(%) = Number of dead fishes x 100 Number of fishes stocked
vi Digestibility
Nutrient and feedstuff digestibility values were evaluated according to Maynard et al(1979) and Bondi (1987) as stated thus:
ADC (%) of nutrients=l 00-(l 00Cr2O3 in diets x nutrient in faeces*)Cr20 3 in faeces nutrient in diet
Apparent digestibility coefficients of feedstuffs were calculated
according to Cho, e t al., (1985) as given below:
Test ingredient(ADC) = ADC of test diet - 0.7 ADC of ref.diet0.3 ADC of test diet
3.7 Statistical Analysis
Results o f carcass composition, the evaluation parameters o f the diets
and other data were subjected to one way Analysis o f Variance
(ANOVA) using Turkey's test (Steele and Torrie,1960), often a t 5% and
seldomly a t 10% probability level. Multifactor Analysis of Variance
(MANOVA) was used to check significance of factors and their
interactions in experiments with factorial design. Multiple parameter
means comparison of treatments was according to Duncan multiple
71
range test (1955). Simple regression by product moment and
correlation were used to relate diet and carcass essential amino acids
and mineral composition (Zar, 1984).
Percentage data were transformed by arc-sine transformation
(Zar,1984) prior to the ANOVA and reversed afterwards. All statistics
were executed using the statgraphics (version 5.0) and minitab
(version 10.1) packages.
72
tb ^c^ 'V K ^ c k x i i r ^ Q <
■ v p ? a ; :■■■■/ ' : — r : ; ; >' • . • - , : . . . v ^ n • v - -:•■■,;■■v'kKt
afHv :;0~" everH t i i - e .r
. ' ' V t u w : i f . "
CHAPTER FOUR
NUTRITIVE VALUE OF FEEDSTUFFS
73
4.1 Biochemical Evaluation of Soybean Flour.
4.1.2 Introduction
Soybean absolute suitability in animal feeds including aquaculture
species as a replacer of fish meal has been bedeviled by some draw
backs including antinutritional factors (ANFs) explained in 2.2 (Liener,
1980).. ANFs tha t have caused noticeable physiological and
anatom ical defects in fish are trypsin inhibitors and phytates .
Trypsin inhibitor inhibits the enzymatic action of trypsin and heightens
methionine deficiency by pancreatic oversecretion of cystine,
symptomised by tissue hypertrophy, rachitogenicity, etc. in animals.
Phytic acid chelates minerals like phosphorus, calcium, magnesium,
zinc, iron, copper etc to form phytate, renders them unavailable and
its toxicity is symptomised by structural malformation and physiological
inefficiency. It has been reported to cause 8-10% reduction in growth
of fish and high mortality after 90 days feeding (Spinelli, 1978).
The physiological effects of saponin, estrogen and allergens on
aquatic animals have not been known (Lim and Akiyama, 1989)
though saponin was reported to elicit haemolytic activity in farm
animals (Gestetner et al. 1971; Liener, 1980). 1-3% of the protein of
defatted soybean is haemaglutinnin which binds carbohydrate to
74
elicit toxicity in animals (Jaffe, 1980). However, it has been found to
have an insignificant contribution to the poor nutritive value of raw
soybeans (Turner and Liener, 1975). In fact, it is inactivated by the
pepsin of stomach bearing fishes (NRC, 1983).
Fortunately, the ANFs of economic concern are heat labile and
therefore readily destroyed through heat processing. However, heat
processing has its own disadvantage. It reduces protein availability
and solubility. The browning reaction (Maillard reaction) that takes
place renders unavailable much of the lysine and could trigger lysine
deficiency in fish with high lysine requirement.
Though, commercial soybean products currently in use in fish diets
have been toasted either a t 177°C for 10 minutes or 105°C for 20
minutes (Lovell, 1990), there is still the use of raw soybean in research
diets. Therefore, there still exist the aforementioned flaws of rawness
and undertoasting, toasting and overtoasting of soybean products.
Evaluating the levels of these ANFs and effects of processing on
nutritive value of soybean have become appropriate and
conventional preambles in any investigation on soybean product
utilisation in fish diets.
75
4.1.3 Materials and Methods
Feedstuffs assayed were: Soybean flour (raw, dehulled and solvent
extracted soybean flour from Sigma Chemical Supply Company ltd,
U.S.A; dehulled , solvent extracted and autoclaved soybean flour a t
131°C a t 15 pounds per square inch for 20 minutes and commercial
soybean flour supplied by Dr Viv Crampton of Ewos UK ltd.), fishmeal,
poultry m eat meal and wheat flour. Proximate composition was
determ ined for all feedstuffs while protein solubility index, trypsin
inhibitor activity assay, determination of phytic acid and available
lysine were conducted for soybean products. Proximate composition
was done as in 3.6.1.
i Protein Solubility Index (PSI) of Soybean Producls
Several methods are in use in the determination of the adequacy of
heat treatm ent of soybean meal. These include urease activity
(Caskey and Knap, 1944; Bird et al., 1947) trypsin inhibitor activity
(Kakade et. al., 1974; Hammerstrand, et. al., 1981), formaldehyde
titration (Almquist and Maurer (1953), cresol red dye-binding
(Olomucki and Bornstein, 1960), orange G dye-binding (Moran e t al,
1963), fluorescence test (Hsu et. al., 1949), Coomassie Blue (Kratzer,
1990) and protein solubility index (Vohra and Kratzer, 1991).
76
Araba and Dale (1990) have demonstrated clearly the superiority of
protein solubility index (PSI) over most others. Urease activity
destruction precedes that of lysine unavailability such that it drops to
zero when lysine is still available. Araba and Dale (1990) observed a
better relationship between chick response and overprocessing
evaluated using PSI than cresol red dye binding or urease activity.
The protein solubility index method (Araba and Dale, 1990) was
therefore adopted for acertaining the protein quality of raw and
toasted soybean products. It involves measuring the solubility of
soybean in a weak alkali solution (0.2% potassium hydroxide) and
soluble protein is measured using the Kjeldahl method. The amount of
soluble protein is expressed as a percentage of total protein.
ii Available Lysine
The A.O.A.C. (1990) method for assaying available lysine was used
which is the same as that of conventional amino acid analysis. The
method takes advantage of the ability of free - amino group of
lysine in protein to bind with 1 -fluoro-2,4-dinitrobenzene (DNFB) part of
which has been bound by carbohydrate during toasting (Maillard
reaction) and considered unavailable or destroyed. Upon acid
hydrolysis, stable DNFB retained its lysine group while that unavailable
was hydrolysed and detectable by the amino acid analyzer. The
difference was considered as available lysine.
77
iii Trypsin Inhibitor Activity
The improved method of Hammerstrand et al. (1981) over the
standard AACC (American Association of Cereal Chemists) method
which in itself was an improvement over Kakade et al.(1969, 1974)
was employed here. All the methods share the same principle of
determining trypsin inhibitor in soybean products based on the tryptic
hydrolysis o f a synthetic substrate, benzoyl-DL-arginine-p-nitroanilide
hydrochloride (BAPA). Three soybean flour samples, viz: Raw, dehulled
and solvent extracted soybean flour; autoclaved, dehulled and
solvent extracted soybean flour, and toasted commercial soybean
flour were assayed. There was a difference in synthetic trypsin activity
(as depicted in absorbance a t 41 Onm) of a standard BAPA solution
(without inhibition) and that of soybean sample plus BAPA solution
(with inhibition) after a correction for sample effect using sample
blank. This was attributed to trypsin inhibitor activity in the sample. The
trypsin inhibitor activity was quantified using the formula below:
Tl, m g/g of sample = differential absorbance X dilution factor0.019 X 1,000
A dilution factor of 1 in 60 was used. Choice of dilution factor provides
for differences in the sensitivity of substrates. The differential
absorbance was first converted to trypsin inhibitor unit (TIU). One Till
represented 0.01 increase in absorbance.
78
iv Phytic Acid Determination
A modification of the McCance-Widowson method for determining
phytic acid according to Wheeler and Ferrel (1971) was adopted.
Three soybean flour samples, viz: Raw, dehulled and solvent extracted
soybean flour; autoclaved, dehulled and solvent extracted soybean
flour, and toasted commercial soybean flour were analysed. The
phytate was extracted with trichloroacetic acid and precipitated as
ferric salt. The iron concentration was determined colorimetrically a t
480nm and extrapolated from a calibration curve using iron standard.
The phytate phosphorus content was calculated from the iron
content assuming a constant 4 Fe:6 P molecular ratio in the
precipitate.
79
4.1.4 Results and Discussion
i Proximate analysis
Table 4.1 presents the proximate composition of ail feedstuffs. Highest
moisture value of 13.1% was recorded for wheat flour and lowest for
soybean oil. Fishmeal recorded the highest protein value of 66.4% and
no protein was detected in soybean oil. Soybean oil was
approximately 100% lipid while dehulled and raw soybean flour had
the lowest lipid of 0.4%. Ash highest value of 16.3% was recorded in
poultry meat meal while that of carbohydrate of 38.4% cam e from
wheat flour. Highest gross and digestible energy values of 8 and 9
and 2.7 and 3.7 kcalg'1 were recorded for soybean oil and wheat
four respectively.
This table depicts clearly that fishmeal poultry meat meal and the
soybean flour product all have above 20% protein and according to
NRC (1993) should be used as protein supplements in fish diets,
soybean oil has 100% oil and act as a good source of lipid while
wheat flour which is low in both protein and lipid but high in
carbohydrate will better serve as a good carbohydrate source. A diet
of any desired specification can easily be formulated from these
feedstuffs.
80
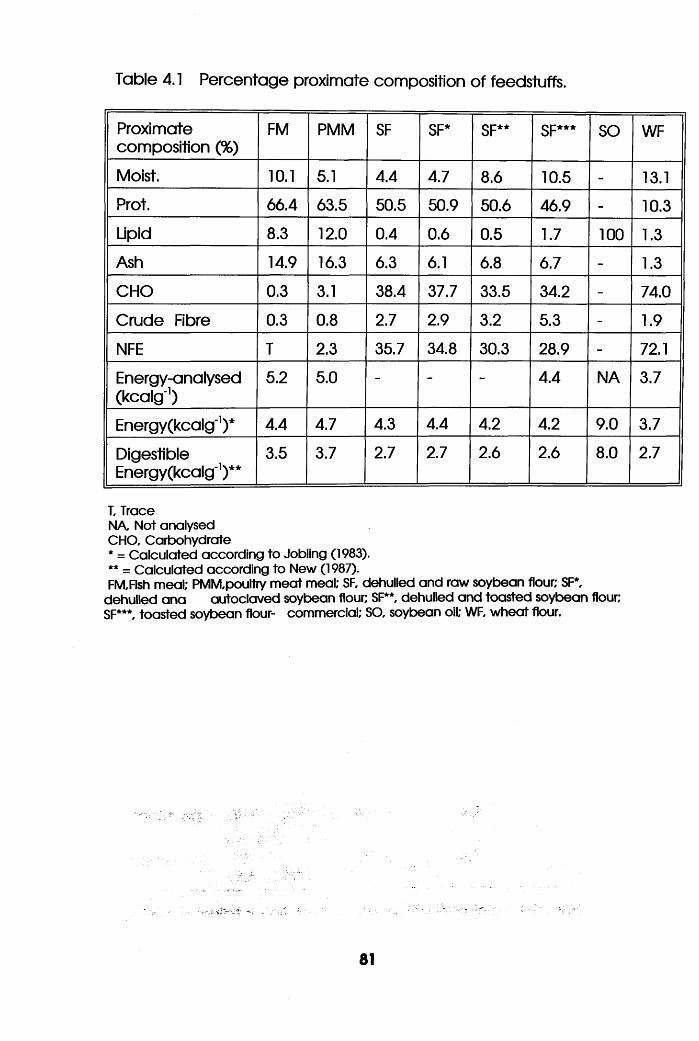
Table 4.1 Percentage proximate composition of feedstuffs.
Proximate composition (%)
FM PMM SF SF* SF** SF*** SO WF
Moist. 10.1 5.1 4.4 4.7 8.6 10.5 - 13.1
Prot. 66.4 63.5 50.5 50.9 50.6 46.9 - 10.3
Lipid 8.3 12.0 0.4 0.6 0.5 1.7 100 1.3
Ash 14.9 16.3 6.3 6.1 6.8 6.7 - 1.3
CHO 0.3 3.1 38.4 37.7 33.5 34.2 - 74.0
Crude Fibre 0.3 0.8 2.7 2.9 3.2 5.3 - 1.9
NFE T 2.3 35.7 34.8 30.3 28.9 - 72.1
Energy-analysed(kca lg1)
5.2 5.0 - - - 4.4 NA 3.7
Energy(kcalg-1)* 4.4 4.7 4.3 4.4 4.2 4.2 9.0 3.7
DigestibleEnergyCkcalg"1)**
3.5 3.7 2.7 2.7 2.6 2.6 8.0 2.7
T, TraceNA, Not analysed CHO. Carbohydrate* = Calculated according to Jobling (1983).** = Calculated according to New (1987).FM.Fish meal; PMM.poultry meat meal; SF, dehulled and raw soybean flour; SF*,
dehulled ana autoclaved soybean flour; SF**, dehulled and toasted soybean flour; SF***, toasted soybean flour- commercial; SO, soybean oil; WF, wheat flour.
81
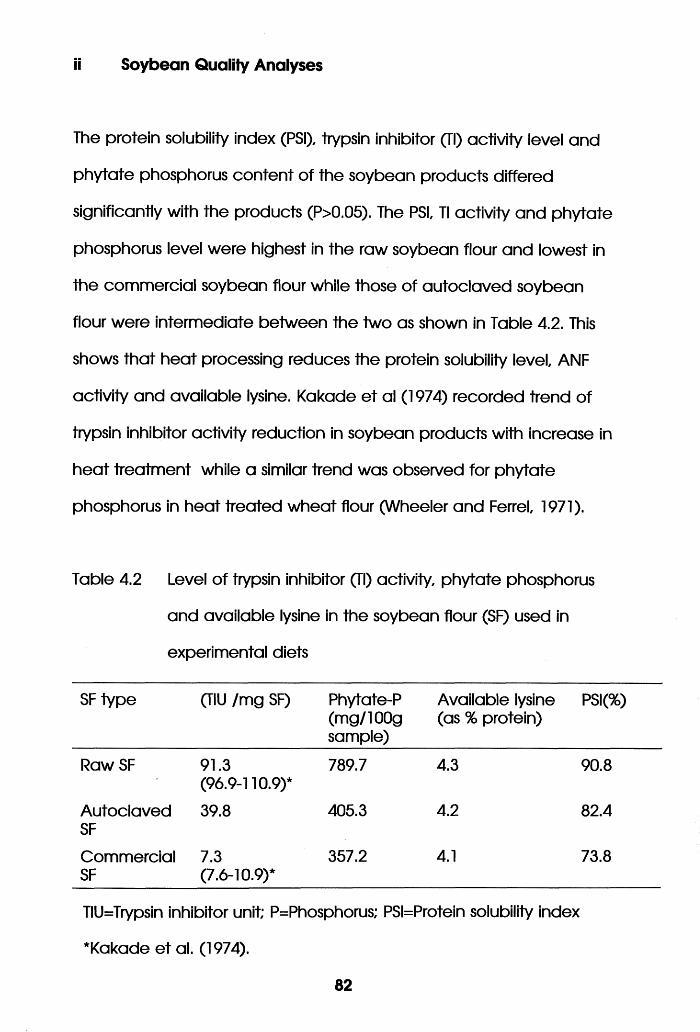
ii Soybean Quality Analyses
The protein solubility index (PSI), trypsin inhibitor (Tl) activity level and
phytate phosphorus content o f the soybean products differed
significantly with the products (P>0.05). The PSI Tl activity and phytate
phosphorus level were highest in the raw soybean flour and lowest in
the commercial soybean flour while those of autoclaved soybean
flour were intermediate between the two as shown in Table 4.2. This
shows tha t heat processing reduces the protein solubility leve l ANF
activity and available lysine. Kakade e t al (1974) recorded trend of
trypsin inhibitor activity reduction in soybean products with increase in
heat treatm ent while a similar trend was observed for phytate
phosphorus in heat treated wheat flour (Wheeler and Ferrel 1971).
Table 4.2 Level o f trypsin inhibitor (Tl) activity, phytate phosphorus
and available lysine in the soybean flour (SF) used in
experimental diets
SF type (TIU /m g SF) Phytate-P(mg/lOOgsample)
Available lysine (as % protein)
PS!(%)
Raw SF 91.3(96.9-110.9)*
789.7 4.3 90.8
AutoclavedSF
39.8 405.3 4.2 82.4
CommercialSF
7.3(7.6-10.9)*
357.2 4.1 73.8
TIU=Trypsin inhibitor unit; P=Phosphorus; PSI=Protein solubility index
*Kakade e t al. (1974).
82
4.2 Digestibility of Soybean Flour, Poultry Meat Meal and Wheat
Flour in Oreochromis niloticus and Clarias gariepinus
4.2.1 Introduction
A basic step in the choice of a feedstuff in the formulation of a good
d ie t is knowledge of its digestibility. This has been necessitated by the
quest for the development of low-cost diets using agricultural by
products in fish culture (De Silva et al., 1990). Most o f these are non-
conventional and will therefore demand characterisation by
biological and chemical evaluation. Digestibility is also an indicator of
potentially available energy and nutrients for maintenance, growth
and reproduction of the animal and a measure of indigestible
nutrients that account for major portion of wastes generated from
aquaculture operation (Cho, 1991). The digestibility coefficients of
feedstuffs in a diet are largely unaffected by biotic and abiotic
factors, and additives.(Cho and Kaushik, 1990). This has made possible
the development of a mathematical and predictive model for the
digestibility of innumerable diet formulations possible from such
feedstuffs.
Several methods have been developed for feedstuff digestibility
investigation. Cho et al., (1985) replaced 30% of a reference diet with
the test ingredient. De Silva et al., (1990) found that mixing 15-20% of
83
the ingredient (leaf meal) in a reference diet would be more
desirable in determining the digestibilty of leaf meal in Oreochromis
aureus. However, their results showed very high apparent digestibility
coefficients (ADC) for test diets with 10 and 20% inclusion levels o f the
test ingredient. There were cases a t 10% where this gave higher ADC
o f test diet than the reference diet signifying >100% digestibility which
is theoretically impossible. Values obtained a t 20% and above
guaranteed <100% ADC values.
This controversy requires further investigation into the conventional
digestibility study method. As a result of the foregoing, 30% inclusion
levels of ingredients, viz; soybean flour, poultry meat meal and wheat
flour into a reference diet containing fish meal and wheat flour to
give the test diet were adopted for this investigation. The study is
intended to basically characterise the feedstuffs in terms of their
macro-nutrient digestibility.
84
4.2.2 Materials and Methods
Four reference diets (4 kcalg'1 energy and 38% crude protein)
containing fish meal as protein supplement and wheat flour were
formulated. Soybean flour (conventionally used commercial grade),
poultry m eat meal and wheat flour were used to individually replace
30% o f each of three of the reference diets to give three test diets as
shown in Table 4.4. The proximate composition of the ingredients are
presented in Table 4.3. These four diets were fed to Oreochromis
niloticus (M±S.E.=21.6±0.6g) and Clarias gariepinus (M±S.E.= 50.0±1.8g)
a t 2% body weight per day a t 11:00 Hr for four weeks.The first week for
acclim ation and faecal collection was effected for the remaining
three weeks.
Waste was siphoned out a t 13:00 and faecal collection made a t
10:00 before next feeding. Fish were stocked a t 10 per 50L tank in a
recirculatory system having water flow rate reduced to 0.5L per
minute circulating from the top. Water quality parameters were
monitored as described in 3.5.2: Temperature, 26-27°C; dissolved
oxygen (DO), 4.4-6.2 mgL'1; pH, 6.0-6.5; NH3-N, 0.2-0.6 mgL'1; N 02-N, 0.2
mgL'1; N03-N, 10-20 mgL"1; Ca-hardness, 51-62 mgL'1 and total
hardness, 59-71 mgL'1 .
85
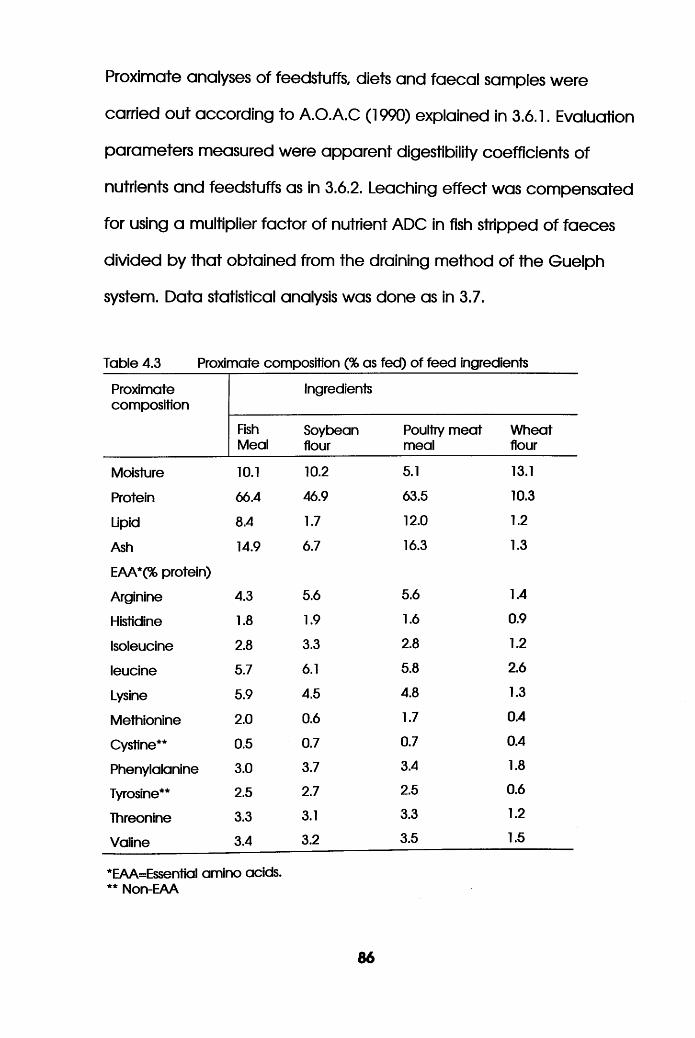
Proximate analyses of feedstuffs, diets and faecal samples were
carried out according to A.O.A.C (1990) explained in 3.6.1. Evaluation
parameters measured were apparent digestibility coefficients of
nutrients and feedstuffs as in 3.6.2. Leaching effect was compensated
for using a multiplier factor of nutrient ADC in fish stripped of faeces
divided by that obtained from the draining method of the Guelph
system. Data statistical analysis was done as in 3.7.
Table 4.3 Proximate composition (% as fed) of feed ingredients
Proximatecomposition
Ingredients
FishMeal
Soybeanflour
Poultry meat meal
Wheatflour
Moisture 10.1 10.2 5.1 13.1
Protein 66.4 46.9 63.5 10.3
Upid 8.4 1.7 12.0 1.2
Ash 14.9 6.7 16.3 1.3
EAA*(% protein)
Arginine 4.3 5.6 5.6 1.4
Histidine 1.8 1.9 1.6 0.9
Isoleucine 2.8 3.3 2.8 1.2
leucine 5.7 6.1 5.8 2.6
Lysine 5.9 4.5 4.8 1.3
Methionine 2.0 0.6 1.7 0.4
Cystine** 0.5 0.7 0.7 0.4
Phenylalanine 3.0 3.7 3.4 1.8
Tyrosine** 2.5 2.7 2.5 0.6
Threonine 3.3 3.1 3.3 1.2
Valine 3.4 3.2 3.5 1.5
*EAA=Essential amino acids.** Non-EAA
86
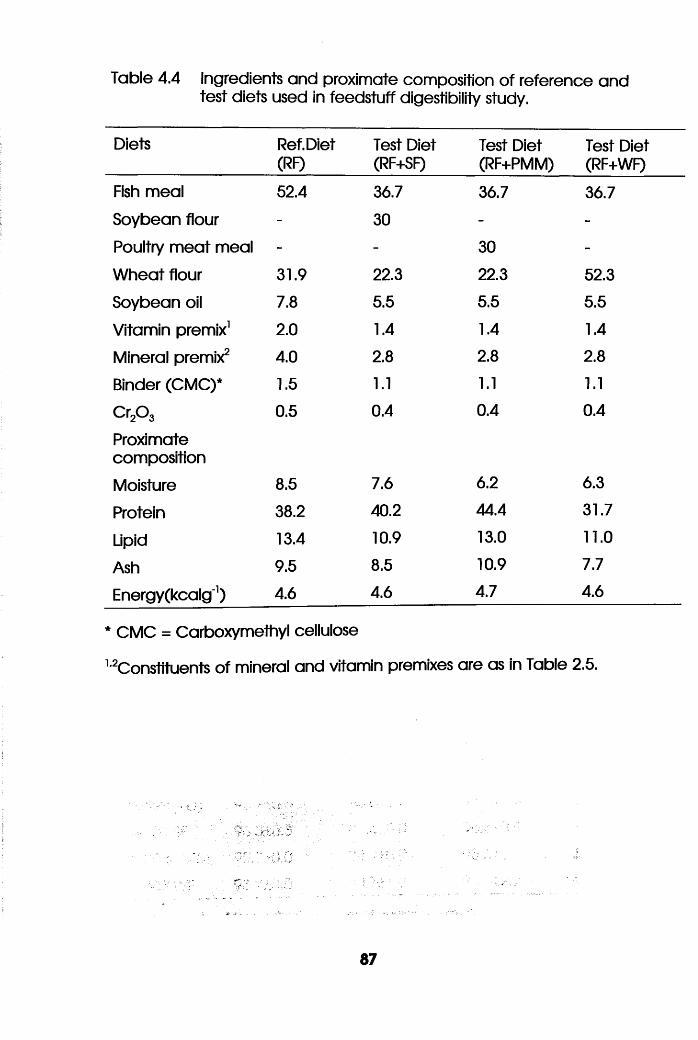
Table 4.4 Ingredients and proximate composition of reference and test diets used in feedstuff digestibility study.
Diets Ref. Diet (RF)
Test Diet (RF+SF)
Test Diet (RF+PMM)
Test Diet (RF+WF)
Fish meal 52.4 36.7 36.7 36.7
Soybean flour - 30 - -
Poultry m eat meal - - 30 -
W heat flour 31.9 22.3 22.3 52.3
Soybean oil 7.8 5.5 5.5 5.5
Vitamin premix1 2.0 1.4 1.4 1.4
Mineral premix2 4.0 2.8 2.8 2.8
Binder (CMC)* 1.5 1.1 1.1 1.1
Cr20 3 0.5 0.4 0.4 0.4
Proximatecomposition
Moisture 8.5 7.6 6.2 6.3
Protein 38.2 40.2 44.4 31.7
Lipid 13.4 10.9 13.0 11.0
Ash 9.5 8.5 10.9 7.7
Energy(kcalg_1) 4.6 4.6 4.7 4.6
* CMC = Carboxymethyl cellulose
^Constituents of mineral and vitamin premixes are as in Table 2.5.
87
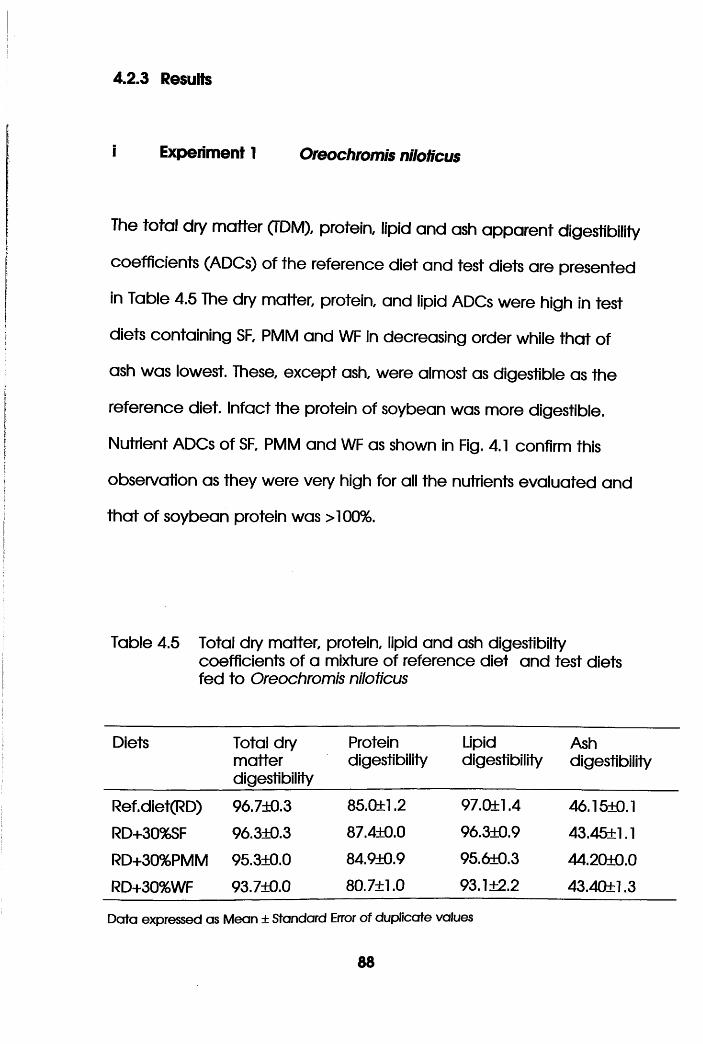
4.2.3 Results
i Experiment 1 Oreochromis niloticus
The tota l dry matter (TDM), protein, lipid and ash apparent digestibility
coefficients (ADCs) of the reference diet and test diets are presented
in Table 4.5 The dry matter, protein, and lipid ADCs were high in test
diets containing SF, PMM and WF in decreasing order while that of
ash was lowest. These, except ash, were almost as digestible as the
reference diet. Infact the protein of soybean was more digestible.
Nutrient ADCs of SF, PMM and WF as shown in Fig. 4.1 confirm this
observation as they were very high for all the nutrients evaluated and
tha t o f soybean protein was >100%.
Table 4.5 Total dry matter, protein, lipid and ash digestibiltycoefficients of a mixture of reference diet and test diets fed to Oreochromis niloticus
Diets Total drymatterdigestibility
Proteindigestibility
Lipiddigestibility
Ashdigestibility
Ref.diet(RD) 96.7±0.3 85.0±1.2 97.0±1.4 46.15±0.1
RD+30%SF 96.3±0.3 87.4±0.0 96.3±0.9 43.45+1.1
RD+30%PMM 95.3±0.0 84.9+0.9 95.6+0.3 44.20+0.0
RD+30%WF 93.7±0.0 80.7±1.0 93.1 ±2.2 43.4G±1.3
Data expressed as Mean ± Standard Error of duplicate values
88
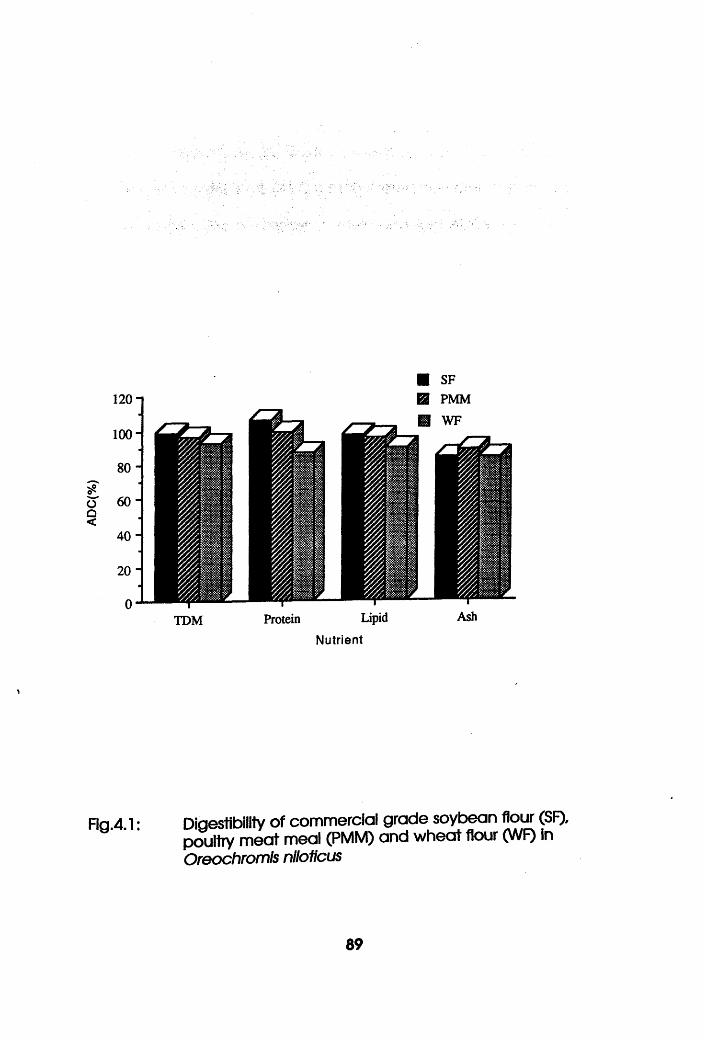
■ SFH PMM
H WF
TDM Protein Lipid AshNutrient
Digestibility o f commercial grade soybean flour (SF). poultry meat meal (PMM) and wheat flour (WF) in Oreochromis nllolicus
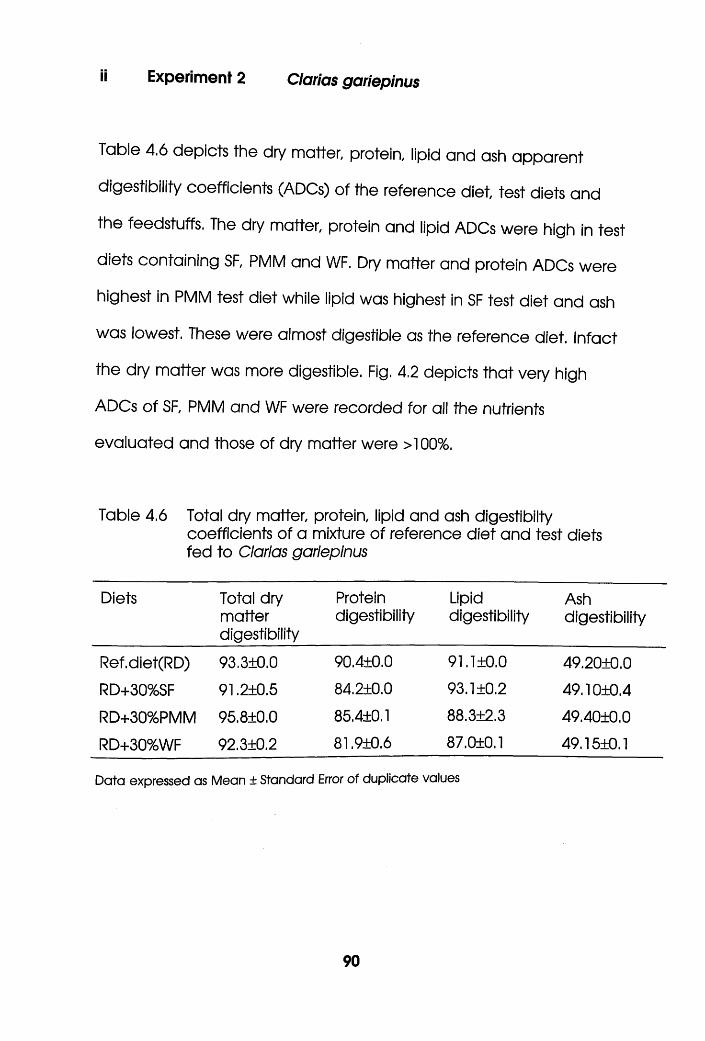
ii Experiment 2 Clarias gariepinus
Table 4.6 depicts the dry matter, protein, lipid and ash apparent
digestibility coefficients (ADCs) of the reference diet, test diets and
the feedstuffs. The dry matter, protein and lipid ADCs were high in test
diets containing SF, PMM and WF. Dry matter and protein ADCs were
highest in PMM test diet while lipid was highest in SF test diet and ash
was iowest. These were almost digestible as the reference diet. Infact
the dry matter was more digestible. Fig. 4.2 depicts that very high
ADCs of SF, PMM and WF were recorded for all the nutrients
evaluated and those of dry matter were >100%.
Table 4.6 Total dry matter, protein, lipid and ash digestibiltycoefficients of a mixture of reference diet and test diets fed to Clarias gariepinus
Diets Total drymatterdigestibility
Proteindigestibility
Lipiddigestibility
Ashdigestibility
Ref.diet(RD) 93.3±0.0 90.4+0.0 91.1+0.0 49.20+0.0
RD+30%SF 91.2+0.5 84.2+0.0 93.1+0.2 49.10+0.4
RD+30%PMM 95.8±0.0 85.4+0.1 88.3+2.3 49.40+0.0
RD+30%WF 92.3±0.2 81.9+0.6 87.0+0.1 49.15+0.1
Data expressed as Mean ± Standard Error of duplicate values
90
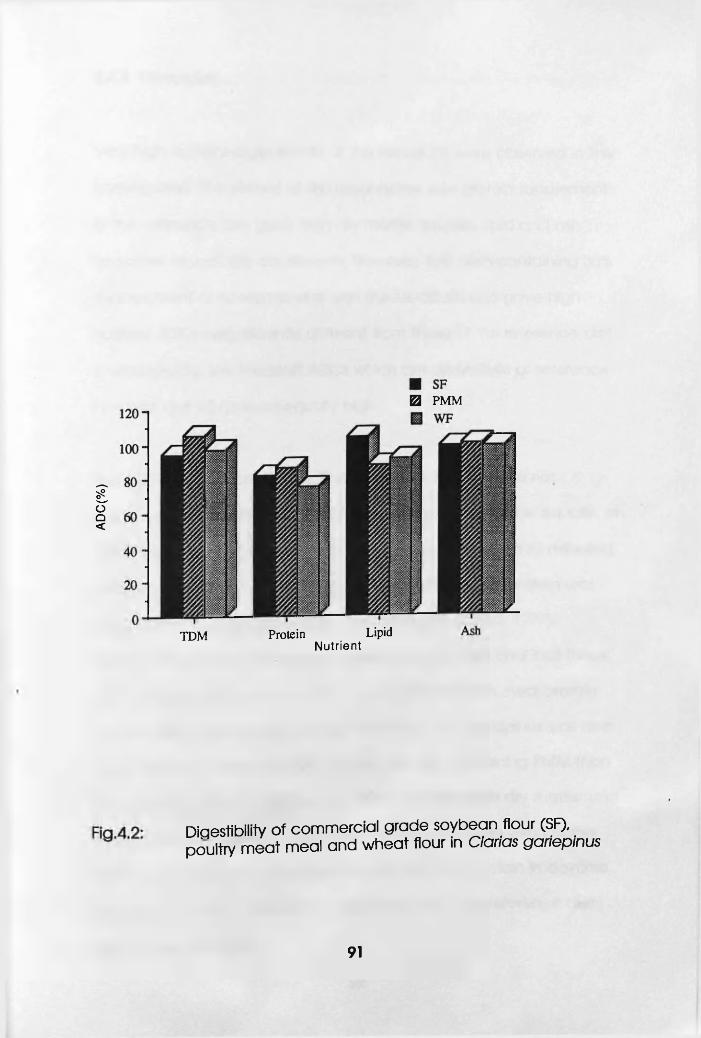
AD
C(%
)
0 PM M
TDM Protein LipidNutrient
Diqestibility of commercial grade soybean flour (SF), poultry meat meal and wheat flour in Clarias gariepinus
91
4.4.4 Discussion
Very high nutrient digestibilities of the feedstuffs were observed in this
investigation. The choice of fish meal as the sole protein supplement
in the reference diet gave high dry matter, protein, lipid and ash
apparent digestibility coefficients. However, test diets containing 30%
replacem ent of reference diet with the feedstuffs also gave high
nutrient ADCs insignificantly different from those of the reference diet.
Consequently, the feedstuff ADCs which are derivatives of reference
and test diet ADCs were equally high.
The >100% ADC recorded for SF protein in O. niloticus was not
unconnected with the fact that it has been reported to be equally, or
more, digestible than fish meal in some fishes. The protein of dehulled,
solvent-extracted soybean meal containing 49% crude protein was
reported to be 85% digestible in channel catfish (Lovell, 1977),
rainbow trout (Smith, 1976) and tilapia (Popma, 1982) and that these
ADC were equal to or higher than those for whole fish meal protein
(Lovell, 1990). The high dry matter PMM ADC in C gariepinus was as a
result o f higher dry matter ADC for the test diet containing PMM than
the reference diet. De Silva et al.,(1990) recorded high dry matter and
protein ADCs in Oreochromis aureus fed leaf meal with even higher
ADCs for dry matter in night faecal collection and protein in daytime
faecal collection at 10% level of replacement of the reference diet
with the test feedstuff.
92
The excessively high feedstuff digestibilty observed in this investigation
was attributed to reference diet type and level of replacement by
the feedstuffs in the test diets. The conventional use of fish meal which
lacks absolute digestibility superiority over other high quality feedstuffs
like dehulled, toasted and solvent extracted soybean meal needs to
be reconsidered. 30% replacement level is, from all indication,
inadequate as all test diets were almost as digestible as the reference
d ie t including that containing wheat flour. This level was probably
insignificant to effect any change.
A significantly high level of inclusion that would make the test diet
share insignificantly different nutritive value with the feedstuffs rather
than reference diet may be more appropriate. The feedstuff ADC
results from this investigation were more representative of fish meal
ADC in the reference diet than those of SF, PMM and WF in the test
diets. These postulations are not conclusive until after further
investigation. It is recommended that the level of reference diet that
will not alter the ingredient nutrient level significantly but be
acceptab le to the fish, be established, incorporated in the ingredient
and used as test diet in future investigations. In vitro screening could
be carried out to confirm the findings.
93

CHAPTER FIVE
DIGESTIBILITY, APPARENT AMINO ACID AVAILABILITY OF SOYBEAN FLOUR-POULTRY MEAT MEAL BLEND BASED DIETS FOR OREOCHROMIS
NILOTICUS AND CLARIAS GARIEPINUS.
94
5.1 Introduction
Digestibility estimations have been a major focus in aquaculture
nutrition for assessing ingredient or diet quality. However, variability still
exists on the analytical method and evaluation procedure used for
such estimation and an aspect of this is the use of internal or external
markers (Bowen, 1978; De Silva and Perera, 1983; Tacon and
Rodrigues, 1984). Higher digestibility values were recorded with the
use o f an internal marker (crude fibre) than an external one (Cr20 3) in
Oreochromis aureus (De Silva et al, 1990).
However, the use of internal marker particularly chromic oxide has
been the convention. Common levels of this marker are 0.5% and
1.0%. Comparison of two levels is uncommon leading to paucity of
information on the effect of Cr20 3 levels on digestibility values
generally. Though, this marker is biochemically inert (Maynard e t al.
1979 and Bondi, 1987) but their suspected physical inactivity calls for
caution in the choice of level in a digestibility study. Consequently,
varying Cr20 3 levels (0.5% and 1.0%) were used in this experiment to
establish the ideal marker level for optimum nutrient digestibility and
availability in O.niloticusond C.gariepinus fed diets containing three
SF:PMM blends as protein supplements. As a preamble, the water
stability o f the diets was evaluated taking into cognisance its role in
d iet disintegration and the subsequent leaching effect that often
leads to over-estimation of the digestibility of heavily leached nutrient.
95
5.2 Fingerlings
5.2.1 Materials and Methods
i Experimental Design
Two seperate experiments were conducted to evaluate the
digestibility of soybean flour (SF) - poultry meat meal (PMM) blend
based diets in fingerling Oreochromis niloticus and Clarias gariepinus.
For each experiment a 2 x 3 factorial design was used and it involved
12 10-L tanks. Each treatment was duplicated. Fingerlings of
Oreochromis niloticus (M ± S.E.M.= 22.1 ± 0.4g) and Clarias gariepinus
(M ± S.E.M.= 23.3 ± 0.6g) were stocked a t 5 per tank in a still water
digestibility system. The system itself was supplied with water from an
overhead tank thermoregulated at 28°C. Two randomly distributed
units received the same treatment.
ii Diels, Feeding and Fish Husbandry
Six isocaloric and isonitrogenous diets (Diets I - VI) were formulated on
the basis of two factors, viz; 0.5% and 1.0% levels of Cr20 3, and 25:75,
50:50 and 75:25 soybean flour (SF) : poultry meat meal (PMM) blends
based diets. Table 5.1 shows the proximate analysis of the diets used.
Soybean flour used was of commercial grade with a 73.63% protein
96
solubility index as analysed according to Araba and Dale (1990). High
quality poultry meat meal was supplied by Chettles UK Ltd,
Nottingham. Feedstuffs were mixed using Hobart Mixer and pelleted
using California Pellet Mill (Model CL2) equipped with steam
conditioner. Pelleted diets were dried by convection a t 60°C
overnight. After cooling diets were packed in sealed black
polyethylene bags and stored a t -30°C until required.
Initially fish were fed for one week to acclimate them to the d ie t the
system and free their guts from pre - experimental diet. They were fed
for three weeks to collect sufficient faecal matter for analysis . Feed
was given a t 11.00 a t 2% body weight. The fishes were allowed to
feed for one hour after which feed remnants were flushed out. Faecal
matter was collected a t 10.00 the following morning, weighed and
oven-dried overnight a t 105°C prior to proximate and Cr20 3 analyses
as in 3.6.1.
iii Experimental Analysis
Feedstuffs, diets and faecal matter were analysed for proximate
composition in duplicate according to AOAC (1990) methods stated
in 3.6.1. Water stability of diets was investigated by two methods, viz:
Net immersion method, Immersing 5g of each diet in the water o f the
system for 30 minutes, 1, 2 and 3 hours; and Beaker method, leaving
97
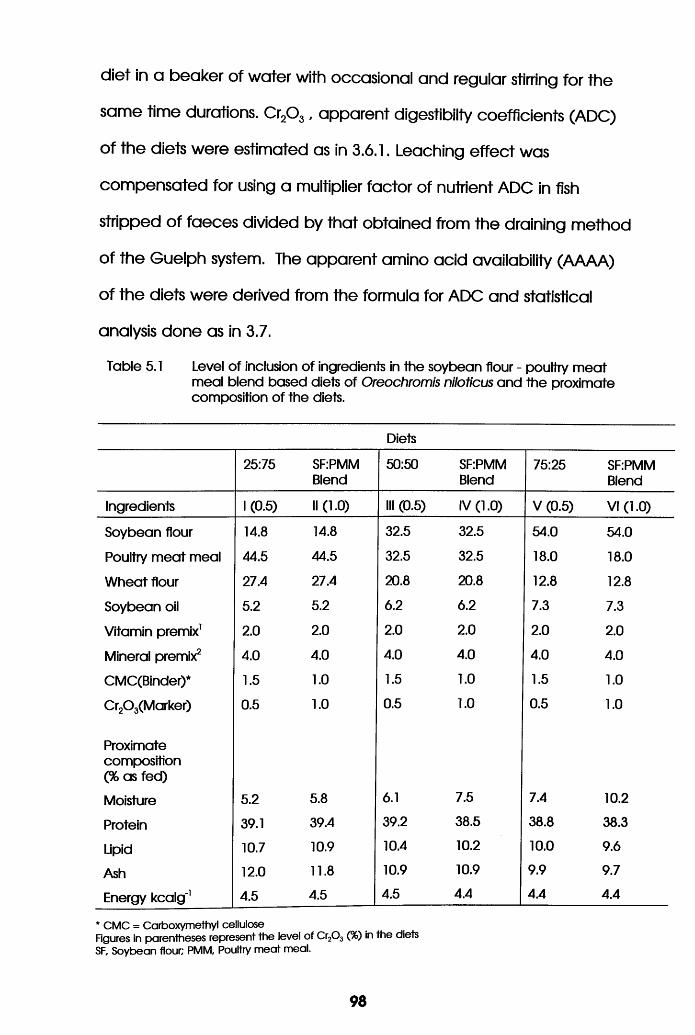
diet in a beaker of water with occasional and regular stirring for the
same time durations. Cr20 3, apparent digestibilty coefficients (ADC)
o f the diets were estimated as in 3.6.1. Leaching effect was
compensated for using a multiplier factor of nutrient ADC in fish
stripped of faeces divided by that obtained from the draining method
of the Guelph system. The apparent amino acid availability (AAAA)
o f the diets were derived from the formula for ADC and statistical
analysis done as in 3.7.
Table 5.1 Level of inclusion of ingredients in the soybean flour - poultry meat meal blend based diets of Oreochromis niloticus and the proximate composition of the diets.
Diets
25:75 SF:PMMBlend
50:50 SF:PMMBlend
75:25 SF:PMMBlend
Ingredients 1 (0.5) II (1.0) III (0.5) IV (1.0) V (0.5) VI (1.0)
Soybean flour 14.8 14.8 32.5 32.5 54.0 54.0
Poultry meat meal 44.5 44.5 32.5 32.5 18.0 18.0
Wheat flour 27.4 27.4 20.8 20.8 12.8 12.8
Soybean oil 5.2 5.2 6.2 6.2 7.3 7.3
Vitamin premix1 2.0 2.0 2.0 2.0 2.0 2.0
Mineral premix2 4.0 4.0 4.0 4.0 4.0 4.0
CMC(Binder)* 1.5 1.0 1.5 1.0 1.5 1.0
Cr20 3(Marker) 0.5 1.0 0.5 1.0 0.5 1.0
Proximate composition (% as fed)
Moisture 5.2 5.8 6.1 7.5 7.4 10.2
Protein 39.1 39.4 39.2 38.5 38.8 38.3
Lipid 10.7 10.9 10.4 10.2 10.0 9.6
Ash 12.0 11.8 10.9 10.9 9.9 9.7
Energy kcalg"1 4.5 4.5 4.5 4.4 4.4 4.4
* CMC = Carboxymethyl celluloseFigures in parentheses represent the level of Cr20 3 (%) in the diets SF. Soybean flour; PMM. Poultry meat meal.
98
5.2.2 Results and Discussion
i Diets Water Stability
Figs. 5.1a and b show the water stability of selected diets representing
25:75; 50:50 and 75:25 soybean flour (SF): poultry meat meal (PMM)
inclusion levels i.e diets I, III and V respectively. Diet V had higher
stability than diets III and I in that order implying that diets with more
SF were more water stable than those with more PMM. This trend was
observed with the two methods adopted here. However, higher
values were obtained with the method of stirring the diets in a beaker
of water than immersing in the water of the experimental system.
More than 80% and 60% of any of the diets were water stable after 3
hours with the immersion in the system water and stirring in a beaker
of water methods respectively.
The higher carbohydrate content of SF than PMM provided additional
binding and consequently better stability. The occasional stirrling of
diet in a beaker of water caused more attrition and abrasion than
recorded with net immersed diets in the water of the system.
99
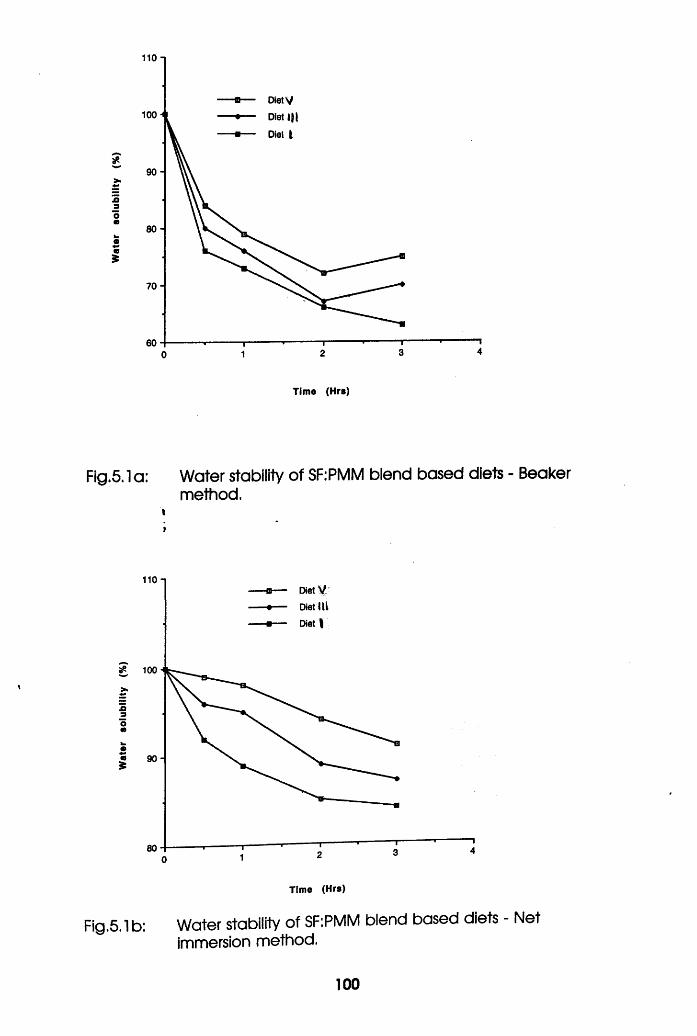
Wat
er
solu
bilit
y (%
)
110 -i
DietV
Diet l ||
Diet t
100 h
90 -
80-
70 -
Time (Hrs)
Fig.5.1 a: Water stability of SF:PMM blend based diets - Beakermethod.
t»
110 1Diet V
Diet IU
Diet |
jD3Omw
a 90-
Tlme (Hrs)
Fig.5.lb: Water stability of SF:PMM blend based diets - Netimmersion method.
100
ii Experiment 1: Digestibility, Amino Acid Availability of SF-PMM
Blend Based Diets in Oreochromis niloticus Fingerlings
(a) Nutrient Digestibility
Fig. 5.2 presents the dry matter (DM) protein (PR), lipid (LP) and ash
digestibility coefficients of the six diets. Lipid digestion was highest of
the three nutrients. Significantly higher values were obtained for diets
containing 0.5% Cr2Os than 1.0% Cr20 3 for protein and ash in most
cases. The high lipid digestibiity coefficients for all the diets may be
attributed to high lipase activity in fish generally (Sargent, e t al 1989;
De Silva and Anderson, 1995). Protein digestibiity was moderately
higher and lower for diets containing 0.5 and 1.0 % Cr20 3 respectively.
The increased level of Cr20 3 lowered digestibility in the latter, in
implied agreement with De Silva et al. (1990) who observed that
ingredients with Cr20 3 (external marker) had lower digestibilities than
those with crude fibre (internal marker) in Oreochromis aureus.
Lovell (1990) reported that the protein of dehulled solvent extracted
soybean meal was 85% digestible, equal to or higher than that of
whole fish meal protein in channel catfish. Protein of the 75:25 SF:PMM
blend based diet was better digestible than of 25:75 and 50:50
SF:PMM. The herbivorous feeding habit of tilapias (Reed e t al, 1969)
could be responsible for this trend of observation. This requires
confirmation through further study.
101
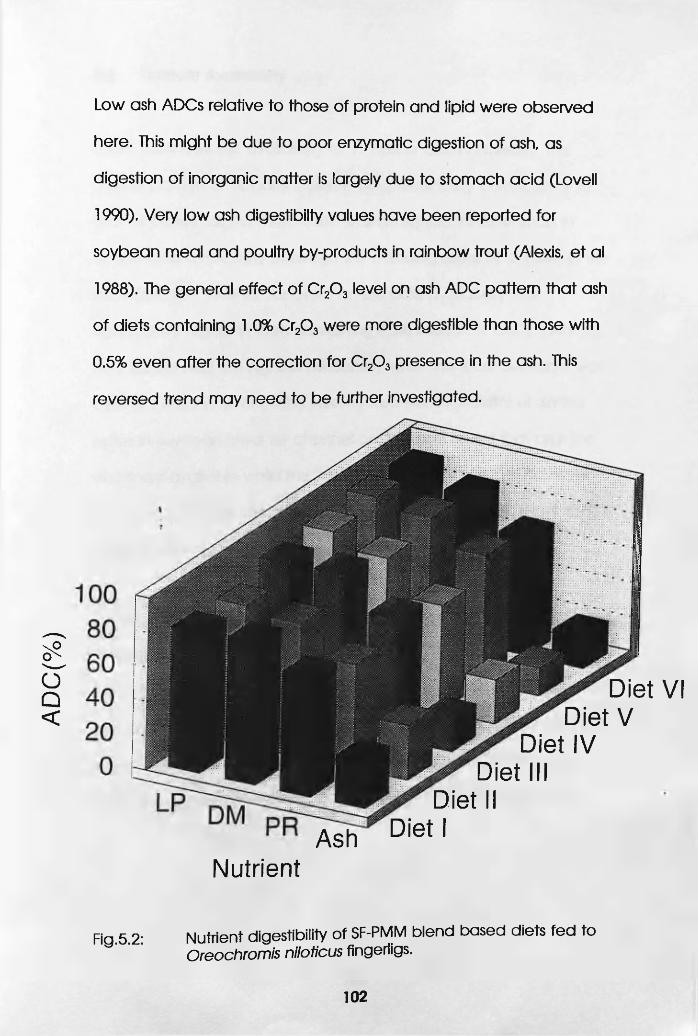
ADC
(%)
Low ash ADCs relative to those of protein and lipid were observed
here. This might be due to poor enzymatic digestion of ash, as
digestion of inorganic matter is largely due to stomach acid (Lovell
1990). Very low ash digestibiity values have been reported for
soybean meal and poultry by-products in rainbow trout (Alexis, e t al
1988). The general effect of Cr20 3 level on ash ADC pattern that ash
o f diets containing 1.0% Cr20 3 were more digestible than those with
0.5% even after the correction for Cr20 3 presence in the ash. This
reversed trend may need to be further investigated.
Ash
Diet VI Diet V
Diet IV Diet III
Diet II Diet I
Nutrient
Fig.5.2: Nutrient digestibility of SF-PMM blend based diets fed toOreochromis niloticus fingerligs.
102
(b) Nutrient Availability
Table 5.2 shows the availability of 17 amino acids analysed. The
overall pattern of apparent amino acid availability corresponds to
tha t o f protein digestibility. There was no significant difference in
amino acid availability between the blending ratios of SF:PMM in the
diets (p>0.05). Overall apparent amino acid availability was
significantly higher in diets containing 0.5% than 1.0% Cr20 3 (p<0.05).
Methionine had the highest availability while the least available was
cystine . Wilson , et al (1981) investigated the availability of amino
acids in soybean meal for channel catfish and found that arginine
was most available while the least available was glycine. However,
they presented the availability of methionine + cystine in combination,
these have been seperated in this investigation.
Table 5.3 relates the amino acids in the diets to the requirement data
of Santiago and Lovell (1988) to establish the limiting amino acids. It
shows that methionine was the first limiting amino acid while Leucine
was in excess. Coincidentally, methionine had the highest availability.
Whether deficiency of an amino acid could possibly influence its
apparent availability may need to be experimentally investigated.
103
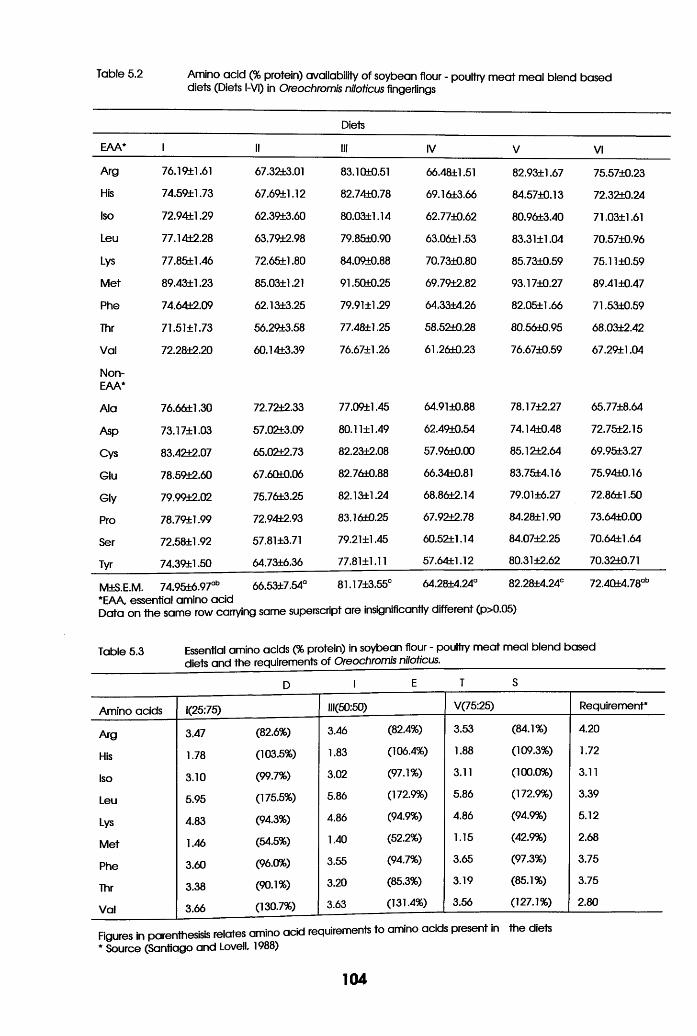
Table 5.2 Amino acid (% protein) availability of soybean flour - poultry meat meal blend baseddiets (Diets l-VI) in Oreochromis niloticus fingerlings
Diets
EAA* 1 II III IV V VI
Arg 76.19±1.61 67.32+3.01 83.10+0.51 66.48+1.51 82.93+1.67 75.57+0.23
His 74.59+1.73 67.69+1.12 82.74+0.78 69.16+3.66 84.57+0.13 72.32t0.24
Iso 72.94±1.29 62.39+3.60 80.03+1.14 62.77+0.62 80.96+3.40 71.03+1.61
Leu 77.14+2.28 63.79fc2.98 79.85+0.90 63.06+1.53 83.31+1.04 70.57+0.96
Lys 77.85+1.46 72.65+1.80 84.09+0.88 70.73+0.80 85.73+0.59 75.11+0.59
Met 89.43+1.23 85.03+1.21 91.50+0.25 69.79t2.82 93.17+0.27 89.41+0.47
Phe 74.64+2.09 62.13+3.25 79.91+1.29 64.33+4.26 82.05+1.66 71.53+0.59
Thr 71.51+1.73 56.29±3.58 77.48+1.25 58.52+0.28 80.56+0.95 68.03+2.42
Val 72.28±2.20 60.14+3.39 76.67+1.26 61.26+0.23 76.67+0.59 67.29tl .04
Non-EAA*
Ala 76.66±1.30 72.72+2.33 77.09tl.45 64.91+0.88 78.17+2.27 65.77+8.64
Asp 73.17+1.03 57.02t3.09 80.11+1.49 62.49±0.54 74.14+0.48 72.75+2.15
Cys 83.42+2.07 65.02+2.73 82.23+2.08 57.96+0.00 85.12+2.64 69.95+3.27
Glu 78.59+2.60 67.60+0.06 82.76±0.88 66.34+0.81 83.75+4.16 75.94+0.16
Gly 79.99+2.02 75.76+3.25 82.13+1.24 68.86+2.14 79.01+6.27 72.86+1.50
Pro 78.79fcl.99 72.94+2.93 83.16±0.25 67.92+2.78 84.28+1.90 73.64+0.00
Ser 72.58+1.92 57.81+3.71 79.21+1.45 60.52tl.14 84.07+2.25 70.64+1.64
Tyr 74.39+1.50 64.73+6.36 77.81+1.11 57.64+1.12 80.31+2.62 70.32+0.71
M+S.E.M. 74.95±6.97ab 66.53+7.54° 81.17+3.55° 64.28+4.24° 82.28+4.24° 72.40±4.78°fc*EAA, essential amino acidData on the same row carrying same superscript are insignificantly different (p>0.05)
Table 5.3 Essential amino acids (% protein) in soybean flour - poultry meat meal blend baseddiets and the requirements of Oreochromis niloticus.__________________________
D 1 E T S
Amino acids 1(25:75) 111(50:50) V(75:25) Requirement*
Arg 3.47 (82.6%) 3.46 (82.4%) 3.53 (84.1%) 4.20
His 1.78 (103.5%) 1.83 (106.4%) 1.88 (109.3%) 1.72
Iso 3.10 (99.7%) 3.02 (97.1%) 3.11 (100.0%) 3.11
Leu 5.95 (175.5%) 5.86 (172.9%) 5.86 (172.9%) 3.39
Lys 4.83 (94.3%) 4.86 (94.9%) 4.86 (94.9%) 5.12
Met 1.46 (54.5%) 1.40 (52.2%) 1.15 (42.9%) 2.68
Phe 3.60 (96.0%) 3.55 (94.7%) 3.65 (97.3%) 3.75
Thr 3.38 (90.1%) 3.20 (85.3%) 3.19 (85.1%) 3.75
Val 3.66 (130.7%) 3.63 (131.4%) 3.56 (127.1%) 2.80
Figures in parenthesisis relates amino acid requirements to amino acids present in the diets * Source (Santiago and Lovell, 1988)
104
ii Experiment 2: Digestibility and Amino Acid Availability of
Soybean Flour-Poultry Meat Meal Blend Based
Diets in Clarias gariepinus Fingerlings
(a) Nutrient Digestibility
Fig. 5.3 presents the dry matter, protein, lipid and ash digestibility
coefficients of the six diets. Similar, to the observation in O.niloticus,
lipid digestion was highest of the three nutrients. The digestibility of dry
m atter and lipid did not reflect the level of Cr20 3 in the diets.
Significantly higher values were obtained for diets containing 0.5%
Cr20 3 than 1.0% Cr20 3 for protein and ash in most cases.
However, protein of 75:25 SF:PMM blend based diet which was best
digestible than 25:75 and 50:50 SF:PMM in O.niloticus was not.
C.goriepinus seemed to digest efficiently proteins of both SF and PMM
hence the better protein ADCs of 50:50 SF:PMM than any other. The
omnivorous feeding habit which tends towards carnivory (Reed et al,
1969) could be responsible. This is not conclusive as it will need to be
further investigated. Pattern of ash digestibility was also similar to that
o f O.niloticus.
105
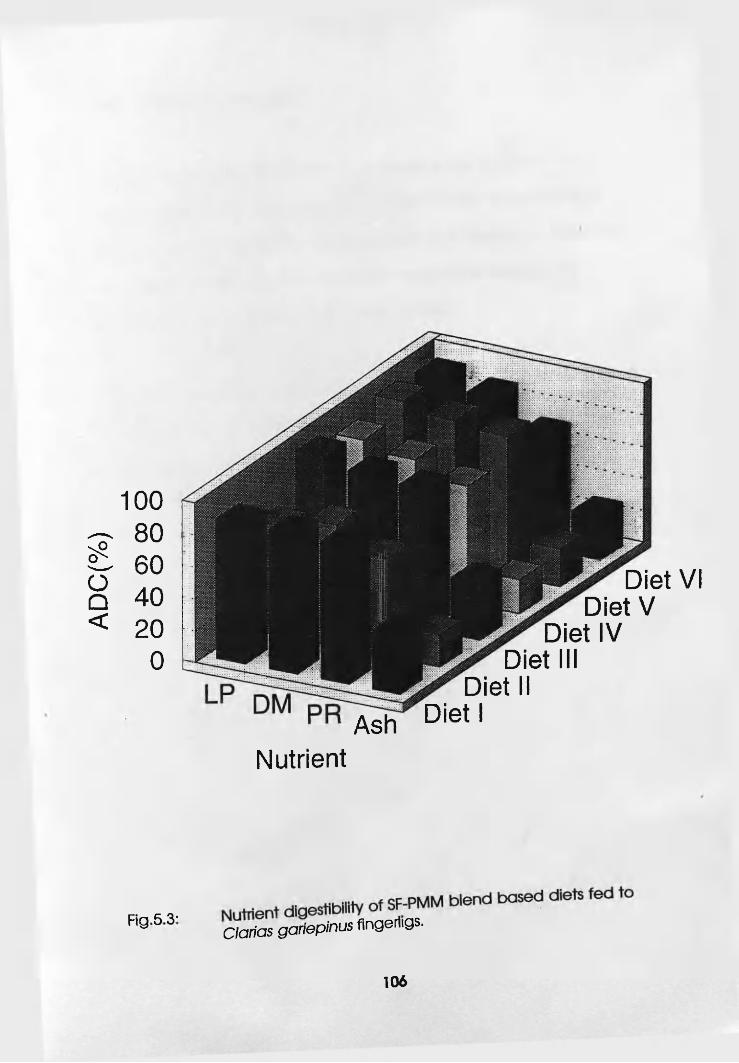
AD
C(%
)
10080604020
0
Nutrient
Diet VI Diet V
Diet IV Diet III
Diet IIAsh Dietl
Hg63.9 Clarias gariepinus flngerligs.
106
(b) Nutrient Availability
Table 5.4 shows the availability of 17 amino acids analysed. The
overall pattern of apparent amino acid availability corresponds to
tha t o f protein digestibility and similar to that of O.niloticus. There was
no significant difference in amino acid availability between the
blending ratios of SF:PMM in the diets (p>0.05).
Table 5.5 relates the amino acids in the diets to the requirements data
o f NRC (1983) to establish the limiting amino acids. It shows that
methionine was the first limiting amino acid while Leucine was in
excess following the same trend as in O.niloticus.
107
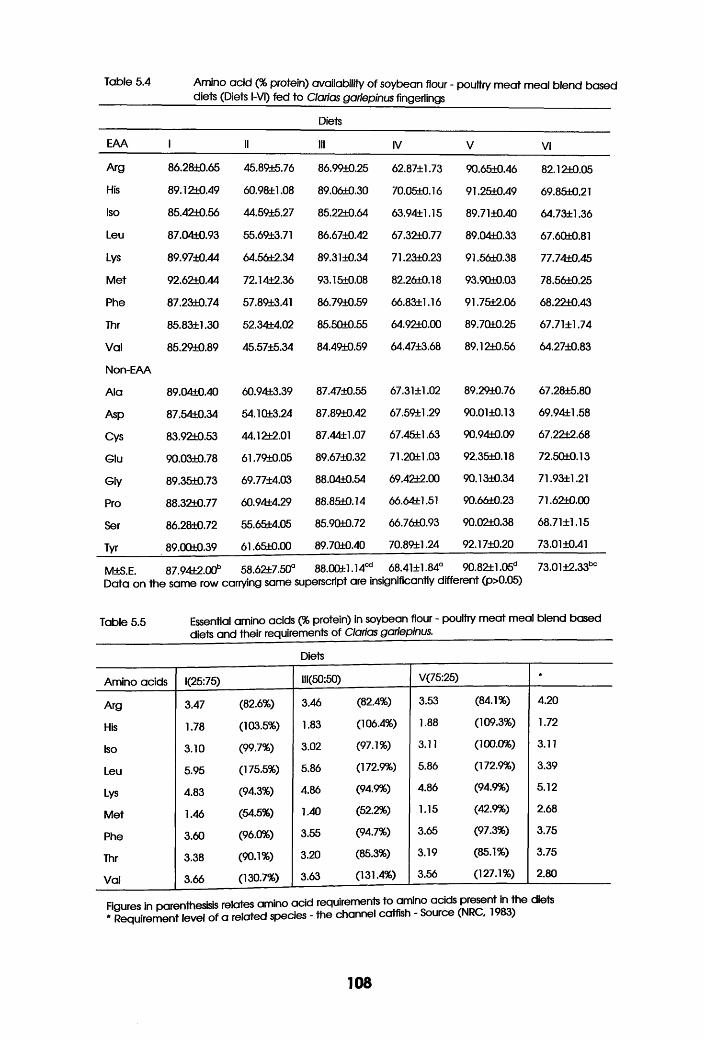
Table 5.4 Amino acid (% protein) availability of soybean flour - poultry meat meal blend baseddiets (Diets l-VI) fed to Clarias gariepinus fingerlings
Diets
EAA 1 II III IV V VI
Arg 86.28±0.65 45.89t5.76 86.99t0.25 62.8711.73 90.6510.46 82.1210.05
His 89.12t0.49 60.98il .08 89.0610.30 70.0510.16 91.2510.49 69.8510.21
Iso 85.42t0.56 44.59t5.27 85.22t0.64 63.9411.15 89.7110.40 64.7311.36
Leu 87.04i0.93 55.69t3.71 86.6710.42 67.32t0.77 89.0410.33 67.6Qt0.81
Lys 89.9710.44 64.56t2.34 89.3110.34 71.2310.23 91.5610.38 77.7410.45
Met 92.6210.44 72.14i2.36 93.1510.08 82.2610.18 93.9010.03 78.5610.25
Phe 87.23tO.74 57.89t3.41 86.79t0.59 66.8311.16 91.7512.06 68.22t0.43
Thr 85.83±1.30 52.34t4.02 85.5QtO.55 64.9210.00 89.7QtO.25 67.7111.74
Val 85.29i0.89 45.5715.34 84.4910.59 64.4713.68 89.12t0.56 64.2710.83
Non-EAA
Ala 89.0410.40 60.94i3.39 87.4710.55 67.3111.02 89.29i0.76 67.2815.80
Asp 87.54t0.34 54.10tt3.24 87.89t0.42 67.59tl.29 90.0110.13 69.9411.58
Cys 83.92+0.53 44.12+2.01 87.4411.07 67.4511.63 90.94i0.09 67.22t2.68
Glu 90.03i0.78 61.7910.05 89.6710.32 71.2QL1.03 92.3510.18 72.5Qt0.13
Gly 89.35iO.73 69.7714.03 88.0410.54 69.4212.00 90.1310.34 71.9311.21
Pro 88.3210.77 60.9414.29 88.8510.14 66.6411.51 90.6610.23 71.6210.00
Ser 86.28i0.72 55.6514.05 85.9QtO.72 66.7610.93 90.02t0.38 68.7111.15
Tyr 89.0Qt0.39 61.6510.00 89.7010.40 70.89tl.24 92.1710.20 73.0110.41
M+S.E. 87.94E2.00b 58.62±7.50a 88.0Qil.l4cd 68.4111.84° 90.82±1.05dData on the same row carrying same superscript are insignificantly different (p>0.05)
73.01i2.33bc
Table 5.5 Essential amino acids (% protein) in soybean flour - poultry meat meal blend baseddiets and their requirements of Clarias gariepinus._____________________________
Diets
Amino acids 1(25:75) 111(50:50) V(75:25) *
Arg 3.47 (82.6%) 3.46 (82.4%) 3.53 (84.1%) 4.20
His 1.78 (103.5%) 1.83 (106.4%) 1.88 (109.3%) 1.72
Iso 3.10 (99.7%) 3.02 (97.1%) 3.11 (100.0%) 3.11
Leu 5.95 (175.5%) 5.86 (172.9%) 5.86 (172.9%) 3.39
Lys 4.83 (94.3%) 4.86 (94.9%) 4.86 (94.9%) 5.12
Met 1.46 (54.5%) 1.40 (52.2%) 1.15 (42.9%) 2.68
Phe 3.60 (96.0%) 3.55 (94.7%) 3.65 (97.3%) 3.75
Thr 3.38 (90.1%) 3.20 (85.3%) 3.19 (85.1%) 3.75
Val 3.66 (130.7%) 3.63 (131.4%) 3.56 (127.1%) 2.80
Figures in parenthesisis relates amino acid requirements toamino acids present in the diets * Requirement level of a related species - the channel catfish - Source (NRC. 1983)
108
5.3 Juveniles
5.3.1 Materials and Methods
Two parallel experiments were conducted to evaluate the digestibility
o f soybean flour (SF) - poultry meat meal (PMM) blend based diets in
juvenile Oreochromis niloticus and Clarias gariepinus. For each
experim ent a 2 x 3 factorial design was used and it involved 12 50-L
tanks per experiment. Each treatment was duplicated. Juveniles of
Oreochromis niloticus (M ± S.E.M.= 55.3 ± 0.9g) and Clarias gariepinus
(M ± S.E.M.= 52.9 ± 2.0g) were stocked a t 10 per tank in a recirculatory
feeding trial system. Two randomly distributed units received the same
treatment. Diets, preparation, feeding of fish was same as in 5.2.
Experimental analyses,feedstuffs, diets and faecal matter were carried
out as in 3.6.1. Digestibility coefficients and availability of nutrients
were measured as in 3.6.2 and statistical analyses were carried out as
in 3.7.
, -
109
5.3.2 Results and Discusion
i Experiment 1: Digestibility and Amino Acid Availability of
Soybean Flour-Poultry Meat Meal Blend Based Diets in
Oreochromis niloticus Juveniles
(a) Nutrient Digestibility
The dry matter, protein, lipid and ash apparent digestibility
coefficients (ADCs) of the six diets are depicted in Fig.5.4. Lipid
digestion was highest. However, it was not significantly affected by
the levels of the marker, either 0.5% Cr20 3 or 1.0% Cr20 3 (P>0.05). Dry
matter had markedly higher ADCs in the diets with 0.5% Cr20 3 than
those with 1.0%, while the reverse was the case for protein and ash
ADCs (P<0.05).
The high lipid digestibiity coefficients for all the diets may be
attributed to high lipase activity in fish generally (Sargent, Henderson
and Tocher, 1989; De Silva and Anderson, 1994). Protein digestibiity
was moderately high and low for diets containing 1.0 and 0.5% Cr20 3
respectively. The increased level of Cr20 3 decreased dry matter
digestibility, increased protein digestibility and seemed to increase ash
digestibility. This implies that certain nutrient digestibility could increase
with increase in Cr20 3 from 0.5% to 1.0%. This could be due to the
110
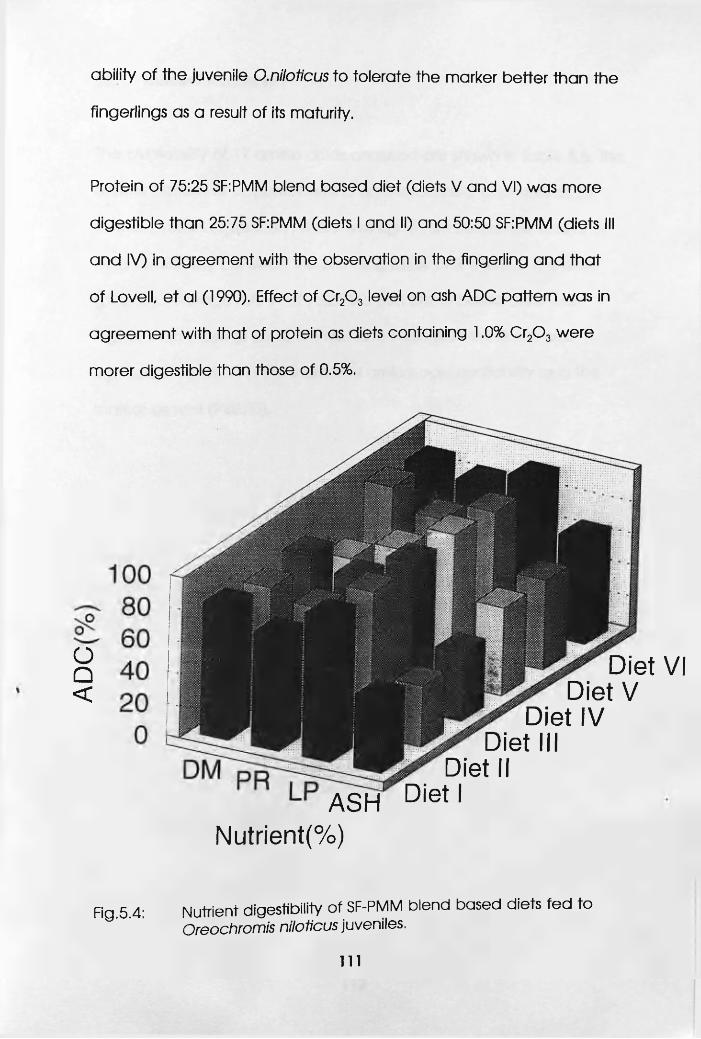
ability o f the juvenile O.niloticus to tolerate the marker better than the
fingerlings as a result of its maturity.
Protein o f 75:25 SF:PMM blend based diet (diets V and VI) was more
digestible than 25:75 SF:PMM (diets I and II) and 50:50 SF:PMM (diets III
and IV) in agreement with the observation in the fingerling and that
o f Lovell, et al (1990). Effect of Cr20 3 level on ash ADC pattern was in
agreem ent with that of protein as diets containing 1.0% Cr20 3 were
morer digestible than those of 0.5%.
oQ<
ASH Nutrient(%)
Diet VI Diet V
Diet IV Diet III
Diet II Diet I
Fig.5.4: Nutrient digestibility of SF-PMM blend based diets fed toO reochrom is n ilo ticus juveniles.
I l l
(b) Nutrient Availability
The availability of 17 amino acids analysed are shown in Table 5.6. The
overall pattern of apparent amino acid availability corresponds to
tha t o f protein digestibility. There was significant difference in amino
acid availability between the blending ratios of SF:PMM in the diets
(p<0.05). Average AAAA of 75:25 SF.’PMM blend based diets was
higher than those of 25:75 SF:PMM and 50:50 SF:PMM. There was
significant variation in the individual amino acid availability and the
marker as well (P<0.05).
112
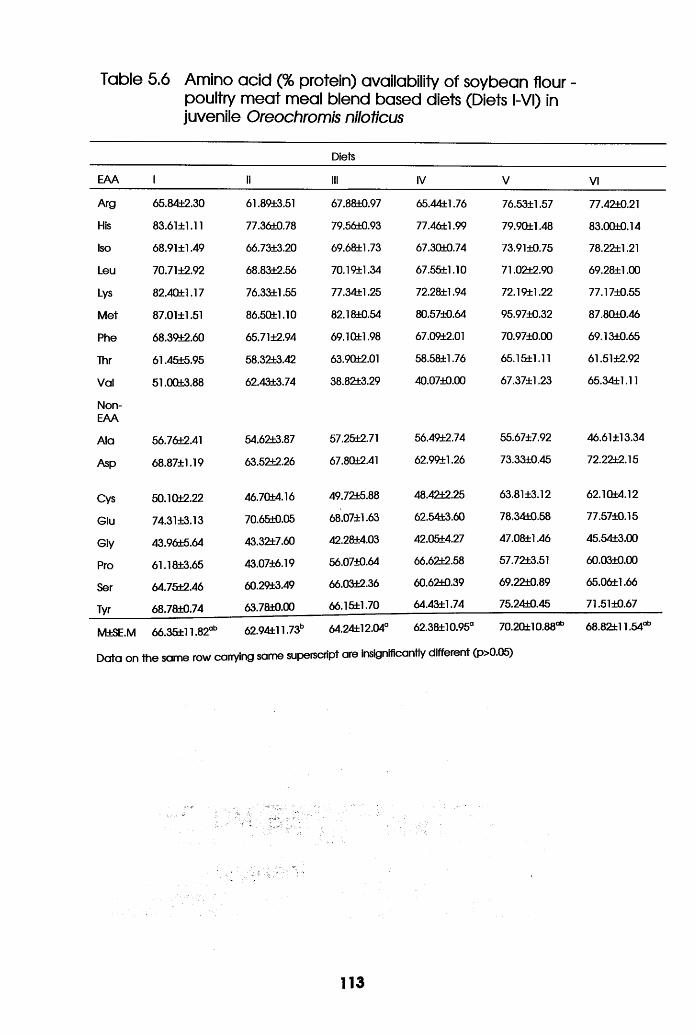
Table 5.6 Amino acid (% protein) availability of soybean flour - poultry meat meal blend based diets (Diets l-VI) in juvenile Oreochromis niloticus
Diets
EAA 1 II III IV V VI
Arg 65.84±2.30 61.89+3.51 67.88+0.97 65.44+1.76 76.53+1.57 77.42+0.21
His 83.61+1.11 77.36+0.78 79.56+0.93 77.46+1.99 79.90+1.48 83.00+0.14
Iso 68.91±1.49 66.73+3.20 69.68+1.73 67.30+0.74 73.91+0.75 78.22+1.21
Leu 70.71±2.92 68.83+2.56 70.19+1.34 67.55+1.10 71.02+2.90 69.28+1.00
Lys 82.40+1.17 76.33+1.55 77.34+1.25 72.28+1.94 72.19+1.22 77.17+0.55
Met 87.01±1.51 86.50il.10 82.18+0.54 80.57+0.64 95.97+0.32 87.80+0.46
Phe 68.39t2.60 65.71+2.94 69.10+1.98 67.09t2.01 70.97+0.00 69.13+0.65
Thr 61.45+5.95 58.32+3.42 63.90+2.01 58.58+1.76 65.15+1.11 61.51+2.92
Val 51.00+3.88 62.43+3.74 38.82+3.29 40.07+0.00 67.37+1.23 65.34+1.11
Non-EAA
Ala 56.76+2.41 54.62+3.87 57.25+2.71 56.49+2.74 55.67+7.92 46.61+13.34
Asp 68.87+1.19 63.52+2.26 67.80+2.41 62.99il.26 73.33+0.45 72.22+2.15
Cys 50.10+2.22 46.70+4.16 49.72i5.88 48.42+2.25 63.81+3.12 62.10+4.12
Glu 74.31+3.13 70.65+0.05 68.07+1.63 62.54+3.60 78.34i0.58 77.57+0.15
Gly 43.96+5.64 43.32+7.60 42.28+4.03 42.05+4.27 47.08+1.46 45.54+3.00
Pro 61.1843.65 43.07+6.19 56.07+0.64 66.62+2.58 57.72+3.51 60.03+0.00
Ser 64.75+2.46 60.29+3.49 66.03+2.36 60.62+0.39 69.22+0.89 65.06+1.66
Tyr 68.78+0.74 63.78+0.00 66.15+1.70 64.43+1.74 75.24+0.45 71.51+0.67
M±SE M 66.35±11.82ab 62.94±11.73b 64.24±12.04a 62.38±10.95 70.20±10.88 68.82±11.54
Data on the same row carrying same superscript are insignificantly different (p>0.05)
113
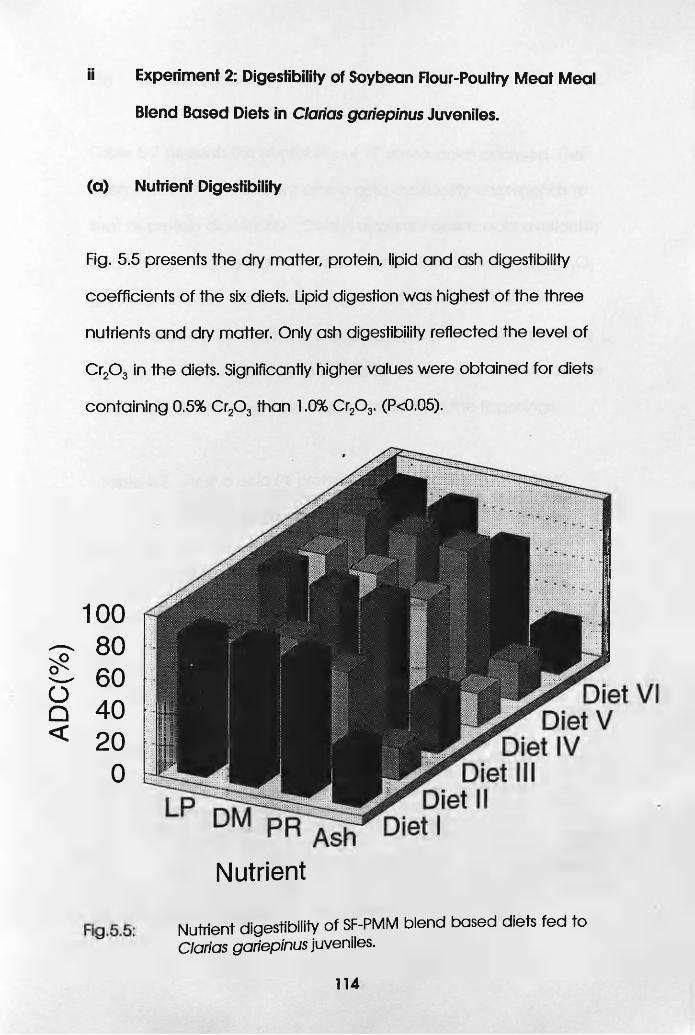
AD
C(%
)ii Experiment 2: Digestibility of Soybean Flour-Poultry Meat Meal
Blend Based Diets in Clarias gariepinus Juveniles.
(a) Nutrient Digestibility
Fig. 5.5 presents the dry matter, protein, lipid and ash digestibility
coefficients of the six diets. Lipid digestion was highest of the three
nutrients and dry matter. Only ash digestibility reflected the level of
Cr20 3 in the diets. Significantly higher values were obtained for diets
containing 0.5% Cr20 3 than 1.0% Cr20 3. (P<0.05).
10080604020
0
Nutrient
Nutrient digestibility of SF-PMM blend based diets fed to Clarias gariepinus juveniles.
114
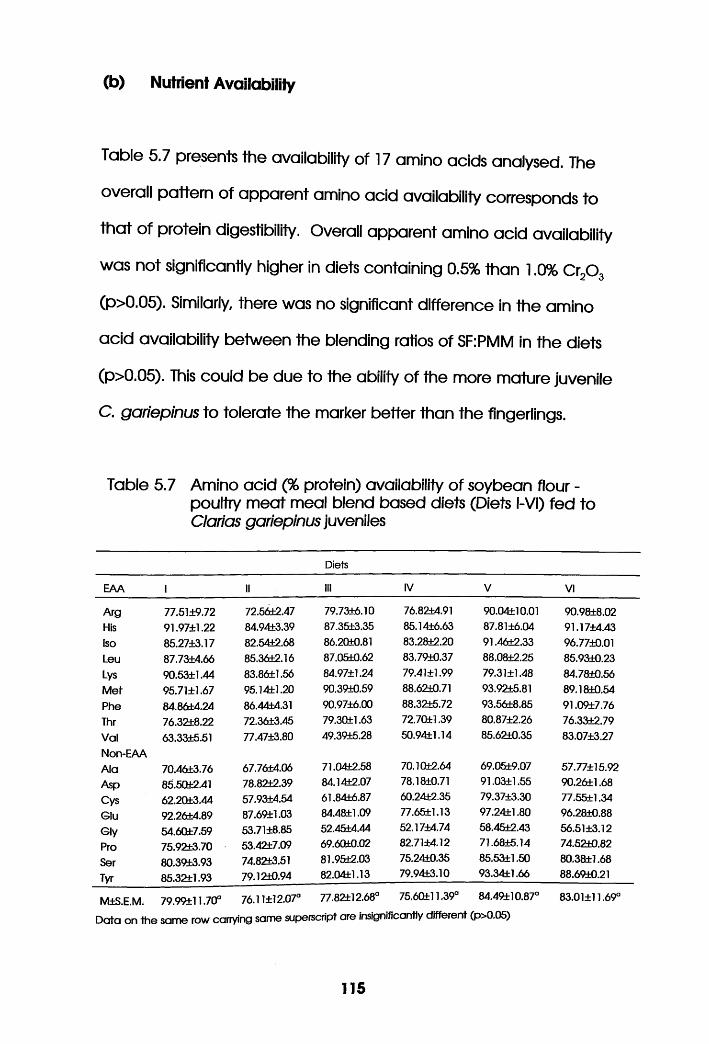
(b) Nutrient Availability
Table 5.7 presents the availability of 17 amino acids analysed. The
overall pattern of apparent amino acid availability corresponds to
that of protein digestibility. Overall apparent amino acid availability
was not significantly higher in diets containing 0.5% than 1.0% Cr„(X2 3
(p>0.05). Similarly, there was no significant difference in the amino
acid availability between the blending ratios of SF:PMM in the diets
(p>0.05). This could be due to the ability of the more mature juvenile
C. gariepinus to tolerate the marker better than the fingerlings.
Table 5.7 Amino acid (% protein) availability of soybean flour - poultry meat meal blend based diets (Diets l-VI) fed to Clarias gariepinus juveniles
Diets
EAA 1 II III IV V VI
Arg 77.51±9.72 72.56t2.47 79.73+6.10 76.82±4.91 90.04fcl0.01 90.98±8.02His 91.97±1.22 84.94+3.39 87.35+3.35 85.14±6.63 87.81 ±6.04 91.17±4.43Iso 85.27±3.17 82.54±2.68 86.20tfc0.81 83.28±2.20 91.46+2.33 96.77+0.01Leu 87.73±4.66 85.36+2.16 87.05+0.62 83.79+0.37 88.08+2.25 85.93+0.23Lys 90.53±1.44 83.86±1.56 84.97±1.24 79.41±1.99 79.31±1.48 84.78±0.56Met 95.71±1.67 95.14±1.20 90.39t0.59 88.62±0.71 93.92+5.81 89.18±0.54Phe 84.86±4.24 86.44+4.31 90.97±6.00 88.32±5.72 93.56+8.85 91.09t7.76Thr 76.32+8.22 72.36+3.45 79.30+1.63 72.7Qtl.39 80.87±2.26 76.33±2.79Val 63.33±5.51 77.47±3.80 49.39t5.28 50.94tl.14 85.62±0.35 83.07±3.27Non-EAAAla 70.46±3.76 67.76±4.06 71.04+2.58 70.1Qt2.64 69.05+9.07 57.77±15.92Asp 85.5Q+2.41 78.82±2.39 84.14±2.07 78.18±0.71 91,03±1.55 90.26±1.68Cys 62.2Q±3.44 57.93±4.54 61.84±6.87 60.24i2.35 79.37+3.30 77.55±1.34Glu 92.26±4.89 87.69+1.03 84.48±1.09 77.65±1.13 97.24+1.80 96.28±0.88Gly 54.60±7.59 53.71+8.85 52.45±4.44 52.17±4.74 58.45+2.43 56.51 ±3.12
Pro 75.92+3.70 53.42±7.09 69.60+0.02 82.71+4.12 71.68+5.14 74.52t0.82
Ser 80.39t3.93 74.82t3.51 81.95t2.03 75.24+0.35 85.53±1.50 80.38ttl.68
Tyr 85.32tl.93 79.12fc0.94 82.04tl.13 79.94+3.10 93.34tl.66 88.69+0.21
M±S.E.M. 79.99tl 1.70° 76.11±12.07° 77.82+12.68° 75.60+11.39° 84.49tl0.87° 83.01±11.69°
Data on the same row carrying same superscript are insignificantly different (p>0.05)
115
CHAPTER SIX
SOYBEAN FLOUR-POULTRY MEAT MEAL BLENDS AS DIETARY PROTEIN SOURCES IN PRACTICAL DIETS OF OREOCHROMIS NILOTICUS and
CLARIAS GARIEPINUS
116
6.1 Introduction
Generally, high dietary levels of plant proteins or complete substitution
of animal proteins has resulted in poor growth and feed efficiency in
fish for reasons aforementioned (Jackson et al.,1982; Viola et al.,1983;
Dabrowski et al.,1989; Urn, 1992). There is therefore limited use of plant
proteins in aquaculture feeds. Much improvement is required when a
plant protein use in a fish diet is desirable. Soybean could be enriched
by supplementing it with nutrients that are deficient in their simple or
compound forms.
Blending with feedstuffs that are rich in such nutrients could be
promising.lt has been reported that soybean nutrient imbalance
(particularly EAA) could be improved by the incorporation of low cost
animal protein such as poultry meat meal - this approach has been
found to be economical in catfish diet (Mohsen and Lovell, 1990).
Past experiments have established the successful utilisation of poultry
by-product meal (PBM) in fish diets (Fowler, 1981 a, b; 1982; 1991;
Steffens, 1994). Therefore, this study was designed to investigate the
nutritional improvement of soybean flour by the incorporation of
poultry meat meal as blend in the practical diets of Oreochromis
niloticus and Clarias gariepinus.
117
6.2 Materials and Methods
Oreochromis niloticus (M±S.E = 18.2±0.5g) and Clarias gariepinus
(M±S.E.=8.2±0.5g) fingerlings were stocked in duplicate (10 fish/ tank)
in 50-L tanks and fed four diets containing soybean flour(SF) - poultry
meat meal(PMM) blends by weight viz; reference diet (100:00
SF:PMM), diet I (75:25 SF:PMM), diet II (50:50 SF:PMM) and diet III (25:75
SF:PMM), at 4% body weight per day, twice daily at 09:30 and 17:00
for eight weeks. Fish were bulk- weighed fortnightly and feeding rates
adjusted accordingly. The tanks were cleaned twice a week by
siphoning off bottom wastes in addition to the self cleaning
mechanism of the recirculatory system. Water flow rate was
maintained at 2L min'1 per tank.
Water quality parameters were monitored fortnightly as in 3.5.2 and
recorded thus: Temperature, 26±0.0 °C; dissolved oxygen (DO), 5.2±0.3
mgL"1; pH, 6.6±0.1; NH3-N, 0.3±0.1 mgL'1; N02-N, 0.2±0.0 mgL'1; N03'-N,
12.5±2.5 mgL’1; Ca-hardness, 61.8±3.3 mgL’1 and total hardness, 77.3+
1.5 mgL'1.
The formulation and proximate composition of the experimental diets
are shown in Table 6.1 Soybean flour used was of commercial grade
with a 73.63% protein solubility index as analysed according to Araba
and Dale (1991). Poultry meat meal was supplied by Chettles UK ltd,
Nottingham. Pellets of 3mm diameter 5mm long were prepared using
118
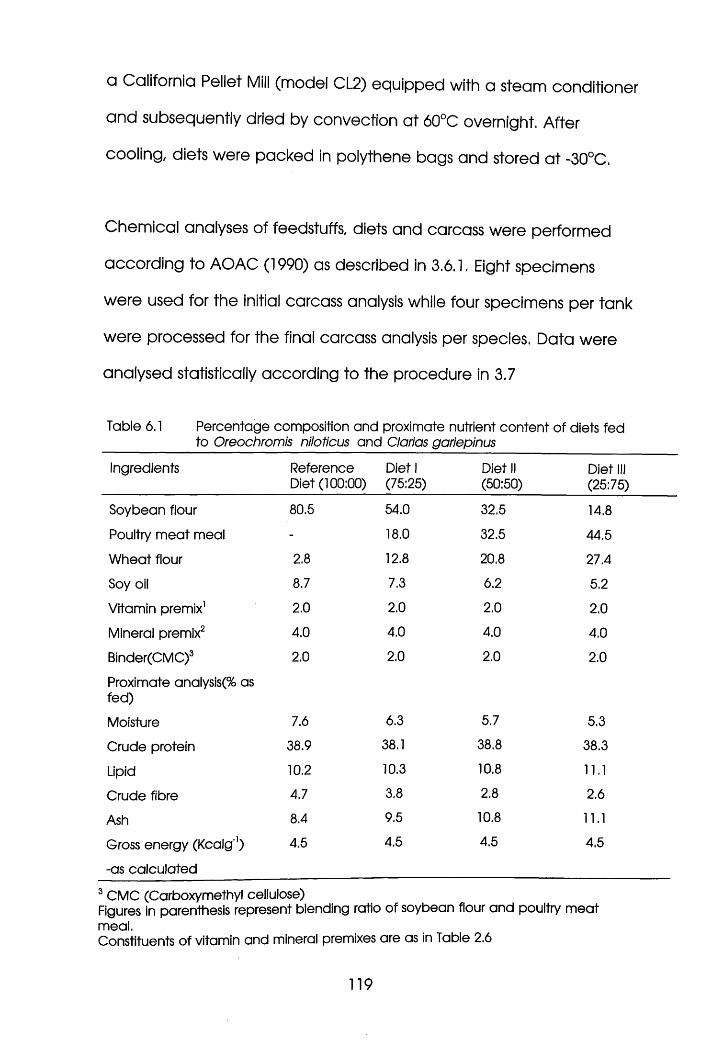
q California Pellet Mill (model CL2) equipped with a steam conditioner
and subsequently dried by convection at 60°C overnight. After
cooling, diets were packed in polythene bags and stored at -30°C.
Chemical analyses of feedstuffs, diets and carcass were performed
according to AOAC (1990) as described in 3.6.1. Eight specimens
were used for the initial carcass analysis while four specimens per tank
were processed for the final carcass analysis per species. Data were
analysed statistically according to the procedure in 3.7
Table 6.1 Percentage composition and proximate nutrient content of diets fed to Oreochromis niloticus and Clarias gariepinus
Ingredients Reference Diet (100:00)
Diet 1 (75:25)
Diet II (50:50)
Diet III (25:75)
Soybean flour 80.5 54.0 32.5 14.8
Poultry m eat meal - 18.0 32.5 44.5
W heat flour 2.8 12.8 20.8 27.4
Soy oil 8.7 7.3 6.2 5.2
Vitamin premix1 2.0 2.0 2.0 2.0
Mineral premix2 4.0 4.0 4.0 4.0
Binder(CMC)3
Proximate analysis(% as fed)
2.0 2.0 2.0 2.0
Moisture 7.6 6.3 5.7 5.3
Crude protein 38.9 38.1 38.8 38.3
Lipid 10.2 10.3 10.8 11.1
Crude fibre 4.7 3.8 2.8 2.6
Ash 8.4 9.5 10.8 11.1
Gross energy (Kcalg1)
-as calculated
4.5 4.5 4.5 4.5
3 C M C (Carboxymethyl cellulose)Figures in parenthesis represent blending ratio of soybean flour and poultry m eat meal.Constituents of vitamin and mineral premixes are as in Table 2.6
119
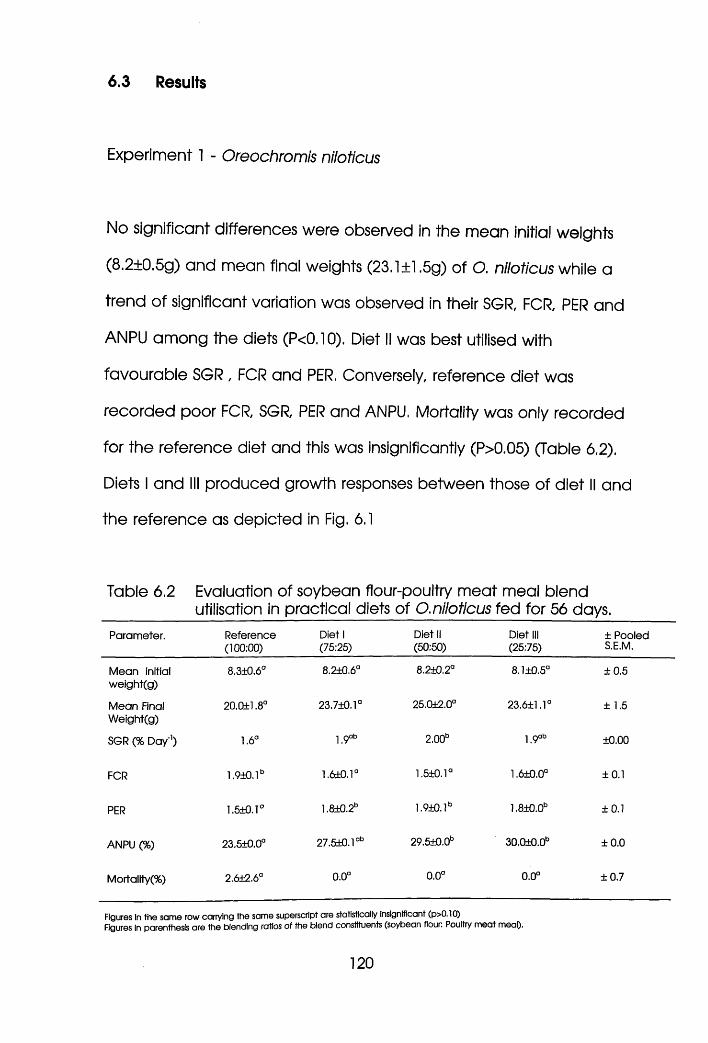
6.3 Results
Experiment 1 - Oreochromis niloticus
No significant differences were observed in the mean initial weights
(8.2±0.5g) and mean final weights (23.1±1.5g) of O. niloticus while a
trend of significant variation was observed in their SGR, FCR, PER and
ANPU among the diets (PcO.lO). Diet II was best utilised with
favourable SGR , FCR and PER. Conversely, reference diet was
recorded poor FCR, SGR, PER and ANPU. Mortality was only recorded
for the reference diet and this was insignificantly (P>0.05) (Table 6.2).
Diets I and III produced growth responses between those of diet II and
the reference as depicted in Fig. 6.1
Table 6.2 Evaluation of soybean flour-poultry meat meal blendutilisation in practical diets of O. niloticus fed for 56 days.
Parameter. Reference(100:00)
Diet 1 (75:25)
Diet II (50:50)
Diet III (25:75)
± Pooled S.E.M.
Mean initial weight(g)
8.3±0.6a 8.2±0.6° 8.2±0.2° 8,1±0.5° + 0.5
Mean Final Weight(g)
20.0±1.8° 23.7±0.1° 25.0+2.0° 23.6±1.1° ± 1.5
SGR (% Day'1) 1.6° 1 9°b 2.00b 1 9°b ±0.00
FCR 1.9±0.1b 1.6±0.1° 1.5±0.1° 1,6±0.0° ±0.1
PER 1.5±0.1° 1.8±0.2b 1.9±0.1b 1.8±0.0b ±0.1
ANPU (%) 23.5+0.0° 27.5+0. l ab 29.5±0.0b 30.0±0.0b ±0.0
Mortality(%) 2.6±2.6° 0.0° o o a 0.0° ±0.7
Figures In the same row carrying the same superscript are statistically insignificant (p>0.10)Figures In parenthesis are the blending ratios of the blend constituents (soybean flour. Poultry m eat m eal).
120
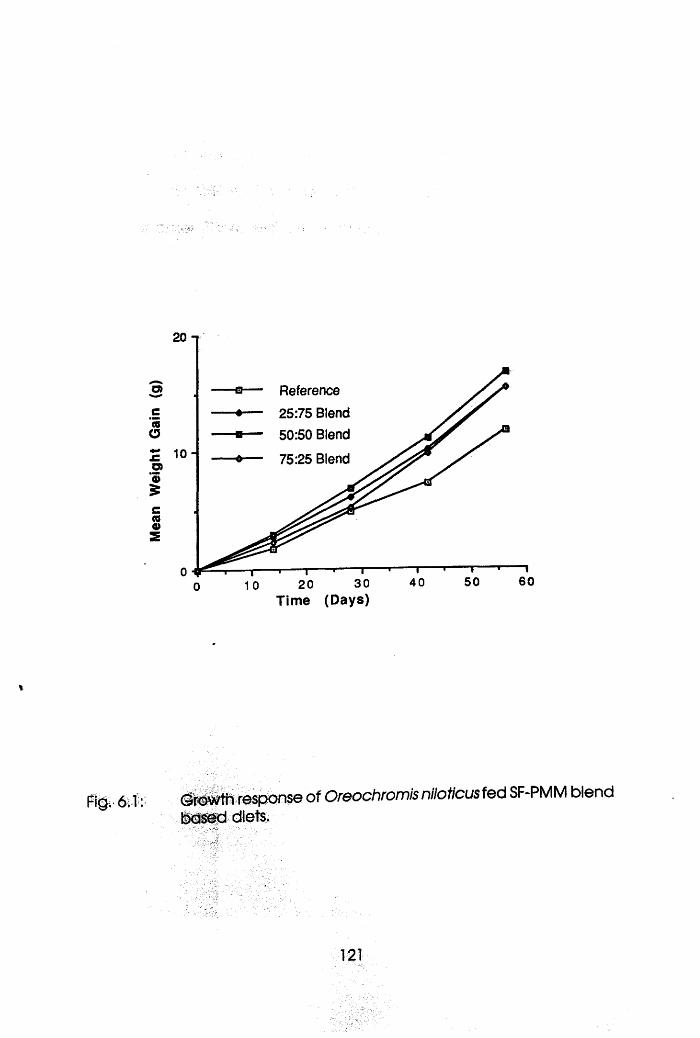
Mean
W
eigh
t Ga
in (g
)
Reference
25:75 Blend
50:50 Blend
75:25 Blend10 -
60504020 30Time (Days)
i
Pig. 6 | ; Growth response of Oreochromis niloticus fed SF-PMM blendbased diets.
121
Table 6.3 shows the amino acid composition of the diets vis-a-vis their
requirements in O,niloticus as established by Santiago and Loveil
(1988). Methionine + cystine was observed to be the first limiting
amino acid followed by phenylalanine + tyrosine, threonine and lysine
in that order. There was excess of leucine in all the diets. Increasing
PMM incorporation increased methionine and reduced leucine in the
diets. Carcass composition of the fingerlings fed the four diets is shown
in Table 6.4. Protein, lipid and ash varied significantly with the diets
(P<0.05). Protein content was highest in fingerlings fed diet III and
lowest in fingerlings fed diet I. Fingerlings fed diet III had the highest
lipid content while the lowest lipid and ash values were recorded in
fishes fed the reference diet. There was a general increase in carcass
lipid and ash with increasing poultry meat meal in the diets.
122
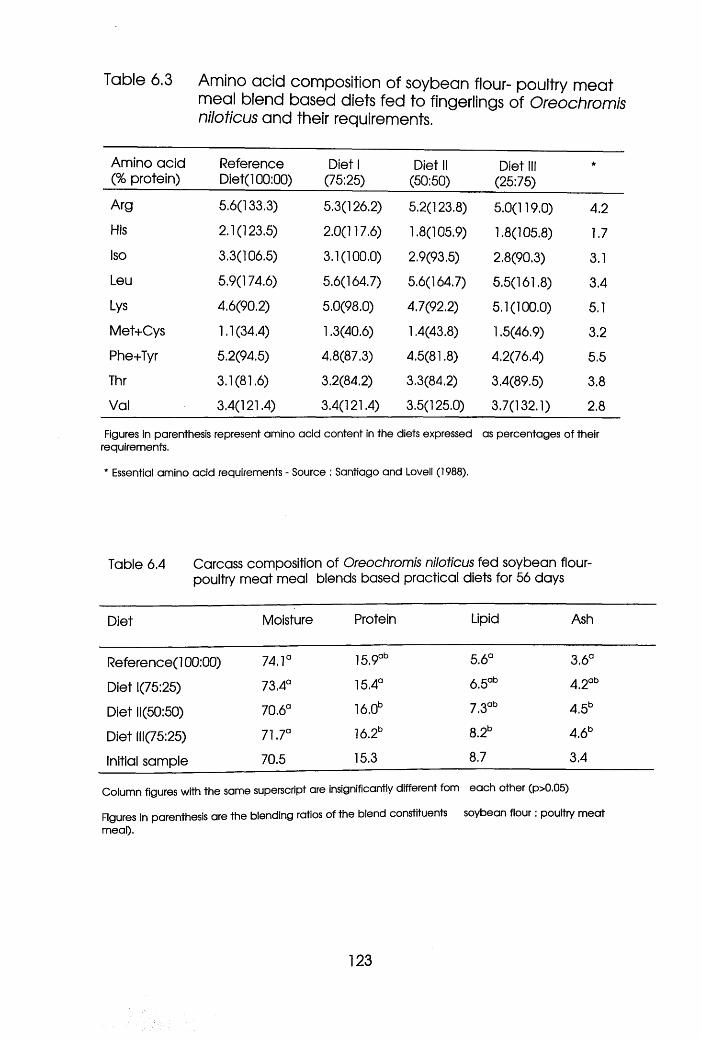
Table 6.3 Amino acid composition of soybean flour- poultry meat meal blend based diets fed to fingerlings of Oreochromis niloticus and their requirements.
Amino acid (% protein)
Reference Diet(l 00:00)
Diet 1 (75:25)
Diet II (50:50)
Diet III (25:75)
*
Arg 5.6(133.3) 5.3(126.2) 5.2(123.8) 5.0(119.0) 4.2
His 2.1(123.5) 2.0(117.6) 1.8(105.9) 1.8(105.8) 1.7
Iso 3.3(106.5) 3.1(100.0) 2.9(93.5) 2.8(90.3) 3.1
Leu 5.9(174.6) 5.6(164.7) 5.6(164.7) 5.5(161.8) 3.4
Lys 4.6(90.2) 5.0(98.0) 4.7(92.2) 5.1(100.0) 5.1
Met+Cys 1.1(34.4) 1.3(40.6) 1.4(43.8) 1.5(46.9) 3.2
Phe+Tyr 5.2(94.5) 4.8(87.3) 4.5(81.8) 4.2(76.4) 5.5
Thr 3.1(81.6) 3.2(84.2) 3.3(84.2) 3.4(89.5) 3.8
Val 3.4(121.4) 3.4(121.4) 3.5(125.0) 3.7(132.1) 2.8
Figures in parenthesis represent amino acid content in the diets expressed as percentages of their requirements.
* Essential amino acid requirements - Source : Santiago and Lovell (1988).
Table 6.4 Carcass composition of Oreochromis niloticus fed soybean flour- poultry m eat meal blends based practical diets for 56 days
Diet Moisture Protein Lipid Ash
Referenced 00:00) 74. r 15.9ab 5.6° 3.6°
Diet 1(75:25) 73.4° 15.4° 6.5ab 4.2ab
Diet 11(50:50) 70.6a 16.0b 7.3ab 4.5b
Diet 111(75:25) 71.7° 16.2b 8.2b 4.6b
Initial sample 70.5 15.3 8.7 3.4
Column figures with the same superscript are insignificantly different fom each other (p>0.05)
Figures in parenthesis are the blending ratios of the blend constituents soybean flour: poultry meat meal).
123
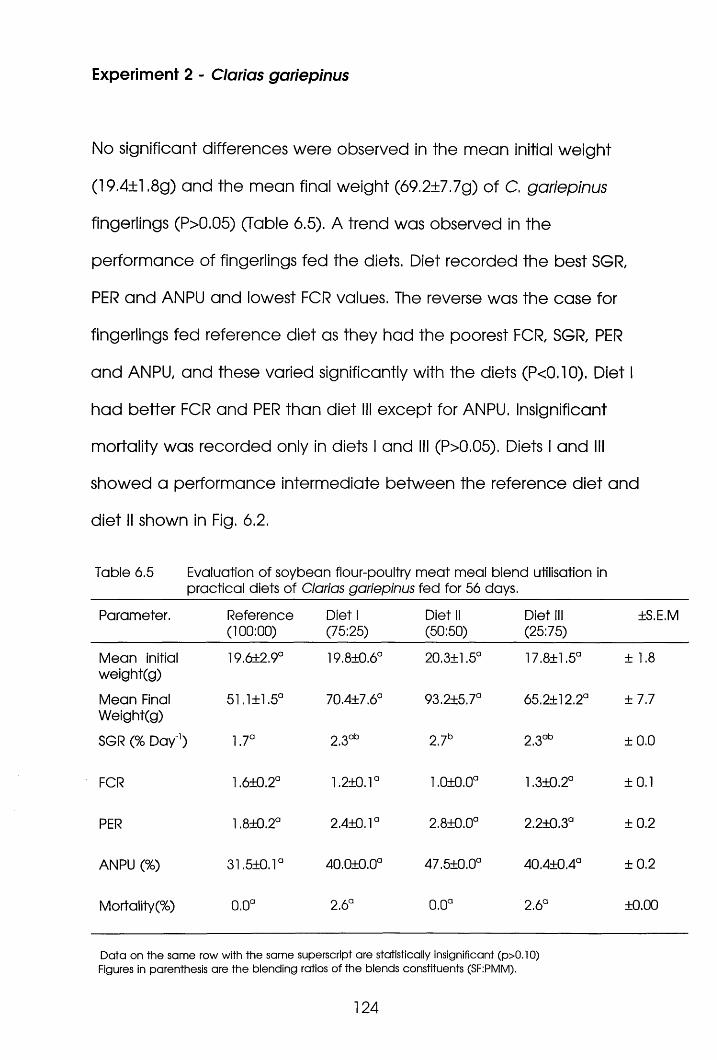
Experiment 2 - Clorias gariepinus
No significant differences were observed in the mean initial weight
(19.4±1.8g) and the mean final weight (69.2±7.7g) of C. gariepinus
fingerlings (P>0.05) (Table 6.5). A trend was observed in the
performance of fingerlings fed the diets. Diet recorded the best SGR,
PER and ANPU and lowest FCR values. The reverse was the case for
fingerlings fed reference diet as they had the poorest FCR, SGR, PER
and ANPU, and these varied significantly with the diets (PcO.lO). Diet I
had better FCR and PER than diet III except for ANPU. Insignificant
mortality was recorded only in diets I and III (P>0.05). Diets I and III
showed a performance intermediate between the reference diet and
diet II shown in Fig. 6.2.
Table 6.5 Evaluation of soybean flour-poultry m eat meal blend utilisation in practical diets of Clarias gariepinus fed for 56 days.
Parameter. Reference(100:00)
Diet 1 (75:25)
Diet II (50:50)
Diet III (25:75)
±S.E.M
M ean initial weight(g)
19.6±2.9a 19.8±0.6° 20.3±1.5° 17.8±1.5° ± 1.8
M ean Final W eight(g)
51. 1±1.5° 70.4+7.6° 93.2±5.7° 65.2±12.2° ± 7 .7
SGR (% D a y 1) 1.7° 2.3°b 2.7b 2.3°b ± 0 .0
FCR 1.6+0.2° 1.2±0.1° 1.0±0.0° 1.3±0.2° ±0.1
PER 1.8+0.2° 2.4+0.1° 2.8+0.0° 2.2±0.3° ± 0 .2
ANPU (%) 31.5+0.1° 40.0+0.0° 47.5+0.0° 40.4+0.4° ± 0 .2
Mortality(%)
aOo
2.6° o o Q 2.6° ±0.00
Data on the same row with the same superscript are statistically insignificant (p>0.10) Figures in parenthesis are the blending ratios of the blends constituents (SF:PMM).
124
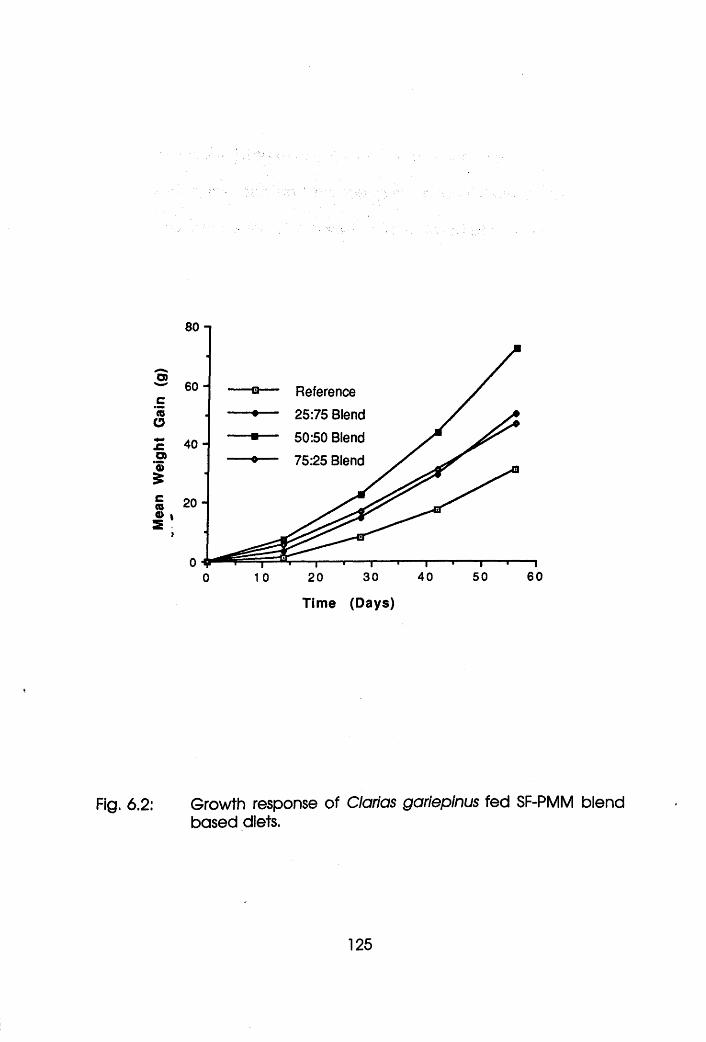
Mean
W
eigh
t Ga
in (g
)
80 -i
60 - Reference
25:75 Blend
50:50 Blend
75:25 Blend40 -
2 0 -
}
6040 5030201 00Time (Days)
Fig. 6.2: Growth response of Clarias gariepinus fed SF-PMM blendbased diets.
125
The amino acid composition of the diets as in Table 6.6 shows that
methionine + cysteine was the first limiting amino acid, followed by
phenylalanine + tyrosine and lysine in that order. There was excess of
leucine in all the diets and increasing the level of PMM in the diets
increased methionine + cysteine but decreased phenylalanine +
tyrosine and leucine. No significant differences were observed in the
carcass proximate composition of C. gariepinus fed the diets (P>0.05).
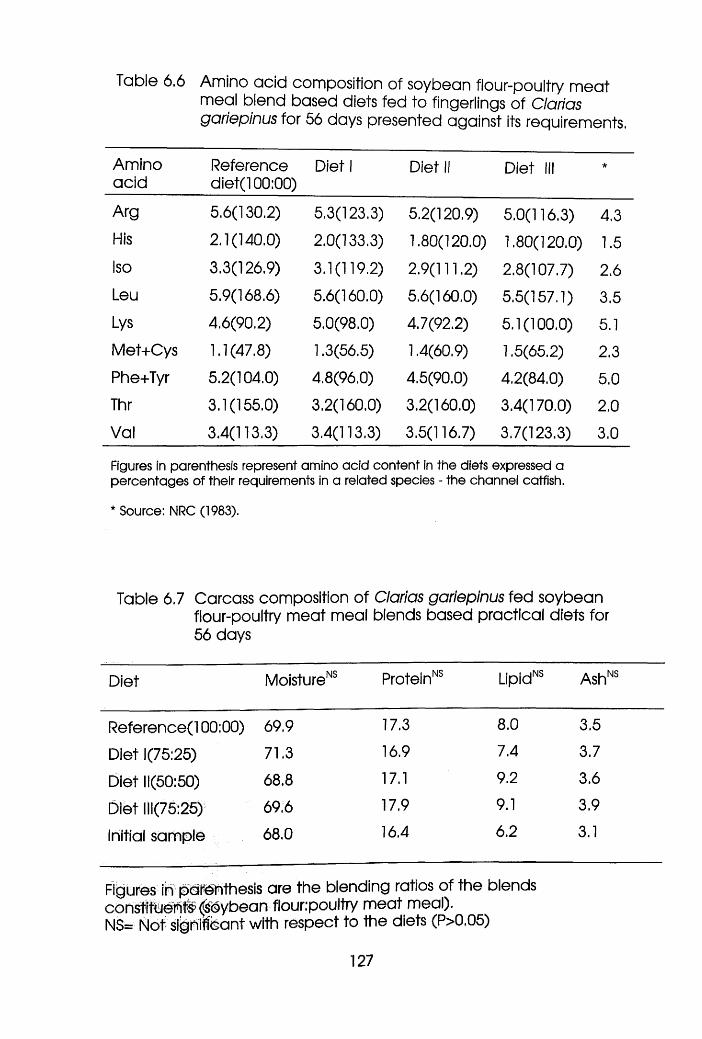
Table 6.6 Amino acid composition of soybean flour-poultry meat meal blend based diets fed to fingerlings of Clarias gariepinus for 56 days presented against its requirements.
Aminoacid
Reference diet(l 00:00)
Diet 1 Diet II Diet III *
Arg 5.6(130.2) 5.3(123.3) 5.2(120.9) 5.0(116.3) 4.3His 2.1(140.0) 2.0(133.3) 1.80(120.0) 1.80(120.0) 1.5Iso 3.3(126.9) 3.1(119.2) 2.9(111.2) 2.8(107.7) 2.6Leu 5.9(168.6) 5.6(160.0) 5.6(160.0) 5.5(157.1) 3.5Lys 4.6(90.2) 5.0(98.0) 4.7(92.2) 5.1(100.0) 5.1Met+Cys 1.1(47.8) 1.3(56.5) 1.4(60.9) 1.5(65.2) 2.3Phe+Tyr 5.2(104.0) 4.8(96.0) 4.5(90.0) 4.2(84.0) 5.0Thr 3.1(155.0) 3.2(160.0) 3.2(160.0) 3.4(170.0) 2.0
Val 3.4(113.3) 3.4(113.3) 3.5(116.7) 3.7(123.3) 3.0
Figures in parenthesis represent amino acid content in the diets expressed a percentages of their requirements in a related species - the channel catfish.
* Source: NRC (1983).
Table 6.7 Carcass composition of Clarias gariepinus fed soybean flour-poultry meat meal blends based practical diets for 56 days
Diet MoistureNS ProteinNS UpidNS AshNS
Reference(l 00:00) 69.9 17.3 8.0 3.5
Diet 1(75:25) 71.3 16.9 7.4 3.7
Diet 11(50:50) 68.8 17.1 9.2 3.6
Diet 111(75:25) 69.6 17.9 9.1 3.9
initial sample 68.0 16.4 6.2 3.1
Figures in pdfenthesis are the blending ratios of the blends constiltiieinfe (Soybean flour.’pouitry meat meal).NS= Not significant with respect to the diets (P>0.05)
6.4 Discussion
The highest mean final weight SGR, PER, and lowest FCR values
recorded for fishes fed diet II in both experiments suggests the
superiority of 50:50 blend of soybean flour and poultry meat meal
over the other blends for the culture of O. niloticus and C. gariepinus.
The improved performace of diet II was due to improved essential
amino acids (EAA) balance , Sadiku and Jauncey (in Press) have
shown that SF is higher in all the essential amino acids than PMM
except threonine, valine, methionine and lysine. Methionine was
identified as the first limiting amino acid as shown in Tables 6.3 and
6.6, the risk of its deficiency could be reduced by the incorporation of
PMM in the diets.
Problems of lysine unavailability and sulphur containing amino acid
destruction through toasting of SF (Snyder and Kwon, 1987; Goihl,
1987) could therefore be ameliorated by the incorporation of PMM. A
good blend of SF and PMM as in diet II gave an improved amino acid
balance. Higher level of inclusion of soybean flour as in the reference
diet and diet I increase the risk of methionine deficiency and that of
PMM as in diet III increases the risk of Phenylalanine deficiency. This
could militate against high inclusion levels of both SF and PMM in an
ideal SF:PMM blend based diet of O.niloticus and C.gariepinus.
128
The level of leucine which when present in excess would be toxic to
fish (Hughes, et al 1984; Robinson, et al 1984, Tacon, 1992) and
observed to have caused scoliosis, deformed opercula, scale
deformities, scale loss and spongiosis of epidermal cells in
Onycorynchus mykiss (Cho and Cowey,1991) was in excess in all the
diets. Though there is paucity of information on the toxicity of this
amino acid in O.niloticus and C. gariepinus, absence of symptoms of
deficiency and toxicity in the two experiments indicated that their
excessive levels were not critical to the fish over this duration. Inclusion
of PMM was beneficial as it reduced leucine in the diets.
Increasing order of carcass lipid and ash from reference diet to diet III
in O.niloticus with increased inclusion levels of PMM rather than SF was
due to higher levels of lipid and ash in diets with high PMM (Sadiku
and Jauncey, in Press). This was not the trend in C.gariepinus which
could tolerate higher inclusion level of this in its diet than O.niloticus,
as catfishes requires more lipid than tilapia (NRC, 1983). In fact, tilapia
has been documented to perform better on low lipid diets (Jauncey
and Ross, 1982; Jauncey, 1993).
in conclusion, there is nutritional improvement of soybean meal with
the incoporation of PMM (animal protein). Whether this is
ecomonically viable as postulated by Fowler (1991), needs to be
further investigated.
129
CHAPTER SEVEN
SUBSTITUTION OF FISHMEAL WITH SOYBEAN FLOUR - POULTRY MEAT MEAL BLENDS IN PRACTICAL DIETS FOR OREOCHROMIS NILOTICUS AND
CLARIAS GARIEPINUS
130
7.1 Introduction
Replacement of fish meal has been one of the current fish meal
research needs (Chamberlaia 1993) and replacement of fish meal
with vegetable proteins (partially or totally) has been the goal of
aquaculture (Wee and Wang, 1987;Lim and Dominy, 1989; Ng and
Wee, 1989; Shiau et al. 1990).
Lovell (1990) and Lim (1992) documented reported variable successes
on utilisation of soybean in aquaculture feeds. Highest level of
replacement of fish meal meal with soybean meal without any
supplementation In tilapia diets was found to be 50% in a diet of 25%
crude protein (Viola and Arieli, 1983).High level of dietary soybean
meal or complete substitution of animal proteins resulted in poor
growth and feed efficiency of fish (Jackson et al. 1982; Dabrowska et
al.1989) hence their indispensability. This could be due to increase in
critical state of methionine and available lysine with increase in
replacement level. Incorporation of low cost animal protein (rich in
methionine and available lysine) is therefore a necessity for nutritional
improvement of soybean and its subsequent use to replace fishmeal.
7h@i'0fQi'@/ fj~|@ objectives of this study are to ameliorate amino acid
imbalance of SF by PMM incorporation as blends, establish the ideal
levels of incorporation of PMM in SF and replacement of fishmeal in
practical diets for O.niloticus and C. gariepinus.
131
7.2 Materials and Methods
i Experimental fish, fish husbandry and fish diets
Ten isocaloric and isonitrogenous diets - Control Diet (0% replacement
of fish meal), Diets MX - of 25:75; 50:50; 75:25 soybean flour (SF)-poultry
meat meal (PMM) blends replacing fish meal at 25%, 50% and 75%,
were fed to fingerlings of Oreochromis niloticus (M±S.E = 7.1±0.2g) and
Clarias gariepinus (M±S.E = 10.2±0.8g) at 4% body weight per day at
09:30 and 17:00 Hrs for 56 days in two seperate experiments as
experiments 1 and 2 respectively. Fish were bulk-weighed fortnightly
and feeding rates adjusted accordingly.
Deffated, toasted and dehulled SF (Type II) obtained from Sigma
Chemical Co. ltd, U.S.A. was used for experiment 1 while defatted
and toasted SF supplied by Dr Viv Crampton of Ewos U.K. ltd was used
for experiment 2. High quality PMM was supplied by Chettles UK ltd,
Nottingham. The formulation and proximate composition of the
experimental diets are shown in Table 7.1. 3mm pellets were prepared
using California Pellet Mill (model CL2) equipped with a steam
conditioner and subsequently dried by convection at 60 C overnight.
After cooling, diets were packed in sealed black plastic bags and
stored (-30°C) until required.
132
ii Experimental system
A 3 X 3 factorial design plus two controls was adopted. Fishes were
stocked in duplicate into twenty 50 L tanks at 15 fish/ tank for
O.niloticus and 10 fish/tank for C.gariepinus. The tanks were regularly
cleaned by siphoning off waste. Water flow was maintained at 2L min'
1 per tank and water quality parameters were monitored fortnightly
using methods described in 3.5.2 and recorded as follows:
Temperature, 26-27°C and 27°C; dissolved oxygen (DO), 4.5-6.0 and
5.5-6.7 mgL'1; pH, 6.0 and 6.0; NH3-N, 0.4-1.0 and 0.6-1.0 mgL'1; N02-N,
0.2 and 0.2 mgL'1; N03-N, 20 and 20 mgL'1; Ca-hardness, 88-173 and
49-77 mgL'1 and total hardness, 123-210 and 69-105 mgL'1 for
experiments 1 and 2 respectively.
iii Experimental and statistical analyses
Chemical analysis of feedstuffs, diets and carcass (initial and final)
was performed according to AOAC (1990) following the procedures
in 3.6.1. Eight specimens of fingerlings were taken for initial carcass
analysis while four from each tank were used for final carcass analysis.
Biological parameters measured according to the description in 3.6.2
and data analysed statistically according to procedures in 3.7
133
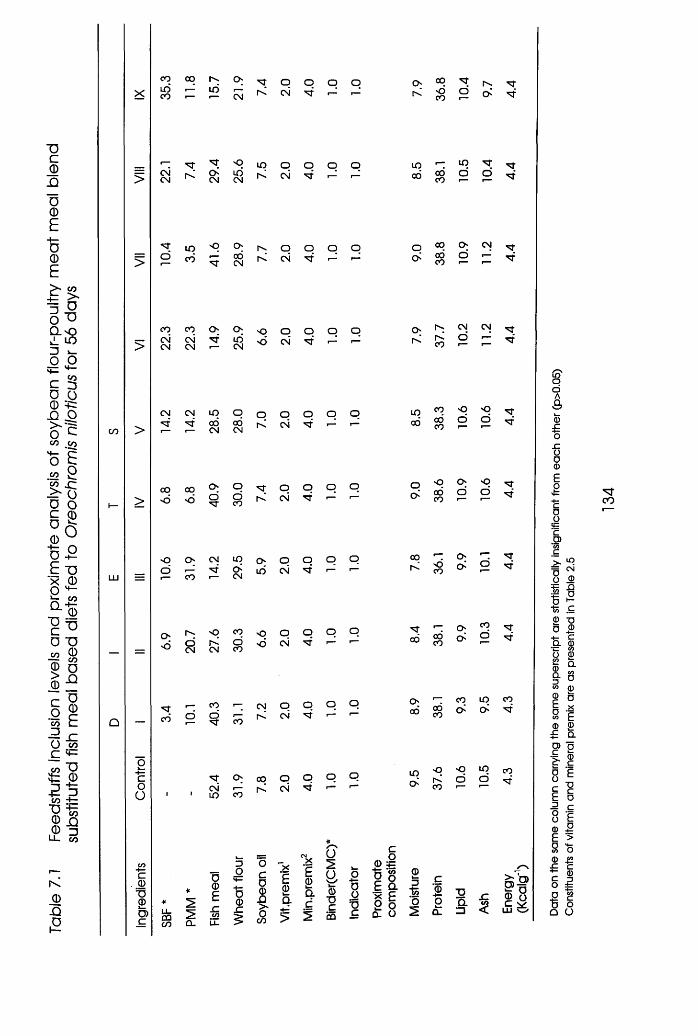
Table
7.1
Fe
edst
uffs
in
clusio
n lev
els
and
prox
imat
e an
alys
is of
soyb
ean
flour
-pou
ltry
mea
t m
eal
blen
d su
bstit
uted
fish
m
eal
base
d di
ets
fed
to O
reoc
hrom
is
nilo
ticus
fo
r 56
days
oo 00 qin i in Ioo ■— CM
o o oCN 'J i-00<5oo o
> CMCMMTOCM
OinCM
o lo in ^ r o o
d inooq q
00 CMrqb Ob
q o CMoo o i—oo ■— i—
CO 00 O O n o o o oCMCM CMCM "Cf inCM <5 cm' MT r— r—
Obiq CM CMb o i—oo 1— "sf
>
CM
0O<5
CM q o o O o o o q00CM 00CM CM MT 00
00 o o q o o o o o<5 or ocO b cm' r— r_ b
00 <3 n00 o o00 >“ 1—
q o o00 o o00 ■— ■—
n q CM ind bcO '— CM
oin
oCM
o 00 ooo'" I MT O ^
o<5 oCM
qbCMooooo
o<5
CDCM
o oo 00ooo « o' o
MT
OOI— 00CD CD r : i— CO
CMboCM
o q00 0000
oo in b b
q■r
cooStCMm
9.5
q o inq q o o o o b o orr\ b CM >—- ■— CO ■“ 1oo
q
c0)b05C 00
CO
00£_C
3o5=4—D0_c
co0noCO
X£0Q.
o
£©•DcCO
IO’ac
* S| 8£ a * £ 2 o a. o
0=Jto'o
c1gCL
T>aZ3.C 85
LU C > Data
on the
sa
me
colu
mn
carry
ing
the
same
su
pers
crip
t are
st
atist
ically
in
sign
ifica
nt f
rom
each
ot
her
(p>0
.05)
Co
nstit
uent
s of
vitam
in
and
min
eral
pre
mix
are
as pr
esen
ted
in Ta
ble
2.5
7.3 Results and Discussion
7.3.1 Experiment 1 - Oreochromis niloticus
i Nutrient Utilisation
Mean initial weights and the mean final weight of fishes fed different
diets did not differ significantly (P>0,05). The SGR, FCR and PER
differences between the diets were significant (p<0,05) while those of
ANPU and mortality were insignificant (p>0.05) as depicted in Table
7.2. MFW, SGR, FCR, PER, ANPU differed significantly with replacement
levels (p<0.05) but not blending ratios of soybean flour - poultry meat
meal blends in the diets. The interactions of substitution and blending
were insignificant in all cases (p>0.05). Diet VII was the best utilised of
the ten diets. It had the lowest FCR, highest SGR and PER while diet III
had the poorest nutrient utilisation with highest FCR and lowest SGR,
PER.
Figs. 7.1a, b and c show that the control diet gave the best growth
response in 25:75 and 50:50 blends while that of 25% substitution was
best of all replacement levels in 75:25 blends. Poorest growth
responses were observed with 75% replacement in 25.75 and 75.25
blends while that of 50% replacement was poorest in 50.50 blend.
135
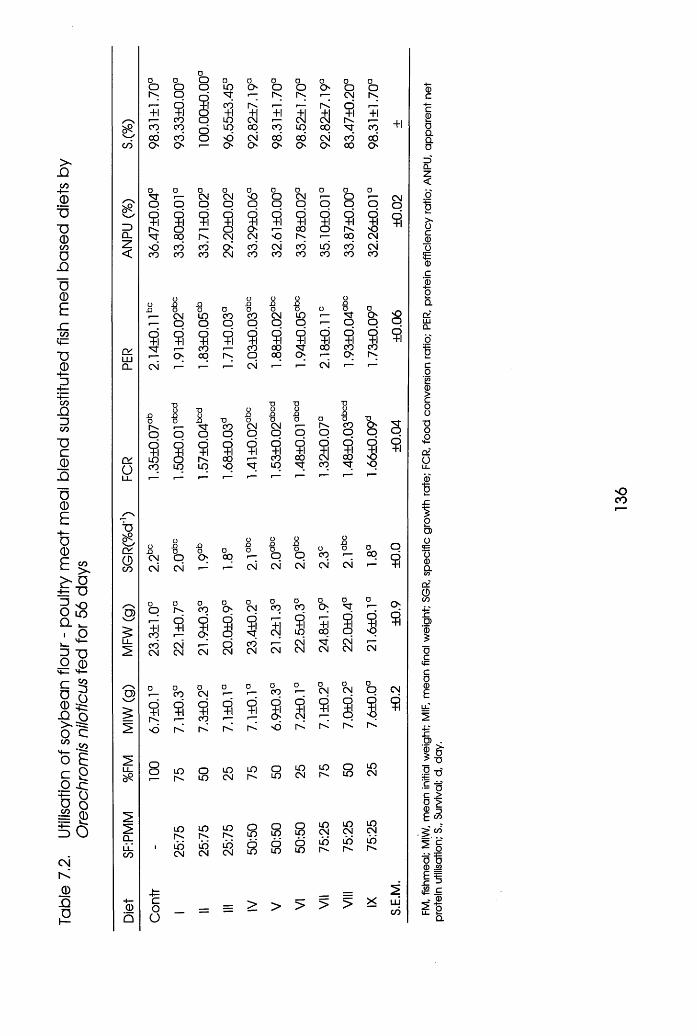
Table
7.
2.
Utilis
ation
of
soyb
ean
flour
- po
ultry
m
eat
mea
l ble
nd
subs
titut
ed
fish
mea
l ba
sed
diet
s by
O
reoc
hrom
is
nilo
ticus
fed
fo
r 56
days
o o O 0 0 o o 0 D 0o O O LO O O O o o Orv. o <—; rv 1— CM r^.
+ i 9CO
g
oCO+1LO
rv+ i S
l<
s 9r-«.
+i55 co CO d LO oo CO LO 00 "xT COv_^ 00 CO o <5 cm 00 00 cm CO 00CO O O O ' o O a O ' 00 o>
&3CLz<
O'LUCL
O'O
■Q55CvoCO
U)
CD
CLillGO
+1
o'sT
D 0CM
oCM
0•O
0O
0CM
0 oO
a
O p O O O O O o O O
9 g 9 g 3CM
9 9 g 9 3r^.00 Fv CM o oo r^.
°o•oCM
<5 CO CO c> CO CM CO LO CO CMCO CO co CM CO CO co CO CO CO
o13 □be XI
0 0 abc
abc
abc
o
oqD 0CM LO CO CO CM LO I— O'
i— O o o O O O ■— o o
9 9 9 9 9 9 9 9 9CO CO oo ^r oo CO CO00 rT O °o Ch 1— <>
CM CM ■— <— CM ■— ■—
C\Jo9
01CO
o§LO
ro COo$ 3r . oo LO o
o TJO TJa T3o_QX30CMO
OCMO
0 0 0COOO
1 o
9r-"'vT
9CO10
900 3
CO1 9
oXJCM
onoO
X)oC>
o00
oXIoOn0O
oX30O
0CO
oXI0 o
COoQ
CM CN r— r— CM CN CM CM CM +1
DO
o oCO
0C>
0CM
oCO
oCO
aC>
0'nT
0O '
+ iCO
9 I § i 5 i + iCO § i 9
COCM
CMCM CM
oCM
cbCM CM
CMCM
'vTCM
CMCM CM
a oCO
oCM
o 0 oco
0CM
0CN
oo CM
9r^.
9 9CO
9 9 s i 9 § 19
r<
100
75 50 25 75 50 25 75 50 25
LO LOr-»
LOr--. SoLO
oLO
LOCM
LOCM
LOCM
1 LOCM
LOCM
ibCM 8
oLO
oLO
ibI- -
ibr^.
ib
co _ =o = > > >" - > > > < LUCO
©cc2oaaoba.z<01oca)oc£oQ.
01sCO5coo•ao£O'oLL.
!uo5ooa)atnD£0CO-px iO)■®5ocSf=Co©e
x:0) .s>
'■Soc > 0 £ £ w
0 1ffl .52
1 ^co r-«= -b * ffi2 -5LL. w
<5CO
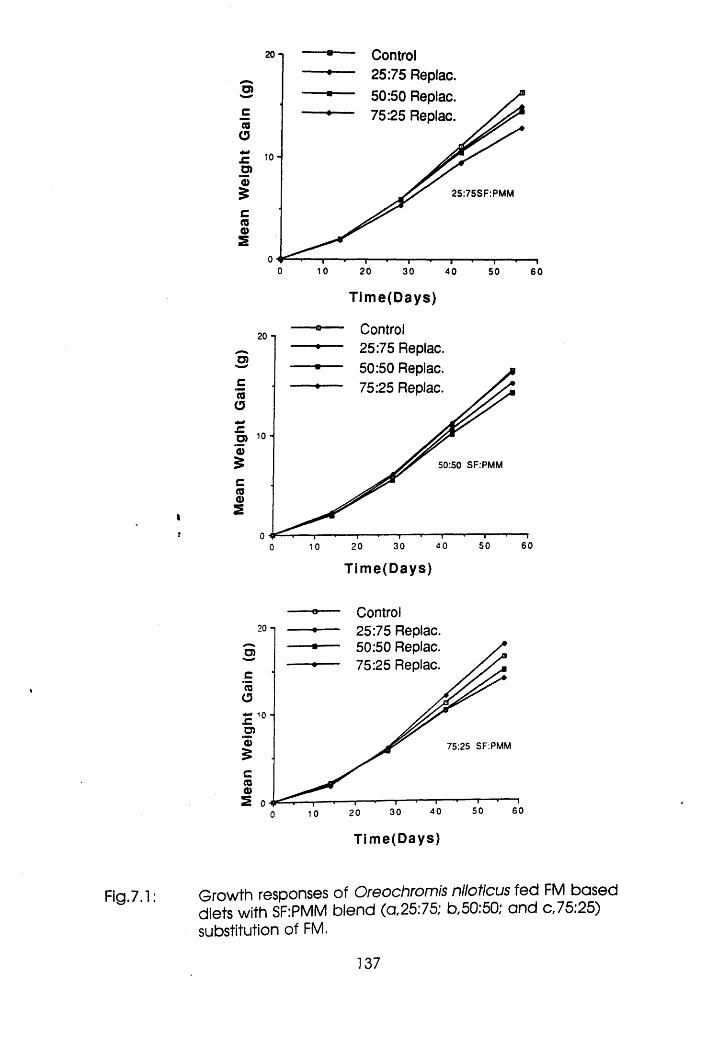
Fig.7.1:
Control 25:75 Replac. 50:50 Replac. 75:25 Replac.
20 - |
O)cCOO£ 10- O)0>£ 25:75SF:PMM
CCOCD2
o 10 20 30 40 SO 60
Time(Days)
Control 25:75 Replac. 50:50 Replac. 75:25 Replac.
20 - i
05
50:50 SF.PMM
50 604 030201 00Tlme(Days)
Control20 - | 25:75 Replac.
50:50 Replac. 75:25 Replac.
10 -JZO)75:25 SF:PMM
6050403020
Time(Days)
Growth responses of Oreochromis niloticus fed FM based diets with SF:PMM blend (a,25:75; b,50:50; and c,75:25) substitution of FM.
137
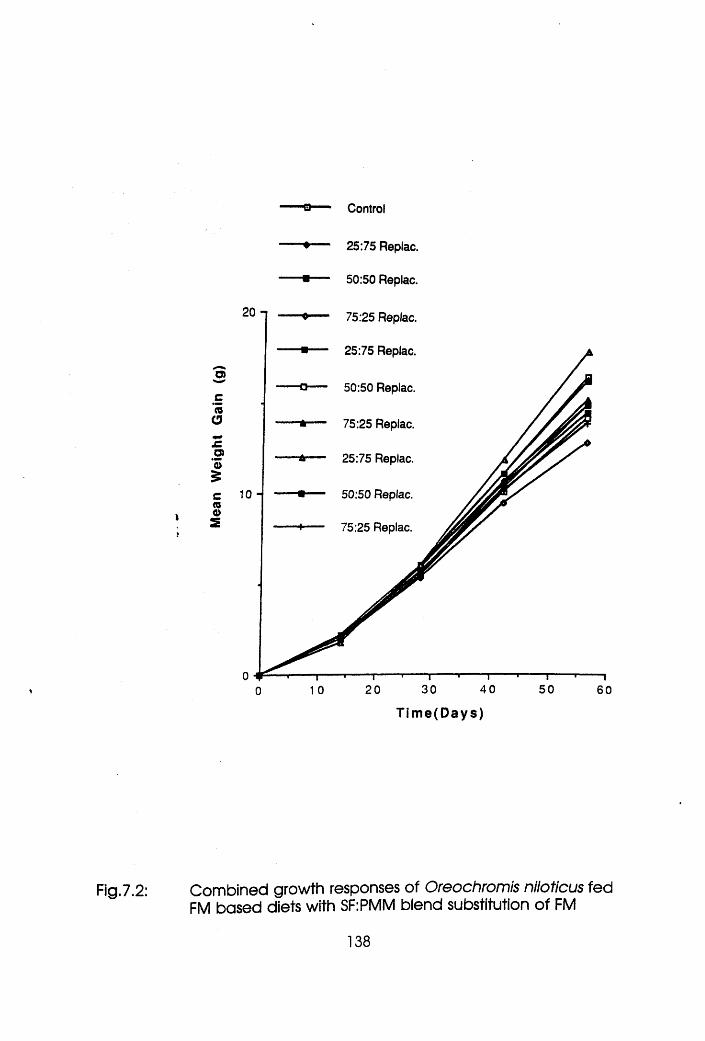
Fig.7.2:
Control
25:75 Replac.
50:50 Replac.
75:25 Replac.
25:75 Replac.
o>50:50 Replac.c
COO 75:25 Replac.x:03®£
25:75 Replac.
50:50 Replac.ccoCD2 75:25 Replac.
30 40 5020 601 00T im e (D a y s )
Combined growth responses of Oreochromis niloticus fed FM based diets with SF:PMM blend substitution of FM
138
Table 7.3 shows that there was deficiency of essential amino acids
(EAAs) in all the diets. Though there was excess of leucine and
deficiency of methionine in all the diets, there was improvement of
amino acid imbalance with the incorporation of poultry meat meal
(PMM) in soybean flour (SF) as blends generally. Methionine level
increased while that of leucine decreased with increase in PMM and
decrease in SF. Higher substitution level of fish meal also caused
reduction of methionine and lysine, and increase in other essential
amino acids.
139
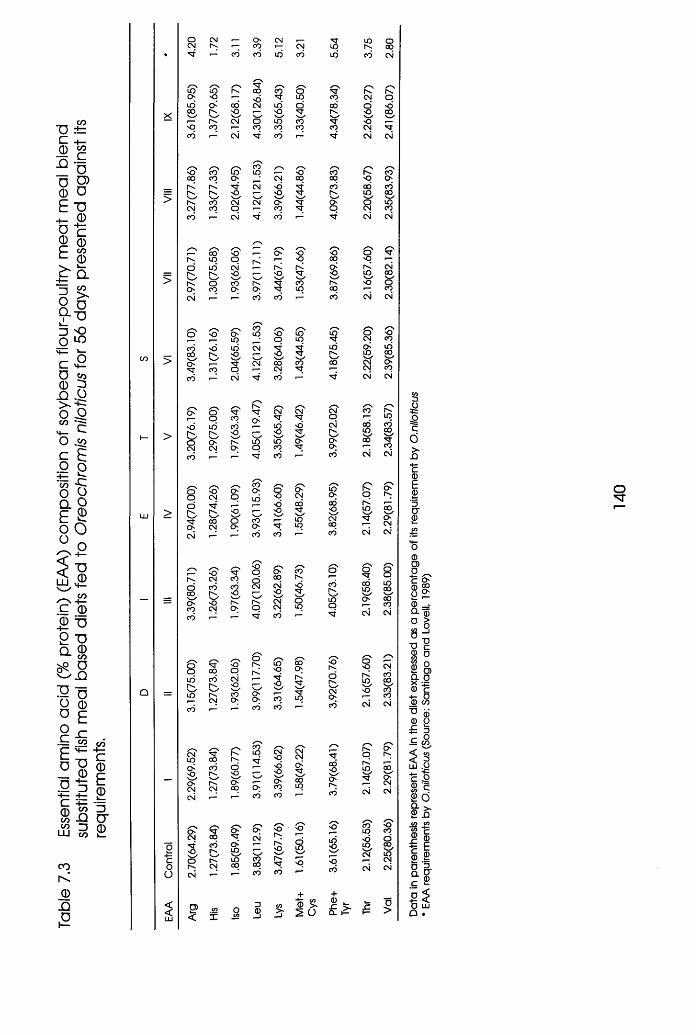
Table
7.3
Es
sent
ial
amin
o ac
id (%
prot
ein)
(E
AA)
com
posi
tion
of so
ybea
n flo
ur-p
oultr
y m
eat
mea
l bl
end
subs
titut
ed
fish
mea
l ba
sed
diet
s fed
to
Ore
ochr
omis
ni
lotic
us
for
56 da
ys
pres
ente
d ag
ains
t its
re
quire
men
ts.
>
>
>
>
oCM
CMt--. [H
MT 1 CO
LOo 8 hv
U500
o'r>.
oo
'Or¥oq
CM
CO r- CM
/--V s~s cO /■—V<3 CO CO LO00 CO O ,_I CMr< r< MT CM <5i'- O -o'—✓ '—'I'- CO CM CM oCM co O i— coCO r“ CM CO
coO
■— ■— CO
.— i— CO
Jl 52 O< X -£2
CO<3 o to ■O
LO o<5 LO CMr o r— o.vy '—' V/
"vT CM 00co o i—| CM
CM CO
:= 18i— ^ CO ■—
sLOr-. Ooo
LO co CM
o / \MTCO CM ooo o o'
o ooo ,_
CO CM MT■f CM CM
/■ N /> /-NCO CO00 <3 oCO oo CO
LO 000^ o LOo CM CO
cm' CM
o o•O o MTCO «o '—c> i< CM•o LO 001 <3 O00 1— COCO CM CM
/—( o8
oCM<3CO
LO C> LO1 . IS 00oo CM 0^
CM COCM CM
oCM CO CvO LOCM* oo COr . 52- ooO'’ oo ¥o •— COCO CM CM
/" NLO oO' o r-.00 i< .—& © 00CM00 CMCO CM CM
o ' §cd OO LO1 52- 00to o 00o 1— CO"cr CM <N
S' S' S'r - * 1— r~~
r < o LO
s S’ So o
CO •— CO
> I % so £
3.05Co>•nc0E2'5O'2£H—O005
I p
0Q- 00 5■o c1 o! § x £ 0 c0 5^ a> 0 o s i ^c °5 sm .0C I2 q 2 oQ- >. 2 aCO CO*co *p9 ©i E 0 2
ItD LUQ *
o
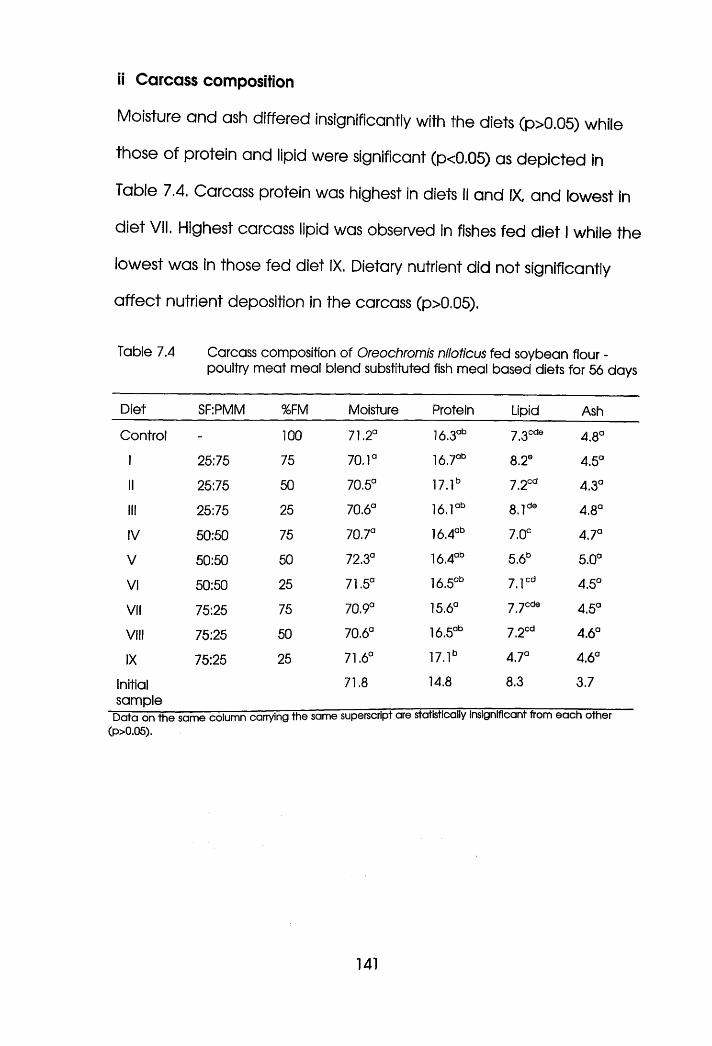
ii Carcass composition
Moisture and ash differed insignificantly with the diets (p>0.05) while
those of protein and lipid were significant (p<0.05) as depicted in
Table 7.4. Carcass protein was highest in diets II and IX, and lowest in
diet VII. Highest carcass lipid was observed in fishes fed diet I while the
lowest was in those fed diet IX. Dietary nutrient did not significantly
a ffect nutrient deposition in the carcass (p>0.05).
Table 7.4 Carcass composition of Oreochromis niloficus fed soybean flour -poultry m eat meal blend substituted fish meal based diets for 56 days
Diet SF:PMM %FM Moisture Protein Lipid Ash
Control - 100 71.2° 16.3ab 7.3cde 4.8°
1 25:75 75 70. l a 16.7ab 8.2s 4.5°
II 25:75 50 70.5° 17.1b 7 2 cct 4.3°
III 25:75 25 70.6° 16. r b 8.1de 4.8°
IV 50:50 75 70.7° 16.4ab 7.0C 4.7°
V 50:50 50 72.3° 16.4ab 5.6b 5.0°
VI 50:50 25 71.5° 16.5ab 7 . r d 4.5°
VII 75:25 75 70.9° 15.6° -j ^cde 4.5°
VIII 75:25 50 70.6° 16.5ab 7.2cd 4.6°
IX 75:25 25 71.6° 17.l b 4.7° 4.6°
Initialsample
71.8 14.8 8.3 3.7
Dota on the some column carrying the same superscript are statistically insignificant from each other (p>0.05).
141
iii Discussion
Replacement of fish meal at 25% with soybean flour-poultry meat
meal blend of 75% soybean flour was found to be most appropriate
as replacement above and blending below these levels inhibited
performance generally. This is in agreement with ealier reports.
Jackson (1982) observed that 25% inclusion of soybean in place of fish
meal gave equally a good growth response of tilapia as the control
i.e without replacement. Similarly, at suboptimal and optimal protein
levels of 24% and 32% respectively, soybean meal could replace fish
meal at 30% but better at suboptimal level (Shiau et al. 1987,1990).
Diet VII did better than the control diet despite its disadvantaged
amino acid balance over the control diet and diets l-VI. It was better
in amino acid balance than diets VIII and IX with respect to the
critical amino acids - methionine, leucine and lysine. The superiority of
this diet could not be attributed to better amino acid balance. It
could be due to factors other than those investigated here, possibly
th@ feeding behaviour of tilapia. In fact, tilapia has earlier been
documented to grow better on methionine and available lysine
deficient soybean meal based diet than on fishmeal that has better
amino acid balance, thereby putting to rest the indispensability of fish
meal in tilapia diets (Rumsey, 1993).
142
Amino acid requirements of tilapia as contained in NRC (1983) and
Tacon(1990) were not met in any of the diets except leucine that was
in excess. Higher inclusion levels of SF decreased methionine and
increased other amino acids which when in excess could be
detrimental to the fish. Excess of certain EAAs like leucine have been
reported to exert toxic effect in fish (Hughes, et al, 1984; Robinson et
al, 1984). Infact, Cho etal. (1991) reported toxicity of leucine in
rainbow trout (Oncorhynchus mykiss) when present in excess of 13.4%.
Although, there was excess of leucine in these diets, no structural
deformity characteristic of leucine toxicity was observed.
Diet VII was higher in soybean flour than poultry meat meal. This
suggests a marginal level of incorporation of poultry meat meal in
soybean flour to give optimum performance of the diets in O.niloticus.
Poultry by-product meal on its own has been postulated to
successfully replace fishmeal at >50% level without compromising
performance in Chinook salmon (Fowler, 1991). Improvement of
soybean flour was therefore achieved by the incorporation of poultry
meat meal. It was evident that addition of poultry meat meal
ameliorated methionine and available lysine deficiency, and reduced
leucine, and the risk of its toxicity. This did not affect carcass
deposition of nutrients, as dietary nutrients related insignificantly with
carcass nutrients. The difference in carcass nutrient was primarily due
to nutrient metabolism in the fish. A blend higher in soybean flour than
poultry meat meal could therefore be considered as a suitable
alternative source of protein to partially replace fish meal.
143
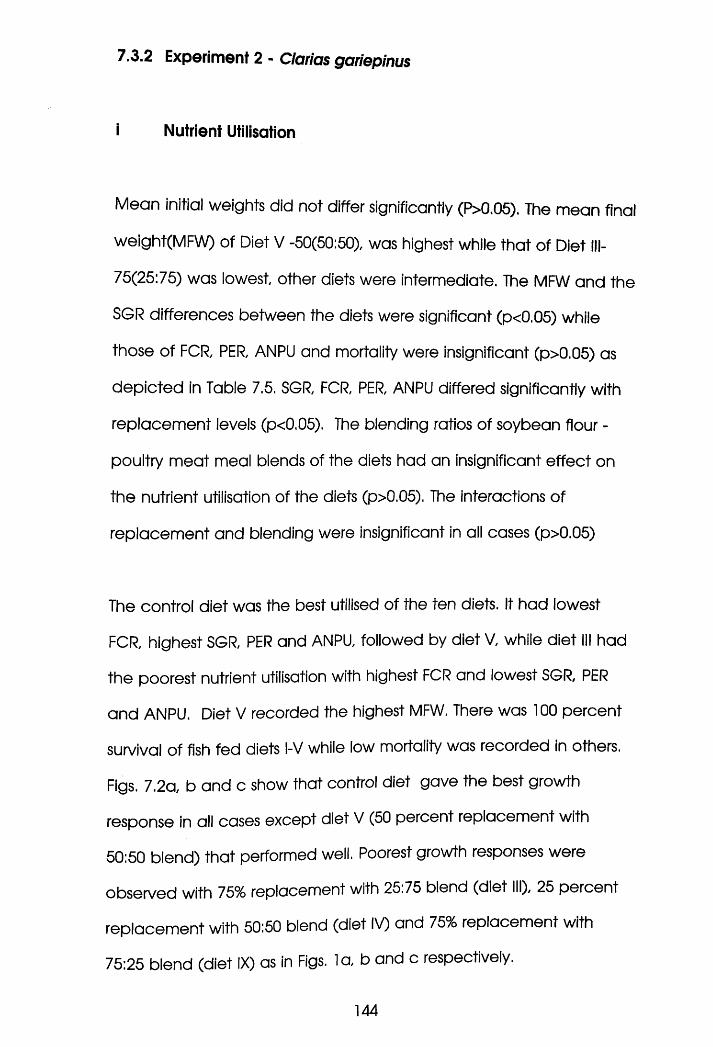
7.3.2 Experiment 2 - Clarias gariepinus
i Nutrient Utilisation
Mean initial weights did not differ significantly (P>0.05). The mean final
weight(MFW) of Diet V -50(50:50), was highest while that of Diet III-
75(25:75) was lowest other diets were intermediate. The MFW and the
SGR differences between the diets were significant (p<0.05) while
those of FCR, PER, ANPU and mortality were insignificant (p>0.05) as
depicted in Table 7.5. SGR, FCR, PER, ANPU differed significantly with
replacement levels (p<0.05). The blending ratios of soybean flour -
poultry meat meal blends of the diets had an insignificant effect on
the nutrient utilisation of the diets (p>0.05). The interactions of
replacement and blending were insignificant in all cases (p>0.05)
The control diet was the best utilised of the ten diets. It had lowest
FCR, highest SGR, PER and ANPU, followed by diet V, while diet III had
the poorest nutrient utilisation with highest FCR and lowest SGR, PER
and ANPU. Diet V recorded the highest MFW. There was 100 percent
survival of fish fed diets l-V while low mortality was recorded in others.
Figs. 7.2a, b and c show that control diet gave the best growth
response in all cases except diet V (50 percent replacement with
50:50 blend) that performed well. Poorest growth responses were
observed with 75% replacement with 25:75 blend (diet III), 25 percent
replacement with 50:50 blend (diet IV) and 75% replacement with
75:25 blend (diet IX) as in Figs. 1a, b and c respectively.
144
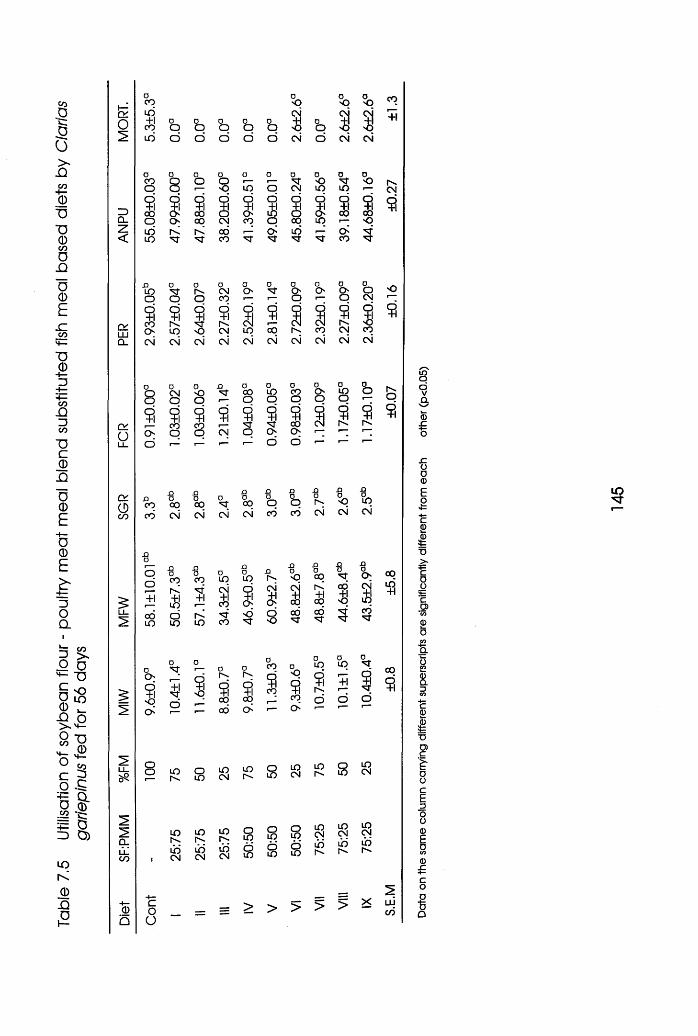
Table
7.5
Ut
ilisat
ion
of so
ybea
n flo
ur -
poul
try
mea
t m
eal
blend
su
bstit
uted
fish
m
eal
base
d di
ets
by C
lario
s ga
riepi
nus
fed
for
56 da
ys
CLO
IDQ_Z<
CLLUCL
CLO
CL0CO
GIL LCO
Doo
4?CO
oO
Do oO
oO
0O
ib o o o o o
aCOO
aOo
oO
oOqo
LOo
O900O c£
100
iqodo
iblo
r<mt
l<Mf 00CO
c>MT
X)LOo
o
Oor^.o
oCMCO
oO
o
o+1COo
9LO
1o 9r'-CM
iLO
900
CM CM CM CM CM CM
oOO
DCMO
oOo
A 000O
oLOo
9 9COo
9COo9CM
9MTo95
o 1 * o
nCO
.QOcox>oco 0
MT
XI000XJ0O
cb CM CM cm' CM cb
Oo+icoLO
01c>
oo
X I0CO
X IoCO
0iO
r<
LO1 CM
+1qOLO ub CO
o o
9o-sT
$ Sco oOCO O '
q
3oo
co900
0O
o<5
oO
CMi 0o
CM3 CM*3CM o CM CM
0MTcm
0OiO
oMfLO
oO
oo iq I iq
ibMT mT
CNCO
MT
oOO
oO '
oO 'O
aOCM
a iCO
9CM O
CM CM CM CM
0COO
0O 'O
0LOo
0O
900O ' 1 9 9P^
o
XI X I X3 nno
o <3 iOcb CM CM CM
X I X) X I XJooo. 00 MT O '
+ jq s 5q CMs00mT 00MT MTMT cb'Cf
00
+i
CM
o9
ro
00
•o
Ic>
o o LO LO co
9
LOr-vLOCM
co _ o
lO LO
LO LO CM CMo o oLO LO LOo o oLO LO LO
CM CM ib lo ib r--
= = > > > > > ^CO
oVaN-/<5f
c<DIT3>OO!Pca>'</5£01•c0w53aS
1I■oCDc£bocEooo0)Eov>0.c+-co
•§D
$
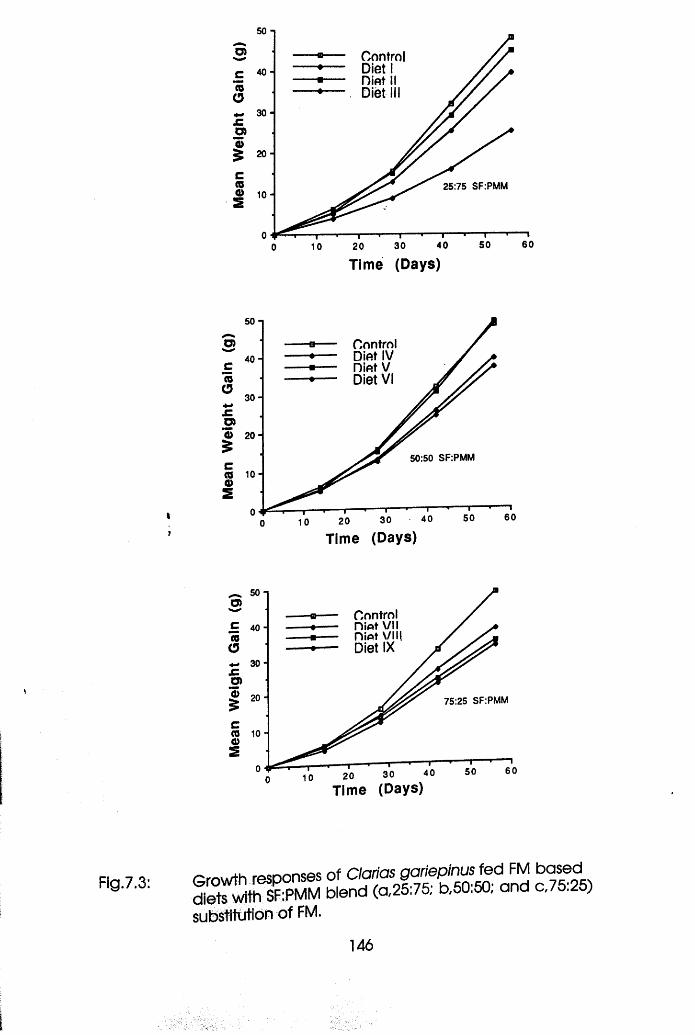
I>
Fig.7.3:
50 no> Control
Diet I Diet II
. Diet III
C 40 -"toO
O)<D£ 20-CAS© 1 0 -
25:75 SF:PMM
6050403020100Time (Days)
5 0 -i
Control Diet IV Diet V Diet VI
3C(0O
30 -
£34) 2 0 -£
50:50 SF:PMMC<0 1 0 - 0)2
60503020
Time (Days)
50 -lO>
Control n iA t V IIm e t v i i i Diet IX
c75O
co| 2 0 - 75:25 SF:PMM
C(0©2
0 6050403020Time (Days)
Growth responses of C to ^ ganep/nus fed FM based diets with SF:PMM blend (a,25.75, b,50.50, and c,/b.zs) substitution of FM.
146
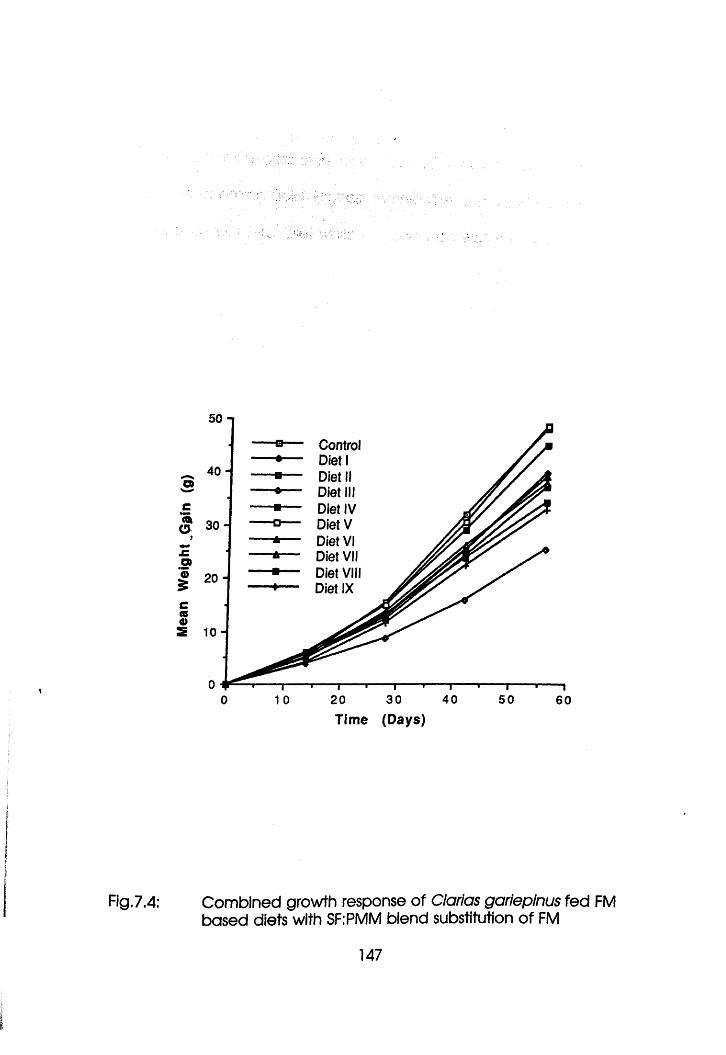
Mean
W
eigh
t JS
gin
(g)
Control Diet I Diet II Diet III Diet IV Diet V Diet VI Diet VII Diet VIII Diet IX
Time (Days)
Fig.7.4: Combined growth response of Clarias garlepinus fed FMbased diets with SF:PMM blend substitution of FM
147
There was essential amino acid imbalance in all the diets. Only
requirements for leucine and threonine were met as shown in Table
7.6. There was excess of leucine and deficiency of methionine as the
first limiting amino acid. Highest methionine and lowest leucine were
recorded in Control Diet while the converse was the case in Diet IX.
Increase in poultry meat meal increased methionine and reduced
leucine. Increase in fish meal replacement reduced methionine and
increased leucine.
148
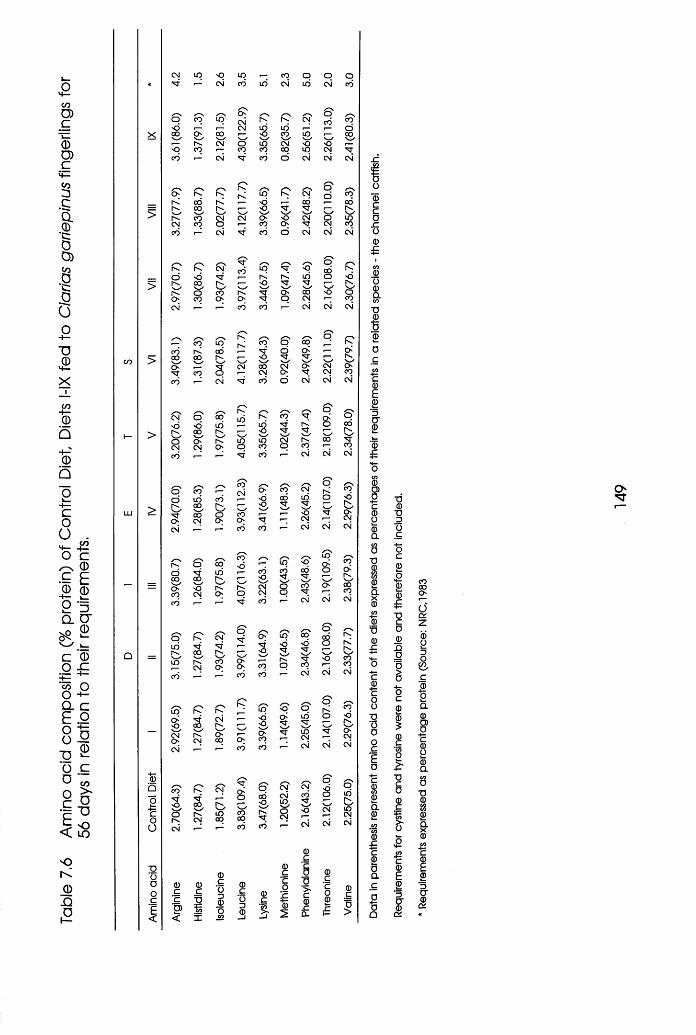
Table
7.6
Am
ino
acid
com
posi
tion
(% pr
otei
n)
of C
ontro
l Di
et
Diet
s l-IX
fed
to
Clar
ias
garie
pinu
s fin
gerli
ngs
for
56 da
ys
in re
latio
n to
thei
r re
quire
men
ts.
>
>
>
>
>
bocoO
•g'oaocE<
CM iq o1 CM
O CO q< 5 r ZCO o OO
v yr ^ . CM
< 5 CO >—CO 1 CM
/----VO I"".r < o o r <
0 0' —' '— 'i ^ . CO CMCM CO Oc o 1 CM
S N /— «.I ' ' . CMb < 5r - . o o r - .
v._' .—✓r ^ . o COo CO O
CM 1 1
/----V / NCO q
CO o oo o o o r»'—' '—'o MT
c o OCO 1 CM
/■—\CM o 0 0
<j -d idr-« o ow \-/O oCM CMCO 1 1
o c o 1—b id c dt". o o r ^ .
c o " oo CM O'.CM 1
r - . o o o
b ido o o o i-".
V.—' '— 'O oCO CM e >c d 1
^ sO r^ . CMb "CT MT
o o t--.'—s '—✓ V_'iO CO
CM O'.CO 1
/—< .— *to r~- r-c> CM5 /
0 0 t ' -
CM o ^O CM o o
CM
/—\CO CMMT " f i—O OOw n-/ __’O r-- iOr-- CM CO
CM r—
© © c cg =g’g>< X
r - .— MT
r- CO CO
CO CO ■—
©C'co® ic
•i t5
LO -Oco oo
O CO O "C r— CM
CO CM CM
CO S '/—00
S '
•sf-o o c>M ,
oo”CM
CMO'
O' CMCM
cd o CM CM
©c'cog> •c©£CL
✓-N S'00 oo rv<5 o i<MT rvvy '—^
CO"C •oCO 1— CO
CM CM CM
'o©ac/3
T3©g2occ©E2'5<T2©£
©0)£c©o©a<nD•o©S32Q.x©42©tl©JZ
©JZc©oac•§Q
oc2©©c
"coO£TSCo©c+=2: » S:
C©E2
‘5cr©O'
c'©oo .©CDOc©o©aCOo•D©S3©a©
■§©£23O'©O'
O
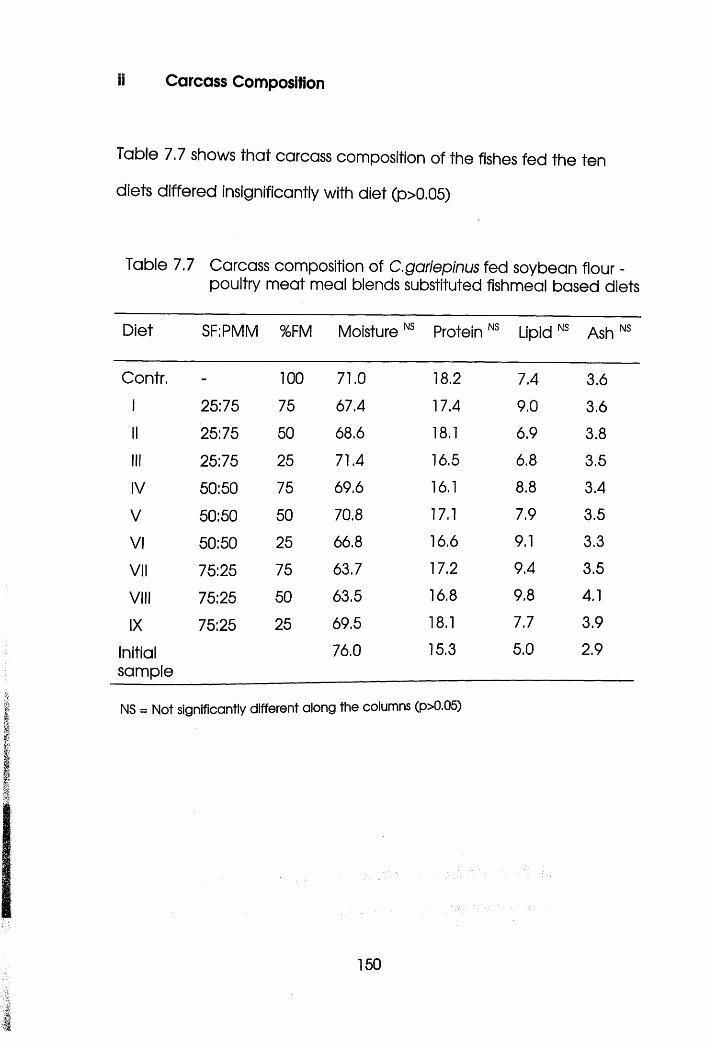
ii Carcass Composition
Table 7.7 shows that carcass composition of the fishes fed the ten
diets differed insignificantly with diet (p>0.05)
Table 7.7 Carcass composition of C.gariepinus fed soybean flour - poultry meat meal blends substituted fishmeal based diets
Diet SF:PMM %FM Moisture NS Protein NS Lipid NS Ash NS
Contr. - 100 71.0 18.2 7.4 3.61 25:75 75 67.4 17.4 9.0 3.6II 25:75 50 68.6 18.1 6.9 3.8
III 25:75 25 71.4 16.5 6.8 3.5
IV 50:50 75 69.6 16.1 8.8 3.4
V 50:50 50 70.8 17.1 7.9 3.5
VI 50:50 25 66.8 16.6 9.1 3.3
VII 75:25 75 63.7 17.2 9.4 3.5
VIII 75:25 50 63.5 16.8 9.8 4.1
IX 75:25 25 69.5 18.1 7.7 3.9
Initial 76.0 15.3 5.0 2.9sample
NS = Not significantly different along the columns (p>0.05)
150
iii Discussion
Diet V did equally well as the control diet. Diet V was a 50:50 blend of
soybean flour and poultry meat meal. This suggests an equal level of
incorporation of poultry meat meal in soybean flour to give optimum
nutrient balance and good performance of the diets. It was evident
that addition of poultry meat meal ameliorated methionine and
available lysine deficiency, and reduced leucine. In terms of amino
acid balance, only the superiority of control diet could be attributed
to better amino acid balance as it had the highest methionine and
the least leucine. That of diet V could be due to factors other than
those investigated here, possibly due to improved palatability and
reduction in antinutritional factors that demand further investigation.
Conversely, higher inclusion level of SF increased other amino acids
which when in excess could be detrimental to the fish as
aforementioned. Performance of fishes fed diet V equals that of the
control diet suggesting diet V as the best alternative to fishmeal
protein diet i.e a 50:50 blend of SF:PMM replacing fish meal at 50%.
The rest of the discussion regarding risk of excess leucine toxicity is
similar to that of O.niloticus.
The superiority of diet V not withstanding, favourable SGR, FCR, PER,
ANPU and high survival rate made them suitable for the intensive
culture of grower C.gariepinus.
151
CHAPTER EIGHT
SUPPLEMENTATION OF SOYBEAN FLOUR-POULTRY MEAT MEAL BLEND BASED DIETS WITH DL-METHIONINE TO IMPROVE NUTRIENT UTILISATION IN
OREOCHROMIS NILOTICUS AND CLARIAS GARIEPINUS.
152
8.1 Introduction
Several investigations into the effects of supplementing synthetic
amino acids to diets with amino acid deficiencies have been
conducted, The results, to date, have been inconsistent sometimes
showing improvements when the single most limiting amino acid is
supplemented and sometimes only when two or more deficient
amino acids are added. Some authors have argued that naturally
rich sources of a deficient amino acid are superior to supplements.
Individual supplementaion of methionine, lysine, histidine or leucine to
the diet of rainbow trout was observed not to improve the growth
rate of the fish but collective supplementation did (Rumsey and
Ketola, 1975). Fordiani and Ketola (1980) recorded improved growth in
rainbow trout fed a methionine supplemented commercial soybean
diet, but growth was not improved when the soybean was reheated.
Viola et al. (1982), Tacon et al. (1984) and Murai et al. (1986)
recorded improved growth in carp, Oreochromis niloticus and
channel catfish respectively when they were fed soybean containing
diets with methionine supplementation.
A major factor militating against successful utilisation of synthetic
amino acid supplemented to diet appears to be premature
absorption. This makes it unavailable when jointly required with the
other amino acids by the fish. This joint availability is evaluated as
153
balance of essential amino acids in the plasma (BEAAP). Premature
absorption reduces BEAAP value of amino acid supplemented diets.
This low BEAAP value has been found responsible for the reduced
growth consistently observed when fish silage was substituted for fish
meal in salmon diets (Hardy, 1991).
The use of complementary feedstuffs, in terms of aimno acid profile, in
fish diet formulation to meet nutrient requirements could therefore be
the most effective way of overcoming amino acid deficiency. The
amino acids of such diets are concurrently available to fish thereby
giving them a high BEAAP value. For example, a combination of
menhaden and soybean protein will be better than either of them
alone in eel's diet as their critically limiting amino acids are
complementary (Lovell,1990). Other lower cost animal proteins than
fishmeal, such as poultry meat meal, are richer in methionine and
cystine than soybean. Blending of such materials with soybean in fish
diets should be beneficial.
The present experiment was designed to investigate the effects of
blending methionine rich but lower cost, animal protein (poultry meat
meal) with methionine deficient soybean flour and the
supplementation of these blends with dl-methionine on the
performance of the Nile tilapia (Oreochromis niloticus) and the
African catfish (Clarias gariepinus).
154
8.2 Materials and Methods
Two parallel experiments were conducted using 24 50L tanks.
Oreochromis niloticus (M±S.E = 1.85±0.05g) and Clarias gariepinus
(M±S.E. = 3.25±0.07g) fingerlings were stocked in duplicate (15 fish/
tank). They were fed six soybean flour(SF) - poultry meat meal blend
(25:75; 50:50; 75:25) based diets with or without dl- methionine
supplementation (diets l-VI) at 6% body weight per day, thrice daily at
10:00 , 14:00 and 18:00 for eight weeks. Fishes were bulk weighed
every 2 weeks and feeding rates adjusted accordingly. A 2x3 factorial
design was adopted for the experiments
The tanks were regularly cleaned by siphoning off accumulated
wastes. Water flow was maintained at 2L min'1 per tank and water
quality parameters were monitored fortnightly using the methods
described in 3.5.2 and got the following range of values: Temperature,
26-27°C; dissolved oxygen (DO), 6.0-6.6 mgL'1; pH, 6.0; NH3-N, 0.4-1.0
mgL'1; N02'-N, 0.2 mgL’1; N03'-N, 20 mgL'1; Ca-hardness, 63-99 mgL'1
and total hardness, 84-118 mgL'1.
The proximate composition of the experimental diets is shown in Table
8.1. 1mm pellets were prepared using a California Pellet Mill (model
Cl 9) ©quipped with a steam conditioner and subsequently dried by
convection at 60°C overnight. After cooling, diets were packed in
sealed black polythene bags and stored (-30 C) until required.
155
Chemical analysis of feedstuffs, diets and carcass (initial and final)
was performed according to AOAC (1990) accoding to the
procedures in 3.6.1. Eight specimens for each species were used for
the initial carcass analysis while four specimens per tank were
processed for the final carcass analysis.
Heparinized blood samples - using ammonium salt of heparin, were
collected in eppendorf test tubes as described by Svobodova, et al
(1991). A 1:1 mixture of blood plama sample: 10% 5-sulphosalicyclic
acid solution were refrigerated for 30 minutes and then centrifuged
for 10 minutes at 23,000 r.p.m. using Beckman Ultra Centrifuge, Palo
Alto, California. The supernatant was saved for amino acid analysis.
Alpha-plus Amino Acid Analyser (LKB Bichrom Ltd, Cambridge) was
used for amino acid analysis of the feedstuffs, diets, carcass and the
blood plasma. Biological parameters measured as described in 3.6.2,
Statistical analysis was carried out as described in 3.7
156
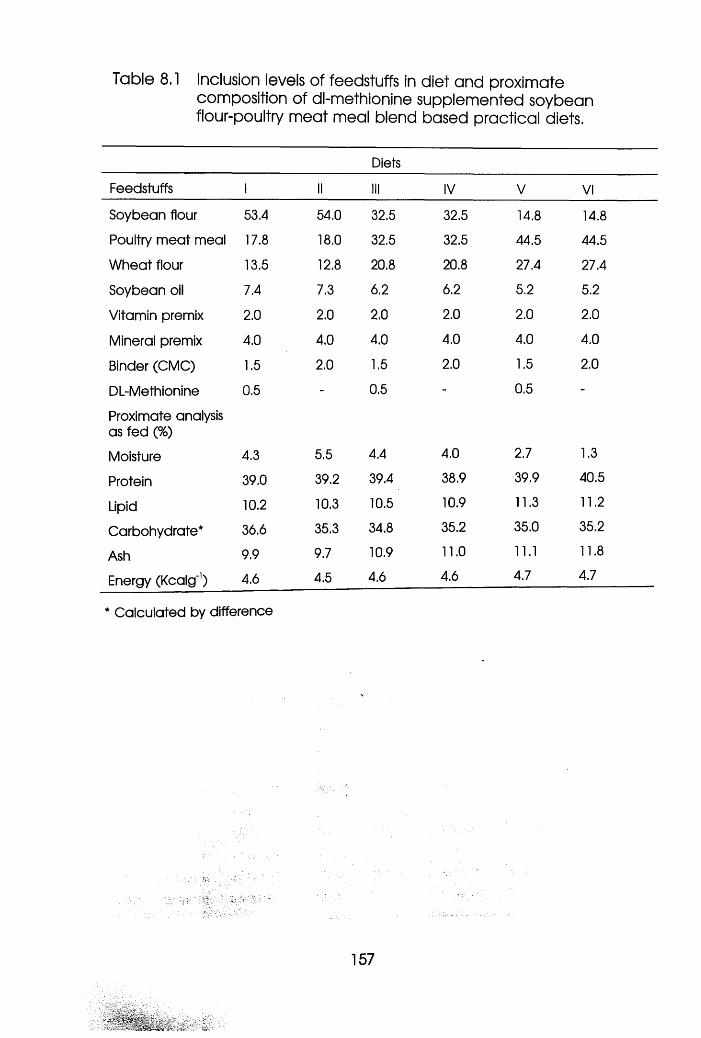
Table 8.1 Inclusion levels of feedstuffs in diet and proximatecomposition of dl-methionine supplemented soybean flour-poultry meat meal blend based practical diets.
Diets
Feedstuffs 1 II III IV V VI
Soybean flour 53.4 54.0 32.5 32.5 14.8 14.8
Poultry m eat meal 17.8 18.0 32.5 32.5 44.5 44.5
W heat flour 13.5 12.8 20.8 20.8 27.4 27.4
Soybean oil 7.4 7.3 6.2 6.2 5.2 5.2
Vitamin premix 2.0 2.0 2.0 2.0 2.0 2.0
Mineral premix 4.0 4.0 4.0 4.0 4.0 4.0
Binder (CM C) 1.5 2.0 1.5 2.0 1.5 2.0
DL-Methionine 0.5 - 0.5 - 0.5 -
Proximate analysis as fed (%)
Moisture 4.3 5.5 4.4 4.0 2.7 1.3
Protein 39.0 39.2 39.4 38.9 39.9 40.5
Lipid 10.2 10.3 10.5 10.9 11.3 11.2
Carbohydrate* 36.6 35.3 34.8 35.2 35.0 35.2
Ash 9.9 9.7 10.9 11.0 11.1 11.8
Energy (Kcalg'1) 4.6 4.5 4.6 4.6 4.7 4.7
* Calculated by difference
157
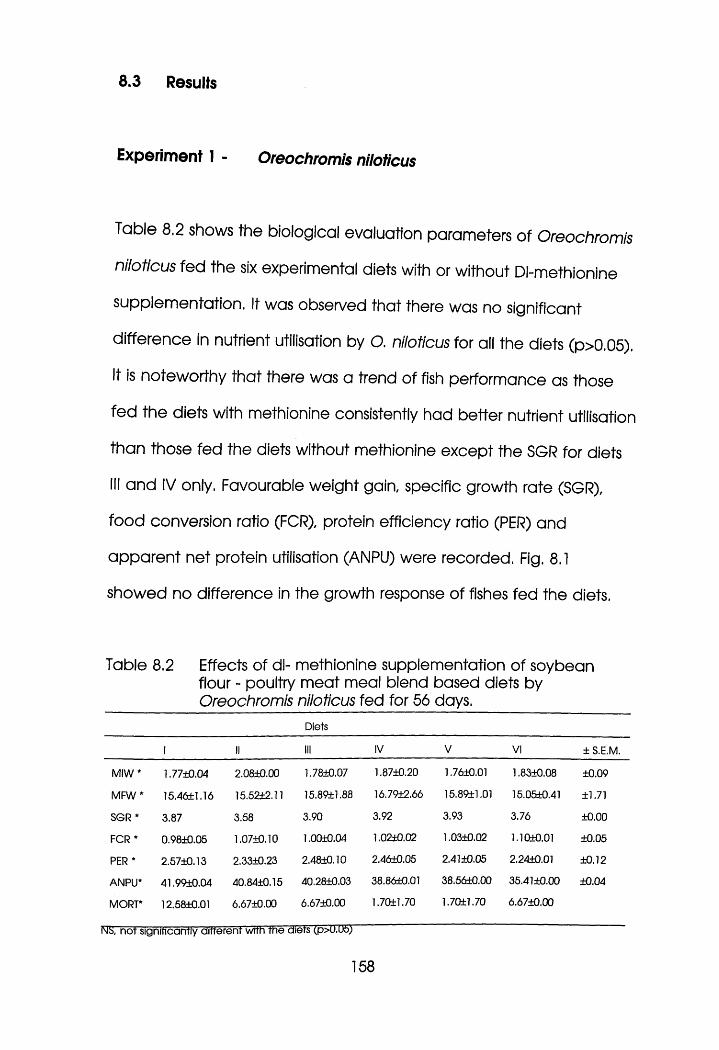
8.3 Results
Experiment 1 - Oreochromis niloticus
Table 8.2 shows the biological evaluation parameters of Oreochromis
niloticus fed the six experimental diets with or without Dl-methionine
supplementation. It was observed that there was no significant
difference in nutrient utilisation by O. niloticus for all the diets (p>0.05).
It is noteworthy that there was a trend of fish performance as those
fed the diets with methionine consistently had better nutrient utilisation
than those fed the diets without methionine except the SGR for diets
III and IV only. Favourable weight gain, specific growth rate (SGR),
food conversion ratio (FCR), protein efficiency ratio (PER) and
apparent net protein utilisation (ANPU) were recorded. Fig. 8.1
showed no difference in the growth response of fishes fed the diets.
Table 8.2 Effects of dl- methionine supplementation of soybean flour - poultry meat meal blend based diets byOreochromis niloticus fed for 56 days.
Diets
1 II III IV V VI 1S.E.M.
MIW * 1.7710.04 2.0810.00 1.7810.07 1.8710.20 1.7610.01 1.8310.08 10.09
MFW* 15.4611.16 15.5212.11 15.8911.88 16.7912.66 15.8911.01 15.0510.41 11.71
SGR * 3.87 3.58 3.90 3.92 3.93 3.76 10.00
FCR* 0.9810.05 1.0710.10 1.0010.04 1.0210.02 1.0310.02 1.1010.01 10.05
PER * 2.5710.13 2.3310.23 2.4810.10 2.4610.05 2.4110.05 2.2410.01 ±0.12ANPU* 41.9910.04 40.8410.15 40.2810.03 38.8610.01 38.5610.00 35.4110.00 10.04
MORT* 12.5810.01 6.6710.00 6.6710.00 1.7011.70 1.7011.70 6.6710.00
NS, not significantly different with me diets (p>u.Ub)
158

o>
Diet 1 Diet 2 Diet 3 Diet 4 Diet 5 Diet 6
c‘501
cCB<D2
20 30 401 00 50 60
Time (Days)
Fig.8.1: Growth response of Oreochromis niloticus fed dl-methionine supplemented SF-PMM blend based diets.
159
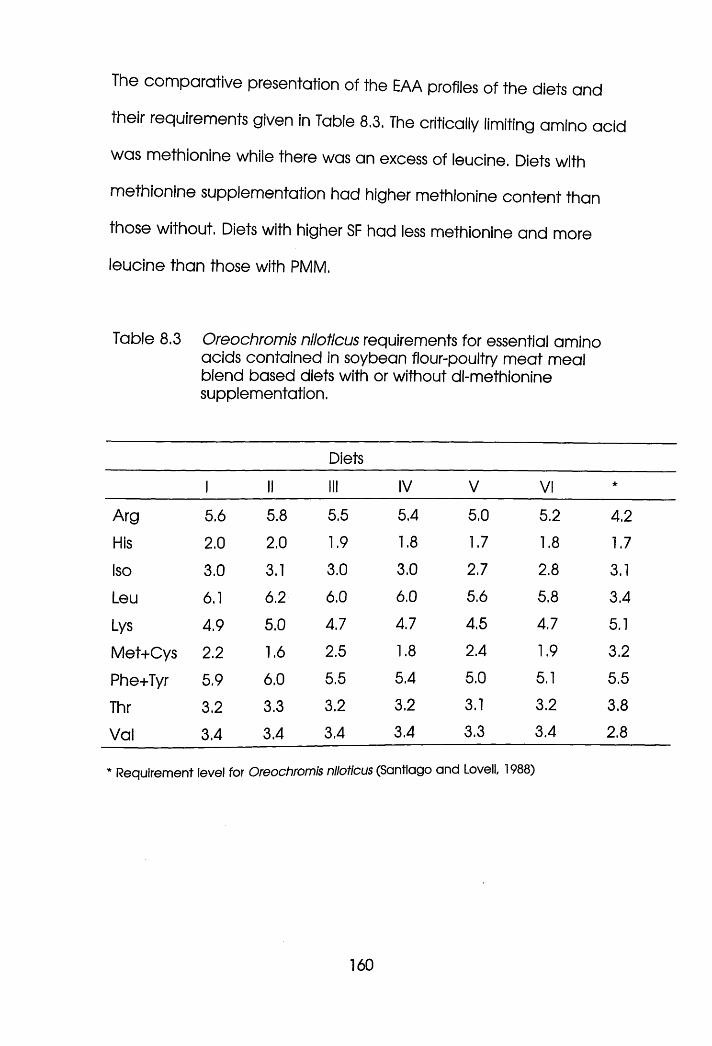
The comparative presentation of the EAA profiles of the diets and
their requirements given in Table 8.3. The critically limiting amino acid
was methionine while there was an excess of leucine. Diets with
methionine supplementation had higher methionine content than
those without. Diets with higher SF had less methionine and more
leucine than those with PMM.
Table 8.3 Oreochromis niloticus requirements for essential amino acids contained in soybean flour-poultry meat meal blend based diets with or without dl-methionine supplementation.
Diets
1 II III IV V VI *
Arg 5.6 5.8 5.5 5.4 5.0 5.2 4.2
His 2.0 2.0 1.9 1.8 1.7 1.8 1.7
Iso 3.0 3.1 3.0 3.0 2.7 2.8 3.1
Leu 6.1 6.2 6.0 6.0 5.6 5.8 3.4
Lys 4.9 5.0 4.7 4.7 4.5 4.7 5.1
Met+Cys 2.2 1.6 2.5 1.8 2.4 1.9 3.2
Phe+Tyr 5.9 6.0 5.5 5.4 5.0 5.1 5.5
Thr 3.2 3.3 3.2 3.2 3.1 3.2 3.8
Val 3.4 3.4 3.4 3.4 3.3 3.4 2.8
* Requirement level for Oreochromis niloticus (Santiago and Lovell, 1988)
160
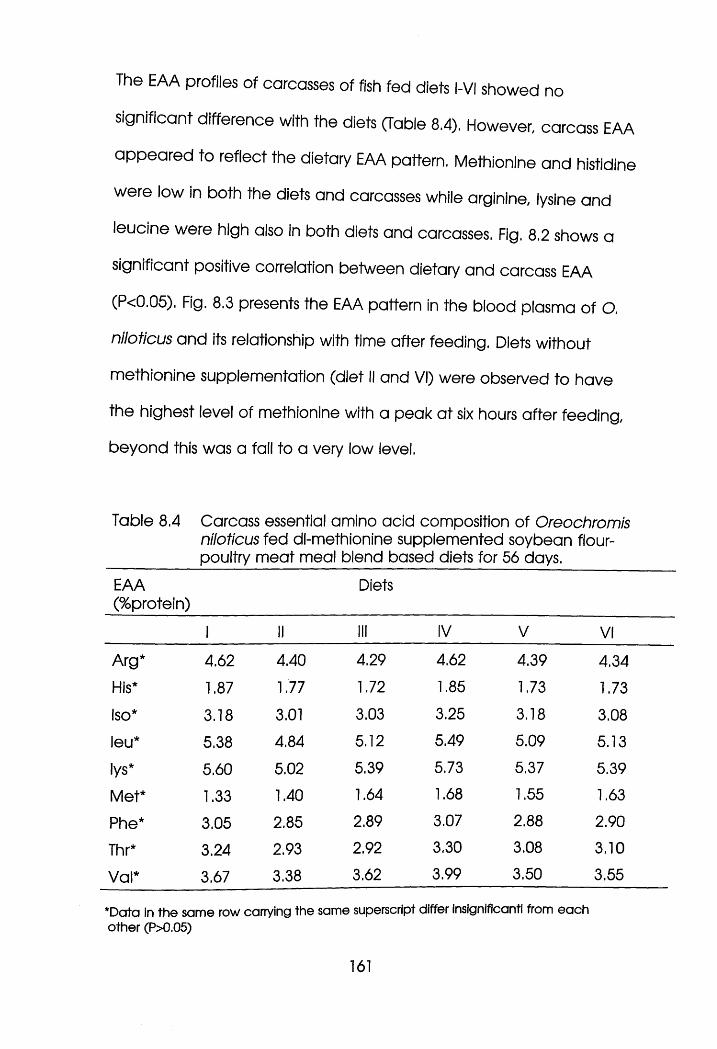
The EAA profiles of carcasses of fish fed diets l-VI showed no
significant difference with the diets (Table 8.4). However, carcass EAA
appeared to reflect the dietary EAA pattern. Methionine and histidine
were low in both the diets and carcasses while arginine, lysine and
leucine were high also in both diets and carcasses. Fig. 8.2 shows a
significant positive correlation between dietary and carcass EAA
(P<0.05). Fig. 8.3 presents the EAA pattern in the blood plasma of O.
niloticus and its relationship with time after feeding. Diets without
methionine supplementation (diet II and VI) were observed to have
the highest level of methionine with a peak at six hours after feeding,
beyond this was a fall to a very low level.
Table 8.4 Carcass essential amino acid composition of Oreochromis niloticus fed dl-methionine supplemented soybean flour- poultry meat meal blend based diets for 56 days.
EAA(%protein)
Diets
1 II III IV V VI
Arg* 4.62 4.40 4.29 4.62 4.39 4.34His* 1.87 1.77 1.72 1.85 1.73 1.73
Iso* 3.18 3.01 3.03 3.25 3.18 3.08
leu* 5.38 4.84 5.12 5.49 5.09 5.13
iys* 5.60 5.02 5.39 5.73 5.37 5.39
Met* 1.33 1.40 1.64 1.68 1.55 1.63
Phe* 3.05 2.85 2.89 3.07 2.88 2.90
Thr* 3.24 2.93 2.92 3.30 3.08 3.10
Val* 3.67 3.38 3.62 3.99 3.50 3.55
*Data in the same row carrying the same superscript differ insignificantl from each other (P>0.05)
161
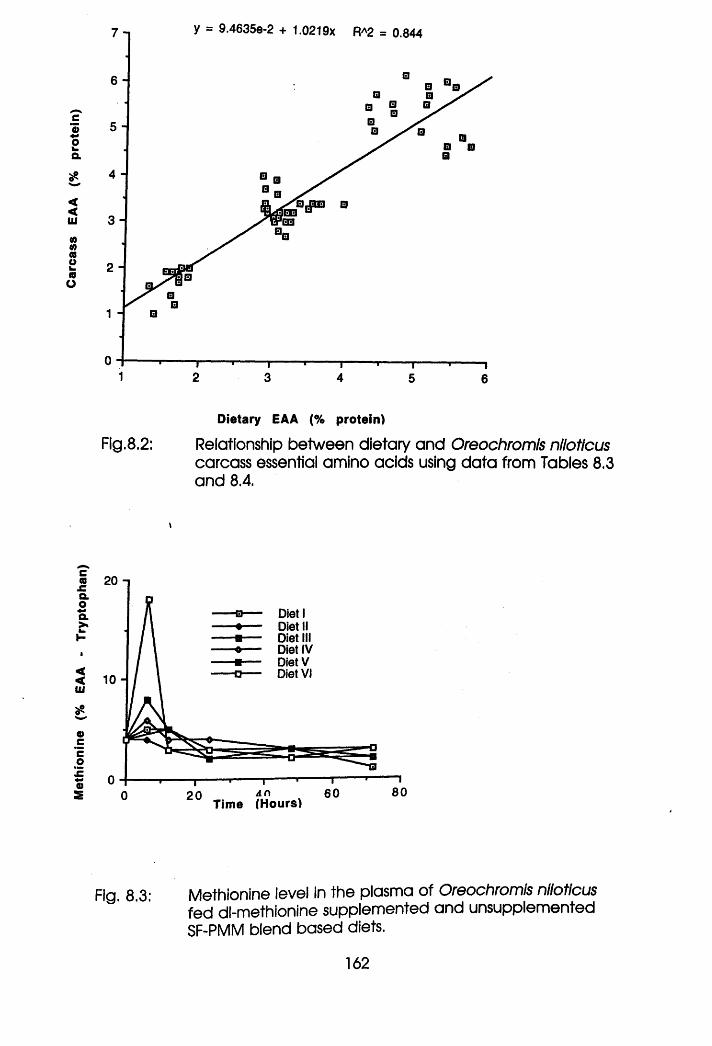
Met
hion
ine
(% EA
A -
Tryp
toph
an)
Carc
ass
EAA
(% pr
otei
n)
y = 9.4635e-2 + 1.0219x R*2 = 0.844
6
5
4
3
2
1 El
Dietary EAA (% protein)
Fig.8.2: Relationship between dietary and Oreochromis niloticuscarcass essential amino acids using data from Tables 8.3 and 8.4.
\
20 n
Diet I Diet II Diet III Diet IV Diet V Diet VI10 -
806020 AnTime (Hours)
Fig. 8.3: Methionine level in the plasma of Oreochromis niloticusfed dl-methionine supplemented and unsupplemented SF-PMM blend based diets.
162
Histologically, there was fat deposition in the liver tissue and
vacuolation of hepatocytes which became pronounced with
increased lipid content as a result of increased incorporation of
poultry meat meal in the diet were evident. These were so
pronounced in the 75:25 SF:PMM that they could have been
pathological at this level (Plates 8.1 a, b, c and d).
However, certain degree of liver vacuolation is characteristic of
farmed fish (Turnbull, Personal Communication). This could be
responsible for the insignificant difference in the mortality of fish fed
these diets.
163
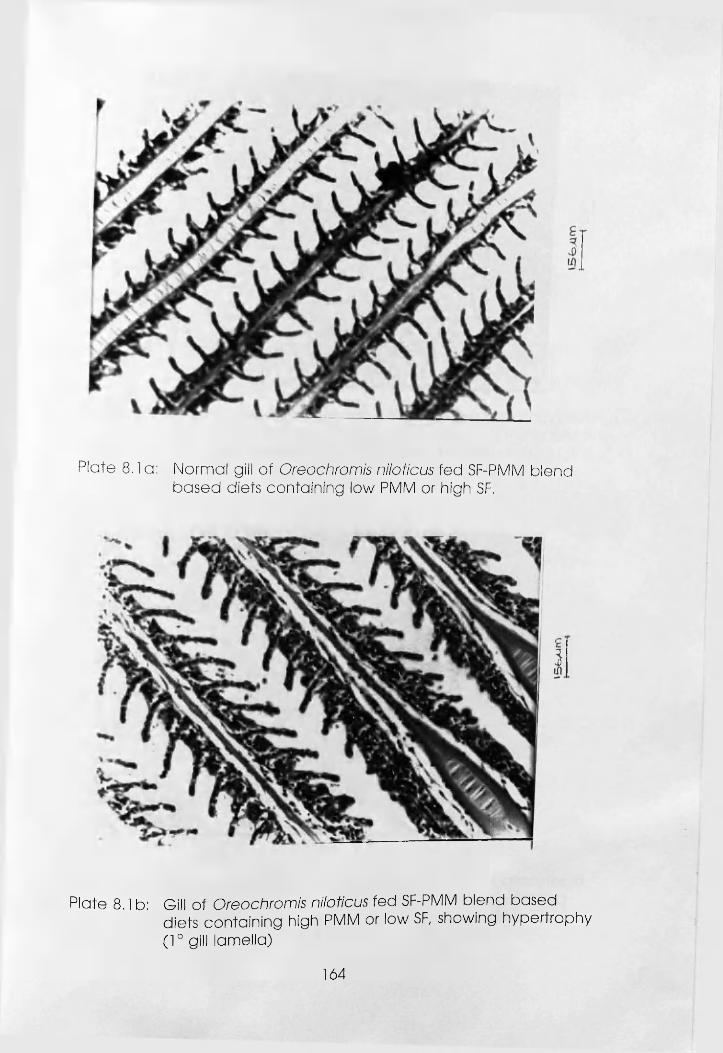
Plate 8.1 a: Normal gill of Oreochromis niloticus fed SF-PMM blend based diets containing low PMM or high SF.
3
Plate 8.1 b: Gill of Oreochromis niloticus fed SF-PMM blend baseddiets containing high PMM or low SF, showing hypertrophy (1° gill lamella)
164
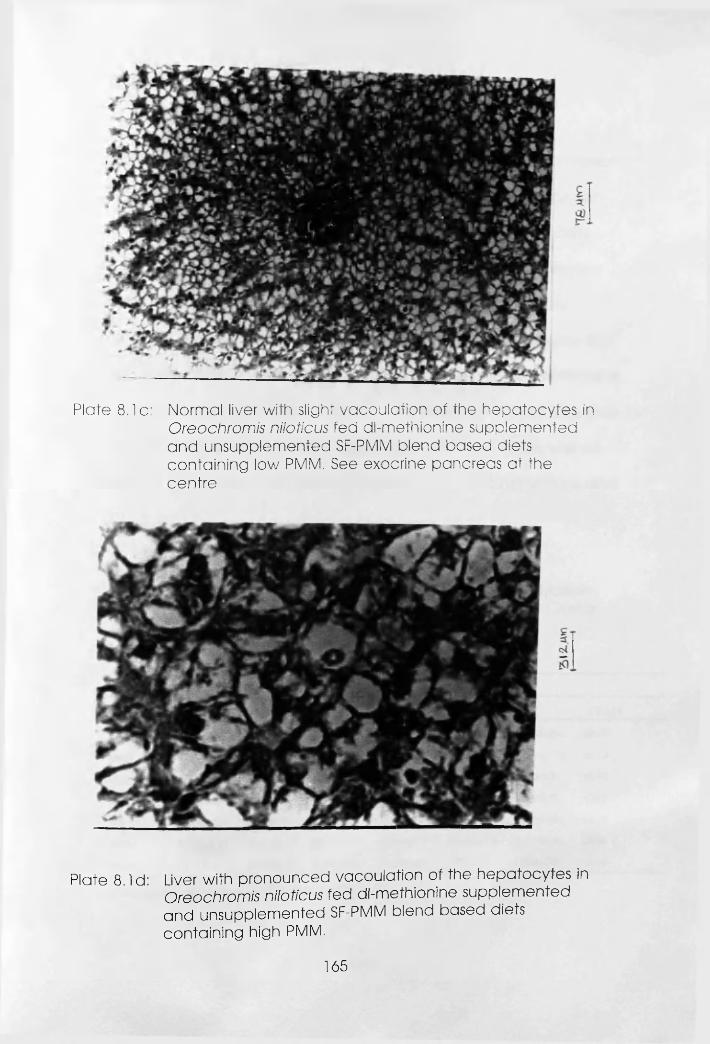
Plate 8.1 c: Normal liver with slight vacoulation of the hepatocytes in Oreochromis niloticus fed dl-methionine supplemented and unsupplemented SF-PMM blend based diets containing low PMM. See exocrine pancreas at the centre
Plate 8.Id: Liver with pronounced vacoulation of the hepatocytes in Oreochromis niloticus fed dl-methionine supplemented and unsupplemented SF-PMM blend based diets containing high PMM.
165
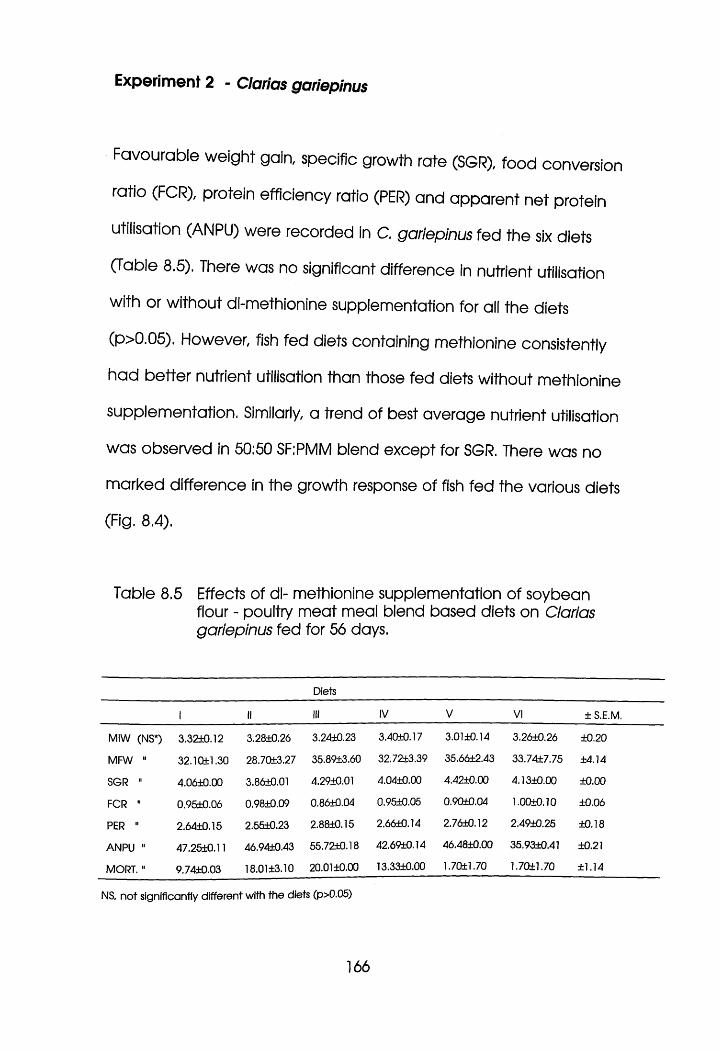
Experiment 2 - Clarias gariepinus
Favourable weight gala specific growth rate (SGR), food conversion
ratio (FCR), protein efficiency ratio (PER) and apparent net protein
utilisation (ANPU) were recorded in C. gariepinus fed the six diets
(Table 8.5). There was no significant difference in nutrient utilisation
with or without dl-methionine supplementation for all the diets
(p>0.05). However, fish fed diets containing methionine consistently
had better nutrient utilisation than those fed diets without methionine
supplementation. Similarly, a trend of best average nutrient utilisation
was observed in 50:50 SF:PMM blend except for SGR. There was no
marked difference in the growth response of fish fed the various diets
(Fig. 8.4).
Table 8.5 Effects of dl- methionine supplementation of soybean flour - poultry meat meal blend based diets on Clarias gariepinus fed for 56 days.
Diets
I II III IV V VI ± S.E.M.
MIW (NS*) 3.32+0.12 3.28±0.26 3.24±0.23 3.40±0.17 3.01±0.14 3.26±0.26 ±0.20
MFW " 32.10ttl.30 28.70+3.27 35.89±3.60 32.72±3.39 35.66±2.43 33.74±7.75 ±4.14
SGR " 4.06±0.00 3.86±0.01 4.29±0.01 4.04±0.00 4.42±0.00 4.13±0.00 ±0.00
FCR 11 0.95+0.06 0.98±0.09 0.86±0.04 0.95+0.05 0.90+0.04 1.00+0.10 ±0.06
PER " 2.64±0.15 2.55±0.23 2.88±0.15 2.66±0.14 2.76±0.12 2.49±0.25 ±0.18
ANPU " 47.25±0.11 46.94±0.43 55.72±0.18 42.69t0.14 46.48±0.00 35.93±0.41 ±0.21
MORT. " 9.74+0.03 18.01±3.10 20.01±0.00 13.33±0.00 1.7041.70 1.7041.70 ±1.14
NS, not significantly different with the diets (p>0.05)
166
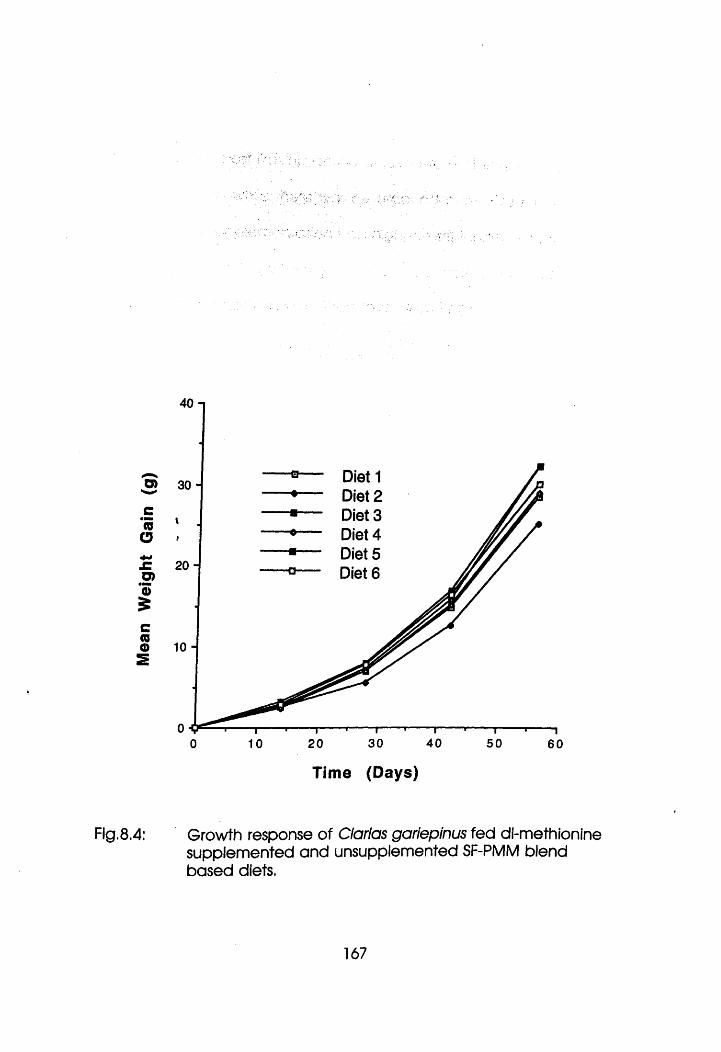
Mea
n W
eigh
t Ga
in
(g)
40
Fig.8.4:
30-
20
Diet 1 Diet 2 Diet 3 Diet 4 Diet 5 Diet 6
Time (Days)
Growth response of Clarias gariepinus fed dl-methionine supplemented and unsupplemented SF-PMM blend based diets.
167
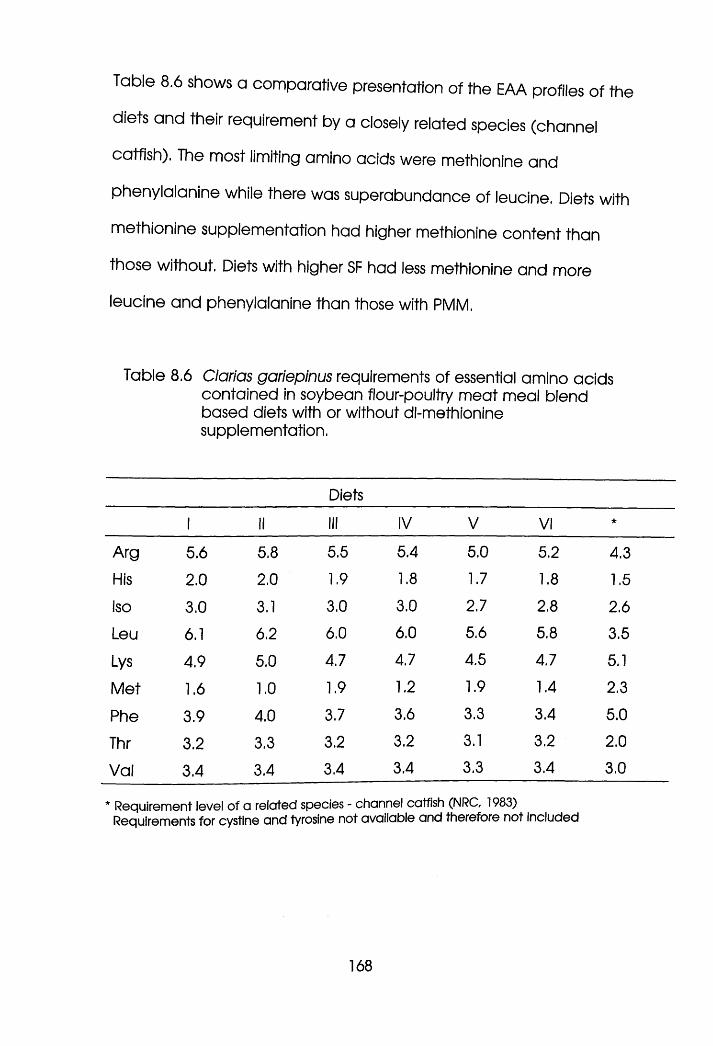
Table 8.6 shows a comparative presentation of the EAA profiles of the
diets and their requirement by a closely related species (channel
catfish). The most limiting amino acids were methionine and
phenylalanine while there was superabundance of leucine. Diets with
methionine supplementation had higher methionine content than
those without. Diets with higher SF had less methionine and more
leucine and phenylalanine than those with PMM.
Table 8.6 Clarias gariepinus requirements of essential amino acids contained in soybean flour-poultry meat meal blend based diets with or without dl-methionine supplementation.
Diets
1 II III IV V VI *
Arg 5.6 5.8 5.5 5.4 5.0 5.2 4.3His 2.0 2.0 1.9 1.8 1.7 1.8 1.5Iso 3.0 3.1 3.0 3.0 2.7 2.8 2.6
Leu 6.1 6.2 6.0 6.0 5.6 5.8 3.5
Lys 4.9 5.0 4.7 4.7 4.5 4.7 5.1
Met 1.6 1.0 1.9 1.2 1.9 1.4 2.3
Phe 3.9 4.0 3.7 3.6 3.3 3.4 5.0
Thr 3.2 3.3 3.2 3.2 3.1 3.2 2.0
Val 3.4 3.4 3.4 3.4 3.3 3.4 3.0
* Requirement level of a related species - channel catfish (NRC, 1983) Requirements for cystine and tyrosine not available and therefore not included
168
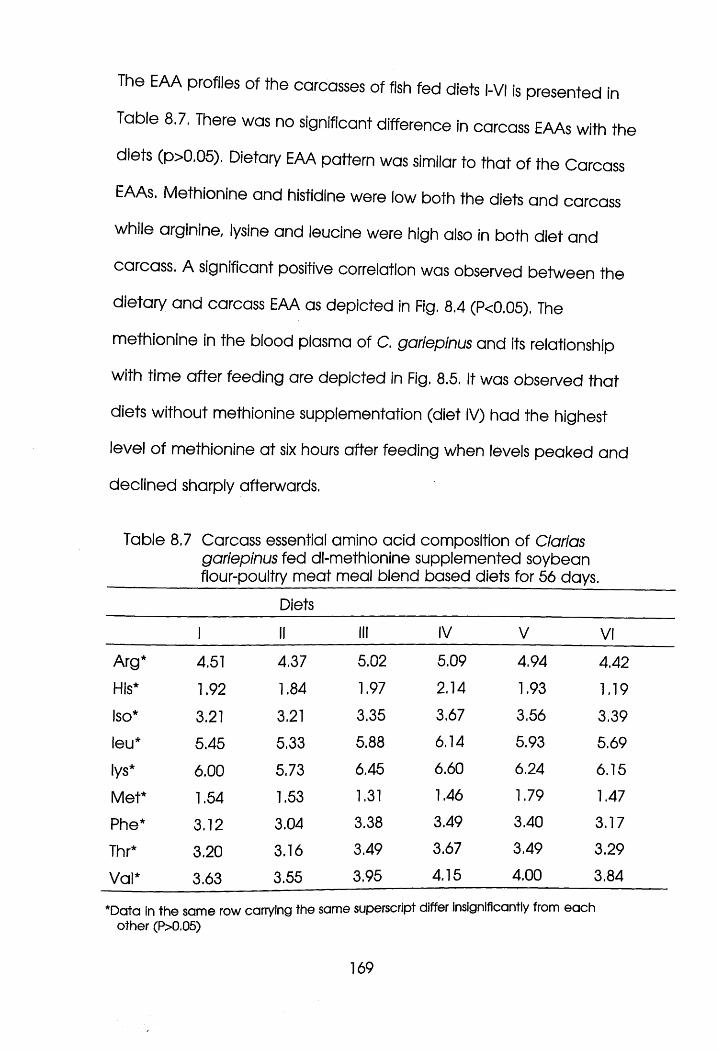
The EAA profiles of the carcasses of fish fed diets l-VI is presented in
Table 8.7. There was no significant difference in carcass EAAs with the
diets (p>0.05). Dietary EAA pattern was similar to that of the Carcass
EAAs. Methionine and histidine were low both the diets and carcass
while arginine, lysine and leucine were high also in both diet and
carcass. A significant positive correlation was observed between the
dietary and carcass EAA as depicted in Fig. 8.4 (P<0.05). The
methionine in the blood plasma of C. gariepinus and its relationship
with time after feeding are depicted in Fig. 8.5. It was observed that
diets without methionine supplementation (diet IV) had the highest
level of methionine at six hours after feeding when levels peaked and
declined sharply afterwards.
Table 8.7 Carcass essential amino acid composition of Clarias gariepinus fed dl-methionine supplemented soybean
flour-poultry meat meal blend based diets for 56 days
Diets
1 II III IV V VI
Arg* 4.51 4.37 5.02 5.09 4.94 4.42
His* 1.92 1.84 1.97 2.14 1.93 1.19
Iso* 3.21 3.21 3.35 3.67 3.56 3.39
leu* 5.45 5.33 5.88 6.14 5.93 5.69
lys* 6.00 5.73 6.45 6.60 6.24 6.15
Met* 1.54 1.53 1.31 1.46 1.79 1.47
Phe* 3.12 3.04 3.38 3.49 3.40 3.17
Thr* 3.20 3.16 3.49 3.67 3.49 3.29
Val* 3.63 3.55 3.95 4.15 4.00 3.84
*Data in the same row carrying the same superscript differ insignificantly from each other (P>0.05)
169
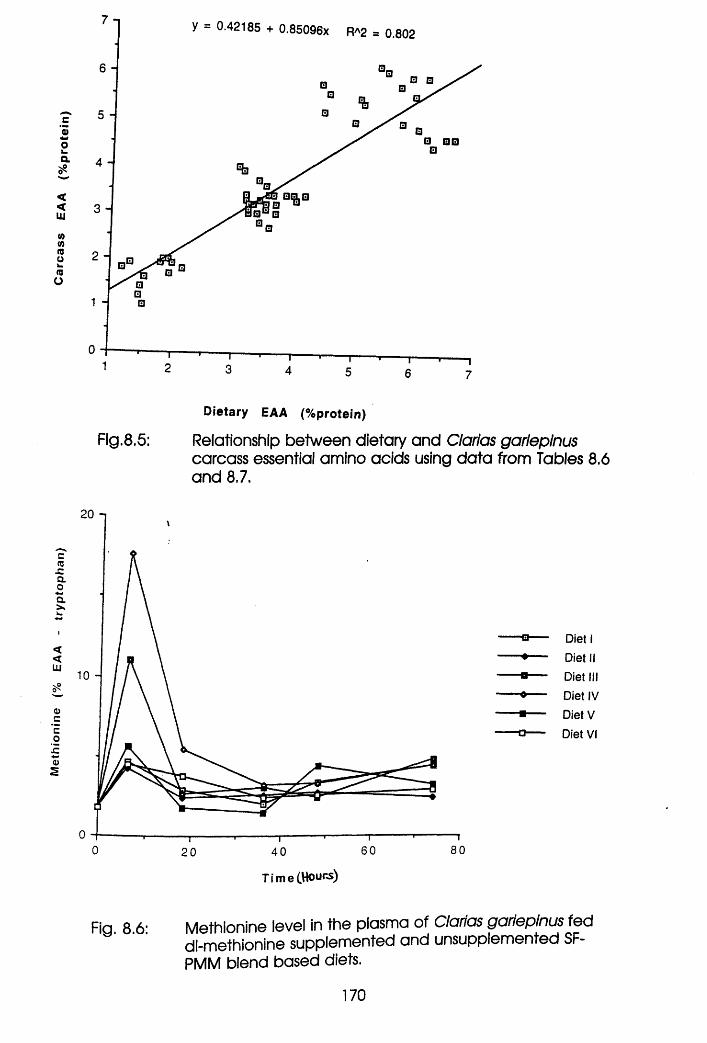
y - 0.42185 + 0.85096x R*2 = 0.802
cS+*oa
sO0s
a 0D
<<Ui
(0aov.<Qo
Dietary EAA (%protein)
Fig.8.5: Relationship between dietary and Clarias gariepinuscarcass essential amino acids using data from Tables 8,6 and 8.7.
20
c
aoak.
■
<<tUJ
0)'Eo!Ea2
800 604020
- Diet 1----- «— ■ Diet II-----a— ■ Diet III----- ■ Diet IV----- ■— ■ Diet V-----□— Diet VI
Time (Hours)
Fig. 8.6: Methionine level in the plasma of Clarias gariepinus fedcj|.methionine supplemented and unsupplemented SF- PMM blend based diets.
170
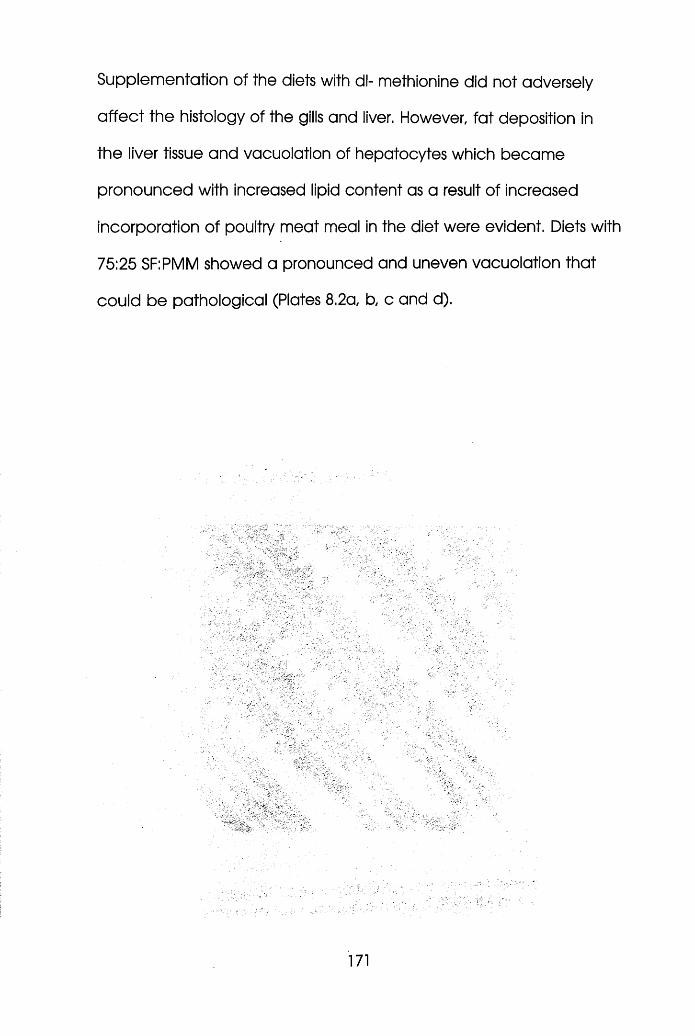
Supplementation of the diets with dl- methionine did not adversely
affect the histology of the gills and liver. However, fat deposition in
the liver tissue and vacuolation of hepatocytes which became
pronounced with increased lipid content as a result of increased
incorporation of poultry meat meal in the diet were evident. Diets with
75:25 SF:PMM showed a pronounced and uneven vacuolation that
could be pathological (Plates 8.2a, b, c and d).
171
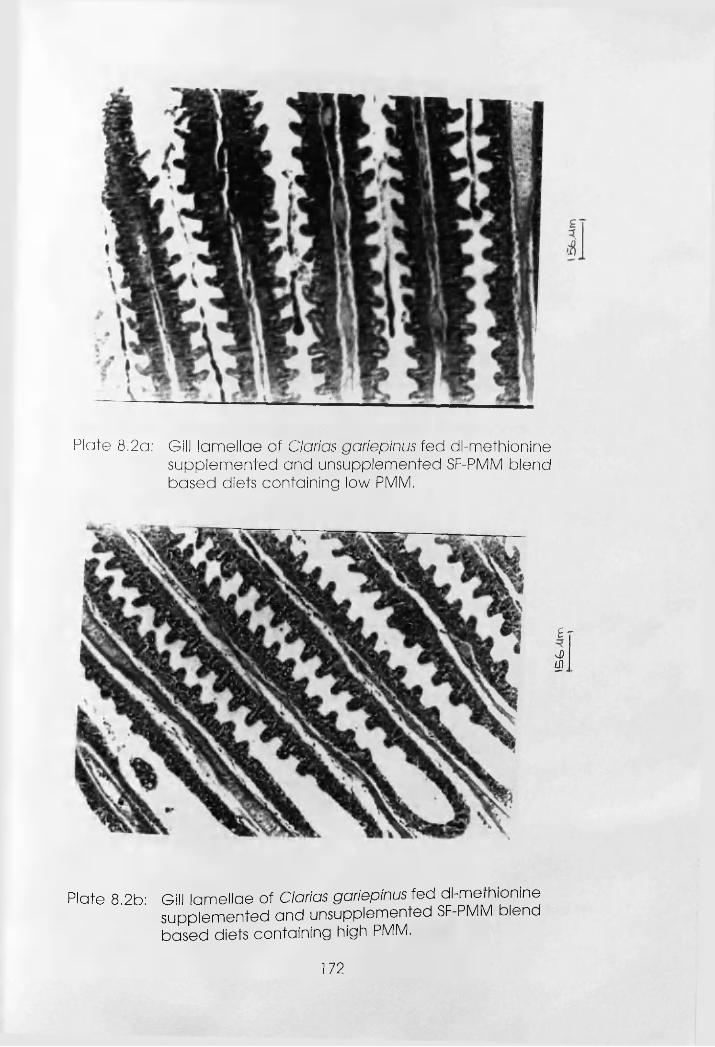
Plate 8.2a: Gill lamellae of Clarias gariepinus fed dl-methionine supplemented and unsupplemented SF-PMM blend based diets containing low PMM.
£ -<0 IS1
Plate 8.2b: Gill lamellae of Clarias gariepinus fed dl-methionine supplemented and unsupplemented SF-PMM blend based diets containing high PMM.
172
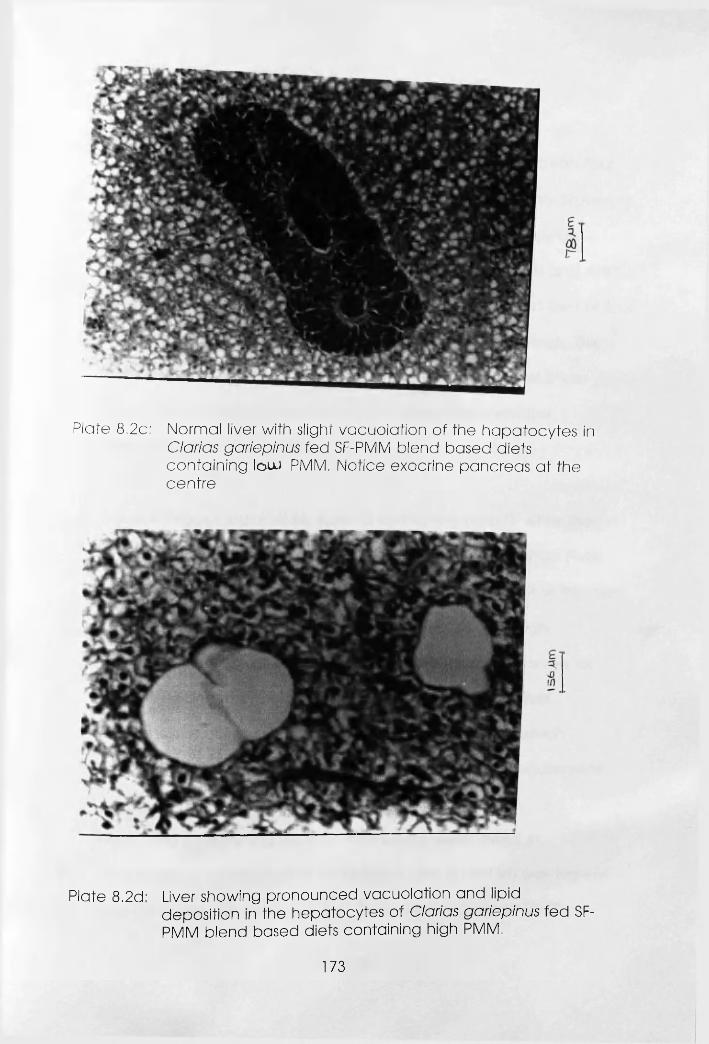
Plate 8.2c: Normal liver with slight vacuolation of the hapatocytes in Clarias gariepinus fed SF-PMM blend based diets containing lou) PMM. Notice exocrine pancreas at the centre
Plate 8.2d: Liver showing pronounced vacuolation and lipiddeposition in the hepatocytes of Clarias gariepinus fed SF- PMM blend based diets containing high PMM.
173
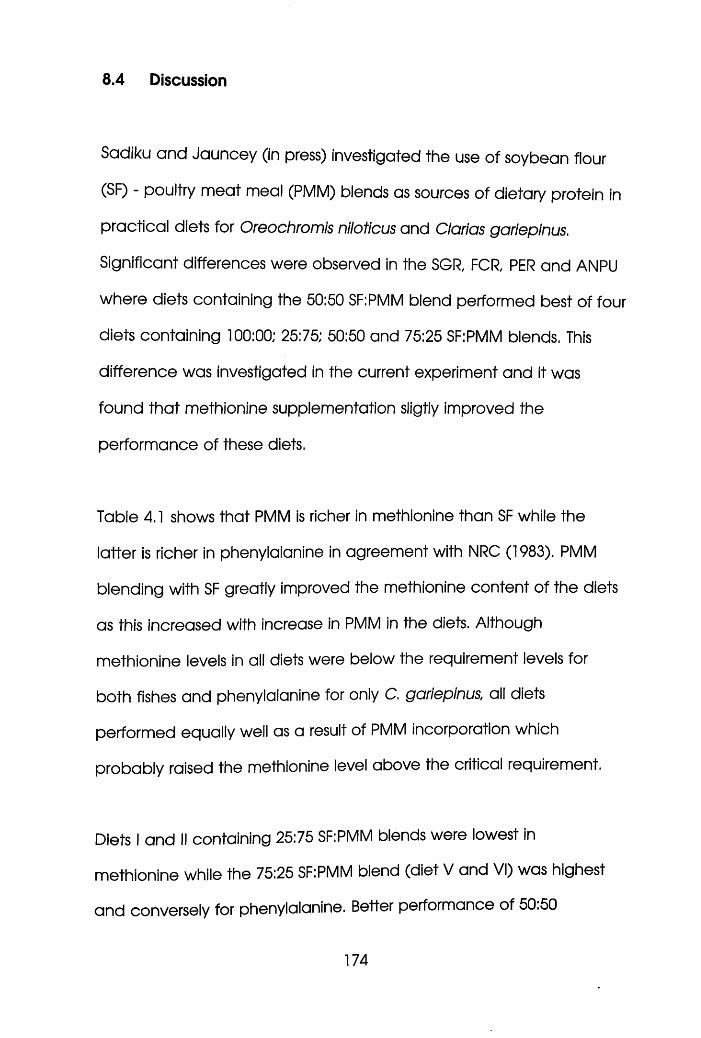
8.4 Discussion
Sadiku and Jauncey (in press) investigated the use of soybean flour
(SF) - poultry meat meal (PMM) blends as sources of dietary protein in
practical diets for Oreochromis niloticus and Clarias gariepinus.
Significant differences were observed in the SGR, FCR, PER and ANPU
where diets containing the 50:50 SF:PMM blend performed best of four
diets containing 100:00; 25:75; 50:50 and 75:25 SF:PMM blends. This
difference was investigated in the current experiment and it was
found that methionine supplementation sligtly improved the
performance of these diets.
Table 4.1 shows that PMM is richer in methionine than SF while the
latter is richer in phenylalanine in agreement with NRC (1983). PMM
blending with SF greatly improved the methionine content of the diets
as this increased with increase in PMM in the diets. Although
methionine levels in all diets were below the requirement levels for
both fishes and phenylalanine for only C. gariepinus, all diets
performed equally well as a result of PMM incorporation which
probably raised the methionine level above the critical requirement.
Diets I and II containing 25:75 SF:PMM blends were lowest in
methionine while the 75:25 SF:PMM blend (diet V and VI) was highest
and conversely for phenylalanine. Better performance of 50:50
174
SF:PMM than any other in an earlier feeding trial, the trend of which
was similarly observed in this investigation, could be attributed to
amino acid balance of the diets, Increase in PMM incorporation in the
diet raised the level of certain essential amino acids (lysine,
methionine, threonine and valine) while others decreased and a
good balance needs to be maintained.
For C. gariepinus, a good balance of methionine and phenylalanine
justifies the 50:50 blending of SF and PMM as 75:25 and 25:75 SF:PMM
aggravates methionine and phenylalanine deficiency respectively.
The phenylalanine requirement of O. niloticus was met in some of the
diets while the level in others was not critical, better performance of
50:50 SF:PMM could be attributed to overall essential amino acid
balance of the diets. Hardy (1991) observed poorer growth of salmon
fed a fish silage based diet than when fed fishmeal diet as a result of
better balance of essential amino acid in the plasma (BEAAP) of the
latter.
The lower methionine peak recorded for the latter at six hours was as
a result of premature absorption of the free amino acid in the diets
including the supplemented synthetic methionine. Premature
absorption of EAAs has been found to be related to the proportion of
peptides and free amino acids in the d ie t. In addition, premature
absorption and metabolisation of certain EAAs such as methionine ,
175
arginine, isoleucine, leucine and vaiine occurs in the first three to six
hours (Hardy, 1991). Much of the methionine in the supplemented
diets would have disappeared at six hours and beyond, thereby
giving them the lower level recorded.This trend suggested no
differential utilisation of dietary amino acids in the tissue.
The carcass EAA pattern reflected that of the diets. Tissue amino acid
patterns of a fish species have been reported to reflect dietary amino
requirements of such fish and that the rate of carcass deposition can
be equated to the dietary requirement (Jauncey, et al, 1983). Bowen
(1980) and Cowey and Tacon (1981) postulated the existence of
correlation between the pattern of EAAs in the tissue and that of the
dietary requirement. Since favourable perfomance of the fish was
observed with all the diets, EAAs levels in the diets were not critically
low where deficient.
Histologically, incorporation of poultry meat meal was detrimental to
the general well-being of both fishes. Evenly distributed fa t deposits
and vacuolated hepatocytes of fishes fed low level of PMM were
characteristic of cultured fish in intensive culture.
176
CHAPTER NINE
EFFECT OF MINERAL PREMIX RECONSTITUTION OF SOYBEAN FLOUR- POULTRY MEAT MEAL BLEND BASED DIETS IN OREOCHROMIS NILOTICUS
AND CLARIAS GARIEPINUS
1 1 1
1
9.1 Introduction
The use of mineral premixes in fish diets has become a tradition in
intensive fish feed production. The need for a premix is as a result of
insufficient supply of minerals in the diets, from feedstuffs, to meet the
mineral requirements of the fish.
These minerals are of structual and physiological importance to the
fish as; structural components of hard-tissue matrices like bone, rays,
teeth, scales and in soft tissue nutrients like protein, phospholipid,
nucleic acids and metalloproteins. They are also cofactors/activators
of enzymes, soluble minerals in osmoregulation, acid-base balance
(buffer) and in production of membrane potential (Davis and Gatlin ,
1991).
Unlike terrestial animals that rely entirly on a dietary source of minerals,
fish also derive minerals from their immediate environment. What is
included in the diet is to compensate for the negative balance of its
environmental supply of minerals and requirements. Marine fishes will
require less of a dietary source of minerals than the freshwater fishes.
Several studies have been conducted to establish appropriate
requirement levels of some of these minerals in tilapia and catfish.
NRC (1993) gave the requirements as foilows: phosphorus, 0.5%;
magnesium, 500mg/kg; zinc, 20mg/kg for O,niloticus ond phosporus,
1 7 8
0.45%; magnesium, 400mg/kg; manganese, 2.4mg/kg; zinc, 20mg/kg
for channel catfish (a related fish to C.gariepinus).
For economic considerations and nutritional variability, inclusion levels
of these minerals in diets do not always comply with requirement data
. Such data are generated from purified diets instead of practical
ones (Gatlin and Wilson, 1984). The interactions of these minerals in
fish diets with respect to their utilisation by fish have not been
accounted for in such nutrient requirements studies. Some minerals
have been found to spare each other. Dabrowska et al. (1989)
reported the sparing effect of magnesium on calcium, phosphorus
and zinc. Calcium was reported to inhibit phosphorus (Davis and
Gatlin III, 1991).
In view of these interactions, it would be necessary to investigate the
effect of the presence or absence of certain minerals in
conventionally used mineral premixes and performance of fishes fed
diets with such reconstituted premixes. This study is aimed towards
developing economically and nutritionally viable mineral premixes for
the soybean fiour-poultry meat meal blend based diets used in this
study.
1 7 9
9.2 Materials and Methods
Oreochromis niloticus (M±S.E = 3.95±0.09g) and Clarias gariepinus
(M±S.E. = 1.06±0.02g) fingerlings were stocked in duplicate (10 fish/
tank) in 50-L tanks and fed five 50:50 soybean flour(SF)-poultry meat
meal blend based diets - Diet I , Diet II (- calcium and phosphorus),
Diet III (- magnesium), Diet IV (-zinc) and Diet V (- Ca, P, Mg and Zn)
a t 6% body weight per day, thrice daily at 10:00 , 14:00 and 18:00 for
eight weeks. Fish were bulk-weighed every 2 weeks and feeding rates
adjusted accordingly.
The tanks were regularly cleaned by siphoning off wastes. Water flow
was maintained at 2L min'1 per tank and water quality parameters
were monitored fortnightly according to the methods described in
3.5.2 and recorded thus: Temperature, 26-27°C; dissolved oxygen(DO),
4.5-5.5mgL'1; pH, 5.0-6.5; NH3-N, 0.2-1 .OmgL'1; N02'-N, 0.2mgL_1; N03'-N,
20mgL'1; Ca-hardness, 36-77mgL_1 and total hardness, 44-103 mgL’1.
The formulation and proximate composition of the experimental diets
are shown in Table 9.1. 1mm pellets were prepared using a California
Pellet Mill (model CL2) equipped with a steam conditioner and
subsequently dried by convection at 60°C overnight. After cooling,
diets were packed in sealed black polythene bags and stored
(-30°C) until required.
1 8 0
Chemical analysis of feedstuffs, diets and carcass (initial and final)
was performed according to AOAC (1990) described in 3.6.1. Eight
specimens for each species were used for the initial carcass analysis
while four specimens per tank were processed for the final carcass
analysis. Calcium, magnesium and phosphorus were determined using
Atom ic Absorption Spectrophotometer (AAS) and phosphorus was
spectrophotometrically analysed according to (Allen, 1940)
Histological examination of whole fingerling trunk cross section and
those of gill, bone and liver were carried out before and after the
experiment respectively. Procedures in 3.6.2 were used for evaluating
biological parameters. Data were analysed as described in 3.7
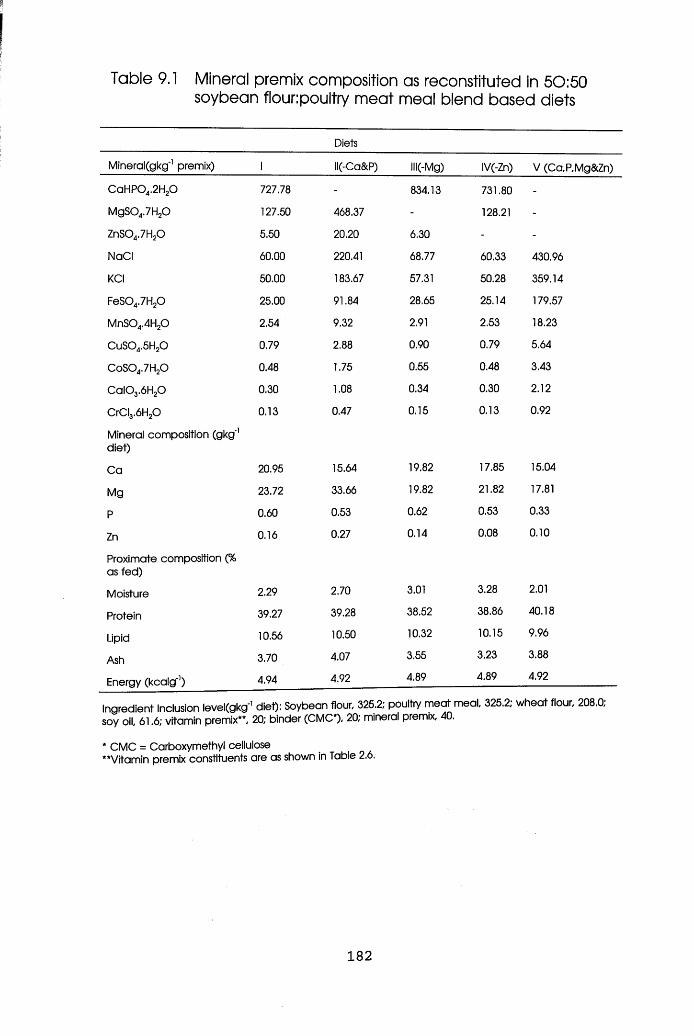
Table 9.1 Mineral premix composition as reconstituted in 50:50 soybean flour:poultry meat meal blend based diets
Diets
MineralCgkg'1 premix) 1 IlC-Ca&P) INC-Mg) IV(-Zn) V (Ca,P,Mg&Zn)
CaHP04.2H20 727.78 - 834.13 731.80 -
MgS04.7H20 127.50 468.37 - 128.21 -
ZnS04.7H20 5.50 20.20 6.30 - -
NaCI 60.00 220.41 68.77 60.33 430.96
KCI 50.00 183.67 57.31 50.28 359.14
FeS04.7H20 25.00 91.84 28.65 25.14 179.57
MnS04.4H20 2.54 9.32 2.91 2.53 18.23
CuS04.5H20 0.79 2.88 0.90 0.79 5.64
CoS04.7H20 0.48 1.75 0.55 0.48 3.43
C al03.6H20 0.30 1.08 0.34 0.30 2.12
CrCI3.6H20 0.13 0.47 0.15 0.13 0.92
Mineral composition (gkg'1 diet)
Ca 20.95 15.64 19.82 17.85 15.04
Mg 23.72 33.66 19.82 21.82 17.81
P 0.60 0.53 0.62 0.53 0.33
Zn 0.16 0.27 0.14 0.08 0.10
Proximate composition (% as fed)
Moisture 2.29 2.70 3.01 3.28 2.01
Protein 39.27 39.28 38.52 38.86 40.18
Lipid 10.56 10.50 10.32 10.15 9.96
Ash 3.70 4.07 3.55 3.23 3.88
Energy (kcalg"’) 4.94 4.92 4.89 4.89 4.92
Ingredient Inclusion leveKgkg1 diet): Soybean flour, 325.2; poultry meat meal, 325.2; wheat flour, 208.0; soy oil, 61.6; vitamin premix**, 20; binder (CMC*), 20; mineral premix, 40.
* CMC = Carboxymethyl cellulose“ Vitamin premix constituents are as shown in Table 2.6.
1 8 2
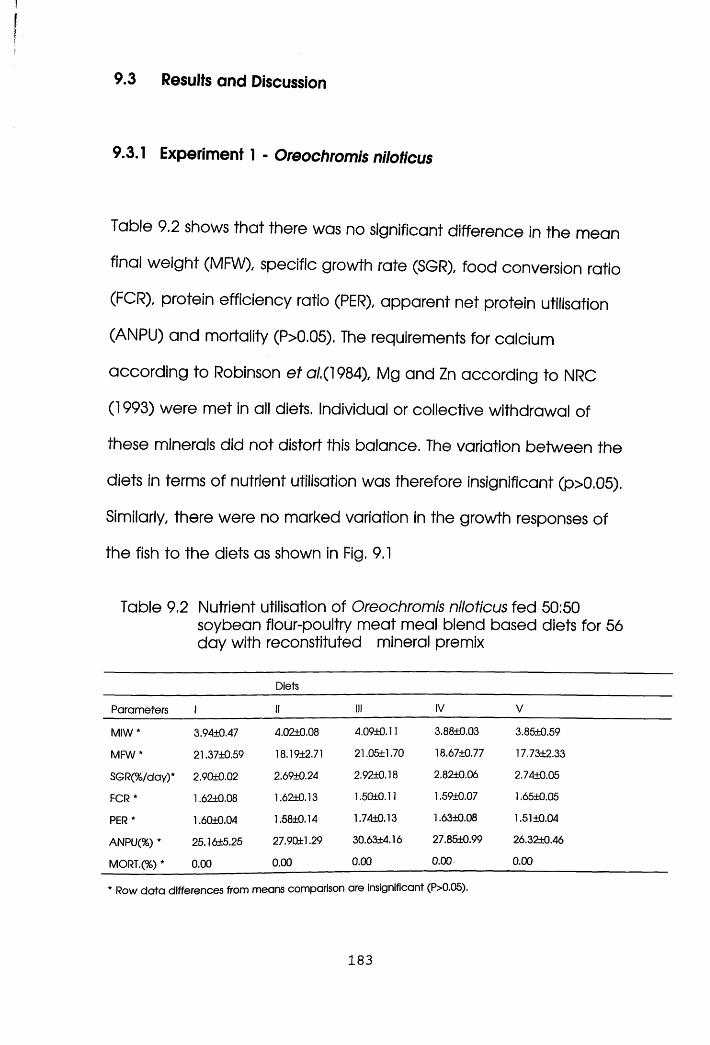
1
9.3 Results and Discussion
9.3.1 Experiment 1 - Oreochromis niloticus
Table 9.2 shows that there was no significant difference in the mean
final weight (MFW), specific growth rate (SGR), food conversion ratio
(FCR), protein efficiency ratio (PER), apparent net protein utilisation
(ANPU) and mortality (P>0.05). The requirements for calcium
according to Robinson e ta l.(1984), Mg and Zn according to NRC
(1993) were met in all diets. Individual or collective withdrawal of
these minerals did not distort this balance. The variation between the
diets in terms of nutrient utilisation was therefore insignificant (p>0.05).
Similarly, there were no marked variation in the growth responses of
the fish to the diets as shown in Fig. 9.1
Table 9.2 Nutrient utilisation of Oreochromis niloticus fed 50:50soybean flour-poultry meat meal blend based diets for 56 day with reconstituted mineral premix
Diets
Parameters 1 II III IV V
MIW * 3.94+0.47 4.02±0.08 4.09±0.11 3.88±0.03 3.85±0.59
MFW* 21.37±0.59 18.19±2.71 21.05±1.70 18.67±0.77 17.73+2.33
SGR(%/day)* 2.90±0.02 2.69±0.24 2.92+0.18 2.82±0.06 2.74±0.05
FCR* 1,62±0.08 1.62±0.13 1.50±0.11 1.59±0.07 1.65±0.05
PER * 1.60±0.04 1.58±0.14 1.74+0.13 1.63±0.08 1.51+0.04
ANPU(%) * 25.16±5.25 27.9Gtfcl.29 30.63±4.16 27.85±0.99 26.32±0.46
MORT.(%) * 0.00 0.00 0.00 0.00 0.00
* Row data differences from means comparison are insignificant (P>0.05).
1 8 3
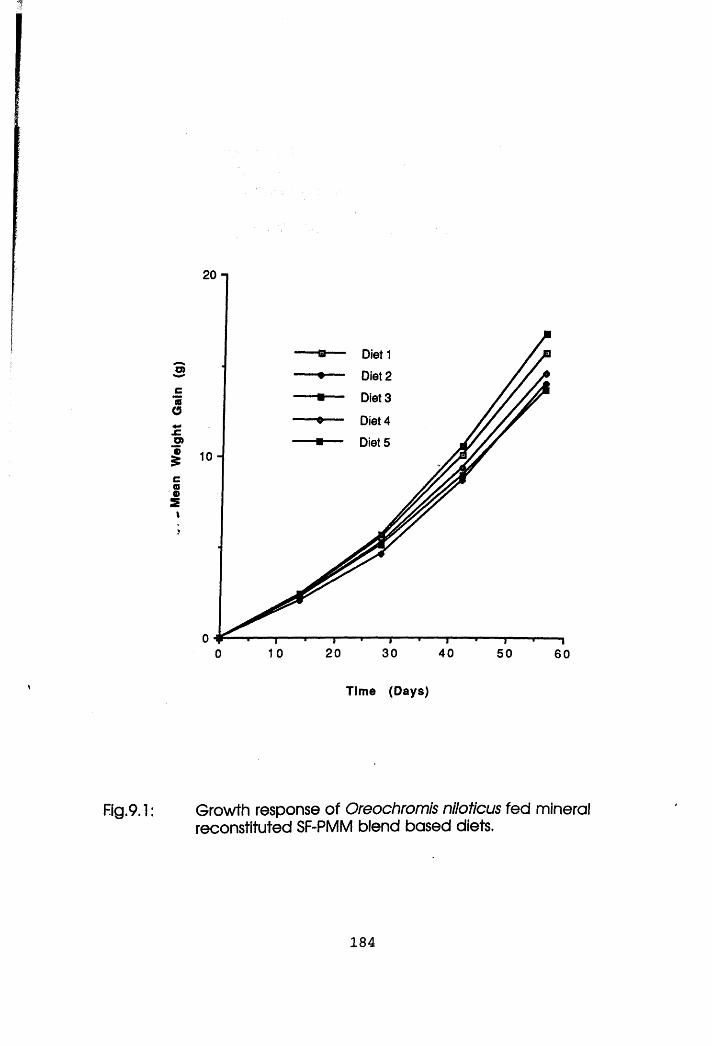
Diet 1
Diet 2
Diet 3e«O
Diet 4
Diet 5o>1 io-cffio2 »
20 301 0 40 500 60
Time (Days)
Fig.9.1: Growth response of Oreochromis niloticus fed mineralreconstituted SF-PMM blend based diets.
1 8 4
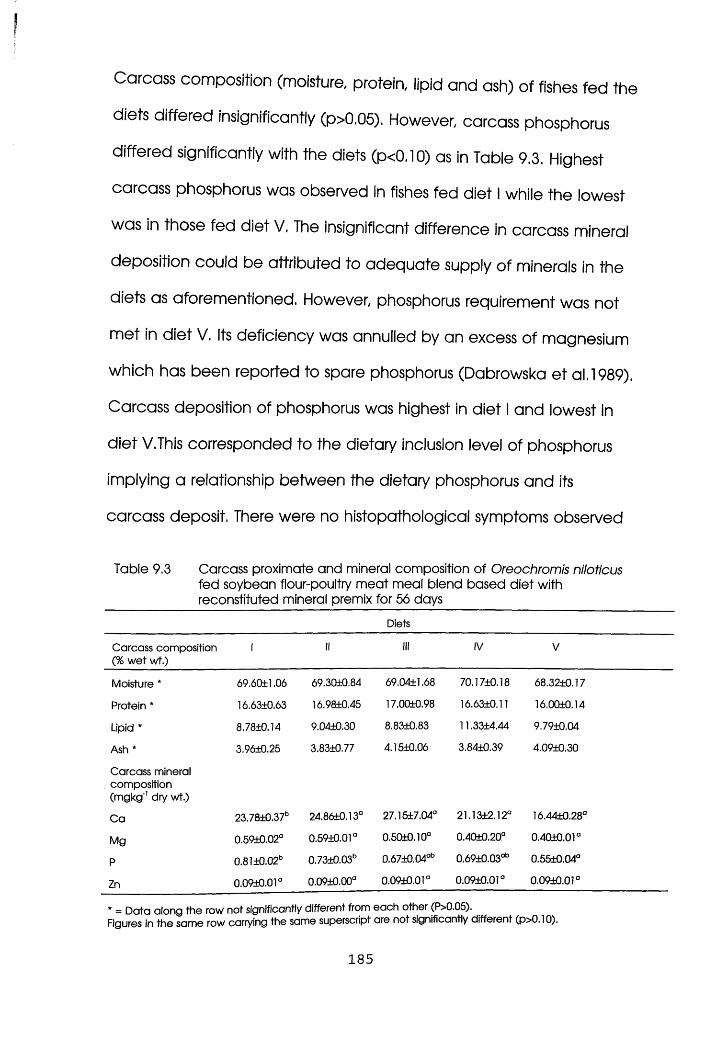
I
Carcass composition (moisture, protein, lipid and ash) of fishes fed the
diets differed insignificantly (p>0.05). However, carcass phosphorus
differed significantly with the diets (p<0.10) as in Table 9.3. Highest
carcass phosphorus was observed in fishes fed diet I while the lowest
was in those fed diet V. The insignificant difference in carcass mineral
deposition could be attributed to adequate supply of minerals in the
diets as aforementioned. However, phosphorus requirement was not
met in diet V. Its deficiency was annulled by an excess of magnesium
which has been reported to spare phosphorus (Dabrowska et al.1989).
Carcass deposition of phosphorus was highest in diet I and lowest in
diet V.This corresponded to the dietary inclusion level of phosphorus
implying a relationship between the dietary phosphorus and its
carcass deposit. There were no histopathological symptoms observed
Table 9.3 Carcass proximate and mineral composition of Oreochromis niloticus fed soybean flour-poultry meat meal blend based diet with reconstituted mineral premix for 56 days
Diets
Carcass composition (% wet wf.)
1 II III IV V
Moisture * 69.6Q±1.06 69.30±0.84 69.04±1.68 70.17±0.18 68.32±0.17
Protein * 16.63+0.63 16.98+0.45 17.0Q±0.98 16.63±0.11 16.0Q±0.14
Lipid * 8.78+0.14 9.04±0.30 8.83+0.83 11.33±4.44 9.79+0.04
Ash * 3,96±0.25 3.83±0.77 4.15+0.06 3.84±0.39 4.09±0.30
Carcass mineral . composition
(mgkg'1 dry wt.)
Ca 23.78±0.37b 24.86±0.13a 27.15+7.04° 21.13±2.12° 16.44±0.28°
Mg 0.59±0.02a 0.59+0.01a 0.50±0.10° 0.40±0.20° 0.40±0.01°
P 0.81±0.02b 0.73±0.03b 0.67±0.04ab 0,69±0.03ab 0.55±0.04°
Zn 0.09±0.01a 0.09±0.00a 0.09±0.01° 0.09±0.01° 0.09±0.01a
* = Data along the row not significantly different from each other (P>0.05).Figures in the same row carrying the same superscript are not significantly different (p>0.10).
185
Fig. 9.2 shows a positve strong correlation between dietary
phosphorus and carcass phosphorus (pcO.05), as increase in dietary
phosphorus led to an increase in carcass phosphorus. This correlation
was not significant in other minerals. The strong positive correlation
between dietary phosphorus and its carcass deposition indicated that
there was increase in the carcass deposition of phosphorus with its
increase in the diets. This trend was observed to correspond to
increase in dietary magnesium which did not increase proportionately
in the carcass suggesting a preferential utilisation of magnesium to
meet other physiological demands to spare phosphorus for its
mobilisation towards tissue formation (Davis and Gatlin, 1991).
1 8 6
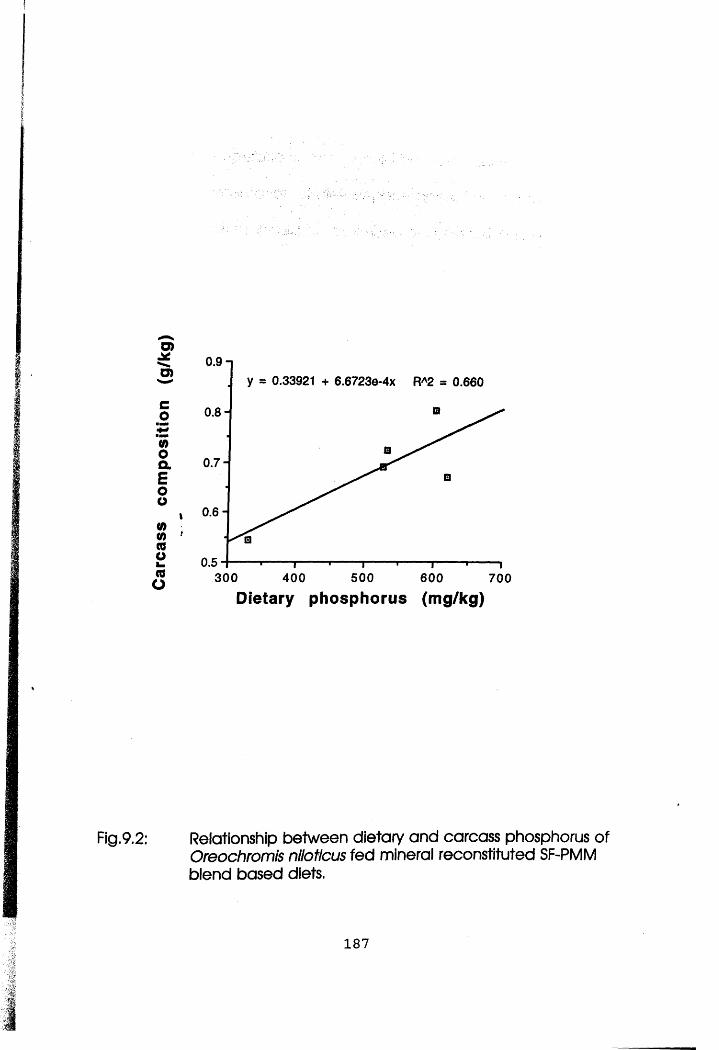
Car
cass
co
mpo
sitio
n (g
/kg
)
Fig.9.2:
0.9 -iy = 0.33921 + 6.6723e-4x RA2 = 0.660
0.8 -
0.7-
0.6 -i?
0.5300 500400 600 700
Dietary phosphorus (m g/kg)
Relationship between dietary and carcass phosphorus of Oreochromis niloticus fed mineral reconstituted SF-PMM blend based diets.
1 8 7
Table 8.1 shows that phosphorus was in excess in all the diets except
diet V. In view of the environmental impact of phosphorus in
aquaculture operations, care should be taken against
oversuppplementation of dietary phosphorus. Phosphorus dietary
supplementation should be minimised and this will in turn reduce feed
cost (Davis and Gatlin, 1991). In diets of O.niloticus as in this
experiment, it has been observed that phosphorus supplementation in
a mineral premix with adequate magnesium may not be necessary as
magnesium spares phosphorus. Magnesium level in such premix could
be increased in the diets to spare phosphorus. This suggests
undersupplementation of phosphorus in a diet with high level of
magnesium to make a low pollution diet.
Histological examination of the fish showed no differences in spinal
cord, kidney and liver; No difference in the level of ossification of the
vertebral column; the interstitial lymphoid tissues of the kidney were
normal for tilapia species and exocrine pancreas combined with
some fat deposits were observed and these are not uncommon with
fishes in intensive culture (Plates 9.1a, b, and c respectively).
1 8 8
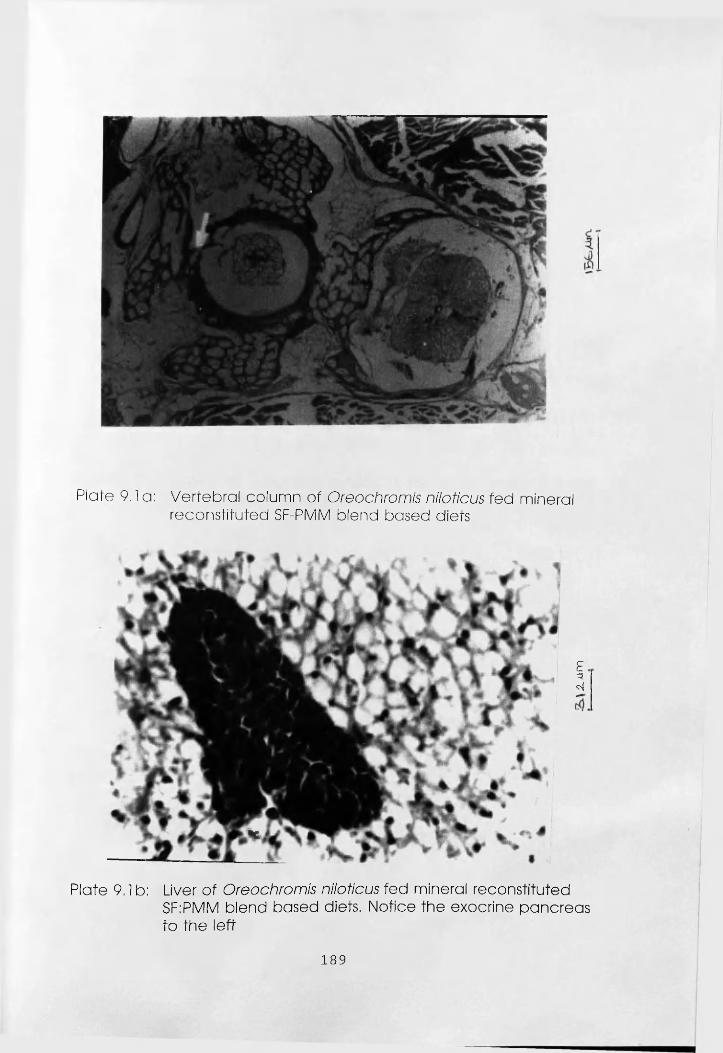
Plate 9.1 a: Vertebral column of Oreochromis niloticus fed mineral reconstituted SF-PMM blend based diets
*
Plate 9.1 b: Liver of Oreochromis niloticus fed mineral reconstitutedSF:PMM blend based diets. Notice the exocrine pancreas to the left
189
2. a
m
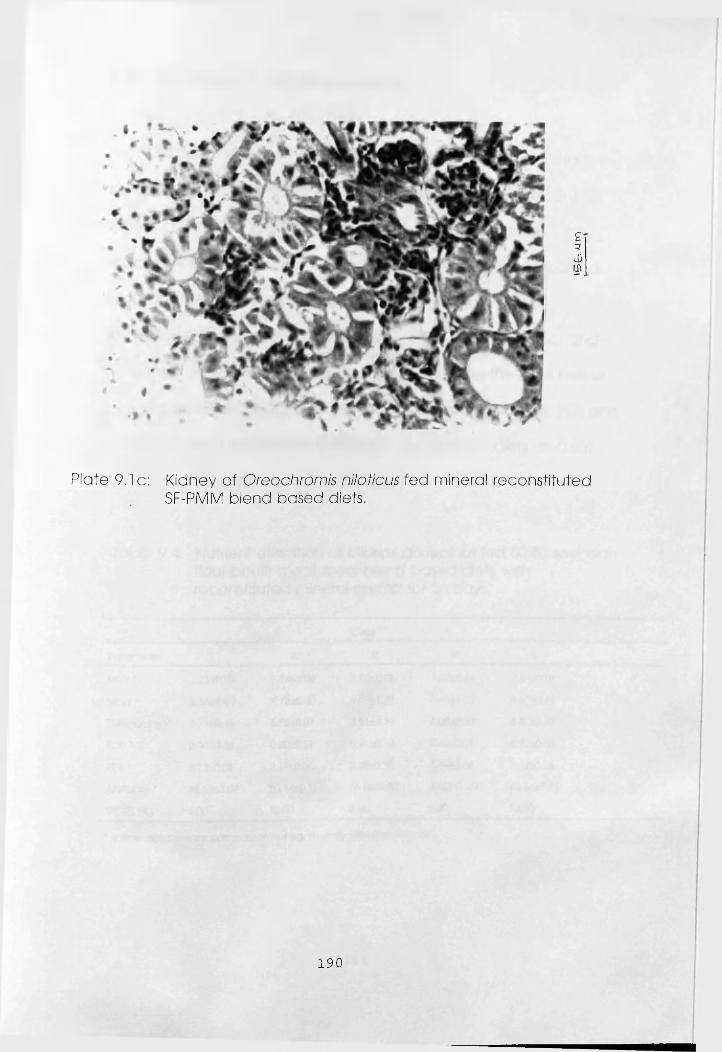
Plate 9.1c: Kidney of Oreochromis niloticus fed mineral reconstituted SF-PMM blend based diets.
190
'teC
.-U
ro
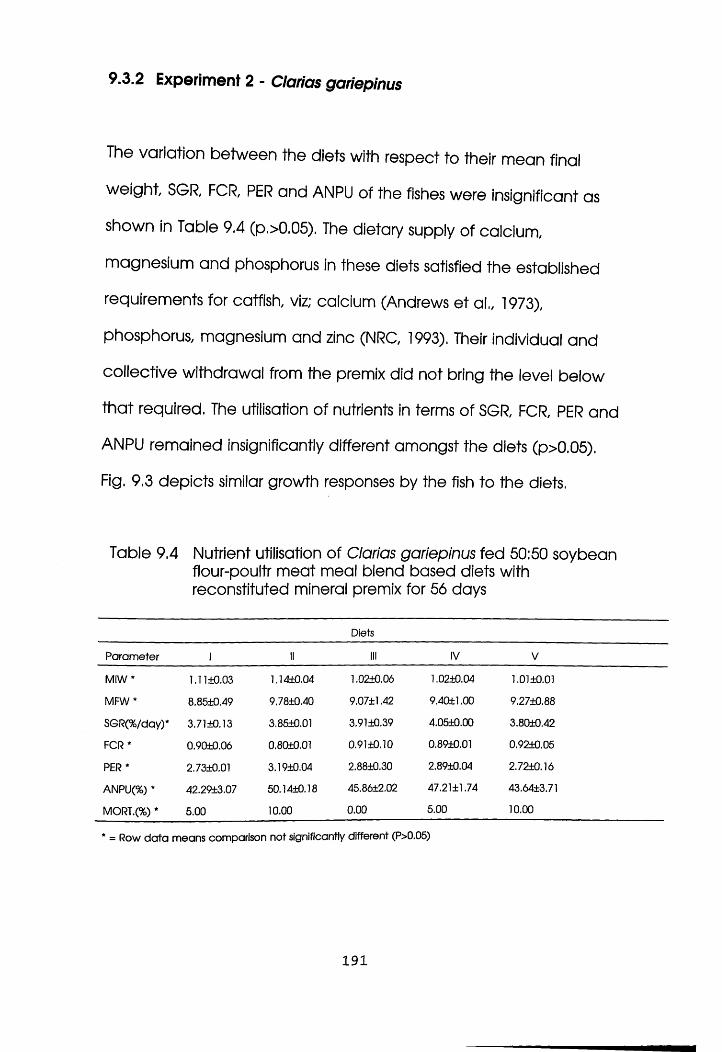
9.3.2 Experiment 2 - Clarias gariepinus
The variation between the diets with respect to their mean final
weight, SGR, FCR, PER and ANPU of the fishes were insignificant as
shown in Table 9.4 (p.>0.05). The dietary supply of calcium,
magnesium and phosphorus in these diets satisfied the established
requirements for catfish, viz; calcium (Andrews et al., 1973),
phosphorus, magnesium and zinc (NRC, 1993). Their individual and
collective withdrawal from the premix did not bring the level below
that required. The utilisation of nutrients in terms of SGR, FCR, PER and
ANPU remained insignificantly different amongst the diets (p>0.05).
Fig. 9.3 depicts similar growth responses by the fish to the diets.
Table 9.4 Nutrient utilisation of Clarias gariepinus fed 50:50 soybean flour-poultr meat meal blend based diets with reconstituted mineral premix for 56 days
Diets
Parameter 1 II III IV V
MIW * 1.11±0.03 1.14+0.04 1.02±0.06 1,02±0.04 1.01±0.01
MFW * 8.85±0.49 9.78±0.40 9.07±1.42 9.40±1.00 9.2 7±0.88
SGR(%/day)* 3.71±0.13 3.85±0.01 3.91±0.39 4.05+0.00 3.80±0.42
FCR* 0.90±0.06 0.80±0.01 0.91±0.10 Q.89±0.01 0.92±0.05
PER* 2.73±0.01 3.19±0.04 2.88+0.30 2.89±0.04 2.72±0.16
ANPU(%) * 42.29±3.07 50.14±0.18 45.86±2.02 47.21 ±1.74 43.64±3.71
MORT.(%) * 5.00 10.00 0.00 5.00 10.00
* = Row data means comparison not significantly different (P>0.05)
1 9 1
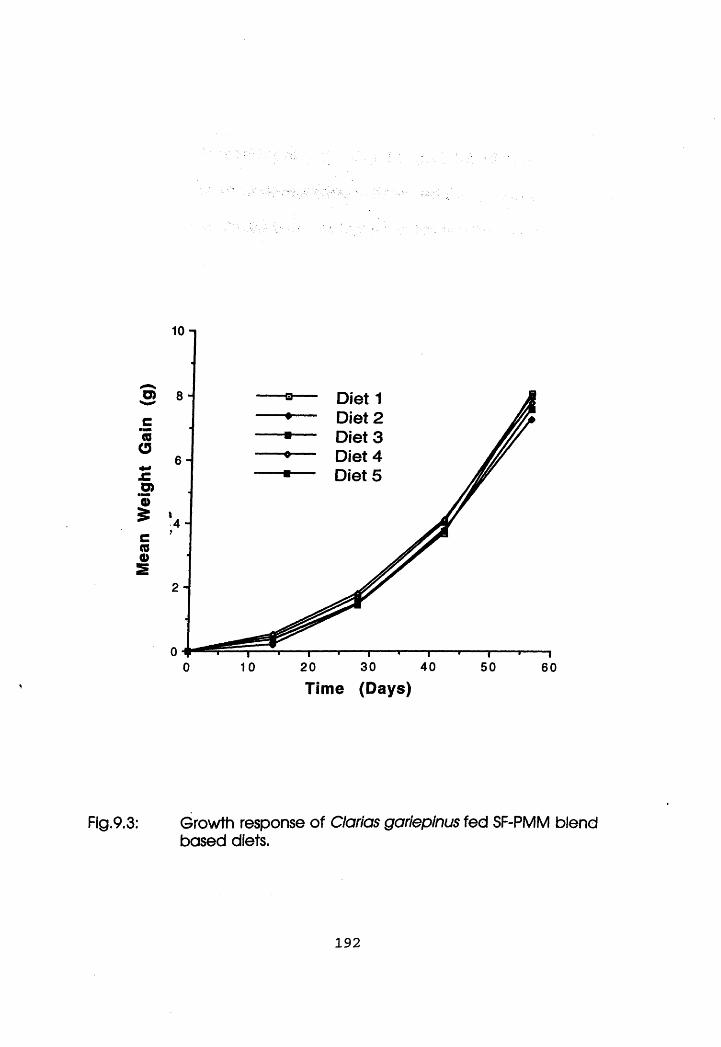
Mea
n W
eigh
t Ga
in
(g)
DietDietDietDietDiet
2 -
30 4010 20 500 60Time (Days)
Fig.9.3: Growth response of Clarias gariepinus fed SF-PMM blendbased diets.
1 9 2
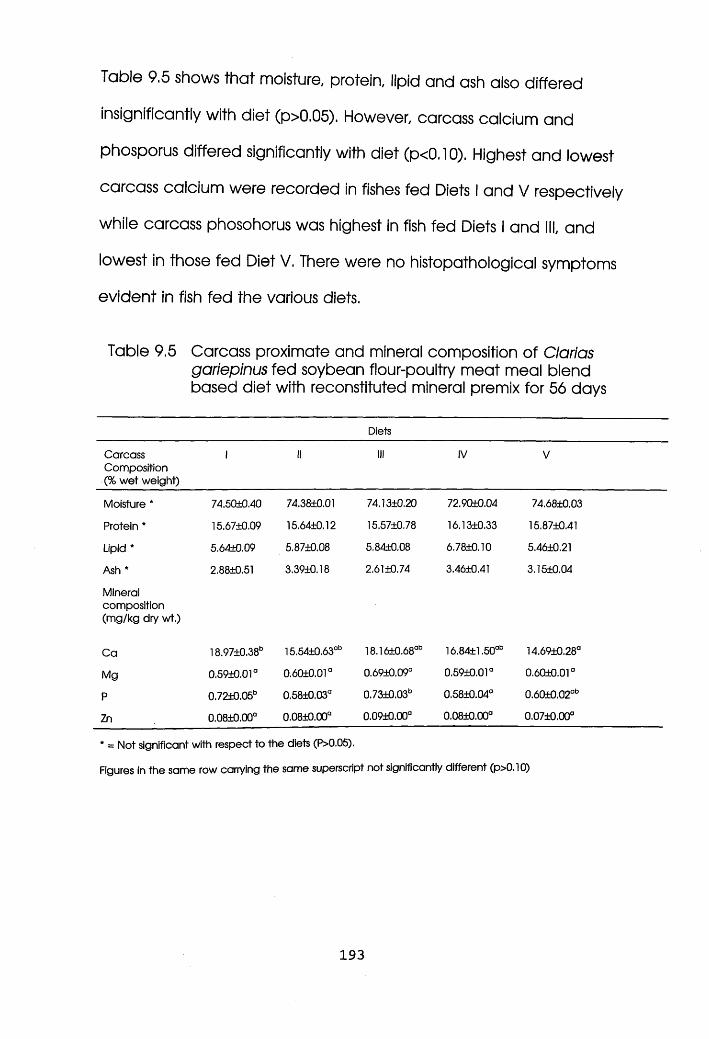
Table 9.5 shows that moisture, protein, lipid and ash also differed
insignificantly with diet (p>0.05). However, carcass calcium and
phosporus differed significantly with diet (p<0.10). Highest and lowest
carcass calcium were recorded in fishes fed Diets I and V respectively
while carcass phosohorus was highest in fish fed Diets I and III, and
lowest in those fed Diet V. There were no histopathological symptoms
evident in fish fed the various diets.
Table 9.5 Carcass proximate and mineral composition of Clarias gariepinus fed soybean flour-poultry meat meal blend based diet with reconstituted mineral premix for 56 days
Diets
Carcass Composition (% wet weight)
1 II III IV V
Moisture * 74.50±0.40 74.3810.01 74.13±0.20 72.9010.04 74.6810.03
Protein * 15.67±0,09 15.64±0.12 15.57±0.78 16.1310.33 15.8710.41
Lipid * 5.64±0.09 5.87±0.08 5.84±0.08 6.7810.10 5.4610.21
Ash *
Mineral composition (mg/kg dry wt.)
2.88±0.51 3.39±0.18 2.61±0.74 3.4610.41 3.1510.04
Ca 18.97±0.38b 15.54±0.63ab 18.16+0.68ab 16.8411.50°b 14.6910.28°
Mg 0.59±0.01a 0.60±0.01 ° 0.6910.09° 0.5910.01° 0.6010.01°
P 0.72±0.05b 0.58±0.03° 0.73±0.03b 0.5810.04° 0.60i0.02ab
Zn 0.08+0.00° 0.08±0.00° 0.0910.00° 0.0810.00° 0.0710.00°
* = Not significant with respect to the diets (P>0.05).
Figures in the same row carrying the same superscript not significantly different (p>0.10)
1 9 3
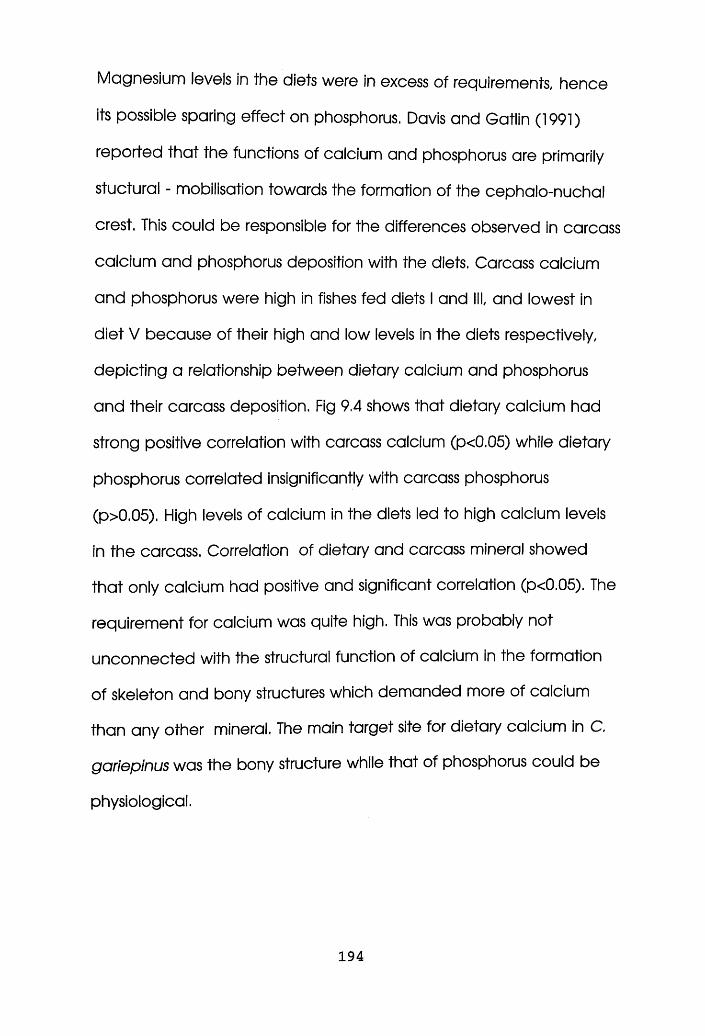
Magnesium levels in the diets were in excess of requirements, hence
its possible sparing effect on phosphorus. Davis and Gatlin (1991)
reported that the functions of calcium and phosphorus are primarily
stuctural - mobilisation towards the formation of the cephalo-nuchal
crest. This could be responsible for the differences observed in carcass
calcium and phosphorus deposition with the diets. Carcass calcium
and phosphorus were high in fishes fed diets I and III, and lowest in
diet V because of their high and low levels in the diets respectively,
depicting a relationship between dietary calcium and phosphorus
and their carcass deposition. Fig 9.4 shows that dietary calcium had
strong positive correlation with carcass calcium (p<0.05) while dietary
phosphorus correlated insignificantly with carcass phosphorus
(p>0.05). High levels of calcium in the diets led to high calcium levels
in the carcass. Correlation of dietary and carcass mineral showed
that only calcium had positive and significant correlation (p<0.05). The
requirement for calcium was quite high. This was probably not
unconnected with the structural function of calcium in the formation
of skeleton and bony structures which demanded more of calcium
than any other mineral. The main target site for dietary calcium in C.
gariepinus was the bony structure while that of phosphorus could be
physiological.
1 9 4
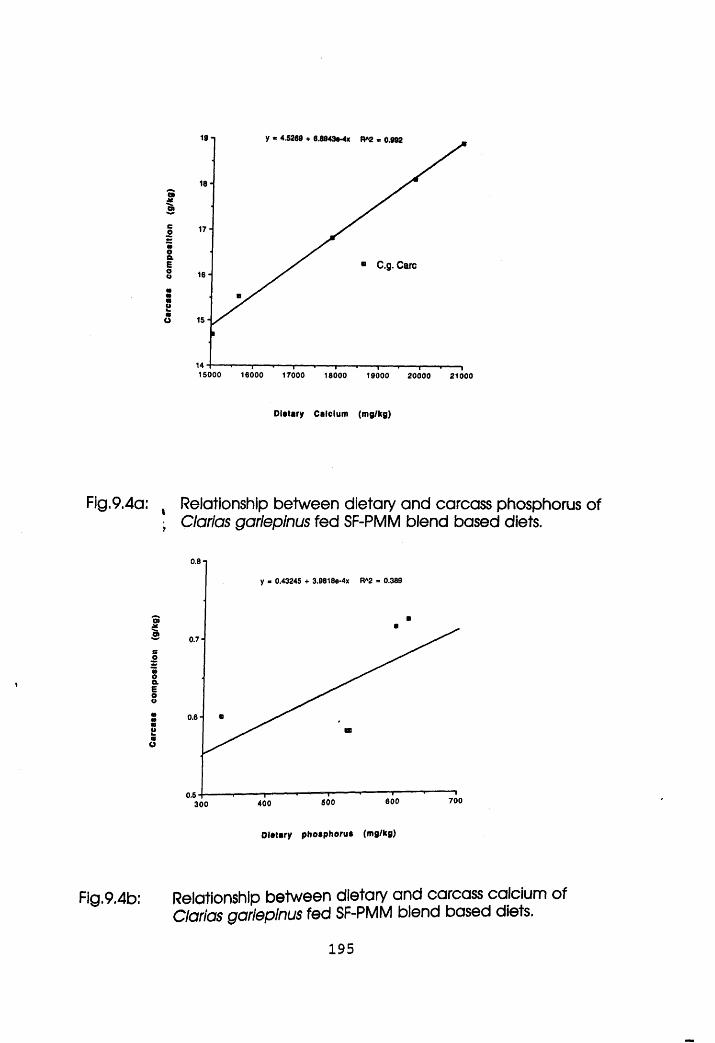
19 T y * 4.5269 + 6.8943o-4x R* 2 B 0.992
18-aweo 17-
moaEoo
■ C.g. Caro16-
m«•ok•o 15-
15000 16000 17000 18000 19000 20000 21000
Dietary Calcium (mg/kg)
Fig.9.4a: x Relationship between dietary and carcass phosphorus of , Clarias gariepinus fed SF-PMM blend based diets.
0.8
y - 0.43245 + 3.9818e-4x R*2 = 0.389
aI 0.7-eo
«oaEoo
0.6 -w■eaO
0.5700800500400300
Dietary phoephorue (mg/kg)
Fig.9.4b: Relationship between dietary and carcass calcium ofClarias gariepinus fed SF-PMM blend based diets.
195
The magnesium sparing effect on phosphorus might not be dominant
over the inhibitory effect of calcium on phosphorus as
supplementation of calcium in the basal diet appeared to inhibit
phosphorus bioavailability (Davis, 1990). It was evident that calcium
and phosphorus supplementation would be necessary in catfish diets.
The vertebral column, liver and kidney did not show any
histopathological symptom. Reconstitution of minerals in the diets did
not create any marked difference in vertebral column development.
Liver tissue showed the exocrine pancreas and a few fat deposit in
the hepatocytes, this was normal with farmed fishes. Well developed
interstitial lymphoid tissue were observed in the Kidney (Plates 9.2a, b
and c)
1 9 6
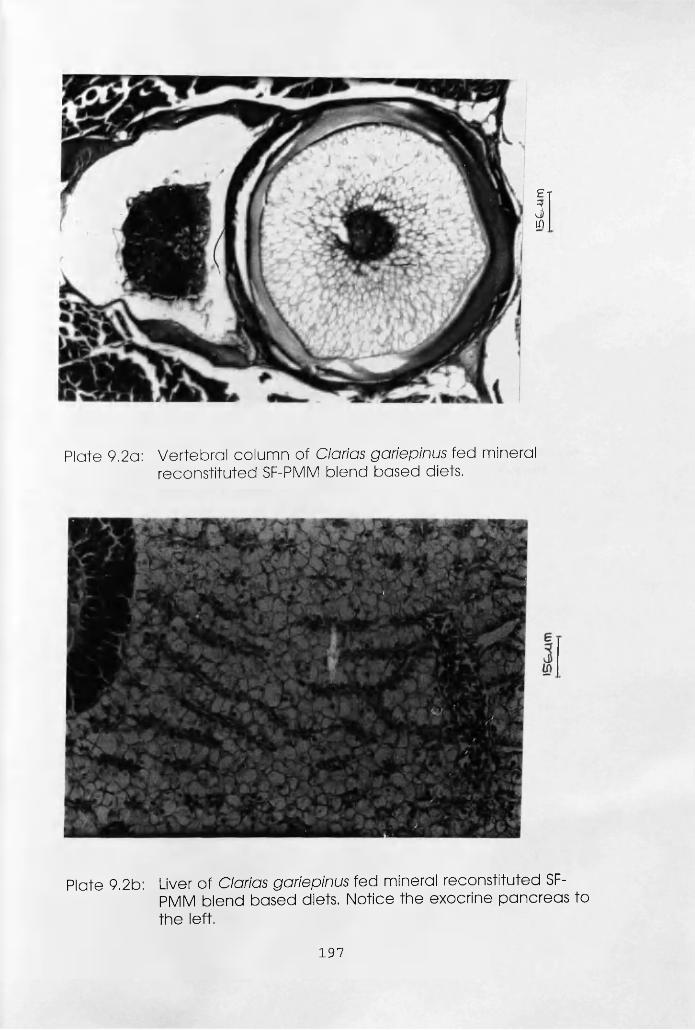
E T3U)
Plate 9.2a: Vertebral column of Clarias gariepinus fed mineral reconstituted SF-PMM blend based diets.
Plate 9.2b: Liver of Clarias gariepinus fed mineral reconstituted SF-PMM blend based diets. Notice the exocrine pancreas to the left.
197
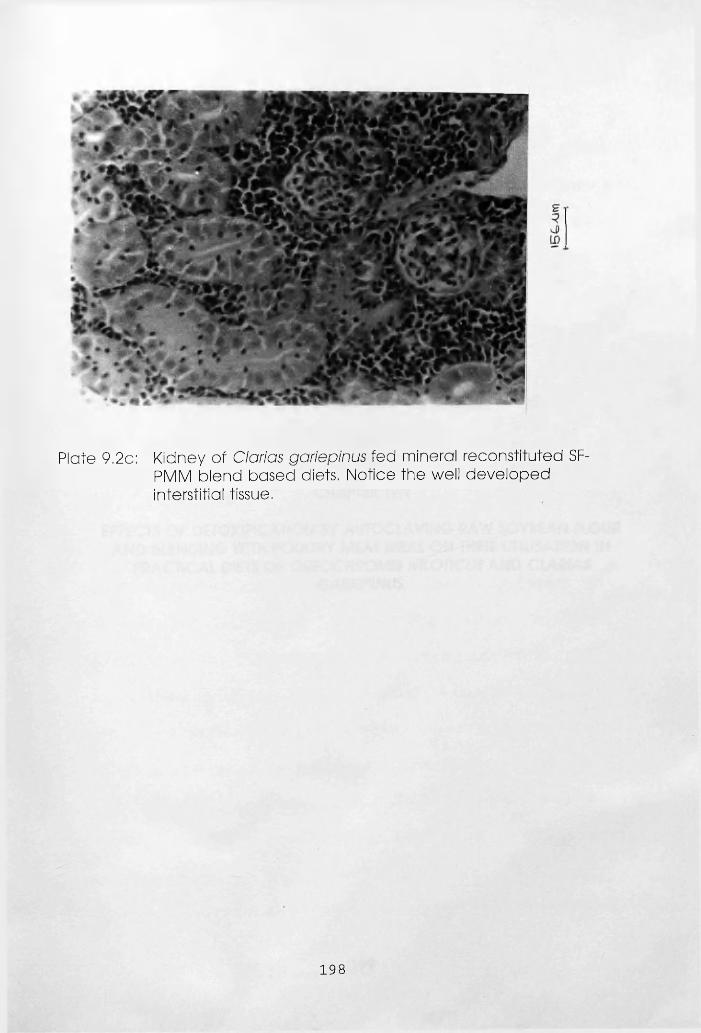
Plate 9.2c: Kidney of Clorios gariepinus fed mineral reconstituted SF- PMM blend based diets. Notice the well developed interstitial tissue.
198
1
. v - ■
>vjt- - ' )*' >' • p . ' \ , ’r ' . .•
CHAPTER TEN
EFFECTS OF DETOXIFICATION BY AUTOCLAVING RAW SOYBEAN FLOUR AND BLENDING WITH POULTRY MEAT MEAL ON THEIR UTILISATION IN
PRACTICAL DIETS OF OREOCHROMIS NILOTICUS AND CLARIASGARIEPINUS.
. i
199
10.1 Introduction
With respect to economics, availability and nutritional value, soybean
meal appears to be the most promising vegetable protein source for
animal feeds but not without its inherent flaws (Lim, 1992). Notable
among these are its relative inefficiency as recovery energy source for
tissue growth and repair, and gonadal development when
incorporated a t high level in fish diets. These have been attributed to
nutrient deficiency and imbalance such as minerals and amino-acids,
presence of anti-nutritional factors (ANFs) and toxic substances in
plant feedstuffs, diet stability in water and palatability (Lim and
Dominy, 1991).
Natural nutrient sources incorporated to provide the deficient nutrient
a t the right time has been suggested. Some lower cost animal
proteins - than fish meal, are higher in methionine than soybean are
lower in the ANFs. These are poultry by-product meal, blood meal,
shrimp meal, meat meal, crab meal, gelatin, e.t.c. (NRC, 1983).
Processing of raw plant protein to remove ANFs and toxic substances
would also be beneficial and it has become area of focus of
aquaculture nutrition (Chamberlain, 1993). Processing of raw plant
feedstuffs like soaking in water, drying, heating etc. have been found
capable of reducing the ANFs. Heat treatment is an effective way of
removing most of the ANFs (Tacon, 1982; Lovell, 1990). Feedding heat
200
treated soybean meal to channel catfish diet improved its growth
response (Wilson and Poe, 1985). Processing of SF through processing
and nutrient enrichment by the incorporation of natural nutrient
sources has been proposed as possible remedies to the flaws
associated with SF utilisation in aquaculture feeds. Results from such
experimental evaluation have recorded relative successes.
There is also paucity of information on the use raw SF blended with
PMM and autoclaved SF blended with PMM in aquaculture feeds. The
aim of this investigation is therefore, to evaluate the effects of such
processing and nuitrient enrichment on diet utilisation by O.niloticus
and C.goriepinus.
201
10.2 Materials and Methods
i Experimental fish, fish husbandry and fish diets
Eight isocaloric (4.2 kcalg'1) and isonitrogenous (38%) diets - Diets l-VIII
25:75; 50:50; 75:25; 100:00 soybean flour - poultry meat meal blends,
using raw and autoclaved soybean flour were fed to fingerlings of
Oreochromis niloticus (M±S.E. = 2.78±0.03) and Clarias gariepinus
(M±S.E = 14.73±0.13g) a t 4% body weight per day a t 10:00 and 18:00
for eight weeks in two seperate experiments - Experiments 1 and 2
respectively. Fishes were bulk-weighed every 2 weeks and feeding
rates adjusted accordingly.
Defatted, dehulled and raw soybean flour (Type I) was obtained from
Sigma Chemical Co. ltd, U.S.A. Half of this was autoclaved a t 121°C
a t 15 psi for 20 minutes. Table 10.1 depicts the varying levels of anti-
nutritional factors (trypsin inhibitor and phytic acid) and available
lysine in raw and autoclaved soybean flour used in both experiments.
High quality poultry meat meal was supplied by Chettles UK ltd,
Nottingham. The formulation and proximate composition of the diets
are shown in Table 10.2. 2mm pellets were prepared using a California
Pellet Mill (model CL2) equipped with a steam conditioner while diets
containing raw soybean were pelleted using Hobart A200 Mixer to
prevent the heat effect of steam conditioning. Diets were
202
subsequently dried by convection a t 40°C overnight and packed in
sealed black plastic bags and stored (-30°C) until required.
ii Experimental system
A 2 X 4 factorial design using twenty-four 50L tanks was adopted for
each experiment. Fingerlings were stocked at 15 fish per tank in
triplicate per treatment. The tanks were regularly cleaned by
siphoning off accumulated waste. Water flow was maintained a t 2L
min'1 per tank. Water quality parameters were monitored as described
in 3.5.2 and recorded thus: Temperature, 26-27 °C and 25-27 °C;
dissolved oxygen (DO), 4.4-6.2 and 5.1-6.0 mgL1; pH, 6.0-6.5 and 6.0-
7.0; NH3-N, 0.2-0.6 and 0.2-0.6 mgL1; N02-N, 0.2 and 0.2 mgL'1; N03-N,
10-20 and 10-20 mgL1; Ca-hardness, 51-62 and 46-57 mgL'1 and total
hardness, 59-71 and 66-93 mgL'1 for experiment 1 and 2 respectively.
iii Experimental analysis
Chemical analysis of feedstuffs, diets and carcass (initial and final)
was performed according to AOAC (1990) following the procedures
in 3.6.1. Eight specimens of fingerlings were taken for initial carcass
analysis while four from each tank were used for final carcass analysis.
Trypsin inhibitor activity assay in soybean flour was according to
Hammerstrand et al. (1981) described in 4.1.3. Biological parameters
203
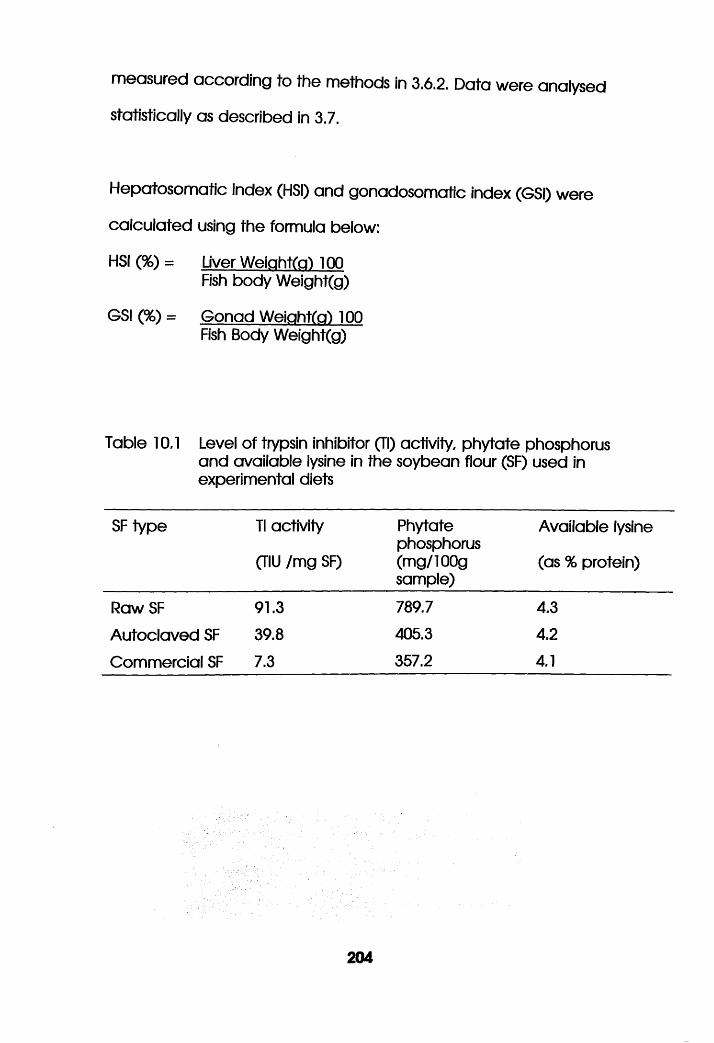
measured according to the methods in 3.6.2. Data were analysed
statistically as described in 3.7.
Hepatosomatic index (HSI) and gonadosomatic index (GSI) were
calculated using the formula below:
HSI (%) = Uver WeightfcO 100Fish body Weight(g)
GSI (%) = Gonad Weightier) 100 Fish Body Weight(g)
Table 10.1 Level of trypsin inhibitor (Tl) activity, phytate phosphorus and available lysine in the soybean flour (SF) used in experimental diets
SF type Tl activity
(Till /m g SF)
Phytatephosphorus(m g/100gsample)
Available lysine
(as % protein)
Raw SF 91.3 789.7 4.3
Autoclaved SF 39.8 405.3 4.2
Commercial SF 7.3 357.2 4.1
204
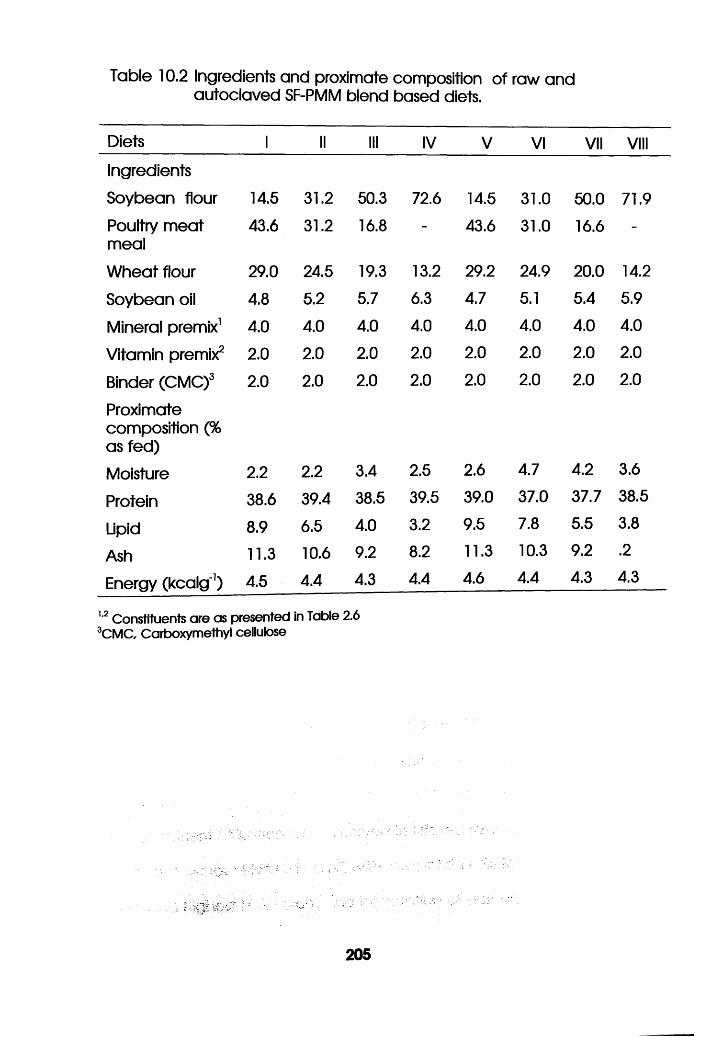
Table 10.2 Ingredients and proximate composition of raw and autoclaved SF-PMM blend based diets.
Diets 1 II III IV V VI VII VIII
Ingredients
Soybean flour 14.5 31.2 50.3 72.6 14.5 31.0 50.0 71.9
Poultry meat meal
43.6 31.2 16.8 - 43.6 31.0 16.6 -
W heat flour 29.0 24.5 19.3 13.2 29.2 24.9 20.0 14.2
Soybean oil 4.8 5.2 5.7 6.3 4.7 5.1 5.4 5.9
Mineral premix1 4.0 4.0 4.0 4.0 4.0 4.0 4.0 4.0
Vitamin premix2 2.0 2.0 2.0 2.0 2.0 2.0 2.0 2.0
Binder (CMC)3 2.0 2.0 2.0 2.0 2.0 2.0 2.0 2.0
Proximate composition (% as fed)
Moisture 2.2 2.2 3.4 2.5 2.6 4.7 4.2 3.6
Protein 38.6 39.4 38.5 39.5 39.0 37.0 37.7 38.5
Lipid 8.9 6.5 4.0 3.2 9.5 7.8 5.5 3.8
Ash 11.3 10.6 9.2 8.2 11.3 10.3 9.2 .2
Energy (kca lg1) 4.5 4.4 4.3 4.4 4.6 4.4 4.3 4.3
1-2 Constituents are as presented in Table 2.6 3CMC, Carboxymethyl cellulose
205
10.3 Results
10.3.1 Experiment 1 - Oreochromis niloticus
i Nutrient Utilisation
Table 10.3 presents the response of O.niloticus fingerlings fed raw and
autoclaved soybean flour (SF) - poultry meat meal (PMM) blend
based diets. It was observed that diets containing autoclaved
soybean flour did better than those with raw soybean flour a t the
same incorporation level. Similarly, diets containing high inclusion
levels o f PMM performed better than those with soybean flour. There
was significant variation in the mean final weight (MFW), specific
growth rate (SGR), food conversion ratio (FCR), protein efficiency ratio
(PER), apparent net protein utilisation (ANPU) of fishes fed the different
diets (P<0.05). Mortality variation with the diets was insignificant
(P>0.05).
Diet V containing 25:75 SF:PMM with autoclaved SF did better than
those of any other blending ratio with or without autoclaving. It gave
gave highest MFW, SGR, PER and ANPU, and lowest FCR values.
Poorest nutrient utilisation was observed in fish fed raw soybean flour
based diet without PMM (diets IV) with lowest MFW, SGR, PER and
ANPU, and highest FCR values. The interraction of autoclaving and
206
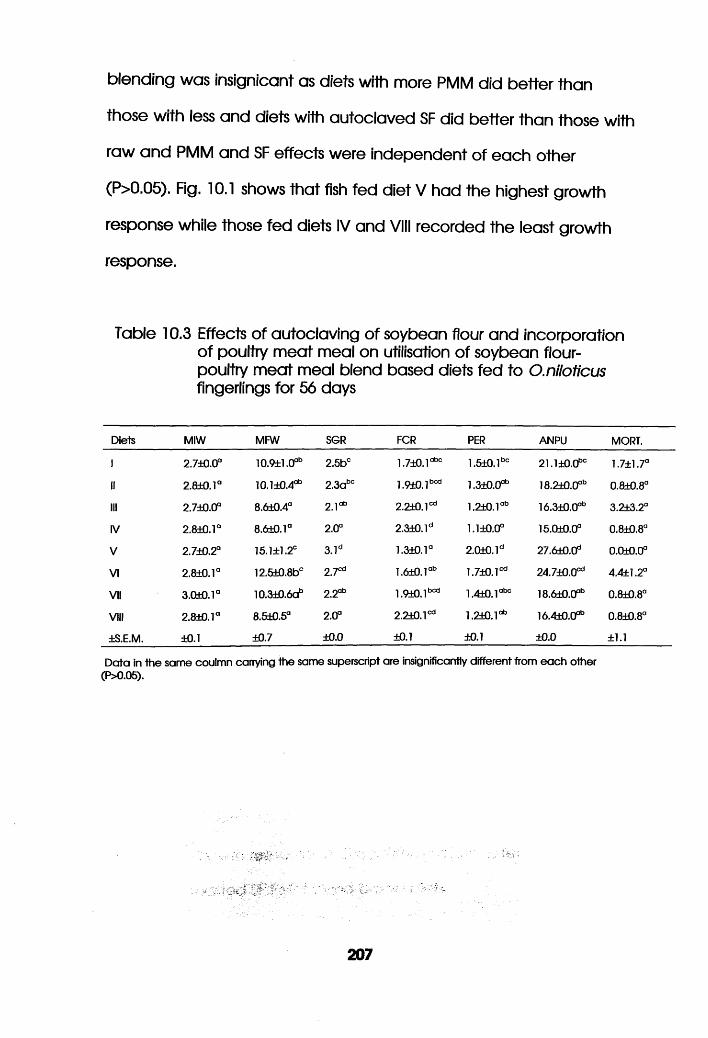
blending was inslgnicant as diets with more PMM did better than
those with less and diets with autoclaved SF did better than those with
raw and PMM and SF effects were independent of each other
(P>0.05). Fig. 10.1 shows that fish fed diet V had the highest growth
response while those fed diets IV and VIII recorded the least growth
response.
Table 10.3 Effects of autoclaving of soybean flour and incorporation of poultry meat meal on utilisation of soybean flour- poultry meat meal blend based diets fed to O.niloticus fingerlings for 56 days
Diets MIW MFW SGR FCR PER ANPU MORT.
1 2.7±0.0° 10.9*1.0* 2.5b° 1.7±0.1abc 1.5±0.1bc 21.1±0.0bc 1.7*1.7°
li 2.8±0.1° 10.1±0.4ab 2.3abc 1.9±0.1bcd 1.3±0.0°b 18.2±0.0°b 0.8±0.8°
III 2.7±0.0° 8.6±0.4a 2 i° b 2.2±0.1cd 1.2±0.1°b 16.3±0.0°b 3.2±3.2°
IV 2.8±0.1° 8.6±0.1a 2.0° 2.3±0. ld 1.1*0.0° 15.0*0.0° 0.8±0.8°
V 2.7±0.2° 15.1*1.2° 3.1d 1.3±0.1a 2.0*0. ld 27.6±0.0d 0.0±0.0°
VI 2.8+0. r 12.5±0.8bc Z7cd 1.6±0.1ab 1.7±0.1cd 24.7±0.0cd 4.4*1.2°
VII 3.0ti£). 1° 10.3*0.6ab 2 2ab 1.9±0.1bcd 1.4±0.1abc 18.6*0.0* 0.8±0.8°
VIII 2.8*0.1° 8.5±0.5a 2.0° 2.2*0.1“* 1.2*0. l ab 16.4*0.0* 0.8±0.8°
±S.E.M. *0.1 ±0.7 ±0.0 ±0.1 ±0.1 ±0.0 ±1.1
Data in the same coulmn carrying the same superscript are insignificantly different from each other (P>0.05).
207
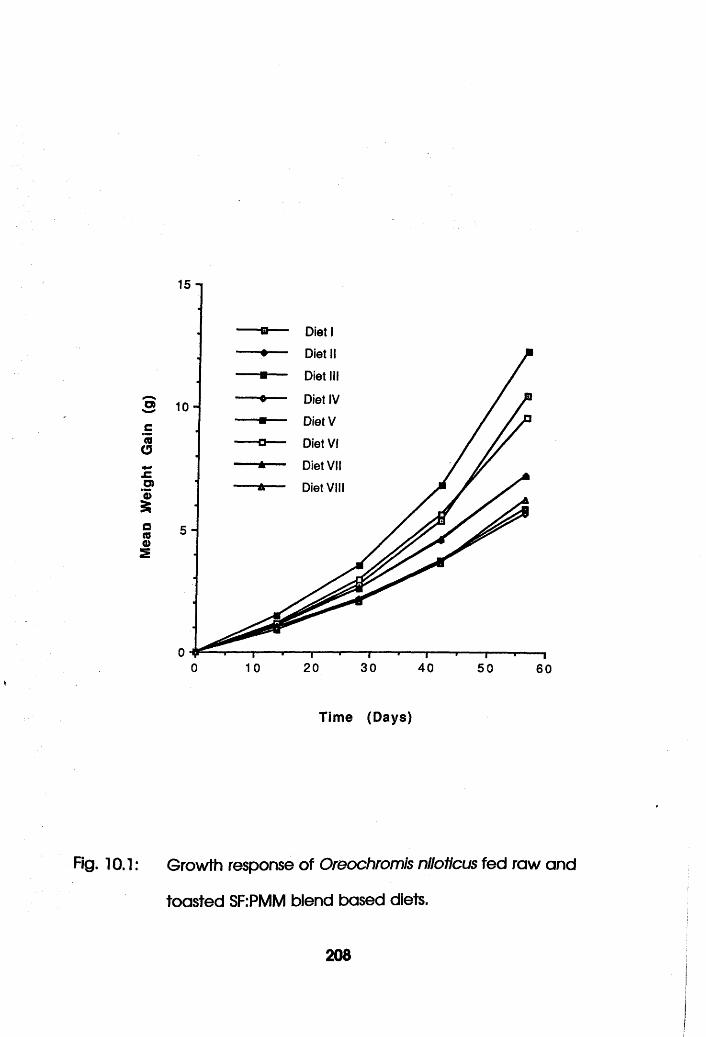
Time (Days)
Fig. 10.1: Growth response of Oreochromis nlloticus fed raw and
toasted SF:PMM blend based diets.
208
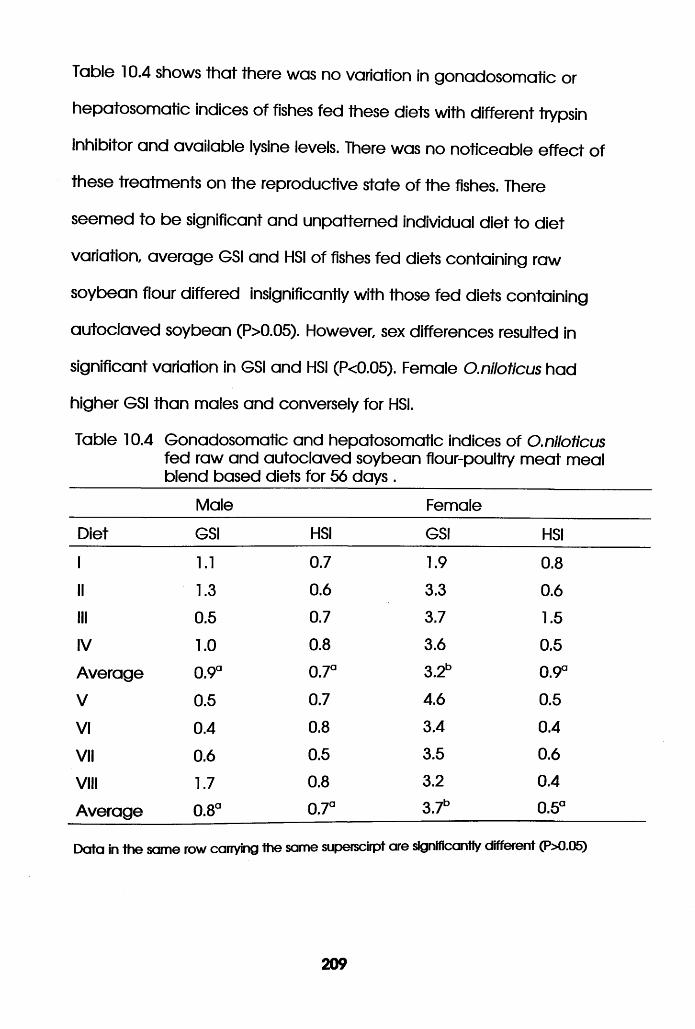
Table 10.4 shows tha t there was no variation in gonadosomatic or
hepatosomatic indices of fishes fed these diets with different trypsin
inhibitor and available lysine levels. There was no noticeable e ffect of
these treatments on the reproductive state of the fishes. There
seemed to be significant and unpatterned individual diet to diet
variation, average GSI and HSI of fishes fed diets containing raw
soybean flour differed insignificantly with those fed diets containing
autoclaved soybean (P>0.05). However, sex differences resulted in
significant variation in GSI and HSI (P<0.05). Female O.niloticus had
higher GSI than males and conversely for HSI.
Table 10.4 Gonadosomatic and hepatosomatic indices of O.niloticus fed raw and autoclaved soybean flour-poultry m eat meal blend based diets for 56 days .
Male Female
Diet GSI HSI GSI HSI
1 1.1 0.7 1.9 0.8
II 1.3 0.6 3.3 0.6
III 0.5 0.7 3.7 1.5
IV 1.0 0.8 3.6 0.5
Average o Q o Q 3.2b 0.9°
V 0.5 0.7 4.6 0.5
VI 0.4 0.8 3.4 0.4
VII 0.6 0.5 3.5 0.6
VIII 1.7 0.8 3.2 0.4
Average
o00o 0.7a 3.7b 0.5°
Data in the same row carrying the same superscirpt are significantly different (P>0.05)
209
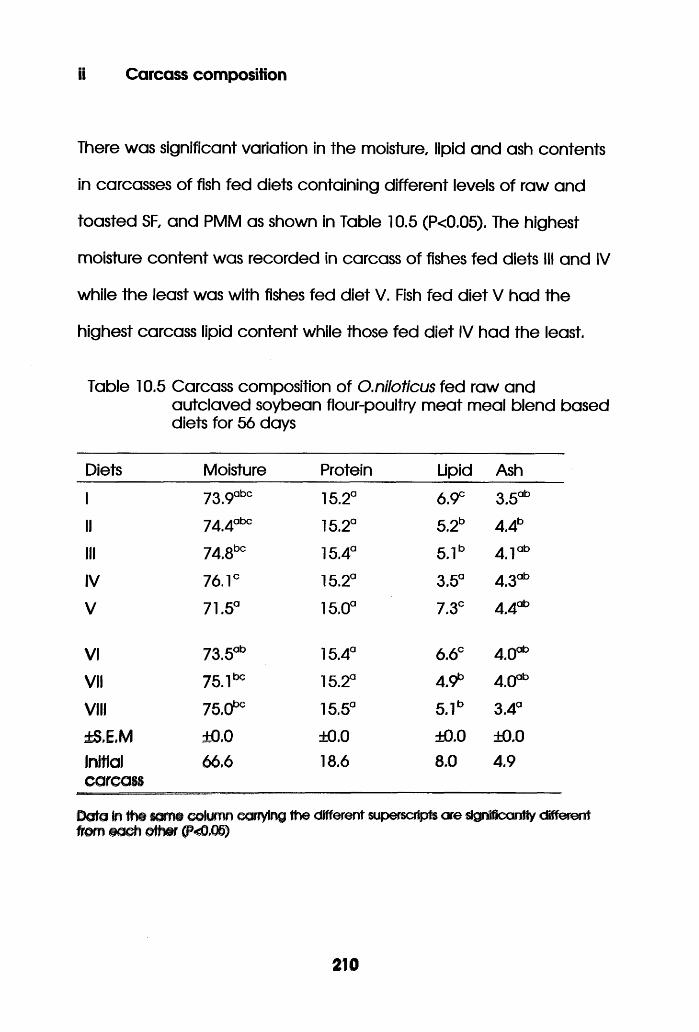
ii Carcass composition
There was significant variation in the moisture, lipid and ash contents
in carcasses o f fish fed diets containing different levels o f raw and
toasted SF, and PMM as shown in Table 10.5 (P<0.05). The highest
moisture content was recorded in carcass of fishes fed diets III and IV
while the least was with fishes fed diet V. Fish fed d iet V had the
highest carcass lipid content while those fed diet IV had the least.
Table 10.5 Carcass composition of O.niloticus fed raw andautclaved soybean flour-poultry m eat meal blend based diets for 56 days
Diets Moisture Protein Lipid Ash
1 73.9abc 15.2° 6.9° 3 .5*
II 744abc 15.2° 5.2b 4.4b
III 74.8bc 15.4° 5.1b 4 .1 *
IV 76.1° 15.2° 3.5° 4 .3 *
V 71.5° 15.0° 7.3° 4 .4 *
VI 73.5* 15.4° 6.6C 4 .0 *
VII 75.1150 15.2a 4.9* 4 .0 *
VIII 75.0bo 15.5° 5.1b
CO
±S,E.M ±<0.0 +0.0 ±0.0 ±0.0Initialcarcass
66.6 18.6 8.0 4.9
Data In the same column carrying the different superscripts are significantly different from each other (NO,05)
210
iii Histology
Examinaton o f the fish fed the various diets showed hypertrophy of
the primary gill lamellae in fish fed diets containing raw soybean flour
(Plate 10.1a and b). There was hepatocytes vacuolation and lipid
deposition in the liver of fish fed all the diets. However these were not
severe enough to be pathological even with a high inclusion level o f
poultry m eat meal a t 25:75 SF:PMM as vacuoles were small and
evenly distributed considered normal in farmed fish fed high protein -
energy diets (Plate 10.2a and b)
211
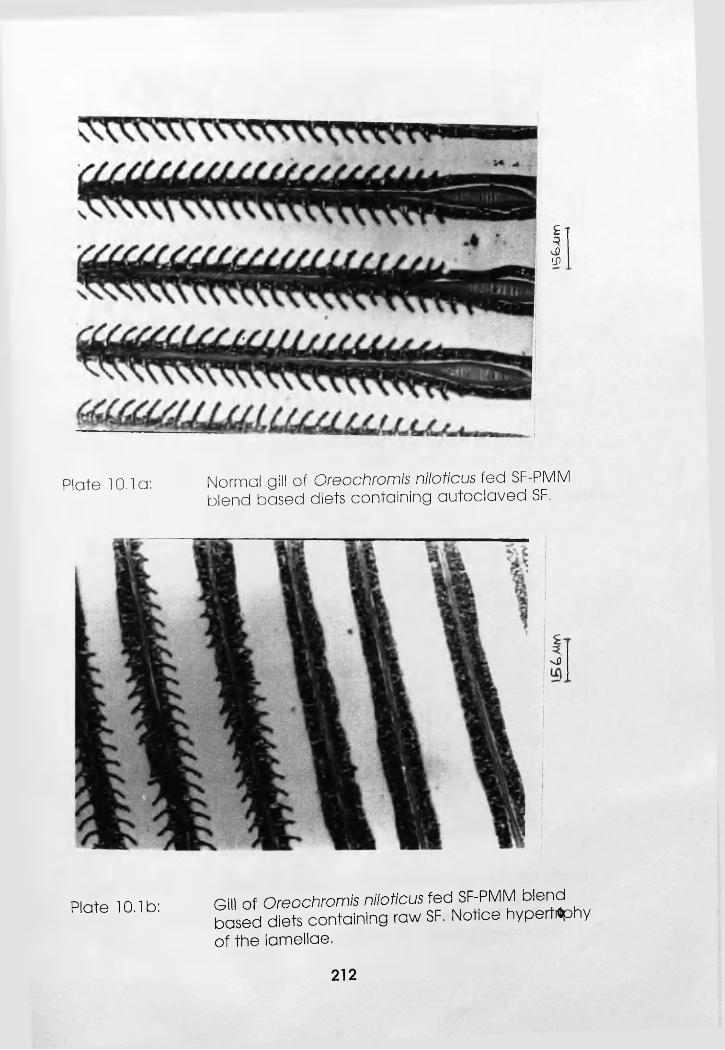
£ T 3vDLO
Plate 10.1a: Normal gill of Oreochromis niloticus fed SF-PMMblend based diets containing autoclaved SF.
£sD
Plate 10.1b: Gill of Oreochromis niloticus fed SF-PMM blendbased diets containing raw SF. Notice hypertrtphyof the lamellae.
212
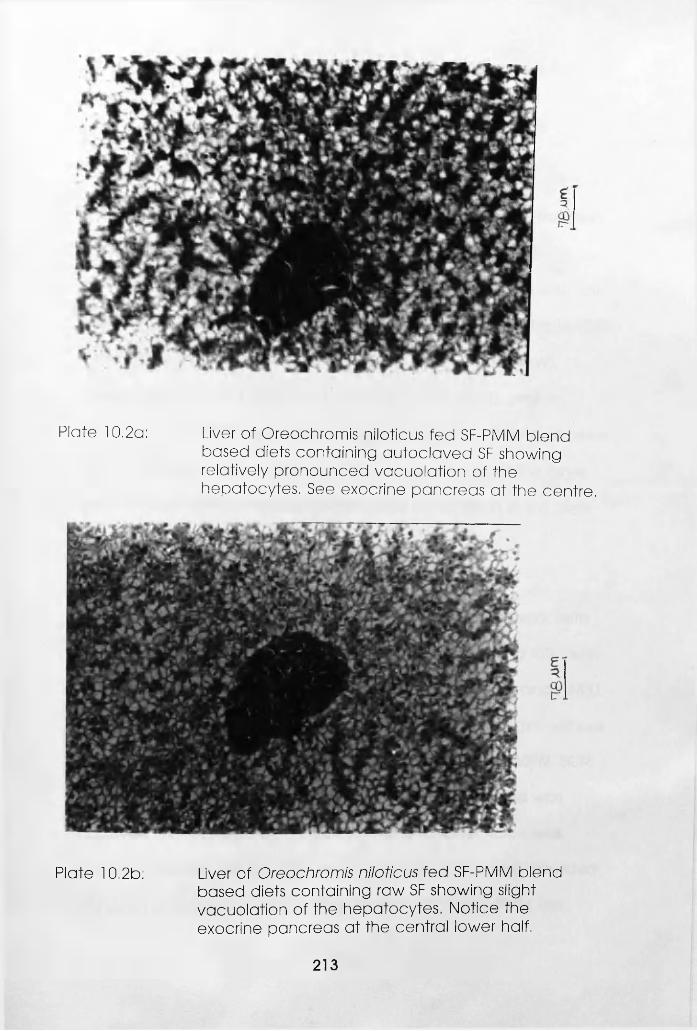
Plate 10.2a: Liver of Oreochromis niloticus fed SF-PMM blendbased diets containing autoclaved SF showing relatively pronounced vacuolation of the hepatocytes. See exocrine pancreas at the centre.
Plate 10.2b: Liver of Oreochromis niloticus fed SF-PMM blendbased diets containing raw SF showing slight vacuolation of the hepatocytes. Notice the exocrine pancreas at the central lower half.
213
10.3.2 Experiment 2 - Clarias gariepinus
i Nutrient Utilisation
Diets containing high inclusion levels o f PMM performed better than
those with soybean flour. Similarly, It was observed tha t diets
containing autoclaved soybean flour did better than those with raw
soybean flour a t the same incorporation level as shown in Table 10.6.
There was significant variation in the mean final weight (MFW),
specific growth rate (SGR), food conversion ratio (FCR), protein
efficiency ratio (PER), apparent net protein utilisation (ANPU) of fishes
fed the different diets (P<0.05). The reproductive state of the fishes
and mortality were unaffected significantly by variation in the diets
(P>0.05).
Diet V and VI containing 25:75 and 50:50 SF.PMM respectively, with
autoclaved SF did better than those of any other blending ratio with
or w ithout autoclaving. They gave highest MFW, SGR, PER and ANPU,
and lowest FCR values. Fish fed raw soybean flour based diet without
PMM (diets IV) had poorest nutrient utilisation with lowest MFW, SGR,
PER and ANPU, and highest FCR values. The same response was
observed with fish fed diet VIII except that better PER value was
recorded with fish fed this diet. Insignicant interaction was recorded
between autoclaving and blending as diets with more PMM did
214
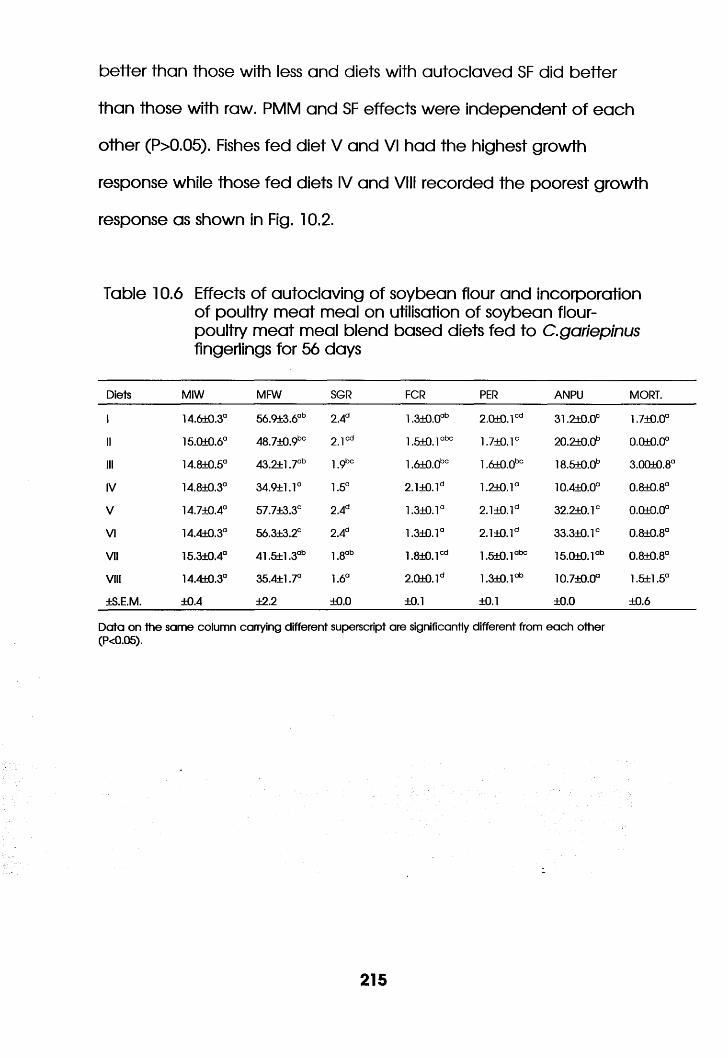
better than those with less and diets with autoclaved SF did better
than those with raw. PMM and SF effects were independent o f each
other (P>0.05). Fishes fed d iet V and VI had the highest growth
response while those fed diets IV and VIII recorded the poorest growth
response as shown in Fig. 10.2.
Table 10.6 Effects o f autoclaving of soybean flour and incorporation o f poultry m eat meal on utilisation of soybean flour- poultry m eat meal blend based diets fed to C.gariepinus fingerlings for 56 days
Diets MIW MFW SGR FCR PER ANPU MORT.
1 14.6+0.3° 56.9±3.6°b 2.4d 1.340.0°b 2.0+0. l cd 31.240.0° 1.740.0°
II 15.040.6° 48.740.9bc 2.1cd 1.540.1abc 1.7+0.1c 20.2±0.0b 0.040.0°
III 14.8+0.5° 43.2+1,7°b }.<PC 1.640.0bc 1 ^ . O 130 is -s+o .o13 3.00±0.8°
IV 14.840.3° 34.9+1.1° 1.5° 2.1+0.1d 1.240.1° 10.4±0.0° 0.840.8°
V 14.740.4° 57.7+3.3° 2.4d 1.340.1° 2.1±0.1d 32.2+0.1° 0.040.0°
VI 14.440.3° 56.3±3.2° 2.4d 1.340.1° 2.1+0.1d 33.3+0.1° 0.840.8°
VII 15.340.4° 41.5+1.3°b 1.8°b 1.840.1cd 1.5+0.1abc 15.040. l°b 0.840.8°
VIII 14.440.3° 35.4+1.7° 1.6° 2.040. l d 1.3+0.1°b 10.740.0° 1.5±1.5°
+S.E.M. 40.4 +2.2 +0.0 ±0.1 +0.1 ±0.0 ±0.6
Data on the same column carrying different superscript are significantly different from each other (P<0.05).
215
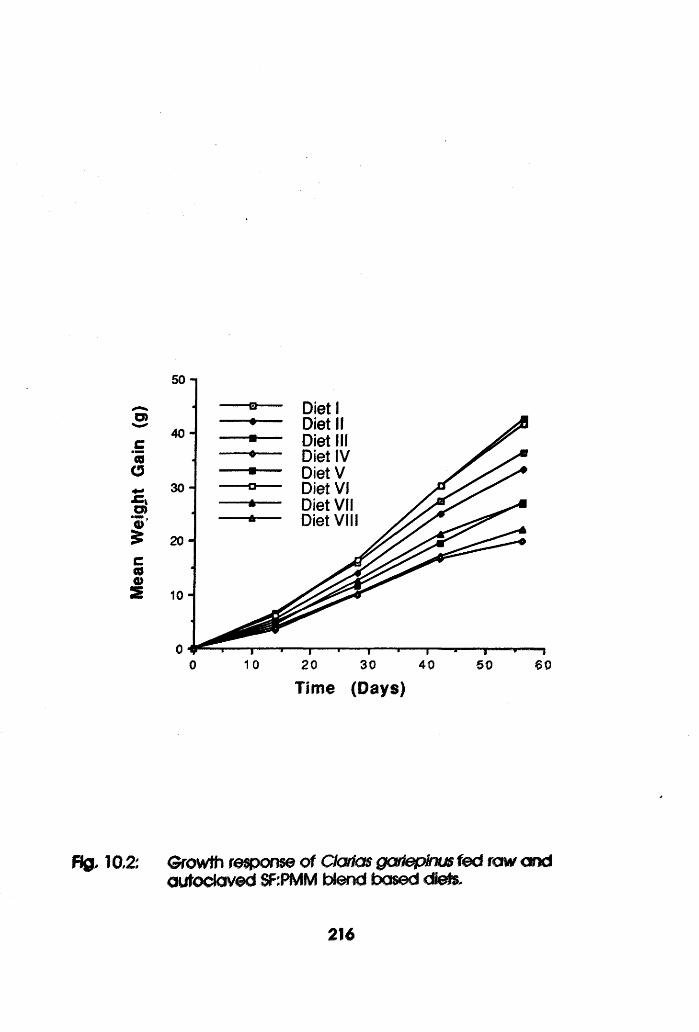
50 i
Diet I Diet If Diet III Diet IV Diet V Diet VI Diet VII Diet VIII
o>40 -
£COO
30 -fao>5$ 20 -
CC00)s 1 0 -
1 o 20 30 40 50 60
Time (Days)
Fig, 10,2; Growth response of Cianas garieptnus fed raw andautociaved blend based diets,
216
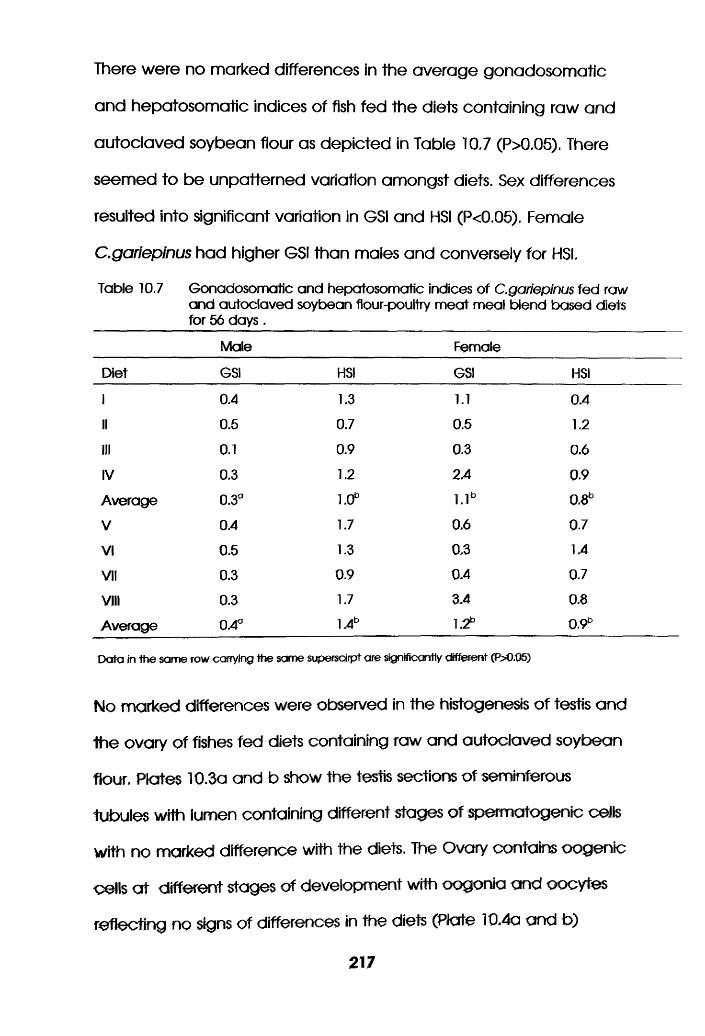
There were no marked differences in the average gonadosomatic
and hepatosomatic indices of fish fed the diets containing raw and
autoclaved soybean flour as depicted in Table 10.7 (P>0.05). There
seemed to be unpatterned variation amongst diets. Sex differences
resulted into significant variation in GSI and HSI (P<0.05). Female
C.gaiiepinus had higher GSI than males and conversely for HSI.
Table 10.7 Gonadosomatic and hepatosomatic indices of C.gariepinus fed raw and autoclaved soybean flour-pouitry meat meal blend based diets for 56 days.
Male Female
Diet GSi HSI GSI HSI
1 0.4 1.3 1.1 0.4
II 0.5 0.7 0.5 1.2
III 0.1 0.9 0.3 0.6
IV 0.3 1,2 2.4 0.9
Average 0.3° l . lb 0.3b
V 0.4 1.7 0.6 0.7
VI 0.5 1.3 0.3 1.4
VII 0.3 0.9 0.4 0.7
VIII 0.3 1.7 3.4 0.6
Average 0.4° 1.4b 1.2b 0.9b
Data in the same tow carrying the same supersdrpt are significantly different (P>0.05)
No marked differences were observed in the histogenesis o f testis and
the ovary o f fishes fed diets containing raw and autoclaved soybean
flour. Plates 10.3a and b show the testis sections o f seminferous
tubules with lumen containing different stages o f spemnatogenic cells
with no marked difference with the diets. The Ovary contains oogenic
ceils a t different stages of development with oogenic and oocytes
reflecting no signs o f differences in the diets (Plate 10.4a and b)
217
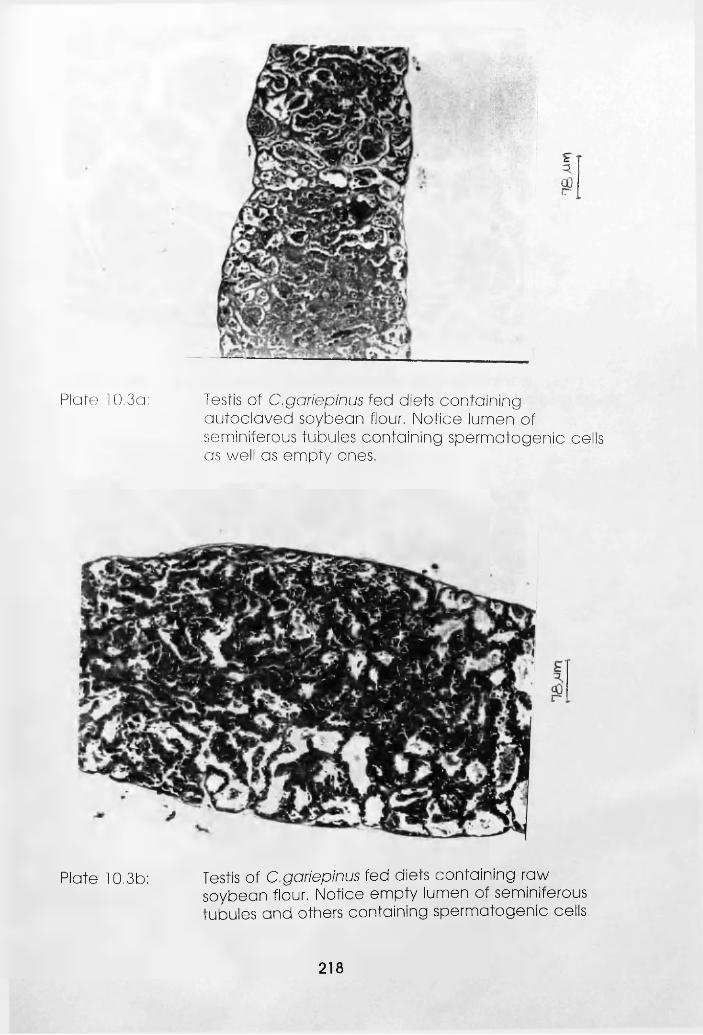
Plate 10.3a: Testis of C.gariepinus fed diets containingautoclaved soybean flour, Notice lumen of seminiferous tubules containing spermatogenic cells as well as empty ones.
Plate 10.3b: Testis of C.gariepinus fed diets containing rawsoybean flour. Notice empty lumen of seminiferous tubules and others containing spermatogenic cells,
218
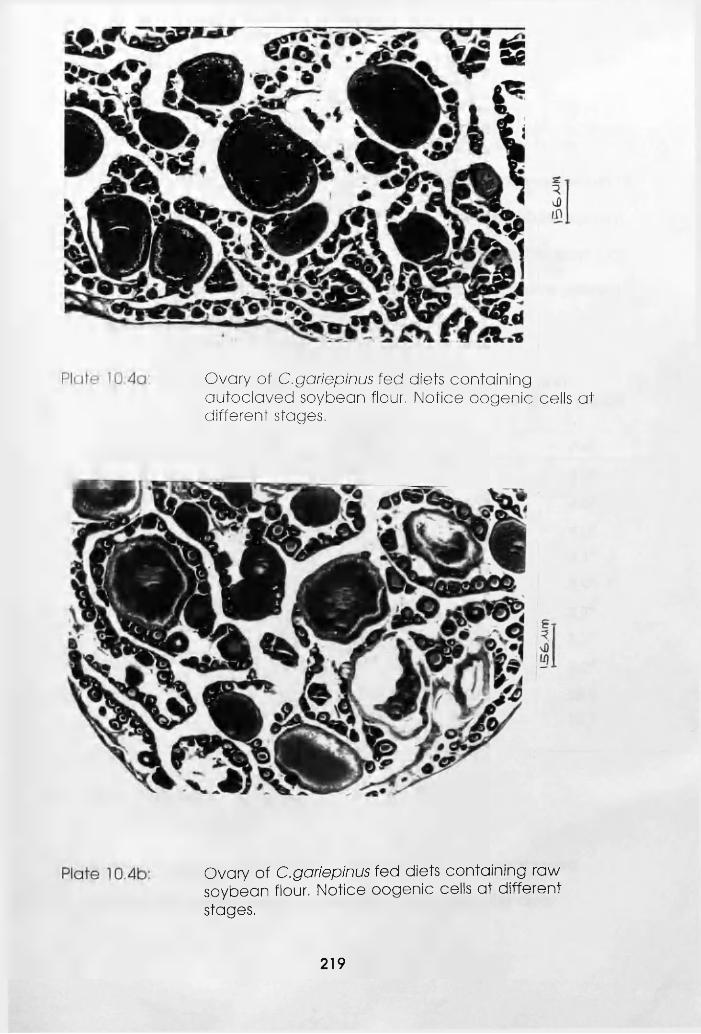
Ovary of C.gariepinus fed diets containing autoclaved soybean flour, Notice oogenic cells a t different stages,
Ovary of C.gariepinus fed diets containing raw soybean flour. Notice oogenic cells a t different stages.
219
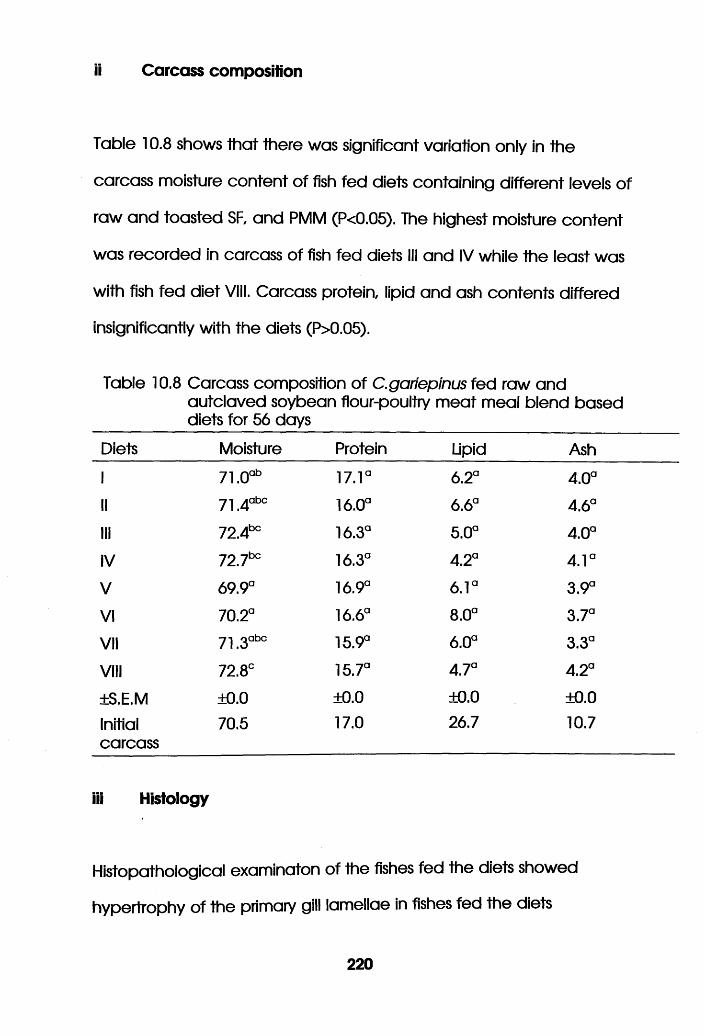
ii Carcass composition
Table 10.8 shows tha t there was significant variation only in the
carcass moisture content o f fish fed diets containing different levels o f
raw and toasted SF, and PMM (P<0.05). The highest moisture content
was recorded in carcass of fish fed diets III and IV while the least was
with fish fed d iet VIII. Carcass protein, lipid and ash contents differed
insignificantly with the diets (P>0.05).
Table 10.8 Carcass composition of C.gariepinus fed raw andautclaved soybean flour-poultry m eat meal blend based diets for 56 days
Diets Moisture Protein Lipid Ash
1 71.0ab 17.1a 6.2a
oO
II 71 4abc 16.0° 6.6a 4.6°
III 72.4bc 16.3a 5.0a 4.0a
IV 72.7bc 16.3°
oCN 4.1a
V 69.9a 16.9° 6.1a 3.9°
VI 70.2° 16.6a 00 to Q 3.7a
VII 71.3abc 15.9° 6.0° 3.3a
VIII 72.8C 15.7a 4.7a 4.2a
±S.E.M ±0.0 ±0.0 ±0.0 ±0.0
Initialcarcass
70.5 17.0 26.7 10.7
iii Histology
Histopathological examinaton of the fishes fed the diets showed
hypertrophy of the primary gill lamellae in fishes fed the diets
220
containing raw soybean flour (Plate 10.5a and b). There was
hepatocytes vacuolation and lipid deposition in the liver of fish fed ail
the diets. However, these were not observed to be pathological even
w ith high inclusion level of poultry m eat meal a t 25:75 SP.PMM as
vacuoles were small and evenly distributed considered normal in
farm ed fish fed high protein - energy diets (Plate 10.6a and b)
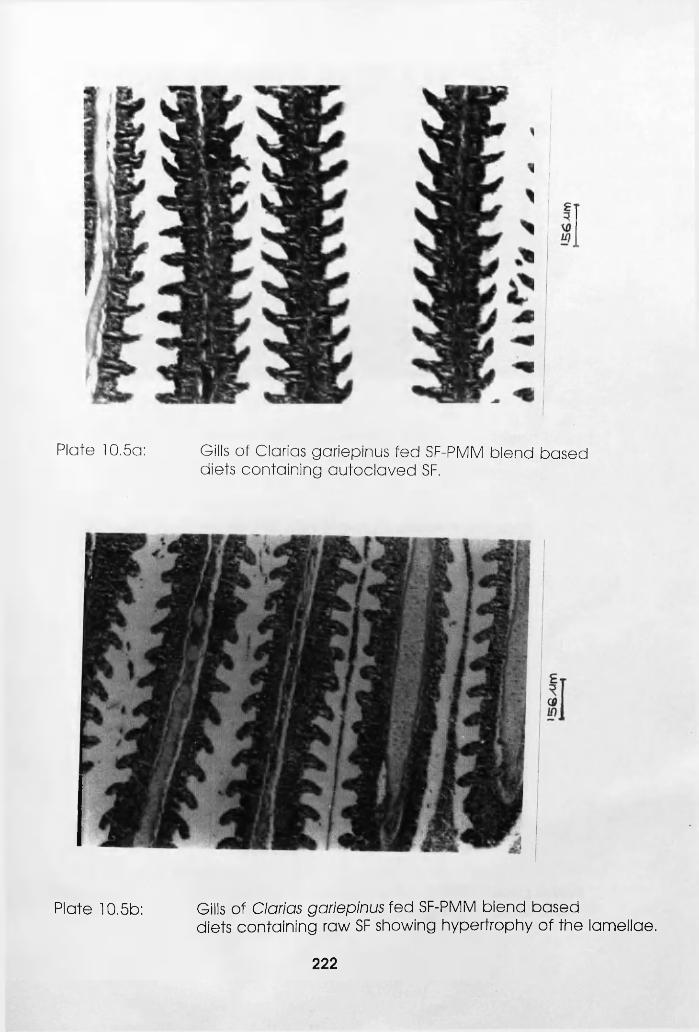
Plate 10.5a: Gills of Clarias gariepinus fed SF-PMM blend baseddiets containing autoclaved SF.
Plate 10.5b: Gills of Clarias gariepinus fed SF-PMM blend baseddiets containing raw SF showing hypertrophy of the lamellae.
222
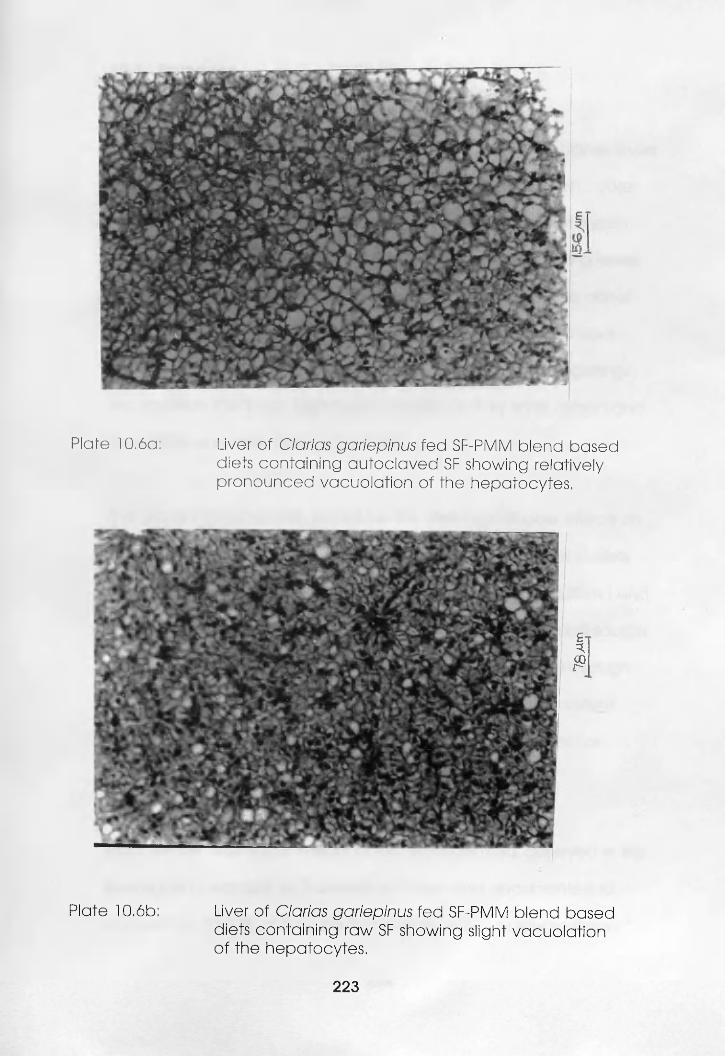
Plate 10.6a: Liver of Clarias gariepinus fed SF-PMM blend based diets containing autoclaved SF showing relatively p ronounced vacuolation of the hepatocytes.
Plate 10.6b: Liver of Clarias gariepinus fed SF-PMM blend baseddiets containing raw SF showing slight vacuola tion of the hepatocytes.
223
78>u
m
10.4 Discussion
Poorer nutrient utilisation by both fish fed diets containing higher levels
o f incorporation of raw soybean flour was evident. They had poorer
SGR, FCR, PER and ANPU. This was presumably as a result o f trypsin
inhibitor (Tl) activity that increased in the diets with increasing levels
o f raw soybean (diets l-IV). Table 10.1 shows tha t raw SF had about
three times the Tl o f autoclaved SF. Growth retardation and poor
protein efficiency ratio were observed in channel catfish fingeriings
fed soybean meal with high trypsin inhibitor activity level (Wilson and
Poe, 1985) and carp (Viola e t al 1983).
The graded incorporation of PMM in the diets had double effects on
Tl activity. It reduced the levels o f Tl activity to residual level in diets
containing raw soybean flour and high levels o f PMM as in diets I and
II where its inclusion level was above 30%. PMM Is also a good source
o f lysine. This compensated for lysine rendered unavailable through
autoclaving o f soybean. It thereby improved growth and nutrient
utilisation, as well as counterbalancing any deleterious e ffect o f
unavailable lysine in diets with raw soybean and PMM.
Much o f the deleterious effects o f raw soybean meal observed in this
investigation was due to Tl activity as it has been documented to
account for 30-50% of the growth inhibitory effect o f raw soybean
224
meal fed to rat (Kakade et al. 1973). Though the level o f Tl activity in
diets containing autoclaved soybean flour as com pared to
com m ercial soybean flour depicted inadequate heating, Tl has been
reduced to residual levels incapable of eliciting significant growth
depression and poor nutrient utilisation, particularly in a high protein
diet. Rackis e t al. (1975) observed maximum nutrient utilisation in rats
fed soybean meal where 79-87 % of the inhibitors were inactivated.
The reproductive performances (GSI and HSI) of both fishes were
unaffected by differences in Tl activity level in different diets and
hence the similarity in the gonadodal development o f fish fed diets
containing both raw and autoclaved SF. Santiago et al(1988)
reported tha t feeding Leucaeno leaf meal to O.niloticus did not
markedly a ffect the GSI of the male and female Nile tilapia. Sex
seemed to account more for a marked difference in GSI and HSI than
Tl activity as females had higher GSI while males had higher HSI. The
lower average lipid level in fingerlings fed diets containing raw SF than
those with autoclaved SF could be attributed to trypsin inhibition as it
has been reported to result into tissue loss of lipid.
225
CHAPTER ELEVEN
AQUACULTURE NUTRITION AND WASTE GENERATION POTENTIAL OFAQUACULTURE OPERATION
226
11.1 Introduction
Nutritional approaches to quantifying solid and soluble wastes from
aquacultural operations have been proposed. These are based on
the importance of digestibility as an indicator of potentially available
energy and nutrients for growth, maintenance and reproduction of
the animal as well as the levels of indigestible nutrients (solid wastes
output) which account for the major portion of aquaculture wastes
(Cho, 1993). Cho postulated that it is possible to determine the
proportions of nutrients retained in fish and excreted as solid wastes
from the digestibility of feed, comparative carcass analysis and
measurements of feed intake and growth. This would be helpful in
developing predictive models for waste estimation in aquaculture
operations. Biological and chemical methods of quantifying waste
output in effluent are use. The biological method seems to offer
promise.
Cho et al. (1991) reported that there was agreement in results from
both methods for nitrogen waste output in brown trout culture.
However, the chemical method was inappropriate for phosphorus
waste output which was excessively high. Similarly they observed that
the use of fixed ADC and NRE (Nutrient retention efficiecy) for
estimating waste output for different ingredients and diet formulations
was equally misleading. Digestibility and nutrient utilisation studies of
an ingredient or a diet formulation are therefore necessary preambles
227
to predicting its waste generation potential and subsequent
modelling.
It is quite uncommon to see environmental im pact assessment of
feeding trials quantifying waste from such experiments in numerical
terms. The farthest ever gone is evaluating the digestibility (often) and
metabolisability (seldom) of the diets used leaving the end user of
such findings to narrow them down to their specifications w ithout a
worked example. This is a case study serving as a worked example on
the application of such im portant parameters, viz; digestibility, nutrient
utilisation and nutrient retention.
228
11.2 Materials and Methods
Materials and methods required are more of software than hardware
in this study. Results from the nutrient digestibility experiment of three
soybean flour (SF) - poultry m eat meal (PMM) blend based diets with
0.5% and 1.0% levels of Cr20 3 in both Oreochromis niloticus and
Clarias gariepinus (Tables 5.3 and 5.6; Figs. 5.2 and 5.3) were used in
conjunction with data from feeding trial experiments (Tables 6.2, 6.4
6.5 and 6.7) of the fish species on the diets to predict the waste
generation potential and nutrient retention efficiency of rearing
O.niloticus and C.gariepinus fingerlings on these diets.
The model for faecal nitrogen waste output (indigestible crude
protein) estimation for the diets could be m athem atically presented
as:
100-protein ADC(%)=Apparent indigestible protein coefficient (%)
or
(100-protein ADC)XCrude protein intake=lndigestible protein (%) (g/fish/day) (g/fish/day)
while the model for protein retention efficiency(PRE) according to
Cho, et al (1985) could be expressed as:
PRE = Carcass protein aain(g)Protein intake(g) X protein ADC(%)
iv Statistical Analysis.
Data were analysed statistically according to the procedures in 3.7
229
11.3 Results and Discussion
Figs. 5.1 and 5.2 revealed that protein digestibility of the diets differed
significantly from each other for both O,niloticus and C.gariepinus
(p<0.05). Diet III (50:50 SF.’PMM) had the highest protein ADC, followed
by diets V(75:25 SF:PMM) and I (25:75 SF:PMM) in that order - all with
0.5% Cr20 3. They generated lower faecal nitrogen wastes than diets II,
IV and VI with 1.0% Cr20 3 as shown in Table 11.1a and b. This was
probably due to their high level of the marker as it has been observed
tha t marker type influences digestibility (De Silva et al, 1990; Sadiku
and Jauncey, 1995).
Table 11.2a and b depict the protein retention effeciency (PRE)
derived from carcass protein gain , ADC and protein intake data.
Carcass protein gain, protein intake and apparent net protein
utilisation (ANPU) data of Sadiku and Jauncey (in press) from a
previous feeding trial using the same diets were used in this prediction.
In O.niloticus, there was insignificant difference in protein retention
effeciency of the diets (p>0.05). This was in agreement with the
finding of the feeding trial where the protein utilisation parameters
also varied insignificantly with the diets (p>0.05). Though the protein
ADC was found to differ significantly with the diets, it was not
adequate to change this finding. Conversely, there was significant
difference in the protein retention efficiency of the diets (p>0.05) in
230
C.gariepinus. Higher protein retention efficiency was observed in diets
with 1.0% than 0.5% Cr20 3. This was due to the higher protein ADC in
the latter while they shared the same protein intake.
There seems to be agreement in the trend of nitrogen waste
generation potential of the diets in both species. However, opposing
trends were observed in their nutrient retention efficiency in both
species. This was probably due to the fact that the theoretical
assumption of the three diets having similar protein intake level does
not hold in practice if both species were fed diets originally
containing 0.5% and 1.0% Cr20 3 levels. Protein intake could have
been higher a t the 0.5% level and this could have resulted into better
protein efficiency by C.gariepinus fed diet with 0.5% Cr20 3 than those
with 1.0% .
Although, there is relative validity in this predictive modelling, to
achieve absolutely validity, it is strongly recommended that feeding
trials and digestibility study diets should be the same in all respects.
The experimental subjects and conditions for both experiments should
be very similar. More work needs to be done to expand the scope of
this investigation towards developing comprehensive nutritional
models for quantifying waste output generation in aquaculture
operations for most of the commercially available ingredients and
aquaculture species. The faecal nitrogen waste output and nutrient
231
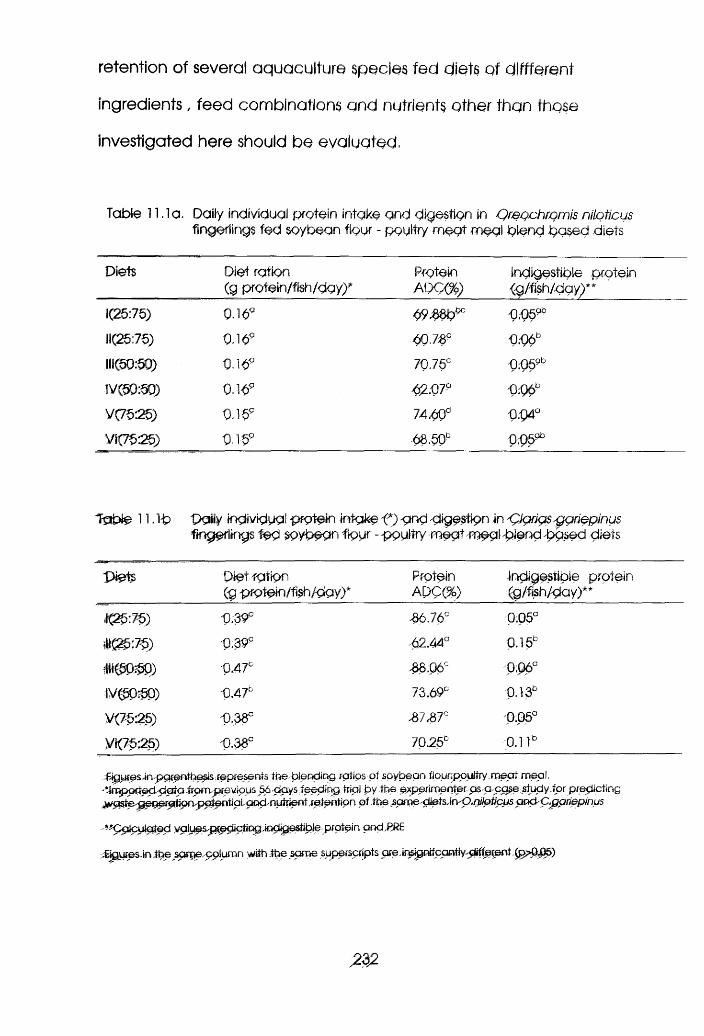
retention of several aquaculture species fed diets of diffferent
ingredients, feed combinations and nutrients other thgn thqse
investigated here should be evaluated.
Table 11.1a. Daily individual protein intake and digestion in Qreqchrqmls niloticus fingerlings fed soybean flour - poultry m eat m egi blend based diets
Diets Diet ration (g protein/flsh/day)^
ProteinADC(%)
Indigestible protein (g /fish /d ay)**
1(25:75) 0.15' €.p59b
11(25:75) 0.169 60 .739 0;06b
111(50:50) 0.16° 70.75° p.059b
1V(50:50) 0.15- 62.079 0:P69
V (7525) 0.16° 74,50° g.Q4a
¥1(75:25) 0.15° •68,50° p;05ob
Table n . ib Daily IndividUdi protein intgke <-*) p nd digestion in 'Clarias -gariegin us fingerlings ted soybean flour - poultry m ^ t-m e a l p ien d D osed diets
Piets Diet'ration (g pm tein/f(sh/dgy)*
ProteinADC(%)
Indigestible protein (g /fjsh /day)**
m m 5.30° 36.76° 0.05°
i m m '0.39° 62.44° 0.15b
r n m m '0.47° 38.06° 0.06°
IVC50:5p) '0.47b 73.69° 0.13b
V(75:25) '0.33° 3 7 3 7 ° 0.05°
Vt(75:25) V M C 70.25b 0.1 l b
:£iguse$ in p aren th esis represents W endicig la tio s o f so yb e an fio u n p o u ifry .m ea t m e a l.vipus 66-daysfeeding tria l b y th e p x p p r in ^ ^ p s - a '^ e .s t ^ y J o e p r e f ^ in g
^ ^ e ^ g ^ ^ p n p 0 ^ t i a i a i^ 'n u tm fit f0en tip n o f th e s a m e .pmtsAryO^gUpiipuspod'Cgjpriepinus
‘ ^ jJ c u ia te d y a l^ s ^ ^ c ^ ^ .iD C lip ^ t ib le p ro te in a n d 3R E
fig u re s h n .th e s a m e g p lu ra n w ith ttie s a m e superscripts a r e ir ^ i^ c ^ t iy - d i f ^ e r it
m

Table 11.2a Individual fish carcass protein and retention in Qreochromis niloticus fingerlings fed soybean flour - poultry m eat m eal based diets
Diet Carcass protein (g /fish/day)*
ANPU(%)* Protein retention efficiency **
1(25:75) 0.05° 27,50° 0.42°
11(25:75) 0.05° 27.50° 0.4$°
111(50:50) 0.05a 29.50° 0-40°
IV(50:50) 0.05° 29.50° 045°
V(75:25) 0.05° 30.00° 040°
VI (75:25) 0.05° 30.00° 044°
Table 11.2b Individual fish carcass protein and retention in Clarias ggriepinus fingerlings fed soybean flour - poultry meat meal based diets
Diet Carcass protein (g/fish/day)*
ANPU(%)* Protein fetentionefficiency **
1(25:75) 0.16° 40.00° 045°c
11(25:75) 0.15° 40.00° 0.-54bb
111(50:50) 0.23b 47.50° 0.55°b
1V(50:5P) 0,23to 47.50° 0.55b
V(75:25) 0.15° 4000° 0,40°
VI (7525) 0-15° 40.00° 0.58°b
fig u re s in p aren th esis represents th e b len d in g ratios o f so yb ean flp u rp p u ltry m e a t m ea l.
S p o r t e d -d a ta from prev iou s days fe e d in g tria l d y th e exp erim en ter os a p a $ e study fp r p re d ic tin gw a s te g e n e ra tio n p o te n tia l p n d nu trien t re ten tio n p f th e sam e -diets -in 'P .o /io f/c u s p n d 'C/g&ciepinus
**C stfpylG rted va lues p re d ie tin g in d igestip le p ro te in p n d RRE
fig u re s tn -the s a m e p p iy m n w ith th e sa m e superscripts -are -in sig n ifo an tiyd ifeE p n t
CHAPTER TWELVE
GENERAL DISCUSSION
234
The nutritional studies in this research are intended to investigate the
nutritional improvement of soybean flour by the incorporation of low
cost animal protein - poultry meat meal (PMM) as blends, their
utilisation either as the sole protein supplement and their role as
replacers of fishmeal in practical diets of Oreochromis niloticus and
Clarias gariepinus. In addition, improvement of such diets through
essential amino acid profile enrichment by supplementation and
reconstitution of their minerals were studied. To achieve these aims,
several feeding trials were conducted to establish which of 25:75;
50:50 and 75:25 SF:PMM blends would be optimum and at which of
25%, 50 and 75% replacement level of fishmeal. Effects of dl-
methionine supplementation and reconstitution of minerals of
significant nutritional importance such as calcium, phosphorus,
magnesium and zinc were examined. Digestibility studies of these
blends were conducted to evaluate their quality in terms of nutrients
availability and utilisation.
There has been no problem free utilisation of soybean in aquaculture
diets. Lovell (1990) and Urn (1992) documented reported variable
successes on the utilisation of soybean in aquaculture feeds.
Replacement of fishmeal meal with soybean meal without any
supplementation in tilapia diets was successful up to 50% in a diet of
25% crude protein (Viola and Arieli, 1983). High level of dietary
soybean meal or complete substitution of fish meal resulted in poor
235
growth and feed efficiency of fish (Jackson et al. 1982; Dabrowska et
al.1989) hence the seeming fishmeal indispensability. However, rising
cost and uncertain availability have made it mandatory to reduce
the fishmeal content of fish diets (Shiau et al.1987; Dong et al, 1993).
This has resulted again in another search - a close substitute to
fishmeal, of lower cost and more readily available animal protein.
Poultry by-product meal (PBM) has been reported as a successful
replacer of fish meal (Higgs, 1979; Fowler, 1981a,b; 1982; 1991;
Steffens, 1994). Blending with soybean meal has been postulated to
result in economic improvement of soybean meal based diets
(Mohsen and Lovell, 1990). A readily available poultry product -
poultry meat meal (PMM) was therefore blended with soybean flour
(SF) a t 25:75; 50:50 and 75:25 (SF:PMM) as sole protein source or
partial replacer of fishmeal in the diets of Oreochromis niloticus and
Clarias gariepinus. A good biend of SF and PMM as in diet II (50:50)
gave an improved amino acid balance.
Feeding trials in Chapter Six show high levels of inclusion of soybean
flour as in the reference diet and diet I (75:25) increased the risk of
methionine deficiency and leucine excessiveness in both O.niioticus
and C. gariepinus while that of PMM as in diet Hi (25:75) increased the
risk o f phenylalanine deficiency in C. gariepinus {Tables 6.3. and 6.6).
236
Excesses of certain EAAs like leucine have been reported to exert
toxic effects in fish (Hughes, Rumsey and Nesheim, 1984; Robinson,
Poe and Wilson, 1984). Infact, Cho et al. (1991) reported toxicity of
leucine in rainbow trout (Oncorhynchus. mykiss) when present in
excess of 13.4% i.e 113.4% of the requirement level. This could militate
against high inclusion levels of SF and PMM in an ideal SF:PMM blend
based diet for O.niloticus and C.gariepinus.
Fishmeal replacement potential of SF was also improved by the
incorporation of PMM into SF as blends. A 25% replacement of
fishmeal using 75:25 SF:PMM blend based diets (diet VII) was found
most suitable for the intensive culture for O.niloticus (Table 7.2). Diet VII
was higher in soybean flour than poultry meat meal. This suggests a
marginal level of incorporation of poultry meat meal in soybean flour
to give optimum performance of the diets in O. niloticus. In C.
gariepinus, diet V did equally well as the control diet. Diet V was a
50:50 blend of soybean flour and poultry meat meal replacing 25%
fishmeal (Table 7.5). This suggests an equal level of incorporation of
poultry meat meal in soybean flour to give optimum nutrient balance
and good performance of the fish on the diets. Poultry by-product
meal on its own has been postulated to successfully replace fish meal
a t >50% level without compromising performance of Chinook salmon
(Fowler, 1991). Blending with SF was found beneficial for the intensive
culture of both O.niloticus and C.gariepinus as favourable
237
performance parameters were observed in both experiments
reported in Chapter Seven.
In terms of amino acid balance, methionine was the first limiting EAA
in the diets. Improvement of soybean flour based diet was therefore
achievable by the incorporation of methionine-rich poultry meat
meal. It was evident that addition of poultry meat meal ameliorated
methionine and available lysine deficiency, and reduced leucine,
and the risk of its toxicity. The better performance of diet VII than the
control is not absolutely in agreement with the speculations that poor
nutrient utilisation and growth response were linked to methionine
defic iency. Only the superiority of the control diet in C. gariepinus
could be attributed to better methionine level, as it had the highest
methionine and the least leucine, but that diet V, lower in methionine
than diets VIII, IX and X, was its closest rival put this to further question.
Performance of the blends in partial replacement of fishmeal could
not therefore be linked to methionine. It could be due to factors not
studied in these experiments and therefore worthy of further
investigation.
Despite the marked differences in performance of both fish with
different replacement and blending levels, values for nutrient
utilisation parameters were favourable for all diets depicting the
possibilty of replacing fish meal up to 75% with any of the blends
238
successfully. Improvement of fish meal replacement levels with
soybean flour was therefore achieved by the incorporation of poultry
meat meal in both fish. It is evident from the foregoing that partial
replacement of fishmeal with any of the blends does not require EAA
supplementation, but utilisation of blends higher in either SF or PMM as
sole source of protein require EAA supplementation, particularly
methionine. An attem pt was therefore made to supplement the diet
with methionine from natural and synthetic sources.
Poultry Meat Meal is a good natural source of methionine and
improved diet methionine level when blended. In addition,
supplementation of crystalline methionine was investigated in feeding
trials in Chapter Eight. Methionine supplementation was beneficial to
SF:PMM blends utilisation in the diets of O.niloticus and C.gariepinus.
50:50 SF:PMM blend with 0.5% methionine supplementation was best
utilised by both species. The phenylalanine requirement of O. niloticus
was met in some of the diets while the level in others was not critical,
that of methionine was greatly improved. The good performance of
50:50 SF:PMM could be attributed to overall essential amino acid
balance of the d ie ts . In C. gariepinus, a good balance of methionine
and phenylalanine justifies the 50:50 blending of SF and PMM as 75:75
and 25:75 SF:PMM aggravates methionine and phenylalanine
deficiency respectively. Viola et al. (1982), Tacon et al. (1984) and
Murai et al. (1986) recorded improved growth in carp, Oreochromis
239
niloticus and channel catfish respectively when fed soybean
containing diets with methionine supplementation.
Blood plasma methionine dynamics showed highest methionine
peaks in fishes fed diets without methionine supplementation at six
hours after feeding. The lower methionine peak recorded for the diets
with methionine supplementation at six hours may have been a result
of premature absorption of the free amino acids in the diets including
the supplemented synthetic methionine which has been reported to
be related to the proportion of peptides and free amino acids in the
d ie t . In addition, premature absorption and metabolism of certain
EAAs such as methionine , arginine, isoleucine, leucine and valine
occurs in the first three to six hours (Hardy, 1991), Much of the
methionine in the supplemented diets would have been metabolised
a t six hours and beyond, thereby giving them the lower level
recorded. This was not found to adversely affect nutrient utilisation in
contrast to an earlier finding with poorer growth of salmon fed fish
silage diets than with fishmeal diets. This was as a result of better
balance of essential amino acid in the plasma (BEAAP) in fishmeal
without premature absorption of EAAs (Hardy, 1991).
Feeding trials In Chapter Nine depict that mineral reconstitution of
diets based on 50:50 SF:PMM blend (optimum blend) for both
O.niloticus and C.gariepinus did not markedly affect nutrient utilisation
240
and growth response. However, tissue deposition of some minerals
related significantly with their levels in the diets. In O.nilotlcus, carcass
deposition of phosphorus was highest in diet I (+Ca, P, Mg and Zn)
and lowest in diet V (-Ca, P, Mg and Zn) and this reflected the dietary
inclusion level of phosphorus with a strong positive correlation.
Carcass calcium and phosphorus were high in C.gariepinus fed diets I
and III (-Mg), and lowest in diet V because of their high and low levels
in the diets respectively (Tables 9.3 and 9.5). Only dietary calcium had
strong positive correlation with carcass calcium (p<0.05), This may be
due to the structural requirement of calcium by C.gariepinus,
There was oversupplementation of phosphorus in the diets for
O.nilotlcus. Its dietary supplementation should be minimised and this
will in turn reduce feed cost (Davis and Gatlin , 1991) and protect the
fish evironment from phosphorus pollution, supplementation of
Phosphorus in the mineral premix is not a dear necessity as it could be
spared by magnesium. However, in C.gariepinus, it was evident that
calcium and phosphorus supplementation would be necessary as
supplementation of calcium in the basal diet appeared to inhibit
phosphorus bioavailability (Davis, 1990).
Petpxifioation of soybean flour (SF) through heat processing
enhanced SF:PMM blend based diets utilisation by O.d\ot\ous and
241
C.gariepinus as reported in Chapter Ten. It reduced the level of II
activity to residual level In diets containing autoclaved soybean flour
(diets V-VIJI), Incorporation of PMM had similar e ffec t particularly in
diets I - III (containing raw SF). PMM is also a good source of lysine. This
compensated for lysine loss through autoclaving of soybean in diets
V-VII. Heat processing of soybean meal was obseryed to enhance
growth and protein efficiency ratio in channel catfish with reduction in
trypsin inhibitor activity level (Wilson and Poe, 1955).
Lastly, developing environmentally friendly diets is increasingly
becoming a policy by feed manufacturers to promote the market
value o f their products. Such diets are highly digestible, -metabolisable
and generating less waste in aquaculture operation. To achieve this,
careful selection of ingredients of high nutrient digestibility and
utilisation is desirable. Feedstuffs used in this research are fishmeal,
defatted soybean flour, poultry m eat meal and wheat flour. Chapter
Pour presents the nutritive value o f the feedstuffs indicating their
digestibilities. SF:PMM blend based diets, availability of amino acids in
th e blend based diets were studied and reported in Chapter Five,
high digestibility values were obtained for the dry matter, protein, lipid
and ash o f "these feedstuffs. Piets formulated from these using SF:PMM
biends similarly had high nutrient digestibilities in both fish species -
particularly protein and lipid, thereby generating little'nitrogenous
waste. Piets used in this research could therefore be 'Considered to b e
environmentally friendly, of good quality and market vqlue.
OHAPT£R THIRTEEN
eommtm aw mzommmrnm
2 4 3
In conclusion, the following objectives have been achieved:
i Differences were observed in dry matter, protein lipid and ash
digestibility in O.nilotlcus and C.gariepinus. ADC of dry matter,
lipid and ash were high while those of ash for soybean flour
(SF), poultry meat meal (PMM) and wheat flour (WF) were
relatively lower in O.niioticus. in C.gariepinus, ADCs of dry
matter, lipid and ash were high while those of protein for the
three ingredients were relatively lower.
ii There were differences observed In nutrient digestibilities,
apparent amino acid availabilities and nitrogenous waste
generation potential of SF:PMM blend based diets In O.nilotlcus
and C.gariepinus. Lipid digestibility was highest while ash was
lowest for both fishes. Except for ash, nutrient digestibilities were
highest In diets with 0,5% Cr20 3 than with 1,0% wfth lets
nitrogenous waste in the former than the later,
i There was nutritional Improvement of soybean flour wffh the
Incorporation of PMM as blends and fia t §&JGQ SRPMlMS was
found to be optimum for the intensive culture of Ojtfottcwm d
C.gariepinus,
244
iv There was successful 75% replacement of fishmeal with any of
the blends, though 25:75 SF:PMM replacing 25% was best for
O.nilotlcus and 50:50 SF:PMM replacing 25% was pest for
C.gariepinus.
v Methionine supplementation of the blend based diets did
marginally improve nutrient utilisation - particularly the
methionine supply from PMM to SF.
vi Mineral premix reconstitution did not -markedly alter nutrient
utilisation of the optimum blend by both species. However, it
was suggested that phosphorus could be saved in the diets of
O.niioticus as it appeared to be spared by magnesium.
yii -Heat processed SF had residual level of trypsin inhibitor or
phytate phosphorus. Blending SF with PMM increased
methionine and reduced leucine in SF:PMM blond based diets.
Therefore autoclaving and blending enhanced SF utilisation in
the diets o f -both species.
finally, other lo w cost animal proteins and opmpieraentary p lan t
proteins should b e similarly studied to develop a variety o f pnimal-
pnim pl protpin, plant-animal protein and p lan tp lantprp te inb lends as
-suitable alternatives to fishmeal in the diets of aquaculture species.
,245
As a postscript, the CHNSO method of-nitrogen dermination was
tested and found suitable and recommended for protein
determination, particularly when dealing with miorpsgmpie size. It
requires only 5mg sample. Results o f protein content o f some
■feedstuffs using CHNSO Analyser ;2400 model andmicra-kjeidahl
technique are presented in Appendix 1.
REFERENCES
A.O.A.C. (1990). Official Methods o f Analysis (15 th egl.) Heldrich.Association of Official Analytical Chemists, Virginia, U-8 A. 1298pp
Abel, H. J., Becker, K„ Meske, C.H.R. and Friedrich, W. (1984),Possibilities of using heat treated full fa t soybeans in carp feeding. Aquaculture, 42:97-108.
Adesimi, A.A, and Aderinola, E.A. (1983). Economic analysis of fish import demand in Nigeria. In : Proceedings o f the Third Annual Conference, Fisheries Society o f Nigeria, pp. 159-169
Akiyama, D M (1991). The use of soybean products and other plant protein supplements in aquaculture feeds. In: Proceedings o f the Aquaculture, Feed Processing and Nutrition Workshop. Thailand and Indonesia, pp. 199-206,
Alexandratos, N.,(ed.) (1988). World Agriculture; Towards 2000 : A FAQ Study. New York University Press, New York.
Allen, S. (1989). Chemical Analysis o f Ecological Materials -2nd ed, Blackwell Scientific Publications. London, pp. 134-141,
Aimquist, -H.J. and Maurer, S. (1953). A method for study of the effects of heat on nutritive value o f soybean oil -meal. Poultry Sci. 32:549-550.
Andrews, J.W., T.Muira, and C Campbell (1973). Effect o f dietary caicium and phosphorus on growth, fpodd conversion, bone ash and haematological Irevels of catfish. J.Nutr., 103:766-771
Araba, M. and Dole, N.M. (1990), Evaluation of protein solubility as anindicator of overprocessing of soybean meat Poultry Sci. 69:76-83
-Balari-n, J.Q. (1984). Towards an integrated approach to tilapia farming in Africa. The Courier, 85: 82.84
'-Baiqrin, J.Q. and Hatton, J.P. (1979), Tilapia: a guide to their-biology and culture inqfriog. University of Stirling, Stirling, Scotland. 174 pp,
&gipgun, A M and Qloghodo, A.Q. (1988). grow th performance and ' -nutrient utilisation o f f inserting Igrips^qriepinus OuFphpll) fed raw
and -oppked soybean -diets. Aquaculture, 76:11-9-126.
SpriowcS. (198^), Fishmeal - World-outlppk to the year2000. Fish Farmer.-pp49-43.'
248
Bender, A.E. and Miller, D.S. (1953). A new brief method of estimating net protein value. Biochemical Journal 53:vii
Birk, H.R., Boucher, R.V., Caskey Jr, C.D., Hayward, J.W. and Hunter, J.E. (1947). Urease activity and other chemical criteria as indicators of inadequate heating of soybean oil meal. J. Official Agric. Chemists, 30:354-364.
Bondi, A.A. (1987). Animal Nutrition. John Wiley & Sons, New York. 540pp.
Boorman, K.N.(1980). Dietary constraints on nitrogen retention. In: Protein Depositionin Animals (P.J. Bauttery and Lindsey, D.B. - eds.). Butterworths, London, pp. 147-166
Bowen S.H. (1978) Chromic acid assimilation studies-a caution. Trans. Am. Fish. Soc. 107, 755-756
Brown, M.E. (1957). Metabolism. In : The Physiology o f fishes, Vol. 1 Academic Press. New York.
Buckley, R. (1993). Soybean-rich in protein : Feeding the World- The importance of wheat and soybean. Understanding Global Issues, 3/93:4-7
Caskey, C.D. and Knapp, F.(1944). Method for determinating inadequately heatyed soybean meal. Ind. Eng. Chem. (Anal, ed.), 16:640-641.
Castell, J.D. (1979). Review of lipid requirements of finfish. In: Finfish Nutrition and Fishfeed Technology, Proceedings of a World Symposium, Hamburg, Germany, vol. 1:59-84
Chackroff, M. (1987). Freshwater Fish Pond Culture and Management. Scientific Publishers. Delhi, India, pp.33-52.
Chamberlain W.G., 1993. Aquaculture trends and feed projections. World Aquaculture Magazine, 24(1): 1929.
Chinabut, S. Limsuwan, C. and Kitsiwat, P. (1991). Histology o f the Walking Catfish, Clarias batrachus. IDRC, Canada, 96pp.
Cho C.Y.(1991) Digestibility of feedstuffs as a major factor in aquaculture waste management. In: Fish Nutrition in Practice, Biarritz (France), ed. INRA, 1993, Paris, (Les Collogues, No. 61)
Cho, C.Y. (1993). Digestibility of feedstuffs as a major factor in aquaculture waste management, INRA, Paris, p. 360-374
Cho, C.Y. and Cowey, C.B. 1991. Utilisation of different levels of ascorbyl monophosphates by rainbow trout (Cncorhynchus mykiss). Paper
249
presented at The IV International Symposium on Fish Nutrition and Feeding. Biarritz, France.
Cho C.Y., Cowey C.B. and Watanabe T. (1985) Finfish Nutrition in Asia: Methodological Approaches to Research and development. IDRC, Canada. 154pp
Cho, C.Y. and Kaushik, S.J. (1990). Nutritional energetics in fish:Energy and protein utilisation in rainbow trout (Salmo gairdneri).
Cho, C.Y., Slinger, S.J., and Bayley H.S. (1982). Bioenergetics of salmonid fishes, energy intake, expenditure and productivity. Comp Biochem Physiol. 73B, 25-41
Cowey, C.B. and Tacon, A.G.J. (1981). Fish nutrition - relevance toinvertebrates. 2nd International Conference on Aquaculture Nutrition, Biochemical Approaches to Shellfish Nutrition. Univ. of Delaware.
Crowther, B. (1990). U.S. demand for fish meal. Proceedings o f theInternational Conference on Fish By-products, Alaska Sea Grant Program, Fairbanks - Keller, S. (ed.). pp. 57-60.
Csavas, I. (1990). Aquaculture development and environmental issues in developing countries of Asia, In: Conference on Environmental Issues in Third World Aquaculture Development. Bellagio, Italy.
Dabrowska, H, K. Meyer-Burgdorff, and K.D. Gunther (1989). Interactions between dietary protein and magnesium levels in tilapia (Oreochromis niloticus). Aquaculture 76: 277-291.
Dabrowska, K., Poczyczynski, p., Kock, G. and Berger, B. (1989). Effect ofpartially or totally replacing fish meal protein by soybean meal protein on growth, food utilization and proteolytic enzymes activities in rainbow trout (Salmo gairdneri). New in vivo test for exocrine pancreatic secretions. Aquaculture, 77,29-49.
Dada, B.F. (1975). Present status and Prospects for aquaculture in Nigeria. In: Symposium on Aquaculture in Africa, Accra, Ghana. FAO, CIFA/T4 (suppl.l). pp.79-85.
Davies, S.J. Nengas, I. and Alexis, M. (1993). Partial substitution of fishmeal with different meat meal products in diets for sea bream (Sparus aurata). Fish Nutrition in Practice. Biarritz (France), INRA, Paris, pp. 907-
Davies, S.J. Williamson, J. Robinson, M. Bateson, R.l. (1990). Practical inclusion levels of common animal by-products in complete diets for tilapia (Oreochromis mossambicus, Peters). In: The Current Status of Fish Nutrition in Aquaculture, Proceedings o f the Third International
250
Symposium on Feeding and Nutrition in Fish (Takeda, M and Watanabe, T.- editors), Toba, Japan, pp. 325-332.
Davis, D.A.(1990). Dietary mineral requirements of Penaeus vannamei: evaluation of the essentiality for thirteen minerals and the requirements for calcium, phosphorus, copper, iron, zinc and selenium. Ph.D Dissertation, Texas A. & M.University, college station TX, U.S.A.
Davis, D.A. and Gatlin III, D.M. (1991). Dietary mineral requirements offish and shrimp. Proceedings o f the Aquaculture, Feed Processing and Nutrition WorkshopA9-67
De Silva S.S. & Perara M.K. (1983) Digestibility of an aquatic macrophyte by t he cichlid Etroplus suratensis with observations on the relative merits of three indegenous components as markers and daily changes in protein digestibility. J. Fish Biol. 23, 675-684
De Silva S.S., Shim K.F. and Khim Ong A.(1990) An evaluation of the method used in digestibility estimations of a dietary ingredient and comparisons on external and internal markers, and time of faeces collection in digestibility studies in the fsh Oreochromis aureus Steindachner). Reprod. Nutr. Dev. 30, 215-226.
De Silva and Anderson (1995). Fish Nutrition in Aquaculture. Chapman and Hall. pp. 103-142.
Dong, F.M., Hardy, R.W., Haard, N.F., Barrows, F.T., Rasco, B.A., Fairgrieve,W.T. and Forster, I.P.(1993). Chemical composition and protein digestibility of poultry by-product meals for salmonid diets.Aquaculture, 116,149-158
Dorsal, W.J., Robinette, H.R., Robinson, E.H. and Poe, W.E. (1982). Effects of dietary cottonseed meal and gossypol on growth of young channel catfish. Trans Amer. Fish. Soc., 3:651-655.
Duncan, D.B. and Bender, A.E. (1955). Multiple range and multiple F-test. Biometrics, 11:1-42.
Ezenwa, B. (1975). Fish seed production in Nigeria. In : SymposiumAquaculture in Africa., Technical Paper FAO, CIFA/T4 Suppl.l, Rome, p p 441-449.
FAO (Food and Agriculture Organisation)(1992). Aquaculture Production, 1984-1990. FAO Fisheries Circular No.815, Revision 4 (FIDI/C815-Rev.4).206pp.
251
FAO (Food and Agriculture Organisation)(1991a). Aquaculture Production 1986-1989, FAO Fisheries Circular No.816, Revision 3 (FIDI/C816-Rev.3).216pp,
FAO (Food and Agriculture Organi$ation)( 1991b). African Fisheries and the Environment. FAO Regional Office for Africa (RAFR/91/Q2). 26pp
FAO (Food and Agriculture Organi$ation)(1994), Aquacuiture Production, 1986-1992. FAO Fisheries Circular No.815, Revision 6 (FIDI/CS18-Rev 6).216pp.
FAS (Foreign Agricultural Service) (1991). World oilseeds production, U.S.Department of Agriculture Circular Series, WAP 8-9, Washington D.C.29 and 34.
Fordiani, T.R, and Ketola, H.G, (1980). Effects of heat treatment on first limiting amino acids of soybean meal in trout diets. 72nd Ann, Meet, Ammer.Soc, Animal Sci, p. 196
Forster I. P., 1993. Chemical composition and protein digestibility o f poultry by-product meals for salmonid diets.Aquaculture, 116:149-158
Fowler L.G., 1981a, Tests o f Vegetable Protein Replacements and Alternate Ingredients in Abernathy Diet Abernathy Salmon Cultural Development Centre, Tech. Transfer Ser. No. 81-1, I4p,
Fowler L.G., 1981b. Effects o f Lipid and Amino Acid Suppiemention inChinook Salmon Diets Containing Poultry By-products Meal. Abernathy Salmon Cultural Development Centre, Tech,Transfer Ser. No 81-3, 12p.
Fowler LG., 1982. 1981 Tests with Poultry by-Product Meal in Fall Chinook Salmon Diets. Abernathy Salmon Cultural Development Centre, Technical Transfer Ser. No. 82-1, 13p
Fowler, LG. (1991). Poultry by-product meal as-dietary protein source in fall Chinook salmon diets. Aquacuitrure, 99,309-321
Furukawa, A. and Tsukahara, H. (1966), On the acid digestibility method for the determination o f chromic oxide as an index substance in the study o f digestibility of fish feed. Bull. Jpn, Soc. Sci. Fish. 32(6):502-506.
Gallagher, M.L. and Degani, G. (1988). Poultry meal and poultry oil as sources o f protein and lipid in the diet o f European eels (Angu///a qnguillq). Aquacuiture, 73: 177-187,
Gatlin III, G M g o d Wilson, R.P. {T983). Dietary zinc requirement of fingeriing channel catfish. J, Nutr,, 113)630-635.
252
Gatlin III, D.M. and Wilson, R.P. (1984a). Zinc supplementation of practical channel catfish diets. Aquaculture, 41:31-46.
Gatlin III, D.M. and Wilson, R.P. (1984b). Studies on the manganeserequirement of fingeriing channel catfish. Aquaculture, 41 : 85-92.
Gestler, A., Birk, Y. and Bondi, A. (1967). A comparative study of thenutritional and physiological significance of pure trypsin inhibitors and of ethanol-extracted soybean meals in chicks and rats. J.Nutr., 91:358- 370.
Gestetner, B., Birk, Y. Bondi, A and Tencer, Y. (1966). Soybeans saponins VII : A method for determination of sapogenin and saponin content in soybean. Phytochemistry, 5:803-806.
Goihl, J. 1987. Heat treatments affect feeding value of soybean meal, Feedstuffs, 59(51): 16
Grant, J. (1989). Fishmeal: What is it doing to the price of feed? Canadian Aquaculture, 5(4):64-68.
Halver, J.E. (ed.)(1989). Fish Nutrition, 2nd ed. Academic Press, New York.
Hammerstrand, G.E., Black, L.T.and Glover, J.D., 1981. Trypsin inhibitors in soy products:modification of standard analytical procedure. Cereal Chem., 58:42-45
Hardy, R.W. (1991). Fish hydrolysates: Production and use in aquaculture feeds. Proceedings of the Aquaculture Feed Processing and Nutrition Workshop, pp. 109-115
Hardy, R.W. and Masumoto, T. (1990). Specification for marine by-products for aquaculture. In: Proceedings o f the International Conference on Fish By-products, Alaska Sea Grant Program, Fairbanks - Keller, S.(ed.).pp. 109-120.
Haylor, G.S. (1993). Controlled hatchery production of African catfish, Claries garieplnus (Burchell): an overview. Aquaculture and Fisheries Management, 24:245-252.
Higgs, D.A., Markert, J.R., Macquarrie, D.W.,McBride, J.R,Dosangh,B.S.,Nichols,C. and Hoskin, S.G. (1979).Developmentof practical diets for coho salmon Oncorhynchus kisutch, using poultry by-product meal, feather meal, soybeanmeal and rapeseed meal as major protein sources. In: Finfish Nutrition and Fish Feed Technology - Voi 2 - Halver, J.E and Tiews, K. (eds.). Heenemann GmbH & Co. Berlin, pp. 191-218.
253
Hsu P., Graham, W.D., Carver, J.S. and McGinnis, J, (1949). Correlation of nutritive value for chicks of autoclaved soybean meal with fluorescence, browning and sticky droppings. Poultry Sci., 28:780.
Hughes,S.G., G.L.Rumsey and M.C. Neshiem, (1984). Effects of dietary excesses of branched-chain amino acids on the metabolism and tissue composition of lake trout (Salvelinus namaycush). Comp. Biochem. Physiol„ 78A, 413-418
Huisman, E.A. (1986). Current status and role of aquaculture with species reference to the African region. In: Aquaculture Research in the African Region (E.A. Huisman, ed.). PUDOC, Wageningen, The Netherlands. 11-22pp.
IAFMM (International Association of Fish Meal Manufacturers) (1990). World fishmeal production down. Feedstuffs, 62(25):7.
IAFMM (1991). World production of fishmeal drops. Feedstuffs, 63(11): 18.
IITA (International Institute for Tropical Agriculture) (1990a). Making a home for the soybean in Africa. IITA Annual Report, pp. 14-16.
IITA (1990b). Soybean for Good Health : How to Grow and Use Soybeans in Nigeria. IITA, Nigeria. 23pp
IITA (1990c). Soybean Research a t IITA. IITA, Nigeria. 19pp.
IITA (1991). A soybean production surge in Nigeria: How policy can promote the right technology at the right time. IITA Annual Report, pp. 11-13.
Ita, E.O. (1975). Observation on the present status and problems of inland fish culture in some northern states of Nigeria and preliminary results of cage culture experiments in Kainji Lake, Nigeria. In: Symposium on Aquaculture, Accra, Ghana. FAO. CIFA/T4 (suppl.l). pp.241-247.
Ita, E.O. (1986). Reservoir, lake and river fisheries management andinvestment opportunities. In: Fish Enterprise and Information Bronchure, Kainji Lake Research Institute, New Bussa, pp. 3-7.
Ita, E.O. (1993). Inland Fishery Resources o f Nigeria. CIFA occasional paper No.20 (CIFA/OP20), FAO, Rome. 120pp
Ita, E. O., Sado, E.K., Balogun, J.K., Pandogari, A. and Ibitoye, B. (1985).Inventory survey o f Nigeria inland waters and their fishery resources. 1. A preliminary checklist o f inland water bodies in Nigeria. Kainji Lake Research institute Technical Report Series No. 14 KLRI, New Bussa, Nigeria.
254
Jackson, A.J., Capper, B.S. and Matty, AJ. (1982). Evaluation of some plant proteins in complete diets for the tilapia Sarothrodon mossambicus. Aquaculture, 27,97-109.
Jaffe, W.G. (1980). Hemagglutinins (Lectins). In: Toxic Constituents o f Plant Foodstuffs (Liener, I.E. ed,). Academic Press, London, pp. 73-102.
Jauncey, K. 1993. Advances in freshwater fish nutrition. In : Conference, Feed Production Tomorrow II, Victam International. Bangkok,Thailand.26pp.
Jauncey, and Ross, B. 1982. A Guide to Tilapia Feeds and Feeding. Institute of Aquaculture, University of Stirling, Stirling, U.K. 111pp.
Jauncey, K. Tacon, A.G.J. and Jackson, AJ. (1983). The quantitative essential amino acid requirements of Oreochromis niloticus ( - Sarotherodon mossambicus). Proceedings o f International Symposium on Tilapia in Aquacuiture . Nazareth - Israel, pp. 328 - 337.
Jobling M. (1983) A short review and critigue of methodology used in fish growth and nutrition studies. J. Fish. Biol. 23, 685-703
Kakade, M.L., Hoffa, D.E., Liener, I.E., 1973. Contribution of trypsin inhibitors to the deleterious effects of unheated soybean fed to rats. J. Nutr., 103:1772-1778
Kakade, M.L., Rackis, J.J., McGhee, J.E, and Puski, G. (1974), Determination o f trypsin inhibitor activity of soy products: A collaborative analysis o f an improved procedure. Cereal Chem„ 51:376-382.
Kanazawa, A., Teshima, S., Sakamoto, M. and Awal M.A, (1980).Requirements of Tilapia zillii for essential fatty acids. Bull. Jpn. Soc. Sci. Fish., 46:1353-1356.
Kratzer, F.H., Bersch, S., Vohra, P. and Ernst, R.E. (1990). Chemical and biological evaluation of soybean flakes autpclaved for different durations. Anim. Feed. Sci. Techno!. 31:247-259.
Kytty, M.N. (1986). Aquaculture development training in Africa, in:Aquacuiture Research in the African Region (E.A. Huisman ed-), PUDOC, Wageningen, The Netherlands, pp. 23-29.
Liener, l,E. (1981). Factors affecting the nutritional quality o f soya products. J Am. QiiChem. Sqc., 58:406-415.
Lim, C. (1992). Full fa t soybean meal Utilization by f ish. Asian Fisheries Science, 5,181 -187,
255
Urn, C. and Akiyama, D.M. (1989). Full-fat soybean meal utilisation. In: Proceedings o f the People's Republic o f China, Aquaculture and Feed Workshop. American Soybean Association. U.S.A. pp. 164-188.
Urn, C. and Dominy W., 1989. Utilization of plant proteins by warmwater fish. ln:Applenwhite(ed). Proceedings of the World Congress on Vegetable Protein Utilization in Human Foods and nimal Feedstuffs. American Oil Chemists' Society, Champaign, lllinos. 245-251.
Urn C. and Dominy W., 1990. Evaluation of soybean meal as a replacement in diets for shrimps(Penaeus vannamei). Aquaculture, 86:401-an meal as a replacement 407.
Lo, G.S., Settle, S.L., Steinke, F.H. and Hopkins, D.T. (1981). Effect of phytate : Zinc molar ratio and isolated soybean protein and zinc bioavailability. J.Nutr., 111:2223-2235.
Lovell, R.T. (1977a). Diet formulation in catfish feeds In: Nutrition and feeding of channel catfish - Stickney, R.R. and Lovell, R.T. (eds.), Southern Cooperative Series Bulletin 218, Auburn University, Alabama.
Lovell, R.T. (1977b). Mineral requirements. In: Nutrition and feeding of channel catfish - Stickney, R.R. and Lovell, R.T. (eds.). Southern Cooperative Series Bulletin 218, Auburn University, Alabama, pp. 30-32.
Lovell, R.T. (1978). Dietary phosphorus requirement of channel catfish. Trans. Am. Fish. Soc., 107:617-621.
Lovell, R.T. (1989). Nutrition and Feeding of Fish. Van Nostrand Reinhold, New York, U.S.A. 260pp.
Lovell R.T., 1990. Use of soybean products in diets for aquaculture species: revised - Soybean Utilization Alternatives. Bulletin o f American Soybean Association. Centre for Alternative Crops and Products, University of Minnesota, U.S.A. 16pp.
Loveli, R.T. (1991). Use of soybean products in diets for aquaculture species: revised. In: Proceedings o f the Aquaculture, Feed Processing and Nutrition Workshop. Thailand and Indonesia, pp. 173-187.
Lovell, R.T. and Stickney, R.R. (1977). Nutrition and Feeding o f Channel Catfish. So. Coop. Bull. 218.
Maar, A., Mortimer, M.A.E. and Van Derlingen, I. (1966). Fish culture in Central East Africa. FAO/UN, Rome. 158pp
Mangalik, A. (1986). Dietary energy requirements for channel catfish. Ph.D dissertation. Auburn University, Auburn, Alabama.
256
Maynard L A , Loosii J,K„ Hintz R F. and Warner R.G, (1979) Animal Nutrition 7th ed., McGraw-Hill, New York, 620pp
Miller, D.S. and Bender, A,£, (1955). The determination o f the ne t protein utilisation by a shortened method, British Journal o f Nutrition, 9:382 - 388.
Mohsen, A.A, and Lovell, R.T. (1990). Partial substitution o f soy-bean -meal with animal protein sources in diets for channel catfish. Aquaculture, 87:53- 63
Moran, £.T. Jr, Jensen, L.S. and McGinnis, J., (1963). Dye-binding-by soy-bean and Tish meal as an index o f quality. J. Nutr, 79:239-244.
Murai, T„ Ogata, H. and Nose, T. (1932). Methionine coated with various materials supplemented to soy-bean meal -diet for fingeriing carp (Cyprmus oorpio) and channel catfish (ictalurus punctgtus). Bull. Jpn. Boo. Bci. fish., 48(1): 85.
Murai, T., Ogata, H.,Kosutabgk/ P. and Aral, S, (1986). Effects of amino acid supplementation-and methanpI treatment in utilisation of soy flour b y fingeriing carps. Aquaculture -56: 1-97-206,
NRC (1983). Nutrient requirement o f wqrmwqter fishes a n d shellfishes, National Academy Press, Washington, DC., 102pp
NRC (T993). Nutrient Requirements-of fish , National Academy Press, Washington, DC, -p p
-Nelson, T:S., :Ferrarg, L.W. and Storer, N.L. (1968). Phytatephosphprus content o f feed ingredients derived from plants. Ppuitry. 5c/.,47: 1372-1374.
New, M3. <1987), feed-and. feeding -offish -andShrimp, ADCP/REP/87/26, FAC/UNDP, Rome
New, MJ3, <1991). Turn of themilieniumaquaculture. World Aquacuiture, 22(3):^849,
:New, MB., Tacon, A .G J.andCsavas, I,<1993).:Farm-MpdeApuafeeds, pT^cRARA/AApCP, Bangkpk, pp. 1 23
iNg,C>,and Wee, X. <>98,9), The.nutritive vqlueptcgssqyq deafmeahimpeJlet " ' ' ^d<feed4qr.Nile tilapia. y\gppcu/fure,;83(l %)/Ap>£8.
'O'Dell, .B.L.pnd savage, J.E.<t960). Effect,of,phytic^gcid on zinoavailability. Prpc, '$pc. E /pt Biol.,lyied., 103:304-366.
257/ •
Oberleas, D., Munder, M.E. and O 'Dell B.L. (1962). Effects of phytic acid on zinc availability and parakeratosis in swine. J. Anim. Sci., 21:57-61.
Olomucki, E., and Bornsteia S.G. (1960). The dye absorption test for the evaluation of soybean meal quality. J.A.O.A.C. 43: 440-441.
Osborne, T.B., Mendel, L.B. and Ferry, E.L. (1919). A method for expressing numerically the growth promoting value of proteins. Journal o f Biological Chemistry, 37:223-224
Osho, S.M. (1991). Soybean as food in Nigeria : Training manual. A National Workshop on Soybean Processing and Utilisation for Women Groups in Nigeria. IDRC/IITA 50pp.
Osyajuyide, O. (1981). Public investment in fishery development in Nigeria. M.Sc Thesis. Department of Agric. Econs., University of Ife, lle-lfe, Nigeria.
Pascual, F.P. and Penaflorida, V. (1979). The extraction of mimosine from ipil ipil (Leucaena leucocephala) by soaking in water. Aquaculture Department, SEAFDEC Q. Res. Rep. 3(3):4-6.
Popma, T.J. (1982).Digestibility of selected feedstuffs and naturally occuring algae by Tilapia. Ph.D. dissertation. Auburn University, Auburn, AL.
Pryde, E.H. (1983). Nonfood uses of vegetable oils. In: Hanbook o f Processing and Utilisation in Agriculture, Vol IhPart 2 (ed.I.A Wolff). CRC Press, inc., Boca Raton, Florida, pp. 3-14
Rackis, J.J. (1965). Nutritional properties of soybean protein : Physiological properties of soybean trypsin inhibitors and their relationship to pancreatic hypertrophy and growth inhibition of rats. Nutrition Symposium. Northern Regional Research Laboratory. Peoria, Illinois. Federation Proceedings, 24:1488-1493.
Rackis, J.J. and Gumbmann, M.R., 1979. Protease inhibitors: physiologicalproperties and nutritional significance. Symposium on antinutrients and natural toxicants in foods. Am. Chem. Soc. Jpn. Chem. Congress, Flonolulu, Hawaii.
Rackis, J.J., McGhee, J.E. and Booth, A.N. 1975. Biological threshold levels of soybean trypsin inhibitors by rats bioassay. Cereal Chem. 52:85-92.
Ratafia, M.(1995). Aquaculture today: a worldwide status report. World Aquaculture Magazine, 26(2): 18-24.
Reed, W., Burchard, J., Hopson, A.J., Jennes, J. and Yaro, I. (1969). Fish and Fisheries o f Northern Nigeria. Min. of Agric. Northern Nigeria. 226pp.
258
Roberts, M.B.V. (1980). Biology: A Functional Approach -2nd ed. Thomas Nelson & Sons ltd, London, pp.81-92
Roberts, R.J. 1989. Fish Pathology (2nd ed.). Bailliere Tindall, London, pp.375- 385.
Robinson, E.H., W.E.Poe and R.P. Wilson (1984). Effects of feeding diets containing an imbalance of branched-chain amino acids on fingeriing channel catfish. Aquaculture, 37,51-62
Robinson, E.H., S.D. Rawls, P.B. Brown, H.E. Yette, and L.W. Greene (1984). An estimate of the dietary calcium requirement of fingeriing Tilapia aurea reared in calcium-free water. Aquaculture 41:389-393.
Robinson, E.H., S.D. Rawls, P.B.Brown, H.E. Yette, and L.W. Greene (1986). Dietary calcium requirement of channel catfish Ictalurus punctatus reared in calcium-free water. Aquaculture 53:263-270
Robinson, E.H. and Wilson, R.P. (1985). Nutrition and feeding. In: Channel Catfish Culture - Tucker, C.S. (ed.). Elsevier, New York, pp.323-404.
Robinson, E.H., Wilson, R.P., Poe, W.E. and Grizzle, J.M., 1981. Effects of residual antinutritional factors in processed soybean meal on fingeriing channel catfish. Fed. Proc., Fed. Am. Soc. Exp. Biol,, 40:3705,
Rumsey, G.L. 1993. Fish meal and alternate sources of protein in fish feeds update 1993. Fisheries 18(7): 14-19.
Rumsey, K.R. and Ketola, H.G. (1975). Amino acid supplementation of caesin in diet of Atlantic salmon fry and of soybean meal for rainbow trout fingerlings. J. Fish Res. Bd Ca. 32:442-462.
Saad, C.R.B. (1979). Use of full-fat roasted soybeans in practical catfish diet, M.Sc Thesis, Auburn University. 30pp.
Sadiku, S.O.E. and Jauncey, K. (in press). Soybean flour - poultry meat meal blend as dietary protein source in practical diets of Oreochromis niloticus and Clarias gariepinus. Asian Fisheries Sci.
Sadiku S.O.E. and Jauncey, K. (1995).Digestibilty, apparent amino acid avail ability and waste generation potential of soybean flour-poultry meat meal blend based diets for Oreochromis niloticus (L.) fingeriing. Aquaculture Research. 26:651-658
Sandholm, M., Smith, R.R. Shih, J.C.H. and Scott, M.L. (1976).Determination of antitrypsin activity on agar plates : Relationship between antitrypsin and biological value of soybean for trout. J.Nutr. 106:761-766.
259
Santiago, C.B., Aldaba, M.B., Laron, M.A. and Reyes, O.S., 1988.Reproductive performance and growth of Nile tilapia (Oreochromis niloticus) broodstock fed diets containing Leucaena leucocephala leaf meal. Aquaculture, 70:53-61.
Santiago C.B. and Lovell R.T. (1988) Amino acids requirements for growth of Nile tilapia. J. Nutr. 118: 1540-1546.
Sargent J., Henderson R.J. and Tocher D.R. (1989) The Lipids : Fish Nutrition (2nd ed.) Halver, J.E. (editor). Academic Press inc., New york. pp. 153- 218
Satia, B.P. (1989). A regional survey of the aquaculture sector in Africa south of the Sahara. ADCP/REP/ 89/36. FAO/UNDP, Rome. 60pp.
Satia, B.P. (1990). National reviews for aquaculture development in Africa, 29.Nigeria. FAO Fisheries Circular No. 110.29. Rome, 193pp.
Saxena, H.C., Jensen, L.S. and McGinnis, J. (1963), Pancreatic hypertrophy and chick growth inhibition by soybean fractions devoid of trypsin inhibitor. Proc. Soc. Expt. Biol. Med., 112:101-105.
Shiau, S.Y., Chuang, J.L. and Sun, C.L. (1987). Inclusion of soybean meal in tilapia (Oreochromis niloticus x O. aureus) diets at two protein level, Aquaculture, 65,251-261.
Shiau, S.Y., Lan, S.F., Yu, S.L. Lin, A.L. and Kwok, C.C. (1990). Deffated and fullfat soybean meal as partial replacement s for fish meal in tilapia (Oreochromis niloticus x Oreochromis aureus) diets a t low protein level. Aquaculture, 86,401-407
Smith, R. R. (1976). Metabolizable energy of feedstuffs for trout. Feedstuffs 48(23):16-21.
Smith, R.R., Peterson, M.C. and Allfred, A.C. (1980). Effect of leachingonapparent digestion co-efficients of feedstuffs for salmonids, Prog. Fish- Cult, 42:195-199.
Snyder, H.E. and Kwoa T.W, 1987, Soybean Utilisation. Van Nostrand Reinhold, New York.
Spinelli, J. (1978). Unconventional feed ingredients for fish feed. In: Fish Feed Technology, FAO pp. 187-214.
Spinelli, J„ Houle, C.R. and Wekell, J.C. (1982), Effect o f phytafes on thegrowth of rainbow trout fed purified diets containing varying levels of calcium and magnesium. Aquacuiture, 30:71-83.
260
Starkey, T.J. (1990). Past, present and future markets in the United States for fishmeal, fish oil and fish solubles. Proceedings o f the international Conference on Fish By-products, Alaska Sea Grant Program, Fairbanks - Keller, S.(ed.).
Steele, R.G.D. and Torrie, J.H. (1960). Principles and Procedures o f Statistics. McGraw-Hill, New York. NY, 481pp.
Steffens, W. (1989). Principles o f Fish Nutrition. John Wiley & Sons, New York, pp.31-39
Steffens, W. (1994). Replacing fishmeal with poultry by-product meal in diets for rainbow trout, Oncorhynchus mykiss. Aquaculture, 124:27-34.
Stirling, H.P.(1985). Chemical and Biological Methods o f Water Analysis for Aquaculturists. Institute of Aquaculture, University of Stirling, p. 60-64.
Svobodova , Z. Pravada, D. and Palaskova, J. (1991). Unified Methods o f Haematological Examination o f Fish. Research Institute of Fish Culture and Hydrobiology, Vodany, Czechoslovakia, 31pp.
Tacon A.B.J., 1990. Standard Methods for the Nutrition and Feeding o fFarmed Fish and Shrimps. Redmond, W.A. Argent Laboratory Pres. 3-20
Tacon, A.B.J. (1991).Vitamin nutrition in shrimp and fish. In: Proceedings o f the Aquaculture, Feed Processing and Nutrition Workshop. Thailand and Indonesia, pp. 10-41.
Tacon, A.G.J. 1992. Nutritional Fish Pathology. Morphological Signs o fNutrient Deficiency and Toxicity in Farmed Fish, FAO Fish Technical Paper No.330.Rome, FAO. 75p
Tacon, A.G.J., Haaster, J.V., Featherstone, P.B., Kerr, K. and Jackson,A.J.(1983). Studies on the utilisation of full-fat soybean and solvent extracted soybean meal in a complete diet for rainbow trout. Bull.Jpn. Soc. Sci. Fish., 49(9): 1437-1443.
Tacon, A.G.J., Jackson, A.J. (1985). Utilisation of conventional andunconventional protein sources in practical fish feeds. In: Nutrition and Feeding in Fish - Cowey, C.B., Mackie, A.M. and Bell, J.G. (eds.). Academic Press. London.
Tacon, A.G.J., Jauncey, K., Falaye, A., Pantha, M., McGowan, L. andStrafford, E.A. (1983). Proceedings o f the International Symposium on Tilapia in Aquaculture, Nazareth, Israel, pp 356-365.
2 6 1
Tacon A.G.J., Rodtrigues A.M.P. (1984) Comparison of chromic oxide, crude fibre, polyethylene and acid insoluble ash as dietary markers for the estimation of apparent digestibility coefficients in rainbow trout, Aquaculture 43, 391-395
Tacon, A.G.J., Webster, J.L, and Martinez, G.A. (1984). Use of solvent extracted sunflower seed meal in complete diets for fingerlings rainbow trout (Salmo gairdneri Richardson). Aquacuiture 43:381-389,
Tiews, K., Koops, H., Gropp, J, and Beck, H. (1979). Compilation offish meal free diets obtained in rainbow trout (Salmo gairdneri) feeding experiments at Hamburg (1970-1977/78). In: Finfish Nutrition and Fish Feed Technology, Vol.2. - Halver, J.E, and Tiews, K.(eds.) Heenemann, Berlin, pp. 219-228.
Turnbull, T. (Personal Communication), Verterinary Clinician, Institute of Aquaculture, University of Stirling, Stirling
Van Kempen, GJ.M, (1993), Antinutritional factors in animal feed ingredients. Feed Mix, l(3):6-9.
Vanden Bossche, J.P. and Bernacsek, G.M., (1990). Source Book for the Inland Fishery Resources o f Africa: 2. Cl FA Technical paper No. 18/2. FAO, Rome, pp. 159-192,
Viola S. and Ariel!, Y. (1983). Nutrition studies with tilapia (Sarotherodon), 1. Replacement of fishmeal by soybean meal in feeds for intensive tilapia culture, Bamidgeh, 35/9-17
Vohra, P. and Kratzer, F.H. (1991). Evaluation of soybean meal determines adequacy of heat treatment. In: Proceedings o f the Aquaculture, Feed Processing and Nutrition Workshop. Thailand and Indonesia, pp, 225-241.
Viola, S., Mokady, S. and Arieli, Y., T983. Effects of soybean processingmethod on the growth of carp (Cyprinus carpio ), Aquacuiture, 32:27- 38.
Viola, S- Mokady, s. Rappoport, U. and Arieli, Y. (1982). Partial and complete replacement o f fish meal by soybean meal in feeds for intensive culture o f carp. Aquaculture 26:223-236,
Wee, x, and Wang, S.S, {1987), Nutritive value Of Leucaenq leaf meal in pelleted Teed for Nile tilapia. Aquaculture, 62,97-ip8
Wekell, J.C., Shearer, K.Q. and Hpule, C.R. (1983), High zinc supplementation o f rqinbow trout diets. Prog- Fish-cult., 45:144-147.
262
West, W.Q-B and Charles, A.(1991). African Fisheries and the Environment FAO Regional Office for Africa, Accra, Ghana. FAO, RAFR/91 /02. pp.3 and 6.
Wheeler, E.L. and Ferrel, R.E., 1971. A method for phytic acid determination in wheat and wheat fractions. Cereal Chem., 48:312-320
Wilson , R.P. and Poe, W.E., 1985. Effects of feeding soybean meal with varying trypsin inhibitor activities on growth of fingeriing channel catfish. Aquaculture, 46:19-25.
Wilson, R.P., Robinson, E.H. and Poe, W.E. (1981). Apparent and true availability of amino acids from common feeding ingrdients for channel catfish. J. Nutr., 111:923-929.
Zar, J.H. (1984). Biostatistical Analysis (2nd ed.). Prentice-Hall, inc, Englewood Cliffs, New Jersey, pp.236-243.
2 6 3
CHAPTER FIFTEEN
APPENDICES
264
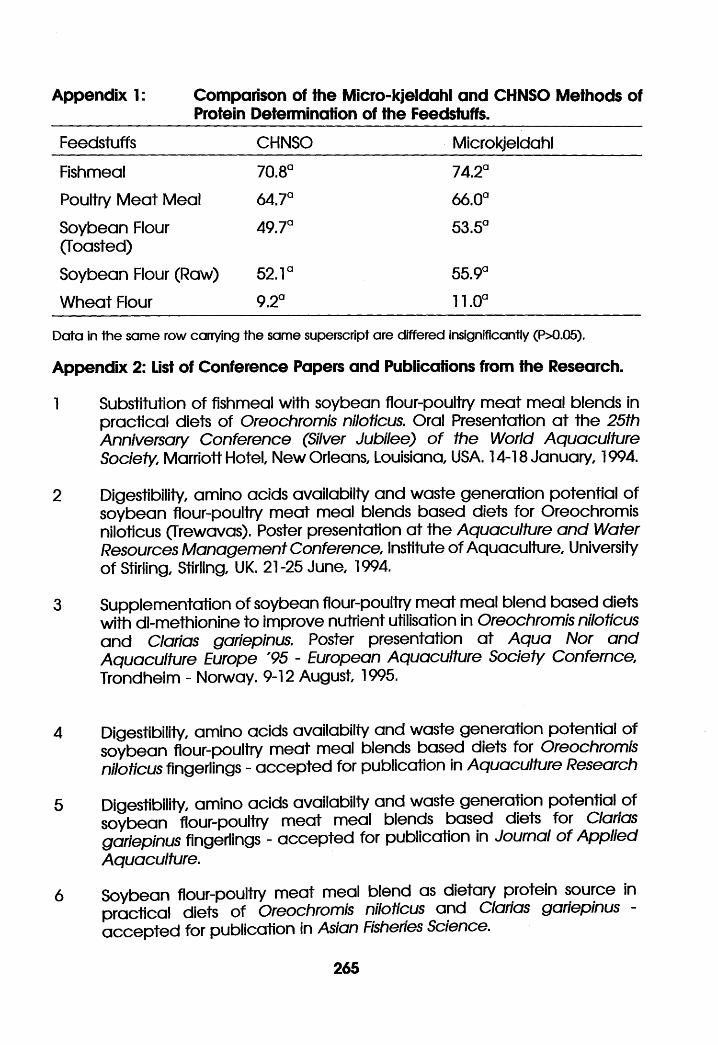
Appendix 1: Comparison of the Micro-kjeldahl and CHNSO Methods ofProtein Determination of the Feedstuffs.
Feedstuffs CHNSO Microkjeldahl
Fishmeal 70.8° 74.2a
Poultry M eat Meal 64.7° 66.0a
Soybean Flour (Toasted)
49.7a 53.5a
Soybean Flour (Raw) 52.1° 55.9°
W heat Flour 9.2a 11.0a
Data in the same row carrying the same superscript are differed insignificantly (P>0.05).
Appendix 2: List of Conference Papers and Publications from the Research.
1 Substitution of fishmeal with soybean flour-poultry m eat meal blends in practical diets of Oreochromis niloticus. Oral Presentation a t the 25th Anniversary Conference (Silver Jubilee) o f the World Aquaculture Society, Marriott Hotel New Orleans, Louisiana, USA. 14-18 January, 1994.
2 Digestibility, amino acids availabilty and waste generation potential of soybean flour-poultry meat meal blends based diets for Oreochromis niloticus (Trewavas). Poster presentation a t the Aquaculture and Water R esources Management Conference, Institute of Aquaculture, University o f Stirling, Stirling, UK. 21-25 June, 1994.
3 Supplementation of soybean flour-poultry meat meal blend based diets with dl-methionine to improve nutrient utilisation in Oreochromis niloticus and Clarias gariepinus. Poster presentation a t Aqua Nor and Aquaculture Europe '95 - European Aquaculture Society Confernce, Trondheim - Norway. 9-12 August, 1995.
4 Digestibility, amino acids availabilty and waste generation potential of soybean flour-poultry meat meal blends based diets for Oreochromis niloticus fingerlings - accepted for publication in Aquaculture Research
5 Digestibility, amino acids availabilty and waste generation potential of soybean flour-poultry meat meal blends based diets for Clarias gariepinus fingerlings - accepted for publication in Journal o f Applied Aquaculture.
6 Soybean flour-poultry meat meal blend as dietary protein source in practical diets of Oreochromis niloticus and Clarias gariepinus accepted for publication in Asian Fisheries Science.
265