use of species richness estimators improves evaluation of...
TRANSCRIPT
ORIGINAL PAPER
Use of species richness estimators improves evaluationof understory plant response to logging: a studyof redwood forests
David T. Loya Æ Erik S. Jules
Received: 9 August 2006 / Accepted: 9 March 2007 / Published online: 6 April 2007
� Springer Science+Business Media B.V. 2007
Abstract The recovery of native understory plant
communities after timber harvest has received a
great amount of attention worldwide. However, most
of these studies have ignored the potentially signif-
icant effects that differences in habitat across forest
development may have on the species–area relation-
ship, even though sampling efficacy among forest
developmental stages may differ markedly as a
result of equal sampling within stages. We examined
vascular plant community structure in coastal red-
wood forests of northern California (USA) in forest
patches in each of four forest stages that develop
with forest age: Initiation, Closure, Mature, and Old-
growth. We also used a set of traditional and novel
approaches to assess sampling efficacy and guide
our sampling design. We initially sampled 75
circular plots (0.04 ha) in stands within each forest
stage across a 1,347 km2 area. The species–area
relationship suggested we had adequately sampled
all stages after the first season of data collection, but
non-parametric richness estimators (Incidence-based
Coverage Estimator or ICE) and Michaelis–Menten
means (MMMeans) rarefaction curves, indicated
inadequate sampling of the older stages. Thus, we
added four more samples within the Old-growth
forest stage, establishing a more equitable sample of
all stages. Our full data set demonstrated significant
differences between plant communities in previously
harvested forests (‘managed’ = Initiation, Closure,
and Mature) and ‘unmanaged’ forests (Old-growth).
Though several understory species were present in
all stages, a suite of Old-growth indicator and
restricted species suggest that recovery of some
species may take long periods in managed forests.
Interestingly, a separate suite of common understory
species were lacking in Old-growth, and species
richness in this stage was lower than in the mature
managed forests. We discuss how this departure
from the prediction of peak richness in Old-growth
may relate to fire suppression in Old-growth forests.
Lastly, analysis of our initial, smaller sampling of
plots suggested that Old-growth plots were the least
species rich. However, additional sampling of the
Old-growth stage demonstrated that Old-growth
plots were as rich as Closure plots. This has
important implications for all studies concerned
with measuring recovery after forest disturbances;
stage-dependent habitat-mediated differences that
affect sampling efficacy may not be captured by
traditional sampling methods.
Keywords Diversity � Redwood forest � Richness
estimators � Sampling efficacy � Timber harvest �Understory plants
D. T. Loya � E. S. Jules (&)
Department of Biological Sciences, Humboldt State
University, Arcata, CA 95521, USA
e-mail: [email protected]
123
Plant Ecol (2008) 194:179–194
DOI 10.1007/s11258-007-9283-z
Introduction
In forests that are intensively managed for timber,
community response to disturbance is of particular
conservation interest because stand rotation logging
imposes serial catastrophic disturbances to which
forest species must respond (Jules 1998; Verheyen
et al. 2003; Dignan and Bren 2003). This disturbance
regime creates a patchwork of forest blocks, each at
various stages of stand development and, therefore, a
mosaic of habitats variously suitable for forest
understory species. Because some species may
recover slowly after disturbance (Moola and Vasseur
2004; Donohue et al. 2000), their persistence across
the landscape will be dependent on several key
factors, including rate of population increase, prop-
agule abundance, dispersal mode, and the rate of
harvest rotation. Site- and landscape-scale features of
timber harvest disturbance may be particularly
important for plants, which generally rely on seed
dispersal to move from disturbed to suitable habitat.
Thus, understory plant species must either persist
through the disturbance or recolonize when, and if,
the site becomes suitable again (Grime 1986).
The recovery of plant communities after timber
harvest has been the subject of a large pool of
literature (reviewed in Harris et al. 1982; Franklin
1982; Oliver and Larson 1996; and Franklin et al.
2002; for example). However, the results of these
studies differ markedly (Dyrness 1973; Peet and
Christensen 1988; Frost 1992; Sullivan et al. 2001;
Battles et al. 2001; Costa and Magnusson 2002). For
example, Greenberg et al. (1995) found an increase in
species richness and diversity following post fire
salvage logging in a fire-adapted sand pine scrub
forest. In other cases, diversity initially decreased,
especially among forest interior species (Meier et al.
1995; Roberts and Zhu 2002), then quickly recovered
within a few decades (Peet and Christensen 1988;
Hannerz and Hanell 1997; Gilliam 2002; Gilliam et al.
1995; Roberts 2002). This later pattern of community
development was also documented in fixed plots
measured prior to logging and 28 year later in a mixed
Douglas-fir forest in the Pacific Northwest (Halpern
and Spies 1995). In contrast, richness and herbaceous
cover in eastern deciduous forests was lower in
secondary forests recovering from timber harvest than
in primary forests, even when the secondary forests
were as old as 87 years (Duffy and Meier 1992). This
result is supported by studies in several other forest
types (Peterken and Game 1984; Whitney and Foster
1988; Dzwonko and Loster 1989).
The diversity of these past findings may result in
part because community recovery is systemspecific
and influenced by numerous biotic and abiotic factors
(Halpern 1989; Roberts and Gilliam 1995; Roberts
2004). Alternatively, while conflicting results may
have system-specific, ecologically-based explana-
tions, differences may also be attributable to habi-
tat-specific effectiveness of sampling species
richness. Though the species–area relationship is
well documented, there is also a generally positive
relationship between the number of individuals in a
sample and richness (Colwell and Coddington 1994;
Gotelli and Colwell 2001). So comparable samples
will not necessarily be achieved using a sampling
design with equal numbers of sampling units across
different communities in which the number of
individuals of a particular species varies significantly
(Colwell and Coddington 1994). Thus, past studies
that have used balanced sampling designs may have
been inadequate for addressing the very questions
they were intended to answer. Likewise, most studies
that do not employ balanced designs have not
addressed habitat-specific sampling efficacy (Peter-
ken and Game 1984; Halpern and Spies 1995). A
growing suite of analytical techniques has been
developed recently to contend with estimating spe-
cies richness where abundance varies (Gotelli and
Colwell 2001; Longino et al. 2002), however none of
these have been applied to studies which assess the
recovery of forest diversity after logging.
In this study, we assessed the influence of clearcut
logging on community structure and richness, and,
more importantly, used a suite of newly developed
analytical tools to provide a critique of traditional
assessments of diversity recovery rates. In addition,
ours is the first study to examine the effects of stand
rotation logging on understory plant communities in
redwood forests. The redwood forest system is ideal
for asking how methods for assessing community
metrics compare because it is a discrete system with a
long history of intensive management similarly
applied over the region, yet remnant unlogged stands
exist in the matrix of managed forests. In this study,
we explored the relationship between understory
vascular plant diversity and forest development, time
since disturbance, and environmental factors across
180 Plant Ecol (2008) 194:179–194
123
forest stages spanning new clearcuts to old-growth
redwood forests.
Methods
Study area
We studied understory vascular plant community
structure in redwood forests of central and southern
Humboldt County, California, USA during the spring
and summer of 2003 and 2004. The study included
redwood forests of various ages across four owner-
ships: the Bureau of Land Management’s Headwaters
Forest, the City of Arcata’s Jacoby Creek Forest,
Humboldt Redwoods State Park (HRSP), and the
Pacific Lumber Company (PL) holdings. The study
area encompassed approximately 1,347 km2. The
majority of the study area has been clearcut at least
once, and the timberland forests are a patchwork of
cut blocks of various ages and developmental stages.
Unlogged forest occurs in remnant patches across the
landscape and was sampled from the Headwaters
Forest, HRSP, and PL land.
Sampling design
A total of 79 plots were sampled during the flowering
period of most forest species. Plot selection was
restricted to redwood-dominated forests greater than
50 m from class-I and -II watercourses, at least 10 m
from permanent, mapped roads, and at slopes between
20% and 60%. All aspects were sampled, but special
habitats, such as riparian areas, forest wetlands, rock
outcrops, and alluvial flats, were excluded. Each plot
was located at least 250 m from other plots. Locations
matching these criteria were generated in ArcView
GIS 8.0 and located in the field using a Magellan1
(San Dimas, CA) GPS receiver. At each location,
temporary circular plots measuring 0.04 ha (11.3 m
radius) were established for data collection.
To assess the relationship between understory
plant community structure and stand development,
we stratified samples in the field by assigning each
plot to one of four forest developmental stages based
on stand characteristics. The forest stage categories
used were: Initiation—recently cleared (i.e., trees
harvested), completely open-canopied plots; Clo-
sure—closed canopies, high stem density, small
diameter at breast height (dbh; mean = 40 cm), high
small-stem mortality, and vertically undifferentiated
canopies; Mature-closed to partially open canopies,
lower stem density, larger dbh (mean = 60 cm), low
small-stem mortality, and canopies with vertical
structure due to dominant trees; and Old-growth—
unlogged stands with very large trees (mean
dbh = 133.4 cm).
To quantify understory vascular plant community
structure, we recorded presence and cover of the
entire vascular flora in the herbaceous layer in each
plot. We defined the understory community physiog-
nomically, arbitrarily separating the herbaceous layer
from the shrub layer at 1-m. Each species was
assigned one of the following cover classes: (1)
<25%, (2) 26–75%, (3) >76. Nomenclature followed
The Jepson Manual (Hickman 1993).
We recorded site characteristics at each plot to
evaluate the relationship between community struc-
ture and environmental variables. We measured
slope, aspect, and elevation, and visually estimated
percent cover for canopy, shrub and herb layers as
well as cover of bare mineral soil and woody debris.
Each plot was assigned a woody debris decay class
based on the average state of decay of all large pieces
of woody debris. We also estimated the distance in
meters from plot center to the interface between
contiguous forest and forest opening, hereafter edge
distance. In addition, the distance of each plot from
the coast both linearly and by creek kilometers was
determined from GIS data.
Since site quality affects rates of tree growth, stand
descriptions related to tree size may lead to specious
estimations of stand age (Watt et al. 2003; Andreas-
sen and Tomter 2003), and, therefore, community
compositional gradients associated with age of forest.
To independently verify the chronological basis for
our developmental stages, we estimated plot age for a
random subset of the plots managed for timber using
standard dendrochronology techniques. Forty-five
plots were aged. One to seven trees from the
dominant size-class cohort were selected from each
aged plot. Cores that intersected the central pith were
removed from each tree at breast height using tree
ring increment borers. The cores were processed in
the lab and the annual growth rings were counted
under low magnification. The age of the oldest tree in
the plot was used as plot age.
Plant Ecol (2008) 194:179–194 181
123
Analyses
Ordination
To assess the relationship between forest stage, site
characteristics, and plant community composition, we
used Nonmetric Multidimensional Scaling (NMS)
with the Bray–Curtis distance measure conducted
using the software PC-ORD (version 4.01; McCune
and Mefford 1999). The joint plot feature with an r2-
cutoff of 0.3 was used to explore correlations
between site characteristics and community compo-
sition. Ordinations were performed on the full data
set and on a subset of native plants only to tease apart
the effect of early colonization of non-native species.
The data were prepared to improve multivariate fit
and to facilitate interpretation of the results. Species
that did not occur in more than 7.5% of the plots were
excluded from analysis. One ‘‘Mature’’ plot was
excluded due to insufficient site characteristic data;
the final species matrix measured 78 plots · 93
species. Edge distance was log transformed. The final
matrix of site characteristics measured 78 plots · 20
variables. Finally, we performed rigid visual rotations
of the ordinations to maximize the percent variation
explained along the two most dominant axes. Axes
lacking interpretative value were not assessed.
Differences in community structure among forest
stages were then assessed in PC-ORD using a
Multiple Response Permutation Procedure (MRPP).
All pair-wise comparisons of forest stages were
made. We used a Bonferroni corrected critical value
to maintain family-wide significance levels of
a = 0.05. The adjusted critical value was a/(number
of tests) = (0.05/7 = 0.0357). For ease of interpreta-
tion, we present adjusted P-values instead of adjusted
alpha.
Indicator species analysis
We assessed fidelity to each forest stage using an
indicator species analysis (ISA) in PC-ORD (McCu-
ne and Mefford 1999). This analysis assigns a
Dufrene and Legendre (1997) indicator value, which
describes the affinity of each species to each forest
stage. For each species, indicator value differences
among stages were tested using a Monte Carlo
simulation of 1,000 runs with a critical value of
a = 0.05.
Richness estimators
Average richness
We used species richness to compare diversity among
forest stages and to assess sampling efficacy within
each stage. To determine whether there were differ-
ences in richness among forest stages, average
sample richness was compared for the full data set
and the non-native subset using Kruskal–Wallis One-
way ANOVA in NCSS (Hintze 2001); these data did
not satisfy parametric test assumptions. Native rich-
ness among forest stages was compared using ANO-
VA. All pair-wise comparisons were made using a
Tukey–Kramer Multiple Comparisons test or, the
nonparametric alternative, the Kruskal–Wallis Multi-
ple-Comparison Z-value test. Bonferroni adjusted
critical values were used for the Z-value multiple
comparison tests.
Species accumulation and rarefaction curves
We also estimated total species richness with species
accumulation and rarefaction curves. The accumula-
tion and rarefaction curves can be used to compare
richness across stages (Gotelli and Colwell 2001). In
this study, however, the curves were used primarily to
assess the validity of between-stage comparisons of
richness. Valid comparisons can only be based on
samples that adequately describe the richness of each
habitat being compared. So, by assessing sampling
efficacy of each stage, we determined which com-
parisons were likely based on adequate samples.
Sampling effectiveness can be inferred based on
the behavior of the accumulation curve. Generally,
sampling is considered adequate when the rarefaction
or other richness estimator curve levels off asymp-
totically. A good estimator is one that becomes
independent of sampling effort relatively early,
remains stable, and is little affected by species
patchiness or sample order (Gotelli and Colwell
2001). Richness estimates used to compare commu-
nities should be derived from effort-independent
estimator curves.
Species–area curves were produced for each forest
stage in PC-ORD (McCune and Mefford 1999). This
software generates estimates of total species richness
by iteratively subsampling randomly selected plots
for each level of sampling effort (i.e., number of
182 Plant Ecol (2008) 194:179–194
123
plots) and calculating total richness for each run. The
averaged estimates of total richness for each level of
sampling were graphically portrayed as a plot of
richness against number of plots.
Because richness estimates in sampled communi-
ties may differ due to differences in abundance of
individuals, standard statistical techniques for com-
paring species richness may be misleading (Colwell
and Coddington 1994; Chazdon et al. 1998). That is,
one community may be more or less thoroughly
sampled as compared to another using the same
number of plots in each community if the number of
individuals affects estimates of richness. Rarefaction
techniques scale species richness estimates by indi-
vidual abundance levels (Colwell and Coddington
1994; Colwell 2000; Gotelli and Colwell 2001).
For this reason, total species richness was also
estimated using Michaelis–Menten rarefaction
curves. We calculated Michaelis–Menten Means
(MMMeans) curves using the computer program
EstimateS (version 6; Colwell 2000). This is a
sample-based rarefaction method that generates
asymptotic estimates of total richness for each
pooling level. Estimates are made once per pooling
level by using the smoothed asymptotic estimator
curve from a simulation of randomized plot order.
This method suppresses the effect of outliers and
produces a smoothed curve (Colwell 2000). We used
the EstimateS default settings of sampling without
replacement, parameter values fitted according to
Raaijmakers’ (1987) Eadie-Hofstee equation, and
simulations consisted of 50 runs.
Non-parametric richness estimator
In addition to the species accumulation and rarefac-
tion curves, we used EstimateS to generate non-
parametric richness estimates. Some non-parametric
estimators, such as the incidence-based coverage
estimator (ICE), may provide reliable estimates of
species richness at even low levels of sampling effort
(Colwell and Coddington 1994; Chazdon et al. 1998;
Walther and Martin 2001; Foggo et al. 2003; Brose
et al. 2003). We converted the data to presence/
absence and calculated the ICE (Lee and Chao 1994)
using EstimateS. ICE uses the concept of statistical
coverage to estimate true richness, including undis-
covered species, based on the proportions of discov-
ered rare species (Chazdon et al. 1998; Colwell
2000). The ICE estimates were generated for each
forest stage using the EstimateS default definition of
rare species as those that occur in 10 or fewer plots.
The species–area, MMMeans rarefaction, and non-
parametric ICE curves were compared graphically to
cross-verify the behavior of each estimator. Addi-
tional information regarding sampling efficiency was
inferred from graphs of observed species richness,
number of Uniques, and number of Duplicates.
Uniques are the number of species that occur in only
one sample, while Duplicates are those that occur in
only two samples. These additional descriptors were
calculated in EstimateS. Observed richness is the
number of species in random simulated samples for
increasing levels of sampling effort.
The EstimateS sample-based estimators can repre-
sent species density if plotted against the number of
sample units or they can represent species richness if
plotted against number of individuals (Colwell 2000;
Gotelli and Colwell 2001). This report is concerned
with species richness; however, the number of indi-
viduals was not tracked during data collection. Instead,
we used the number of species occurrences within a
forest stage as a reasonable proxy for abundance, and
we plotted the number of occurrences along the
abscissa (see Longino et al. 2002 for example).
Richness sampling curves that become effort-
independent and stabilize suggest thorough sampling.
Likewise, curves for Uniques and Duplicates should
initially rise quickly with increasing numbers of
individuals, then level off and decrease as sampling
approaches true richness. This is because the prob-
ability of encountering a new species early in
sampling is high, while only those species that are
truly rare will remain infrequent as the community is
more thoroughly sampled. However, estimators may
behave differently for different data sets, and esti-
mators that have been tested against benchmark
datasets may not perform similarly for other datasets
(Chazdon et al. 1998; Gotelli and Colwell 2001). For
unstable curves, the ICE was considered a lower
estimate of richness (Gotelli and Colwell 2001).
The rarefaction and richness estimators were used
to guide further sampling. Preliminary results based
on the first season of data collection suggested the
need for additional sampling, especially of the Old-
growth stage. Four additional plots were selected from
the Headwaters Forest. This also served to include
more coastal Old-growth forest sampling in the study.
Plant Ecol (2008) 194:179–194 183
123
Results
In the 79 plots sampled, we encountered 227
understory vascular plant species in 56 families.
Seventy-three percent of these species, including the
majority of herbaceous (69%) and all woody species,
were native to California. We did not assess native
status for species identified only to genus unless the
genus is entirely composed of species native to
California. Of the 79 plots, 19 were assigned to
Initiation, 16 to Closure, 25 to Mature, and 19 to Old-
growth. Most plot characteristics did not differ
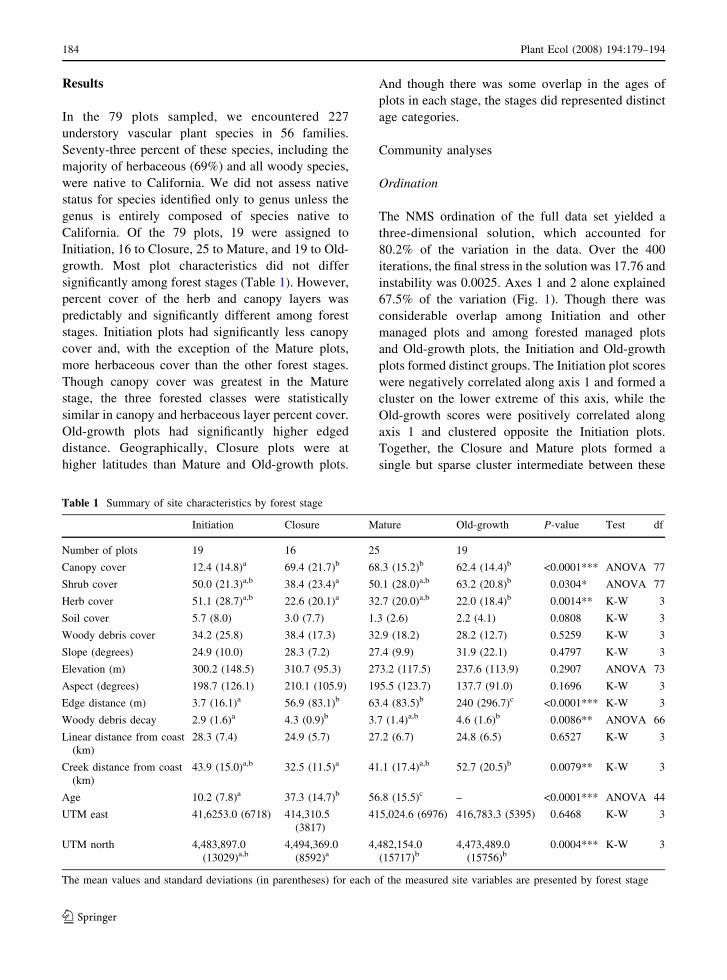
significantly among forest stages (Table 1). However,
percent cover of the herb and canopy layers was
predictably and significantly different among forest
stages. Initiation plots had significantly less canopy
cover and, with the exception of the Mature plots,
more herbaceous cover than the other forest stages.
Though canopy cover was greatest in the Mature
stage, the three forested classes were statistically
similar in canopy and herbaceous layer percent cover.
Old-growth plots had significantly higher edged
distance. Geographically, Closure plots were at
higher latitudes than Mature and Old-growth plots.
And though there was some overlap in the ages of
plots in each stage, the stages did represented distinct
age categories.
Community analyses
Ordination
The NMS ordination of the full data set yielded a
three-dimensional solution, which accounted for
80.2% of the variation in the data. Over the 400
iterations, the final stress in the solution was 17.76 and
instability was 0.0025. Axes 1 and 2 alone explained
67.5% of the variation (Fig. 1). Though there was
considerable overlap among Initiation and other
managed plots and among forested managed plots
and Old-growth plots, the Initiation and Old-growth
plots formed distinct groups. The Initiation plot scores
were negatively correlated along axis 1 and formed a
cluster on the lower extreme of this axis, while the
Old-growth scores were positively correlated along
axis 1 and clustered opposite the Initiation plots.
Together, the Closure and Mature plots formed a
single but sparse cluster intermediate between these
Table 1 Summary of site characteristics by forest stage
Initiation Closure Mature Old-growth P-value Test df
Number of plots 19 16 25 19
Canopy cover 12.4 (14.8)a 69.4 (21.7)b 68.3 (15.2)b 62.4 (14.4)b <0.0001*** ANOVA 77
Shrub cover 50.0 (21.3)a,b 38.4 (23.4)a 50.1 (28.0)a,b 63.2 (20.8)b 0.0304* ANOVA 77
Herb cover 51.1 (28.7)a,b 22.6 (20.1)a 32.7 (20.0)a,b 22.0 (18.4)b 0.0014** K-W 3
Soil cover 5.7 (8.0) 3.0 (7.7) 1.3 (2.6) 2.2 (4.1) 0.0808 K-W 3
Woody debris cover 34.2 (25.8) 38.4 (17.3) 32.9 (18.2) 28.2 (12.7) 0.5259 K-W 3
Slope (degrees) 24.9 (10.0) 28.3 (7.2) 27.4 (9.9) 31.9 (22.1) 0.4797 K-W 3
Elevation (m) 300.2 (148.5) 310.7 (95.3) 273.2 (117.5) 237.6 (113.9) 0.2907 ANOVA 73
Aspect (degrees) 198.7 (126.1) 210.1 (105.9) 195.5 (123.7) 137.7 (91.0) 0.1696 K-W 3
Edge distance (m) 3.7 (16.1)a 56.9 (83.1)b 63.4 (83.5)b 240 (296.7)c <0.0001*** K-W 3
Woody debris decay 2.9 (1.6)a 4.3 (0.9)b 3.7 (1.4)a,b 4.6 (1.6)b 0.0086** ANOVA 66
Linear distance from coast
(km)
28.3 (7.4) 24.9 (5.7) 27.2 (6.7) 24.8 (6.5) 0.6527 K-W 3
Creek distance from coast
(km)
43.9 (15.0)a,b 32.5 (11.5)a 41.1 (17.4)a,b 52.7 (20.5)b 0.0079** K-W 3
Age 10.2 (7.8)a 37.3 (14.7)b 56.8 (15.5)c – <0.0001*** ANOVA 44
UTM east 41,6253.0 (6718) 414,310.5
(3817)
415,024.6 (6976) 416,783.3 (5395) 0.6468 K-W 3
UTM north 4,483,897.0
(13029)a,b4,494,369.0
(8592)a4,482,154.0
(15717)b4,473,489.0
(15756)b0.0004*** K-W 3
The mean values and standard deviations (in parentheses) for each of the measured site variables are presented by forest stage
184 Plant Ecol (2008) 194:179–194
123
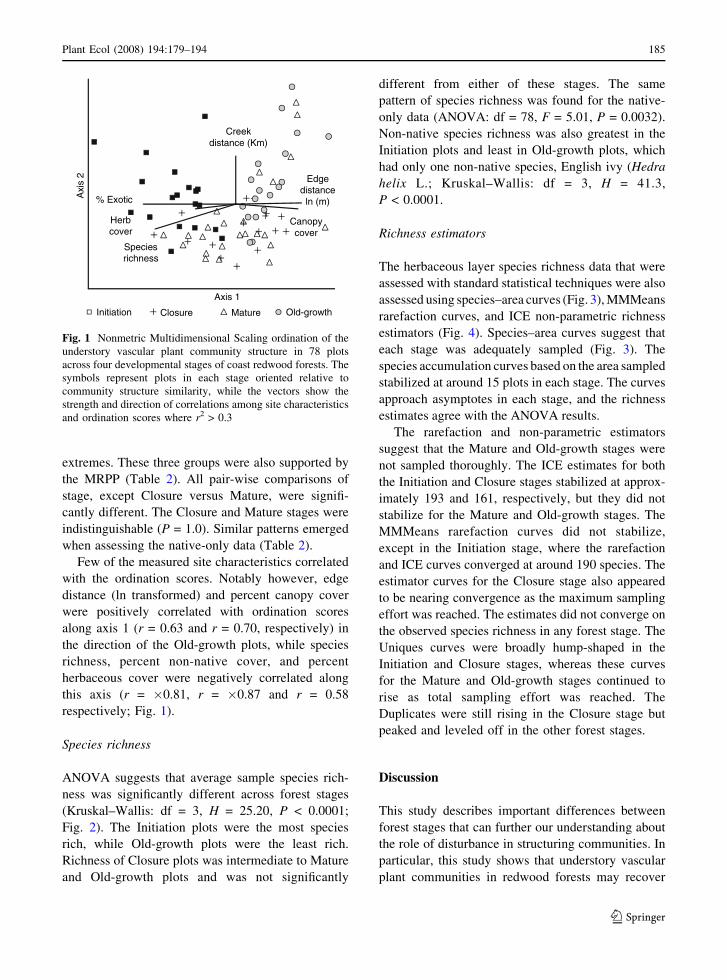
extremes. These three groups were also supported by
the MRPP (Table 2). All pair-wise comparisons of
stage, except Closure versus Mature, were signifi-
cantly different. The Closure and Mature stages were
indistinguishable (P = 1.0). Similar patterns emerged
when assessing the native-only data (Table 2).
Few of the measured site characteristics correlated
with the ordination scores. Notably however, edge
distance (ln transformed) and percent canopy cover
were positively correlated with ordination scores
along axis 1 (r = 0.63 and r = 0.70, respectively) in
the direction of the Old-growth plots, while species
richness, percent non-native cover, and percent
herbaceous cover were negatively correlated along
this axis (r = �0.81, r = �0.87 and r = 0.58
respectively; Fig. 1).
Species richness
ANOVA suggests that average sample species rich-
ness was significantly different across forest stages
(Kruskal–Wallis: df = 3, H = 25.20, P < 0.0001;
Fig. 2). The Initiation plots were the most species
rich, while Old-growth plots were the least rich.
Richness of Closure plots was intermediate to Mature
and Old-growth plots and was not significantly
different from either of these stages. The same
pattern of species richness was found for the native-
only data (ANOVA: df = 78, F = 5.01, P = 0.0032).
Non-native species richness was also greatest in the
Initiation plots and least in Old-growth plots, which
had only one non-native species, English ivy (Hedra
helix L.; Kruskal–Wallis: df = 3, H = 41.3,
P < 0.0001.
Richness estimators
The herbaceous layer species richness data that were
assessed with standard statistical techniques were also
assessed using species–area curves (Fig. 3), MMMeans
rarefaction curves, and ICE non-parametric richness
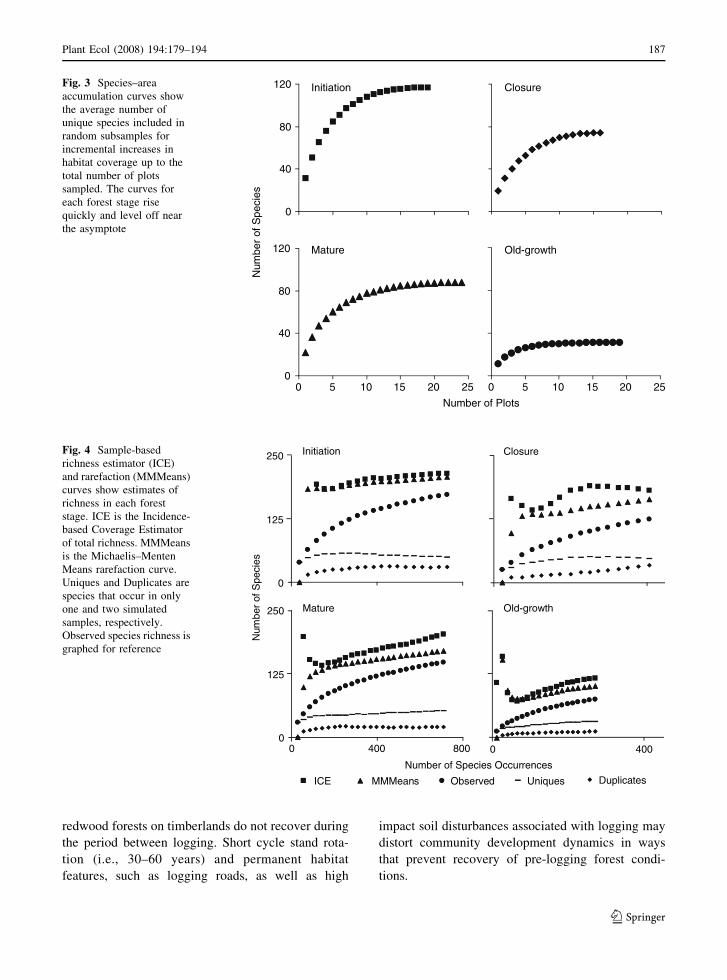
estimators (Fig. 4). Species–area curves suggest that
each stage was adequately sampled (Fig. 3). The
species accumulation curves based on the area sampled
stabilized at around 15 plots in each stage. The curves
approach asymptotes in each stage, and the richness
estimates agree with the ANOVA results.
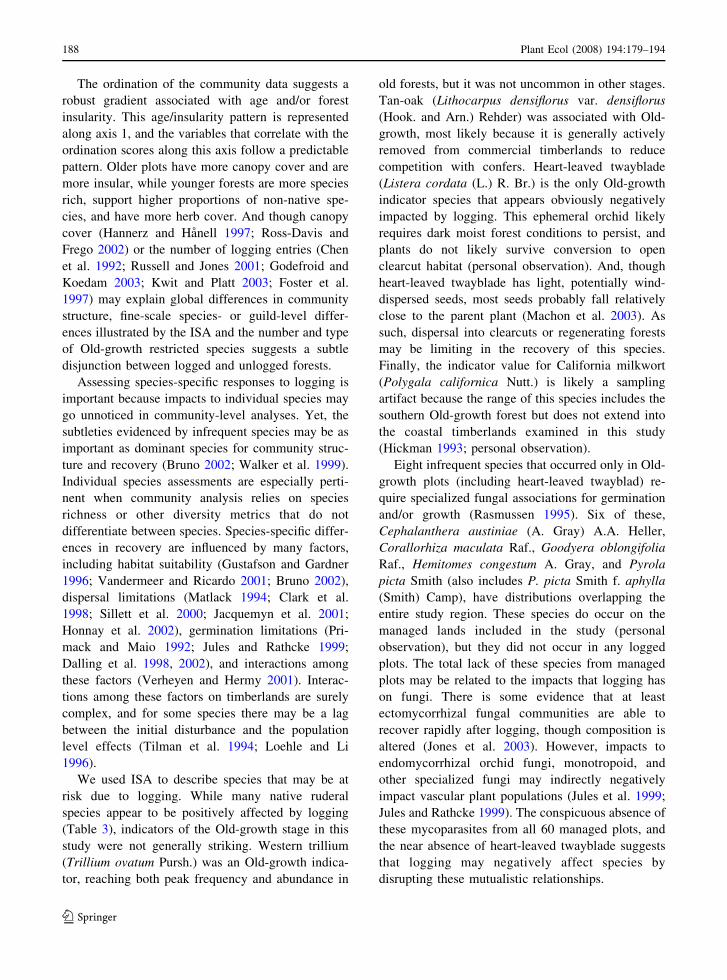
The rarefaction and non-parametric estimators
suggest that the Mature and Old-growth stages were
not sampled thoroughly. The ICE estimates for both
the Initiation and Closure stages stabilized at approx-
imately 193 and 161, respectively, but they did not
stabilize for the Mature and Old-growth stages. The
MMMeans rarefaction curves did not stabilize,
except in the Initiation stage, where the rarefaction
and ICE curves converged at around 190 species. The
estimator curves for the Closure stage also appeared
to be nearing convergence as the maximum sampling
effort was reached. The estimates did not converge on
the observed species richness in any forest stage. The
Uniques curves were broadly hump-shaped in the
Initiation and Closure stages, whereas these curves
for the Mature and Old-growth stages continued to
rise as total sampling effort was reached. The
Duplicates were still rising in the Closure stage but
peaked and leveled off in the other forest stages.
Discussion
This study describes important differences between
forest stages that can further our understanding about
the role of disturbance in structuring communities. In
particular, this study shows that understory vascular
plant communities in redwood forests may recover
cover
Axis 1
Old-growthMatureClosureInitiation
Axi
s2
Creekdistance (Km)
Edgedistance
ln (m)
Canopy cover
% Exotic
Speciesrichness
Herb
Fig. 1 Nonmetric Multidimensional Scaling ordination of the
understory vascular plant community structure in 78 plots
across four developmental stages of coast redwood forests. The
symbols represent plots in each stage oriented relative to
community structure similarity, while the vectors show the
strength and direction of correlations among site characteristics
and ordination scores where r2 > 0.3
Plant Ecol (2008) 194:179–194 185
123
relatively quickly after logging, yet a portion of the
flora in Old-growth forest communities is lost after
logging. This study also promulgates a method of
assessing sampling efficacy that should be employed
in other investigations where sampled communities
are compared for the purpose of understanding
recovery of native systems in managed landscapes.
This type of analysis may be most critical to field
experiments for which sampling artifacts and the lack
of experimental control are important concerns.
Community structure and disturbance
The results of this study run counter to a successional
hypothesis predicting a spike in species richness
immediately following logging due to non-native
colonizers, followed by a trough in richness caused
by canopy closure, and the eventual recovery of the
pre-harvest community and peak of richness in the
mature forest (Franklin et al. 2002). Community
composition was markedly different between logged
and unlogged forest types and between Initiation and
older timberlands (Fig. 1, Table 2). But this differ-
ence was not attributable to early-colonizing non-
native species, but rather an increase in native
ruderals. Further, there was a suite of species
restricted to and indicative of Old-growth (Table 3).
While there was considerable overlap in the commu-
nity composition among forest stages, the composi-
tion of even the oldest logged forests was different
from unlogged forests. Thus, it may be that compo-
nents of the understory plant communities of coast
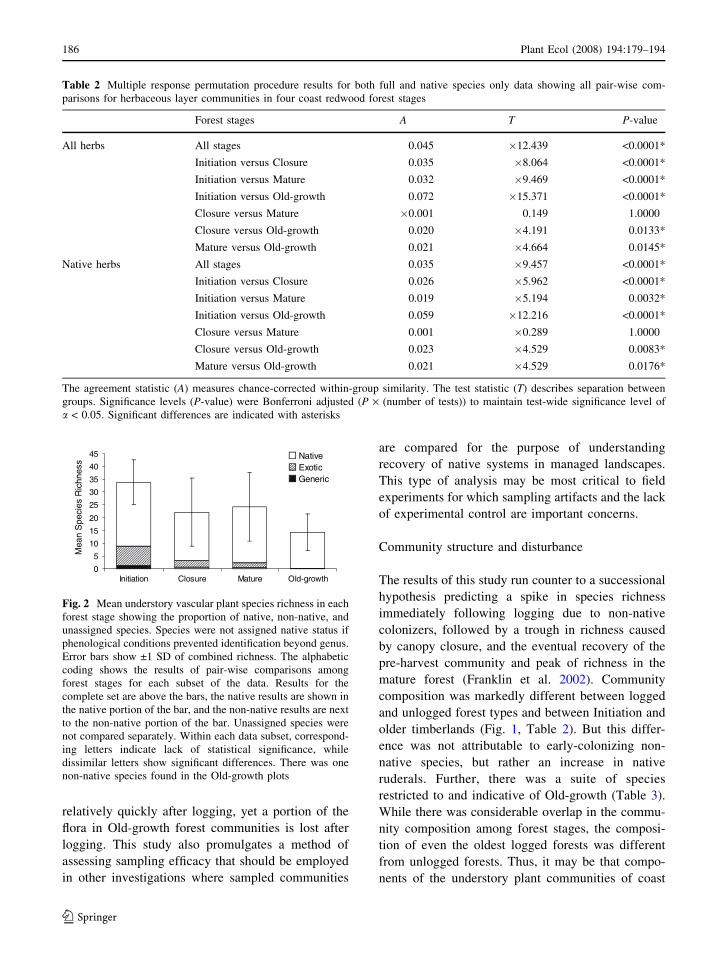
Table 2 Multiple response permutation procedure results for both full and native species only data showing all pair-wise com-
parisons for herbaceous layer communities in four coast redwood forest stages
Forest stages A T P-value
All herbs All stages 0.045 �12.439 <0.0001*
Initiation versus Closure 0.035 �8.064 <0.0001*
Initiation versus Mature 0.032 �9.469 <0.0001*
Initiation versus Old-growth 0.072 �15.371 <0.0001*
Closure versus Mature �0.001 0.149 1.0000
Closure versus Old-growth 0.020 �4.191 0.0133*
Mature versus Old-growth 0.021 �4.664 0.0145*
Native herbs All stages 0.035 �9.457 <0.0001*
Initiation versus Closure 0.026 �5.962 <0.0001*
Initiation versus Mature 0.019 �5.194 0.0032*
Initiation versus Old-growth 0.059 �12.216 <0.0001*
Closure versus Mature 0.001 �0.289 1.0000
Closure versus Old-growth 0.023 �4.529 0.0083*
Mature versus Old-growth 0.021 �4.529 0.0176*
The agreement statistic (A) measures chance-corrected within-group similarity. The test statistic (T) describes separation between
groups. Significance levels (P-value) were Bonferroni adjusted (P · (number of tests)) to maintain test-wide significance level of
a < 0.05. Significant differences are indicated with asterisks
0
5
10
15
20
25
30
35
40
45
Initiation Closure Mature Old-growth
NativeExoticGeneric
Mea
nS
peci
esR
ichn
ess
Fig. 2 Mean understory vascular plant species richness in each
forest stage showing the proportion of native, non-native, and
unassigned species. Species were not assigned native status if
phenological conditions prevented identification beyond genus.
Error bars show ±1 SD of combined richness. The alphabetic
coding shows the results of pair-wise comparisons among
forest stages for each subset of the data. Results for the
complete set are above the bars, the native results are shown in
the native portion of the bar, and the non-native results are next
to the non-native portion of the bar. Unassigned species were
not compared separately. Within each data subset, correspond-
ing letters indicate lack of statistical significance, while
dissimilar letters show significant differences. There was one
non-native species found in the Old-growth plots
186 Plant Ecol (2008) 194:179–194
123
redwood forests on timberlands do not recover during
the period between logging. Short cycle stand rota-
tion (i.e., 30–60 years) and permanent habitat
features, such as logging roads, as well as high
impact soil disturbances associated with logging may
distort community development dynamics in ways
that prevent recovery of pre-logging forest condi-
tions.
0 5 10 15 20 250
40
80
120
0 5 10 15 20 25
0
40
80
120 Initiation Closure
Mature Old-growth
Number of Plots
Num
ber
ofS
peci
es
Fig. 3 Species–area
accumulation curves show
the average number of
unique species included in
random subsamples for
incremental increases in
habitat coverage up to the
total number of plots
sampled. The curves for
each forest stage rise
quickly and level off near
the asymptote
0
125
250
0 400 800 0 400
0
125
250 Initiation Closure
Mature Old-growth
Number of Species Occurrences
Num
ber
ofS
peci
es
ICE MMMeans Observed Uniques Duplicates
Fig. 4 Sample-based
richness estimator (ICE)
and rarefaction (MMMeans)
curves show estimates of
richness in each forest
stage. ICE is the Incidence-
based Coverage Estimator
of total richness. MMMeans
is the Michaelis–Menten
Means rarefaction curve.
Uniques and Duplicates are
species that occur in only
one and two simulated
samples, respectively.
Observed species richness is
graphed for reference
Plant Ecol (2008) 194:179–194 187
123
The ordination of the community data suggests a
robust gradient associated with age and/or forest
insularity. This age/insularity pattern is represented
along axis 1, and the variables that correlate with the
ordination scores along this axis follow a predictable
pattern. Older plots have more canopy cover and are
more insular, while younger forests are more species
rich, support higher proportions of non-native spe-
cies, and have more herb cover. And though canopy
cover (Hannerz and Hanell 1997; Ross-Davis and
Frego 2002) or the number of logging entries (Chen
et al. 1992; Russell and Jones 2001; Godefroid and
Koedam 2003; Kwit and Platt 2003; Foster et al.
1997) may explain global differences in community
structure, fine-scale species- or guild-level differ-
ences illustrated by the ISA and the number and type
of Old-growth restricted species suggests a subtle
disjunction between logged and unlogged forests.
Assessing species-specific responses to logging is
important because impacts to individual species may
go unnoticed in community-level analyses. Yet, the
subtleties evidenced by infrequent species may be as
important as dominant species for community struc-
ture and recovery (Bruno 2002; Walker et al. 1999).
Individual species assessments are especially perti-
nent when community analysis relies on species
richness or other diversity metrics that do not
differentiate between species. Species-specific differ-
ences in recovery are influenced by many factors,
including habitat suitability (Gustafson and Gardner
1996; Vandermeer and Ricardo 2001; Bruno 2002),
dispersal limitations (Matlack 1994; Clark et al.
1998; Sillett et al. 2000; Jacquemyn et al. 2001;
Honnay et al. 2002), germination limitations (Pri-
mack and Maio 1992; Jules and Rathcke 1999;
Dalling et al. 1998, 2002), and interactions among
these factors (Verheyen and Hermy 2001). Interac-
tions among these factors on timberlands are surely
complex, and for some species there may be a lag
between the initial disturbance and the population
level effects (Tilman et al. 1994; Loehle and Li
1996).
We used ISA to describe species that may be at
risk due to logging. While many native ruderal
species appear to be positively affected by logging
(Table 3), indicators of the Old-growth stage in this
study were not generally striking. Western trillium
(Trillium ovatum Pursh.) was an Old-growth indica-
tor, reaching both peak frequency and abundance in
old forests, but it was not uncommon in other stages.
Tan-oak (Lithocarpus densiflorus var. densiflorus
(Hook. and Arn.) Rehder) was associated with Old-
growth, most likely because it is generally actively
removed from commercial timberlands to reduce
competition with confers. Heart-leaved twayblade
(Listera cordata (L.) R. Br.) is the only Old-growth
indicator species that appears obviously negatively
impacted by logging. This ephemeral orchid likely
requires dark moist forest conditions to persist, and
plants do not likely survive conversion to open
clearcut habitat (personal observation). And, though
heart-leaved twayblade has light, potentially wind-
dispersed seeds, most seeds probably fall relatively
close to the parent plant (Machon et al. 2003). As
such, dispersal into clearcuts or regenerating forests
may be limiting in the recovery of this species.
Finally, the indicator value for California milkwort
(Polygala californica Nutt.) is likely a sampling
artifact because the range of this species includes the
southern Old-growth forest but does not extend into
the coastal timberlands examined in this study
(Hickman 1993; personal observation).
Eight infrequent species that occurred only in Old-
growth plots (including heart-leaved twayblad) re-
quire specialized fungal associations for germination
and/or growth (Rasmussen 1995). Six of these,
Cephalanthera austiniae (A. Gray) A.A. Heller,
Corallorhiza maculata Raf., Goodyera oblongifolia
Raf., Hemitomes congestum A. Gray, and Pyrola
picta Smith (also includes P. picta Smith f. aphylla
(Smith) Camp), have distributions overlapping the
entire study region. These species do occur on the
managed lands included in the study (personal
observation), but they did not occur in any logged
plots. The total lack of these species from managed
plots may be related to the impacts that logging has
on fungi. There is some evidence that at least
ectomycorrhizal fungal communities are able to
recover rapidly after logging, though composition is
altered (Jones et al. 2003). However, impacts to
endomycorrhizal orchid fungi, monotropoid, and
other specialized fungi may indirectly negatively
impact vascular plant populations (Jules et al. 1999;
Jules and Rathcke 1999). The conspicuous absence of
these mycoparasites from all 60 managed plots, and
the near absence of heart-leaved twayblade suggests
that logging may negatively affect species by
disrupting these mutualistic relationships.
188 Plant Ecol (2008) 194:179–194
123
In addition to the intense nature of the initial
disturbance, the frequency of logging disturbance
may also affect the long-term population persistence
of understory species and, thus, community resilience
(Jules and Shahani 2003; Roberts 2002; Roberts and
Zhu 2002). Though many forest understory species
may either persist in or colonize young habitats, as
we found for the majority of species, major changes
in composition likely only occur over very long
periods (Dyrness 1973). Late colonizing species and
the gradual expansion of remnant populations likely
account for these changes (Halpern 1989). The
differences in species composition between Closure
and Mature stages in this study may suggest such
slow changes. If these processes operate over the
entire landscape, community structure and local
extinction may be predicated, at least in part, by
logging intervals.
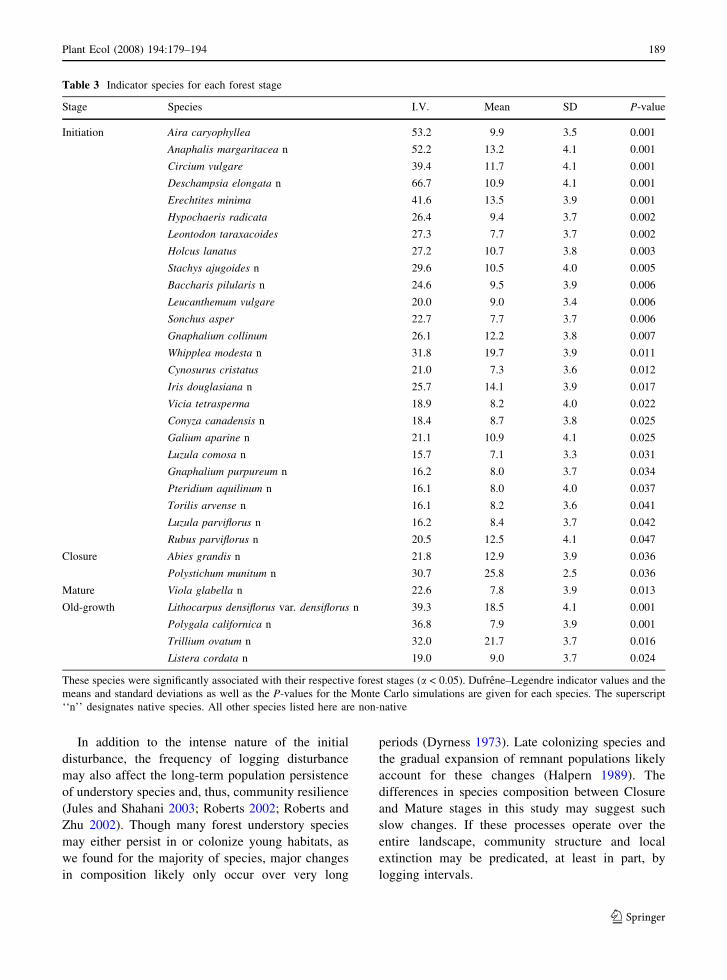
Table 3 Indicator species for each forest stage
Stage Species I.V. Mean SD P-value
Initiation Aira caryophyllea 53.2 9.9 3.5 0.001
Anaphalis margaritacea n 52.2 13.2 4.1 0.001
Circium vulgare 39.4 11.7 4.1 0.001
Deschampsia elongata n 66.7 10.9 4.1 0.001
Erechtites minima 41.6 13.5 3.9 0.001
Hypochaeris radicata 26.4 9.4 3.7 0.002
Leontodon taraxacoides 27.3 7.7 3.7 0.002
Holcus lanatus 27.2 10.7 3.8 0.003
Stachys ajugoides n 29.6 10.5 4.0 0.005
Baccharis pilularis n 24.6 9.5 3.9 0.006
Leucanthemum vulgare 20.0 9.0 3.4 0.006
Sonchus asper 22.7 7.7 3.7 0.006
Gnaphalium collinum 26.1 12.2 3.8 0.007
Whipplea modesta n 31.8 19.7 3.9 0.011
Cynosurus cristatus 21.0 7.3 3.6 0.012
Iris douglasiana n 25.7 14.1 3.9 0.017
Vicia tetrasperma 18.9 8.2 4.0 0.022
Conyza canadensis n 18.4 8.7 3.8 0.025
Galium aparine n 21.1 10.9 4.1 0.025
Luzula comosa n 15.7 7.1 3.3 0.031
Gnaphalium purpureum n 16.2 8.0 3.7 0.034
Pteridium aquilinum n 16.1 8.0 4.0 0.037
Torilis arvense n 16.1 8.2 3.6 0.041
Luzula parviflorus n 16.2 8.4 3.7 0.042
Rubus parviflorus n 20.5 12.5 4.1 0.047
Closure Abies grandis n 21.8 12.9 3.9 0.036
Polystichum munitum n 30.7 25.8 2.5 0.036
Mature Viola glabella n 22.6 7.8 3.9 0.013
Old-growth Lithocarpus densiflorus var. densiflorus n 39.3 18.5 4.1 0.001
Polygala californica n 36.8 7.9 3.9 0.001
Trillium ovatum n 32.0 21.7 3.7 0.016
Listera cordata n 19.0 9.0 3.7 0.024
These species were significantly associated with their respective forest stages (a < 0.05). Dufrene–Legendre indicator values and the
means and standard deviations as well as the P-values for the Monte Carlo simulations are given for each species. The superscript
‘‘n’’ designates native species. All other species listed here are non-native
Plant Ecol (2008) 194:179–194 189
123
Richness also differed among forest stages. Both
native and non-native species richness was greatest
in the Initiation stage. This was likely a result of
the open canopy and disturbed soil conditions of
this young stage (Dilustro et al. 2002). Often the
early peak in richness is attributed to invading non-
native species (e.g., Ross et al. 2002), but ruderal
native species accounted for the majority of the
additional species in the early successional habitats
in this study. Old-growth forests were relatively
species poor, and there were several common forest
understory species conspicuously absent from the
Old-growth plots. Studies in Douglas-fir, mixed
conifer, and eastern hardwood forests, suggest that
vascular diversity peaks in the oldest forests (e.g.,
Peterken and Game 1984), and there is a suite of
Old-growth, or late successional, species that char-
acterize this diversity (Jules et al. 1999). The
results of the current work conflict with these
studies.
The discrepancy between previous work and our
study may result from several interacting factors.
First, there may be unavoidable sampling artifacts
due to the spatially clumped distribution of remnant
Old-growth forest. In addition, the inland location of
much of the Old-growth forest included in this study
may have affected species richness. Creek distance
(from the ocean) was correlated with the ordination
solution (Fig. 1). Richness in forests may be
positively correlated with precipitation and soil
moisture (Bhattarai and Vetaas 2003; Hardtle et al.
2003). In redwood forests, fog, which decreases with
increasing creek distance, is an important factor
structuring understory communities (Harris 1987;
Dawson 1998). It is likely that the coastal Old-growth
forest in the study region supports a more diverse
vascular plant community than that of the Old-growth
forest we sampled. Finally, lack of disturbance may
be another potentially important factor affecting
community structure in the Old-growth plots in this
study. The pre-settlement fire return interval in
HRSP, from which most of the Old-growth plots
were drawn, has been estimated to be 26 years (Stuart
1987), yet the shrub structure in these plots suggests
that they have not burned recently, and there is no
administrative record of fire in the portion of the park
studied (Jay Harris, personal communication). Thus,
the disturbance dynamics that structured observable
Old-growth redwood plots in this study do not likely
represent ‘‘natural’’ conditions (Jacobs et al. 1985;
Greenlee and Langenheim 1990). As such, the
observed Old-growth forest may not represent a
‘‘control’’ or equilibrium understory community, and
the value of comparisons between timberland and
Old-growth reserve may be limited.
Richness estimators and accumulation curves
Though this study is the first to describe patterns of
understory vascular plant diversity in redwood forests
across a broad range of stand ages and developmental
stages, it follows a long list of studies aimed at
discovering the effects that logging has on the
communities that exist between the timber. In some
systems, vascular plant diversity may rebound
quickly from logging (Gilliam 2002; Gilliam et al.
1995; Peet and Christensen 1988; Roberts 2002),
while in others Old-growth communities may take
long periods of time to recover (Peterken and Game
1984, Whitney and Foster 1988; Dzwonko and Loster
1989) or may not recover at all (Duffy and Meier
1992). Even though understanding community recov-
ery is universally recognized as important to forest
conservation, and though species richness is almost
as universally used to investigate recovery rates,
explicit evaluation of the effects of abundance and
sampling efficacy on diversity metrics is not widely
used in ecological studies. This study adds to the
growing body of literature that examines the use of
non-parametric richness estimators, species accumu-
lation curves, and rarefaction curves to assess the
validity of comparisons among communities.
Comparisons across forest stages amount to com-
parisons across habitats. Since each habitat may have
idiosyncratic dynamics, within-stage sampling effi-
cacy may differ across habitats. For instance, the
‘‘more individuals’’ hypothesis suggests that species
richness is positively correlated with the number of
individuals, which in turn varies with energy avail-
ability (Currie and Paquin 1987; Currie 1991; Gaston
2000). Availability of both energy and nutrient
resources are drastically different across develop-
mental stages in forests (Toky and Ramakrishnan
1983). For this reason, the number of individuals and
species richness should be greater in recently dis-
turbed forest habitat that has been released from
canopy cover. Thus, for a fixed area in each habitat, a
different proportion of the communities of those
190 Plant Ecol (2008) 194:179–194
123
habitats will be sampled if number of individuals (or
biomass) correlates with richness.
Estimates of sampling efficacy suggested differ-
ences in sampling thoroughness across forest stages.
Both species–area and richness estimator curves
stabilized for the Initiation and Closure plots in this
study. The ICE and MMMeans curves not only
stabilized but also appeared to converge, suggesting
agreement with the results of the species area curves
for these habitats. Conversely, the Mature and Old-
growth curves stabilized using the species–area
approach, but they did not stabilize under rarefaction
and non-parametric estimation. Furthermore, the
curves for the older stages appear to be correlated
with sampling effort. This suggests that the Mature
and Old-growth habitats were not thoroughly sam-
pled, which is contrary to the results of the species–
area assessment.
There are several general implications of these
assessments. First, within-habitat sampling effi-
ciency may vary drastically among habitats. We
sampled 25 Mature plots and only 19 and 16
Closure and Initiation plots, respectively. And
though there are notable differences between the
habitats of the Initiation and Closure stages, each
was well sampled, whereas the Mature stage was
likely undersampled even though more sampling
effort occurred in this forest stage. Next, these
results suggest that balanced sampling designs may
be particularly poor at capturing the nuances of
communities in forest habitats at different develop-
mental stages. Finally, traditional tests may produce
misleading results if the communities being com-
pared are not thoroughly sampled.
Our results must be evaluated in light of the
sampling efficacy assessment. The rarefaction and
ICE results suggest that the community similarities
among the Closure and Mature stages may be an
artifact of under sampling the Mature stage. The ICE
estimate for the Managed stage nearly converged on
the estimate for the Initiation stage. Chazdon et al.
(1998) and Longino et al. (2002) consider a rising
ICE a good lower estimate of species richness, and
the Mature stage estimator curve was still rising at
maximal sampling effort. A more thorough sampling
of the Mature stage may have resulted in an average
richness similar to that of the Initiation stage and a
community composition distinct from the Closure
stage.
Assessment of the estimator curves for the Old-
growth stage is less straightforward. The behavior of
the curves for the Old-growth plots suggested insuf-
ficient sampling; all of the curves, except the Uniques
curve, were rising moderately steeply as sampling
approached completion. However, the Old-growth
final richness estimate was still much lower than
estimates for any other stage at almost any level of
sampling effort. Understory habitat in the upland
Old-growth forest may be completely occupied by
woody shrubs (personal observation). In short, irre-
spective of sampling efficacy, vascular plant species
richness in the Old-growth plots included in this
study was truly lower than in all other forest stages.
While it is critical to understand community
recovery in managed forest ecosystems, that under-
standing is contingent upon valid comparisons. To
the extent that methodological shortcomings are
masked by accepted protocols, our abilities to
discover patterns in nature are diminished. Nonethe-
less, the methods used in this study to address
sampling efficiency should by no means replace
traditional tools. Nor should these be used uncriti-
cally. The behavior of the ICE was inconsistent in
tests using tropical tree data for which total richness
was known (Chazdon et al. 1998). However, these
methods should be included in the ecological reper-
toire and used in conjunction with standard methods.
This is especially relevant to studies that inform
management of biodiversity, including the growing
body of literature aimed at understanding the effects
of logging on plant communities (e.g., Gilliam et al.
1995; Verheyen et al. 2003; Moola and Vasseur
2004). These studies have made numerous conclu-
sions without assessing sampling efficacy.
Future comparisons between forest stages should
be grounded in a thorough accounting of the species
present in each community coupled with tests of
within-stage sampling efficacy. This has long been
recognized (e.g., Sanders 1968; Bunge and Fitzpa-
trick 1993), and methods for interpolating and
extrapolating estimates that account for the relation-
ship between number of individuals and species
richness have been introduced in the ecological
literature (Heck et al. 1975; Colwell and Coddington
1994; Gotelli and Colwell 2001). Yet these methods
have not achieved widespread use (except see
Goldberg and Estabrook 1998; Longino et al. 2002
for recent examples).
Plant Ecol (2008) 194:179–194 191
123

Conclusion
In light of the differences in sampling efficacy across
forests stages, one might question the usefulness of
biological conclusions drawn from this study. If
diversity in the Mature an Old-growth stages was not
fully captured, do the ordination, ISA, and other
analyses instruct us? Indeed, a preliminary analysis,
which included 15 Old-growth plots, suggested
additional sampling in this stage. We collected more
data, found more species, and reinforced the patterns
found in the smaller data set. Unfortunately, the
pattern suggesting further data collection was also
reinforced. Importantly, the ordination and ISA
results are unlikely to change regardless of the
number of added plots. In these analyses, infrequent
species, defined as those that occur in fewer than a
percentage of plots, are removed to increase the
signal to noise ratio. So the conclusions based on the
common species are not likely to change. The
ordinations do in fact tell us something about the
relationships among forest stages even though the
communities were not sampled thoroughly.
Analyses of species richness and diversity, both
sensitive to differences in rare species, would change
drastically if sampling efficacy, not number of plots, in
each habitat was equal. This point is made quite clear
by considering that equal area sampling between
clearcut forest and Old-growth forest represents dras-
tically different actual areas of sampling since there
are large trees occupying habitat in one stage and none
in the other. Therefore, the conclusions in this study
based on species–area relationships were different
than those based on non-parametric estimators and
rarefaction curves, and the results that included the
additional data were different from those including
only the data specified by the species–area approach.
Use of richness estimators can improve our evaluation
of how logging impacts biological diversity and should
be standard components of future studies.
Acknowledgements We would like to thank Gordon Leppig
for his generous contributions of time and energy to this study.
We would also like to acknowledge Steve Sillett for editorial
commentary on an earlier version of this document, David
Hankin for his insights into our sampling methods, and two
anonymous reviewers for valuable comments. This study was
funded in part by generous contributions from the California
Department of Fish and Game, the Humboldt State University
Foundation, and the Humboldt State University Department of
Biological Sciences Master’s Grant program.
References
Andreassen K, Tomter SM (2003) Basal area growth models
for individual trees of Norway spruce, Scots pine, birch
and other broadleaves in Norway. For Ecol Manage
180:11–24
Battles JJ, Shlisky AJ, Barrett RH, Heald RC, Allen-Diaz BH
(2001) The effects of forest management on plant species
diversity in a Sierran conifer forest. For Ecol Manage
146:211–222
Bhattarai KR, Vetaas OR (2003) Variation in plant species
richness of different life forms along a subtropical ele-
vation gradient in the Himalayas, east Nepal. Global Ecol
Biogeogr 12:327–340
Brose U, Martinez ND, Williams RJ (2003) Estimating species
richness: sensitivity to sample coverage and insensitivity
to spatial patterns. Ecology 84:2364–2377
Bruno JF (2002) Causes of landscape-scale rarity in cobble
beach plant communities. Ecology 83:2304–2314
Bunge J, Fitzpatrick M (1993) Estimating the number of spe-
cies: a review. J Am Stat Assoc 88:364–373
Chazdon RL, Colwell RK, Denslow JS, Guariguata MR (1998)
Statistical methods for estimating species richness of
woody regeneration in primary and secondary rain forests
of NE Costa Rica. In: Dallmeier F, Comiskey JA (eds)
Forest biodiversity research, monitoring and modeling:
conceptual background and Old World case studies. Par-
thenon Publishing, Paris, pp 285–309
Chen J, Franklin JF, Spies TA (1992) Vegetation responses to
edge environments in old-growth Douglas-fir forests. Ecol
Appl 2:387–396
Clark JS, Maklin E, Wood L (1998) Stages and spatial scales of
recruitment limitation in southern Appalachian forests.
Ecol Monog 68:213–235
Colwell RK (2000) EstimateS: Statistical estimation of species
richness and shared species from samples (Software and
User’s Guide), Version 6. http://www.vice-
roy.eeb.uconn.edu/estimates
Colwell RK, Coddington JA (1994) Estimating terrestrial
biodiversity through extrapolation. Phil Trans Roy Soc
Lond B 345:101–118
Costa F, Magnusson W (2002) Selective logging effects on
abundance, diversity, and composition of tropical under-
story herbs. Ecol Appl 12:807–819
Currie DJ (1991) Energy and large-scale patterns of animal and
plant species richness. Am Nat 137:27–49
Currie DJ, Paquin V (1987) Large-scale biogeographical pat-
terns of species richness of trees. Nature 329:326–327
Dalling JW, Hubbell SP, Silvera K (1998) Seed dispersal,
seedling establishment and gap partitioning among tropi-
cal pioneer trees. J Ecol 86:674–689
Dalling JW, Muller-Landau HC, Wright SJ, Hubbell SP (2002)
Role of dispersal in the recruitment limitation of neo-
tropical pioneer species. J Ecol 90:714–727
Dawson TE (1998) Fog in the California redwood forest: eco-
system inputs and use by plants. Oecology 117:476–485
Dignan P, Bren L (2003) A study of the effect of logging on
the understory light environment in riparian buffer strips
in a south-east Australian forest. For Ecol Manage
172:161–172
192 Plant Ecol (2008) 194:179–194
123
Dilustro JJ, Collins BS, Duncan LK, Sharitz RR (2002) Soil
texture, land-use intensity, and vegetation of Fort Benning
upland forest sites. J Torr Bot Soc 129:289–297
Donohue K, Foster DR, Motzkin G (2000) Effects of the past
and present on species distribution: land-use history and
demography of wintergreen. J Ecol 88:303–316
Duffy DC, Meier AJ (1992) Do Appalachian herbaceous un-
derstories ever recover from clear-cutting? Con Bio
6:196–201
Dufrene M, Legendre P (1997) Species assemblages and
indicator species: the need for a flexible asymmetrical
approach. Ecol Monog 67:345–366
Dyrness CT (1973) Early stages of plant succession following
logging and burning in the western cascades of Oregon.
Ecology 54:57–69
Dzwonko Z, Loster S (1989) Distribution of vascular plant
species in small woodlands on the western Carpathian
foothills. Oikos 56:77–86
Foggo A, Rundle SD, Bilton DT (2003) The net result: eval-
uating species richness extrapolation techniques for lit-
toral pond invertebrates. Freshwater Biol 48:1756–1764
Foster DR, Aber JD, Melillo JM, Bowden RD, Bazzaz FA
(1997) Temperate forest response to natural catastrophic
disturbance and chronic anthropogenic stress. BioScience
47:437–445
Franklin JF (1982) Old-growth forests in the Pacific Northwest:
an ecological view. Pages 5 to 27 in old-growth forests: a
balanced perspective. University of Oregon, Bureau of
Governmental Research and Service, Eugene, Oregon,
USA
Franklin JF, Spies TA, Van Pelt R, Carey AB, Thornburgh DA,
Berg DR, Lendenmayer DB, Harmon ME, Keeton WS,
Shaw DC, Bible K, Chen J (2002) Disturbances and
structural development of natural forest ecosystems with
silvicultural implications, using Douglas-fir forests as an
example. Forest Ecol Manage 155:399–423
Frost EJ (1992) The effect of forest-clearcut edges on the
structure and composition of old-growth mixed conifer
stands in the western Klamath Mountains. Masters of Arts
thesis presented to Humboldt State University, California,
USA
Gaston KJ (2000) Global patterns in biodiversity. Nature
405:220–227
Gilliam FS (2002) Effects of harvesting on herbaceous layer
diversity of a central Appalachian hardwood forest in
West Virginia, USA. For Ecol Manage 155:33–43
Gilliam F, Turrill N, Adams MB (1995) Herbaceous-layer and
overstory species in clear-cut and mature central Appa-
lachian hardwood forests. Ecol Appl 5:947–955
Godefroid S, Koedam N (2003) Distribution pattern of the flora
in a peri-urban forest: an effect of the city-forest ecotone.
Landscape Urban Plan 65:169–185
Goldberg DE, Estabrook GF (1998) Separating the effects of
number of individuals sampled and competition on spe-
cies diversity: an experimental and analytic approach. J
Ecol 86:983–988
Gotelli NJ, Colwell RK (2001) Quantifying biodiversity: pro-
cedures and pitfalls in the measurement and comparison
of species richness. Ecol Lett 4:379–391
Greenberg CH, Neary DG, Haris LD, Linda SP (1995)
Vegetation recovery following high intensity fire and
silviculture treatments in sand pine scrub. Am Mid Nat
133:149–163
Greenlee JM, Langenheim JH (1990) Historic fire regimes and
their relation to vegetation patterns in the Monterey Bay
area of California. Am Mid Nat 124:239–253
Grime JP (1986) Predictions of terrestrial vegetation responses
to nuclear winter conditions. Int J Environ Stud 28:11–20
Gustafson EJ, Gardner RH (1996) The effect of landscape
heterogeneity on the probability of patch colonization.
Ecology 77:94–107
Halpern CB (1989) Early successional patterns of forest spe-
cies interactions of life history traits and disturbance.
Ecology 70:704–720
Halpern CB, Spies TA (1995) Plant species diversity in natural
and managed forests of the Pacific Northwest. Ecol Appl
5:913–934
Hannerz MK, Hanell B (1997) Effects on the flora in Norway
spruce forests following clearcutting and shelterwood
cutting. For Ecol Manage 90:29–49
Hardtle W, von Oheimb G, Wetphal C (2003) The effects of
light and soil conditions on the species richness of the
ground vegetation of deciduous forests in northern Ger-
many (Schleswig-Holstein). For Ecol Manage 182:327–
338
Harris SA (1987) Relationship of convection fog to charac-
teristics of the vegetation of Redwood National Park. M.S.
Thesis. Humboldt State University, CA USA
Harris LD, Maser C, McKee A (1982) Patterns of old-growth
harvest and implications for Cascades wildlife. Trans
North Am Wildlife Nat Resour Confer 47:374–392
Heck KL Jr, van Belle G, Simberloff D (1975) Explicit cal-
culation of the rarefaction diversity measurement and the
determination of sufficient sample size. Ecology 56:1459–
1461
Hickman JC (ed) (1993) The Jepson Manual: higher plants of
California. University of California Press, Berkeley, CA
Hintze J (2001) NCSS and PASS. Number Cruncher statistical
systems. Kaysville, Utah. www.ncss.com
Honnay O, Verheyen K, Butaye J, Jaquemyn H, Bossuyt B,
Hermy M (2002) Possible effects of habitat fragmentation
and climate change on the range of forest plant species.
Ecol Letts 5:525–530
Jacobs DF, Cole DW, McBride JR (1985) Fire history and
perpetuation of natural coast redwood ecosystems. J For
83:494–497
Jacquemyn H, Butaye J, Hermy M (2001) Forest plant species
richness in small fragmented mixed deciduous forest
patches: the role of area, time and dispersal limitation. J
Biogeogr 28:801–812
Jones MD, Durall DM, Cairney JWG (2003) Ectomycorrhizal
fungal communities in young forest stands regenerating
after clearcut logging. New Phytol 157:399–422
Jules ES (1998) Habitat fragmentation and demographic
change for a common plant: Trillium in old-growth forest.
Ecology 79:1645–1656
Jules ES, Frost EJ, Mills LS, Tallmon DA (1999) Ecological
consequences of forest fragmentation in the Klamath
Region. Nat Areas J 19:368–378
Jules ES, Rathcke BJ (1999) Mechanisms of reduced trillium
recruitment along edges of old-growth forest fragments.
Conserv Biol 13:784–793
Plant Ecol (2008) 194:179–194 193
123
Jules ES, Shahani PC (2003) A broader ecological context to
the fragmentation frenzy: why matrix habitat is more
important than we thought. J Veg Sci 14:459–464
Kwit CP, Platt WJ (2003) Disturbance history influences
regeneration of non-pioneer understory trees. Ecology
84:2575–2581
Lee S, Chao A (1994) Estimating population size via sample
coverage for closed capture-recapture models. Biometrics
50:88–97
Loehle C, Li B (1996) Habitat destruction and the extinction
debt revisited. Ecol Appl 6:784–789
Longino JT, Coddington J, Colwell RK (2002) The ant fauna of
a tropical rain forest: estimating species richness three
different ways. Ecology 83:689–702
Machon N, Bardin P, Mazer SJ, Moret J, Godelle B, Austerlitz
F (2003) Relationship between genetic structure and seed
and pollen dispersal in the endangered orchid Spiranthesspiralis. New Phytol 157:677–687
Matlack GR (1994) Plant species migration in a mixed-history
forest landscape in eastern North America. Ecology
75:1491–1502
McCune B, Mefford MJ (1999) PC-ORD. Multivariate analysis
of ecological data. Version 4.27. MjM Software, Glene-
den Beach, Oregon, U.S.A
Meier AJ, Brantton SP, Duffy DC (1995) Possible ecological
mechanisms for loss of vernal-herb diversity in logged
eastern deciduous forests. Ecol Appl 5:935–946
Moola FM, Vasseur L (2004) Recovery of late-seral vascular
plants in a chronosequence of post-clearcut forest stands
in coastal Nova Scotia, Canada. Plant Ecol 172:183–197
Oliver CD, Larson BC (1996) Forest stand dynamics. John
Wiley and Sons, Inc., New York, New York, USA
Peet RK, Christensen NL (1988) Changes in species diversity
during secondary forest succession on the North Carolina
Piedmont. In: During HJ, Werner MJ (eds) Diversity and
pattern in plant communities. SPB Academic Publishing,
The Hague, pp 233–245
Peterken GF, Game M (1984) Historical factors affecting the
number and distribution of vascular plant species in the
woodlands of central Lincolnshire. J Ecol 72:155–182
Primack RB, Maio SL (1992) Dispersal can limit local plant
distribution. Conserv Biol 6:513–519
Raaijmakers JGW (1987) Statistical analysis of the Michaelis–
Menten equation. Biometrics 43:793–803
Rasmussen HN (1995) Terrestrial orchids: from seed to my-
cotrophic plant. CambridgeUniversity Press, Cambridge
Roberts MR (2002) Effects of forest plantation management on
herbaceous-layer composition and diversity. Can J Bot
80:378–389
Roberts MR (2004) Response of the herbaceous layer to natural
disturbance in North American forests. Can J Bot
82:1273–1283
Roberts MR, Gilliam FS (1995) Patterns and mechanisms of
plant diversity in forested ecosystems: implications for
forest management. Ecol Appl 5:969–977
Roberts MR, Zhu L (2002) Early response of the herbaceous
layer to harvesting in a mixed coniferous-deciduous forest
in New Brunswick, Canada. For Ecol Manage 155:17–31
Ross KA, Fox BJ, Fox MD (2002) Changes to plant species
richness in forest fragments: fragment age, disturbance
and fire history may be as important as area. J Biogeogr
29:749–765
Ross-Davis AL, Frego KA (2002) Comparison of plantations
and naturally regenerated clearcuts in the Acadian Forest:
forest floor bryophyte community and habitat features.
Can J Bot 80:21–33
Russell WH, Jones C (2001) The effects of timber harvesting
on the structure and composition of adjacent old-growth
coast redwood forest, California, USA. Landscape Ecol
16:731–741
Sanders H (1968) Marine benthic diversity: a comparative
study. Am Nat 102:243–282
Sillett SC, McCune B, Peck JE, Rambo TR, Ruchty A (2000)
Dispersal limitations of epiphytic lichens result in species
dependent on old-growth forests. Ecol Appl 10:789–799
Stuart JD (1987) Fire history of an old-growth forest of Se-
quoia sempervirens (Taxodiaceae) forest in Humboldt
Redwoods State Park, CA. Madrono 34:128–141
Sullivan TP, Sullivan DS, Lindgren PMF (2001) Influence of
variable return harvest on forest ecosystems I. Diversity
and stand structure. J Appl Ecol 38:1221–1233
Tilman D, May RM, Lehman CL, Nowak MA (1994) Habitat
destruction and the extinction debt. Nature 371: 65–66
Toky OP, Ramakrishnan PS (1983) Secondary succession
following slash and burn agriculture in north-eastern In-
dia: nutrient cycling. J Ecol 71:747–757
Vandermeer J, Ricardo C (2001) Metapopulation dynamics and
the quality of the matrix. Am Nat 158:211–220
Verheyen K, Hermy M (2001) The relative importance of
dispersal limitation of vascular plants in secondary forest
succession in Muizen Forest, Belgium. J Ecol 89:829–840
Verheyen K, Guntenspergen GR, Biesbrouck B (2003) An
integrated analysis of the effects of past land use on forest
herb colonization at the landscape scale. J Ecol 91:731–
742
Walker B, Kinzig A, Langridge J (1999) Plant attribute
diversity, resilience, and ecosystem function: the nature
and significance of dominant and minor species. Ecosys-
tems 2:95–113
Walther BA, Martin JL (2001) Species richness estimation of
bird communities: how to control for sampling effort. Ibis
143:413–419
Watt MS, Whitehead D, Mason EG, Richardson B, Kimberley
MO (2003) The influence of weed competition for light
and water on growth and dry matter partitioning of young
Pinus radiata at a dryland site. For Ecol Manage
183:363–376
Whitney GC, Foster DR (1988) Overstory competition and age
as determinants of the understory flora of woods in central
New England. J Ecol 76:867–876
194 Plant Ecol (2008) 194:179–194
123