use of vis-nirs for land management classification with a
TRANSCRIPT

Cien. Inv. Agr. 41(1):21-32. 2014www.rcia.uc.cl
crop production
Introduction
Soil organic carbon (SOC) and its effects on soil fertility have been the subject of research for many
years. SOC content is becoming increasingly important, not only for the proper functioning of ecosystems but also for the socio-economic development of many regions of the world (Bationo et al., 2007; Komatsuzaki and Ohta, 2007). The Institute of Soil Science and Plant Cultivation – State Research Institute (IUNG-
research paper
Use of VIS-NIRS for land management classification with a support vector machine and prediction of soil organic carbon and other soil
properties
Guillaume Debaene, Dorota Pikuła, and Jacek NiedźwieckiInstitute of Soil Science and Plant Cultivation, State Research Institute, ul. Czartoryskich 8, 24-100 Puławy,
Poland.
Abstract
G. Debaene, D. Pikuła, and J. Niedźwiecki. 2014. Use of VIS-NIRS for land management classification with a support vector machine and prediction of soil organic carbon and other soil properties. Cien. Inv. Agr. 41(1): 21-32. The objective of this research was to investigate the effects of a long-term experiment on soil spectral properties and to develop prediction models of these properties (soil organic carbon (SOC), N, pH, Hh, P2O5, K2O, Ca, Mg, K, and Na content) from texturally homogeneous samples (loamy sand). To this aim, chemometric techniques, such as partial least square (PLS) regression and support vector machine (SVM) classification, were used. Our results show that visible and near infrared spectroscopy (VIS-NIRS) is suitable for the prediction of properties of texturally homogeneous samples. The effects of fertilizer applications were sufficient to modify the soil chemical composition to a range suitable for using VIS-NIRS for calibration and modeling purposes. The best results were obtained for SOC and N content prediction using the full dataset with cross-validation (r2 = 0.76, RMSECV = 0.04, RPD = 2.02 and r2 = 0.81, RMSECV = 0.01, RPD = 2.20, respectively) and with an independent validation dataset (r2 = 0.70, RMSEP = 0.04, RPD = 1.80 and r2 = 0.73, RMSEP = 0.03, RPD = 1.22, for SOC and N content, respectively). The use of fertilizers and the type of crop rotation appear to have a significant impact on soil spectral properties; the SVM methodology with a linear kernel function was able to classify soil samples as functions of the applied doses of organic and inorganic fertilizers with 75% accuracy with cross-validation and the type of crop rotation with more than 90% accuracy with full validation of separate datasets.
Key words: Manure, near-infrared spectroscopy, nitrogen fertilizer, partial least square regression, soil organic carbon, Support Vector Machine.
Received April 30, 2013. Accepted February 25, 2014.Corresponding author: [email protected]
DOI: 10.4067/s0718-16202014000100003
ciencia e investigación agraria22
PIB) conducts extensive field experiments at the Grabów experimental station near Puławy (Eastern Poland). One of the main objectives of these studies is to track the influence of differ-ent plant species growing in two rotations with and without legumes and to compare these with the regular use of different doses of manure to monitor SOC content in the soil.
Changes in SOC content occur slowly and there-fore can be monitored in long-term experiments. It is well known that different crop rotations influence not only crop yield but also many soil characteristics, such as SOC content (Powlson et al., 2011, Rutkowska and Pikuła, 2013). Moreover, the content of SOC can vary depending on soil texture and land use.
Visible and near infrared spectroscopy (VIS-NIRS) is a rapid, low-cost, and efficient method for characterizing soils and can be used to ana-lyze several constituents simultaneously (Brown et al., 2005; Reeves et al., 2009; Stenberg et al., 2010; Debaene et al., 2014). Moreover, the method is easy to implement, does not require any chemicals, and is non-destructive. With the rise of precision (site-specific) agriculture, chemical and physical characteristics of many samples from a limited area are needed and conventional laboratory analysis is often too costly.
VIS-NIRS can aid in estimating soil carbon con-tent (Aïchi et al., 2009; Ladoni et al., 2010) and these data are particularly important for future global carbon research as soils are regarded as potential sinks or sources of atmospheric carbon. Partial least square (PLS) regression is one of the most popular methods for calibration used in combination with VIS-NIRS (Brown et al., 2005). A support vector machine (SVM) is a machine learning technique that is used for classification and regression based on statistical learning. A detailed description can be found in Noble (2006). We present the use of this data mining method to classify soil samples as a function of their
land management history (manure, N-fertilizer application, and crop rotation).
The aim of this research was (1) to examine the suitability of VIS-NIRS to determine SOC, N content and other soil properties from texturally homogeneous soil samples treated with different amounts of organic and inorganic fertilizers and (2) to classify soil samples according to their land management history (crop rotation, fertilizer ap-plication) using a support vector machine.
Materials and methods
Samples
Forty soil samples were collected from the topsoil (0-30 cm) at the site of a long-term static experi-ment started in 1980 at the Grabów Experimental Station (IUNG-PIB), Puławy, on a loamy sand (USDA soil classification). According to the World Reference Base (WRB, 1998), the soil is an Albic Luvisol. The samples were air dried and sieved at 2 mm with no further treatments.
Experimental design
The field experiment was conducted as a three–factor system:
Factor I: crop rotation A- without plants consid-ered to enrich soil with organic carbon (potato, winter wheat, spring barley and corn silage), and B- with plants promoting the formation of soil humus (potato, winter wheat + mustard, spring barley and a mixture of clover with grasses).
Factor II (autumn application): five levels of increas-ing doses of wet manure, 0, 20, 40, 60 and 80 t∙ha-1 which corresponded to the average rates of 0, 98, 188, 282 and 372 kg N·ha-1 for the four crop rotation.
Factor III (autumn application): application of four levels of mineral nitrogen fertilizers at the rates
23VOLUME 41 Nº1 JANUARY – APRIL 2014
suitable for N requirements of the species: N0- no nitrogen, N1- 170 kg N ha-1 in crop rotation A and 275 kg N ha-1 in crop rotation B, N2- 340 kg N ha-1 in crop rotation A and 550 kg N ha-1 in crop rotation B and N3- 510 N ha-1 in crop rotation A and 825 kg N ha-1 in crop rotation B per rotation.
The experiment was established in 1980 using a randomized split-block layout in two cycles offset by one year.
The results of soil organic carbon content are presented for two crop rotations, rotation A (with maize) and rotation B (with clover-grass mixture), during the years 2004-2007.
A detailed description of the experimental design can be found in Rutkowska and Pikuła (2013). One soil sample of each split-block was collected after 27 years of the experiment and seven rotations (A and B). Samples were collected in August after the last crop was harvested, after maize in crop rotation A and after the clover-grass mixture in crop rotation B. In total, there are 20 samples from crop rotation A and 20 from crop rotation B (Factor I), five sets of 8 samples treated with 0, 98, 188, 282 and 372 kg N ha-1 of wet manure (Factor II), and four sets of 10 samples that were treated with different amounts of N-fertilizers (Factor III, see above for rates of application as a function of the crop rotation). These sets (classes) were used for the SVM classification.
Straw was always removed from the field in this experiment. Chemical analyses were performed on soil samples after one full rotation of the two crops, with and without legumes (years of research 2004-2007). The samples (mean for four replications) were analyzed for the concentra-tion of soil organic carbon compounds (SOC) using the Turin method, total nitrogen content (N) according to the Kjeldahl method, and P2O5 and K2O (exchangeable cations) according to the Egner method. The hydrolytic acidity (Hh) was determined according to the Kappen method. This is the first time, to the authors’ knowledge,
that Hh has been predicted using VIS-NIRS technology. This parameter is important in soil science because it gives information about the lime requirements for acidic soils, which are typical in Poland. All chemical analyses were performed at the IUNG Main Chemical Labora-tory in Puławy according to methods described previously (Debaene et al., 2010).
Spectral acquisition
Spectral analysis was performed using the Veris® VIS-NIR spectrophotometer in bench top mode (Veris Technologies, Salina, KS, USA) in the 350-2220 nm spectral range using Veris spectro-photometer software V1.74. The sample holder was placed against the face of the sapphire window of the shank module that contained a tungsten halogen lamp and fiber optics for transmission to the spectrometer. Samples were scanned 20 times and averaged by the software and data were collected every 5 nm. The absorbance of the scanned samples is given by the relation log (1/R) where R is the reflectance.
Calibration schemes
Standard normal variate (SNV) and first and second Savitzky-Golay derivatives were applied to the raw spectra as mathematical pretreatments. The spectrum from each sample was matched with laboratory analysis data to create a database for calibrations. A multivariate calibration technique is required to obtain some practical information from the VIS-NIRS spectra. PLS regression was used to determine the best correlation between the chemical and spectra data. The PLS is a dimen-sion reduction technique that seeks a set of latent variables by maximizing the covariance of two variable blocks (i.e., spectra X and concentration Y). The number of latent variables to be used in the model is given by the minimized prediction error or Root Mean Square Error (RMSE). All data pretreatments and calibrations were devel-
ciencia e investigación agraria24
oped with Unscrambler X® (Camo AS, Oslo, Norway). Due to the small dataset (40 samples), the best option was to use cross-validation (CV) of the full dataset though, a few other calibra-tion schemes were also investigated. First, the entire dataset was used for CV. Cross-validation was also applied to the two datasets from the different plant assemblages (scheme A and B, 20 samples each). To check the validity of the models but also to examine the effect of such a small dataset on calibration, the dataset was split in two to obtain a calibration and a validation set. Five and ten samples were taken out and used as an independent validation set (for calibration n = 35 and n = 30, respectively).
Soil classification with the SVM method was also completed using Unscrambler X®. Two support vector classification (SVC) methods were tested, type 1 (C-SVC, 0 < C < ∞) and type 2 (nu-SVC, 0 < nu < 1), with a linear kernel function for the separation of classes.
Results and discussion
Results of physical and chemical analyses
The summary statistics of the chemical analyses and correlation matrix of soil properties are provided in Table 1. These statistics are only informative because each sample comes from a different land management history. The soil is acidic (pH ± 5) with low SOC and N contents (0.69 and 0.07 g kg-1, respectively), lower than typical Polish soils. The correlation between available Mg (Mga) and total Mg and between exchangeable K and total K are most likely due to the addition of cation forms by the N-fertilizer and manure. These correlations were already observed in Polish soils (Fotyma, 2007) but were assumed to be related to soil tex-ture. The strong correlation between SOC and N (r = 0.94, P>0.05) has been observed previously (Bationo et al., 2007; Liu et al., 2012) and could be due to manure and N-fertilizer applied at different doses in each parcel (plot), therefore inducing a
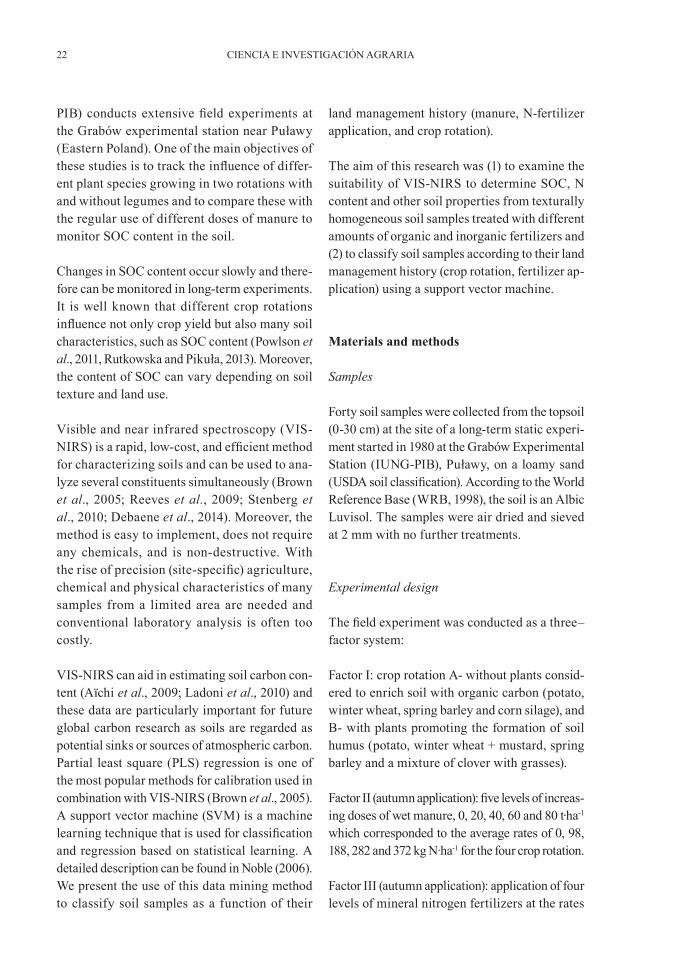
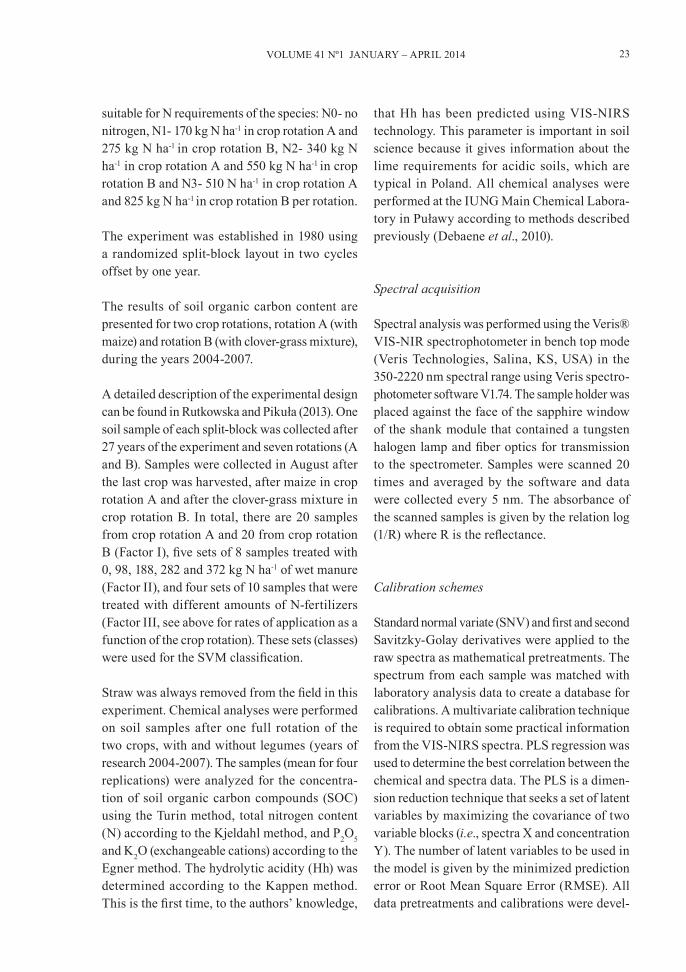
correlation between SOC and N because the N content in soil is almost entirely dependent on the organic matter content. Hh is related to the concentration of acidic hydroxyl groups on soil surfaces inducing the strong negative correlation between pH and Hh. Figure 1 presents a ternary diagram of the samples’ texture. Our 40 samples were texturally homogeneous and located in a loamy sand region (USDA texture classes), which helps to minimize the effect of soil texture on the reflectance spectra.
Partial least square regression and prediction
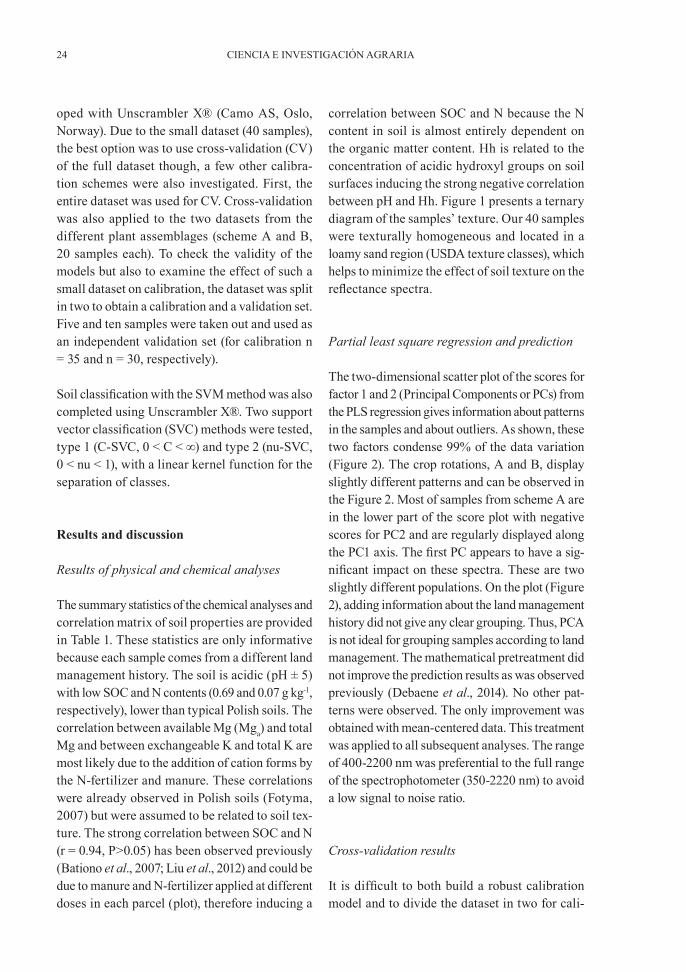
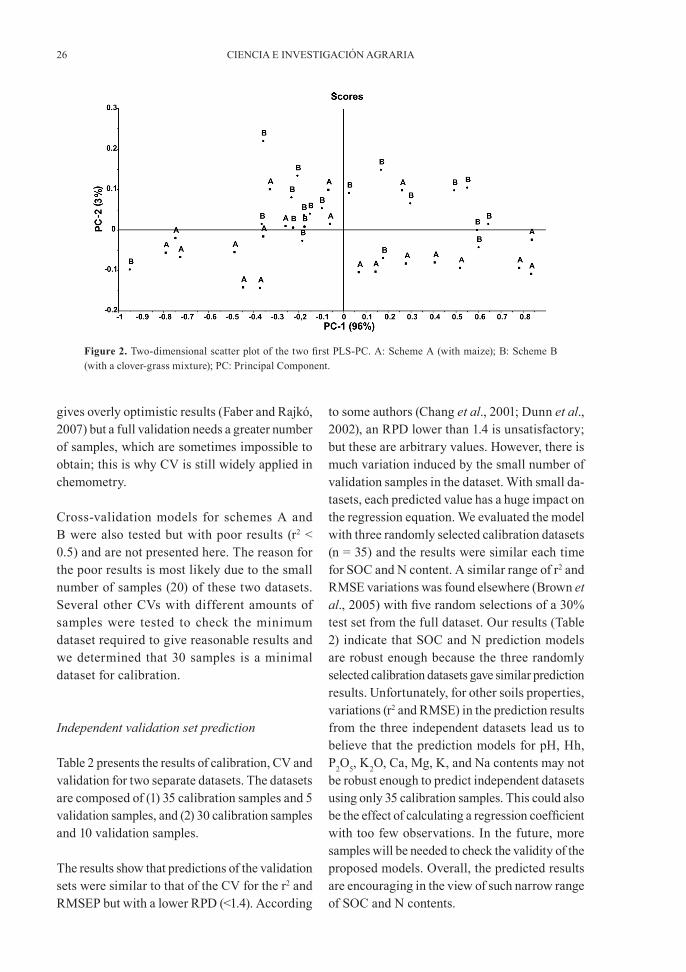
The two-dimensional scatter plot of the scores for factor 1 and 2 (Principal Components or PCs) from the PLS regression gives information about patterns in the samples and about outliers. As shown, these two factors condense 99% of the data variation (Figure 2). The crop rotations, A and B, display slightly different patterns and can be observed in the Figure 2. Most of samples from scheme A are in the lower part of the score plot with negative scores for PC2 and are regularly displayed along the PC1 axis. The first PC appears to have a sig-nificant impact on these spectra. These are two slightly different populations. On the plot (Figure 2), adding information about the land management history did not give any clear grouping. Thus, PCA is not ideal for grouping samples according to land management. The mathematical pretreatment did not improve the prediction results as was observed previously (Debaene et al., 2014). No other pat-terns were observed. The only improvement was obtained with mean-centered data. This treatment was applied to all subsequent analyses. The range of 400-2200 nm was preferential to the full range of the spectrophotometer (350-2220 nm) to avoid a low signal to noise ratio.
Cross-validation results
It is difficult to both build a robust calibration model and to divide the dataset in two for cali-
25VOLUME 41 Nº1 JANUARY – APRIL 2014
results for CV were obtained for SOC and N contents with r2 = 0.76, RMSECV = 0.04, RPD = 2.02 and r2 = 0.81, RMSECV = 0.01, RPD = 2.20, respectively (RPD = Ratio of Performance Deviation). The other chemical properties most likely require more samples to increase their prediction capabilities. Typically, cross-validation
bration and validation with only forty samples because the calibration set needs to encompass all variations of the soil properties to be predicted. In such case, cross-validation is usually adopted as a means to overcome that problem (Martens and Dardenne, 1998). The results of the full CV are presented in Table 2. The best prediction
Figure 1. Soil samples (n = 40) texture ternary diagram. In between the dotted lines is the loamy sand region.
Table 1. Summary statistics of soil samples (n = 40) and correlation matrix of soil properties.
pH N SOC P2O5 K2O Mga Ca Mg K Na Hh
Mean 5.17 0.07 0.69 11.94 9.12 1.25 52.43 1.38 9.75 0.43 2.02Max 5.68 0.09 0.86 19.50 16.80 2.10 60.50 2.54 15.61 1.11 2.78Min 4.48 0.03 0.55 6.20 2.50 0.40 38.50 0.46 3.18 0.22 1.56Range 1.20 0.06 0.31 13.30 14.30 1.70 22.00 2.08 12.43 0.89 1.22SD 0.31 0.01 0.08 3.81 3.91 0.45 5.06 0.50 3.59 0.17 0.32
pH N SOC P2O5 K2O Mga Ca Mg K Na HhpH 1N -0.44 1SOC -0.31 0.94 1P2O5 0.78 -0.53 -0.40 1K2O 0.81 -0.50 -0.41 0.88 1Mga 0.50 0.35 0.41 0.44 0.52 1Ca 0.83 0.04 0.12 0.58 0.64 0.71 1Mg 0.44 0.38 0.41 0.37 0.46 0.95 0.69 1K 0.82 -0.42 -0.33 0.88 0.97 0.59 0.68 0.53 1Na 0.50 -0.46 -0.46 0.62 0.64 0.14 0.31 0.23 0.61 1Hh -0.93 0.63 0.49 -0.74 -0.78 -0.33 -0.70 -0.28 -0.76 -0.55 1
Concentrations in g kg-1; Hh in cmol kg-1; Max, Min: maximum and minimum values; SD: standard deviation; Mga: available Mg; and SOC: soil organic carbon. Italicized values: P>0.05.
ciencia e investigación agraria26
to some authors (Chang et al., 2001; Dunn et al., 2002), an RPD lower than 1.4 is unsatisfactory; but these are arbitrary values. However, there is much variation induced by the small number of validation samples in the dataset. With small da-tasets, each predicted value has a huge impact on the regression equation. We evaluated the model with three randomly selected calibration datasets (n = 35) and the results were similar each time for SOC and N content. A similar range of r2 and RMSE variations was found elsewhere (Brown et al., 2005) with five random selections of a 30% test set from the full dataset. Our results (Table 2) indicate that SOC and N prediction models are robust enough because the three randomly selected calibration datasets gave similar prediction results. Unfortunately, for other soils properties, variations (r2 and RMSE) in the prediction results from the three independent datasets lead us to believe that the prediction models for pH, Hh, P2O5, K2O, Ca, Mg, K, and Na contents may not be robust enough to predict independent datasets using only 35 calibration samples. This could also be the effect of calculating a regression coefficient with too few observations. In the future, more samples will be needed to check the validity of the proposed models. Overall, the predicted results are encouraging in the view of such narrow range of SOC and N contents.
gives overly optimistic results (Faber and Rajkó, 2007) but a full validation needs a greater number of samples, which are sometimes impossible to obtain; this is why CV is still widely applied in chemometry.
Cross-validation models for schemes A and B were also tested but with poor results (r2 < 0.5) and are not presented here. The reason for the poor results is most likely due to the small number of samples (20) of these two datasets. Several other CVs with different amounts of samples were tested to check the minimum dataset required to give reasonable results and we determined that 30 samples is a minimal dataset for calibration.
Independent validation set prediction
Table 2 presents the results of calibration, CV and validation for two separate datasets. The datasets are composed of (1) 35 calibration samples and 5 validation samples, and (2) 30 calibration samples and 10 validation samples.
The results show that predictions of the validation sets were similar to that of the CV for the r2 and RMSEP but with a lower RPD (<1.4). According
Figure 2. Two-dimensional scatter plot of the two first PLS-PC. A: Scheme A (with maize); B: Scheme B (with a clover-grass mixture); PC: Principal Component.
27VOLUME 41 Nº1 JANUARY – APRIL 2014
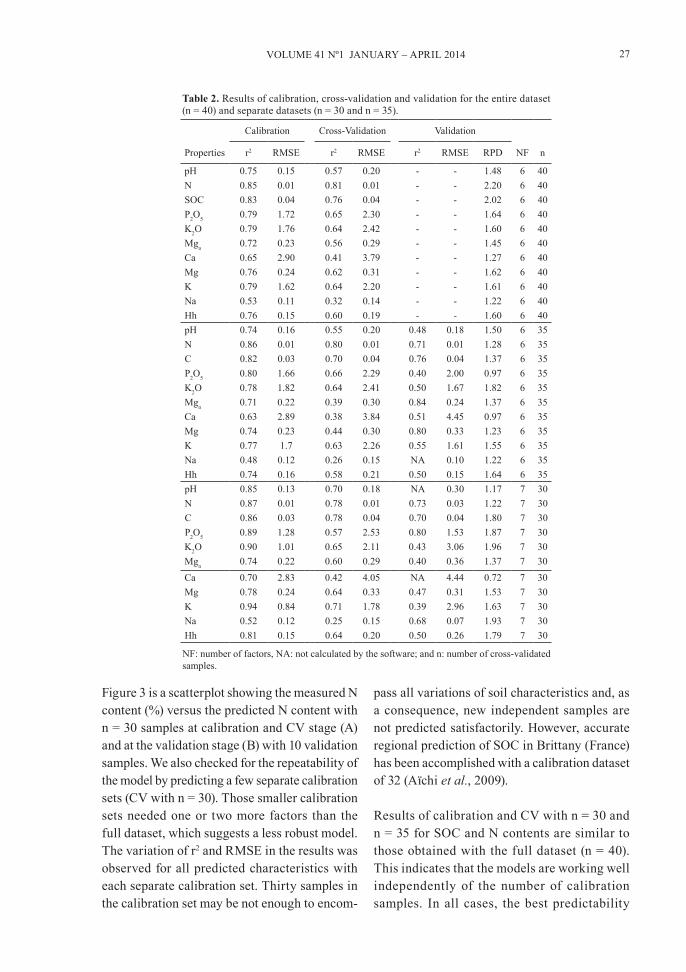
Table 2. Results of calibration, cross-validation and validation for the entire dataset (n = 40) and separate datasets (n = 30 and n = 35).
Properties
Calibration Cross-Validation Validation
NF nr2 RMSE r2 RMSE r2 RMSE RPD
pH 0.75 0.15 0.57 0.20 - - 1.48 6 40N 0.85 0.01 0.81 0.01 - - 2.20 6 40SOC 0.83 0.04 0.76 0.04 - - 2.02 6 40P2O5 0.79 1.72 0.65 2.30 - - 1.64 6 40K2O 0.79 1.76 0.64 2.42 - - 1.60 6 40Mga 0.72 0.23 0.56 0.29 - - 1.45 6 40Ca 0.65 2.90 0.41 3.79 - - 1.27 6 40Mg 0.76 0.24 0.62 0.31 - - 1.62 6 40K 0.79 1.62 0.64 2.20 - - 1.61 6 40Na 0.53 0.11 0.32 0.14 - - 1.22 6 40Hh 0.76 0.15 0.60 0.19 - - 1.60 6 40pH 0.74 0.16 0.55 0.20 0.48 0.18 1.50 6 35N 0.86 0.01 0.80 0.01 0.71 0.01 1.28 6 35C 0.82 0.03 0.70 0.04 0.76 0.04 1.37 6 35P2O5 0.80 1.66 0.66 2.29 0.40 2.00 0.97 6 35K2O 0.78 1.82 0.64 2.41 0.50 1.67 1.82 6 35Mga 0.71 0.22 0.39 0.30 0.84 0.24 1.37 6 35Ca 0.63 2.89 0.38 3.84 0.51 4.45 0.97 6 35Mg 0.74 0.23 0.44 0.30 0.80 0.33 1.23 6 35K 0.77 1.7 0.63 2.26 0.55 1.61 1.55 6 35Na 0.48 0.12 0.26 0.15 NA 0.10 1.22 6 35Hh 0.74 0.16 0.58 0.21 0.50 0.15 1.64 6 35pH 0.85 0.13 0.70 0.18 NA 0.30 1.17 7 30N 0.87 0.01 0.78 0.01 0.73 0.03 1.22 7 30C 0.86 0.03 0.78 0.04 0.70 0.04 1.80 7 30P2O5 0.89 1.28 0.57 2.53 0.80 1.53 1.87 7 30K2O 0.90 1.01 0.65 2.11 0.43 3.06 1.96 7 30Mga 0.74 0.22 0.60 0.29 0.40 0.36 1.37 7 30Ca 0.70 2.83 0.42 4.05 NA 4.44 0.72 7 30Mg 0.78 0.24 0.64 0.33 0.47 0.31 1.53 7 30K 0.94 0.84 0.71 1.78 0.39 2.96 1.63 7 30Na 0.52 0.12 0.25 0.15 0.68 0.07 1.93 7 30Hh 0.81 0.15 0.64 0.20 0.50 0.26 1.79 7 30
NF: number of factors, NA: not calculated by the software; and n: number of cross-validated samples.
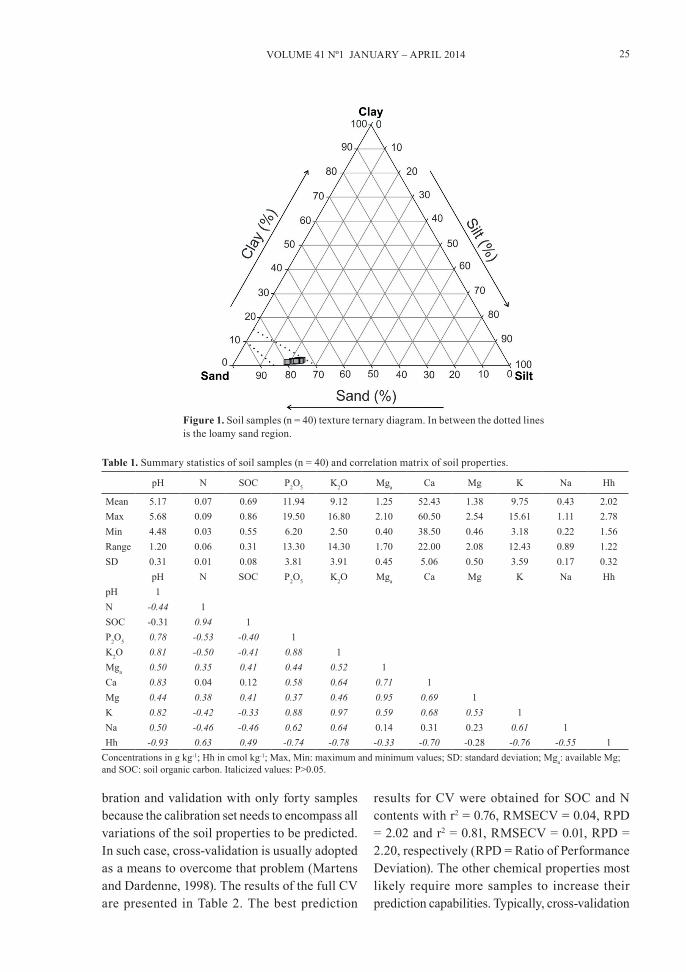
Figure 3 is a scatterplot showing the measured N content (%) versus the predicted N content with n = 30 samples at calibration and CV stage (A) and at the validation stage (B) with 10 validation samples. We also checked for the repeatability of the model by predicting a few separate calibration sets (CV with n = 30). Those smaller calibration sets needed one or two more factors than the full dataset, which suggests a less robust model. The variation of r2 and RMSE in the results was observed for all predicted characteristics with each separate calibration set. Thirty samples in the calibration set may be not enough to encom-
pass all variations of soil characteristics and, as a consequence, new independent samples are not predicted satisfactorily. However, accurate regional prediction of SOC in Brittany (France) has been accomplished with a calibration dataset of 32 (Aïchi et al., 2009).
Results of calibration and CV with n = 30 and n = 35 for SOC and N contents are similar to those obtained with the full dataset (n = 40). This indicates that the models are working well independently of the number of calibration samples. In all cases, the best predictability

ciencia e investigación agraria28
was observed for SOC and N content. It can be explained by the fact that those two properties have a small range of values (Table 1), which means that every possible dataset will exhibit similar properties. For some other chemical properties, the variations are important and some datasets used for calibration will not present the full range of values. Moreover, C and N have a direct spectral response in the near-infrared range. Some properties (P2O5, Mga, Mg, and Na) resulted in a better r2 for the predicted dataset and most of the predictive errors of the validated datasets were lower than that of calibration and cross-validation. This has been observed previously (Martens and Dardenne, 1998) and it was demonstrated that removing samples from an already limited set of available samples dramatically reduced the predictive performance of the calibrated
models and, at the same time gave uncertain, systematically overly optimistic assessments of the models’ predictive performance.
Finally, the r2 values from Unscrambler® X are estimated from the explained variance as a percentage of the validation (predicted samples). When plotting a scatter plot of the measured vs. calculated values and calculating the correlation, the r2 (Pearson) are close to unity, e.g., 0.96 for N compared with a value of r2 = 0.73 here (Table 2).
Support Vector Machine classification of the samples
Unlike the PLS regression, the SVM classification was best in the range of 350-2220 nm.
Figure 3. Measured vs. predicted N content (%). A. Calibration (dashed line and crosses) and cross-validation (plain line and dots). B. Validation.

29VOLUME 41 Nº1 JANUARY – APRIL 2014
For the SVM method, due to the small number of samples, we used the entire dataset for cross-validation first. The same spectra pretreatments were tested. The results were much improved using area normalization, performed by calculat-ing and equalizing the area under each spectral curve. The SVM results are typically presented in the form of a confusion matrix (CM). A confusion matrix is a specific table layout that allows visualization of the performance of an algorithm. Each column of the matrix represents the instances in a predicted class, while each row represents the instances in an actual class. As an example of a CM, the manure application SVM classification is presented in Table 3. The overall SVM performance is presented in Table 4. In that table, the CM results and independent dataset classification are given in a percentage form. For the full validation (FV), separate datasets (n = 10) were used for classification. The results are the means of three separate replicates of randomly selected samples. These replicate means served as a check to verify that the good results were not an undesired effect of chance.
As shown in Table 3, six samples were correctly attributed to class 1 (0 t ha-1), class 2 (20 t ha-1), and class 3 (40 t ha-1). Sample attribution to class 4 (60 t ha-1) is the poorest (5 samples out of 8). The best classification is for class 5 (80 t ha-1) with seven samples out of eight correctly attributed. Each amount of manure application appears to have the same impact on the SVM classification. Overall, 30 samples out of 40 (75%) were cor-rectly classified. These results are encouraging but more investigation is needed to increase the accuracy of the classification.
For the classification of soil as a function of the land management, nu-SVC performed better than C-SVC (Table 4). The default nu value (0.5) and C (1) were used.
The crop rotation classification (with two classes) with cross-validation was accurate at 85% and three independent datasets were perfectly classified
(100%). The conclusion is that the crop rotation or the plant cover had an extensive impact on the soil spectra in these plots.
The classification of the dose of organic and in-organic fertilizer also shows promising results. Cross-validation was accurate at 75% for both. The classification of the independent dataset was not as accurate. This requires more samples to cover all variations and, in validating 10 samples, each error reduces the accuracy by 10%.
The results obtained with the SVM classifica-tion are encouraging especially because all samples were of similar texture from one type of soil (loamy soil). Previously (Li et al., 2009), a SVM was successfully applied to discriminate among four different types of soils based on soil spectra in the 421-1075 nm range. In that
Table 4. SVM land management classification performance.
SVM NC Validation
C-SVC nu-SVC% correct
classificationCrop rotation (A- B) 2 CV 82 85
2 FV (10) 90 100Manure application 5 CV 70 75
5 FV (10) 70 60N-fertilizer 4 CV 68 75
4 FV (10) 60 60
A, B: crop rotation, scheme A or B; NC: number of classes to classify; CV: cross-validation; and FV: full validation of separate datasets, 10 – number of independent samples to classify.
Table 3. Confusion matrix for the classification of the dose of manure applied.
Predicted Actual 1 2 3 4 5% correct
classification
1 6 0 0 0 0 75
2 1 6 1 2 1 75
3 1 1 6 0 0 75
4 0 0 0 5 0 62.5
5 0 1 1 1 7 87.5
Total - - - - - 75
In italics, the correctly predicted class (number of samples) with the last column indicating the percentage of correct classifications per class.The classes 1 to 5 represent the level of manure application (0, 20, 40, 60, 80 t ha-1).

ciencia e investigación agraria30
case, soils were coming from different regions and were of different types so the spectra were quite dissimilar for some peaks; this was not the case in our samples because of the homo-geneous texture. Moreover, in their research, a principal component analysis (PCA) already clearly separated the samples into four distinct classes. This is not the case in the present study (Figure 2). Soil texture has an impact on the VIS-NIRS spectra because the shape, size and arrangement of the particles can affect the path of the light in transmission and reflectance (Chang et al., 2001). We conclude that a SVM worked here because of the difference in chemical and physical properties due to the manure/fertilizer. These differences appear to be enough to train the SVM (Kovačević et al., 2010).
Forty samples from a texturally homogeneous field (loamy sand) but with different land manage-ment histories (manure, N-fertilizer application and crop rotation) were selected and analyzed with VIS-NIRS. Our results confirm previous research (Reeves et al., 2009; Stenberg et al., 2010; Debaene et al., 2014) on the suitability of VIS-NIRS for rapid analysis of several soil properties, especially N and SOC content (Aïchi et al., 2009; Ladoni et al., 2010). This was the first attempt at predicting Hh using VIS-NIRS technology (r2 = 0.60; RMSE = 0.19), a very important parameter for light acidic soils. Our results show that a calibration set should include more than 30 samples and most likely more than 40. It was possible to detect small variations of SOC and N contents with good predictability even with a very narrow range
of contents (e.g., 0.06 g kg-1 for SOC). Because the soil texture of these samples was almost identical, the predictive ability must be induced by some changes in the chemical properties of the samples from the land management. The change in soil properties generated changes in the VIS-NIR spectral response that were used for soil classification.
A support vector machine has seldom been used for soil classification, but its applications are growing quickly. The results of using SVM methodology with a linear kernel function to classify soil samples as a function of the dose of fertilizer application were classified with more than 75% accuracy with CV for the type of crop rotation and with 100% accuracy (full validation) for separate datasets. The results presented here underline the capability of a SVM to classify and discriminate among soil samples. More investigations in using this methodology should be conducted in the future.
To observe in more detail the effects of manure or of N-fertilizers on the soil spectra, more samples are needed for future studies. These results could help improve the understanding and the utilization of remote and proximal sensing for soil classification.
Acknowledgement
This research was partially financed by the National Science Center (NCN - Poland) with decision number DEC-2012/07/B/ST10/04387.
Resumen
G. Debaene, D. Pikuła y J. Niedźwiecki. 2014. Uso de VIS-NIRS para la clasificación de ordenación de tierras con máquinas de soporte vectorial y predicción del contenido del carbón orgánico del suelo y otras propiedades del suelo. Cien. Inv. Agr. 41(1): 21-32. El objetivo del presente estudio fue analizar los resultados de un experimento a largo plazo, concerniente a las propiedades espectrales del suelo y desarrollar un modelo de pronóstico de estas propiedades (el contenido del carbón orgánico del suelo, N, pH, pH, Hh, P2O5, K2O, Ca, Mg, K, y Na) a base de muestras homogéneas en términos de textura (arena arcillosa). Para

31VOLUME 41 Nº1 JANUARY – APRIL 2014
este propósito se han aplicado métodos quimiométricos, tales como la regresión de mínimos cuadrados parciales y la clasificación de las máquinas de soporte vectorial. Los resultados demuestran que la espectroscopia visible y del infrarrojo cercano e espectroscopia (VIS-NIRS) constituye un método adecuado para el pronóstico de propiedades de las muestras homogéneas en términos de textura. Los efectos de la aplicación del fertilizante eran suficientes para la modificación de la composición química del suelo hasta alcanzar el rango que permitió el uso de VIS-NIRS para la calibración y modelización. Los mejores resultados para el pronóstico del contenido del carbón orgánico del suelo y N se obtuvieron utilizando el conjunto completo de datos con la validación cruzada (r2 = 0,76, error cuadrático medio con validación cruzada (RMSECV) = 0,04, diferencia porcentual relativa (RPD) = 2,02 y r2 = 0,81, RMSECV = 0,01, RPD = 2,20, respectivamente) y el conjunto de datos con validación independiente (r2 = 0,70, error cuadrático medio de predicción (RMSEP) = 0,04, RPD = 1,80 y r2 = 0,73, RMSEP = 0,03, RPD = 1,22, respectivamente). El uso de fertilizantes y el tipo de rotación de cultivos parecen tener impacto significativo sobre las propiedades espectrales den suelo, ya que con el uso de la metodología de máquinas de soporte vectorial con función lineal nuclea se logró la identificación de muestras del suelo como funciones de dosis administradas de fertilizantes orgánicos e inorgánicos con el 75% de exactitud con validación cruzada y el tipo de rotación de cultivos con la exactitud superior al 90% con validación completa de conjuntos de datos separados.
Palabras clave: Carbono orgánico del suelo, espectroscopía del infrarrojo cercano, estiércol, fertilizante nitrogenado, máquinas de vectores soporte, regresión mínimos cuadrados parciales.
References
Aïchi, H., Y. Fouad, C. Walter, R.A. Viscarra Ros-sel, Z.L. Chabane, and M. Sanaa. 2009. Regional predictions of soil organic carbon content from spectral reflectance measurements. Biosystems Engineering 104:442-446.
Bationo, A., J. Kihara, B. Vanlauwe, B. Waswa, and J. Kimet. 2007. Soil organic carbon dynamics. functions and management in West African agro-ecosystems. Agricultural Systems 94:13-25.
Brown D.J., R.S. Bricklemyer, and P.R. Miller. 2005. Validation requirements for diffuse reflectance soil characterization models with a case study of VNIR soil C prediction in Montana. Geoderma 129:251-267.
Chang, C.W., D.A. Laird, M.J. Mausbach, and C.R. Hurburgh. 2001. Near-Infrared Reflectance Spectroscopy‒Principal Component Regression Analyses of Soil Properties. Soil Science Society of America Journal 65:480-490.
Debaene, G., J. Niedźwiecki, and A. Pecio. 2010. Visible and near-infrared spectrophotometer for soil analysis: preliminary results. Polish Journal of Agronomy 3:3-9.
Debaene, G., J. Niedźwiecki, A. Pecio, and A. Żurek. 2014. Effect of the number of calibration samples on the prediction of several soil proper-ties at the farm-scale. Geoderma 214-215:114-125.
Dunn, B.W., H.G. Beecher, G.D. Batten, and S. Ciava-rella. 2002. The potential of near-infrared reflectance spectroscopy for soil analysis ‒ a case study from the Riverine Plain of southeastern Australia. Australian Journal of Experimental Agriculture 42:607-614.
Faber, N.M., and R. Rajkó. 2007. How to avoid over-fitting in multivariate calibration – The conven-tional validation approach and an alternative. Analytica Chimica Acta 595:98-106.
Fotyma, M. 2007. Content of potassium in different forms in the soils of Southeast Poland. Polish Journal of Soil Science XL/1:19-32.
IUSS/ISRIC/ISSS Working Group. 1998. World ref-erence base for soil resources 1998. World Soil Resources Reports No. 84. FAO, Rome, 88pp.
Komatsuzaki, M., and H. Ohta. 2007. Soil manage-ment practices for sustainable agro-ecosystems. Sustainability Science 2:103-120.
Kovačević, M., B. Bajat, and B. Gajić. 2010. Soil type classification and estimation of soil proper-
ciencia e investigación agraria32
ties using support vector machines. Geoderma 154:340-347.
Ladoni, M., H.A. Bahrami, S.K. Alavipanah, and A.A. Norouzi. 2010. Estimation of soil organic carbon from soil reflectance: a review. Precision Agriculture 11:82-99.
Li, Z., J. Yu, and Y. He. 2009. Use of NIR spectros-copy and LS-SVM model for the discrimination of varieties of soil. In: D. Li and Z. Chunjiang (eds.). Computer and Computing Technologies in Agriculture II, Volume 1.Springer, Boston, USA. p. 97-105.
Liu, W., S. Chen, X. Qin, F. Baumann, T. Scholten, Z. Zhou, W. Sun, T. Zhang, J. Ren and D. Qin. 2012. Storage, patterns, and control of soil or-ganic carbon and nitrogen in the northeastern margin of the Qinghai–Tibetan Plateau. Environ-mental Research Letters 7:12pp.
Martens, A., and P. Dardenne. 1998. Validation and verification of regression in small data sets. Che-mometrics and Intelligent Laboratory Systems 44:99-121.
Noble, W.S. 2006. What is a support vector machine? Nature 24:1565-1657.
Powlson, D.S., A.P. Whitmore, and K.W.T. Gould-ing. 2011. Soil carbon sequestration to mitigate climate change: a critical re-examination to iden-tify the true and the false. European Journal of Soil Science 62: 42-55.
Reeves III, J.B., and D.B. Smith. 2009. The poten-tial of mid- and near-infrared diffuse reflectance spectroscopy for determining major- and trace-element concentrations in soils from a geological survey in North America. Applied Geochemistry 24:1472-1481.
Rutkowska, A., and D. Pikuła. 2013. Effect of crop rotation and nitrogen fertilization on the quality and quantity of soil organic matter. In: M.C. Her-nandez Soriano (ed.). Soil processes and current trends in quality assessment. In Tech, Rijeka, Croatia. p. 249-267.
Stenberg, B., R.A. Viscarra Rossel, A.M. Moua-zen, and J. Wetterlind. 2010. Visible and Near Infrared Spectroscopy in Soil Science. In: D.L. Sparks (ed.). Advances in Agronomy, Vol. 107.Elsevier, Burlington Academic Press, USA. p. 163-215.