useful information about this presentation file
TRANSCRIPT

Slide 1
Useful information about this presentation file
The first proper Slide to present to the audience
is NOT this one, it is the next one.
This presentation to the Melbourne ATAA meeting in July 2008 is a follow up to an earlier BullCharts presentation to the Melbourne ATAA meeting in December 2006. This version is prepared totally using the OpenOffice Impress software (not MS PowerPoint).
This file might contain some “Speaker Notes” text. To view these notes, make sure to view the “Notes” (or View the file in PowerPoint using “Normal” view, and the text should be visible in the lower window pane).
Note, the PDF version of this presentation does not have the speaker notes.
View the Speaker Notes below for more information about this presentation.
You can print the slides, with the Speaker Notes included on the page using: File > Print > “Print What?- Notes”
This version updated:
11 July 2008
Slide 2
How to implement a trading strategy in charting software
(eg. in BullCharts)
Presenter:
Robert Brainhttp://www.robertbrain.com/Melbourne BullCharts User Group convenor,Professional trainer, consultant, computer whiz,technical analyst and part-time trader.(Seminars: “Introduction to the Share Market and Share Trading”)(Not employed by BullCharts, and receives no commissions).

including BullCharts demo
Slide 4
IMPORTANT!(ie. standard disclaimer)
This presentation is regarding a possible trading strategy which has NOT been tested,
and a software package.There is NO guarantee of success.
It does not include financial advice of any sort.This presentation does NOT include
ANY financial recommendationsof ANY sort whatsoever.
(Always seek professional advice before investing.)
Slide 5
General information only!
advice
General information only! Gen
eral
info
rmat
ion
only!
Gen
era l
info
rmat
ion
only
!
Slide 6
Housekeeping?
Please hold questions until the end. Also:
Note: This material does include some information from the supplier; but it is not intended to be a sales spiel. It is intended to be informative, and helpful.
In any examples - not concerned with the finer points of technical analysis .
Tonight’s presenter is a PC guru; but not yet a BullCharts super expert.

Slide 7
It’s Free!!
➔The Yellow “BullCharts Free Trial CD” request form - complete the details and submit tonight. One Yellow Form will be drawn tonight
to win tonight’s BullCharts Door Prize (one license + 1 year EOD) Value = $1147.
➔ “Free Trial CD” kit (in the mail) includes:Full unrestricted copy of BullCharts software;Needs a special Username and Password to access EOD data downloads;Useful for a 2 week period.
Slide 8
Target audience assumptions
That everyone fits at least one of these:Technical analyst (indicators, or patterns, or waves, etc.)Intra-day traderShort term trader (days-weeks)Long term trader (weeks-months)Investor (buy and hold)“Black box” software? <-- NO!

Slide 9
This presentation
Is designed to:Run for more than an hour;Includes a detailed BullCharts demo of many features.
BUT, for tonight:Skip most of the demo, andSkip through some of the slides.There are screen shots.If time permits, we can demo features.
Slide 10
Traders Quick quiz:
➔ Have a “Trading Plan / Strategy”?➔ Is it written down?➔ Do you follow it religiously?➔ Do you adjust your position size to
accommodate risk?➔ Do you determine your stop position before
each trade?➔ Do you record the trade details?
(more quiz over page..../)
?

Slide 11
more quiz?
➔ Do you religiously monitor open trades and raise the stop periodically?
➔ Do you ever go back and review past trades to fine tune your strategy or behaviour?
➔ Do you have a clear method of doing all the above?
➔ Is some of this just too hard?
➔ How about a simple way to keep records?Stay tuned:....../
Slide 12
Trading Plan/Strategy?
1. Everybody has one that is written down andfollowed to the letter?
2. Everybody's plan/strategy can be different.3. There are essential elements of every
trading strategy....
Surely...

Slide 13
Plan – Key Elements
1. Determine your investment objectives.
2. Which market?➢ Equities, futures, CFDs, etc.?➢ Local or overseas?
3. Time frame? Intraday, EOD, EOW?
4. Stock search and selection method
5. Risk and money management
6. Exit strategy
7. Back testing?
Slide 14
➔ You need to be clear about it.
➔ This is your choice;and charting software can't help you decide.
➔ Your choice.
➔ Watchlists, Scans,View and customise charts,Add indicators.
➔ Determine yourself; but record on a price chart.
➔ Run Scans “as at” an earlier date.
Can charting s/w help?1. Determine your investment
objectives.
2. Which markets?➢ equities, futures, CFDs?➢ long or short?➢ local or overseas?
3. Time frame?
4. Stock search and selection?
5. Risk and money management?
6. Exit strategy?
7. Back testing?
Today's focus
Slide 15
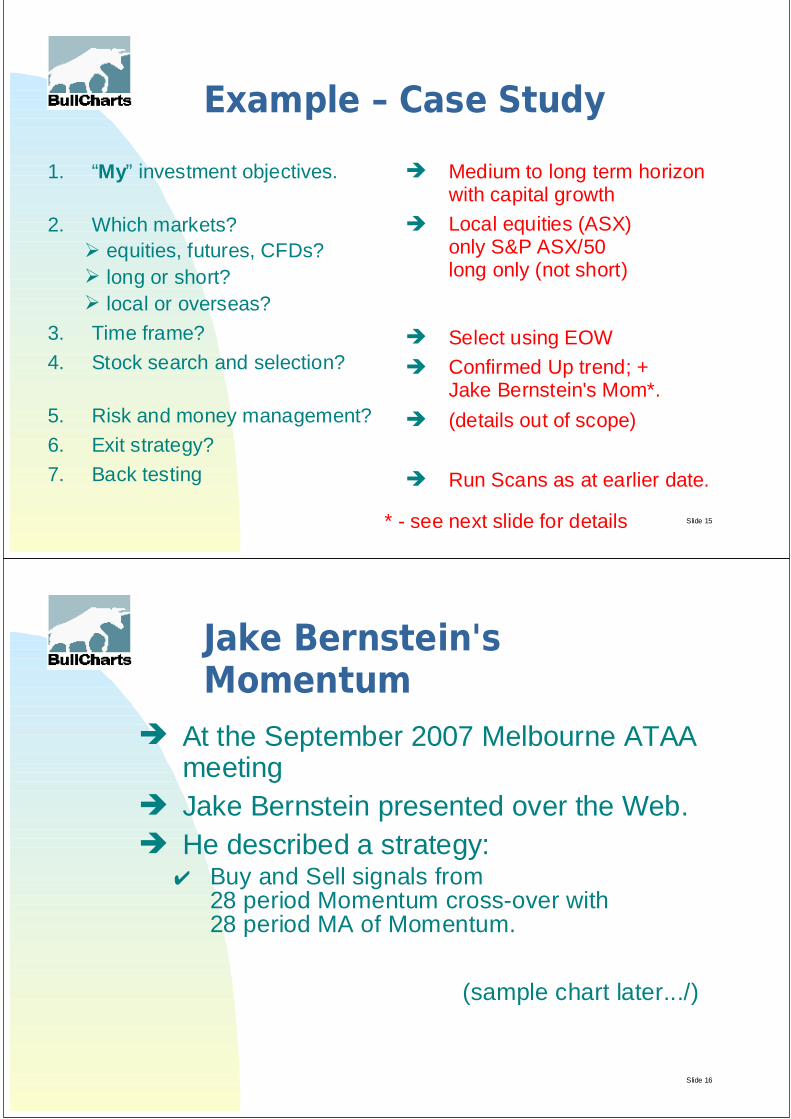
Example – Case Study
1. “My” investment objectives.
2. Which markets?➢ equities, futures, CFDs?➢ long or short?➢ local or overseas?
3. Time frame?
4. Stock search and selection?
5. Risk and money management?
6. Exit strategy?
7. Back testing
➔ Medium to long term horizon with capital growth
➔ Local equities (ASX)only S&P ASX/50long only (not short)
➔ Select using EOW
➔ Confirmed Up trend; +Jake Bernstein's Mom*.
➔ (details out of scope)
➔ Run Scans as at earlier date.
* - see next slide for details
Slide 16
Jake Bernstein's Momentum
➔ At the September 2007 Melbourne ATAA meeting
➔ Jake Bernstein presented over the Web.➔ He described a strategy:
✔ Buy and Sell signals from 28 period Momentum cross-over with 28 period MA of Momentum.
(sample chart later.../)

Slide 17
In this example – The steps to follow are:
1. Prepare one or more Watchlists.2. Specify stock search criteria – Scan.3. Include other details in the Scan?4. Specify the Watchlist(s) to Scan through,
and then run the Scan.5. View the results, customise the chart.6. Create a new Watchlist to monitor.
(continued.../)
Slide 18
In this example – The steps to follow (cont)
7. Decide Go / NoGo (ie. buy / no-buy).If Go, then continue:-
8. Determine position size and initial stop and profit target.
9. Enter the trade.10. Record actual trade details on the
price chart and save it.11. Monitor trade and record progress.

Slide 19
Step 1 – which stocks?Prepare Watchlist(s)
➔ Create a new Watchlist “Folder”✔ Call it “ATAA presentation”.
➔ Create one new Watchlist in this folder✔ Call it “Fav List - 50”.
➔ Take the S&P ASX/50 stock list, and “Copy” all symbols into the new watchlist.
➔ Customise the list:✔ eg. remove Ansell ANN, TabCorp TAH,
Timber Corp TIM (if there); and include: AED, Boom Logistics BOM.
Slide 20
Step 1 – which stocks?Prepare Watchlist(s)
➔ Create a new Watchlist “Folder”and a Watchlist in the folder, and add stocks from the S&P ASX/50 index, and delete some.

Slide 21
Step 2 – searchScan criteria
➔ Create a new “Scan”.➔ Set the first “scan criteria” to:
✔ 55 bar EMA – increasing (weekly), for 26 weeks.
Slide 22
Step 2 – Scan...more criteria
➔ Create two more new scan criteria:✔ Momentum Smoothed (ie. MA of Mom)
has “increased”, for every bar,for all of the “last 3 bars”.
✔ Momentum (28bar) has “crossed Above” Mom Smoothed, for any bar, in the “last 34 bars”.
(Note: the time periods used in this example are for this display only.In reality, we might use different values.)

Slide 23
What will the chart look like?
Slide 24
Step 3 – in the Scan ...include fundamentals
➔ Create more new scan criteria to “Show”:✔ Number of Trades
(will be plotted on the chart).✔ Historic PE ratio
(will be listed in the Scan Results Table)✔ Earnings Yield✔ Dividend Yield✔ Dividend Cover
(20 Fundamental values available in BullCharts to scan on)

Slide 25
The BullCharts Scan Definition:
Run scan as at earlier date
Run on Weekly data
In this scan, match ALL
criteria
A list of all Scan Criteria
(in plain English)
Slide 26
Step 4 – Specify a watchlist, and Run Scan
➔ In the Scan Definition,specify which watchlist(s) to scan on.
➔ Run the Scan (weekly on weekend).

Slide 27
Step 5 – View the results
➔ View the Results Table entries.➔ Double click a line in the
Scan Results Tableto create a default chart.
➔ We could:✔ Customise the chart, and✔ Save as a Template for later use; and✔ Add to the Template Toolbar.
➔ Or apply an existing Template.
Slide 28
Step 5 – Scan results table (eg)
Sample data.Columns are automatically included in results table based on Scan Criteria.
Sort any column

Slide 29
Step 6 – Create a new Watchlist, and peruse
➔ Take the Scan Results and save into a New Watchlist to monitor later.
➔ Peruse the results and highlight watchlist entries with a Colour Code.
➔ Turn on the BullCharts “IntelliCharts” feature.
➔ Add lines or text to the chart(and it is saved automatically as a stock-specific IntelliChart).
Slide 30
Step 7 – Decide go/nogo
➔ Use other indicators on Daily time frame to decide if to buy this stock or not.✔ check volatility – Bollinger Bands;
✔ check Parabolic SAR.➔ Buy? or No-buy?

Slide 31
Step 7 – the Daily chart
Slide 32
Step 8 – Determinetrade details and record
➔ If “buy”, then determine:✔ position size✔ initial stop loss value✔ price target
(eg. use Gann Retracement tool)➔ Record these values on the chart.➔ Save the chart for later reference.

Slide 33
Step 8 – Price targetsample calculation
Slide 34
Step 9 – Enter the trade,and record the details
➔ Once the trade is entered, record details on the saved price chart:✔ trade date✔ position size✔ actual purchase price
➔ Save the chart for later referenceto monitor ongoing performance.

Slide 35
Step 9 – The saved price chart
Slide 36
Step 10 – Monitorand record progress
➔ According to your Trading Strategy, monitor the position(eg. hourly, daily, weekly, monthly).
➔ Revise Trailing Stop (eg. CBL).➔ Record updated details on the saved
price chart.➔ Save the chart for later reference
to monitor ongoing performance.

Slide 37
Step 10 – The updated saved price chart
Slide 38
Step 10 – The Final Result saved in a price chart

Slide 39
Summary
➔ Have a Trading Plan (in writing).➔ Recorded key steps on a Price Chart.➔ Saved the price chart for
ongoing reference.➔ Now have a record of the trade details
(both soft copy and hard copy).➔ Includes a record of the ongoing
monitoring and revised trailing stops.➔ Can easily review performance.
Slide 40
The Hard Copy chartwhen printed

Slide 41
How to implement a trading strategy in charting software (eg. in BullCharts)
Presenter:
Robert Brainhttp://www.robertbrain.com/BullCharts user andMelbourne BullCharts User Group convenor,Professional trainer, consultant, computer whiz,technical analyst and part-time trader.
More information about upcoming seminars: “Introduction to the Share Market and Share Trading”
are available on the web site above.(Not employed by BullCharts, and receives no commissions).
Slide 42
Q & A
Thank you
Questions and Answers
BullCharts Demo(if time permits)

Slide 43
Backup Slides
followin case they are necessary
Slide 44
BullCharts Questions Trial
Free 2 week trial - full version and Live Data Software
$795 once off Data
End Of Day $352 per annum Live (inc EOD) - $151.25/month TradeSim Std $198, Prof: $484
Fair Deal Cross-grade from your current provider Transfer your remaining months for free
Trial of BullCharts Windows XP or 2000 (Not W95/W98/ME or Mac)
www.bullcharts.com.au Contact BullCharts / BullSystems to discuss.

Slide 45
BullChartsWhat is it?
Quoting from the developers (BullSystems):
“An innovative charting and technical analysis system.
It provides a feature rich and powerful set of tools
with access to the latest strategies from local and overseas authors
in analyzing the dynamics of the stock market.”
Source: http://www.bullcharts.com.au/