user help guide - cvquality.acc.org
TRANSCRIPT

eReports Corporate Dashboard
User Help Guide
Version 2.0
The mission of the NCDR® is to improve the quality of cardiovascular patient care by providing information,
knowledge and tools; implementing quality initiatives; and supporting research that improves patient care and
outcomes.
The NCDR® is an initiative of the American College of Cardiology Foundation, with partnering support for the
CathPCI Registry from the Society for Cardiovascular Angiography and Interventions, and the ICD Registry from the
Heart Rhythm Society.
CONFIDENTIALITY NOTICE
This document contains information confidential and proprietary to the American College of Cardiology
Foundation. This document is intended to be a confidential communication and may involve information or
material that may not be used, disclosed or reproduced without the written authorization of the ACCF. Those so
authorized may only use this information for a purpose consistent with the authorization. Reproduction of any
section of this document with permission must include this notice.
Contents Contents ........................................................................................................................................................ 2
I. Introduction .......................................................................................................................................... 4
A. Definitions ......................................................................................................................................... 4
B. User Privileges ................................................................................................................................... 5
II. Registry Login ........................................................................................................................................ 6
C. On-boarding ...................................................................................................................................... 6
D. Login .................................................................................................................................................. 6
III. Administration .................................................................................................................................. 8
E. Individual Profile ............................................................................................................................... 9
1. Change Contact Information ....................................................................................................... 10
2. Change Password ........................................................................................................................ 10
F. Corporate Profile ............................................................................................................................. 10
1. Hospital(s) Information ............................................................................................................... 11
2. Contact Information ....................................................................... Error! Bookmark not defined.
G. Corporate User Administration ....................................................................................................... 12
1. Search User ................................................................................................................................. 12
2. Add User ...................................................................................................................................... 13
3. Edit User ...................................................................................................................................... 14
IV. Corporate Dashboard ...................................................................................................................... 15
A. DQR Submission Status (Left Panel) ................................................................................................ 15
1. Current ........................................................................................................................................ 16
2. Historical ..................................................................................................................................... 17
3. DQR Drilldown Reports ............................................................................................................... 18
B. Notify............................................................................................................................................... 19
C. Reports ............................................................................................................................................ 19
1. Executive Summary Report ......................................................................................................... 20
2. Facility Demographics ................................................................................................................. 21
3. Hospital Detail Report ................................................................................................................. 22
4. Participating Program Report ..................................................................................................... 23
5. Participating Registry Report ...................................................................................................... 24
6. Data Collection Vendor ............................................................................................................... 24
D. Files ................................................................................................................................................. 25
E. Set Preferences ............................................................................................................................... 25
1. My Metrics .................................................................................................................................. 26
2. My Markets ................................................................................................................................. 27
F. eReports Dashboard (Right Panel) .................................................................................................. 29
1. My Metrics Tab ........................................................................................................................... 30
2. Executive Metrics ........................................................................................................................ 30
3. Market Analysis ........................................................................................................................... 30
Questions and Comments ........................................................................................................................... 33

I. Introduction
NCDR® eReports Corporate is designed to support clients such as hospitals or health systems, private
health insurance payers and other stakeholders who value a multi-hospital view into quality of
cardiovascular care being provided within a specific system or region.
A web-enabled business intelligence data report dashboard and quality improvement program, NCDR®
eReports Corporate is designed to serve as an enhanced customizable reporting mechanism by which
clients can tailor NCDR® reports for comparison purposes, monitor the quality of data submissions from
the hospital and perform comparative analyses utilizing customized markets.
This user help guide will familiarize you with the eReports Corporate Dashboard and assist you in using
this tool to better improve the quality of cardiovascular care for your patients. Provided in this guide is
an overview of the features of the eReports Corporate Dashboard National Cardiovascular Data
Registry’s (NCDR®) features and how to access them. Below are the definitions and types of user
privileges that will help you work through this guide. Thanks for your interest in the American College of
Cardiology’s NCDR® eReports Corporate Dashboard
Definitions
Client: This is an entity external to the American College of Cardiology Foundation (ACCF) who has a
contract in place that will allow them to access the reports published on www.ncdr.com.
Participant: This is a legal entity with a physical location that has a valid master agreement and registry
specific addendum in place. In addition, all fees are paid and current and the participant offers a service
that would meet inclusion for participation.
My Metrics: These are the metrics your organization will most commonly reference. Clients can hand
pick these metrics.
My Markets: These are user defined based on the hospitals participating in their program.
Limited: This signifies hospitals who submit a form with a reduced set a data to the registry (only
applicable for some registries). These hospital submissions are reviewed based on the benchmark
quality for limited data submissions only.
Premier: This signifies hospitals who submit forms with more extensive datasets to the applicable
registry (only applies to some registries). These hospital submissions are reviewed based on the
benchmark quality for premier submission forms.

User Privileges
eReports – Admin: Users with this privilege are able to change preferences for ‘My Metrics’ and ‘My
Markets’ for that institution.
eReports: Users with this privilege are able to view the reports for that institution.
Corporate Profile – View: Users with this privilege are able to see the Corporate Profile of the
institution.
Corporate Profile – Update: Users with this privilege are able to update that institution’s corporate
profile.
Corporate Site User Administration: Users with this privilege are able to add new users and change user
account information including which users have what privileges for that institution.
II. Registry Login
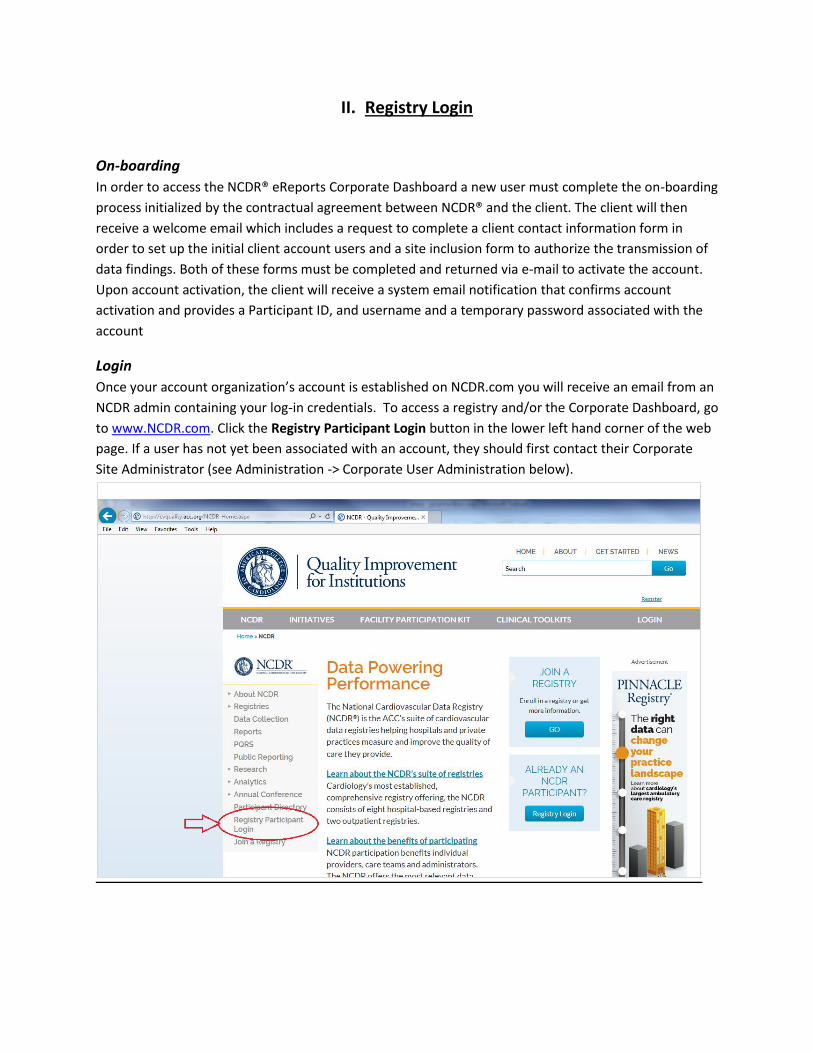
On-boarding
In order to access the NCDR® eReports Corporate Dashboard a new user must complete the on-boarding
process initialized by the contractual agreement between NCDR® and the client. The client will then
receive a welcome email which includes a request to complete a client contact information form in
order to set up the initial client account users and a site inclusion form to authorize the transmission of
data findings. Both of these forms must be completed and returned via e-mail to activate the account.
Upon account activation, the client will receive a system email notification that confirms account
activation and provides a Participant ID, and username and a temporary password associated with the
account
Login
Once your account organization’s account is established on NCDR.com you will receive an email from an
NCDR admin containing your log-in credentials. To access a registry and/or the Corporate Dashboard, go
to www.NCDR.com. Click the Registry Participant Login button in the lower left hand corner of the web
page. If a user has not yet been associated with an account, they should first contact their Corporate
Site Administrator (see Administration -> Corporate User Administration below).

After successful Login to the User account, access the registries subscribed to by clicking on either the
Hospital Registries, EP Registry Suite, or Outpatient Registries tabs and selecting the desired registry.
Each Registry landing page provides users with the latest registry announcements, helpful registry
specific resources and a navigational panel located on the left hand side for setting up users and
accessing the corporate dashboard.
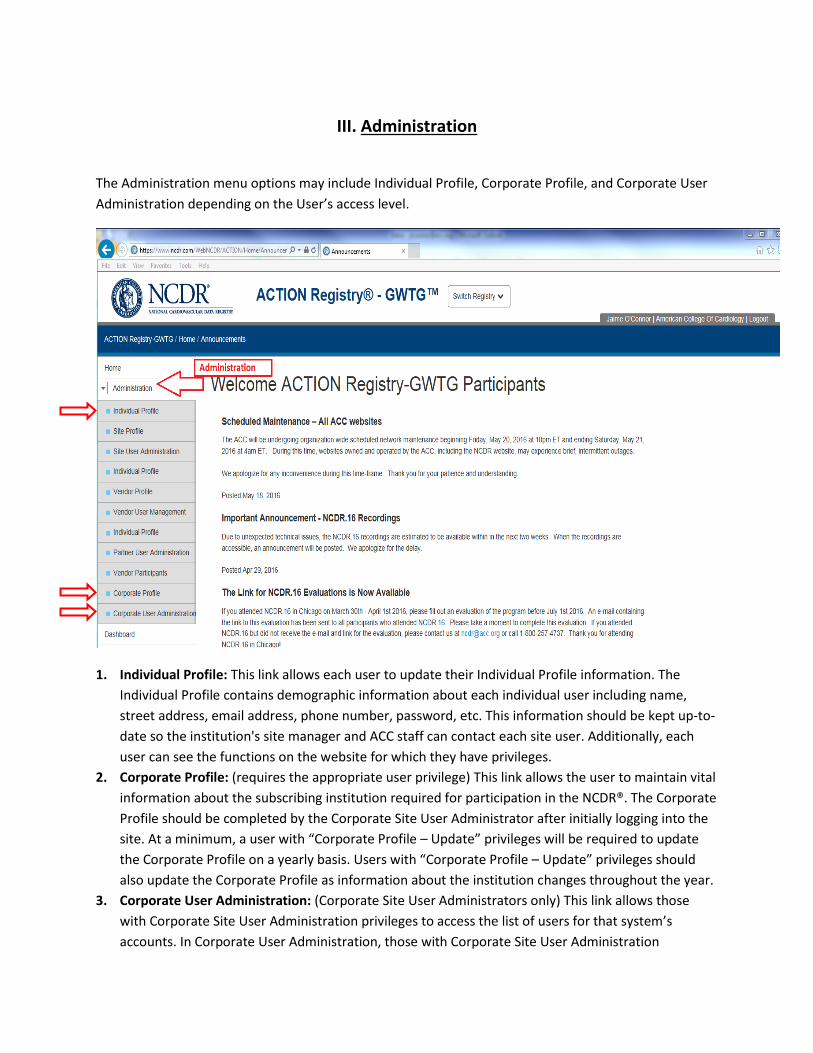
III. Administration
The Administration menu options may include Individual Profile, Corporate Profile, and Corporate User
Administration depending on the User’s access level.
1. Individual Profile: This link allows each user to update their Individual Profile information. The
Individual Profile contains demographic information about each individual user including name,
street address, email address, phone number, password, etc. This information should be kept up-to-
date so the institution's site manager and ACC staff can contact each site user. Additionally, each
user can see the functions on the website for which they have privileges.
2. Corporate Profile: (requires the appropriate user privilege) This link allows the user to maintain vital
information about the subscribing institution required for participation in the NCDR®. The Corporate
Profile should be completed by the Corporate Site User Administrator after initially logging into the
site. At a minimum, a user with “Corporate Profile – Update” privileges will be required to update
the Corporate Profile on a yearly basis. Users with “Corporate Profile – Update” privileges should
also update the Corporate Profile as information about the institution changes throughout the year.
3. Corporate User Administration: (Corporate Site User Administrators only) This link allows those
with Corporate Site User Administration privileges to access the list of users for that system’s
accounts. In Corporate User Administration, those with Corporate Site User Administration

privileges may add, edit or disable users as well as grant privileges for viewing eReports and
updating the Corporate Profile.
Individual Profile
This link allows each user to update their Individual Profile information. The Individual Profile contains
demographic information about each individual user including name, street address, email address,
phone number, password, etc. This information should be kept up-to-date and complete so the
institution's site manager and ACC staff can contact each site user.
Additionally, each user can see each of the functions for which they have privileges on the website. This
is located on the bottom of the page and is adjustable by the appropriate administrators on the
Corporate User Administration page.
1. Change Contact Information
A user can update their contact information including their email, from the Individual Profile page under
the Administration tab. Editable individual profile information includes the user’s name, organizational
role, contact information and address.
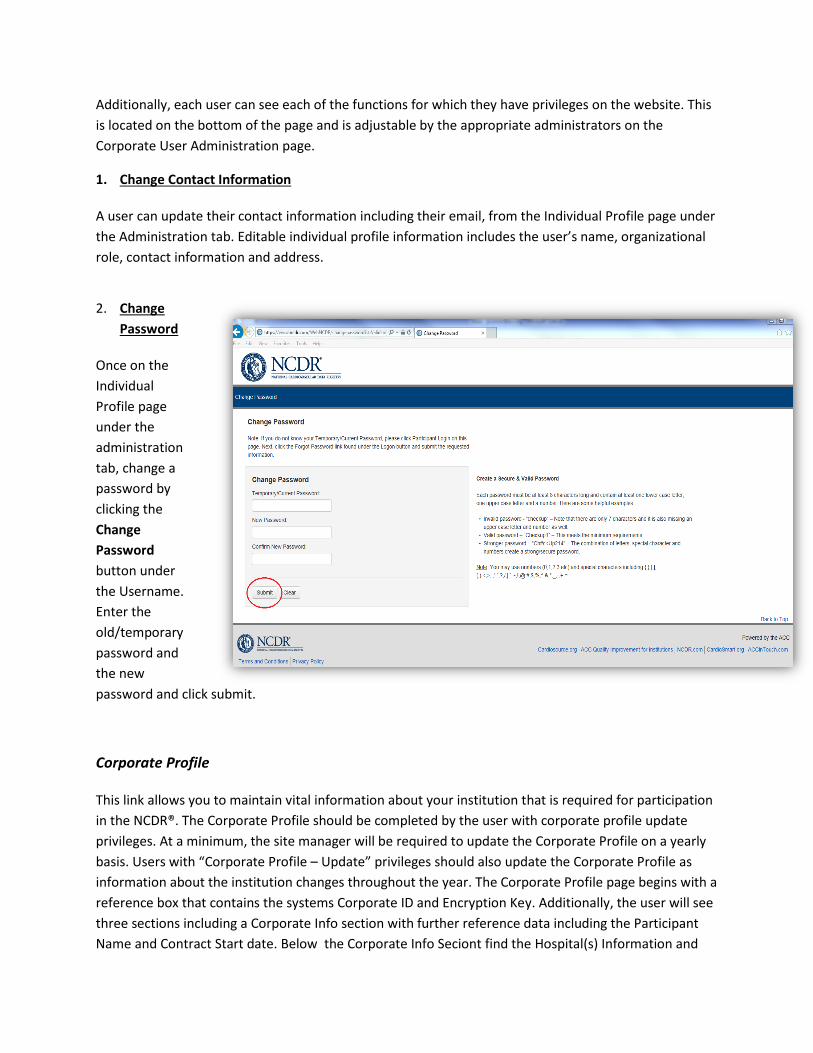
2. Change
Password
Once on the
Individual
Profile page
under the
administration
tab, change a
password by
clicking the
Change
Password
button under
the Username.
Enter the
old/temporary
password and
the new
password and click submit.
Corporate Profile
This link allows you to maintain vital information about your institution that is required for participation
in the NCDR®. The Corporate Profile should be completed by the user with corporate profile update
privileges. At a minimum, the site manager will be required to update the Corporate Profile on a yearly
basis. Users with “Corporate Profile – Update” privileges should also update the Corporate Profile as
information about the institution changes throughout the year. The Corporate Profile page begins with a
reference box that contains the systems Corporate ID and Encryption Key. Additionally, the user will see
three sections including a Corporate Info section with further reference data including the Participant
Name and Contract Start date. Below the Corporate Info Seciont find the Hospital(s) Information and

Contact Information sections where users with the necessary update privileges can make adjustments to
the account profile.
1. Hospital(s) Information
Those granted Corporate Profile editing privileges should keep the Corporate Profile information
updated as the institution changes maintaining the number of hospitals that perform various cardiology
procedures including PCIs, Diagnostic Catheterizations, Transcatheter Aortic Valve
Replacements/Implantations, Pediatric Interventional Cardiac Catheterization and vascular surgery as
well as maintaining then number of hospitals with Electrophysiology Programs and Emergency
Departments relative to the number of unique hospitals in the institution.
2. Contact Information
The contact information can also be updated for each user in the participating institution by clicking on
the Update link next to each of the User roles listed.

Corporate User Administration
This link allows those granted corporate site administrator privileges to grant access to the site to other
users and assign the appropriate user privileges. In Corporate User Administration, the user may add,
edit or disable users as well as grant privileges for viewing data including eReports and updating the Site
Profile.
1. Search User
A user with Corporate Site User Administrator privileges can search for each user that belongs to their
account by first name, last name, user name or email address in order to look up what privileges that
user has.

2. Add User

3. For each specific registry, the User Administrator can add a new user by clicking on the Add New
User button at the bottom of the Corporate User Administration page. This will navigate the
administrator to the Corporate User Setup page where they need to fill out all the required fields
and assign roles and privilege(s) to the new user. Once the administrator clicks Save an automated
email is sent to the email address provided for the new user for activation. The user must then
follow the steps outlined above to complete activation of the user account.
4. Edit User
The User Administrator can change the privileges of the users from the Corporate User Administration
page by clicking on the Edit link next to each user. The administrator is taken to the Corporate Site User
Administration – User Setup page for that user where they can then change the username, registry
access setting, contact information, role(s), privilege(s) or reset the user’s password. New temporary
passwords are sent to the user’s email address. The administrator must click Save at the bottom of the
page in order to keep the changes that are made.
Congratulations! You are now set up and ready to use the eReports Corporate Dashboard. We’re thrilled
that you have joined our community of users of the NCDR® eReports Corporate Dashboard. Learn more
about the Corporate Dashboard in the next section.
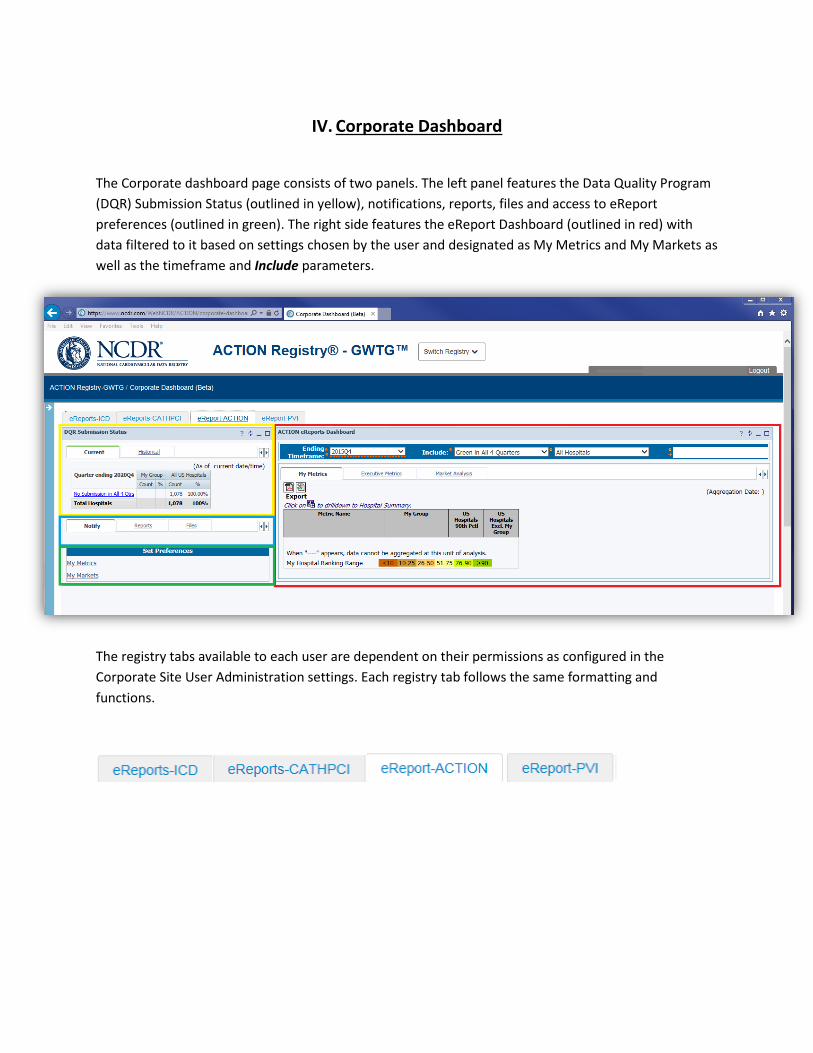
IV. Corporate Dashboard
The Corporate dashboard page consists of two panels. The left panel features the Data Quality Program
(DQR) Submission Status (outlined in yellow), notifications, reports, files and access to eReport
preferences (outlined in green). The right side features the eReport Dashboard (outlined in red) with
data filtered to it based on settings chosen by the user and designated as My Metrics and My Markets as
well as the timeframe and Include parameters.
The registry tabs available to each user are dependent on their permissions as configured in the
Corporate Site User Administration settings. Each registry tab follows the same formatting and
functions.

DQR Submission Status (Left Panel)
Participants of the registries submit data to the NCDR® for quality review. This quality review is known
as the Data Quality Reporting (DQR) process. The DQR checks submitted patient records and returns a
green, yellow or red status for their submission. Data are first checked for errors then checked for
“completeness” thresholds. Passing the DQR ensures well-formed data and a statistically significant
submission. Green light submissions will be displayed in the quarterly reports along with yellow light
submissions displayed in the details section of the report. Following successful submission to the DQR,
the data is included in the current data set and the dashboard includes data submitted with a green light
status. The user can view the DQR summaries for both current and historical DQR submissions. For a
complete DQR reference guide, click on the Resources tab at the top of the screen and select the Data
Call for Submission Guide.
1. Current
The Current tab shows the up to date DQR submission status of member institutions as of the current
date and time. Note: The Current tab is not available on all dashboards.
To view the summary of the current four quarter time period select the left most tab at the top of the
left DQR Submission Status panel.
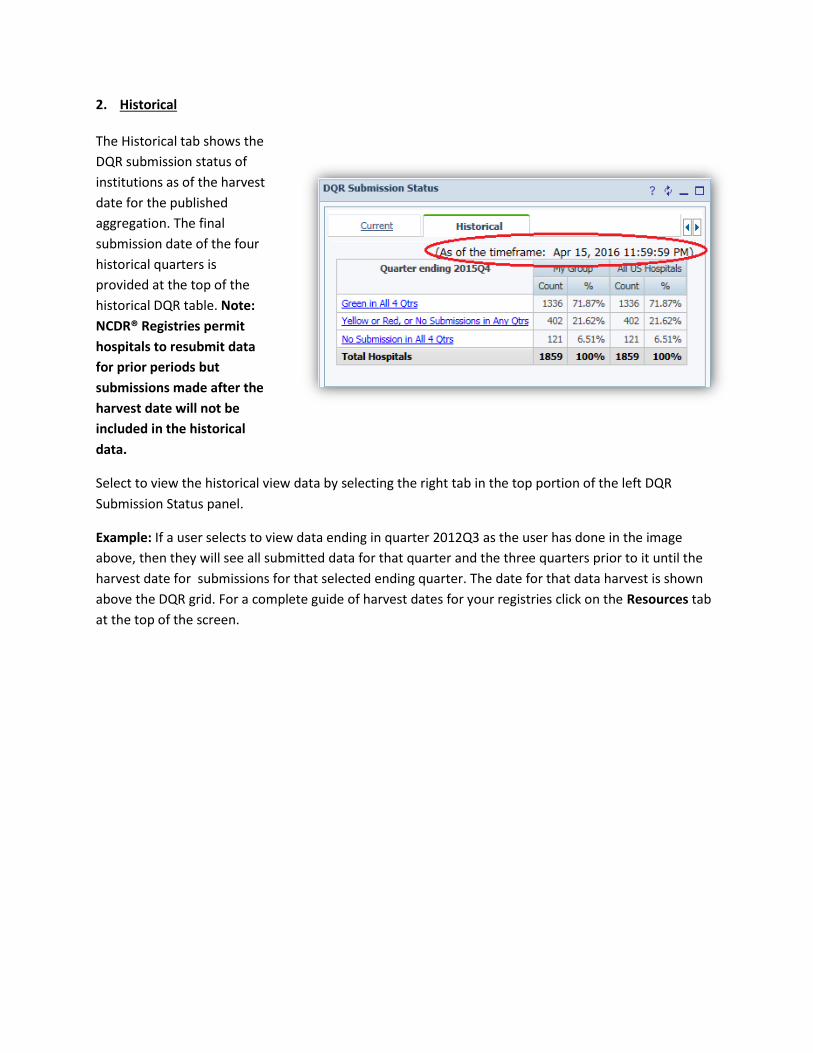
2. Historical
The Historical tab shows the
DQR submission status of
institutions as of the harvest
date for the published
aggregation. The final
submission date of the four
historical quarters is
provided at the top of the
historical DQR table. Note:
NCDR® Registries permit
hospitals to resubmit data
for prior periods but
submissions made after the
harvest date will not be
included in the historical
data.
Select to view the historical view data by selecting the right tab in the top portion of the left DQR
Submission Status panel.
Example: If a user selects to view data ending in quarter 2012Q3 as the user has done in the image
above, then they will see all submitted data for that quarter and the three quarters prior to it until the
harvest date for submissions for that selected ending quarter. The date for that data harvest is shown
above the DQR grid. For a complete guide of harvest dates for your registries click on the Resources tab
at the top of the screen.

3. DQR Drilldown Reports
The user can view submission statuses at the hospital level by clicking on one of the status links in
the DQR Summary table. Any of the three links will navigate the user to the Hospital Data
Submission Status Report with the defaulted link set as the submission status. This report allows the
user to see the submission status for each institution. From this page the user can also change the
filter to see the report for other timeframes and statuses. The Ending Timeframe filter designates
the final quarter of a 4 quarter period for with the report is generated. The Submission Status filter
allows the user to generate a report that includes only green submissions, yellow or red, or no
submissions in any quarters, no submissions in all four quarters, or all submission statuses. For
applicable registries each hospital submission is also identified as a limited submission (L) or a
premier submission (P). The sorting options include Hospital Name, City and State. Additionally, a
version of the report may be exported by clicking on the Excel Export Button.
Ending Timeframe filter Submission Status Filter
Excel Export Button
Sort by Menu

A. Notify
Notifications are used to inform NCDR® eReports Corporate clients of any updates regarding
participants or the dashboard itself. this feature is also used as a vehicle for communicating any
upcoming events or site maintenance. Notifications are set by ACC staff with an expiration date so that
once the expiration date is reached, the notification is no longer visible.
The notifications are located
under the Notify tab on the left
side of the Corporate Dashboard page. It is the left most tab located directly below the DQR Submission
Status summary table.
B. Reports
There are six reports provided in the
Reports tab. Two reports, the Executive
Summary and Facility Demographics
reports are registry specific while the
Hospital Detail, Participating Programs,
Participating Registries and Data
Collection Vendor reports are identical across registries. Note: The “Report Links” section, including the
Hospital Detail Report, Participating Programs, Participating Registries and Data Collection Vendor
reports, are not available on all dashboards.
Report Scope Visibility
Executive Summary Registry-specific Systems
Facility Demographics Registry-specific Systems
Hospital Detail Identical for all registries Hospital Systems
Participating Programs Identical for all registries Hospital Systems
Participating Registries Identical for all registries Hospital Systems
Data Collection Vendor Identical for all registries Hospital Systems
The Reports tab is located on the left side of the Coporate Dashboard page to the right of the Notify tab
and under the DQR Submission Status table.
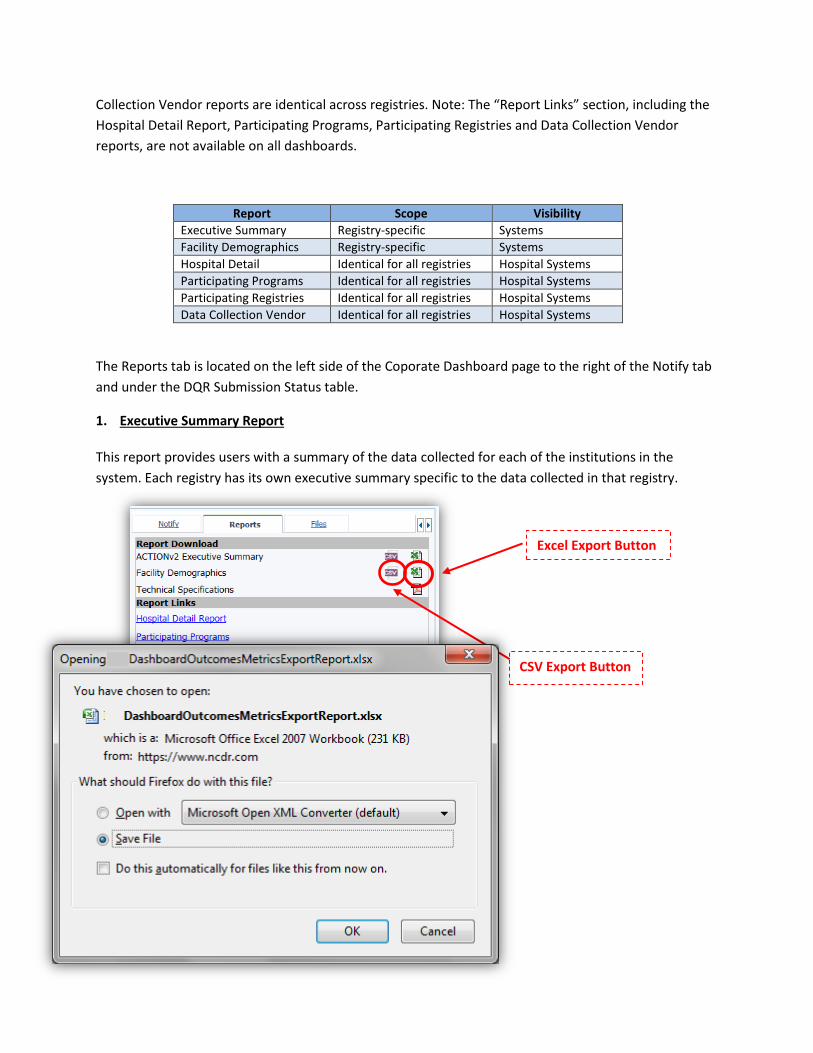
1. Executive Summary Report
This report provides users with a summary of the data collected for each of the institutions in the
system. Each registry has its own executive summary specific to the data collected in that registry.
Excel Export Button
CSV Export Button

The Executive Summary Report is
accessed in the form of an Excel
export by clicking on the Excel
button just to the right of the
<Registry>Executive Summary
Report label. Click Save As and
click OK. Then select a location
and click Save. To view the
report, open the Excel file from
the location where it is saved.
Follow the same procedure with
the CSV export button.
For specific details on what data
elements are included in the
Executive Summary Report, please reference the eReports Corporate Dashboard Technical
Specifications.
2. Facility Demographics
This report provides the user with a summary of the demographics data for the facilities reporting data
in that registry. Like the Executive Summary Report, this report is specific to each registry.
The Facility Demographics report is also accessed under the reports tab by saving a copy of the report
locally. This is done by clicking on the Excel button to the right of the Facility Demographics title, and
then clicking Save As and OK, then selecting a location and clicking Save. The saved report can then be
opened locally.
For specific details on what data elements are included in the Executive Summary Report, please
reference the eReports Corporate Dashboard Technical Specifications.
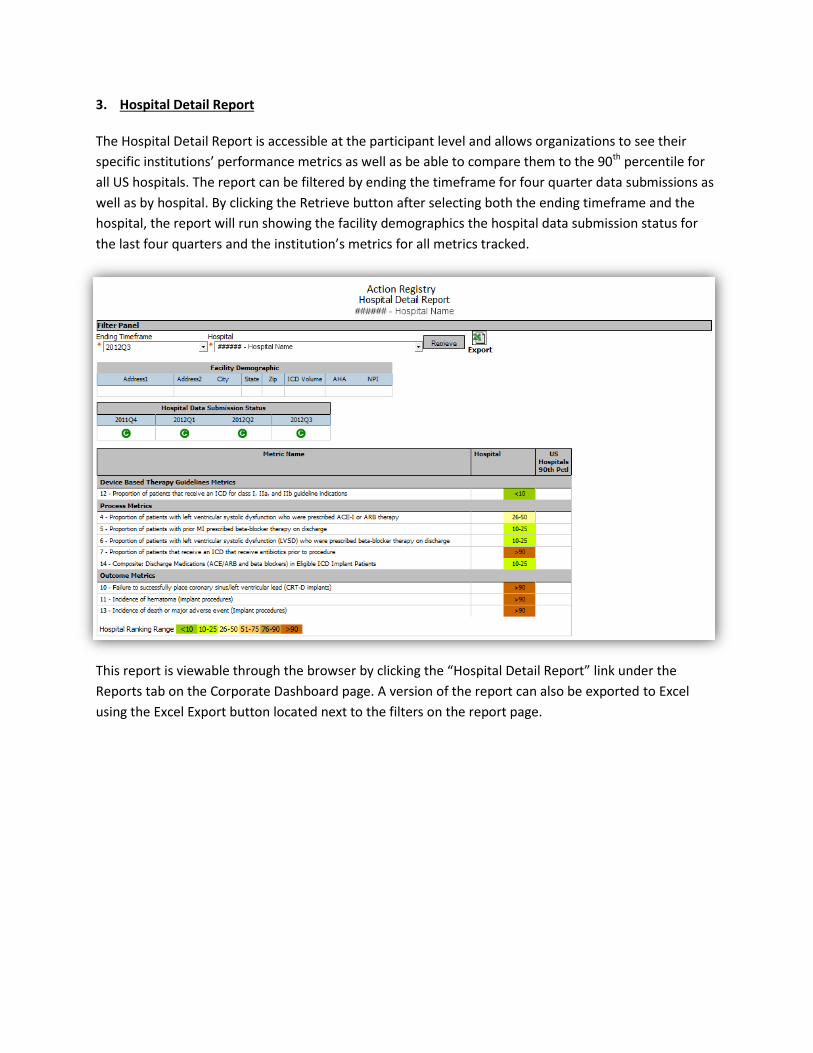
3. Hospital Detail Report
The Hospital Detail Report is accessible at the participant level and allows organizations to see their
specific institutions’ performance metrics as well as be able to compare them to the 90th percentile for
all US hospitals. The report can be filtered by ending the timeframe for four quarter data submissions as
well as by hospital. By clicking the Retrieve button after selecting both the ending timeframe and the
hospital, the report will run showing the facility demographics the hospital data submission status for
the last four quarters and the institution’s metrics for all metrics tracked.
This report is viewable through the browser by clicking the “Hospital Detail Report” link under the
Reports tab on the Corporate Dashboard page. A version of the report can also be exported to Excel
using the Excel Export button located next to the filters on the report page.

4. Participating Program Report
This report provides the system level user with a breakdown of the programs in which their institutions
are participating. Both a summary of the programs, in which the number of hospitals within each
program and the associated registry for that program are provided, as well as a hospital listing for the
participating programs are provided.
This report is accessed via the report link under the Reports tab. This report can also be saved locally by
using the Excel Export button at the top of the report page to save an Excel version to a local drive.

Excel Export Button
5. Participating Registry Report
The Participating Registry Report is a system level report that provides a breakdown of the number of
hospitals that participate in each NCDR® registry. Further breakdown is provided in the second level
data table which provides a listing of each hospital and some of its information organized by registry.
The Participant Registry Report is accessed from the report link under the Reports tab on the left side of
the Corporate Dashboard page and is viewed through the browser. Like the other browser based reports
however, a copy can be exported to Excel on a local drive by clicking the Excel Export button at the top
of the report page and choosing a location to save to.
6. Data Collection Vendor
The Data Collection Vendor Report provides a system level overview of the vendors used for data
collection by the submitting institutions within the system. The report breaks down the vendors first by
the registries that they are
associated with followed by
the number of hospitals
using that vender for that
registry.
The Vendor Data Collection
Report is also accessed via
link under the “Report
Links” heading under the
reports tab on the left side
of the Corporate Dashboards page. A copy of the report can also be exported to Excel using the Excel
export button at the top of the report’s page.
Excel Export Button

C. Files
“Files” provides another feature that enhances the communication capabilities between the American
College of Cardiology and its clients. The files tab is where the ACC will post files for distribution to client
Corporate Dashboard users. The Files tab is on the left panel of the Corporate Dashboards page located
below the DQR Submission Status table. Under this tab, the system will list the file name which will be
linked to the associated uploaded
file as well as the load date of
that file and both the last time
the file was accessed and the
user that accessed that file. There
is also a “More” link at the
bottom of the file tab area for
accessing full lists of loaded files.
D. Set Preferences
Users with eReports Administration privileges have access to set Preferences while all users can view
preferences. NCDR® eReports contain features that are customizable at the client level. However, it is
important to note that these features are customizable at the organization level and not at the
individual level. Any update to My Markets/My Metrics definitions will be reflected in the dashboard by
the next business day after the reporting data mart is updated as part of the nightly refreshing process.

ADD – Moves selected metrics
from “Available Metrics” (left) to
“My Metrics” (right).
REMOVE – Moves selected
metrics from “My Metrics” (right)
to “Available Metrics” (left)
NOTE: System updates are made overnight and all changes made to My Market and My Metrics
Preferences will not be reflected until the next day.
1. My Metrics
This page allows eReports Administrators to set the Metrics seen under the My Metrics tab in the
dashboard. NOTE: All eReports viewers see the same set of Metrics under the My Metrics tab so any
changes made to these preferences will be seen by all users. It is important to note that because the
registries refresh overnight, any changes made to My Metrics will not be reflected until the following
day. The only metrics available to be put in the My Metrics column are those available to the
organization in the Executive Summary Metrics. NOTE: My Metrics is restricted to the executive
summary list. The my metric list is specific to your organization, not individual user logins, so any
changes will be reflected in the dashboard when accessed by all authorized users. My Metric list may
include only metrics from the list of metrics available to your organization.
The left side of the My Metrics preferences contains a list of all Available Metrics not currently shown in
the My Metrics tab while the list on the right shows all elements to be shown in My Metrics. Once the
preferences are saved, it is this list on the right that will show under the My Metrics tab of the
dashboard the following day. Metrics are switched from one side to the other by clicking on metrics
from one side and clicking on the appropriate button to switch them. To switch from Available Metrics
to My Metrics, the user holds down the “Ctrl” key and clicks on metric types in the left column and then
clicks Add. To switch metrics from My Metrics to Available Metrics, select metric types in the right
column by holding down the “Ctrl” key while clicking on items from the right column and then click
Remove. Click Save when changes are completed or Cancel to leave the page without making any
changes.
The My Metrics preferences are located by clicking the “My Metrics” link under the “Set Preferences”
header at the bottom of the left panel of the Corporate Dashboard page.
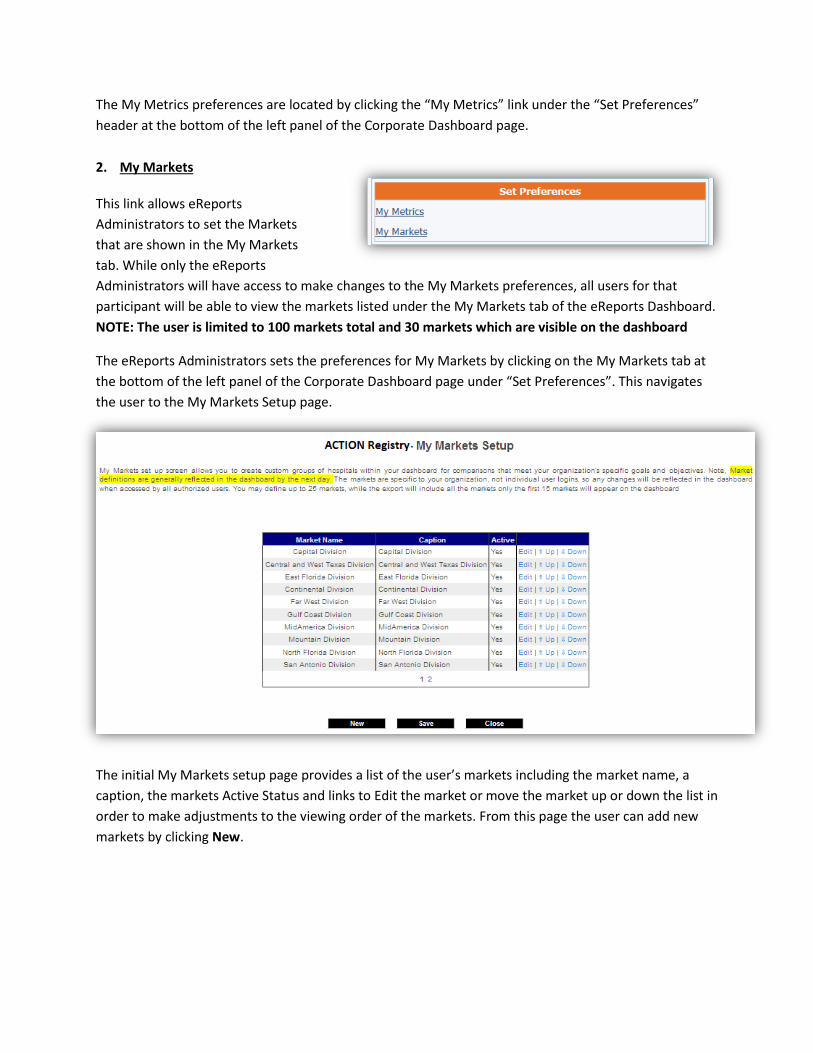
2. My Markets
This link allows eReports
Administrators to set the Markets
that are shown in the My Markets
tab. While only the eReports
Administrators will have access to make changes to the My Markets preferences, all users for that
participant will be able to view the markets listed under the My Markets tab of the eReports Dashboard.
NOTE: The user is limited to 100 markets total and 30 markets which are visible on the dashboard
The eReports Administrators sets the preferences for My Markets by clicking on the My Markets tab at
the bottom of the left panel of the Corporate Dashboard page under “Set Preferences”. This navigates
the user to the My Markets Setup page.
The initial My Markets setup page provides a list of the user’s markets including the market name, a
caption, the markets Active Status and links to Edit the market or move the market up or down the list in
order to make adjustments to the viewing order of the markets. From this page the user can add new
markets by clicking New.

In order to successfully add new markets, enter a Market Name, click on the appropriate participants
from the “Available Participants” list holding down the Control key in order to select multiple and click
Add. Once all additions have been made click Save to have the market definitions changed for the next
day.

Change existing markets by clicking the “Edit” link next to one of the existing markets on the My
Markets Setup list. This directs the user to the “My Markets Setup (EDIT)” page where there is a
prepopulated Market Name and Selected Participants. Add or Remove the appropriate participants and
save the changes in order to have the new market definitions reflected in the dashboard the next day.
Additionally, when adding or editing markets to My Markets, the eReports Administrator can set the
active status of the market to “Yes” or “No.” Markets set to “No” for active status will be removed from
the dashboard for the following day.
E. eReports Dashboard (Right Panel)
The eReports Dashboard provides the numbers that allow users to conduct in depth analysis of their
systems compared to national averages and separated out into user designated markets.
This
analysis
can be
conducted
over a
variety of
metrics collected in the NCDR® registries. Changes to the dashboards are limited by the preferences set
to My Metrics and My Markets tabs by eReports Administrators. These settings may be viewed in the
Set Preferences links in the left panel. However, all eReports viewers can make filter changes to see
different ending timeframes to their data.
Export Buttons
Dashboard Filters
1. My Metrics Tab
The My Metrics tab shows only the metrics selected under the My Metrics preferences set by the
eReports Administrators. The default metrics constitute an aggregation of all submitted institution data
that passes as green in the DQR defined above. The metrics in the dashboard will also be reflective of
the last four quarters ending with the quarter selected in the Ending Timeframe filter dropdown. The
metrics are organized by metric categories that vary by registry.
The dashboard displays performance for each metric divided up by the markets (defined in the My
Markets preferences) in order to allow the systems to see how different groups compare. Included in
the metrics are the measures for “My Group,” “All hospitals 90th Percentile,” and “US Hospitals
Excluding My Group.” These inclusions are compared in order to provide a ranking of the markets
relative to all US hospitals. My Group numbers are ranked within a percentile range and given a color
identifier. The rankings are delineated between the 10th and 25th, 26th and 50th, 51st and 75th, and 76th
and 90th percentiles.
The user can view additional comparison points to all U.S. hospitals by clicking on the Export button for
either a pdf or Excel where they will see comparisons to the 10th percentile, 25th percentile and 50th
percentile.
2. Executive Metrics
The Executive Metrics tab is set up the same way as the My Metrics tab. However, the executive metrics
provides the full list of metrics available from the registry.
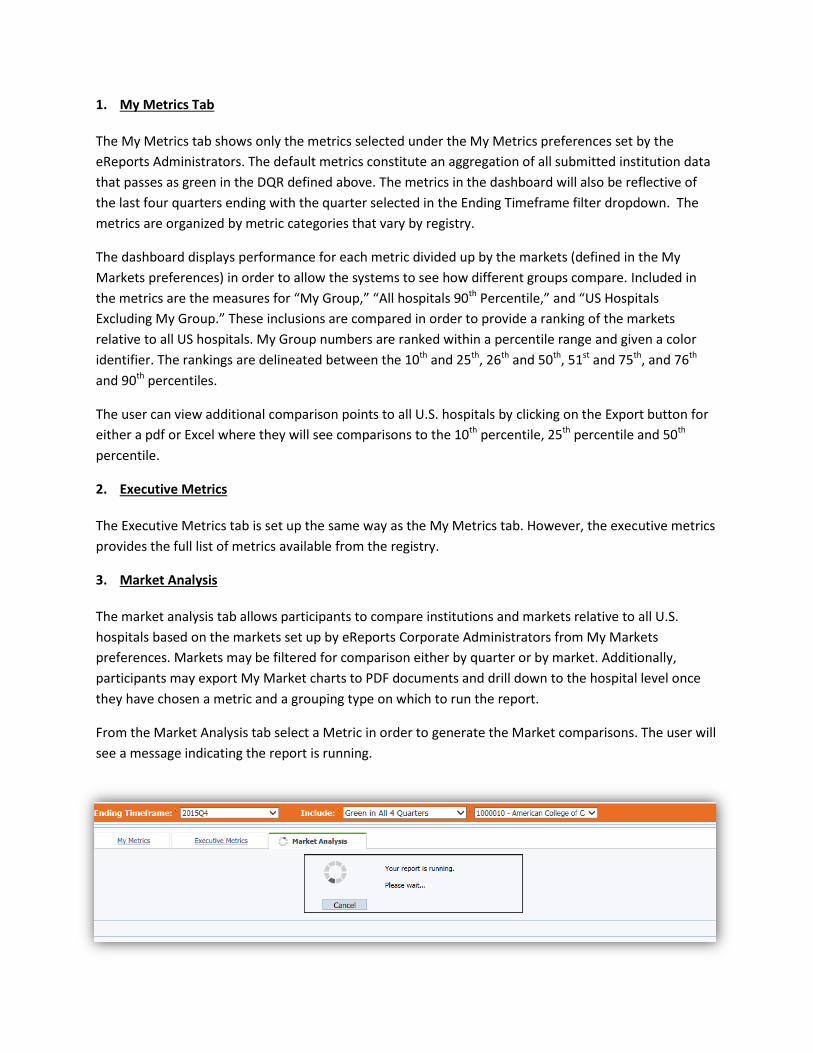
3. Market Analysis
The market analysis tab allows participants to compare institutions and markets relative to all U.S.
hospitals based on the markets set up by eReports Corporate Administrators from My Markets
preferences. Markets may be filtered for comparison either by quarter or by market. Additionally,
participants may export My Market charts to PDF documents and drill down to the hospital level once
they have chosen a metric and a grouping type on which to run the report.
From the Market Analysis tab select a Metric in order to generate the Market comparisons. The user will
see a message indicating the report is running.

Once the report is generated the user can drilldown to hospital level detail by clicking on the graph for a
specific group to see the hospitals in that group.
NOTE: This drilldown feature is unavailable for the U.S. Hospitals Excluding My Group.
From the hospital level view, the users can change the report they are viewing by using the filter menus
at the top of the report. These filters mirror the higher level report pages so that they carry over the
filter settings set before drilling down. Users may also export the hospital level report by clicking on the
Excel Export Button next to the filter menus.
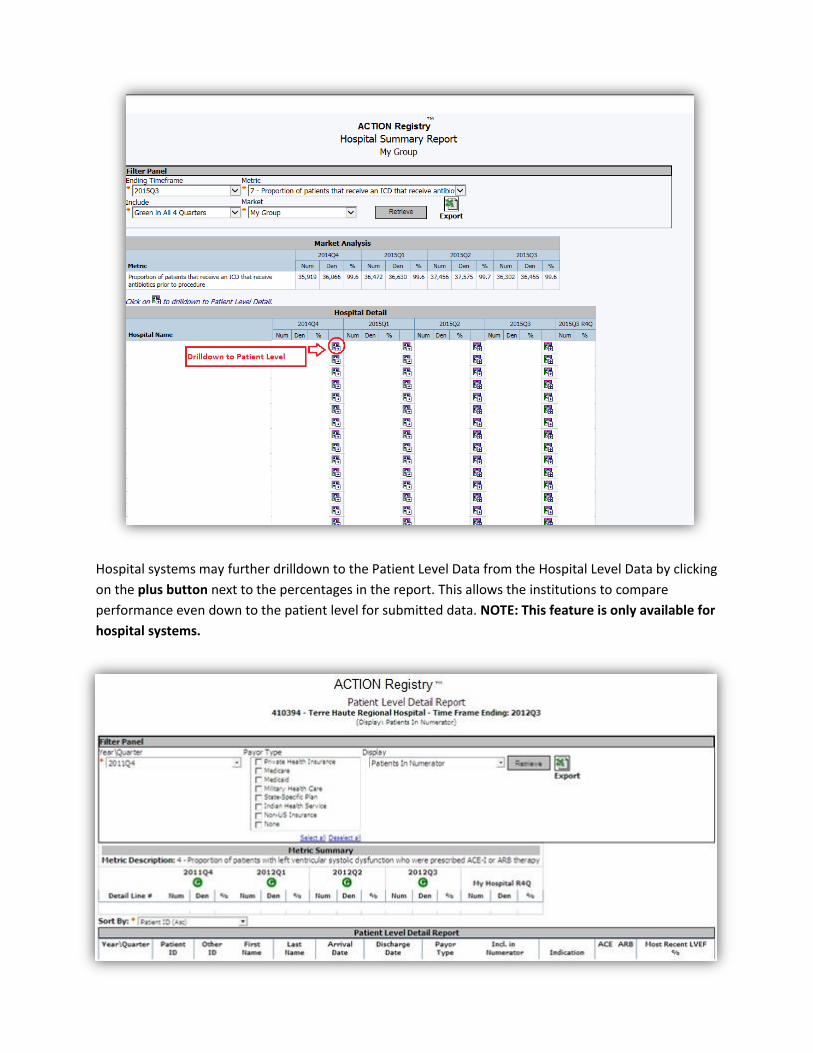
Hospital systems may further drilldown to the Patient Level Data from the Hospital Level Data by clicking
on the plus button next to the percentages in the report. This allows the institutions to compare
performance even down to the patient level for submitted data. NOTE: This feature is only available for
hospital systems.

Additional resources are available at the Resources tab at the top of the registry dashboard page. The American College of Cardiology is thrilled to have the opportunity to cooperate with you for the mutual goal of improving cardiology patient outcomes. And we look forward to further opportunities to help your efforts to improve cardiology care quality and information through the NCDR® and the eReports Corporate Dashboard.
Questions and Comments
The ACC will respond to hospital and stakeholder questions and comments between the hours of 9:00 a.m. and 5:00 p.m. Monday through Friday Eastern Standard Time. There are two ways to reach us:
By email at [email protected]. Please include your full name, institution name, address, phone number and a brief description of your inquiry.
By phone at (800) 257-4737
To ensure proper handling of inquiries, please reference "NCDR eReports Corporate" when contacting
the ACC regarding this initiative.