using a continuous measure of genderedness to assess sex
TRANSCRIPT

Vol.:(0123456789)
Political Behavior (2021) 43:1779–1800https://doi.org/10.1007/s11109-021-09681-2
1 3
ORIGINAL PAPER
Using a Continuous Measure of Genderedness to Assess Sex Differences in the Attitudes of the Political Elite
Jan Erik Lönnqvist1 · Ville‑Juhani Ilmarinen1
Accepted: 21 January 2021 / Published online: 2 February 2021 © The Author(s) 2021
AbstractWe investigated the attitudes of the 11,410 candidates in the Finnish 2017 municipal elections who had responded to a Voting Advice Application. Women candidates were, both in terms of economic and social attitudes, more progressive than men. Building on the gender diagnosticity approach, we used responses to the attitude items to construct a dimensional measure of political genderedness; i.e., a meas-ure of the femininity–masculinity of the individual’s political attitudes. We used this measure to investigate the magnitude of sex differences across parties and the determinants of these differences. Sex differences were larger in parties with more economically right-oriented, socially conservative, well-off, and male candidates. Moreover, these differences were caused by men in these parties being different from other candidates. A similar methodology, in which a continuous measure of genderedness is used to assess sex differences, could be used in other domains of research on political behavior.
Keywords Sex differences · Gender · Political attitudes · Political elite · Femininity–masculinity
Introduction
One of the most accepted generalizations in political science research is that the higher echelons of power are dominated by men. Even societies such as the Nordic welfare countries, in which this generalization has gradually begun to be challenged, are still far from a situation in which sex is of no consequence. In Finland, the share of elected women has during the last 20 years stagnated at a steady 40 percent level. In the present
* Jan Erik Lönnqvist [email protected]
Ville-Juhani Ilmarinen [email protected]
1 Swedish School of Social Science, University of Helsinki, Snellmaninkatu 12, PO BOX 16, 00014 Helsinki, Finland

1780 Political Behavior (2021) 43:1779–1800
1 3
research, we investigate one way in which this gender imbalance may matter; i.e., we investigate whether the men and women that constitute the political elite differ in their political and policy preferences.
Our first goal was to investigate, among the 11,410 candidates in the Finnish 2017 municipal elections, whether men and women candidates differed in terms of political attitudes. Our first batch of results suggested that indeed they do, and we followed up by investigating some of the possible determinants of these differences. However, in doing so, we wanted to separate sex from gender, a distinction all too often ignored in research on political behavior (Bittner and Goodyear-Grant 2017).
Sex, used here in its common-language meaning as referring to two binary catego-ries, should not be conflated with gender, which consists of the meanings ascribed to male and female social categories within a culture. Although sex as a biological cat-egory can be considered more or less taxonic, gender differences on psychological variables, including attitudes, are dimensional. Conflating sex with gender is not only normatively wrong but simplifies and distorts the results (Bittner and Goodyear-Grant 2017). Building on the work of Lippa and Connelly (1990) on gender diagnosticity, we constructed a dimensional variable reflecting to what extent the attitudes of an individ-ual are feminine vs. masculine. This variable allows women to receive high scores in masculinity, and vice versa. It is ideally suited to investigate the extent to which politi-cal attitudes are gender-typical.
We first present research on sex differences in political attitudes in the mass public and in the political elite. This research is explicitly on sex differences; that is, differ-ences between two, binary, natural, and fixed categories. When referring to “sex differ-ences” and the “sex gap”, we are explicitly referring to differences between two catego-ries: men and women. We then introduce the concept of gender diagnosticity (Lippa and Connelly 1990), which we will employ to measure the genderedness of political attitudes. By “genderedness,” as well as “gender differences” in “femininity–masculin-ity,” we refer to differences in a continuous variable that is not constrained by biologi-cal sex. We will use the measure of gender diagnosticity to investigate possible deter-minants of genderedness, both at the individual and the party-level. By investigating gender differences we are, in one sense, investigating how close to the prototypical woman or man individual candidates and parties are. We will also investigate to what extent differences in prototypicality can be explained by party demographics, such as the mean age of a party’s candidates.
Sex Differences in Political Attitudes in the Mass Public
The political attitudes of the mass public are best described by two dimensions—an economic/fiscal dimension and a social/cultural dimension (Conover and Feldman 1980). Regarding the economic dimension of attitudes, right-wing (as opposed to left-wing) economic policies focus on a large role for free markets and individual action, and general rejection or retrenchment of the welfare state (e.g. Klingemann et al. 2006). In the Finnish context, this dimension revolves around conflicts around taxes, public welfare expenditure, privatization, and deregulation (Karvonen 2014).

1781
1 3
Political Behavior (2021) 43:1779–1800
The other dimension of political attitudes, social conservatism (as opposed to progressivism) can broadly speaking be defined as “resistance to change and the ten-dency to prefer safe, traditional and conventional forms of institutions and behav-ior” (Wilson 1973, p. 4). Social conservatism emphasizes the importance of pre-serving ties that bind people together, such as family, religion and customs, making traditional morality and a national way of life central (Klingemann et al. 2006). In Finland, typical dividing issues between social conservatives and progressives are immigration, same-sex marriage, same-sex adoption, the role of religion and tradi-tional morality in politics, and patriotism (Karvonen 2014).
Due to the diversity of human cultures and political systems, it is difficult to make generalizations about sex differences in sociopolitical attitudes. However, reviews and meta-analysis tend to conclude that the most substantial sex gap on economic issues is that women tend to endorse more socially compassionate policies, which manifests, for instance, in greater support of government spending for social pro-grams, such as programs for medical care, education, job creation, equal rights, and reducing income differences between the rich and poor (e.g., Eagly et al. 2004).
Regarding the social/cultural dimension of political attitudes, the literature is more mixed. Although some cross-cultural research suggests that women support traditional moral values more than men (e.g., women are more opposed to extra-marital relationships, divorce, suicide, and the legalization of marijuana; Eagly et al. 2004), recent Eurobarometer statistics (retrieved 5.2.2019 from http://websi te.ca/full http://ec.europ a.eu/commf ronto ffice /publi copin ion/index .cfm) show that women have a more tolerant attitude towards progressive lifestyle values, including more positive attitudes towards multiculturalism and immigrants, as well as towards reli-gious and sexual minorities.
Sex Differences in Political Attitudes in the Political Elite
Women’s experiences and responsibilities in the private sphere have been suggested to influence their attitudes and behavior also in the political sphere (e,g., Swers 2001). Consistent with this, several studies have suggested that female lawmakers tend to express stronger concern about social policies, such as those pertaining to education, reproductive rights, child-care, and family health legislation (e.g., Rein-gold 2008; Saint-Germain 1989; Swers 2001). However, other studies have sug-gested that factors such as political party, region, religion, class, and constituency characteristics exert a much stronger influence, rendering the influence of sex insig-nificant (Thomas et al. 2014).
Studies that have found sex effects have reported these effects to be moderated by issue. For instance, some studies report no differences on economy and welfare state issues, but some variation in attitudes towards equal rights and affirmative action (e.g., McEvoy 2016). Also party affiliation has been suggested to moderate the influ-ence of sex. In the US, in which much of the relevant research has been conducted, women legislators express significantly more progressive welfare policy preferences

1782 Political Behavior (2021) 43:1779–1800
1 3
than men, but sex differences are greater among Republican than Democrat legisla-tors (Poggione 2004).
Sex, Gender, and Gender Giagnosticity
Bittner and Goodyear-Grant (2017) recently argued that despite the centrality of sex and gender to political behavior, they are poorly measured and often conflated. Sex, in its common-language meaning, refers to two fixed, natural and binary categories (male and female) into which humans are divided on the basis of biological differ-ences. By contrast, gender consists of the meanings ascribed to male and female social categories within a culture. When people incorporate these cultural meanings, gender becomes part of their identity. Through these gender identities, individuals understand themselves in relation to the culturally feminine and masculine meanings attached to men and women, and they may think and act according to these gendered aspects of their selves (Wood and Eagly 2015). Despite the disparate meanings of sex and gender, sex is often in social science surveys used as a proxy of gender. This practice severely distorts the measurement of gender (Bittner and Goodyear-Grant 2017).
The oldest and most common approach to measuring genderedness is to meas-ure attributes, such as attitudes and behaviors, that are thought to differ between the sexes (Wood and Eagly 2015). The researchers, drawing for instance on issues raised by women’s rights movements (e.g., autonomy and well-being of women, issues tra-ditionally thought to belong to the private sphere) a priori decide on which attitudes and behaviors are typical of which gender, and item responses are used to compute indices of masculinity and femininity (Saint-Germain 1989). However, the creation of items and the a priori classification of which items indicate which gender is likely to be biased by gender stereotypes. In response to such criticism, Lippa and Con-nelly (1990) introduced and operationalized gender diagnosticity.
The gender diagnosticity approach (Lippa and Connelly 1990) is based on the notion that within-sex gender differences in psychological constructs are defined by between sex differences in these constructs (Terman and Miles 1936). In practice, this translates into using Bayesian posterior probabilities to indicate how female-like or male-like an individual is given the observed differences between the sexes in a population (Lippa and Connelly 1990). These probabilities can be derived by statistical approaches (e.g., linear discriminant analysis; Lippa and Connelly 1990), whereby a linear combination in a set of attributes is weighted with the goal of maximizing its ability to differentiate between sexes. The purpose of this method is to provide a continuous measure of gender (Lippa and Connelly 1990), an index that indicates how gender typical a given respondent’s responses are. Typicality is here interpreted statistically; e.g., the femininity of political attitudes refers to the degree to which the respondent’s attitudes match those attitudes that tend to be more typical among female than male politicians. A man can have feminine political atti-tudes, and a woman can have masculine political attitudes. This method has been employed, for instance, to show that masculine attitudes predict substance abuse among both males and females (Mahalik et al. 2015).

1783
1 3
Political Behavior (2021) 43:1779–1800
As noted above, women may, for instance, be more socially conservative than men on some issues and more progressive on others. This means that employing a composite sum variable of conservativeness would mask the presence of sex dif-ferences. Furthermore, not only can the direction of possible sex differences be expected to vary from issue to issue, but also the magnitude of such differences. Some attitude items are likely to be more strongly associated with sex than other items, and this should be reflected in the weights that the items are assigned. The gender diagnosticity approach allows for the construction of a variable that reflects overall sex differences in attitudes per se. We label this variable political feminin-ity–masculinity. The lower (higher) the person’s score on femininity–masculinity, the more strongly the attitude profile of that person suggest that the individual is female (male). The exact construction of the variable is detailed in the Methods section.
The Importance of Voting Advice Applications in the Finnish Electoral System
Above we noted that a general limitation of the research on the sex gap in the politi-cal elite is that the research usually relies on observable legislative behavior, which if often externally constrained. The Finnish electoral system provides a unique, or at least rare, context in which to study the actual attitudes of the candidates by means of candidates’ responses to Voting Advice Applications (VAAs). A VAA is a web tool designed to let voters get an idea of which parties’ or candidates’ positions are clos-est to their own preferences. After completing a series of questions regarding their agreement with policy statements on prominent issues, users are shown how their positions match those of each party and/or each candidate competing in an elec-tion (see, e.g., Garzia and Marschall 2012). VAAs have in the last decade become extremely popular, particularly in European countries with multi-party systems. In recent elections, they have reached more than 20% of the electorate in countries such as Switzerland, Germany, Finland and Denmark (Germann and Gemenis 2019). A recent meta-analysis on the effects of VAAs shows that VAAs have positive effects on turnout, vote choice, and issue knowledge (Munzert and Ramirez Ruiz 2021).
In Finland VAAs are particularly important because of the Finnish electoral sys-tem. Elections in Finland are wholly open list; that is, voters have to vote for indi-vidual candidates, not for party lists (in closed list elections, voters vote for party lists and cannot affect the order of candidates within the lists). This means that indi-vidual candidates compete against fellow partisans for seats in the municipal council (strong within-party competition). The elections are proportional, meaning that the percent of the vote won by a party in a municipality is the percent of seats the party receives in the municipal council (leading to between-party competition). Wholly open-list proportional representation with mandatory preferential voting has gener-ated a multi-party system that involves a high degree of both within- and between party competition (Von Schoultz 2018).
Although VAAs are part of the elections also in other Western European coun-tries, the Finnish context differs in that these other countries all have closed list elec-tions (the parties determine the order in which candidates are selected), meaning

1784 Political Behavior (2021) 43:1779–1800
1 3
that the VAAs only recommend parties. By contrast, in Finland the VAAs recom-mend individual candidates, and this is done based on the fit between the candidate’s and the voter’s responses to the VAA questions. The wholly open list system (the parties have no say in which of its candidates are elected) make it important for can-didates to attract personal votes, making the VAAs an extremely important tool for candidates. Indeed, the effects of VAAs on election behavior are particularly strong in Finland; e.g., in the above referred to meta-analysis (Munzert and Ramirez Ruiz 2021) the strongest effects of VAAs on vote choice were found in Finland.
Research Questions
Based on the above described rather mixed pattern of results on the effects of sex on the sociopolitical attitudes of the political elite, our first batch of research questions concerns the existence and magnitude of a possible sex gap in the sociopolitical atti-tudes of the candidates in the 2017 Finnish municipal elections. Moreover, as some of the more thoughtfully conducted studies on this topic suggest that party affiliation may render the influence of sex close to null (e.g., Reingold 2008), we sought to compare the effects of sex with those of party affiliation.
Our second batch of research questions concerns the possible determinants of the sex gap. We will investigate to what extent the sex gap varies across parties, and to what extent party-level characteristics can help explain the sex gap. For these analyses, we will employ, along with the conventional measures of economic and social attitudes, our new measure of the genderedness of political attitudes. We seek to investigate whether the sex gap is, as in the US (Poggione 2004), stronger among right-oriented, as opposed to left-oriented parties, and among conservative, as opposed to progressive parties. Related to this, we ask which sex drives differ-ences in the sex gap across parties. If, as our results will suggest, the strength of the sex gap varies across parties, then these differences could be driven by either sex. One recent study, run in the US, showed that female republicans’ policy positions are closer to those of the median voter, and that women are more likely to spon-sor bills that attract bipartisan support (Gagliarducci and Paserman 2016). Based on this, we expect women, across parties, to be more similar to each other in terms of political attitudes, whereas men’s attitudes will may vary more as a function of party affiliation. This implies that women in right-oriented or conservative parties could be more similar, in terms of political attitudes, to women in more left-oriented or progressive parties, with the men in right-oriented and conservative parties caus-ing the larger sex gap in those parties. We will also investigate whether other party characteristics; i.e., mean age, income, and education, as well as gender distribution, predict the size of the sex gap.
1785
1 3
Political Behavior (2021) 43:1779–1800
Methods
Participants
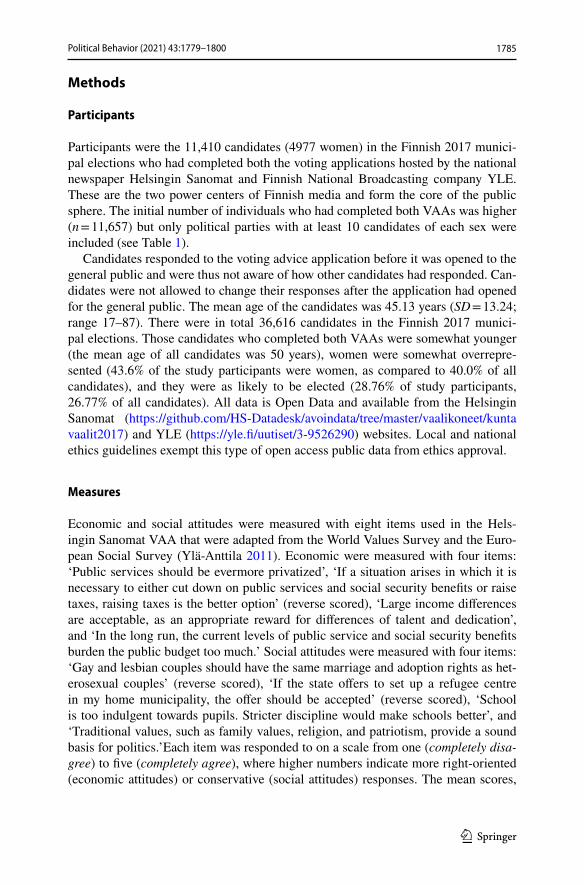
Participants were the 11,410 candidates (4977 women) in the Finnish 2017 munici-pal elections who had completed both the voting applications hosted by the national newspaper Helsingin Sanomat and Finnish National Broadcasting company YLE. These are the two power centers of Finnish media and form the core of the public sphere. The initial number of individuals who had completed both VAAs was higher (n = 11,657) but only political parties with at least 10 candidates of each sex were included (see Table 1).
Candidates responded to the voting advice application before it was opened to the general public and were thus not aware of how other candidates had responded. Can-didates were not allowed to change their responses after the application had opened for the general public. The mean age of the candidates was 45.13 years (SD = 13.24; range 17–87). There were in total 36,616 candidates in the Finnish 2017 munici-pal elections. Those candidates who completed both VAAs were somewhat younger (the mean age of all candidates was 50 years), women were somewhat overrepre-sented (43.6% of the study participants were women, as compared to 40.0% of all candidates), and they were as likely to be elected (28.76% of study participants, 26.77% of all candidates). All data is Open Data and available from the Helsingin Sanomat (https ://githu b.com/HS-Datad esk/avoin data/tree/maste r/vaali konee t/kunta vaali t2017 ) and YLE (https ://yle.fi/uutis et/3-95262 90) websites. Local and national ethics guidelines exempt this type of open access public data from ethics approval.
Measures
Economic and social attitudes were measured with eight items used in the Hels-ingin Sanomat VAA that were adapted from the World Values Survey and the Euro-pean Social Survey (Ylä-Anttila 2011). Economic were measured with four items: ‘Public services should be evermore privatized’, ‘If a situation arises in which it is necessary to either cut down on public services and social security benefits or raise taxes, raising taxes is the better option’ (reverse scored), ‘Large income differences are acceptable, as an appropriate reward for differences of talent and dedication’, and ‘In the long run, the current levels of public service and social security benefits burden the public budget too much.’ Social attitudes were measured with four items: ‘Gay and lesbian couples should have the same marriage and adoption rights as het-erosexual couples’ (reverse scored), ‘If the state offers to set up a refugee centre in my home municipality, the offer should be accepted’ (reverse scored), ‘School is too indulgent towards pupils. Stricter discipline would make schools better’, and ‘Traditional values, such as family values, religion, and patriotism, provide a sound basis for politics.’Each item was responded to on a scale from one (completely disa-gree) to five (completely agree), where higher numbers indicate more right-oriented (economic attitudes) or conservative (social attitudes) responses. The mean scores,

1786 Political Behavior (2021) 43:1779–1800
1 3
Tabl
e 1
Sam
ple
size
s, de
scrip
tive
stat
istic
s, an
d se
x di
ffere
nces
in P
oliti
cal a
ttitu
des f
or w
omen
and
men
in e
ach
polit
ical
par
ty
d = st
anda
rdiz
ed m
ean
diffe
renc
e be
twee
n w
omen
and
men
, cal
cula
ted
with
sta
ndar
d de
viat
ion
that
was
poo
led
acro
ss a
ll pa
rty ×
sex
grou
ps (0
.68
and
0.70
, for
eco
nom
ic
and
soci
al a
ttitu
des,
resp
ectiv
ely)
Party
Sam
ple
size
Econ
omic
atti
tude
sSo
cial
atti
tude
s
Wom
enM
enW
omen
Men
Wom
enM
en
nn
MSD
MSD
dM
SDM
SDd
Cen
tre P
arty
848
1025
0.18
0.66
0.37
0.71
− 0
.29
0.14
0.70
0.53
0.74
− 0
.56
Chr
istia
n D
emoc
rats
260
259
− 0
.04
0.73
0.17
0.76
− 0
.30
0.91
0.52
1.07
0.57
− 0
.23
Com
mun
ist P
arty
3955
− 1
.35
0.47
− 1
.37
0.37
0.02
− 1
.15
0.62
− 1
.16
0.48
0.02
Finn
s Par
ty27
682
40.
030.
780.
280.
87−
0.3
61.
170.
621.
420.
60−
0.3
5G
reen
Lea
gue
1026
792
− 0
.48
0.63
− 0
.42
0.69
− 0
.09
− 0
.91
0.55
− 0
.86
0.63
− 0
.08
Left
Alli
ance
514
643
− 1
.17
0.47
− 1
.12
0.48
− 0
.06
− 0
.84
0.77
− 0
.72
0.81
− 0
.17
Nat
iona
l Coa
litio
n Pa
rty99
515
220.
920.
731.
160.
72−
0.3
50.
110.
680.
390.
75−
0.4
0Pi
rate
Par
ty20
79−
0.2
40.
96−
0.0
50.
92−
0.2
9−
1.2
30.
43−
0.8
10.
73−
0.5
9So
cial
Dem
ocra
tic P
arty
862
1070
− 0
.69
0.59
− 0
.60
0.60
− 0
.13
− 0
.43
0.76
− 0
.10
0.82
− 0
.46
Swed
ish
Peop
le’s
Par
ty13
716
40.
000.
740.
430.
84−
0.6
3−
0.7
00.
61−
0.3
40.
76−
0.5
2

1787
1 3
Political Behavior (2021) 43:1779–1800
SDs and reliabilities for economic and social attitudes were, respectively, M = 2.61 (SD = 1.00; α = 0.79) and 2.76 (SD = 1.02; α = 0.74).
Income and education, available from the YLE VAA, were coded as binary. The average income in Finland in 2016 was 28,974€. The categories employed by YLE allowed us to code participants reporting an income smaller (greater) than 30,000€ as below (above) average, coded as zero (one). All education lower (higher) than bachelor’s degree was coded as zero (one). A total of 2910 (40.91%) of those 7114 who reported their income were below average income, and 3973 (44.11%) of those 9007 who reported highest educational attainment had lower than bachelor’s degree education.
Statistical Approach
We first employed multilevel modeling to examine sex differences in economic and social attitudes (using mean scores). In the multilevel models, political party was treated as a random effect within which candidates belonging to each party were nested. Sex differences were modelled in three steps. First, a random intercept model without any independent variables was fitted. The fixed effects of individual-level sex and party-level sex (proportion of men in the party) were entered into the model at the next step. For each candidate, individual-level sex was centered around the mean of the individual’s political party. This way, individual-level sex indicated sex differences in political attitudes independent of the proportion of women and men in the political party. In the third and final step, a random effects model was constructed in which the effect of individual-level sex was allowed to vary between political parties. Such an effect would indicate that sex differences vary between par-ties. In this model, the correlation between the random intercepts (the party means on economic/social attitudes) and the random effects of sex (sex differences within party) was also estimated.
To investigate sex differences in attitudes per se we constructed the political femininity–masculinity variable. We employed a cross-validation approach in which overall sex differences were estimated in one dataset (training data; n = 5704) and tested in another (testing data; n = 5706). This was done to avoid circularity. The split into training and testing data was done at the level of the party in order to have a representative number of participants in each party-cluster. The split into training and testing data, along with all of the subsequent analyses, were repeated 1000 times to ensure that the results were independent of the data split and in order to estimate sampling variability in the estimated parameters.
Political femininity–masculinity was constructed in the training phase by means of penalized regression analysis (McNeish 2015). Penalized regression is especially suitable when there are many highly intercorrelated potential predictor variables—the method offers parsimonious and precise models, which leads to better predic-tive performance in independent datasets. We used elastic net penalty, a compromise between ridge regression and LASSO (McNeish 2015). In the penalized regression for the training data, sex was regressed on the eight political attitudes by binomial link regression, for which the regularization parameter was obtained using tenfold

1788 Political Behavior (2021) 43:1779–1800
1 3
cross-validation in which cross-validated error was minimized. From this analysis, coefficient weights for each political attitude were obtained and used in the testing set to construct predicted values of sex based on political attitudes. The predicted values were logistically distributed and were standardized within the testing sample. These predicted values served as the operationalization of political femininity–mas-culinity in the present study. An approach similar to ours has been run with large sets of narrow personality traits predicting various outcomes (Seeboth and Mõttus 2018). The penalized regression analyses were run with the glmnet package (Fried-man et al/ 2010) in R (R Core Team 2017).
We constructed, using the above describe method, similar models including the party-level covariates income, education, age, and sex distribution. We sought to investigate whether they could explain differences between parties either in political femininity–masculinity (main effects of party-level covariates) or in sex gaps (cross-level interactions with sex). The equations for the multilevel models are presented in Online Appendix A.
Inferences regarding the statistical significance of the parameters were based on the distribution of parameter estimates across repeated sets of analyses. If the 95% percentile confidence intervals excluded zero, the parameter was considered sig-nificant. For economic and social attitudes, the entire dataset was bootstrapped to obtain the confidence intervals. For political femininity–masculinity, the distribu-tion across permutations (variants of training/testing splits) was used. All multilevel models were fitted with the lme4 -package (Bates et al. 2015) in R (R Core Team 2017). Analysis scripts are made openly available at https ://osf.io/cnfze /.
Results
Economic and Social Attitudes
Means, standard deviations, and standardized mean differences in economic and social attitudes between women and men are presented party-wise in Table 1. In the entire sample, women (M = − 0.14, SD = 0.93) scored lower than men (M = 0.11, SD = 1.03) in economic attitudes, t(11,135) = − 13.49, p < 0.001, d = − 0.25, indicat-ing more left-wing attitudes among women. The sex differences in observed means suggested that sex gaps in economic attitudes were heterogeneous across politi-cal parties (standardized differences ranged from d = − 0.63 to d = 0.02). Women (M = − 0.22, SD = 0.91) also scored lower than men (M = 0.18, SD = 1.03) in social attitudes, t(11,192) = − 22.22, p < 0.001, d = − 0.41, indicating more progressive attitudes among women. For social attitudes, the party-specific sex gaps ranged from d = − 0.59 to d = 0.02.
The heterogeneity of sex differences between parties was examined with mul-tilevel models in which party was treated as a random variable. Tables S1 and S2 in the Supplementary Information present the results for economic and social attitudes, respectively. The random intercept model (Model 0) showed that 50.06% of the variance in economic attitudes was between parties. The param-eter estimates of Model 1 indicated a general sex gap: sex was associated with

1789
1 3
Political Behavior (2021) 43:1779–1800
economic attitudes at the level of the individual (γ10 = 0.16, 95% CI from 0.13 to 0.19), but the percentage of men in the party was not associated with party-level economic attitudes (γ01 = 0.01, 95% CI from − 0.03 to 0.05). Sex explained 1.26% of the individual-level variance in Model 1. Including random effects for sex in the model, as well as the correlation between the random intercept and the effect of sex (Model 2), improved the model. The estimate for the random effect of sex on economic attitudes was σu1 = 0.07 (95% CI from 0.03 to 0.11). The mean model estimate for the correlation between economic attitudes and sex dif-ferences in economic attitudes at the level of the party was perfect, σu01 = 1.00 (95% CI from 0.85 to 1.00), indicating that sex differences in economic attitudes are larger (smaller) in right-wing (left-wing) parties. Estimating the between-party variance as conditional on sex revealed that the between party variance was larger among men (σ2
u0 = 0.56) than among women (σ2u0 = 0.46). The boot-
strapped estimates of variance supported this conclusion: 99.8% of the bootstrap samples showed higher variance among men. Thus, party-level differences in the sex gap for economic attitudes were mostly due to men from different parties being dissimilar.
Regarding social attitudes, 56.39% of variance was between parties (Model 0). In the fixed effects model (Model 1), individual level-sex predicted the individual’s social attitudes (γ10 = 0.25, 95% CI from 0.22 to 0.27), explain-ing 2.84% of the variance, but the percentage of male candidates did not pre-dict social attitudes at the party-level (γ10 = 0.01, 95% CI from − 0.03 to 0.06). Including random effects for sex in the model, as well as the correlation between the random intercept and the effect of sex (Model 2), improved the model. The random effect for sex was σu1 = 0.11 (95% CI from 0.03 to 0.16). At the level of the party, the correlation between social attitudes and sex differences in social attitudes was moderately high, σu01 = 0.40 (95% CI from − 0.75 to 1.00), but was not consistently positive across bootstrapped samples. Party-level variance com-ponents calculated as conditional on sex showed that the estimate of between-party variance was larger for men (σ2
u0 = 0.69) than for women (σ2u0 = 0.62), but
this difference was not reliably observed across the bootstrap samples, of which 83.6% showed larger variance for men. Thus, sex differences in social attitudes differed across parties, but in contrast to economic attitudes, we cannot reliably (at p < 0.05) conclude that these differences are driven by men differing more strongly across parties.
The predicted values of economic and social attitudes for women and men (calculated across 1000 bootstrap samples of random effect models) are shown party-wise in Fig. 1. Although the between-party difference is the most striking observation (around 50% of the variance of both variables was between parties), it is also obvious that sex gaps are non-identical across political parties (consist-ent with the above identified presence of random effects in the models). We next employ the political femininity–masculinity variable to investigate the size of the sex gap across parties and its determinants.

1790 Political Behavior (2021) 43:1779–1800
1 3
Political Femininity–Masculinity
The regression coefficients obtained from the penalized elastic net binomial regres-sion predicting sex with eight attitude variables are shown in Table S3. Each atti-tude had unique associations with sex and there was heterogeneity in the magnitude and the directions of these associations. Attitudes concerning the acceptability of income differences and the rights of gay and lesbian couples were most strongly associated with sex. The coefficient weights obtained from the training data were used, one permutation at a time, to compute the predicted political femininity–mas-culinity variable in the testing data.
The results of multilevel models predicting political femininity–masculinity in the testing data are presented in Table S4. The random intercept model (Model 0) showed that on average 28.75% of the variation in political femininity–masculin-ity was between parties (95% of all permutations were between 24.66 and 32.84%). Inclusion of sex effects (Model 1) improved the model. The coefficient for individ-ual-level sex, indicating a general sex gap in the data, was estimated at γ10 = 0.45 (95% of estimates fell between 0.42 and 0.48), and explained, on average, 6.54% of the individual-level variance in political femininity–masculinity. This pseudo-R2 coefficient was transformed into Cohen’s d (see Borenstein et al. 2009), giving the effect size d = 0.53 (SD = 0.02) for sex effects across permutations. The observed
Fig. 1 Model estimates of economic and social attitudes for women and men in different political parties based on predicted values of random effect models across 1000 bootstrap samples. Shapes indicate mean estimates and ellipses depict 95% percentile confidence intervals around the means

1791
1 3
Political Behavior (2021) 43:1779–1800
grand mean across permutations, ignoring party-clusters, gave a comparable esti-mate of the sex gap, d = 0.57 (SD = 0.02).
At the party-level, percentage of men was consistently associated with party-level femininity–masculinity (γ01 = 0.02, indicating that a ten percent increase in men increases masculinity by 0.20, 95% CI from 0.10 to 0.30). Controlling for the vary-ing sex ratios between parties decreased the amount of variation in political feminin-ity–masculinity that was explained by party from 28.75% to 26.96% (95% CI from 21.19% to 32.49%). Including random effects for sex in the model, as well as the correlation between the random intercept and the effect of sex (Model 2), improved the model. The mean estimate of the random effect of sex across all permutations was σu1 = 0.13 (95% CI from 0.10 to 0.17). The correlation between the party mean on femininity–masculinity and the party-specific effects of sex on femininity–mas-culinity was estimated at σu01 = 0.67 (95% CI from 0.27 to 0.99).
The variance–covariance matrix of Model 2 for political femininity–masculin-ity was examined to determine whether sex differences were more strongly driven by either sex. The average estimate for between-party variance in political feminin-ity–masculinity was 0.31 (SD = 0.04) for men, and 0.22 (SD = 0.03) for women. Fur-thermore, between-party variance for men was larger in 99.7% of the permutations, indicating that the reason that the parties had sex gaps of different magnitude is that the men differed more between parties than did women. The party-wise estimates for political femininity–masculinity for both sexes are presented in Table 2 and depicted in Fig. 2.
We next sought to investigate to what extent between-party differences in average political femininity–masculinity correlated with other party characteristics; i.e., with mean income, mean education, mean age, and with the percentage of men, as well as with the party means of economic and social attitudes. Because of the high degree of multicollinearity between these characteristics, they were each entered separately into the model. The correlations between party-level variables, the amount of vari-ance of the random intercept and sex effects on political femininity–masculinity that could be explained are presented in Table 3. Results from the multilevel models are presented in Tables S5 and S6.
Mean age was associated with political femininity–masculinity. For each addi-tional year in the average age of the party member, party’s femininity–masculinity increased γ03 = 0.05 (95% CI [0.02, 0.10]). The means of economic γ05 = 0.41 (95% CI [0.11, 0.64]) and social attitudes γ06 = 0.63 (95% CI [0.55, 0.71]) were also both positively associated with party’s femininity–masculinity.
The final models investigated whether between-party differences in the sex gap in femininity–masculinity were associated with party-level demographic variables or party means of economic and social attitudes. This was done by including cross-level interaction terms to the model in which the party-level main effect from the same variable was already included alongside sex variables at both levels. Results from these models are presented in Tables S7 and S8. Mean income, γ12 = 0.01 (95% CI [0.003, 0.010]), the percentage of men, γ11 = 0.01 (95% CI [0.004, 0.014]), as well as mean economic, γ15 = 0.14 (95% CI [0.10, 0.19]), and social attitudes, γ16 = 0.12 (95% CI [0.06, 0.18]) were positively associated with sex effects on politi-cal femininity–masculinity.

1792 Political Behavior (2021) 43:1779–1800
1 3
Tabl
e 2
Obs
erve
d m
eans
of p
oliti
cal f
emin
inity
–mas
culin
ity a
cros
s 100
0 pe
rmut
atio
ns
M m
ean
of m
eans
acr
oss
perm
utat
ions
, SD
sta
ndar
d de
viat
ion
of m
eans
acr
oss
perm
utat
ions
, d m
ean
of s
tand
ardi
zed
mea
n di
ffere
nces
bet
wee
n w
omen
and
men
, cal
cu-
late
d w
ith st
anda
rd d
evia
tion
estim
ate
that
was
poo
led
acro
ss a
ll pa
rty ×
sex
grou
ps fo
r eac
h pe
rmut
atio
n
Wom
enM
end
MSD
2.5%
97.5
%M
SD2.
5%97
.5%
MSD
2.5%
97.5
%
Cen
tre P
arty
− 0
.17
0.03
− 0
.23
− 0
.11
0.40
0.03
0.34
0.47
− 0
.64
0.06
− 0
.76
− 0
.53
Chr
istia
n D
emoc
rats
0.55
0.08
0.37
0.70
0.85
0.08
0.70
1.00
− 0
.34
0.08
− 0
.50
− 0
.19
Com
mun
ist P
arty
− 0
.72
0.08
− 0
.89
− 0
.57
− 0
.47
0.12
− 0
.69
− 0
.24
−0.
290.
14−
0.5
6−
0.0
2Fi
nns P
arty
0.59
0.07
0.44
0.73
1.22
0.05
1.11
1.32
− 0
.70
0.08
− 0
.86
− 0
.55
Gre
en L
eagu
e−
0.7
80.
03−
0.8
3−
0.7
2−
0.5
10.
03−
0.5
8−
0.4
5−
0.2
90.
04−
0.3
7−
0.2
2Le
ft A
llian
ce−
0.6
50.
05−
0.7
4−
0.5
6−
0.4
40.
05−
0.5
3−
0.3
5−
0.2
40.
05−
0.3
3−
0.1
5N
atio
nal C
oalit
ion
Party
− 0
.04
0.04
− 0
.12
0.05
0.49
0.04
0.40
0.57
− 0
.58
0.05
− 0
.69
− 0
.49
Pira
te P
arty
− 0
.72
0.17
− 1
.04
− 0
.36
− 0
.09
0.11
− 0
.30
0.11
− 0
.70
0.22
− 1
.14
− 0
.25
Soci
al D
emoc
ratic
Par
ty−
0.5
60.
03−
0.6
2−
0.4
9−
0.0
80.
03−
0.1
4−
0.0
2−
0.5
30.
05−
0.6
3−
0.4
4Sw
edis
h Pe
ople
’s P
arty
− 0
.47
0.07
− 0
.61
− 0
.32
0.10
0.07
− 0
.04
0.23
− 0
.63
0.11
− 0
.84
− 0
.43
1793
1 3
Political Behavior (2021) 43:1779–1800
Discussion
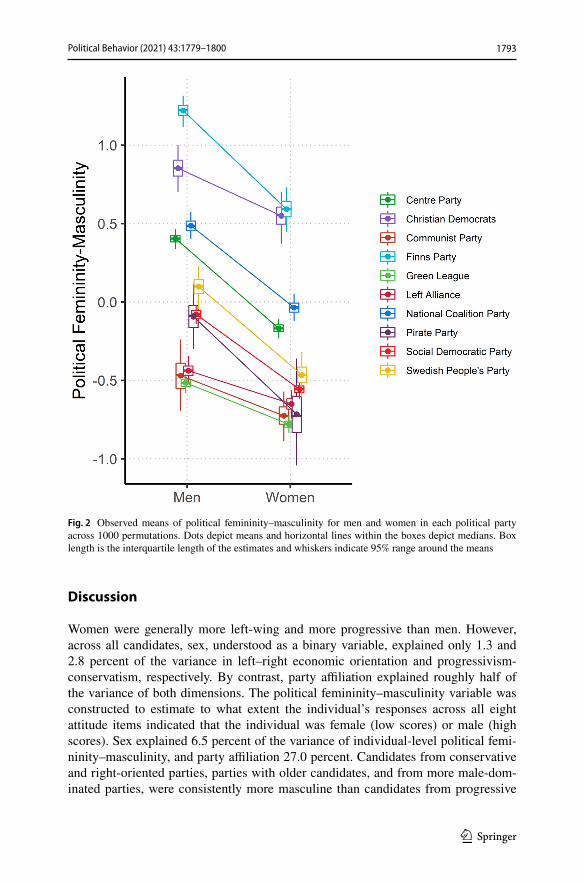
Women were generally more left-wing and more progressive than men. However, across all candidates, sex, understood as a binary variable, explained only 1.3 and 2.8 percent of the variance in left–right economic orientation and progressivism-conservatism, respectively. By contrast, party affiliation explained roughly half of the variance of both dimensions. The political femininity–masculinity variable was constructed to estimate to what extent the individual’s responses across all eight attitude items indicated that the individual was female (low scores) or male (high scores). Sex explained 6.5 percent of the variance of individual-level political femi-ninity–masculinity, and party affiliation 27.0 percent. Candidates from conservative and right-oriented parties, parties with older candidates, and from more male-dom-inated parties, were consistently more masculine than candidates from progressive
Fig. 2 Observed means of political femininity–masculinity for men and women in each political party across 1000 permutations. Dots depict means and horizontal lines within the boxes depict medians. Box length is the interquartile length of the estimates and whiskers indicate 95% range around the means

1794 Political Behavior (2021) 43:1779–1800
1 3
and left-oriented parties, parties with younger candidates, and parties with more women as candidates.
Regarding party-level determinants of the sex gap, we first established that the size of the sex gap indeed varied across parties. The sex gap in economic attitudes was clearly larger in economically right-oriented parties. A similar, although sta-tistically non-significant pattern could be observed with regards to social attitudes, with the sex gap being larger in more conservative parties. Regarding political femi-ninity–masculinity, constructed to best reflect sex differences, the more masculine parties had a clearly larger sex gap. That is, the effects of sex on political feminin-ity–masculinity were largest in parties in which candidates’ average responses were the most masculine. More right-oriented and more conservative parties also had a larger sex gap. Regarding demographic variables, percentage of men and mean eco-nomic income predicted a larger sex gap. Men differed more between parties than did women, and these differences explained why some parties had larger sex gaps than other parties. In sum, masculine parties had larger sex gaps, and the reason for this is that the men in more masculine parties were different from other candidates.
Sex Differences in Attitudes
Previous research has presented a plethora of rather mixed findings on whether and how female politicians differ from their male counter-parts (Wängnerud 2009). Our results add to this mix by investigating these issues in a Nordic welfare society. Fin-land, like Norway and Sweden, has developed an encompassing social insurance system with both high degrees of coverage and generous wage replacement (Korpi and Palme 1998).
In terms of the economic dimension of political attitudes, women were more to the left. This result is akin to results obtained for the mass public. However, what
Table 3 Mean inter-correlations of party-level variables and variance explained across 1000 permutations
Boldface correlations have non-zero 95% confidence intervals*Non-zero 95% interval for multilevel-model parameter estimate when either entered as single variable besides sex-ratio (row 7 col-umns from 1 to 6), or single cross-level interaction term (row 8 col-umns from 1 to 6)
Party-level variable 1 2 3 4 5 6
r1. Income2. Education .503. Age .33 − .074. Sex − .43 − .58 − .525. Economic attitudes .60 .34 − .16 .196. Social attitudes .39 − .28 .28 .15 .61R2
7. Femininity–Masculinity .05 .02 .20* .14* .38* .97*8. Sex difference in Femi-
ninity–Masculinity.38* .09 .00 .44* .56* .63*

1795
1 3
Political Behavior (2021) 43:1779–1800
makes our results particularly interesting is that the sex gap in economic attitudes was larger (smaller) in right-wing (left-wing) parties, and that party-level differences in the size of the sex gap were mostly due to men from different parties being dis-similar. Against the backdrop of the welfare state, this pattern suggests that women, across parties, are more willing to uphold the welfare state, and that men in left-oriented parties are, in this regard, rather similar to women.
In terms of social attitudes, women were clearly more progressive than men. This can be considered surprising, as previous research on the mass public has suggested that women may be more progressive on some issues, such as equal rights issues, and more conservative on other issues, such as those threatening traditional family values (Eagly et al. 2004). In Finland, a two-breadwinner society with high gender equality, a strong social safety net, and a provision of welfare services, women are not that dependent on the financial support of men, and freedom from such finan-cial constraints could allow women to take a more progressive stance also on family values.
Party and the Genderedness of Political Attitudes
Looking at the genderedness of political attitudes, it is clear that party does matter, and it does so in at least two ways. First off, party characteristics can help explain how politically masculine-feminine the attitudes of the candidate are. The more politically masculine candidates were from parties that had on average more right-oriented, more conservative, older, and more male candidates. The more right-ori-ented and conservative parties were more masculine. More surprising is that par-ties with older candidates were also more masculine. This could be an age effect, with people moving towards more masculine attitudes along the life course. But it could also be a cohort effect, with especially old men having been socialized into more masculine attitudes, in which case the sex gap could be expected to gradually dissipate.
Also interesting is that parties with more male candidates had more masculine attitudes, even when the sex of the candidates was controlled for. This could be a case of self-selection, with male candidates attracted to parties with more masculine agendas. But the candidates of male dominated parties could also gradually come to endorse more masculine attitudes. Most likely, these processes are intertwined and difficult to disentangle without experimental or at least longitudinal designs. Never-theless, our results do suggest some type of polarization effect, in which homogene-ity in terms of sex is associated with the radicalization or polarization of attitudes.
A second way in which party mattered was that the sex gap varied considerably across parties. The effects of sex on political femininity–masculinity were largest in parties in which the candidates’ average responses were the most masculine and the most right-oriented. Also the percentage of men and mean economic income predicted a larger sex gap. Considering again that the sex gap was largely driven by men, it seems that it is male candidates from parties in which they are mostly sur-rounded by other men who are wealthy, masculine, and right-oriented, that differ from the same party’s female candidates.

1796 Political Behavior (2021) 43:1779–1800
1 3
Given that the one of the defining goals of feminism and of the left is equality, it is perhaps not that surprising that parties that are more feminine and more left-oriented are also more gender equal in terms of attitudes. Also the result pertaining to income and to the number of women can be interpreted from the perspective of equality. It is the high-income candidates and the male candidates, both of whom are entitled and privileged groups, who have the most to lose with increasing equality. A more general defense of the status quo, including traditional sex roles, could be reflected in a larger within-party sex gap driven by these men.
The Question of Generalizability
Given the rather unique context of this research; that is, the Finnish welfare state, one could ask which of the insights gleaned are not just restricted to this context but have a higher level of generalizability. One reason to believe the results could be context-sensitivity is there that has, in Finland, been strong political consensus that the welfare state, devised in a relatively strong period of economic growth, should, also in times of decreasing growth and unemployment, be maintained despite finan-cial difficulties. The political debate has not questioned the project itself, but focused mainly on how austere a version of the welfare state can be afforded. This means that those who wish to dismantle the welfare state will stand out from the rest. That is, men from right-wing parties will stand out.
However, probing further, why are men more willing to dismantle the well-fare state? Women’s responsibilities in the private sphere may steer them towards stronger concern about social policies (e.g., Reingold 2008; Saint-Germain 1989; Swers 2001). These responsibilities are similar across societies, suggesting that women, regardless of party affiliation, may be less willing to allow people to fall into poverty. This would suggest that our results according to which the right-most men in the most right-leaning parties explain the sex gap would generalize to other contexts. Currently, there is very little research that would help address this issue. However, consistent with our results, some previous work conducted in the US shows that women are more able to cooperate across partisan lines, with female Republicans having preferences that are closer to those of Democrats (Gagliarducci and Paserman 2016).
More generally, cross-cultural variation, as well as variation across time, on the magnitude and structure of sex differences, as well as their determinants, should be interesting directions for future research, especially as there already exist large cross-cultural data sets such as the World Values Survey that have regularly meas-ured political attitudes since the beginning of the 1980s.
Gender Diagnosticity
Besides the above discussed substantive contributions to the literature on sex differ-ences in political attitudes, we also seek to make some more general methodologi-cal claims. There is a plethora of different domains of political behavior in which men and women differ. However, default composite indices that reflect, for instance,

1797
1 3
Political Behavior (2021) 43:1779–1800
party identification, partisanship, legislative voting, bi-partisan co-operation, leader-ship behavior, and political ambition, may not be the best way to capture sex dif-ferences. Rather, summing up individual items into summary indices can mask the presence of real differences. Instead, we suggest that the empirical data should be used to compute a masculinity-femininity index that weights the individual items in such a way as to maximize their discriminatory power from the perspective of sex differences. This data analysis strategy should be especially well suited for situations in which it is a priori unclear whether any such differences exist.
Computing indices of genderedness that maximize sex differences in various domains of political behavior opens up the possibility to ask a novel types of ques-tions. For instance, is genderedness in one domain, such as bipartisan co-operation, associated with genderedness in another domain, such as leadership behaviour? Or more generally, is there one general dimension of femininity–masculinity that cuts across various domains of political behaviour?
Limitations and Conclusions
In contrast to our research, which focuses on attitudes, much of the research on sex differences in politics has employed politicians’ recorded votes as dependent vari-able. However, public voting behaviour is often subject to strong institutional con-straint (e.g., party discipline, rules, government-opposition dynamics, strategic con-siderations, deal-making, partisanship, routine), and may therefore often constitute poor cues as to what individual politicians actually consider important (Hall and Taylor 1996). That individual politicians may only seldom have to opportunity to vote freely can in part explain why previous research on the sex gap has provided mixed results.
As a proxy of the actual attitudes of politicians, responses to VAAs should fare better than observable legislative behavior. However, given that it is actual voting behavior, not attitudes, that shapes decision making, one could reasonably question whether attitudes matter. We argue that attitudes do matter. First, politicians often defect from the party-line when voting (Bowler et al. 1999). Especially local politi-cians, with local ties and individual support bases, can be much more individualistic than national level politicians, simply because they are much less dependent on insti-tutional party support for their political careers (Tavits 2009). Attitudes also have a profound role to play in shaping the party line. There are, of course, many political factors that affect party agendas, but it is the politicians, the ambitious office seekers and office-holders, who have “created and maintained, used and abused, reformed or ignored the political party” (p. Aldrich 1995; p. 4). Although the attitudes of office-holders may not always be reflected in their day-to-day legislative activities, they may be crucial for how the party agenda evolves over time. Also local politicians’ attitudes matter, especially now that local politics have become increasingly politi-cized (Egner 2015). Finally, the attitudes of office-holders matter because they can and do shift the public’s attitudes towards their own favored positions (Broockman and Butler 2017).

1798 Political Behavior (2021) 43:1779–1800
1 3
One could criticize our use of VAAs as measures of attitudes because VAA responses, like all questionnaire responses, are subject to various types of response bias (e.g., social desirability, response acquiescence, dissembling, social signal-ing). Although strategic consideration could inform responses to VAAs, this is more likely for career politicians. Municipal office-holders receive only a small compen-sation for attending municipal meetings, and there are only a few meetings annually. It is a part-time position that does not interfere with day jobs. The private returns to being elected to a municipal council are also negligible (Kotakorpi et al. 2017). This implies that municipal election candidates tend to be internally motivated by their personal convictions and values. Morally convinced policy advocates have been found to be neither capable nor willing to tailor their message in order to appeal to those who think differently (Feinberg and Willer 2015). It seems an obvious strategy for candidates to respond honestly, in the hope of attracting voters who have similar beliefs.
Perhaps the most important limitation of the present research was the rather short set of attitude items. A longer and more comprehensive list of items would most likely have allowed us to construct a much better political femininity–masculinity variable. Having more items would also have allowed us to more systematically investigate how the sex gap varies across issues. Despite this limitation, one impor-tant conclusion that the present research allows is that sex does matter. This means that there is all the more reason to celebrate increasing diversity in the echelons of power. Around seventy percent of Finnish men vote for a same-sex candidate, whereas women tend to split their vote evenly. Nevertheless, Finnish men seldom mention sex as basis for their voting decisions, whereas women do (Holli and Wass 2010). Our results show that sex matters, and that it matters more in some parties than in other parties. Especially when voting for conservative and right-oriented par-ties, voters would do well to consider also the sex of the participant.
Supplementary Information The online version contains supplementary material available at https ://doi.org/10.1007/s1110 9-021-09681 -2.
Acknowledgements This research was supported by the Academy of Finland research Grant 309537.
Funding Open Access funding provided by University of Helsinki including Helsinki University Central Hospital.
Compliance with Ethical Standards
Conflict of interest The authors have no competing interest.
Open Access This article is licensed under a Creative Commons Attribution 4.0 International License, which permits use, sharing, adaptation, distribution and reproduction in any medium or format, as long as you give appropriate credit to the original author(s) and the source, provide a link to the Creative Com-mons licence, and indicate if changes were made. The images or other third party material in this article are included in the article’s Creative Commons licence, unless indicated otherwise in a credit line to the material. If material is not included in the article’s Creative Commons licence and your intended use is not permitted by statutory regulation or exceeds the permitted use, you will need to obtain permission directly from the copyright holder. To view a copy of this licence, visit http://creat iveco mmons .org/licen ses/by/4.0/.

1799
1 3
Political Behavior (2021) 43:1779–1800
References
Aldrich, J. H. (1995). Why parties?: The origin and transformation of political parties in America. Chi-cago: University of Chicago Press.
Bates, D., Maechler, M., Bolker, B., & Walker, S. (2015). lme4: Linear mixed-effects models using Eigen and S4. R package version, 1(1–7), 2014.
Bittner, A., & Goodyear-Grant, E. (2017). Sex isn’t gender: Reforming concepts and measurements in the study of public opinion. Political Behavior, 39, 1019–1041.
Borenstein, M., Hedges, L. V., Higgins, J. P. T., & Rothstein, H. R. (2009). Introduction to meta-analysis. Wiley.
Bowler, S., Farrell, D. M., & Katz, R. S. (1999). Party discipline and parliamentary government. Colum-bus: Ohio State University Press.
Broockman, D. E., & Butler, D. M. (2017). The causal effects of elite position-taking on voter attitudes: Field experiments with elite communication. American Journal of Political Science, 61, 208–221.
Conover, P. J., & Feldman, S. (1980). Belief system organization in the American electorate: an alterna-tive approach. In J. C. Pierce & J. L. Sullivan (Eds.), The electorate reconsidered (pp. 49–67). Bev-erly Hills, CA: Sage.
Eagly, A. H., Diekman, A. B., Johannesen-Schmidt, M. C., & Koenig, A. M. (2004). Gender gaps in sociopolitical attitudes: Asocial psychological analysis. Journal of Personality and Social Psychol-ogy, 87, 796–816.
Egner, B. (2015). Parliaments in disguise? How German councillors perceive local councils. Local Gov-ernment Studies, 41, 183–201.
Feinberg, M., & Willer, R. (2015). From Gulf to bridge. Personality and Social Psychology Bulletin, 41(12), 1665–1681.
Friedman, J., Hastie, T., & Tibshirani, R. (2010). Regularization paths for generalized linear models via coordinate descent. Journal of statistical software, 33, 1–22.
Gagliarducci, S., & Paserman, M. D. (2016). Gender differences in cooperative environments? Evidence from the US Congress (No. w22488). National Bureau of Economic Research.
Garzia, D., & Marschall, S. (2012). Voting Advice Applications under review: the state of research. Inter-national Journal of Electronic Governance, 5(3/4), 203.
Germann, M., & Gemenis, K. (2019). Getting out the vote with Voting Advice Applications. Political Communication, 36, 149–170.
Hall, P. A., & Taylor, R. C. (1996). Political science and the three new institutionalisms. Political Studies, 44, 936–957.
Holli, A. M., & Wass, H. (2010). Gender-based voting in the parliamentary elections of 2007 in Finland. European Journal of Political Research, 49, 598–630.
Karvonen, L. (2014). Parties, governments and voters in Finland: politics under fundamental societal transformation. Colchester: ECPR Press.
Klingemann, H.-D., Volkens, A., Bara, J. L., Budge, I., & McDonald, M. D. (2006). Mapping policy pref-erences II: Estimates for parties, electors, and governments, 1990–2003. Oxford: Oxford University Press.
Korpi, W., & Palme, J. (1998). The paradox of redistribution and strategies of equality: Welfare state institutions, inequality, and poverty in the Western countries. American Sociological Review, 63, 661–687.
Kotakorpi, K., Poutvaara, P., & Terviö, M. (2017). Returns to office in national and local politics: A boot-strap method and evidence from Finland. The Journal of Law, Economics, and Organization, 33(3), 413–442.
Lippa, R. A., & Connelly, S. (1990). Gender diagnosticity: A new Bayesian approach to gender-related individual differences. Journal of Personality and Social Psychology, 59, 1051–1065.
Mahalik, J. R., Lombardi, C. M., Sims, J., Coley, R. L., & Lynch, A. D. (2015). Gender, male-typicality, and social norms predicting adolescent alcohol intoxication and marijuana use. Social Science & Medicine, 143, 71–80.
McEvoy, C. (2016). Does the descriptive representation of women matter? A comparison of gendered dif-ferences in political attitudes between voters and representatives in the European Parliament. Poli-tics & Gender, 12, 754–780.
McNeish, D. M. (2015). Using lasso for predictor selection and to assuage overfitting: A method munzer-long overlooked in behavioral sciences. Multivariate Behavioral Research, 50, 471–484.

1800 Political Behavior (2021) 43:1779–1800
1 3
Munzert, S., & Ramirez Ruiz, S. (2021). Meta-Analysis of the effects of voting advice applications. Polit-ical Communication.
Poggione, S. (2004). Exploring gender differences in state legislators’ policy preferences. Political Research Quarterly, 57, 305–314.
R Core Team. (2017). R: A language and environment for statistical computing. Vienna: R Found Stat Comput.
Reingold, B. (2008). Women as office holders: Linking descriptive and substantive representation. Politi-cal Women and American Democracy, 9, 128–147.
Saint-Germain, M. A. (1989). Does their difference make a difference? The impact of women on public policy in the Arizona legislature. Social Science Quarterly, 70, 956–968.
Seeboth, A., & Mõttus, R. (2018). Successful explanations start with accurate descriptions: Questionnaire items as personality markers for more accurate predictions. European Journal of Personality, 32, 186–201.
Swers, M. (2001). Research on women in legislatures: what have we learned where are we going? Women & Politics, 23(1–2), 167–185.
Tavits, M. (2009). The making of mavericks: Local loyalties and party defection. Comparative Political Studies, 42(6), 793–815.
Terman, L. M., & Miles, C. C. (1936). Sex and personality: Studies in masculinity and femininity. New York: Russell & Russell.
Thomas, S., & Wilcox, C. (Eds.). (2014). Women and elective office: Past, present, and future. Oxford: Oxford University Press.
Von Schoultz, Å. (2018). Electoral systems in context: Finland. In E. S. Herron, R. J. Pekkanen, & M. S. Shugart (Eds.), The Oxford Handbook of Electoral Systems (pp. 601–626). Oxford: Oxford Univer-sity Press.
Wängnerud, L. (2009). Women in parliaments: Descriptive and substantive representation. Annual Review of Political Science, 12, 51–69.
Wilson, G. D. (1973). The psychology of conservatism. Oxford: Academic Press.Wood, W., & Eagly, A. H. (2015). Two traditions of research on gender identity. Sex Roles, 73, 461–473.Ylä-Anttila, T. (2011). Tausta: Näin konservatiivisuutta mitattiin [Background: How conservatism was
measured]. Helsinki: Helsingin Sanomat.
Publisher’s Note Springer Nature remains neutral with regard to jurisdictional claims in published maps and institutional affiliations.