using analytics to predict consumer interest in qatari
TRANSCRIPT

Using analytics to predict consumer interest in Qatari sport
events
Nicholas M. Watanabe, Ph.D. Assistant Professor of Big Data and Analytics, University of South Carolina

1
Abstract
Due to the growth and availability of data, organizations have become heavily
invested in using analytics to improve various business functions with the goal of
developing competitive advantage. Specifically, analytics can be considered the
examination of data to understand meaningful patterns within it. In the case of sport, the
focus on analytics has predominantly been fixated on improving the on-field
performance of players and teams, rather than enhancing the off-field aspects of
business operations, such as marketing, sales, and finance. As such, although sport
organizations often use advanced statistics to evaluate players in order to increase
performance on the field of play, the adoption of analytics to maximize their business
operations is still lacking. With this in mind, the current case study focuses on
introducing and teaching the use of analytics as a way to improve decision-making and
management within sport organizations.
Keywords: Analytics, Regression, Demand for Sport, Decision Making, Qatar
Stars League

2
Introduction to the case context
As part of a new initiative to improve business decision-making in Qatari sports,
Aziz has been hired to lead a new consulting team dedicated to increasing the use of
analytics in the country. Specifically, this program is part of a strategic initiative to
integrate the use of analytics by major Qatari sporting events, as has been done by
other professional sport organizations around the world. Aziz is informed that for the first
stage of this project, focus will be placed on analyzing attendance for matches played
by Qatar Stars League (QSL) teams, with the goal of enhancing consumer interest in
attending games. Furthermore, Aziz has been informed that the specific plan is to not
only increase their understanding of the factors driving attendance at QSL matches, but
also to use this information to enhance their marketing, revenue generation, staffing,
and customer service.1 Although Aziz has extensive experience working in the sport
industry, he has not previously directly dealt with analytics, and it has been many years
since he took his statistics course while in school. Considering this, Aziz’s first course of
action is to start building a team of experts to advise him in terms of the current trends
and methods being used by sport teams in regards to business analytics.
To begin with, Aziz starts to familiarize himself with the concept of analytics. In
his readings, he notes that there has been a growing trend of corporations using
1 Jeffery Borland and Robert Macdonald, “Demand for Sport,” Oxford Review of Economic Policy 19, no. 4 (2003): pp. 478-502, p.479.
3
analytics to improve their decisions and practices.2 In this, Aziz notes that many
organizations are making significant investment in collecting data in order to enhance
the speed and accuracy with which they are able to develop new insights, and thus
increase productivity and efficiency.3 Continuing his research into the use of analytics,
Aziz finds that a greater number of sport organizations have been adopting the use of
analytics from a number of perspectives.
Aziz begins by reading the book Moneyball, by Michael Lewis, which details how
the Oakland Athletics, a Major League Baseball (MLB) team in America, used analytics
to find players with hidden talents at below market value.4 From this, the Athletics were
not only able to improve their performance, but also were able to compete on the field
with other organizations that were spending many times more than they were.5 In his
further investigation into the use of analytics in sport, Aziz finds that a large number of
professional sport teams in North America and Europe spend a significant amount of
money building teams of statistical experts whose entire job is to predict which players
will be able to perform at a high level in the future. The purpose of this is to try and
create competitive advantage over other teams, thus allowing these teams to be more
successful in their organizational and financial performance.6
2 Barbara H Wixom, Bruce Yen, and Michael Relich, “Maximizing Value from Business Analytics,” MIS Quarterly Executive 12, no. 2 (2013): pp. 111-123, p.111 3 Wixom, p. 113. 4 Lewis, Michael. Moneyball. New York: W.W. Norton, 2011. 5 Hakes, Jahn K, and Raymond Sauer. “An Economic Evaluation of the Moneyball Hypothesis.” Journal of Economic Perspectives 20, no. 3 (2006): pp. 173-186, p. 174. 6 Wolfe, Richard, Patrick M. Wright, and Dennis L. Smart. “Radical HRM Innovation and Competitive Advantage: The Moneyball Story.” Human Resources Management 45, no. 1 (2006): pp. 111-145, p. 111.

4
Although all of this information is helpful to Aziz to see how analytics can be used
by sport organizations, it does not help to fulfill the purposes of the strategic mission to
use analytics to better understand match attendance. Based on this, Aziz talks with his
advisors and research team, and begins conducting more research about how sport
organizations have used analytics so that he can develop an approach to using data to
examine attendance in the QSL. In his reading, Aziz finds that a number of sport
organizations have begun to use advanced statistics to improve their marketing and
sales, but overall, there is still greater need for sport teams to use analytics to enrich
their off-field business practices.78 However, in his investigations Aziz finds that a
number of teams have begun using analytics to examine attendance, with their
approach generally informed from economics studies of the demand for sport
attendance.9 Considering this, Aziz directs his team to compile economic research
examining the demand for attendance at sporting events, and then to provide a review
of their findings to help direct the new data-driven initiative.
Analytics and the demand for sport
After giving his team a week to collect and summarize their information, Aziz
calls them back together so that they can discuss their findings and use them to try and
examine attendance data from QSL teams. To begin with, the team notes that
researchers have written a number of papers on factors that determine consumer
7 Gil Fried and Ceyda Mumcu, Sport Analytics: a Data-Driven Approach to Sport Business and Management (New York: Routledge, 2017). 8 Troilo, Michael, Adrien Bouchet, Timothy L. Urban, and William A. Sutton. "Perception, reality, and the adoption of business analytics: Evidence from North American professional sport organizations." Omega 59 (2016): pp. 72-83, p. 73. 9 Borland, p. 478.

5
interest in sport, with general agreement that there are certain categories of
determinants that have the potential to influence consumers. In a paper by Borland and
Macdonald (2003), five categories of determinants of demand are developed based on
the findings from dozens of previous studies conducted using data on attendance at
sporting events.10 Specifically, the five categories that are outlined are: consumer
preferences, economic factors, quality of viewing, quality of contest, and supply
capacity.11
First, consumer preferences are defined as qualitative factors that are
representative of consumer tastes, such as tradition, which can be measured by the age
of the club.12 Second, economic factors include different measures of market potential,
including variables like the size of the local population, income levels, and even
macroeconomic factors such as the unemployment rate.13 Third, the quality of viewing
are those factors which can impact the level of comfort or amenities that are present for
consumers; this could be measured by the age of a stadium, as newer stadiums should
be of higher quality.14 Fourth, the quality of contest measures the level of on-field play
that is expected to be exhibited by teams, which is often represented by performance
variables such as the team winning percentage.15 Finally, the fifth category of demand,
supply capacity, is simply a measure of the number of tickets or seats that are available
for purchase by consumers.
10 Borland, p. 479. 11 Borland, p. 480. 12 Borland, p. 481. 13 Borland, p. 481. 14 Borland, p. 481. 15 Borland, p. 482.

6
By combining these various factors together, researchers develop models, which
are mathematical formulas that detail the different variables that are believed to have an
effect on consumer decisions to attend games. Specifically, models can simply be
considered as a collection of factors that researchers use to build an understanding of
how a specific phenomenon works in the real world.16 In reading additional studies
examining the demand for attendance at sporting events, Aziz and his team come to the
conclusion that in order to conduct analytics to examine what factors impact attendance
at QSL matches, they will need to collect data.17 Based on this information, Aziz tasks
his team to start collecting data from matches played by QSL teams so that they can
build a model and find the factors that determine attendance at matches.
Data collection
In order to start collecting data, Aziz and his team read through a number of
research papers to figure out where they were able to get attendance data, and found
that many studies have utilized information from transfermarkt.de.18 Notably,
transfermarkt.de is a public data site that keeps match records for most matches played
by top-flight professional football clubs from around the world.19 Visiting the
16 Sam Ouliaris, “What Are Economics Models?,” Finance & Development 48, no. 2 (June 2011), https://www.imf.org/.xternal/pubs/ft/fandd/2011/06/basics.htm. 17 David Forrest and Robert Simmons, “Outcome Uncertainty and Attendance Demand in Sport: the Case of English Soccer,” Journal of the Royal Statistical Society: Series D (The Statistician) 51, no. 2 (2002): pp. 229-241, https://doi.org/10.1111/1467-9884.00314, p. 235. 18 Nicholas M. Watanabe et al., “Air Pollution and Attendance in the Chinese Super League: Environmental Economics and the Demand for Sport,” Journal of Sport Management 33, no. 4 (2019): pp. 289-302, https://doi.org/10.1123/jsm.2018-0214, p.292 19 Prockl, Franziska and Bernd Frick. “Information Precision in Online Communities: Player Valuations on www.transfermarkt.de.” International Journal of Sport Finance 13, no. 4 (2018): pp. 319-335, p. 319.

7
transfermarkt.de page for QSL teams, Aziz finds that while there is not much
information in regards to league matches played in Qatar, there is ample information for
games from other competitions, including Asian Champions League, the FIFA Club
World Cup, and so forth. From this, Aziz and his team begin to go through all of the
records for each QSL club on the website to build a full database from which they can
run their analysis.20 After collecting all of the data, the team meets their first obstacle in
terms of being able to analyze the data. That is, although there is ample information
provided, there is still need to clean the data in order to be able to analyze the patterns
of attendance.
Figure 1 – Al Saad Attendance Data from the 2019 Asian Champions League Source: Author
20 “Qatar Stars League,” transfermarkt.de, accessed May 15, 2020, https://www.transfermarkt.com/stars-league/startseite/wettbewerb/QSL

8
To begin the cleaning process, the research team first focuses on the column
labeled “Attendance”, as it is the main variable of interest for this study. Because the
researchers are focused on finding how the patterns of attendance fluctuate based on
other factors, it makes attendance the dependent variable within this study, which is
also known as the response variable.21 In considering Figure 1, it is clear that while the
attendance numbers are present, they have not been coded properly and thus the
research team begins to go through the entire dataset to clean the attendance data into
a proper numerical format. Following this, Aziz and his team turn focus to the other
variables within the dataset by specifically focusing on factors they theorize may be able
to explain attendance, also known as independent variables or explanatory variables.22
In their readings, the group has noted that the day a match is played on sometimes has
an effect on consumer demand. Based on this, the group has decided to re-code the
data for day of the week, which is currently listed as words in the Excel file. In order to
do this, the team creates what is known as a dummy variable, which is a variable that
measures 1 when something is true, and 0 when it is false.
21 John N. Matheson, “The Modern Law of Corporate Groups: An Empirical Study of Piercing the Corporate Veil in the Parent-Subsidiary Context. North Carolina Law Review 87, (2009): pp. 1091-1156, p. 1134. 22 Fisher, Franklin M, “Multiple Regression in Legal Proceedings.” Columbia Law Review 80, no. 4 (1980): pp. 702-736, p. 702.

9
Figure 2 – Al Saad Attendance Cleaned data Source - Author
For example, in considering Figure 2, which presents the cleaned data for Al
Saad, the research team has now recoded individual variables to measure each day of
the week games have been played on. Further examining the data in Figure 2, it is
evident that the team has added some additional independent variables which they
want to test in regards to whether they have a relationship with attendance. Specifically,
variables have been created to account for the various dimensions of determinants of
demand as was laid out in prior modeling of attendance in professional sport.23 With
some additional work, the team finally completes the full dataset. Overall, the final data
(which can be found in the accompanying Excel file) has measures for the year a game
was played in (Year), the day of the week games were played, whether games were
part of the Asian Champions League (ACL), Club World Cup (CWC), Qatar Stars
League (QSL), as well as whether games were in the group stage, knockout round, or
semifinals of a tournament. Additionally, variables were included to account for the
temperature at game time (Temperature), whether there were multiple games played on
23 Borland, p. 479.

10
the same day in Qatar (MultipleGames), and the time at which a match kicked off
(Hours). Finally, the win percentage of the home team was included in the dataset
(WinPct) to account for team performance, and stadium capacity (Capacity) was
developed to account for the supply capacity.24
Conducting analytics
With all of the data finally collected and cleaned, Aziz and his team are now
ready to start conducting their analysis. After some discussion, the first question that the
team wants to consider is whether there is a time-trend for attendance for QSL teams.
That is, Aziz is curious as to whether there is a change in attendance with the passage
of time. In order to conduct an initial level of analysis, Aziz follows what previous
research studies have done and decides to develop a scatterplot to graph his data over
time. In order to do this in Excel, Aziz opens the data file and selects the “Year” and
“Attendance” columns, then clicks on the “Insert” tab at the top of the screen. After this,
Aziz goes to “Charts” and selects the “Scatter” option, which then creates a scatterplot
of attendance over time.
24 Borland, p. 480.
11
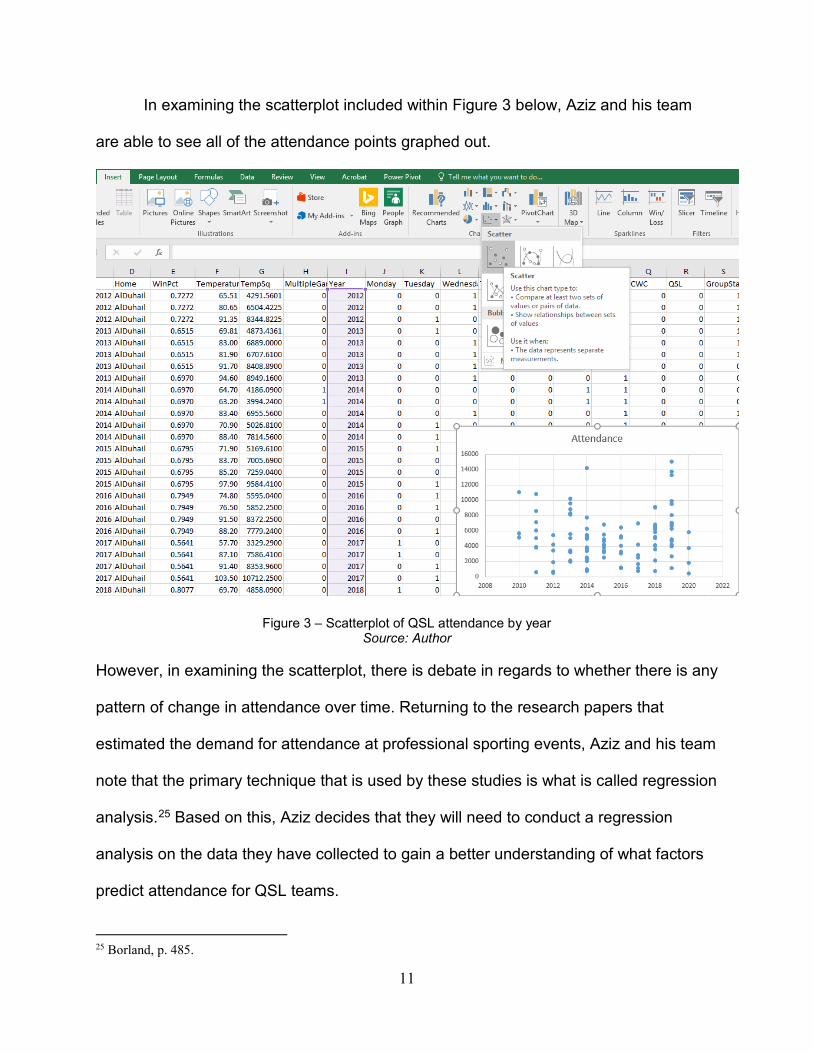
In examining the scatterplot included within Figure 3 below, Aziz and his team
are able to see all of the attendance points graphed out.
Figure 3 – Scatterplot of QSL attendance by year Source: Author
However, in examining the scatterplot, there is debate in regards to whether there is any
pattern of change in attendance over time. Returning to the research papers that
estimated the demand for attendance at professional sporting events, Aziz and his team
note that the primary technique that is used by these studies is what is called regression
analysis.25 Based on this, Aziz decides that they will need to conduct a regression
analysis on the data they have collected to gain a better understanding of what factors
predict attendance for QSL teams.
25 Borland, p. 485.

12
Regression analysis
Reading up on regression analysis, Aziz learns that it is a statistical method that
dates back approximately 200 years to the work of Carl Gauss, who noted the ability to
estimate linear relationships between variables.26 From this, the concept of regression
analysis was developed, which examines how fluctuations in the dependent variable are
related to changes in one or more independent variables, and is a common method
used in examining what factors impact attendance in sport.27 As the research team
investigates the use of regression analysis further, they come to understand that
although the basic methodology is relatively simple, it can grow more complex as one
learns more of the economic math, or econometrics, and provide researchers with a
powerful analytical tool.28 Furthermore, in reviewing more advanced analytical
approaches, Aziz and his team find that regressions often forms the core basis of these
methodologies, including machine learning, which uses regressions to automate the
process of predicting behaviors based on data.29
In his further reading, Aziz notes that there are many ways in which multiple
regression analysis can be conducted, including a variety of statistical packages such
26 Fisher, p. 702. 27 Baker, Thomas A, Marc Edelman, and Nicholas M Watanabe. “Debunking the NCAA’s Myth that Amateurism Conforms with Antitrust Law: A Legal and Statistical Analysis.” Tennessee Law Review 85, (2017): pp. 662-705, p. 686. 28 Gujarati, Damodar N., and Dawn C. Porter. Essentials of econometrics. Vol. 2. Singapore: Irwin/McGraw-Hill, 1999. 29 Sendhil Mullainathan and Jann Spiess, “Machine Learning: An Applied Econometric Approach,” Journal of Economic Perspectives 31, no. 2 (2017): pp. 87-106, https://doi.org/10.1257/jep.31.2.87, p.88

13
as STATA, R Studio, SPSS, and so forth.30 Although Aziz is curious about using these
other programs, he wants to use one that he and his research team are comfortable
with, so they decide to conduct the regression analysis in Excel. Visiting the support
webpage for Microsoft Excel, Aziz’s research team finds that they are able to run a
regression analysis in Excel, but that they will first need to load a special add-on to the
program called the “Analysis TookPak.”31 Following the directions provided on the
webpage, Aziz is able to install the Analysis ToolPak onto his computer, and thus with
the add-on and his dataset loaded, he is ready to begin estimating regressions.
As Aziz and his research team have been trying to understand the importance
that time plays in impacting attendance for QSL teams, they first decide to run a
regression with attendance as the dependent variable, and the column “Year” as the
independent variable.
30 “List of Statistical Software,” Wikipedia, accessed May 17, 2020, https://en.wikipedia.org/wiki/List_of_statistical_software 31 “Load the Analysis ToolPak in Excel,” Office Support (Microsoft), accessed May 17, 2020, https://support.office.com/en-us/article/load-the-analysis-toolpak-in-excel-6a63e598-cd6d-42e3-9317-6b40ba1a66b4

14
Figure 4 – First Step of Estimating a Regression in Excel Source: Author
To start this process, Aziz opens his data set in Excel, and then clicks on the
“Data” tab and selects “Data Analysis” as shown in Figure 3. After clicking Data
Analysis, Aziz then selects “Regression” and clicks on the OK box, as show in Figure 3.
After making this selection another dialogue box will open, which is shown below in
Figure 4. Notably, in the regression dialogue box, users are provided with a number of
options. To begin with, the “Y Range” is where the values for the dependent variable are
included, while the “X Range” is where values for the independent variable(s) are input.
After this, the user can then hit OK, and the regression results will be estimated.

15
Figure 5 – Regression Dialogue Box Source: Author
Following these steps, Aziz estimates a regression examining the relationship
between attendance and time, as measured by the number of years. In analyzing the
regression output, a large amount of statistical information is presented. From Aziz’s
reading, he realizes that he should pay attention to certain specific details. Turning
focus to the results from the initial regression as displayed in Figure 5, Aziz first
examines the R-Squared value, as it represents how well the model is explained by the
data.32
32 Gujarati, Damodar N., and Dawn C. Porter.

16
Figure 6 – Regression results Source: Author
In looking at the R-Square value, Aziz sees that it is 0.004, which means that the
independent variable “Year” only explains about 0.4% of the variation in the dependent
variable of attendance. In further considering the results, Aziz also looks at the
Coefficients and the P-value. The coefficient explains the size of the impact a variable
has on attendance, with the result for Year being only 72, which means that each
additional year would increase attendance by 72 people per game.33 Finally, Aziz notes
the P-value, which explains whether an independent variable has a significant
relationship with the dependent variable. As the standard is to note significance when
the P-value is below 0.05, the results from this regression with a P-value equal to 0.499
indicates that there is no relationship between Years and attendance. Based on these
results, Aziz and his team come to the conclusion that the passage of years is not
important in determining attendance.
33 Gujarati, Damodar N., and Dawn C. Porter.
17
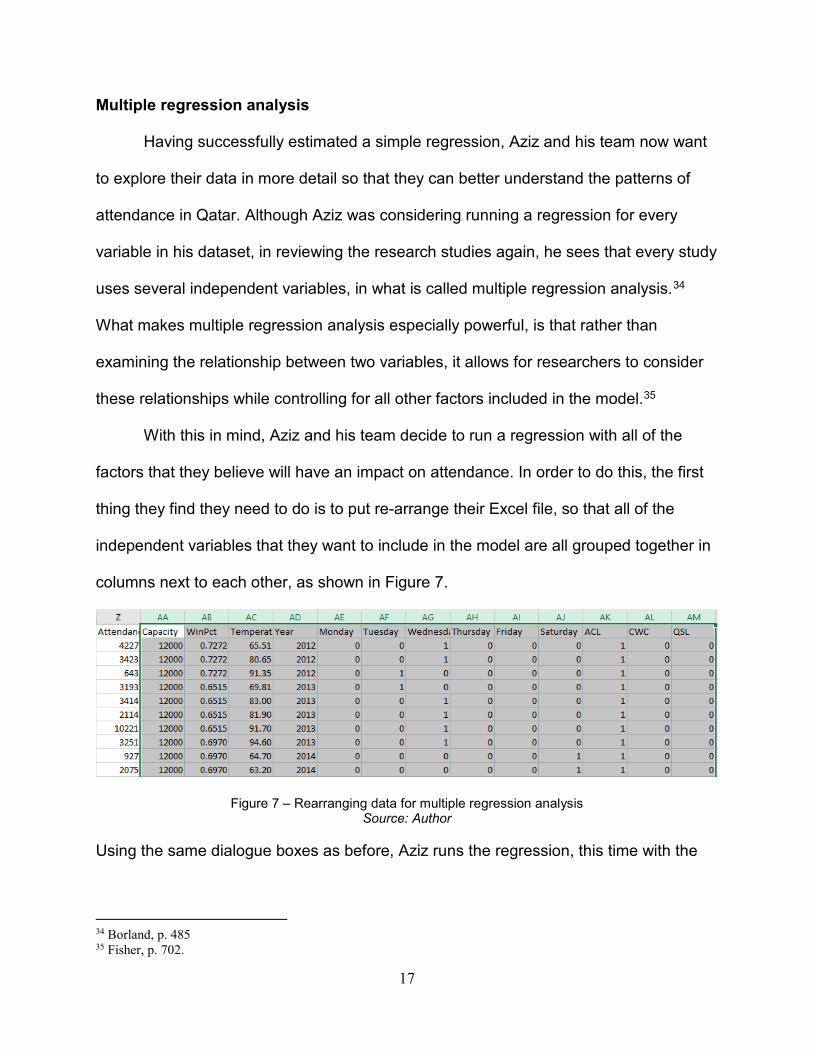
Multiple regression analysis
Having successfully estimated a simple regression, Aziz and his team now want
to explore their data in more detail so that they can better understand the patterns of
attendance in Qatar. Although Aziz was considering running a regression for every
variable in his dataset, in reviewing the research studies again, he sees that every study
uses several independent variables, in what is called multiple regression analysis.34
What makes multiple regression analysis especially powerful, is that rather than
examining the relationship between two variables, it allows for researchers to consider
these relationships while controlling for all other factors included in the model.35
With this in mind, Aziz and his team decide to run a regression with all of the
factors that they believe will have an impact on attendance. In order to do this, the first
thing they find they need to do is to put re-arrange their Excel file, so that all of the
independent variables that they want to include in the model are all grouped together in
columns next to each other, as shown in Figure 7.
Figure 7 – Rearranging data for multiple regression analysis Source: Author
Using the same dialogue boxes as before, Aziz runs the regression, this time with the
34 Borland, p. 485 35 Fisher, p. 702.

18
dependent variable of attendance, and the above variables as the independent
variables. After clicking okay, the results for the multiple regression analysis are then
provided to Aziz, which can be seen in Figure 8.
Figure 8 – Multiple regression analysis results Source: Author
In considering the statistical results in Figure 8, Aziz and his team first note that
the R-Square value is now 0.16, which means that the collection of independent
variables used in this current model explain about 16 percent of the variation in
attendance. Although the figure seems low, in comparison to the previous model that
had an R-Square of 0.004, the number is now much greater, suggesting a model that

19
better explains attendance for QSL teams. In further examining the results, Aziz now
finds that only one variable is significant, which is the variable WinPct, which measures
the Win Percentages of teams. Because the coefficient is positive, it indicates teams
that win more games in the QSL tend to have higher attendance at their matches, a
finding which matches the results from research in other professional sport leagues.36
In further considering the results, it is evident that the model was not able to
estimate results from Thursdays or Fridays, likely because there were too few
observations for those dates. In this case, it may have been smart for Aziz to remove
Thursdays from his model and to re-estimate the results to see if they still have similar
issues. Curiously, the results find that temperature, day of the week, or even the type of
competition (Asian Champions Leagues vs Qatar Stars League vs Club World Cup)
were all insignificant. This would indicate that these factors were not important
determinants for consumers deciding to attend matches. At the same time, when
considering the positive effect of win percentage on attendance, because Aziz used
multiple regression analysis, he is able to note that win percentage has an effect, even
when controlling for temperature, the passage of time, day of the week, and type of
competition that clubs were playing in.
Conclusion
Using the results from his multiple regression analysis, Aziz and his team begin
to write up the report detailing factors that impact attendance at games for QSL teams.
36 Borland, p. 485.

20
Because of the specific findings in relation to win percent, Aziz decides to try and
explore the coefficient for WinPct from his model in further detail. In his readings, Aziz
learns that the coefficient of 6,493 is indicative that a change of 1 unit in WinPct will
increase attendance for a QSL club by 6,493 attendees. However, in discussions with
his team, it is pointed out that the maximum win percentage a team could have is 1, and
thus to explain the results in better detail they will need to scale the coefficients.37
Based on this, Aziz’s draft of the report highlights the finding that if a team were to
increase their win percentage by 10 percent, the expected effect would be an increase
in attendance of about 649 people. Conversely, Aziz also discusses that a decline in
performance for a QSL team would thus likely lead to lower attendance numbers in their
future.
In discussing what else should be included in the report, Aziz and his team
consider the strategic importance of a number of the findings. To begin with, emphasis
is naturally placed on team performance, not only as a way to draw fans to matches, but
also in being an important tool for marketing the league in Qatar. As fans seem to be
drawn to teams who are performing well, it provides QSL clubs with the ability to create
both short-term and long-term marketing strategies to increase consumer interest in the
league, as well as to capitalize on this interest to maximize revenues. At the same time,
there is also strategic importance in understanding the variables that did not have a
significant impact on attendance. For example, the finding that temperature and day of
the week did not impact attendance can provide QSL teams with the knowledge that
37 Gujarati, Damodar N., and Dawn C. Porter.

21
fans seem to come to games regardless of how hot or cold it is, or even what day a
match is held on. Such results have important managerial implications for QSL teams,
as rather than guessing whether there is need for more or less staffing based on the
timing of a match, they now know that they should be providing consistent levels of
staffing and customer service based on the fact that weather and days of the week do
not cause fluctuations in attendance.
As the team comes close to the completion of the report, Aziz is happy with the
accomplishment of using analytics to examine attendance for matches played by QSL
teams. However, before he sends it off to the league, he would like to hear from his
research team in regards to their ideas about how to model attendance for QSL teams.

22
Bibliography Baker, Thomas A, Marc Edelman, and Nicholas M Watanabe. “Debunking the NCAA’s
Myth that Amateurism Conforms with Antitrust Law: A Legal and Statistical Analysis.” Tennessee Law Review 85, (2017): 662-705.
Borland, Jeffery, and Robert Macdonald. “Demand for Sport.” Oxford Review of Economic Policy 19, no. 4 (2003): 478–502.
Fisher, Franklin M, “Multiple Regression in Legal Proceedings.” Columbia Law Review 80, no. 4 (1980): 702-36.
Forrest, David, and Robert Simmons. “Outcome Uncertainty and Attendance Demand in Sport: the Case of English Soccer.” Journal of the Royal Statistical Society: Series D (The Statistician) 51, no. 2 (2002): 229–41. https://doi.org/10.1111/1467-9884.00314.
Fried, Gil, and Ceyda Mumcu. Sport Analytics: a Data-Driven Approach to Sport Business and Management. New York: Routledge, 2017.
Gujarati, Damodar N., and Dawn C. Porter. Essentials of econometrics. Vol. 2. Singapore: Irwin/McGraw-Hill, 1999.
Hakes, Jahn K, and Raymond Sauer. “An Economic Evaluation of the Moneyball Hypothesis.” Journal of Economic Perspectives 20, no. 3 (2006): 173-86.
Lewis, Michael. Moneyball. New York: W.W. Norton, 2011. “List of Statistical Software.” Wikipedia. Accessed May 17, 2020.
https://en.wikipedia.org/wiki/List_of_statistical_software. “Load the Analysis ToolPak in Excel.” Office Support. Microsoft. Accessed May 17,
2020. https://support.office.com/en-us/article/load-the-analysis-toolpak-in-excel-6a63e598-cd6d-42e3-9317-6b40ba1a66b4.
Matheson, John N. “The Modern Law of Corporate Groups: An Empirical Study of Piercing the Corporate Veil in the Parent-Subsidiary Context. North Carolina Law Review 87, (2009): 1091-1156.
Mullainathan, Sendhil, and Jann Spiess. “Machine Learning: An Applied Econometric Approach.” Journal of Economic Perspectives 31, no. 2 (2017): 87–106. https://doi.org/10.1257/jep.31.2.87.
Ouliaris, Sam. “What Are Economics Models?” Finance & Development 48, no. 2 (June 2011). https://www.imf.org/external/pubs/ft/fandd/2011/06/basics.htm.
Prockl, Franziska and Bernd Frick. “Information Precision in Online Communities: Player Valuations on www.transfermarkt.de.” International Journal of Sport Finance 13, no. 4 (2018): 319-35.
“Qatar Stars League.” transfermarkt.de. Accessed May 15, 2020. https://www.transfermarkt.com/stars-league/startseite/wettbewerb/QSL.
Troilo, Michael, Adrien Bouchet, Timothy L. Urban, and William A. Sutton. "Perception, reality, and the adoption of business analytics: Evidence from North American professional sport organizations." Omega 59 (2016): 72-83.
Watanabe, Nicholas M., Grace Yan, Brian P. Soebbing, and Wantong Fu. “Air Pollution and Attendance in the Chinese Super League: Environmental Economics and the Demand for Sport.” Journal of Sport Management 33, no. 4 (2019): 289–302. https://doi.org/10.1123/jsm.2018-0214.

23
Wixom, Barbara H, Bruce Yen, and Michael Relich. “Maximizing Value from Business Analytics.” MIS Quarterly Executive 12, no. 2 (2013): 111–23.
Wolfe, Richard, Patrick M. Wright, and Dennis L. Smart. “Radical HRM Innovation and Competitive Advantage: The Moneyball Story.” Human Resources Management 45, no. 1 (2006): 111-145.

24
Teaching notes
1. Examining the variables that are included in the dataset provided with this case,
develop a list of the factors that you believe may have an impact on attendance
at games. Provide a logical rationale explaining why each of the variables that
you have chosen should have an effect on attendance at matches.
2. Following this, estimate a series of regression models using attendance as the
dependent variable, and only one independent variable. For example, your first
regression may use Capacity as the independent variable, the second regression
could use win percent, and so forth. From this series of regressions, which
variables that you chose had a significant relationship with attendance? Which
did not?
3. Next, utilizing all of the variables that you hypothesized may have an impact on
attendance, estimate a regression model using attendance as the dependent
variable, and all of the other factors as independent variables. From this multiple
regression analysis, what variables had a significant relationship with
attendance? Did the findings from the multiple regression analysis differ from
those models only using one independent variable? Why do you think certain
variables were (or were not) significant?
4. Thinking about different factors that may impact attendance, create several
models that you think could explain why individuals decide to attend Qatar Stars
League matches. After completing the estimation of these models, write out a full
report using all of the models you estimated above, as well as predictions based
on these results as to what factors the Qatar Stars League should pay attention

25
to in order to enhance attendance at games. Using these predictions, discuss
what you believe can be done to improve the marketing and management of
Qatar Stars League matches to increase attendance and revenue, as well as to
improve the customer service.
This case is designed to introduce sport managers and students to the use of
regression analysis, one of the primary analytical tools used in decision-making by sport
organizations. Notably, because the material in this case is able to connect to a variety
of topics, this case can be used as part of the in-class or supplemental materials for
sport courses focused on finance, economics, research methods, statistics, and even
marketing or management. Although individuals working on this case should have some
familiarity with Excel, there may be some need for additional assistance in installing the
Analysis TookPak. Instructions on how to install them are included and linked within the
case. For further information on the ToolPak, as well as notes for how to install in
various versions of Excel, please visit: https://support.office.com/en-us/article/load-the-
analysis-toolpak-in-excel-6a63e598-cd6d-42e3-9317-6b40ba1a66b4.
Even though this case provides a simple explanation of all the statistical
information that is needed to be able to work with the data and understand the results, it
is helpful to cover some of the statistical concepts beforehand. For example, those
working through the case may want to read over the lecture slides that are included with
this case, as well as other additional materials discussing regression analysis, as well
as the concept of statistical significance. In this manner, such additional information will

26
help to provide additional background knowledge about statistics that will be helpful in
completing the case in a proper fashion.
Overall, this case study is designed to be flexible in terms of how it is used by
both instructors and students. Although there are set questions at the end of the case to
help guide towards working with the data and writing a specific report, these questions
could be altered or added on to in order to fit different needs and levels of expertise.
Additionally, it should be noted that because the case provides individuals with the
freedom to build their own regression models and estimate the results for these models
on their own, there is no specific correct answer for this case study. Rather, in
assessing the work completed in relation to this case, focus should be placed on the
logic and thought-process in deciding how the statistical models were built (e.g. what
variables were chosen to be included), and the comparison of this model to the example
provided in the case.
Furthermore, through working on this case, it should help to foster the ability to
discuss the results from a statistical standpoint, as well as how the findings can be used
to enhance discussions of strategic decision-making for sport organizations (in this
case, the QSL). For those who are not familiar with regression analysis, it is suggested
that they read up on the concept before teaching and assigning this case. A good
starting point and reference is provided by the University of California at Los Angeles
(UCLA) Institute for Digital Research & Education, who have an extensive list of
weblinks and resources devoted to regression analysis. Two good starting references

27
are the Introduction to Regression in R (a free to use program):
https://stats.idre.ucla.edu/r/seminars/introduction-to-regression-in-r/, and Regression
with STATA Chapter 1:
https://stats.idre.ucla.edu/stata/webbooks/reg/chapter1/regressionwith-statachapter-1-
simple-and-multiple-regression/#.
For courses focused on finance or economics, this case can provide a hands-on
example of how analytical research is conducted by sport teams in order to predict what
factors will likely impact attendance. In this fashion, the case study can help individuals
to become more familiar with the methods used by researchers and practitioners, and
thus consider how the results are related to the economics and finance of professional
sport. Additionally, for economics or finance courses, the case can be further
supplemented and tied together with readings for the course. One highly recommended
reading to accompany this case is Borland and Macdonald’s (2003) article entitled
“Demand for Sport,” which, as noted in the case, lays out the various categories of
factors which are theorized to determine consumer demand for sport products.
Next, for courses on research methods or statistics, the current case provides the
ability to actually work with data in-class to consider how statistical methods and
research can be applied to real world decision making. The assignment questions
provided at the end of the case can be further modified in statistics or research methods
courses to include additional analyses beyond the ones that are included within this
case. For example, in addition to estimating regressions, students in a statistics course

28
could also be providing tables of summary statistics for all variables, as well as
correlations to provide additional information to the report. Furthermore, the data that is
included with this case can be a starting point to develop additional sport-based
research projects, such as through collecting additional data to add variables to the
dataset from this case. One example of how this could be accomplished is through
coding variables for where the opposing team for each match is from, and then to add
these factors to a regression to determine if opponent location is related to QSL team
attendance.
As an additional note to this case to for those in statistics and research methods
courses, while this case uses Excel to conduct the multiple regression analysis,
instructors and students should feel free to use any other statistical software that they
are comfortable with. This case can also serve as the springboard to dive further into
the use of regression analysis using other types of software. An easy way to accomplish
this would be to use the dataset provided with this case study in conjunction with other
resources, such as the aforementioned guides to regression analysis that have been
posted by UCLA for public use.
Finally, there are a number of additional ways in which this case study can be
used by in the classroom, or tied together with other components of a sport
management course. For those who wish to become more familiar with concepts like
analytics and big data in sport, this case can be developed alongside other
assignments. For example, after completing this assignment, research could be

29
conducted to develop another report about how other analytical methods or approaches
could be used to try and examine patterns of attendance. In this manner, it would further
the understanding of the methods used within the case, as well as help to gain further
insight into the use of analytics and critical decision making in sport. Additionally, there
are readings such as the book Moneyball, which is mentioned in the case that can be
used to further understand and contextualize the use of analytics in sport, especially in
how teams have used these methods to improve their overall organizational
performance. Overall, these assignments could be used together to help further develop
awareness and competency in regards to the use of analytics by sport organizations.
Optional questions for learners:
1. Using the data from the project, create a summary statistics table that includes the
mean (average) value, standard deviation, minimum, and maximum value for each
variable. What interesting patterns do you observe in the data from this table?
2. Taking the data from the case study, find an additional variable that you would like to
add to the model, and collect the data for this variable and add it to the dataset. After
you have collected the data, run a regression with this variable. Was the new variable a
significant predictor of attendance, and how did it change the overall results from the
previous model you estimated?
3. After reading (or watching) Moneyball, how did the Oakland Athletics use analytics to
change the way their organization made decisions? Was the application of analytics

30
useful for the organization? Additionally, did the change within the organization to focus
on analytics cause any tensions between employees about how decisions were made?