using learning analytics to predict academic …
TRANSCRIPT

USING LEARNING ANALYTICS TO PREDICT ACADEMIC SUCCESS
IN ONLINE AND FACE-TO-FACE LEARNING ENVIRONMENTS
by
Lisa Janine Berry
A dissertation
submitted in partial fulfillment
of the requirements for the degree of
Doctor of Education in Educational Technology
Boise State University
May 2017

© 2017
Lisa Janine Berry
ALL RIGHTS RESERVED

DEFENSE COMMITTEE AND FINAL READING
APPROVALS
of the dissertation submitted by
Lisa Janine Berry
Dissertation Title: Using Learning Analytics to Predict Academic Success in Online
and Face-To-Face Learning Environments
Date of Final Oral Examination: 06 March 2017
The following individuals read and discussed the dissertation submitted by student
Lisa Janine Berry, and they evaluated the student’s presentation and response to questions
during the final oral examination. They found that the student passed the final oral
examination.
Jui-long Hung (Andy), Ed.D. Chair, Supervisory Committee
Kerry Lynn Rice, Ed.D. Member, Supervisory Committee
Jesủs Trespalacios, Ph.D. Member, Supervisory Committee
The final reading approval of the dissertation was granted by Jui-long Hung (Andy),
Ed.D., Chair of the Supervisory Committee. The dissertation was approved by the Graduate
College.

iv
ABSTRACT
This learning analytics study looked at the various student characteristics of all
on-campus students who were enrolled in 100 and 200 level courses that were offered in
both online and face-to-face formats during a two-year period. There is a perception that
online education is either not as successful as face-to-face instruction, or it is more
difficult for students. The results of this study show this is not the case.
The goal of this study was to complete an in-depth analysis of student profiles
addressing a variety of demographic categories as well as several academic and course
related variables to reveal any patterns for student success in either online or face-to-face
courses as measured by final grade. There were large enough differences within different
demographic and academic categories to be considered significant for the study
population, but overwhelmingly, the most significant predictor of success was found to
be past educational success, as reflected in a student’s cumulative grade point average.
Further analysis was completed on students who declared high school credit as
their primary major based on significantly different levels of success. These students
were concurrent enrollment students or those who completed college courses for both
high school and university credit. Since most of these students were new to the
university, they did not have a cumulative GPA, so other predictive factors were
explored. The study concludes with recommendations for action based on the logistic
regression prediction tool that resulted from the data analysis.

v
TABLE OF CONTENTS
ABSTRACT ....................................................................................................................... iv
LIST OF TABLES ............................................................................................................. ix
LIST OF FIGURES .............................................................................................................x
CHAPTER ONE: INTRODUCTION ..................................................................................1
Background ..........................................................................................................................1
Problem Statement ...............................................................................................................1
Purpose of Study ..................................................................................................................6
Research Questions ..............................................................................................................8
CHAPTER 2: LITERATURE REVIEW ...........................................................................10
Introduction ........................................................................................................................10
Evolution of Retention Tracking in Higher Education ......................................................10
Origins of Higher Education and Distance Learning .............................................10
The 1930s – 1960s .................................................................................................11
The 1970s – 1980s .................................................................................................13
The 1990s – Today.................................................................................................14
Factors Impacting Persistence............................................................................................16
Sociological Factors ...............................................................................................17
Psychological Factors ............................................................................................18
Organizational Factors ...........................................................................................19

vi
Economic Factors...................................................................................................20
Factors Impacting Student Achievement ...........................................................................21
Academic Factors...................................................................................................21
Demographic Factors .............................................................................................26
Cultural and Societal Factors .................................................................................28
Course Delivery Models ....................................................................................................30
Learning Analytics .............................................................................................................33
History of Learning Analytics ...............................................................................35
Learning Analytics Frameworks ............................................................................36
Privacy and Ethics..................................................................................................39
Uses of Data ...........................................................................................................40
Summary of the Literature .................................................................................................43
CHAPTER 3: METHODOLOGY .....................................................................................45
Overview ............................................................................................................................45
Method ...............................................................................................................................45
Participants .............................................................................................................46
Capture ...............................................................................................................................47
Data Collection ......................................................................................................47
Data Organization ..................................................................................................50
Data Cleaning and Validity ....................................................................................50
Report .................................................................................................................................52
Predict ................................................................................................................................53
Act ......................................................................................................................................54

vii
Refine .................................................................................................................................54
CHAPTER 4: DATA ANALYSIS AND RESULTS ........................................................55
Introduction ........................................................................................................................55
Demographics ....................................................................................................................55
Overall....................................................................................................................55
Gender ....................................................................................................................56
Age .........................................................................................................................57
Ethnicity .................................................................................................................57
First Generation Students .......................................................................................58
Residency ...............................................................................................................60
Majors/Minors/Certificates ....................................................................................60
Courses ...............................................................................................................................63
Enrollments ........................................................................................................................65
Grades Earned ........................................................................................................66
Course Subjects ......................................................................................................67
Correlation Comparisons ...................................................................................................73
Logistic Regression Results ...............................................................................................74
Demographic Variables .........................................................................................75
Academic Variables ...............................................................................................76
Course Variables ....................................................................................................77
Full Prediction Model ............................................................................................78
Research Question 4 – Further Analysis ............................................................................87
Summary of Analysis .........................................................................................................89

viii
CHAPTER 5: DISCUSSION AND CONCLUSIONS ......................................................90
Introduction ........................................................................................................................90
Demographics and Courses................................................................................................91
Predictors of Academic Success ........................................................................................92
Research Question 1: Which are important predictors from student characteristics
that lead to successful completion of 100 and 200 level classes taken online, as
measured by final grade? .......................................................................................95
Research Question 2: Which are important predictors from student characteristics
that lead to successful completion of 100 and 200 level classes taken face-to-face,
as measured by final grade? ...................................................................................96
Research Question 3: What predictors are common or differ between online and
face-to-face settings? .............................................................................................98
Research Question 4: Which academic departments or individual courses can be
identified as significant and in need of further analysis? .....................................101
Limitations .......................................................................................................................102
Recommendations for Future Research ...........................................................................104
Implications of the Results...............................................................................................105
REFERENCES ................................................................................................................108

ix
LIST OF TABLES
Table 1 Predictors of Retention for Various Student Characteristics ........................... 22
Table 2 Data Variables ................................................................................................. 49
Table 3 Gender of Students by Course Modality ......................................................... 56
Table 4 Ethnicity of Students by Course Modality ....................................................... 58
Table 5 First Generation Student Demographics .......................................................... 59
Table 6 Residency Status of Students by Course Modality .......................................... 60
Table 7 Distribution of Degree Types Declared by Students in Study Population ...... 61
Table 8 Number of Degrees Declared by Student in Study Population ....................... 61
Table 9 College or School of Primary Major Declared by Students ............................ 62
Table 10 Course Sections by Modality and Term ......................................................... 63
Table 11 Courses Offered by Academic Department .................................................... 64
Table 12 Descriptive Statistics for Grade Value of Enrollments ................................... 68
Table 13 Descriptive Statistics for Grade Value by Course Subject ............................. 71
Table 14 Logistic Regression Summary for Subset Models .......................................... 76
Table 15 Full Logistic Regression Models for Success ................................................. 82
Table 16 Distribution Statistics for Concurrent Enrollments Students .......................... 88

x
LIST OF FIGURES
Figure 1 Visualization of Learning Analytics Process ................................................. 48
Figure 2 Distribution of Students by Age ....................................................................... 57
Figure 3 Academic Level of Students at Time of Enrollment ........................................ 65
Figure 4 Final Grades Earned in Courses Included in Study Population ....................... 66
1
CHAPTER ONE: INTRODUCTION
Background
Students across the United States are choosing to continue their education beyond
high school at an increasing rate. In 2012, approximately 41% of the population of 18-24-
year-olds were enrolled in an institution of higher education (National Center for
Education Statistics, 2014b). Ten years earlier only 36% of 18-24-year-olds opted to
enroll in college. Online learning is growing at an even faster rate than overall
enrollments. In 2014, about 28% of post-secondary students were enrolled in at least one
distance learning course (Allen & Seaman, 2016; Hart, 2012). In contrast, in 2002, less
than 10% of students opted for distance learning.
The university that was the basis of this study experienced growth in the overall
student population as well as online course enrollments. The fall 2014 enrollment was
approximately 29,100 students, nearly a 20% increase from just ten years earlier. Of these
students, about 11,400, or 39%, were enrolled in at least one online course. Following the
national trend, the university saw a 13% decrease in the number of students enrolled in
exclusively face-to-face courses over the past two years (eCampus Center, 2015).
Problem Statement
Despite the growth in higher education enrollments, both online and face-to-face,
retention of students until a degree is earned is a concern. Retention is defined as an
institution’s ability to retain a student from either admission to graduation, or from one
term to the next (Berger & Lyon, 2005). Retention rates are calculated by determining the

2
percentage of students who reenroll in the university for the next term. Nationally, the
retention rate of full-time students from year to year is 71.8%, but when students are
enrolled only part-time, the retention rate drops to 42.2% (National Center for
Educational Statistics, 2014a). The university that was the focus of this study saw
significant growth in year-to-year retention of full-time students, both face-to-face and
online, over the past ten years. This number grew from 58.6% in 2002 to 71.7% in 2012,
which is very close to the national average (Office of Institutional Research, 2013).
Persistence is a term that is often used in relation to retention. Retention is
measured from the perspective of the university, while persistence is reenrollment or the
desire to reenroll from the student’s point of view. Students make decisions about
whether to persist in their education based on a number of factors. Researchers
established a number of theories on why students persist in their education starting in the
1970s (Astin, 1975; Bean & Metnzer, 1985; Spady, 1970; Tinto, 1975). These theoretical
frameworks consider how the needs of the individual student align with what the
institution offers to students. Astin (1975) proposed that students enter the university
system with their unique set of inputs, including demographics, high school grades, and
reasons for wanting to attend college, among many others. It is the interaction between
the inputs and the higher education environment that determine the educational outcome.
Additionally, Tinto (1975) proposed an interactional theory of retention. His theory
suggested that there are multiple interrelated reasons as to why a student might not persist
in their education. The studies completed by Astin and Tinto both address the person who
enters the university system and how their personal characteristics and past experiences
can impact their education success. This framework served as the foundation for this

3
study. In addition to the factors described in the persistence theories, academic factors
can influence a student’s decision as to whether to persist in their education.
One of the key organizational factors is convenience. If educational options are
convenient for students, they are more likely to persist throughout the term and enroll in
coursework during the next term. Most university level students complete their post-
secondary education in a traditional manner, on a college campus in a classroom. This
model works well for most traditional students, who choose to live on campus or are local
commuter students. However, the option to enroll in courses at a distance has expanded
opportunities for many students, especially those defined as nontraditional.
Nontraditional students are those that meet one or more of these categories: students that
are enrolled on a part-time basis, work more than 35 hours per week while enrolled in
coursework, are financially independent, have dependents or are a single parent, do not
have a high school diploma, or delayed beginning their higher education for a period of
time after high school (Watt & Wagner, 2016).
With the convenience of online course offerings, students can be located
anywhere in the world and successfully complete their school work. Courses offered
online are taken by students in remote locations as well as by students who reside on
campus. This option provides flexibility for even local students, giving them the option to
work on coursework as their schedule allows as opposed to one determined by the
university. Nationally, 14% of higher education students were enrolled in some, but not
all, distance education classes (Allen & Seaman, 2016). This same statistic is much
higher in the state that is the location of this study, with 24.6% of students enrolled in at
least some distance education classes (National Center for Educational Statistics, 2014b).

4
If students report taking only some of their higher education courses online, then the
remainder of their classes must be completed on campus.
While the online delivery model provides convenience for both time and location,
it has caused concern about the quality of the courses as compared to the more traditional,
face-to-face, delivery model (Patterson & McFadden, 2009). These concerns are based on
a review of pass rates that compare face-to-face and online learning. Ideally, the two
delivery models, face-to-face and online, provide equal opportunities for students, and in
turn, have a consistent rate of reenrollment the next term. Clark (1983) reviewed
literature addressing media comparison studies from as early as the 1960s. He concluded
that, when considering learning outcomes as the sole measure of comparison, well-
designed studies show no significant difference in knowledge gained from one medium to
another. Thus, when comparing face-to-face and online versions of the same course,
learning outcomes should be the same (Lockee, Burton, & Cross, 1999). Clark argued
that differences in achievement, or persistence during a course, are due to some other
influence. These influences may include the instructional methods (Clark, 1983), student
motivation, self-discipline (Colorado & Eberle, 2010), student post-secondary readiness,
or cultural factors (Braxton & Hirschy, 2005).
Whatever the reason, if a student does not progress in their education, meaning
they do not receive a grade that allows them to continue in their course work, they are
much more likely to dropout or stopout of their education (Habley, Bloom, Robbins, &
Gore, 2012; Ishler & Upcraft, 2004). A dropout is when a student ceases their enrollment
in the university, and a stopout is when a student stops their enrollment in the university
for a period of a semester or more, but then returns to continue their education. Both

5
dropouts and stopouts can be initiated by the student, or by the institution. If the
institution does not allow reenrollment, it is typically due to lack of an acceptable
academic progress or a violation of school code of conduct.
Patterson and McFadden (2009) completed a study analyzing demographic data of
students doing poorly in both face-to-face and online delivery models and found a higher
dropout rate in the online environment. Age was a factor in persistence, with older
students being more likely to dropout. Another study found that females are more
successful than males in completing courses in the online environment (Aragon &
Johnson, 2008). Considering these findings, this study aimed to identify these and other
student characteristics that lead to more successful outcomes in one delivery model over
another. The range of student characteristics included demographic as well as academic
and course specific data that was both static and dynamic.
Despite the perception that students do worse in online courses as compared to
face-to-face, leadership at the university has invested significant funds and resources to
encourage the growth of online learning for both on-campus and remote students.
Continued growth of online learning is an essential component of the university’s
strategic plan. One of the goals of the strategic plan is to “facilitate the timely attainment
of educational goals for our diverse student population” (Office of the Provost, 2012).
This goal pushes all students to continuously attend the university until they earn the
desired degree or certificate. One strategy included in the plan to help attain this goal is to
use technology and multiple delivery formats to provide options for students. To help
meet the goals outlined in the strategic plan, it is important to predict if students with a
specific set of characteristics are more likely to be successful in either an online delivery

6
model or a face-to-face format. It will be beneficial to have knowledge about success in
specific courses as well as courses offered by specific departments. This knowledge can
be used to inform student advising sessions, or to guide recommendations for course
registration. The information can also help university leadership make decisions about
which departments or courses may be due for a curriculum evaluation. In addition,
individual courses, either online or face-to-face, may be identified for a redesign, or the
information can be used to guide decisions for expansion of programs or degree offerings
for either face-to-face or online formats. At a broader level, this information can be used
to guide both the recruiting and admissions processes (Kalsbeek & Zucker, 2013).
Between 2000 and 2012, retention between the first and second year of
enrollment for students both first time and transfer students, increased by over 10% at the
university that is the focus of this study (Office of Institutional Research, 2013). This
indicates progress toward reaching the goal outlined in the university’s strategic plan.
Although there has been overall growth in both retention and graduation rates between
2000 and 2012, there was not consistent growth (Office of Institutional Research, 2013).
This presented a need for an analysis of demographic and academic data over multiple
years to address variances in persistence rates and to identify trends over more recent
years. Since the university will benefit from having increased retention and graduation
rates, it will be advantageous for the leadership to be informed on the characteristics of
successful students in both online and face-to-face course delivery modes.
Purpose of Study
Students may fail to persist in post-secondary education due to gaps in their
expectations as compared to their educational experience, a lack of academic aptitude and

7
skill, or for economic reasons (Braxton & Hirschy, 2005). The purpose of this study was
to identify what types of students were more successful face-to-face and which were
more successful online. Some students enter college and successfully earn a degree, while
others end up leaving their chosen institution for a variety of reasons. This study
examined some of the characteristics that were common to students who were successful
in both of these course delivery modes.
The significance of this study is to provide information to university stakeholders
about trends in academic success and who persisted in their education whether the
student opted for online or face-to-face course modalities. Stakeholders can use the
information gleaned from this study to inform decisions related to policymaking and
academic advising. Additionally, the information can be used to identify retention issues
and curricular concerns. Students can use academic trends identified through this type of
learning analytics to reflect and self-select course enrollment options.
Academic success can be defined in a number of ways. For the purposes of this
study, a grade of C- or better is deemed as successful because this is the grade required
for any prerequisite courses across the university. Additionally, it is the same measure
used by Liu, Gomez, and Yen (2009) in their study on retention and final grades.
Universities, as well as individual students, can benefit from persistent enrollment
until a degree is attained (Baum, Ma, & Payea, 2013). They are often compared by
measures such as graduation rate and retention rate (Adelman, 1999). These statistics can
be used as a recruiting tool for both students and faculty. In addition to monetary benefits
for the university, individuals can benefit from staying in school until a degree or
certificate is obtained. Students are more likely to be employed, earn more pay, and, once

8
employed, they are more likely to receive additional compensation beyond a salary such
as pension and health benefits (Baum, et al., 2013; U.S. Bureau of Labor Statistics,
2015).
If institutions of higher education are informed of which types of students persist,
particularly in a specific course modality, university personnel may be better prepared to
counsel students who do not have similar characteristics toward success or offer
additional support to certain students. This quantitative study examined a variety of
student demographic characteristics including age, gender, ethnicity, as well as several
academic factors including current university grade point average (GPA), enrollment
status, and year in school. A correlational analysis was used to determine any patterns of
success for on-campus students in either face-to-face or online classes. This was followed
by a series of logistic regression analyses which were completed in order to identify
predictors of success. Following the correlation and regression analyses, a deeper
analysis of courses from an outlier area was completed in an attempt to identify the
underlying reasons for some of the educational trends.
Research Questions
This study addressed demographic, academic, and course related factors of on-
campus students and analyzed their success rates in 100 and 200 level courses taken
either online or face-to-face at a university in the west. Only enrollments in courses that
were offered in both formats between the Fall 2013 semester and the Summer 2015
semester were included in the data analysis. These factors led to the following research
questions:

9
1. Which are important predictors from student characteristic profiles that lead to
successful completion of 100 and 200 level classes taken online, as measured
by final grade?
2. Which are important predictors from student characteristic profiles that lead to
successful completion of 100 and 200 level classes taken face-to-face, as
measured by final grade?
3. What predictors are common or differ between online and face-to-face
settings?
4. Which academic departments or individual courses can be identified as
significant and in need of further analysis?

10
CHAPTER 2: LITERATURE REVIEW
Introduction
This chapter addresses literature relevant to the study. The first section reviews
the emphasis of retention and graduation rates for both face-to-face and online as higher
education has evolved over time in the United States. Later sections address retention
theories and factors that affect persistence as well as factors that affect student
achievement. The next section discusses some of the differences between online and
face-to-face course delivery models, and the final section reviews how learning analytics
and data mining have been used to explore student success.
Evolution of Retention Tracking in Higher Education
Origins of Higher Education and Distance Learning
Institutions of higher education were established in the United States long before
the country was founded. Many of the early institutions were founded with religious
freedom in mind. Their goal was to provide religious education for future ministers
(Geiger, 2015; Snyder, 1993). At that time, the focus of the universities was to facilitate
the spread of religion as opposed to retention of students, so records of this nature were
not kept.
In the early nineteenth century, traditional four-year universities expanded their
curriculum, shifting beyond religious studies to a focus on the classical topics such as
classical languages, ethics, philosophy, and the sciences (Berger & Lyon, 2005; Snyder,
1993). Also during this time, American higher education began to include normal

11
schools, two-year institutions designed to prepare teachers for the public school system.
Enrollment in higher education during the nineteenth century was very exclusive.
Enrollment across the country consisted of only 1% of people 18 to 24 years of age
(Snyder, 1993). Because of the elite status for university level students, retention was not
perceived as an issue and therefore was not tracked (Berger & Lyon, 2005).
The first evidence of distance education was found in Europe during the same
time higher education in the United States was in its early expansion. As early as the mid-
1800s, students in Great Britain were learning shorthand through courses offered via the
postal service. Language classes were offered in both France and Germany using a
similar approach. Learning through correspondence began in the United States a few
decades later (Colorado & Eberle, 2010; Moore & Kearsley, 2005). These courses had a
goal of spreading knowledge, so retention was still not a consideration.
The 1930s – 1960s
The beginning of the twentieth century brought the expansion of industrialism,
which, in turn, caused an increase in demand for a more highly educated workforce
(Berger & Lyon, 2005). This need enabled universities to either grow or become more
selective in who was accepted as a student based on the institutional goals. Universities
with increased enrollments, particularly those that were less selective in who was
accepted, began to track retention of students. The first report on retention was released
in 1938 (Berger & Lyon, 2005). This report, entitled College Student Mortality, examined
dropout rates at several universities in the 1930s. It considered the time it took students to
complete a degree as well as the impact of several student factors including gender, age,
work status, living arrangements, and location of home as compared to university

12
location. During this time, some innovative institutions implemented distance education
employing mail based correspondence courses as well as delivery of higher education
courses over radio broadcasts (Colorado & Eberle, 2010; Moore & Kearsley, 2005).
Major world events during this time frame had an impact on enrollment trends at
the higher education level. World War II had a significant effect on enrollments since
societal efforts were focused on the war as opposed to getting an education. As a result,
college enrollments dropped 20% between the 1939-1940 and 1943-1944 school years
(Snyder, 1993). Male students were a much higher portion of the group that departed
college as compared to females. However, once the war was over, enrollment numbers
grew quickly. This growth is partially due to the GI Bill that was passed by congress in
1944 to provide incentives for veterans of the war to take advantage of higher education
opportunities (Bean & Metzner, 1985; Bok, 2013).
To encourage ongoing education, the United States Armed Forces founded a
distance learning institute around the time of the beginning of World War II. This
military based organization offered both high school and college level courses to
members of the military (Moore & Kearsley, 2005). There were opportunities for
correspondence courses, telephone based education, and courses offered via television.
These models allowed people to continue their education wherever they were located.
The launch of Sputnik, in 1957, initiated another surge in post-secondary
enrollments. This event helped to create the mindset that getting a higher education
would help strengthen the United States as a whole. Soon after the Higher Education Act
was passed, in 1965, providing grants and low-interest loans to help students pay for their
education (Bean & Metzner, 1985; Berger & Lyon, 2005; Bok, 2013). This surge

13
transitioned enrollment in institutions of higher education from the elite to commonplace,
leading to a more diverse student body (Berger & Lyon, 2005; Bok, 2013). This growth
also brought students to the university system who lacked the proper preparation to be
successful. Students did not know what to expect either academically or socially, and
colleges were not prepared to provide that information to students. As a result, the more
diverse student audience brought an increase in dropouts (Berger & Lyon, 2005).
The 1970s – 1980s
The enrollment surge of the 1960s created an increased interest in tracking
enrollment, student persistence, and satisfaction with the educational experience (Berger
& Lyon, 2005). Two major studies completed in the 1970s examined college dropouts
and a variety of factors that may have contributed to students leaving the higher
education system. Spady (1970) looked at environmental factors, while Kamens (1971)
compared dropout rates to the size and prestige of the institution. These studies
determined that there were higher dropout rates at larger institutions. The large
institutional experience was less personal because students had fewer opportunities to get
to know the faculty teaching their courses (Kamens, 1971). He also found that students
who attended a university that was perceived as more prestigious regarded their education
as having more value thereby making them more employable. Studies like those
completed by Spady (1970) and Kamens (1971) led institutions to be more strategic in
their enrollment practices. Universities worked to select students with more academic and
social preparedness, specifically students with research and writing practice, which were
more likely to graduate (Berger & Lyon, 2005).

14
During this time, another organization that led the implementation of alternative
education modalities was the Electronic University Network, a consortium consisting of
several post-secondary institutions. By the 1980s, the Electronic University Network had
over two hundred television based courses available to learners across the United States,
most were available on public broadcasting stations (Moore & Kearsley, 2005). These
courses were some of the early attempts to provide expanded flexibility for learners.
The 1990s – Today
As higher education transitioned into the twenty-first century, retention rates were
still lower than desired. Dropouts ranged from a low of 8% at private elite institutions to
a high of 50% at open enrollment colleges (Berger, & Lyon, 2005). Before this time,
most institutions were single mode institutions, offering only one mode of instruction.
Advances in technology caused many institutions to begin exploring new instructional
models. Some expanded to operating as dual mode institutions, offering two modes of
instruction, most often face-to-face and distance learning options. Still other institutions
had individual faculty members who opted to move their courses online. Most
institutions, offering a mix of face-to-face and online course modalities, were created
with the forethought of a sustainable model, however, when a single faculty member
chooses to move their course online without institutional support, they often do not
endure (Moore & Kearsley, 2005). Many institutions of higher education found
expansion to include alternate instructional delivery models, including a variety of
distance learning models, allowed for continued growth in enrollments without
sacrificing the existing student population. This expansion also continued to grow the
diversity of the student audience (Berger & Lyon, 2005).

15
In an attempt to provide even more opportunities for students, some educators
worked to provide distance learning incorporating a variety of media options. Courses
used a combination of correspondence and media including video, via live broadcasting
or video recordings, audio, printed study guides, with assignments submitted via mail
(Colorado & Eberle, 2010; Moore & Kearsley, 2005). Another multimedia course
delivery model implemented during the late twentieth century was teleconferencing.
Teleconferencing used either one-way or two-way communication using video (Moore &
Kearsley, 2005).
The next phase of distance learning was centered on the use of computers and the
Internet (Colorado & Eberle, 2010; Moore & Kearsley, 2005). Use of this technology
allowed for a multimedia experience combining the use of text, graphics, audio, and
video in the learning experience. The phrase online learning is synonymous with distance
learning via the Internet. Early iterations of online learning were not much more than
correspondence courses that used email in place of postal mail.
Online learning became much more feasible and more widely adopted with the
advent of the learning management system (LMS). Learning management systems and
their improvements came in three waves. Early learning management systems provided a
structured environment for sending and receiving documents. The arrival of Web 2.0
tools enhanced online learning and learning management systems by providing
opportunities for students to interact with the content in real time. The next, and most
recent, significant change in online learning came with combining the field of data
analytics used in business and industry with the learning management systems in learning
analytics (Brown, 2011).

16
Factors Impacting Persistence
As early as the 1970s researchers developed theoretical frameworks to explain
student retention or lack thereof (Astin, 1975; Bean & Metzner, 1985; Spady, 1970;
Tinto, 1975). Many early persistence frameworks were based on a suicide theory. These
theories worked under the assumption that a combination of academic and social
integration into the environment was critical to thriving. If the student felt they did not fit
in, either academically or socially, then they were at risk of dropping out or ending their
life at the institution (Spady, 1970; Tinto, 1975). Because of the era in which these
theories were created, they were focused on face-to-face students. However, they can be
transferred to all instructional models.
Astin (1975) attempted to explain persistence using an Input-Environment-
Outcome model. He theorized that students enter higher education with a number of
foundational characteristics, or inputs, that influence their ability to persist. The input
variables include demographic characteristics, high school grades, and reasons for
wanting to attend college, as well as many other factors. Astin also identified a number of
environmental variables that were likely to affect the likelihood of success for students.
Environmental factors included variables related to the institution, like size and location
of the university; factors related to the faculty, including teaching methodologies and
values; and characteristics related to the student, including the type of residence, the level
of extracurricular involvement, academic major, and peer group factors. Astin considered
the output variables the results of the environmental variables on the input variables
(Ishler & Upcraft, 2004). The outcome variables include satisfaction with the
environment, academic achievement, and retention.
17
Tinto (1975) expanded Spady’s theory, which focused on multiple reasons why a
person might not persist in their education, to propose an interactional theory of college
departure. The theory is labeled as interactional because there are often multiple
interrelated reasons why a student chooses to leave school. Astin’s and Tinto’s theories
intersect at the point that they both consider the set of characteristics that a student has
when beginning their higher education experience (Ishler & Upcraft, 2004). Tinto’s
theory includes both sociological and psychological reasons for students to drop out or
stop out of their education (Braxton & Hirschy, 2005). Bean and Metzner (1985) added
organizational reasons to the theories for lack of persistence. All of the persistence
theories address primarily voluntary dropout or stopouts as opposed to students who do
not reenroll for reasons determined by the institution (Berger & Lyon, 2005; Ishler &
Upcraft, 2004). The institution may deny reenrollment due to serious misconduct or
consistent failing grades. Voluntary departure most often occurs when a student feels the
obstacles to success are insurmountable.
Sociological Factors
Sociological reasons for persistence are related to the degree to which a student
recognizes the value of their education in relation to their career goals (Habley et al.,
2012). In conflict, lack of student retention may occur when students feel like they do not
fit into a university due to differences between their culture of origin and the culture of
the university (Braxton & Hirschy, 2005). Students may be influenced by pressures for a
certain level of academic performance, and if they are unable to achieve that expectation,
they could opt to withdraw from school. This issue can be minimized if institutions and
courses emphasize building a community. This often results in higher levels of student

18
satisfaction, and consequently, a higher rate of retention (Lotsari, Verykios,
Panagiotakopoulos, & Kalles, 2014). Student engagement, whether behavioral,
emotional, or cognitive, is positively correlated with student achievement (Adelman,
1999; Pardo, 2014), so is an essential component of sociological satisfaction with the
educational experience.
Psychological Factors
Psychological factors that affect persistence can be either internal or external.
Internal factors that can influence persistence include academic success, motivation, self-
esteem issues, and study habits. Student motivation and perception of learning can also
affect their persistence in school. Some students are only looking for surface level
learning, meaning they simply want to pass the test and get a grade. These students may
get less out of their educational experience than those looking for a deeper level of
learning. These students are looking to relate new information to previous knowledge,
find patterns in the content, and gain a deep understanding of the underlying principles
(Stansfield, McLellan, & Connolly, 2004).
External factors can also influence a student’s decision to stay in school. These
factors include family issues, time constraints like employment demands, as well as the
perceived level of support and encouragement from family, friends, and coworkers (Bean
& Metzner, 1985; Park & Choi, 2009; Tello, 2007). External factors are likely to be more
prevalent in nontraditional students, particularly those who need to balance family, work,
and school aspects of life. These are the same factors that often cause students to choose
online courses as opposed to face-to-face options (Pontes, Hasit, Pontes, Lewis, &
Siefring, 2010).

19
Organizational Factors
Bean and Metzner (1985) were the first to consider retention from an
organizational perspective as opposed to that of the student. Universities have a vested
interest in getting students to stay in school until a degree is earned. Persistence requires
students to conform to the organizational norms of the institution, but the institution plays
a key role in this conformity (Habley et al., 2012).
Students must have the proper academic aptitude and skill along with personality
traits that allow them to integrate themselves into the college environment (Braxton &
Hirschy, 2005; Park & Choi, 2009). If a student does not fit into the organizational norms
of the institution, it can affect their level of satisfaction with the university. Tinto (1975)
found that students needed to adapt to the routine of the institution. They need to learn
how to participate and communicate to fit into the college environment both inside and
outside of the classroom. This adaptation is dependent on the structure of the university
as well as the flexibility of the student. If this integration does not take place, a student is
much more likely to drop out of the institution. These learning communities exist in both
the face-to-face and online learning environments. Institutions can encourage
opportunities to ease student adaptation to the organization through the use of student
orientation, learning communities, appropriate academic advising, and other support
services (Ishler & Upcraft, 2004; Swail, 2004).
Often orientation activities are a student’s first exposure to the higher education
environment. Students should be introduced to the essential policies and procedures, as
well as the learning communities that they will become a part of as they move forward in

20
their education. Academic advising should take place in conjunction with the orientation,
setting the student down the proper path to academic success (Ishler & Upcraft, 2004).
Economic Factors
While not included in the theories established in the 1970s, current-day students
also consider economic reasons for persistence in institutions of higher education
(Braxton and Hirschy, 2005). The current average cost of tuition, fees, room and board
for a full-time undergraduate student is approximately $20,000 per year. About 84% of
full-time undergraduate students rely on financial aid in the form of grants, loans, work-
study, or other sources to help cover these costs (National Center for Educational
Statistics, 2015). Many students struggle to see the return on investment of time, money,
and effort put into their education, thus select other career options that do not require
further education. The time spent working to pay back loans can also be a deterrent to
continuing in school until a degree is attained. On the other hand, financial aid can
provide opportunities for some highly motivated students who might not otherwise be
able to access higher education (Swail, 2004).
Another economic factor that can affect students is the state of the economy. A
poor economy can mean fewer jobs are available, motivating unemployed people to
return to school to further their education, in hopes of becoming more employable. In
contrast, when the economy is thriving, students may choose to stopout of school in favor
of a job. On the other hand, a strong economy may push students to be more successful in
their coursework, in the hopes that there are jobs waiting for them once they graduate
(Berger & Lyon, 2005).

21
Factors Impacting Student Achievement
Poor academic achievement is second only to financial reasons for the lack of
student persistence in higher education (Bean, 2005). Academic achievement can be
measured by grade point average (GPA), test scores, class rank, or final course grades. In
addition to academic achievement, demographic, and cultural factors, the structure of the
courses a student chooses and the level of student self-regulation can influence how a
student does in school, and in turn, affect the likelihood of a student persisting until
degree completion. All of these factors contribute to a student’s set of entry
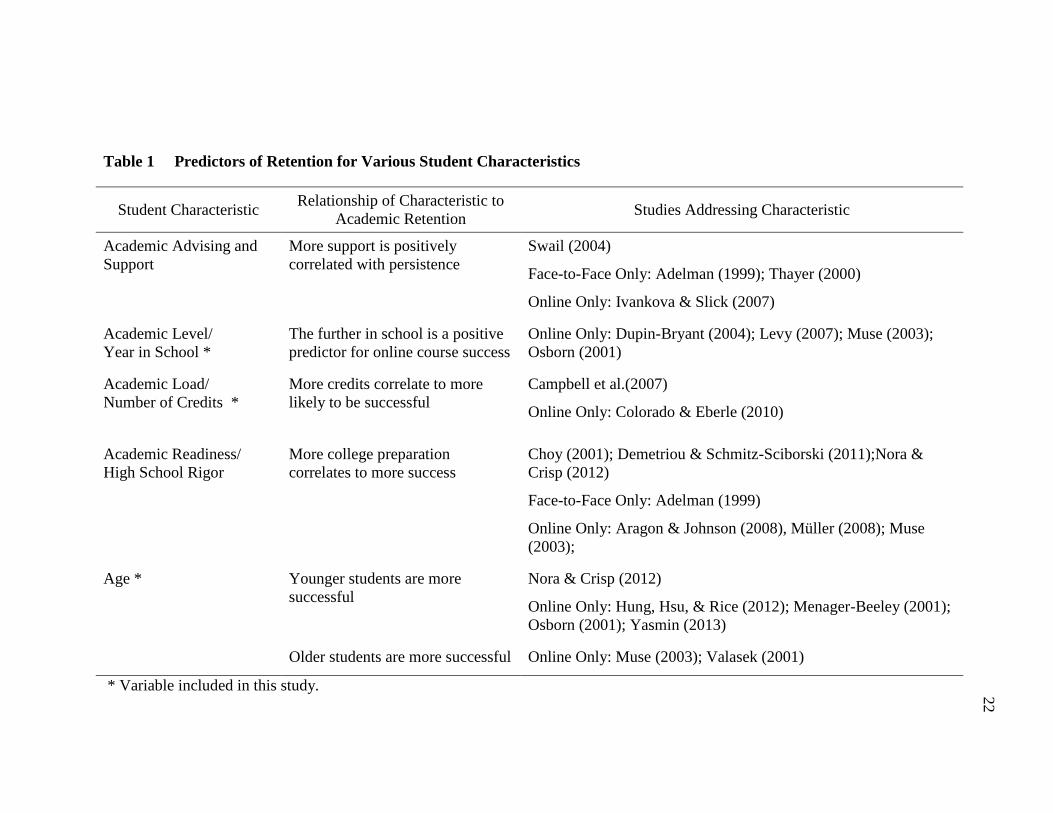
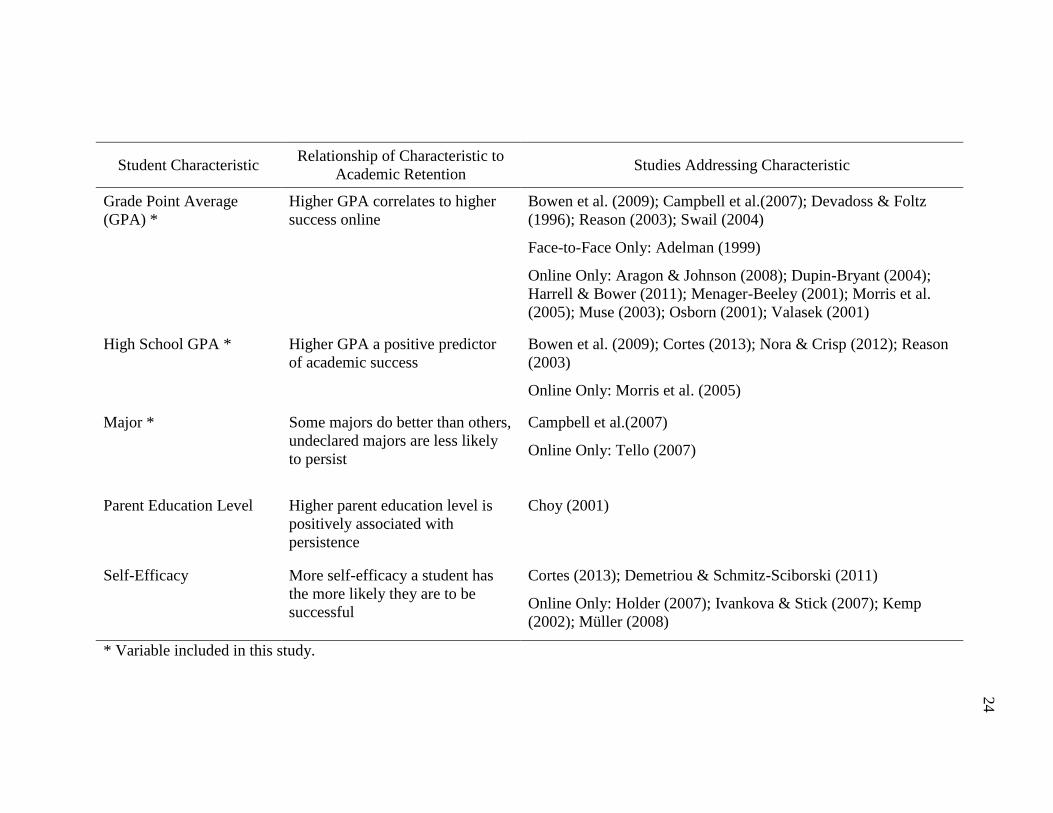
characteristics. Table 1 provides a summary compilation of several key student predictors
and the study reporting the data.
Academic Factors
Class status is one of the top academic predictors of success in both face-to-face
and online courses. The longer a student has been in school, the more likely he or she is
to complete a degree (Hart, 2012; Levy, 2007; Moore & Kearsley, 2005; Wang &
Newlin, 2002). Several studies found grade point average (GPA) to be positively
correlated with success in individual courses (Aragon & Johnson, 2008; Campbell,
DeBlois, & Oblinger, 2007; Dupin-Bryant, 2004; Harrell & Bower, 2011; Hart, 2012;
Jayaprakash, Moody, Laura, Regan, & Baron, 2014; Menager-Beeley, 2001; Morris, Wu,
& Finnegan, 2005; Muse, 2003; Osborn, 2001; Shelton, Hung, & Baughman, 2015;
Valasek, 2001). Some of these studies also found that both the verbal and mathematic
scores on the SAT are strong predictors of academic success (Campbell et al., 2007;
Cortes, 2013; Morris et al., 2005). McKenzie and Schweitzer (2001) reported academic
22
Table 1 Predictors of Retention for Various Student Characteristics
Student Characteristic Relationship of Characteristic to
Academic Retention Studies Addressing Characteristic
Academic Advising and
Support
More support is positively
correlated with persistence
Swail (2004)
Face-to-Face Only: Adelman (1999); Thayer (2000)
Online Only: Ivankova & Slick (2007)
Academic Level/
Year in School *
The further in school is a positive
predictor for online course success
Online Only: Dupin-Bryant (2004); Levy (2007); Muse (2003);
Osborn (2001)
Academic Load/
Number of Credits *
More credits correlate to more
likely to be successful
Campbell et al.(2007)
Online Only: Colorado & Eberle (2010)
Academic Readiness/
High School Rigor
More college preparation
correlates to more success
Choy (2001); Demetriou & Schmitz-Sciborski (2011);Nora &
Crisp (2012)
Face-to-Face Only: Adelman (1999)
Online Only: Aragon & Johnson (2008), Müller (2008); Muse
(2003);
Age * Younger students are more
successful
Nora & Crisp (2012)
Online Only: Hung, Hsu, & Rice (2012); Menager-Beeley (2001);
Osborn (2001); Yasmin (2013)
Older students are more successful Online Only: Muse (2003); Valasek (2001)
* Variable included in this study.

23
Student Characteristic Relationship of Characteristic to
Academic Retention Studies Addressing Characteristic
Course Subject * Students are more successful in
some subject areas. Math tends to
be more challenging.
Online Only: Hung et al. (2012); Yasmin (2013)
Entrance Exam Scores * Higher test scores are a positive
predictor
Campbell et al. (2007); Cortes (2013); Reason (2003)
Online Only: Morris et al. (2005)
Ethnicity * Asians and Caucasians more likely
to persist
Nora & Crisp (2012); Reason, 2003; Swail (2004)
Blacks, Hispanics, Native
Americans less likely to persist
Bowen, Chingos, & McPherson (2009); Nora & Crisp (2012);
Reason (2003); Swail (2004)
Financial Aid Eligibility Lower socioeconomic status
students are less likely to persist
Campbell et al.(2007); Swail (2004)
Higher socioeconomic status
students are more likely to persist
Bowen et al. (2009); Swail (2004)
First Generation Student * First-generation students are less
likely to be successful
Choy (2001); Falcon (2015); Stebleton & Soria (2013)
Face-to-Face Only: Thayer (2000)
Gender * Females are more successful Online Only: Aragon & Johnson (2008); Hung et al. (2012);
Yasmin (2013)
Males are more likely to persist Online Only: Tello (2007)
* Variable included in this study.
24
Student Characteristic Relationship of Characteristic to
Academic Retention Studies Addressing Characteristic
Grade Point Average
(GPA) *
Higher GPA correlates to higher
success online
Bowen et al. (2009); Campbell et al.(2007); Devadoss & Foltz
(1996); Reason (2003); Swail (2004)
Face-to-Face Only: Adelman (1999)
Online Only: Aragon & Johnson (2008); Dupin-Bryant (2004);
Harrell & Bower (2011); Menager-Beeley (2001); Morris et al.
(2005); Muse (2003); Osborn (2001); Valasek (2001)
High School GPA * Higher GPA a positive predictor
of academic success
Bowen et al. (2009); Cortes (2013); Nora & Crisp (2012); Reason
(2003)
Online Only: Morris et al. (2005)
Major * Some majors do better than others,
undeclared majors are less likely
to persist
Campbell et al.(2007)
Online Only: Tello (2007)
Parent Education Level Higher parent education level is
positively associated with
persistence
Choy (2001)
Self-Efficacy More self-efficacy a student has
the more likely they are to be
successful
Cortes (2013); Demetriou & Schmitz-Sciborski (2011)
Online Only: Holder (2007); Ivankova & Stick (2007); Kemp
(2002); Müller (2008)
* Variable included in this study.

25
Student Characteristic Relationship of Characteristic to
Academic Retention Studies Addressing Characteristic
Self-Motivation Motivated students tend to be
successful
Demetriou & Schmitz-Sciborski (2011); Devadoss & Foltz
(1996); Nora & Crisp (2012)
Face-to-Face Only: Adelman (1999)
Online Only: Ivankova & Stick (2007); Liu, Gomez, & Yen
(2009); Muse (2003); Valasek (2001)
Student Age
Similar to Peers
Positive effect de Freitas et al. (2015)
Student Attendance Attendance in face-to-face classes
is a positive predictor of success
Devadoss & Foltz (1996)
Student Engagement More social interaction with
faculty or other students is a
positive predictor of academic
success
Demetriou & Schmitz-Sciborski (2011); de Freitas et al. (2015);
Nora & Crisp (2012); Swail (2004)
Face-to-Face Only: Thayer (2000)
Online Only: Hung et al. (2012); Ivankova & Stick (2007); Liu et
al. (2009); Müller (2008); Valasek (2001)
Support of Family
and Friends
More support correlates with more
persistence
Choy (2001); Swail (2004)
Face-to-Face Only: Adelman (1999)
Online Only: Holder (2007); Müller (2008); Osborn (2001); Park
& Choi (2009)
Work Commitments Students who are employed are
less likely to persist to graduation
Kemp (2002); Tello (2007); Yasmin (2012)
* Variable included in this study.

26
success on a more general level finding that academic performance in higher education
mirrors that of previous academic experiences. This correlation is true for both students
with good grades as well as those who were unsuccessful (Lee & Choi, 2011). Students
who enter a post-secondary institution less prepared for the academic rigor tend to
struggle academically. This causes students to take longer to graduate (Ishler & Upcraft,
2004). Additionally, the more time that has passed since a student last took a class, the
more likely they are to struggle when reenrolling (Colorado & Eberle, 2010; Moore &
Kearsley, 2005). In contrast to these weaknesses, students who enter a course knowing
how to study are more likely to be successful (Moore & Kearsley, 2005; McKenzie &
Schweitzer, 2001). In addition to studying, students who make attendance in their classes
a priority perform better (Devadoss & Foltz, 1996).
Demographic Factors
Early attempts at online learning were promoted as if all diversity could be hidden
in an online environment (Rovai, Ponton, & Baker, 2008). While this could never happen
in a face-to-face classroom because of visual cues, this type of utopian environment may
be possible online, although it is unlikely. In this type of class, the bias would be
removed, but only until the instructor and students start interacting with each other.
Students draw on their past experiences as learning resources, and these could not be
shared without the diversity of the group being shared to some extent.
Males and females have different approaches to learning (Ewert, 2010; Rovai et
al., 2008). Historically, males dominated the higher education student audience until the
1970s, when females surpassed males in the number of both enrollments and graduates
(Ewert, 2010; Grebennikov & Skaines, 2009). Male students have a higher incidence of

27
taking a break of a term or more while working on their post-secondary education. They
are also more likely to attend school on a part-time basis (Ewert, 2010).
Rovai et al. (2008) found that, while enrolled in courses, males generally have a
more positive attitude toward technology than their female counterparts. It may be due to
this attitude toward technology that causes male students to exude more confidence in
their online participation. Male students tend to use fewer qualifiers instead opting to use
more intensifiers in their writing. When students are given the opportunity to interact
with fellow students, females are more likely to ask questions while male students tend to
answer questions more frequently. When working on low level learning tasks female
students take notes and focus on absorbing the content where male students choose to ask
questions directly to the instructor. In contrast, female students prefer interacting with
fellow students when working on higher level learning tasks where males prefer
independent processing. The same research added that female students use a “connected
voice” when contributing to discussion forums, portraying empathy and the importance
of relationships while male students use an “independent voice” which is more certain in
its tone, and sometimes is interpreted as confrontational (Rovai et al., 2008). Overall
studies show that females are more successful than males, although studies have varying
results as to the significance of their findings (Ishler & Upcraft, 2004).
Age is another factor that is considered in the research on retention for the
university population as a whole. Individual studies have differing results. Some studies
have found younger students are more successful (Hung, Hsu, & Rice, 2012; Osborn,
2001; Yasmin, 2013), while others determined that older students do better in their
coursework (Muse, 2003; Valasek, 2001). Older students are often classified as

28
nontraditional students. The term nontraditional student refers to a student who meets one
or more of the following characteristics: they are over the age of twenty-four, married,
have children, or are financially independent (Ewert, 2010; Watt & Wagner, 2016). Any
of these factors can have a detrimental effect on a student’s attention to school work
(Braxton & Hirschy, 2005; Park & Choi, 2009). It is these same factors that may cause a
student to select online courses as opposed to face-to-face classes for the added flexibility
that online options can offer.
Cultural and Societal Factors
Ethnicity is another demographic that is often used when considering success in
higher education (Morris, n.d.; Richardson, 2012). Early researchers came up with
theories based on genetics, hypothesizing that some races have more innate abilities than
others. More recently, researchers argued that differences in educational outcomes are not
due to genetics, but instead caused by the differences in economic, cultural, social, and
historical circumstances. The nature versus nurture mentality spurred a new wave of
research focused on educational interventions that aimed to overcome cultural differences
(Morris, n.d.).
Modern research has centered on the cultural and societal factors that can have an
effect on a student’s predisposition toward education (Richardson, 2012). Hofstede
(2001) defined a framework that can be used to compare cultures and how the societal
factors may define how the culture views higher education. The framework uses five
different scales or dimensions.
Power – Distance Dimension. A measure of the disparity between those who have
power and those who do not.

29
Individualism – Collectivism Dimension. A scale that identifies how a person
considers the effects of their actions.
Uncertainty – Avoidance Dimension. A measure of how nervous people are in
situations perceived as unstructured or unpredictable.
Masculinity – Femininity Dimension. A range of how a culture identifies the
distinction between what men are expected to do from what women are expected
to do.
Long-Term – Short-Term Orientation Dimension. A measure of the extent to
which people from a society are looking toward the future as opposed to living in
the present.
Cultural differences can affect how students interact with the instructor in courses,
both face-to-face and online. If the students have a different cultural background than the
instructor, it has the potential to affect student achievement. The student may be
influenced by different comfort level on the power-distance dimension, and the role of
the teacher; respecting their authority to the point that it hampers their success in the
course (Rovai et al., 2008). Specifically, college level courses often incorporate the use of
discussions. Discussions are frequently in the format of a debate where the intent is to
have students debate the instructor and fellow students. The United States has a relatively
low power-distance rating, however, students from cultures with a high power-distance
rating may not feel comfortable challenging their instructor, a person in a place of
authority (Sher, 2013). This could, in turn, adversely affect their grade, and in turn their
overall academic success. Since minorities are a growing segment of the college

30
population, it is important for university faculty and staff to have an awareness of cultural
differences (Campbell et al., 2007).
Course Delivery Models
There is a spectrum of course delivery models ranging from a face-to-face
classroom to a fully online course. One range within these delivery models is the amount
of synchronous contact between instructor and student. Some classes take place in a fully
synchronous format. This can occur in a classroom, via two-way video, or using a web-
based meeting platform. Besides the level of synchronous contact, there are many
considerations that can affect both the instructor and the student in these various course
delivery models.
The roles of both the instructor and the student vary in the different course
delivery methods. In face-to-face classes, the instructor often has the role of a “sage on
the stage,” or the subject matter expert standing in the front of the classroom distributing
their knowledge to the students (King, 1993). This aligns with the traditional idea of an
instructor lecturing while students are taking notes and attempting to absorb as much
information as possible. This means the activities are often planned and led by the
instructor (Stansfield et al., 2004).
In online courses, the instructor role often changes. They act more as a “guide on
the side” (King 1993). Some instructors opt to play an active role in course facilitation,
providing regular academic support for students as they work their way through the
course content. Instructors grade assignments and provide feedback to students, as well as
facilitate online discussion forums. They make themselves available to struggling
students who ask for help. Other instructors take the initiative to contact students who

31
seem to be struggling in their course. In this model, students have more control over their
learning.
Malcolm Knowles (1984) identified a set of characteristics that are often preferred
by adult learners. His learning theory is referred to as andragogy. Andragogy theory is
based on a set of five assumptions regarding adult learners.
Learner Control. Since adult learners are independent members of society, they
prefer to have a similar level of control within the learning environment.
Therefore they like opportunities where their learning is self-directed.
Life Experience. Secondly, adult learners bring a vast array of experiences to the
classroom. Knowles emphasized that these students learn best when they are
encouraged to draw on their experiences and make connections between their past
experience and the knowledge being gained through the educational experience.
Need-Based Learning. Adult learners approach the learning situation cognitively
and emotionally ready for the task at hand. Adults tend to choose to continue their
education based on a perceived need. The need could be initiated by a career
change or a family event.
Value of Learning. Adult learners need a purpose for their learning. Toward this
end, students need to be informed of the outcomes of the learning experience, and
what value it will provide for them.
Motivation to Learn. Finally, adult learners have an intrinsic motivation to learn
(Knowles, 1984). This final assumption about these learners is very closely
connected to the other assumptions. If a student is motivated to learn because it
provides an opportunity for self-improvement, they are going to want to learn

32
information that is relevant to their lives, and information that provides
opportunities to connect to prior experiences.
Another variable in different course delivery formats involves the amount of
interaction among students (Stansfield et al., 2004). Some course formats, either online or
face-to-face, allow students to work through the materials at their own pace in a relatively
independent format. In this type of course, the student has opportunities to interact with
the content and the teacher, but not fellow students. Other online courses are designed for
a cohort of students. In these courses, students have the opportunity to interact with each
other as well as with the content and the teacher. Either format requires students to be
active participants. Asynchronous online courses provide the opportunity for students to
think and reflect on the content prior to participating in class. Because of the nature of the
discussions, there is the potential for more student interaction and participation than in a
live classroom. Discussion activities in courses are in alignment with Knowles’s
andragogy theory because it provides an avenue for students to be able to draw on
personal experiences and share them with others. This approach allows students to use
each other as learning resources (Moore & Kearsley, 2005).
The instructor is responsible for building a sense of community within the course
they teach (Rovai et al., 2008). In a face-to-face class, this can be accomplished through
discussions and classroom activities. This is a relatively easy task when students are in a
common location and time where students have all their senses gathering information in a
similar environment. However, in an online course, without audio or video, the instructor
and students do not have the visual cues of facial expressions, nor do they have the
intonation cues available when listening to a conversation. Despite the lack of face-to-

33
face contact, there can be other advantages to online learning. The increased
opportunities for reflection, as well as unlimited access to the course content, provide a
greater degree of learner control over the learning environment (Stansfield et al., 2004).
The opportunity for reflection allows for deeper discussion as compared to those that take
place in the face-to-face classroom. These discussions can be productive if students feel
the online environment is a safe place for sharing their thoughts. In doing so, all
participants, both instructors and students, need to have respect for diverse perspectives
(Rovai et al., 2008).
One common concern related to multiple course delivery models is a perception
of differences in course quality (Patterson & McFadden, 2009). To mitigate concerns,
online and face-to-face versions of the same course should be developed around the same
set of learning objectives. Both course models should have the same measurable course
outcomes, although they may be achieved in different ways. If this is truly the case, the
two course models should have similar measures of student success (Clark, 1983). When
a study finds that student outcomes differ between face-to-face and online, those
variances can typically be attributed to instructional strategies, student motivation, or
self-discipline (Colorado & Eberle, 2010; Moore & Kearsley, 2005).
Learning Analytics
Analytics is the science of logical data analysis (Dziuban, Moskal, Cavanagh &
Watts, 2012). The use of analytics is popular in business to predict customer choices. For
example, many online shopping websites offer suggestions based on previous browsing
on their site. Similar analytics of data can be applied in the field of education to predict
student success or inform instructors on when and how to intervene with a student to

34
reduced chances of failure, effectively allowing educators to gain similar benefits for
students as businesses do for their customers through advertising (Martin & Sherin,
2013). The Society for Learning Analytics Research defines their field as “the
measurement, collection, analysis and reporting of data about learners and their contexts
for purposes of understanding and optimizing learning and the environment in which it
occurs” (Siemens & Baker, 2012, pp. 1-2).
Learning analytics is often confused with the field of educational data mining.
While the two fields have many similarities, some argue they evolved separately with a
slightly different focus. The International Educational Data Mining Society defines
educational data mining as “an emerging discipline, concerned with developing methods
for exploring the unique types of data that come from educational settings, and using
those methods to better understand students, and the settings which they learn in”
(Siemens & Baker, 2012, p. 1). Learning analytics focuses on data from the learner and
their context that will be used to improve either the learning process or the learning
environment. In contrast, educational data mining has a slightly broader approach. These
researchers do not specify where their data originates, but they do stipulate that their goal
is to better understand students and the various learning environments. The core
difference between the two fields is that learning analytics incorporates human judgment,
while educational data mining relies on computer automation (Baker & Siemens, 2014;
Pardo, 2014; Siemens & Baker, 2012). This difference is evident in the discovery,
analysis, and application of the data. For example, educational data mining researchers
may apply their findings through having educational software automatically adapt to

35
personalize learning experiences for users. In contrast, learning analytics results are used
to inform instructors on how to assist struggling learners (Baker & Siemens, 2014).
Both learning analytics and educational data mining are emerging as new research
fields because of the ever-increasing amount of data available (Baker & Siemens, 2014;
Wagner & Ice, 2012). Stakeholders at all levels are expressing interest in access and use
of the data including educators, institutions, government, and accrediting agencies. These
groups are using the data to make decisions about instructional strategies, judgments on
the quality of learning, student attrition and graduation rates, financial aid, and policies
about online teaching and learning (Dringus, 2011). Jayaprakash et al. (2014) stated that
“the goal of learning analytics is to uncover hidden patterns in educational data and use
those patterns to attain a better understanding of the educational process, assess student
learning, and make predictions on performance” (pp. 1-2). Researchers in learning
analytics should focus on providing data that support student success as opposed to other
goals such as maximizing profits for the university (Becker, 2013; Slade, & Prinsloo,
2013).
History of Learning Analytics
Using data to inform instruction is not new. On a small scale, teachers have used
informal questioning and other formative assessment techniques in classrooms to gather
information on student understanding for decades. Learning analytics in online learning
became more formal when learning management systems first became available as
opposed to individual websites for distance courses. Learning management systems were
able to track data for users, both students and faculty (Picciano, 2012; Reyes, 2015). The
second wave of data analysis came when Web 2.0 tools were incorporated into online

36
learning situations (Brown, 2011). These tools provided additional data not available with
learning management systems alone. The final wave of development for learning
analytics and data mining came with the increased capacity to analyze large amounts of
data. Learning managements systems and student information systems were linked to
track vast amounts of data.
There is an ever increasing push for stakeholders to use big data in decision
making. Globalization has pushed the demand for learning analytics by creating increased
competition for online educational opportunities. Students no longer need to live in the
same town as their chosen institution of higher education. Reduced public funding and
increased government oversight have caused a need for institutions to show a return on
investment for the education they provide to students (Lockyer, Heathcote, & Dawson,
2013; Picciano, 2012).
Learning Analytics Frameworks
Since the field of learning analytics is relatively new, there are only a few
proposed models to provide structure for studies. Some of these models are based on
older theories of knowledge development or the use of business intelligence (Elias,
2011). Each of these models originates from the definition of learning analytics in that
they are designed to use available data to inform and improve teaching and learning.
Knowledge Continuum. In his dissertation, Baker (2007) proposed a theory on
how businesses can make knowledge actionable. He expanded on an earlier theory, which
proposed that information lies on a Knowledge Continuum based on the depth of how the
data is used (Elias, 2011). Data is at the lowest level and used to answer “what is”
questions. The next level higher is considered information. Information is used to answer

37
questions about when and where. The third level on the spectrum is labeled as
knowledge. Knowledge is used to answer questions about why and how. The high end of
the knowledge spectrum is defined as wisdom. Information has achieved the wisdom
level when it is applied to make improvements in the field.
Collective Applications Model. This model, proposed by Dron and Anderson
(2009), defines a cyclical framework in which data is gathered, processed, and presented.
Gathering data involves selecting and capturing the data. Processing the data involves
aggregating and processing the data. Presenting the data includes determining how it is
displayed. If the desired detail is not displayed, then the cycle is repeated with some level
of change in what data goes through the process (Dron & Anderson, 2009; Elias, 2011).
The Five-Step Learning Analytics Process. Campbell and Oblinger (2007)
proposed a five-stage model for learning analytics studies. The first stage is capturing the
data. Researchers need to determine what data is needed, the level of granularity of the
data, and how to retrieve that data (Campbell & Oblinger, 2007). During this stage,
researchers should employ techniques to ensure the data is stored in a secure location
(Pardo, 2014). Once the data is retrieved, the researcher must make decisions on how to
organize the data prior to moving to the next stage of the process.
The second stage of the learning analytics process involves reporting on the data.
The data needs to be processed in a manner that it can be summarized or combined for
reporting in a usable format for the end user (Campbell & Oblinger, 2007; Pardo, 2014).
During this stage, it is usually necessary to use statistics software tools that can handle
large quantities of data. The tool selected depends on the type of data that was captured
and the research questions to be considered (Greller & Drachsler, 2012). One critical

38
component of the reporting stage is the development of a dashboard that is used to
display the data in a meaningful way for stakeholders (Pardo, 2014). This stage includes
computation of descriptive statistics for the data, which informs end users of what has
happened in the past.
The next stage of the process is to make predictions based on the data and
reporting completed in the previous stage. This involves answering questions that
initiated the data capture in a manner that explains what is likely to happen. An accurate
prediction depends on the use of a reliable model. This stage revolves around the
generation of that model (Campbell & Oblinger, 2007).
Once a prediction is made, the next phase requires stakeholders to act on that
prediction. If this stage is implemented correctly, actions will result in improvements
(Pardo, 2014). These actions can be executed either manually or automatically. The
number and type of interventions are based on the nature of the prediction that was made
in the previous stage (Campbell & Oblinger, 2007). Depending on the type of reporting
and predictions created during earlier stages of the learning analytics process, actions
may be prescriptive in nature. Prescriptive actions should vary for different end users, or
students, helping them to be successful.
The final stage of the learning analytics process is the refining stage. This is the
stage of the process that makes this model unique. The models presented by Baker (2007)
and Dron and Anderson (2009) do not define refining the data as a unique step in the
process. Calling out the refinement of the data as a requirement of the process makes this
model stronger than the other models described in the literature. Regular evaluation
should take place on results of the actions taken during the act stage. In addition to
39
evaluating the actions that take place, researchers should revisit the predictions used to
determine those actions, the reporting that was used to predict, and even how the data
was captured. Improvements could be made at any stage in the learning analytics process
(Pardo, 2014).
Privacy and Ethics
There are potential ethical issues within the field of learning analytics. Primarily
these are issues related to student privacy and ownership of the data (Reyes, 2015; Slade
& Prinsloo, 2013). The Family Education Rights and Privacy Act (FERPA) is a federal
law enacted to protect student privacy. This law guides institutions on how student data
can be used for research, school improvement, and accountability, and when it is
necessary to inform students (U.S. Department of Education, 2012). While some students
may want to opt out of studies that involve learning analytics, it could change the
interpretation of student learning in results of those studies in either a positive or a
negative manner (Brown, 2011). Since this field is in its relative infancy, students need to
be ensured that any learning analytics research used beyond the classroom and instructor
has all personally identifiable information removed from the data prior to release to
researchers (Oblinger, 2012).
One challenge related to learning analytics is that there are few guidelines or
regulations in place to guarantee anonymity (Pardo, 2014; Reyes, 2015). Since there are
minimal guidelines, researchers should be clear in defining the purpose of their study as
well as how the sensitive data is being handled (Slade & Prinsloo, 2013).
Another ethical consideration is related to how the data are used once the analysis
is completed. Data, especially personally identifiable data, should be used for research or

40
school improvement reasons, whether predictive or prescriptive, as opposed to other
reasons like making a profit (Slade & Prinsloo, 2013). At times, an in-depth analysis of
data may lead to conclusions that can help stakeholders increase their understanding
about student retention and academic success, but it may not be actionable data. Other
instances provide information in which stakeholders can take immediate action. No
matter how the data is used, there should be a balance between the push to gain
knowledge against harming individuals, whether they are students or instructors (Slade &
Prinsloo, 2013).
Since the results of data analysis have the potential to directly affect students and
instructors, accurate interpretation of data is critical. If data are misinterpreted, there
could be adverse effects. Students may become unmotivated, academic advising could be
inaccurate, faculty members could lose opportunities for advancement, or the institution
as a whole may lose enrollments. When acting on the data, stakeholders should keep in
mind that the numbers that were analyzed represent real people. These people are part of
the population, but may not have the same needs as the group (Slade & Prinsloo, 2013).
An individual may be an exception to the norm or may have extenuating circumstances
beyond what can be measured with the data alone, so it is essential to avoid profiling of
students based on their demographic or academic characteristics. On the other hand,
educators have an ethical obligation to act on the knowledge gained through the research
(US Department of Education, 2012).
Uses of Data
The results from learning analytics studies are used by a variety of groups. How
the data is used, and what actions are taken, depends on the needs of the group, and their

41
placement in the hierarchy of the educational process (Jayaprakash et al., 2014; Shelton
et al., 2015). Learning analytics data are used in three areas: descriptive, predictive, and
prescriptive analyses (Affendey, Paris, Mustapha, Sulaiman, & Muda, 2010; Brown,
2011). Descriptive analysis helps create a portrait of past students, instructors, or other
stakeholders, while predictive analysis predicts likely trends and outcomes for students
prior to their experience (Affendey et al., 2010; Brown, 2011; Verbert, Manouselis,
Drachsler, & Duval, 2012). Prescriptive analysis dictates interventions for various
stakeholders within the educational community (Brown, 2011). Each of the user groups
may use the data in a descriptive, predictive, or prescriptive manner based on their needs.
Higher Education Administrators. Higher education administrators use data
analysis results in a variety of ways. Data are used to describe the student body as a
whole as well as subpopulations within the university. Administrators can identify
admissions prospects and predict the likelihood of their success (Dziuban et al, 2012).
They detect retention issues, prescribe actions, and monitor graduation rates (Reyes,
2015). Administrators may also use data to identify issues in the learning community
beyond the classroom itself that affect the success of students at the university (Pardo,
2014). Overall, the data reporting can lead to improved accountability across the
university, leading to better use of resources, and an increased reputation, both within the
university and beyond (Campbell & Oblinger, 2007).
University Staff. Learning analytics study results can be useful to instructional
designers when creating online courses (Lockyer et al., 2013). Department level staff can
use data to inform personnel decisions including teaching assignments and training needs
(Berger & Lyon, 2005; Dziuban et al., 2012; Shelton et al., 2015). University staff that

42
provides supplemental student resources benefits from learning analytics results to refine
the timing and location of various services (Becker, 2013; Campbell & Oblinger, 2007).
Faculty. Both face-to-face and online faculty members can benefit from using
data to inform their teaching. Data resulting from formative assessments can be used to
identify knowledge gaps that can be addressed immediately in the classroom, positively
helping current students (Reyes, 2015). Data from other sources, including the end of
course evaluations along with LMS data, can be used in a prescriptive manner to inform
adjustments to course content or pedagogy for future course offerings, particularly for
online courses (Pardo, 2014). Learning analytics can encourage faculty members to take
part in a self-reflection of their online teaching (Dringus, 2011). A self-reflection may
encourage professional growth for faculty in the differences between face-to-face and
online teaching and learning pedagogy (Shelton et al., 2015). Faculty members have the
power to use learning analytics to guide students to success, affect practice, and
contribute to the scholarship of teaching and learning (Campbell & Oblinger, 2007).
Students. Like faculty members, active students, as well as prospective students,
should be able to take advantage of the large amounts of data automatically collected
both prior to enrolling and while participating in online courses. Students may benefit
from having access to predictive analysis results on given courses. This information
should not be used to limit educational options, instead, it has the potential to inform their
decisions on enrollment. Students can work with faculty on educational adjustments
midcourse to improve their academic performance. Like faculty, students will benefit
from data that encourage opportunities for self-reflection (Pardo, 2014). Reflection of this
nature can affect progress in a current course, or inform decisions on future courses.

43
Student awareness of prescriptive analytics can lead to a more streamlined use of
university resources (Campbell & Oblinger, 2007).
Government. Policy makers use data at all levels, descriptive, predictive, and
prescriptive, to evaluate education on a national or regional level. The increase in
learning analytics allows for new types of data use thereby expanding the ability to
evaluate educational objectives. The new data can provide a different viewpoint for
policy making decisions (Reyes, 2015).
Researchers. Researchers work with other stakeholders to share the information in
a refined, usable format. Toward this end, researchers have a number of responsibilities.
They are responsible for the validity and reliability of the data as it goes through the
process of analysis and is shared with others (Reyes, 2015). Additionally, they are
responsible for the de-identification of student data when details are reported beyond the
classroom.
Summary of the Literature
Data has been used to inform instruction and track retention and graduation since
the early years of higher education. Within the last decade, a dramatic increase in the data
available has changed the way data is used in the decision-making process. Much of this
is due to “big data” that is available in student information systems, learning management
systems, and other longitudinal data systems. If this data is properly captured and
reported, it can be used by a variety of stakeholders to predict or prescribe actions based
on the data. There were a number of learning analytics models presented in the literature
review, and each learning analytics study is driven by a model that allows the research to
achieve maximum results. This study used the five-step process proposed by Campbell

44
and Oblinger (2007) because it provided a framework that matched the focus of the
study.
The decisions made based on the data are supported by the persistence theories
established in the 1970s. These theories posited that the characteristics with which each
student enters college, combined with the environment of the institution, can be used to
identify reasons why a student may not succeed in their education. The review of the
literature provided a comprehensive list of characteristics that were options for data
collection points for this study. This study attempted to address as many of the variables
listed in Table 1 as possible. However, one limitation of the purely quantitative study is
that qualitative data is not available. As a result, those student characteristics included in
Table 1 that are related to information about individual students or faculty choice were
not available for this study. This included variables related to whether study participants
accessed services offered by the university. Ultimately, this study addressed 50% of the
student characteristics addressed in the literature. Those variables are indicated in Table 1
with an asterisk.
Finally, all of the literature reviewed for this study addressed the university
population as a whole or focused on either the face-to-face or the online learning
environments in isolation. This study addressed both face-to-face and online course
enrollments separately as well as the population as a whole. This approach makes this
study unique and allows the study to identify predictors that differ between the two
audiences.

45
CHAPTER 3: METHODOLOGY
Overview
This study was centered on a detailed look at the data describing the on-campus
students at a university in the western region of the United States who were enrolled in
100 and 200 level courses that were offered in both face-to-face and online formats over
a two-year period. The results of this study can be used to inform academic advisors on
whether students should choose to take a given course online or face-to-face. The results
can also be used to identify courses and academic departments where students regularly
have significantly different levels of performance, based on final grade, between the face-
to-face and online versions.
Method
Campbell and Oblinger (2007) and Pardo (2014) described a process for learning
analytics that includes five stages. This study adopted the five stage process of capture,
report, predict, act, and refine. This process was used to address the following research
questions:
1. Which are important predictors from student characteristic profiles that lead to
successful completion of 100 and 200 level classes taken online, as measured
by final grade?
2. Which are important predictors from student characteristic profiles that lead to
successful completion of 100 and 200 level classes taken face-to-face, as
measured by final grade?
46
3. What predictors are common or differ between online and face-to-face
settings?
4. Which academic departments or individual courses can be identified as
significant and in need of further analysis?
For the purposes of this study, completion of a course was considered successful
if a student earned a grade of a C- or better. This definition was chosen because the
university requires students to earn a C- or better in all prerequisite courses in
undergraduate programs.
Participants
The data collected for this study was the entire population of on-campus students
who were enrolled in the set of 100 and 200 courses that are offered in both online and
face-to-face formats between the Fall 2013 semester and the Summer 2015 semester at
the university. The collection of 100 and 200 level courses was selected because the
university offers multiple sections of these courses in both formats every term. Blended
courses were excluded from the study. Additionally, these courses have higher
enrollments than many upper division courses, since they often function as service
courses. Service courses are courses that are offered by one academic department but are
required for many degrees or certificates. For example, anatomy and physiology is a
course offered by the biology department but is required by degree programs ranging
from kinesiology and nursing to criminal justice and social work.

47
Capture
The capture process involved three phases, as can be seen in Figure 1. First was
the process of data collection, followed by organizing the data, then cleaning and
validating the data.
Data Collection
Prior to data collection, an application was submitted to the Insitutional Review
Board (IRB), and was approved. Data was exported from the data warehouse at the
university where this study took place. The information was pulled from the PeopleSoft
Student Information System database. PeopleSoft is the student information system
adopted by the university. A detailed list of data points collected can be reviewed in
Table 2.
To initiate the data collection process, a query was run to create a comprehensive listing
of all 100 and 200 level core courses that are offered in both online and face-to-face
formats. This list was used to determine which records to extract from the data
warehouse. Courses offered in only one format or the other were excluded from this
study. A number of courses were offered in other formats including hybrid or via
teleconferencing, but those course sections were excluded from this study. Additional
queries were run to gather demographic information as well as details on residency, first
generation status, high school GPA, and entrance exam scores.
Once the data set was reduced, there were nearly 101,000 individual course
enrollments for just over 23,800 students. Due to the large quantity of data, and the
personal nature of the records, adherence to FERPA regulations was deliberate. The data
was stored on a university computer, to insure the security of the data.
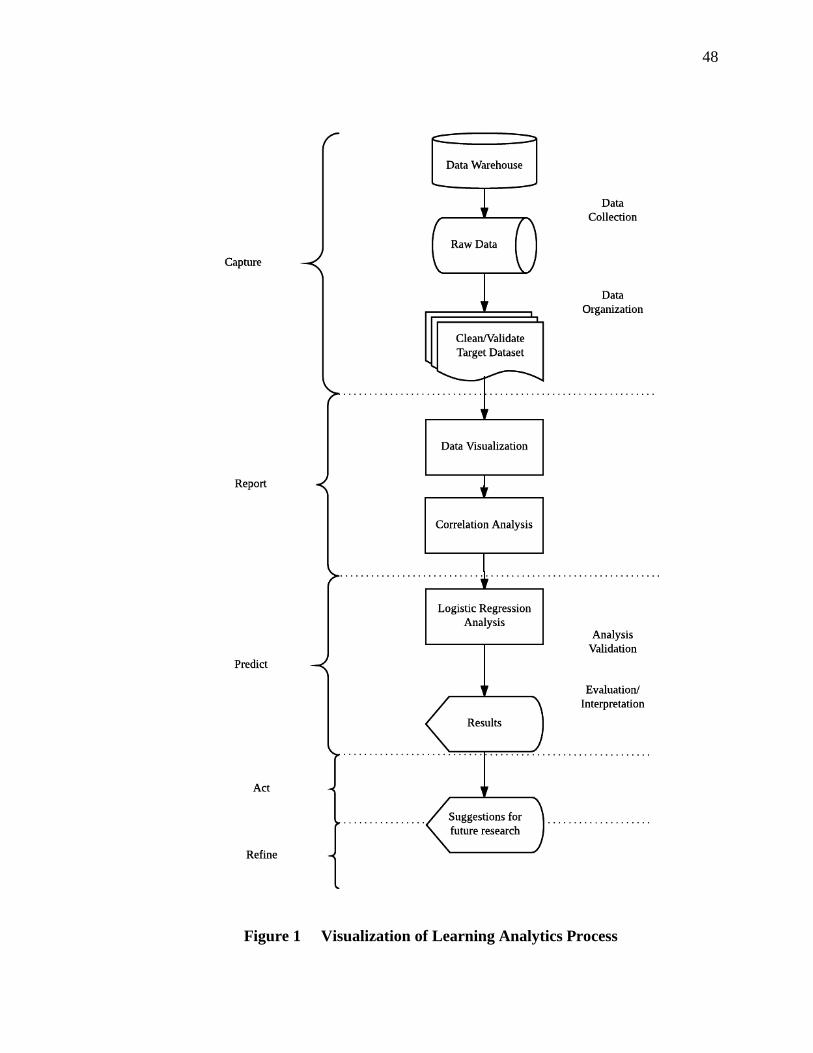
48
Figure 1 Visualization of Learning Analytics Process

49
Table 2 Data Variables
Variable Name Variable Type
Academic Information
Academic Level/Year in School Nominal
Academic Load Nominal
College Cumulative GPA Continuous
Cumulative Credits Earned Continuous
Degree Type Nominal
Entrance exam scores (math, verbal, written, composite) Discrete
Final Grade Discrete
High School GPA Continuous
Primary Major College Nominal
Successful Nominal
Term Enrolled Nominal
Term GPA Continuous
Withdrawal Nominal
Course Information
College Nominal
Course Delivery Mode Nominal/Binary
Course Code (i.e. ENG101) Nominal
Course Level Nominal/Binary
Course Section Enrollment Continuous
Course Section Full Nominal/Binary
Demographic Information
Age at Time of Enrollment Continuous
Age Category Nominal
Declared Degree Count Continuous
Declared Degree Type Nominal
Ethnicity Nominal
First Generation Student Nominal/Binary
Gender Nominal/Binary
Residential Status** Nominal
Student ID* Nominal
Note. All data is at time of course enrollment.
* A number used to identify multiple enrollments for a single student, not necessarily
the university identification number.
** Indicates whether the student is a state resident.

50
Data Organization
Student identification numbers were included with the original data set. This
information was used to join the data from multiple queries into a single merged data set.
In an effort to maximize student privacy, the dataset was de-identified as soon as
possible. De-identification of data is a process used to make the identification of
individual students more difficult (Nelson, 2015; Slade & Prinsloo, 2013). Any
personally identifiable information was encoded as soon as possible after data
acquisition. This allowed the different enrollments for an individual student to be
identified while minimizing the ability to identify his or her original student identification
number. Each record collected was associated with a course enrollment. So, for example,
if a single student was enrolled in three different 100 or 200 level courses, then there
were three different records associated with that student. This approach allowed the study
to account for all online course enrollments and all face-to-face course enrollments for
courses included in the study. The data was delivered in a format that was easily imported
into Microsoft Excel for data cleaning and then imported into SAS, a statistical software,
for more in-depth analysis.
Data Cleaning and Validity
With a large data set, it is likely there will be invalid data (Hand, 1998). The
dataset was evaluated, field by field, for any missing data points. Based on the nature of
the data that was missing, many records were omitted from the study. For example, this
occurred when details like the final grades were listed as incomplete or audit, or if the
full-time status was not included. In some fields, a value of unknown was used
(ethnicity), and in other fields, unknown values were left blank (entrance exam scores,

51
residency information). Sorting and filtering strategies were used to identify anomalies in
the data. For example, students with a GPA above a 4.0 were omitted from the dataset.
The initial data set included all records for active enrollments as well as students who
dropped the course prior to the course drop deadline. Since none of these records had a
final grade associated with them, they were omitted from the study. Additionally,
enrollments that were for a course that used a pass/fail grading format, courses for zero
credits, enrollments that were audits of full courses and enrollments where a student
received an incomplete were omitted from the study data set.
Some data required modification prior to analysis. One critical field was the
reporting of final grades. Instructors at the university are given freedom in how they
report final grades. Some issue only letter grades while others opt to use a +/- system. At
some universities, a grade of C- is considered not passing, but that is not the case at the
university where the study took place. For this study, a C- was considered passing. To
minimize confusion in this field, all grades were truncated to consider only the letter
grade. If a student withdrew from the course, their grade was considered equivalent to an
F for statistical analysis. For calculation purposes, the standard 4.0 grade scale was used
where an A was worth four points, a B was worth three points, a C was worth two points,
a D was worth one point, and an F was worth zero points.
The year in school field was calculated based on the number of credits a student
had completed based on the definition used by the university. A student is considered a
freshman from initial enrollment through 25 credits earned, a sophomore when 26 to 57
credits have been earned, a junior when between 58 and 89 credits have been earned, a

52
senior when 90 or more credits have been earned. Students who are pursuing a second
baccalaureate degree or are graduate students were categorized separately.
Several of the variables were reduced for the logistic regression analysis.
Reducing variables minimizes the number of different values for the variable. The
individual course subjects were reduced from individual subjects to departments for
initial analysis and then further reduced to the college offering the course for logistic
regression analysis. A similar reduction of values was completed for the primary majors
declared by the students. The degree type was reduced from eight different types of
degrees or certificates to three values. It was important to distinguish students working
toward a bachelor’s degree, from those enrolled as college students while enrolled
concurrently as high school students. All other degree types were grouped into a category
labeled as other. Additionally, several variables were transformed to normalize the data
distribution prior to the logistic regression analysis. These variables include the age at
course start, the cumulative credits earned, the degree count, and the total enrolled in
course.
Report
To report on the data, the analysis must be completed. For statistical testing, the
independent, or outcome variable for this study was the course delivery model. This
variable has two possible values, face-to-face and online. Two variables were used to
measure success in each course enrollment. The final grade variable and a reduced
version of the final grade that identified a course enrollment as successful or
unsuccessful. An enrollment was identified as successful if the course enrollment resulted
in a letter grade of an A, B, or C. Letter grades of D or F, as well as withdrawals, were

53
labeled as unsuccessful course completion. All other variables were considered
dependent, or predictor variables.
An initial analysis of the cleaned data was completed using descriptive statistics.
This analysis provided an overall picture of the students who enroll in either online or
face-to-face courses. The categorical variables were interpreted using percentages and
graphs to describe the distribution of the population, while numerical data was described
by reporting on the mean and standard deviation.
As can be observed in Figure 1, the reporting phase involved completing a
detailed data visualization followed by a multivariate analysis involving a comprehensive
set of correlational tests to identify which demographic, academic, and course related
factors were related to student success in either online or face-to-face course enrollments.
The correlation analysis was followed by a logistic regression analysis to create reports
for the predict phase of the learning analytics process.
Predict
The results of the various analyses were used to create a prediction model. A
comprehensive set of correlational tests were used to identify which academic and
demographic factors were most closely associated with student success in either online or
face-to-face course enrollments. The correlation tests were followed by a series of
logistic regression analyses. These results were used to create figures and tables for the
predict phase of the learning analytics process. The model highlights the likelihood of
success for various on-campus students in either online or face-to-face courses.

54
As part of the predict step, the results were used to identify a specific area with
significantly different data. Concurrently enrolled students, those who are simultaneously
both high school and college students, were identified as this group.
Act
The act step of this study involved creating recommendations for university
personnel on student enrollment strategies, and for instructional designers working with
instructors to create both online and face-to-face courses. These recommendations relate
back to the data analyzed and current research. Additionally, the recommendations for
action include suggestions for further research.
Refine
The refine step of this methodology includes the further analysis of the courses
taken as concurrent enrollment courses that were included in this study. Through the
refinement process, the reduced dataset was analyzed in an attempt to identify reasons for
the variations in final grades for students in courses taken for both high school and
college credit.

55
CHAPTER 4: DATA ANALYSIS AND RESULTS
Introduction
The purpose of this study was to identify what types of students were more
successful face-to-face and what types were more successful online. Correlations were
used to identify trends for students based on a number of demographic, academic, and
course related factors. Then logistic regression tests were completed to identify predictive
models for student success. This chapter reports the findings from the quantitative data
analysis. The results presented in this chapter are organized into sections on
demographics of the study population, the courses addressed in the study, and the
enrollment details. The next section reports on the details of the various statistical tests
completed as part of this study. The individual research questions will be addressed in
Chapter 5 as part of the discussion and conclusions of the study.
Demographics
The study population was determined based on the enrollment choices made by
students. It included all students who were actively enrolled in a 100 or 200 level course
that was offered in both online and face-to-face formats during all semesters between Fall
2013 and Summer 2015. An actively enrolled student is defined as one who has not
dropped the course by the drop date for the term, typically the tenth day of the semester.
Overall
Of the entire student population studied (N = 23,836), 87.6% students (N =
20,875) opted to take a face-to-face course during the study time frame, while only

56
46.5% of the students (N = 11,076) chose to take a course online. These numbers make it
clear that many students are enrolled in a combination of face-to-face and online courses.
Of the students, 53.5% (N = 12,760) opted to enroll exclusively in the more traditional
face-to-face courses that were included in this study, although there is a possibility they
were enrolled in online courses that were excluded from the study. Additionally, 12.4%
of the students (N = 2,961) were enrolled in only online courses. The number of students
who chose to enroll in a mix of face-to-face and online courses was 34.0% (N = 8,115).
Gender
The distribution of students at the university as a whole by gender is split such
that 54% of students were female and 45% were male, with approximately 1% opting not
to disclose their gender (Office of Communications and Marketing, 2014). Students who
opted not to report their gender were omitted from this study. The students in the study
population used for this study had a slightly lower percentage of females (52.8%) and a
higher percentage of males (47.2%), as compared to the university as a whole. As
displayed in Table 3, the gender in the face-to-face courses has a shift from the entire
population, with fewer females (51.7%) as compared to males (48.3%). A much higher
percentage of females (58.2%) opted to enroll in online courses as compared to the
number of males (41.8%).
Table 3 Gender of Students by Course Modality
Gender
Study Population Face-to-face Online
N Percent N Percent N Percent
Female 12,583 52.8% 10,783 51.7% 6,442 58.2%
Male 11,253 47.2% 10,092 48.3% 4,634 41.8%
Total 23,836 100.0% 20,875 100.0% 11,076 100.0%
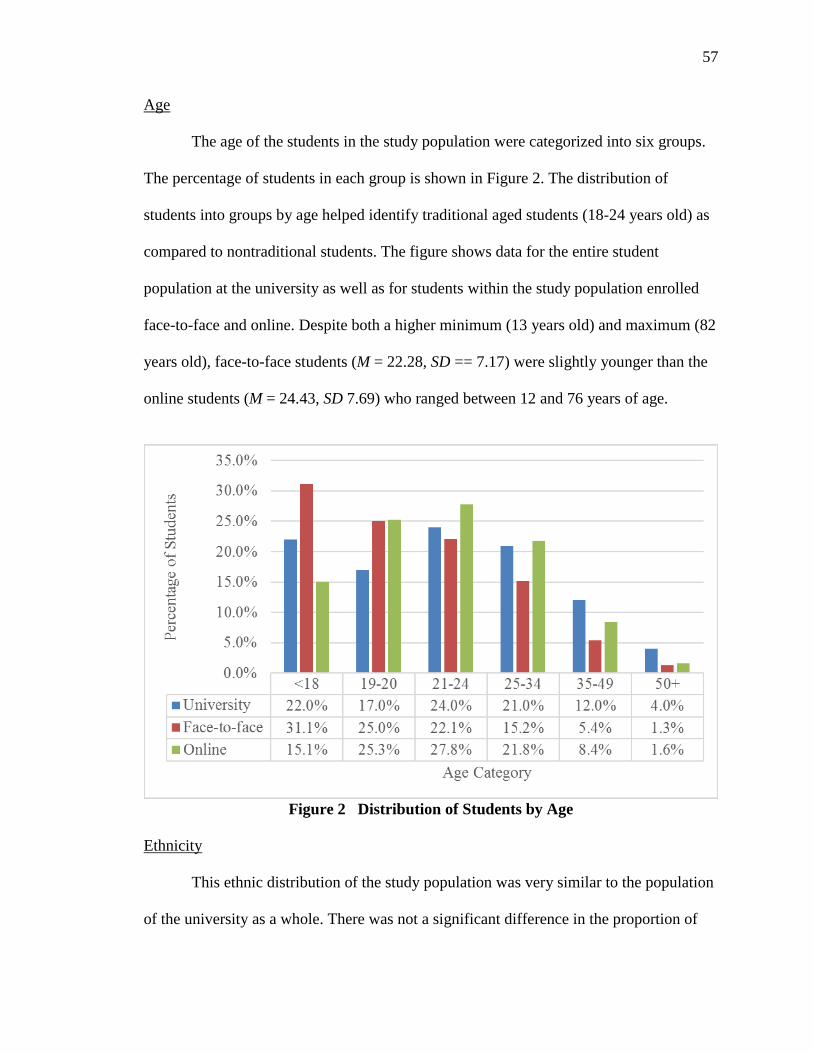
57
Age
The age of the students in the study population were categorized into six groups.
The percentage of students in each group is shown in Figure 2. The distribution of
students into groups by age helped identify traditional aged students (18-24 years old) as
compared to nontraditional students. The figure shows data for the entire student
population at the university as well as for students within the study population enrolled
face-to-face and online. Despite both a higher minimum (13 years old) and maximum (82
years old), face-to-face students (M = 22.28, SD == 7.17) were slightly younger than the
online students (M = 24.43, SD 7.69) who ranged between 12 and 76 years of age.
Figure 2 Distribution of Students by Age
Ethnicity
This ethnic distribution of the study population was very similar to the population
of the university as a whole. There was not a significant difference in the proportion of

58
different ethnic groups between the online and face-to-face student groups. Table 4
provides a breakdown of the ethnic groups for the study population as a whole, those
enrolled in the face-to-face courses that were part of this study, and those enrolled in the
online courses.
First Generation Students
In fall of 2014, the university began to collect data as to whether or not students
were a first generation college student. Since the data for this study spans the semesters
between Fall 2013 and Summer 2015, this data exists for some, but not all students (N =
12,577). Of these students, 44.9% (N = 5,652) are first generation university level
students. The majority of the first generation college students, 54.7% (N = 3,089), chose
to attend exclusively face-to-face courses, while 9.5% (N = 535) selected only online
courses, and 35.9% (N = 2,028) opted for a combination of course delivery modes. Table
5 displays the distribution of the set of known first generation students by gender,
Table 4 Ethnicity of Students by Course Modality
Ethnicity
Study Population Face-to-face Online
N % N % N %
American Indian/Alaskan Native 147 0.6% 130 0.6% 68 0.6%
Asian 591 2.5% 528 2.5% 286 2.6%
Black/African American 376 1.6% 339 1.6% 199 1.8%
Caucasian/White 18,064 75.8% 15,626 74.9% 8,516 76.9%
Hispanic/Latino 2,487 10.4% 2,246 10.8% 1,046 9.4%
Native Hawaiian/Pacific Islander 90 0.4% 81 0.4% 45 0.4%
Two or more races 924 3.9% 859 4.1% 409 3.7%
Not Reported 1,157 4.9% 1,066 5.1% 507 4.6%

59
ethnicity, and age. There is a slightly higher percentage of females that are first
generation students as compared to the population used in this study or for the university
as a whole. Additionally, the ethnic distribution of first generation students shifts
somewhat from the student population as a whole. There is a higher percentage of
Hispanics in the group of first generation students. To account for this shift, there is a
lower percentage of whites in the first generation group, as well as fewer Asians. A
Table 5 First Generation Student Demographics
N % of First Generation
Population
Gender
Female 3,159 55.9%
Male 2,493 44.1%
Ethnicity
American Indian/Alaskan Native 37 0.7%
Asian 119 2.1%
Black/African American 110 2.0%
Caucasian/White 4,043 71.5%
Hispanic/Latino 913 16.1%
Native Hawaiian/Pacific Islander 22 0.4%
Two or more races 277 4.9%
Not Reported 131 2.3%
Age
≤ 18 1,716 30.4%
19-20 1,314 23.2%
21-24 1,019 18.0%
25-34 1,029 18.2%
35-49 450 8.0%
50+ 124 2.2%

60
comparison of the spread of the ages of the first generation students was completed.
While there were some minor differences between the study population and this
subgroup, there were no noteworthy differences.
Residency
Data on residency was available for approximately 59% of the students included
in the study population (N = 14,073). A student identified as a resident established
residency in the state in which the university is located, and as a result was charged the
in-state tuition rate. Students identified as nonresidents were required to pay the higher
out-of-state tuition rates. Table 6 displays the residency status of students based on their
residency status. The distribution of students opting for face-to-face as opposed to online
courses or a combination of both face-to-face and online courses varies significantly
based on residency status. Students that are not residents of the state are much more
likely to take a mix of face-to-face and online courses.
Table 6 Residency Status of Students by Course Modality
Resident Non-Resident
N Percent N Percent
Face-to-face 7,130 63.7% 1,462 50.7%
Online 1,084 9.7% 140 4.9%
Both 2,977 26.6% 1,280 44.4%
Majors/Minors/Certificates
The students that were part of this study (N = 23,836) declared a large number of
degrees in the student information system (N = 35,443). When a student is ready to
graduate, they need to demonstrate they have met all the requirements for that particular
degree. The university allows students to declare majors, minors, and certificates.
Alternatively, students have the opportunity to complete classes without declaring a

61
degree. Table 7 displays the distribution of the different types of degrees identified in the
student information system. Students who have not yet identified a major were
distinguished from students taking courses of interest based on the understanding that at
some point they would identify a major and complete a degree. Minors and certificates
must be completed in conjunction with a major, although that major may be undeclared.
Students who took university level courses while still enrolled in high school were
identified as such in this field.
Table 7 Distribution of Degree Types Declared by Students in Study Population
N Percent
Majors 25,029 70.62%
High School - Undeclared 4,243 11.97%
Other
Minors 5,078 14.33%
Certificates 450 1.27%
Undeclared/Courses of Interest 643 1.81%
Total 35,443 100.00%
Table 8 Number of Degrees Declared by Student in Study Population
N Percent
1 15,945 66.89%
2 5,306 22.26%
3 1,789 7.51%
4 556 2.33%
5 169 0.71%
6 53 0.22%
7 14 0.06%
8 2 0.01%
9 2 0.01%

62
Table 8 displays the number of degrees declared by the students in the study
population. While most students declared a single major (66.89%), there were several
students who identified multiple degrees with the intention to complete the requirements
for each degree. The data did not allow the researcher to identify if students were
changing their choice in degree or were declaring an additional degree.
The most recently declared major was labeled as the primary major for each
student in the study population. Table 9 displays the distribution of primary major for the
students in the study population. The College of Arts and Sciences (COAS) was divided
to identify students declaring arts related majors as opposed to those in science and
mathematics (STEM) fields. There were an additional 737 students (3.09%) who had
taken a college level courses while in high school, but later declared a different major.
Table 9 College or School of Primary Major Declared by Students
N Percent
College of Innovation and Design (CID) 7 0.03%
College of Arts and Sciences (COAS) – Arts 4,960 19.68%
College of Arts and Sciences (COAS) – Science 2,376 9.97%
College of Business and Economics (COBE) 4,531 19.01%
College of Education (COED) 903 3.79%
College of Engineering (COEN) 2,424 10.17%
College of Health Sciences (COHS) 5,015 21.04%
School of Public Service (SPS) 1,804 7.57%
Undeclared – Courses of Interest 403 1.69%%
Undeclared – High School 1,683 7.06%
Total 23,836 100.00%

63
Courses
The students included in this study (N = 23,836) were enrolled in courses that were
offered in both online and face-to-face modalities during the time period between Fall
2013 and Summer 2015. Enrollments from 2,811 unique course sections were included in
the study. Table 10 shows the distribution of course sections across modalities and
semesters offered. During the fall and spring semester, face-to-face course sections
outnumber the online course sections. During the fall semester, face-to-face courses were
80% of the course offerings, that number fell in the spring semester to approximately
72%. The summer semester had a different proportion of face-to-face and online course
sections. In the summer terms included in this study, online sections made up 57% of the
course sections.
Table 10 Course Sections by Modality and Term
Semester Offered
FA13 SP14 SU14 FA14 SP15 SU15 Total Percent
Face-to-face 549 406 69 540 381 86 2,031 72%
Online 134 148 91 144 152 111 780 28%
Total 683 554 160 684 533 197 2,811 100%
The set of courses included in this study were offered by 29 of the 61 different
academic departments across the university. Many of the courses included in the study
are selected by students to meet the core graduation requirements, while others are
chosen by a more select audience as part of a specific program, to fulfill the requirements
of a major, minor, or certificate. The number of courses offered by each department in
each modality can be reviewed in Table 11.

64
Table 11 Courses Offered by Academic Department
Academic Department
Sections
Online Face-to-face Total
Academic Advising and Enhancement 9 19 28
College of Arts and Sciences 547 1,494 2,041
Anthropology 32 25 57
Art 22 20 42
Biology 64 87 151
Chemistry 15 40 55
Communications 1 1 2
English 152 424 576
Environmental Studies 9 22 31
Geography 6 4 10
History 49 83 132
Humanities 19 12 31
Mathematics 61 520 581
Philosophy 22 72 94
Psychology 10 45 55
Sociology 49 55 104
Theater Arts 26 41 67
World Languages 10 43 53
College of Business and Economics 51 129 180
Accountancy 4 13 17
Economics 19 53 72
Management 11 20 31
Marketing and Finance 17 43 60
College of Education 25 22 47
Educational Technology 17 16 33
Special Education 8 6 14
College of Engineering 13 11 24
College of Health Studies 82 102 184
Community and Environmental Health 75 54 129
Kinesiology 7 48 55
Foundational Studies 28 162 190

65
Academic Department
Sections
Online Face-to-face Online
School of Public Service 25 92 117
Criminal Justice 17 49 66
Political Science 8 43 51
Grand Total 780 2,031 2,811
Enrollments
The students in the study population represent 100,943 different course
enrollments throughout the two year, six semester time frame. Of the enrollments,
78.47% were in face-to-face courses (N = 79,213) as compared to 21.44% that were
completely online (N = 21, 730). The students enrolled in courses ranged from freshman
status to graduate students. The academic level is determined by the number of credits
earned by a student prior to the beginning of the term. The distribution of academic level
of students enrolled in the classes included in the study can be seen in Figure 3.
Figure 3 Academic Level of Students at Time of Enrollment

66
The academic load of the students that carried these enrollments included in this
study varied. The vast majority (83.5%) of the enrollments were for students enrolled
full-time at the university. The remaining enrollments were students enrolled on a part-
time basis (16.5%).
Grades Earned
Grades earned as a result of the courses completed for the entire study population
and for both course modalities are displayed in Figure 4. The mean grade point average
(GPA) for all course enrollments in the study population was M = 2.658 (SD = 1.372).
The GPA for only face-to-face enrollments (M = 2.653, SD = 1.352) was slightly lower,
while the online GPA (M = 2.676, SD = 1.445) was somewhat higher than that of the
population. In contrast, when reclassifying final grades as successful, a letter grade of C
Figure 4 Final Grades Earned in Courses Included in Study Population
A B C D F
Sample 35.6% 28.0% 17.2% 5.1% 14.1%
Face-to-Face 34.5% 28.6% 18.1% 5.4% 13.4%
Online 39.7% 25.5% 14.1% 4.2% 16.5%
0.0%
5.0%
10.0%
15.0%
20.0%
25.0%
30.0%
35.0%
40.0%
45.0%
Per
cent
of
Enro
llm
ents
Final Letter Grade

67
or higher, or unsuccessful, a D or lower, the results were different. There was a
significant difference in enrollment success based on course modality. The mean success
rate for face-to-face students (M = 0.812, SD = 0.391) was higher than the success rate
for online enrollments (M = 0.793 SD = 0.405).
A full comparison of GPAs by various demographic and academic characteristics
is shown in Table 12. A review of the table can be completed to identify which values for
the characteristics had higher final grade averages than their counterparts for each
variable in the population as a whole as well as for both the face-to-face and online
subsets.
Course Subjects
So far, the comparison of final grades and success have been focused on student
based factors, either demographic or academic. Another area that was found to be a
differentiating factor in the final grade and success in a course was the subject of the
course the student was enrolled in. The descriptive statistics for each of the
individual courses are listed in Table 13. Comparisons revealed a number of courses in
which students earned significantly higher grades than other courses. For the entire study
population, students enrolled in courses offered by the following departments had
significantly higher grades than the other departments: Academic Advising and
Enhancement, Kinesiology, Communications, Special Education, and Educational
Technology. This same list of classes differs when restricting to only face-to-face course
enrollments: Communications and Academic Advising and Enhancement. For online.

68
Table 12 Descriptive Statistics for Grade Value of Enrollments
Study Population Face-to-Face Online
Mean St Dev N Mean St Dev N Mean St Dev N
Enrollments 2.658 1.373 100,943 2.653 1.352 79,213 2.676 1.445 21,730
Demographic Variables
Gender
Female 2.752 1.348 53,965 2.771 1.315 40,557 2.694 1.440 13,408
Male 2.551 1.393 13,978 2.530 1.378 38,656 2.646 1.453 8,322
Ethnicity
American Indian/Alaska Native 2.408 1.484 611 2.362 1.462 472 2.561 1.552 139
Asian 2.897 1.323 2,528 2.874 1.326 2,017 2.990 1.307 511
Black/African American 2.386 1.390 1,853 2.392 1.362 1,427 2.364 1.483 426
Caucasian 2.682 1.371 74,946 2.681 1.350 58,167 2.685 1.444 16,779
Hispanic/Latino 2.570 1.358 10,965 2.566 1.343 8,978 2.585 1.426 1,987
Hawaiian/Pacific Islander 2.434 1.408 389 2.335 1.406 284 2.704 1.386 105
Two or More Races 2.555 1.401 4,530 2.547 1.383 3,643 2.589 1.470 887
Not Reported 2.625 1.362 5,121 2.593 1.334 4,225 2.779 1.479 896
Age Category
≤ 18 3.863 1.353 25,862 2.871 1.254 23,849 2.767 1.389 2,013
19-20 2.636 1.353 33,580 2.623 1.338 27,561 2.695 1.415 6,019
21-24 2.463 1.429 21,426 2.411 1.410 14,974 2.583 4.464 6,452
25-34 2.585 1.447 13,346 2.539 1.429 9,391 2.673 1.476 4,955
35-49 2.738 1.431 4,713 2.718 1.416 2,796 2.767 1.452 1,917
50 + 2.969 1.339 1,016 2.914 1.363 642 3.064 1.294 374

69
Study Population Face-to-Face Online
Mean St Dev N Mean St Dev N Mean St Dev N
First Generation
Reported First Generation 2.542 1.410 27,669 2.554 1.386 22,455 2.494 1.507 5,214
Reported Non-First Generation 2.745 1.352 35,636 2.742 1.335 29,929 2.758 1.442 5,707
Residency Status
Resident 2.626 1.402 44,587 2.631 1.383 36,841 2.603 1.491 7,672
Non-Resident 2.883 1.235 18,587 2.888 1.212 15,965 2.850 1.369 2,622
Academic Variables
Academic Level
Freshman 2.619 1.391 39,183 2.647 1.369 35,452 2.356 1.554 3,731
Sophomore 2.636 1.366 31,030 2.644 1.338 24,329 2.605 1.465 6,701
Junior 2.654 1.362 17,881 2.619 1.342 12,012 2.727 1.400 5,869
Senior 2.783 1.336 11,018 2.697 1.328 6,337 2.900 1.337 4,681
Graduate 3.171 1.258 1,831 3.209 1.220 1,083 3.118 1.311 748
Academic Load
Full-time 2.627 1.373 84,307 2.619 1.357 68,273 2.662 1.442 16,034
Part-time 2.816 1.358 16,636 2.867 1.305 10,940 2.717 1.453 5,696
Term of Enrollment
Fall 2.660 1.368 52,691 2.667 1.354 44,111 2.623 1.442 8,580
Spring 2.631 1.380 41,401 2.619 1.356 32,460 2.674 1.461 8,941
Summer 2.809 1.353 6,851 2.840 1.256 2,642 2.790 1.410 4,209

70
Study Population Face-to-Face Online
Mean St Dev N Mean St Dev N Mean St Dev N
Primary Major College
CID 2.818 1.352 44 2.906 1.304 32 2.583 1.505 12
COAS – Arts 2.598 1.384 21,566 2.618 1.355 16,519 2.532 1.472 5,047
COAS – Sciences 2.619 1.409 9,620 2.611 1.398 7,872 2.653 1.456 1,748
COBE 2.673 1.359 19,400 2.673 1.340 15,745 2.677 1.437 3,655
COED 2.731 1.371 3,285 2.729 1.336 2,382 2.735 1.460 903
COEN 2.561 1.417 10,726 2.511 1.412 8,653 2.767 1.419 2,073
COHS 2.716 1.355 25,269 2.693 1.336 2,382 2.783 1.422 6,318
SPS 2.611 1.332 6,647 2.619 1.304 5,235 2.583 1.730 1,412
Undeclared – Courses of Interest 2.157 1.526 1,699 2.054 1.508 1,306 2.499 1.537 393
Undeclared – High School Credit 3.363 0.862 2,687 3.387 0.828 2,518 3.006 1.213 169

71
Table 13 Descriptive Statistics for Grade Value by Course Subject
Study Population Face-to-Face Online
Rank Mean Std
Dev N Rank Mean
Std
Dev N Rank Mean
Std
Dev N
Academic Advising and
Enhancement 1 3.496 1.012 450 2 3.588 0.911 325 2 3.256 1.211 125
Accounting 11 2.965 1.428 482 9 3.091 1.365 372 19 2.536 1.554 110
Anthropology 23 2.573 1.335 2,767 22 2.636 1.277 1,878 22 2.439 1.441 889
Art 14 2.826 1.268 3,215 20 2.717 1.294 2,260 5 3.085 1.167 955
Biology 29 2.383 1.287 7,724 28 2.346 1.279 6,148 20 2.527 1.309 1,576
Business Communications 13 2.946 1.186 1,600 12 2.923 1.143 1,137 7 3.000 1.286 463
Chemistry 31 2.275 1.391 4,505 33 2.248 1.378 4,172 16 2.613 1.506 333
Chinese 22 2.607 1.466 178 16 2.796 1.324 137 30 1.976 1.739 41
Communications 3 3.294 1.359 17 1 3.846 0.554 13 33 1.500 1.732 4
Criminal Justice 28 2.424 1.269 2,565 27 2.432 1.267 2,151 24 2.382 1.279 414
Economics 21 2.617 1.336 4,460 21 2.707 1.304 3,933 31 1.945 1.383 527
Educational Technology 5 3.168 1.486 708 4 3.318 1.455 358 6 3.014 1.504 350
Engineering 7 3.063 1.374 1,366 32 2.256 1.295 355 1 3.346 1.286 1,011
English 9 3.030 1.320 11,699 7 3.110 1.278 9,034 12 2.761 1.421 2,665
Environmental Health 6 3.079 1.131 391 8 3.104 1.099 376 21 2.467 1.685 15
Environmental Studies 15 2.802 1.195 822 15 2.820 1.162 656 13 2.729 1.318 166

72
Study Population Face-to-Face Online
Rank Mean Std
Dev N Rank Mean
Std
Dev N Rank Mean
Std
Dev N
French 20 2.669 1.451 242 19 2.744 1.369 215 28 2.074 1.920 27
General Business 17 2.776 1.106 1,317 14 2.826 1.122 1,043 17 2.584 1.025 274
Geography 25 2.523 1.489 172 25 2.506 1.533 83 18 2.539 1.454 89
Health Studies 8 3.046 1.271 5,386 6 3.188 1.077 1,658 8 2.983 1.344 3,728
History 24 2.539 1.404 3,781 24 2.621 1.341 2,767 25 2.315 1.540 1,014
Humanities 18 2.727 1.421 714 13 2.856 1.293 285 15 2.641 1.495 429
Japanese 33 2.223 1.574 251 31 2.278 1.544 198 29 2.019 1.681 53
Kinesiology 2 3.343 0.982 1,223 3 3.364 0.961 1,085 4 3.174 1.120 138
Korean 26 2.500 1.743 52 23 2.625 1.705 40 27 2.083 1.881 12
Mathematics 32 2.265 1.423 18,168 29 2.313 1.404 16,048 32 1.899 1.507 2,120
Philosophy 27 2.429 1.420 2,777 26 2.502 1.393 2,187 26 2.159 1.487 590
Political Science 19 2.715 1.267 1,840 18 2.754 1.224 1,645 23 2.390 1.547 195
Psychology 30 2.336 1.393 5,251 30 2.310 1.392 4,890 14 2.681 1.363 361
Sociology 16 2.790 1.322 4,242 17 2.757 1.262 2,723 11 2.848 1.421 1,519
Special Education 4 3.241 1.087 502 5 3.243 1.049 272 3 3.239 1.133 230
Theater Arts 10 3.027 1.257 2,530 10 3.065 1.228 1,881 9 2.917 1.332 649
University Foundations 12 2.957 1.298 9,546 11 2.965 1.284 8,888 10 2.853 1.471 658
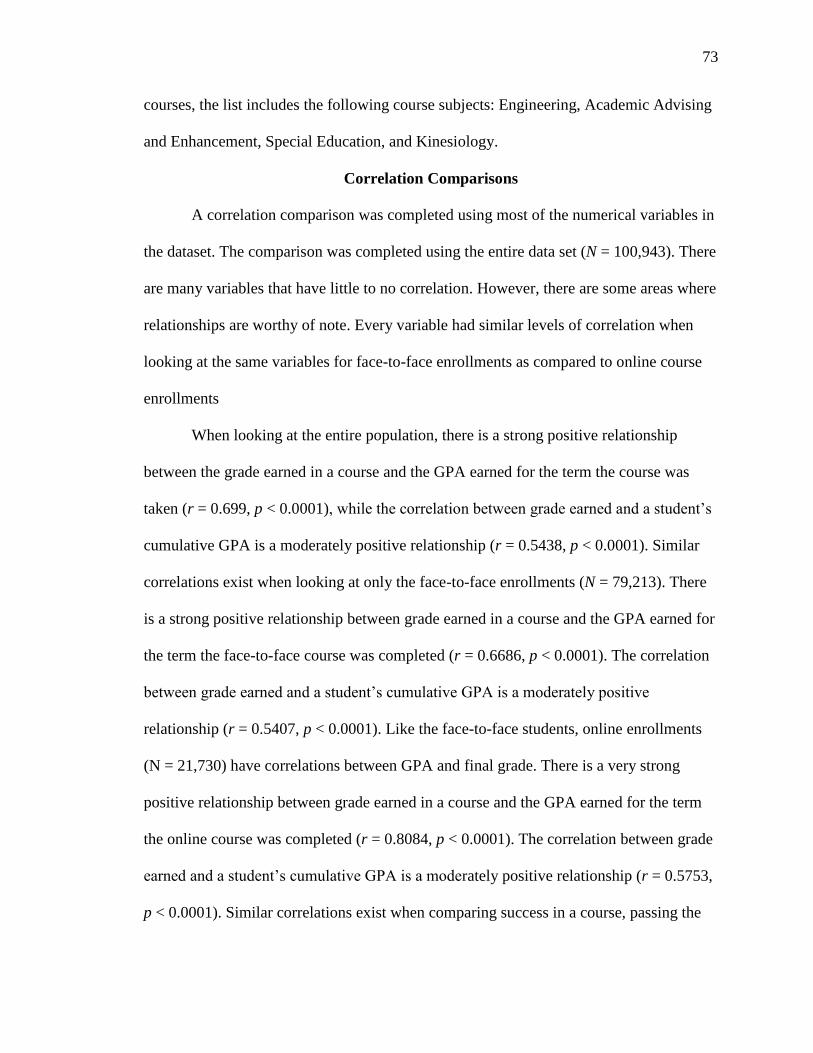
73
courses, the list includes the following course subjects: Engineering, Academic Advising
and Enhancement, Special Education, and Kinesiology.
Correlation Comparisons
A correlation comparison was completed using most of the numerical variables in
the dataset. The comparison was completed using the entire data set (N = 100,943). There
are many variables that have little to no correlation. However, there are some areas where
relationships are worthy of note. Every variable had similar levels of correlation when
looking at the same variables for face-to-face enrollments as compared to online course
enrollments
When looking at the entire population, there is a strong positive relationship
between the grade earned in a course and the GPA earned for the term the course was
taken (r = 0.699, p < 0.0001), while the correlation between grade earned and a student’s
cumulative GPA is a moderately positive relationship (r = 0.5438, p < 0.0001). Similar
correlations exist when looking at only the face-to-face enrollments (N = 79,213). There
is a strong positive relationship between grade earned in a course and the GPA earned for
the term the face-to-face course was completed (r = 0.6686, p < 0.0001). The correlation
between grade earned and a student’s cumulative GPA is a moderately positive
relationship (r = 0.5407, p < 0.0001). Like the face-to-face students, online enrollments
(N = 21,730) have correlations between GPA and final grade. There is a very strong
positive relationship between grade earned in a course and the GPA earned for the term
the online course was completed (r = 0.8084, p < 0.0001). The correlation between grade
earned and a student’s cumulative GPA is a moderately positive relationship (r = 0.5753,
p < 0.0001). Similar correlations exist when comparing success in a course, passing the
74
course with a C or better, and both term and cumulative GPAs. These relationships are
for the study population as a whole in addition to both the face-to-face and online
enrollments.
Another area in which positive correlations exist is between the age of a student at
the time of enrollment and their academic level. The study population (r = 0.4673, p <
0.0001) and both the face-to-face (r = 0.4672, p < 0.0001) and online (r = 0.4676, p <
0.0001) groups have moderate positive relationships between the academic level and the
age of the students. This meaning the older a student is at the time of enrollment they are
more likely to be an upperclassman.
There are weak positive relationships between the various ACT test scores and
GPA, both for the term of enrollment and for the cumulative GPA. There are varying
levels of positive correlations between the various ACT exams scores, with the strongest
correlations being the relationship between the component tests and the composite score.
There are weak negative relationships between the various ACT test, math, verbal,
written, and composite scores and a student’s age.
Logistic Regression Results
To address the first three research questions, logistic regression tests were
conducted to investigate the extent to which various demographic, academic, and course
related factors can be used to predict success. These analyses were completed for the
entire study population as well as for the face-to-face and online subsets. For each group,
the entire study population, the face-to-face enrollments, and the online enrollments,
there were a series of four different logistic regression models created in the process of
identifying the best model for predicting success. Separate logistic regression models

75
were created for demographic variables, academic variables, and course variables to
identify if one area had a larger influence than the others prior to creating a full model
using all the variables. As part of the process of identifying the best prediction model,
different selection models were used including forward selection, backward elimination,
and stepwise selection as well as the full fitted model with no selection. The full fitted
model provided the greatest accuracy of prediction for all data sets.
Demographic Variables
The first model was limited to demographic variables. For this model, the
Nagelkerke R2 estimate reflects the variability of success that can be attributed to the
variables included in the logistic regression model. The combination of demographic
variables used in the model accounts for a 2.91% influence on the likelihood of success
(R2 = 0.0291). Because the model explains such a low percentage of the likelihood of
success, the model was only an accurate predictor 59.17% of the time, based on the area
under the curve (ROC Curve Model). Demographic variables accounted for a slightly
higher amount of the likelihood of success for the face-to-face enrollments, 3.19%. Based
on the ROC Curve Model, demographic variables were accurate in predicting face-to-
face success 59.83% of the time. The demographic variables accounted for 2.26% of the
likelihood of success for online enrollments based on the Nagelkerke R2 estimate, a lower
percentage than the face-to-face subset. As a result, demographic variables were accurate
in predicting success only 57.99% of the time for online enrollments based on the ROC
Curve Model. A summary of the logistic regression model for demographic variables can
be reviewed in Table 14.

76
Academic Variables
A separate model was created to evaluate the effect of academic variables on
success in courses. The Nagelkerke R2 estimate showed that academic variables
accounted for 31.97% of the likelihood of success across the study population, and the
area under the curve indicated the model was accurate in predicting success 82.66% of
the time. For the face-to-face enrollments, the academic variables explained 33.10% of
Table 14 Logistic Regression Summary for Subset Models
Model Variables Demographic Academic Course
Full Study Population
X2 1,051.1858 22,324.5119 2,416.9195
N 57,397 100,943 100,943
Significance p < 0.0001 p < 0.0001 p < 0.0001
Degrees of Freedom 11 21 14
Nagelkerke’s Pseudo R2 0.0291 0.3179 0.0379
Area Under ROC Curve 0.5917 0.8266 0.6110
Face-to-Face
X2 954.7563 18,187.6186 2,318.5826
N 48,117 79,213 79,213
Significance p < 0.0001 p < 0.0001 p < 0.0001
Degrees of Freedom 11 21 14
Nagelkerke’s Pseudo R2 0.0319 0.3310 0.0482
Area Under ROC Curve 0.5983 0.8306 0.6242
Online
X2 138.1273 5,287.4567 543.4994
N 9,280 21,730 21,730
Significance p < 0.0001 p < 0.0001 p < 0.0001
Degrees of Freedom 11 21 14
Nagelkerke’s Pseudo R2 0.0226 0.3377 0.0386
Area Under ROC Curve 0.05799 0.82.53 0.6127

77
the variability in the likelihood of success, based on the Nagelkerke’s R2 estimate, and the
ROC Curve Model indicated academic variables were an accurate as a predictor for
83.06% of the face-to-face dataset. For online enrollments, academic variables represent
33.77% of the variability in the likelihood of success. This model is accurate in predicting
student success 82.53% of the time, based on the ROC Curve Model. By far the most
significant variable in this model was the cumulative GPA. The term GPA was omitted
from this and all other logistic regression models because of the collinearity with the
target variable.
Course Variables
This model evaluated variables specifically related to the course a student took.
The Nagelkerke’s R2 estimate indicated that course related variables influenced 3.79% of
the likelihood of success. When the course variables were used as a prediction model for
the study population the area under the curve showed the model was accurate 61.10% of
the time. The course related variables were also statistically significant for face-to-face
course enrollments. The face-to-face accounted for a slightly higher percentage of the
effect on student success 4.82% based on Nagelkerke’s estimate. The ROC Curve Model
identified this model was accurate in predicting success 62.03% of the time. For online
enrollments, course related variables accounted for 3.86% of the variability in the success
for online course enrollments according to Nagelkerke’s R2 estimate. When used to
predict success, the area under the curve was accurate in identifying successful online
students 61.27% of the time.

78
Full Prediction Model
While each of the models described above addresses some aspects of the
predictors of success for students, the full model includes all variables that showed
significance through the correlation analysis. Table 14 shows the relative level of
predictability for each set of variables, but the full model was found to be the most
significant predictor.
The test of the full model, was statistically significant for the study population,
X2(46, N = 57,397) = 18,202.7063, p < 0.0001. The Nagelkerke R2 estimate indicated the
combination of variables used in the final model account for a 42.13% influence on the
likelihood of success. According to the ROC Curve Model, this model correctly predicted
success for 86.74% of the students in the study population, with a sensitivity of 94.5%
and a specificity of 45.3%.
To illustrate the predictive nature of the logistic regression, the logistic model can
be written in the form of a mathematical equation. This equation is most often presented
as a logit equation that is in the form of Equation 1 where Y is the dependent variable of
the logistic regression, P is the probability of the desired outcome, and and are the
coefficients of the regression model (Peng, Lee, & Ingersoll, 2002). Equation 1 can be
manipulated to represent the probability of the desired outcome, or in the case of this
study, the probability of success. The probability equation is shown in Equation 2.
Logit(Y) = ln(odds) = ln (𝑃
1−𝑃) = 𝛼 + 𝛽1𝑥1 + 𝛽2𝑥2 +⋯+ 𝛽𝑛𝑥𝑛 (1)
𝑃(𝑌) =𝑒𝛼+𝛽1𝑥1+𝛽2𝑥2+⋯+𝛽𝑛𝑥𝑛
1+𝑒𝛼+𝛽1𝑥1+𝛽2𝑥2+⋯+𝛽𝑛𝑥𝑛 (2)

79
Equation 3 shows the full model for the study population. The equation contains
categorical variables and continuous variables. For the continuous variables in the
equation, if the variable is true, then the coefficient is included in the equation, but if the
variable value is false, the variable is equal to zero, and as a result, the coefficient is
eliminated from the equation. For continuous variables, the numeric value is substituted
in for the variable. Variables that were not significant (p < 0.05) were not included in the
logit equation.
Logit(Success Study Population) = – 0.0478 (Full-time Status) + 0.8039 (AAE Course)
– 0.2046 (COAS-Arts Course – 0.7745 (COAS-Science Course) – 0.2259 (COBE
Course) + 0.3568 (COEN Course) + 0.2631 (COHS Course) + 0.1618 (FS
Course) – 2.559 (Cumulative Credits Earned) + 1.9069 (Cumulative GPA) +
0.4619 (Degree Count) – 1.1156 (Bachelor Degree Type) + 2.9707 (HS Credit
Degree Type) + 0.1371 (Hispanic Ethnicity) + 0.1030 (Not First Generation) –
0.2576 (Course Section Not Full) – 0.1899 (2 Credit Course) + 0.1296 (3 Credit
Course) + 0.0948 (Nonresident Status) – 0.0676 (Term Credits Attempted) +
0.3096 (Fall Enrollment) + 0.0544 (Spring Enrollment) – 0.3692 (Total Course
Enrollment) (3)
For the face-to-face enrollments, the logistic regression was statistically
significant for the full model, X2(46, N = 48,117) = 15,194.5884, p < 0.0001. The
variables included in the model explained 43.92% of the variability in the likelihood of

80
success and was accurate as a predictor for 87.43% of the face-to-face data subset. The
equation that represents the face-to-face logit model is displayed in Equation 4.
Logit(Success Face-to-Face ) = – 0.6267 – 0.0450 (Full-time Status) + 0.0517 (100
Level Course) + 1.4781 (AAE Course) – 0.2835 (COAS-Arts Course) – 0.8864
(COAS-Science Course) – 1.0227 (COEN Course) + 1.1024 (COHS Course) –
2.6963 (Cumulative Credits Earned) + 1.9502 (Cumulative GPA) + 0.45592
(Degree Count) – 0.8936 (Bachelor Degree Type) + 2.6152 (HS Credit Degree
Type) + 0.1164 (Hispanic Ethnicity) – 0.0450 (No Race Reported) + 0.0900 (Not
First Generation) – 0.2737 (Course Section Not Full) – 0.1915 (COAS-Science
Major) – 0.4258 (1 Credit Course) + 0.2242 (3 Credit Course) + 0.1135
(Nonresident Status) – 0.0920 (Term Credits Attempted) + 0.2654 (Fall
Enrollment) – 0.5011 (Total Course Enrollment) (4)
The model was statistically significant for online enrollments, X2(46, N = 9,280) =
3071.1300, p < 0.0001. The Nagelkerke R2 estimate indicated that the variables included
in the model represent 43.16% of the variability in the likelihood of success. This model
is accurate in predicting student success 85.95% of the time based on the ROC Curve
Model. Equation 5 shows the relationship between the significant variables and the
coefficients for the model to predict online success.
Logit(Success Online ) = – 2.3066 – 0.8496 (COAS-Science Course) – 0.5257
(COBE Course) + 1.0473 (COEN Course) + 2.1530 (Cumulative GPA) – 0.6119

81
(Degree Count) – 1.9378 (Bachelor Degree Type) + 4.2345 (HS Credit Degree
Type) + 0.0917 (Not First Generation) – 0.1997 (Course Section Not Full) –
0.0721 (Female) + 0.3317 (COBE Major) – 0.4970 (2 Credit Course) – 0.1058
(Spring Enrollment) (5)
Another way to look at the significance of the variables is with the odds ratio. The
odds ratio is calculated as the ratio of success for the given value of a variable as
compared to the base value. For example, more students in the study population were
sophomores than any other academic level, so sophomores were considered the base
value and all other academic levels were compared to them in determining their relative
likelihood of success. As can be seen in Table 15, a freshman is 0.934 times as likely to
be successful in a course as compared to a sophomore when not discriminating between
face-to-face and online enrollments. That means that a freshman is somewhat less likely
to successfully complete their course as compared to a sophomore. Similarly, a student
enrolled in an AAE course is 2.508 times more likely to successfully complete their
course as compared to a student in an SPS course. For numeric variables, each unit of
increase in the odds ratio is associated with one unit of increase in the given variable. For
example, looking at the cumulative GPA, a student is 6.732 times more likely to be
successful for each additional full point increase in their cumulative GPA. While this
information is valuable, only some of the variables were identified as significant when
calculating the logistic regression for the model.

82
Table 15 Full Logistic Regression Models for Success
Variable Study Population Face-to-face Online
Est. () Odds Ratio Est. () Odds Ratio Est. () Odds Ratio
X2 17,477.9518 15,194.5884 3,0071.1300
N 57,397 48,117 9,280
Significance p < 0.0001 p < 0.0001 p < 0.0001
Degrees of Freedom 46 46 46
Cox and Snell R2 0.2625 0.2708 0.2818
Nagelkerke’s Pseudo R2 0.4213 0.4392 0.4316
Area Under ROC Curve 0.8674 0.8743 0.8595
Intercept 0.2434 -0.6267 * -2.3066 **
Academic Level
Freshman -0.0432 0.934 -0.0539 0.896 0.0303 1.146
Junior 0.0187 0.994 0.0178 0.963 0.0306 1.146
Senior 0.0304 1.006 0.0291 0.973 0.0268 1.142
Graduate -0.0303 0.947 -0.0490 0.900 0.0179 1.131
Base = Sophomore
Academic Load
Full-time -0.0478 * 0.909 0.0450 * 0.914 -0.0641 0.880
Base = Part-time
Significance Levels: * p < 0.05, ** p < 0.01, *** p < 0.0001
† Variable was transformed for calculation.

83
Variable Study Population Face-to-face Online
Est. () Odds Ratio Est. () Odds Ratio Est. () Odds Ratio
Age at Course Start † -0.1116 0.894 -0.4202 0.657 0.9673 2.631
Course Level
100 0.0247 1.051 0.0517 * 1.109 0.0396 1.082
Base = 200
College Offering Course
AAE 0.8039 * 2.508 1.4781 * 5.585 0.3170 1.480
COAS – Arts -0.2046 ** 0.915 -0.2835 ** 0.959 0.0700 1.156
COAS – Science -0.7745 *** 0.517 -0.8864 *** 0.525 -0.8496 *** 0.461
COBE -0.2259 ** 0.896 -0.1578 1.088 -0.5257 ** 0.637
COEN 0.3568 * 1.604 -1.0227 *** 0.458 1.0473 *** 3.072
COED -0.2649 0.861 -0.1153 1.135 -0.0479 1.027
COHS 0.2631 ** 1.461 1.1024 *** 3.836 -0.0159 1.061
FS 0.1618 * 1.320 0.1271 1.446 0.0797 1.167
Base = SPS
Cumulative Credits Earned † -2.5590 *** 0.077 -2.6963 *** 0.067 -0.2623 0.769
Cumulative GPA † 1.9069 *** 6.732 1.9502 *** 7.030 2.1530 *** 8.611
Degree Count † 0.4619 *** 1.587 0.5592 *** 1.749 -0.6119 ** 0.542
Significance Levels: * p < 0.05, ** p < 0.01, *** p < 0.0001
† Variable was transformed for calculation.

84
Variable Study Population Face-to-face Online
Est. () Odds Ratio Est. () Odds Ratio Est. () Odds Ratio
Degree Type
Bachelor -1.1156 *** 2.095 -0.8936 ** 2.289 -1.9378 ** 1.432
HS Credit 2.9707 *** 124.687 2.6152 *** 76.465 4.2345 ** 686.281
Base = Other
Ethnicity
American Indian/Alaskan -0.1793 0.783 -0.2059 0.738 0.0564 1.053
Asian 0.1662 1.106 0.1198 1.022 0.3620 1.429
Black -0.0988 0.848 -0.0178 0.890 -0.1491 0.857
Hispanic 0.1373 ** 1.074 0.1164 * 1.018 0.1805 1.192
Pacific Islander -0.1570 0.800 -0.1769 0.759 -0.0827 0.916
Two or More Races 0.0691 1.003 0.1370 1.039 -0.2217 0.856
No Race Reported 0.0031 0.934 -0.0450 * 0.844 -0.1506 0.797
Base = Caucasian
First Generation Status
No 0.1030 *** 1.229 0.0900 *** 1.197 0.0917 ** 1.201
Base = Yes
Full Course Section
No -0.2576 *** 0.597 -0.2737 *** 0.578 -0.1997 *** 0.671
Base = Yes
Significance Levels: * p < 0.05, ** p < 0.01, *** p < 0.0001
† Variable was transformed for calculation.

85
Variable Study Population Face-to-face Online
Est. () Odds Ratio Est. () Odds Ratio Est. () Odds Ratio
Gender
Female -0.0225 0.956 0.0128 1.026 -0.0721 * 0.866
Base = Male
Primary Major College
CID -0.2783 0.484 -0.4210 0.429 0.9540 1.134
COAS – Arts -0.0661 0.599 -0.1101 0.586 0.1524 0.509
COAS – Sciences -0.1203 0.567 -0.1915 * 0.540 0.2113 0.540
COBE 0.0275 0.657 -0.0182 0.642 0.3317 * 0.609
COEN -0.0658 0.599 -0.1118 0.585 0.2714 0.573
COED -0.0824 0.589 -0.1264 0.576 0.1537 0.509
COHS -0.0515 0.608 -0.0785 0.605 0.2574 0.565
HS Credit 0.1902 0.774 0.6331 1.232 -3.1602 0.019
Base = Undeclared
Number of Credits
1.0 -0.0852 0.794 -0.4258 * 0.502 0.4637 1.474
2.0 -0.1899 * 0.715 -0.0609 0.724 -0.4970 ** 0.564
3.0 0.1296 * 0.984 0.2242 ** 0.963 -0.0421 0.889
Base = 4.0
Significance Levels: * p < 0.05, ** p < 0.01, *** p < 0.0001
† Variable was transformed for calculation.

86
Variable Study Population Face-to-face Online
Est. () Odds Ratio Est. () Odds Ratio Est. () Odds Ratio
Residency Status
Nonresident 0.0948 *** 1.209 0.1135 *** 1.255 0.0296 1.061
Base = Resident
Term Credits Attempted -0.0676 *** 0.935 -0.0920 *** 0.912 0.0019 1.002
Term of Enrollment
Fall 0.6096 *** 1.961 0.2654 *** 1.740 -0.0586 0.800
Spring 0.0544 * 1.520 0.0231 1.366 -0.1058 * 0.763
Base = Summer
Total Enrolled (Class Size) † -0.3692 *** 0.691 -0.5011 *** 0.606 0.0836 1.087
Significance Levels: * p < 0.05, ** p < 0.01, *** p < 0.0001
† Variable was transformed for calculation.

87
Research Question 4 – Further Analysis
During the logistic regression analysis, the courses taken by students that were
also enrolled in high school stood out as significantly different than other course
enrollments. These enrollments were identified as the area in need of further analysis.
The odds ratio for students with high school as their degree type were 124.687 times
more likely to be successful as compared to post-secondary students. The odds fell
somewhat for the face-to-face enrollments with the odds of successful completion being
76.465 times that of students who were working toward a non-bachelor’s degree. In the
online enrollments, the odds were the most significant with the odds being 686.281 times
that of the students who listed other as their degree type. Table 16 shows the distribution
of concurrent enrollments students within several of the key factors.
The mean final grade for all students with high school credit as their declared
major in the study population was M = 3.363 (SD = 0.862). A one-way analysis of
variance (ANOVA) test was completed to compare the final grade for concurrently
enrolled high school students to students who had completed high school. There was a
significant difference in final grade based on high school as a primary major, F(1,
100,941) = 732.54, p < 0.0001. Post hoc comparisons using Tukey’s HSD test indicated
that the mean final grade for students who have completed high school (M = 2.639, SD =
1.379) was significantly lower than the final grade (GPA) for concurrently enrolled
students in the study population.
The concurrent student GPA for only face-to-face enrollments (M = 3.387, SD =
0.828) was slightly higher, while the online GPA (M = 3.006, SD = 1.213) was somewhat
lower than that of the study population. An (ANOVA) test was completed on final grade

88
within the course modality subsets. There was a significant difference in final grade
based on high school enrollment status for face-to-face course enrollments, F(1, 79,213)
= 772.71, p < 0.0001. Post hoc comparisons using Tukey’s HSD test indicated that the
mean final grade for students who have completed high school (M = 2.639, SD = 1.359)
was significantly lower than the mean final grade for concurrently enrolled students in
Table 16 Distribution Statistics for Concurrent Enrollments Students
Study Population Face-to-face Online
Total Enrollments (N) 2,687 2,518 169
Ethnicity
American Indian 0.33% 0.32% 0.59%
Asian 1.79% 1.83% 1.18%
Black 0.89% 0.91% 0.59%
Caucasian 79.87% 79.47% 85.80%
Hispanic 9.94% 10.13% 7.10%
Pacific Islander 0.22% 0.24% 0.00%
Two or More Races 4.39% 2.62% 2.96%
No Race Reported 2.57% 4.49% 1.78%
Gender
Female 61.85% 61.56% 66.27%
Male 38.15% 38.44% 33.73%
College Offering Course
AAE 4.84% 3.73% 21.30%
COAS - Arts 31.93% 29.31% 71.01%
COAS - Sciences 34.87% 36.78% 6.51%
COBE 7.74% 8.26% 0.00%
COED 0.04% 0.04% 0.00%
COEN 0.15% 0.12% 0.59%
COHS 9.86% 10.48% 0.59%
FS 0.41% 0.44% 0.00%
SPS 10.16% 10.84% 0.00%
Final Grade
A 55.2% 55.6% 47.9%
B 31.0% 31.5% 23.7%
C 10.5% 10.1% 16.0%
D 1.7% 1.4% 5.9%
F 1.7% 1.4% 6.5%
Average 3.363 3.387 3.006
Standard Deviation 0.862 0.862 0.859
Success Rate 96.65% 97.26% 87.57%

89
the face-to-face enrollments. Additionally, there was a significant difference in final
grade based on high school enrollment status for online course enrollments,
F(1, 21,730) = 8.86, p = 0.0029. Post hoc comparisons using Tukey’s HSD test indicated
that the mean final grade for students who have completed high school (M = 2.674, SD =
1.446) was significantly lower than the GPA for concurrently enrolled students in the
online subset.
Summary of Analysis
The analysis of data for this study was completed to build evidence to answer the
four research questions. The demographic and academic details of the students, the nature
of the courses, and information about the enrollments, including the grades earned, were
described first.
In an attempt to identify relationships between variables or groups of students, a
correlation comparison was completed across multiple variables within the entire study
population as well as within the face-to-face and online subsets. To create a prediction
model, a logistic regression analysis was completed for the study population as a whole,
as well as for both the face-to-face and online subsets.
The next chapter will address each of the research questions and include
interpretations of the analysis provided in this chapter. The information on the students,
the courses, and the enrollments will be used to provide context for the discussion and
interpretation.

90
CHAPTER 5: DISCUSSION AND CONCLUSIONS
Introduction
The purpose of this study was to identify which demographic, academic, and
course related characteristics are most closely related to successful completion of 100 and
200 level courses in both face-to-face and online formats. This chapter will discuss the
results of the analysis and make connections between the literature and the findings from
the data collected for this study. It will also include suggestions for further research, the
significance of the findings, and how the findings can be used.
The following research questions will be used to provide focus for the discussion
and make connections between the various analyses described in the previous chapter:
1. Which are important predictors from student characteristics that lead to
successful completion of 100 and 200 level classes taken online, as measured
by final grade?
2. Which are important predictors from student characteristics that lead to
successful completion of 100 and 200 level classes taken face-to-face, as
measured by final grade?
3. What predictors are common or differ between online and face-to-face
settings?
4. Which academic departments or individual courses can be identified as
significant and in need of further analysis?

91
Demographics and Courses
The demographics of the population used in this study were comparable to the
population of the university. Male students appeared to have a preference for face-to-face
course enrollments as the percentage of males enrolled in online courses was significantly
lower than in the face-to-face courses. There were also differences in enrollments based
on age. Based on the data, younger, traditional students appeared to prefer face-to-face
courses when given an option. In contrast, there were more students in the older age
groups enrolled in online courses. This could be related to the many other competing
priorities nontraditional students must balance, including employment and care for
dependents (Ewert, 2010; Watt & Wagner, 2016), as opposed to a genuine course
modality preference.
The courses included in this study were limited to the 100 and 200 level courses
that were offered in both online and face-to-face formats during the two-year period from
Fall 2013 through Summer 2015. As can be observed in Table 10, during the traditional
school year, which included the fall and spring semesters, approximately 76% of the
course sections included in the study were face-to-face courses. During these semesters,
the average age of students enrolled in the courses is 21.9 years. This indicates traditional
aged students are the majority during the school year. However, in the summer, the
balance of face-to-face and online courses shifted such that only 44% of the courses were
offered face-to-face. This shift appears to be associated with a common reason that
students opt for online courses. Students choose to take online courses for the flexibility
of time, location, and pace (Stansfield et al., 2004). Additionally, the average age of the
student during summer rose to 24.5 years of age. This implies that nontraditional students

92
work toward completing their education year-round as opposed to only during the school
year, while traditional students take the summer off to spend with family or to earn
money. This aligns with the research that found nontraditional students tend to take
courses that fit their schedule as opposed to conforming to the traditional school year
(Daniel, 2000; Watts & Wagner, 2016).
Predictors of Academic Success
This study identified several of the following common success factors in both
online and face-to-face environments: gender, ethnicity, age, first generation status,
residency status, academic level academic load, the term of enrollment, and primary
major college. This finding indicates that these characteristics are predictive of stronger
academic performance despite the course format. When considering demographic
characteristics, females performed better than male students in course enrollments
whether they were face-to-face or online. This finding is in agreement with the studies
completed by Aragon & Johnson (2008), Hung et al. (2012), Reason (2003), Valasek
(2001), and Yasmin (2013). In general, ethnicity was not a strong predictor. One common
finding in this study was that students of Asian descent performed slightly better than all
other ethnic groups. This is in alignment with other studies addressing ethnicity
completed by Nora et al. (2005), Reason, (2003), and Swail (2004).
Age was challenging to use as a predictive behavior because both older and
younger students earned higher average grades than students in the middle age ranges.
Studies reviewed in the literature had mixed results based on the use of age as a predictor,
so these results match the previous studies. Several studies found younger students were
more likely to be successful in their course enrollments (Hung et al, 2012; Osborn, 2001;

93
Yasmin, 2013), while other studies found older students were more likely to be
successful (Muse, 2003; Valasek, 2001). The younger student success is likely due to the
number of students enrolled in concurrent enrollment courses while the older students
often have a different level of intrinsic motivation for their learning (Stansfield et al.,
2004).
Like the studies completed by Choy (2001), Demetriou and Schmitz-Sciborski
(2011), and Thayer (2000), this study found that first generation students earned lower
grades than their counterparts who are not first generation students. First generation
students tend to have lower levels of college readiness and a lack of support from family
and friends as compared to students who are not first generation (Falcon, 2015; Stebleton
& Soria, 2013). These challenges for first generation students may be real, but sometimes
are only perceptions for these students.
Data was not available as to whether students resided on campus or were
commuter students, which was found to be an indicator of success in some studies, but
students enrolled as nonresidents of the state performed significantly better than
residents. Non-resident students are required to pay the higher out-of-state tuition rates.
While no information on a correlation between tuition rates and academic success were
found in the literature, there were studies that identified a positive relationship between
students who received educational grants and academic success (Conrood, 2008).
Another explanation for the higher grades from nonresident students is the opportunity
for nonresident scholarships. Students who meet minimum GPA (3.6 and above) and
entrance exam requirements (ACT 26 or higher, SAT 1240 or higher) from partner states
can receive scholarships to cover the difference between nonresident and resident tuition

94
rates (Office of Financial Aid, 2016). If a high level of achievement isnot maintained,
students may lose this financial assistance.
One academic factor from this study that contradicts the existing literature is
success based on academic load. For the student audience in the study population,
students enrolled part-time performed better in both face-to-face and online courses as
compared to those enrolled full-time. The literature from other studies consistently found
that full-time students were more likely to succeed (Adelman, 1999; Aragon & Johnson,
2008; Colorado & Eberle, 2010; Demetriou & Schmitz-Sciborski, 2011; de Freitas et al.,
2015). There are many possible explanations for this finding, but not one identified in the
existing literature. One study, completed by Ibrahim, Freeman, and Shelley (2011),
evaluated demographic and job satisfaction variables related to the academic success of
part-time students. They found that students were more successful in their courses if they
were satisfied with their employment and if their job was related to their field of study.
Data of this nature was not available for this study.
Another academic factor of interest was a student’s high school GPA. This data
point was available for only about 80% of the enrollments, there was a very weak
correlation between high school GPA and final grade in a course (r = 0.09202, p <
0.0001). While this result aligns with the literature, it is a very weak correlation. It is not
nearly as strong as what Bowen, Chingos, and McPherson (2009) concluded when they
stated that the high school GPA is one of the best predictors of college graduation.
Students need to successfully complete their individual courses to be eligible to graduate.
Demetriou and Schmitz-Sciborski (2011) also reported on the connection between high
school GPA and success at the university level. The university that was the basis of this

95
study had a mix of traditional and nontraditional students. There were only two fields
used in this study that can be used to distinguish traditional from nontraditional students.
Those were the age and academic load. Using these two fields to distinguish
nontraditional, 8% of the course enrollments were identified as nontraditional. As a
result, there were many students who did not begin their higher education directly after
high school. That delay is likely to change the level of motivation for students as well as
provide time for additional maturity when it comes to study skills and prioritization of
schoolwork.
Research Question 1: Which are important predictors from student characteristics that
lead to successful completion of 100 and 200 level classes taken online, as measured by
final grade?
The overall average final grade for online courses was 2.676 with 79.29% of the
students receiving a grade of a C or better. Nearly 40% of students enrolled in online
courses finished their courses earning a grade of an A, while 16.51% (N = 3,588) earned
an F or withdrew from the course. Of those students who received failing grades,
approximately 30% opted to withdraw from the class after the add/drop deadline. Based
on the logistic regression, overall, demographic factors alone account for slightly more
than 2% of student success in online courses. First generation status was the most
significant of those factors. Using the odds ratio as a means of comparison, a non-first
generation student was 1.194 times more likely to be successful in their online course
enrollment than their first generation classmates. This finding corresponds with the
studies completed by Choy (2001), Dimetriou and Schmitz-Sciborski (2011), and Thayer
(2000). Similar to the study completed by Choy (2001), this study identified that there are
96
many factors in addition to first generation status that influenced a likelihood of success
once they decide to enroll. For online courses, one of the more significant factors include
the age at course start (older students are more likely to be successful). All factors and
their odds ratios are identified in Table 15.
In alignment with the literature (Dupin-Bryant, 2004; Levy, 2007; Muse, 2003;
Osborn, 2001), this study verified that the further a student progresses in their academic
career, the more likely they are to be successful in their individual courses. One
explanation for this finding was that unsuccessful students were more likely to drop out
as opposed to returning to school following semesters in which failing grades were
earned. This trend was unique to students enrolled in online courses for this study.
The characteristic that was found to be the strongest predictor of success was a
student’s cumulative GPA. Ten of the studies cited in Table 1 indicated that a higher
cumulative GPA correlates to success in either online or face-to-face courses. One study
in particular (Osborn, 2001), found that cumulative GPA is not a strong predictor when
analyzed in isolation. In contrast, this study’s findings contradict Osborn’s findings as
can be observed in the results of the logistic regression for online courses. The odds ratio
for cumulative GPA for online course enrollments shows that for each full point increase
in GPA a student is 2.1530 times more likely to pass their online course.
Research Question 2: Which are important predictors from student characteristics that
lead to successful completion of 100 and 200 level classes taken face-to-face, as
measured by final grade?
The overall final grade average for face-to-face course enrollments was 2.653
with 81.19% of the students receiving a grade of a C or better. Of the students enrolled in

97
face-to-face courses, 34.46% earned a grade of an A. In contrast, 13.41% (N = 10,621)
earned an F or withdrew from the course. Of those students who received failing grades,
approximately 22% opted to withdraw from the class after the add/drop deadline.
One finding that was unique to the face-to-face course enrollments was the
relationship between academic level, or the amount of time a student had been attending
college, and final grade. For the study population as a whole, the higher the academic
level, the higher the final grade average for enrollments, which was in alignment with the
literature (Dupin-Bryant, 2004; Levy, 2007; Muse, 2003; Osborn, 2001). This was not the
case for the face-to-face course enrollments. For the face-to-face population in this study,
freshmen performed better than both sophomores and juniors in the face-to-face course
enrollments. Other studies that addressed the relationship between academic level and
final grade, including those by Dupin-Bryant (2004), Levy (2007), Muse (2003), and
Osborn (2001), focused on a review of online course enrollments as opposed to face-to-
face enrollments. One study by Devadoss and Foltz (1996), reported student grades based
on the year in college for face-to-face enrollments. Similar to this study, they found that
seniors earned the highest grades. However, that is where the similarities end. They
reported that sophomores outperformed juniors by a hundredth of a grade point average,
but both significantly outperformed freshmen. One explanation for this finding is the high
number of concurrently enrolled students. These students earned significantly higher
grades than the traditional post-secondary students.

98
Research Question 3: What predictors are common or differ between online and face-to-
face settings?
The mean final grade for face-to-face enrollments was significantly lower than the
mean final grade for online enrollments. However, when reducing the variable to two
values, successful, A, B, or C, and unsuccessful, D, F, or W, completion of the course
enrollment, the results were different. Students in face-to-face course enrollments were
more likely to be successful than students enrolled in online courses. A careful review of
Figure 4 shows that students in online courses earn more A grades, but also more F
grades. In contrast, students in face-to-face courses had a slightly flatter distribution of
grades, yet still not a normal curve. While one modality was more successful when
considering the weights of letter grades, the other modality performed better when the
classification was reduced to a simple successful or not. This implies there was no
significant difference based on course modality alone. However, there was a significant
difference in the percentage of students who withdrew from online courses after the
add/drop deadline. Approximately 30% of the failing grades for online students were
attributed to students who withdrew from their course. During the same time, only about
22% of the failing grades for face-to-face students withdrew from their course. This
difference may be attributed to a student past educational experiences. Online learning is
still a new arena for many students, and the experience may not match their expectations,
resulting in a lower level of student satisfaction and a student choosing to withdraw from
their online course (Paechter, Maier, & Macher, 2010).
There were differences in the levels of success for students within certain
demographic groups. When considering gender, female students in face-to-face course

99
enrollments were successful about 3% more often as compared to females in online
courses. However, when looking at the successful completion rate of course enrollments
for males, the difference was less than one-tenth of one percent.
When looking at online and face-to-face courses and the age of students enrolled,
face-to-face course success was in alignment with the study completed by Nora and Crisp
(2012), where younger students were more successful than older students. On the other
hand, when looking at only the online courses, older students had higher grades than
younger students, which matches the findings in studies completed by Muse (2003) and
Valasek (2001). The analysis of student age showed that there were consistent differences
in the rate of success between face-to-face and online with the exception of those that
were fifty years of age and over at the time of their enrollment. Students age fifty and
over were much more successful in face-to-face courses (77.5% pass rate) as compared to
online (70.2% pass rate). All other age groups had no more than a 2% variance in the rate
of success. This is noteworthy since it was the older age groups that enroll in online
courses at a higher rate than their younger counterparts. Although the age at course start
was transformed to normalize the distribution, this difference is best seen through the
logistic regression and the odds ratio. In the face-to-face courses, the regression
coefficient () is negative, indicating the older a student is, the less likely they are to be
successful. In contrast, in the online courses, the regression coefficient () is positive
signifying a positive correlation between age and success in an online course.
Although the numbers were small, Pacific Islanders performed significantly better
in their online course enrollments as compared to their face-to-face courses. Pacific
Islanders were successful in their online courses 82.9% of the time, but were only

100
successful 75.0% of the time in their face-to-face course enrollments. All other ethnic
groups had no more than a 2% variance in their success in face-to-face as compared to
online course enrollments.
A student’s primary degree type and major had an impact on success in their
chosen course enrollments. Students working toward a bachelor’s degree earned higher
grades online as opposed to face-to-face. In contrast, high school student enrolled in
college level courses performed better in the face-to-face environment. High school
students are successful in face-to-face courses at a rate nearly 10% higher than when
taking online courses. The high school students chose face-to-face enrollments over
online enrollments much more often. Only 6% of high school enrollments were
completed online. One explanation for this result is that high school students likely do not
have the same level of choice for course modality as an on campus student. In contrast,
students enrolled as part of their work for another type of degree, whether it be for a
certificate, an associate’s degree, a graduate student taking an undergraduate course, or a
student taking courses of interest, all do better online. These students also opted for
online courses at a higher rate. Students working toward something other than a
bachelor’s degree were more likely to be nontraditional students, and therefore have other
obligations in addition to their university level courses. Often, these students have a high
level of motivation, so are likely to do well in their courses, whether face-to-face or
online. Additionally, the students in this study that were working toward another degree
type were much more successful when enrolled part-time as opposed to full-time.
The relationship between the GPA earned for the term and the success of the
students was evident in both the online and face-to-face enrollments. The correlation

101
between term GPA and success in face-to-face course enrollments was moderately
positive (r = 0.58454, p < 0.0001). There was a strong positive correlation between the
term GPA and success in the online enrollments (r = 0.71856, p < 0.0001). There are
concerns about the collinearity of this variable, so it was excluded from regression
calculations. Students who were enrolled part-time, taking only a single course, would
have a term GPA equal to their course grade.
Research Question 4: Which academic departments or individual courses can be
identified as significant and in need of further analysis?
When completing the analysis, students who had high school listed as their
primary degree type had significantly higher grades than students who had completed
high school. These students were identified as the group in need of further analysis.
When comparing these students to the study population as a whole, the rate of success for
the high school students was 96.65%. In contrast, their post-secondary counterparts were
successful only 80.78% of the time.
Courses offered as concurrent enrollment, or dual credit, courses are designed to
meet a number of goals. The courses are college courses, following a university approved
syllabus, that is most often taught in the high school by a high school teacher that meets
university qualifications (Karp & Hughes, 2008). They help bridge the transition from
high school to college education, ensuring college readiness for these students.
Additionally, they provide opportunities for high achieving high school students to get a
head start on their college education (Hoffmann, 2012).
When analyzing the demographics, there was approximately a 9% higher
percentage of females that took courses as concurrent enrollment as compared to the

102
students in the study population. Similarly, there was a slightly higher percentage of
Caucasians enrolled through concurrent enrollment, but these factors do not seem to have
any relationship with the success of the students. There was a significant difference in the
distribution of the colleges offering the courses in which the concurrently enrolled
students opted to take, but that appeared to be related to the courses the university and the
area high schools offer as a dual credit option as opposed to student choice. Their higher
success rate and the higher average final grade can likely be attributed to the fact that
they are currently high achieving high school students, and were provided the opportunity
to enroll in college level courses because they are often limited to students in college-
prep tracks (Karp & Hughes, 2008).
Limitations
Like any purely quantitative study, this study had limitations based on the absence
of any qualitative data from the study. Specifically, the students that were included in this
study should not be defined by their demographic and academic information alone. There
are many other factors that may have influenced student success in either face-to-face or
online courses. These factors include motivation, both intrinsic and extrinsic (Stansfield
et al., 2004), as well as the student’s readiness for the academic rigor of the course. Other
aspects of a student’s life can interfere with their education, including obligations for
work and family and the level of support from the family, friends, and coworkers (Bean
& Metzner, 1985; Park & Choi, 2009; Tello, 2007). Many of these factors could have
been addressed through a mixed methods study.
The quality of the course experiences related to the data was unknown. Both face-
to-face and online courses vary greatly in the quality of the educational experience. These

103
variances may be attributed to the instructor, the curriculum, or other factors. An
instructor may have been new to a subject, new to a given course, or their teaching style
may not have been a good fit for the student in either face-to-face or online course
sections.
A course itself evolves over time. Faculty members will often adjust their course
content or instruction from semester to semester hoping it improves the course experience
for students. The instructional strategy used in the course can vary greatly from section to
section. Often the instructional techniques used in an online class are different than those
used in face-to-face courses. These varied teaching strategies may have been beneficial in
one learning format for some students yet hurt others in a different format.
Data was collected as to which semester a student enrolled in a course, but the
semester that a student chose to enroll may have affected their success. This could be due
to a number of factors. For example, a student-athlete might have enrolled in the given
course during the semester that practice activities and games needed to fit into the
schedule. Seasonal jobs and other commitments could also influence the time a student
has to dedicate to school work.
Finally, the student population varies from institution to institution. Kalsbeek and
Zucker (2013) argue that a student population is unique to the university, and there needs
to be a change in marketing strategies to greatly alter the student population. Therefore,
the results of this study were unique to this university, and may not be directly
transferable or generalized to other institutions of higher education.

104
Recommendations for Future Research
This study was a comprehensive quantitative study that focused on learning
analytics. There are benefits from additional research that combines both the qualitative
and quantitative aspects of this topic. This study evaluated only demographic, academic,
and course data and how those factors influence successful completion of a course. The
results could be greatly enhanced if paired with research centered around student
perceptions and the impact on retention from semester to semester. Analysis of data on
student attendance and information from the learning management system would also add
value to the university and research community.
Another area that could benefit from more in depth study would be an analysis of
who withdraws from courses after the add/drop deadline established by the university. A
study of this nature would need to include information gathered from these students as to
why they chose to withdraw, and the types of courses that the student chose to drop.
The concurrent enrollment students experienced a much higher level of success in
their individual courses. It could benefit the university to track these students beyond
high school; identifying which students choose to attend the same university after
graduation, or opt to apply to a different university. Additionally, the high schools and
the university could benefit from information on how many students that began their
college career as a high school student continue and graduate as well as how long it takes
them to complete their degrees.
There were some departments where one modality, either online or face-to-face,
did significantly better than the other for the classes offered. Additional research on these
courses would not focus on the modality of the more successful courses, but instead look

105
at the differences in rigor, instructional design, and assessment techniques used in the
course formats. Ideally, research would identify courses in need of improvement and
employ best practices to balance courses modalities.
Implications of the Results
This study found that course modality, either face-to-face or online, was not a
determining factor of success at the university level, nor were most demographic or
academic factors. In some cases, the course itself played a role in the likelihood of a
student’s success, but the best predictor was a student’s previous academic success, as
observed through cumulative GPA. This success was either at the high school level, in
terms of concurrent enrollment, or at the university level.
One concern was the higher number of withdrawals in the online courses. Despite
increased enrollments in online courses, online learning is still a modality that many
students have not experienced. Because of this situation, the expectations for courses
need to be clearly communicated to students early in the learning experience to enable
success. This may help to equalize withdrawals in online courses and bring it closer to the
withdrawal rate of face-to-face courses, an area of concern for online course offerings at
the university. One misconception that is common among college students is that online
courses will be easier, or less rigorous than face-to-face courses. Some students who
enroll in online courses may discover this is not necessarily the case upon enrolling in a
class and a review of the syllabus and end up withdrawing from the class.
The results of this study can be used by a number of stakeholders both within the
university and beyond. The university administrators can draw from this information to
alter admissions standards that can affect the likelihood of success in course enrollments,

106
and in turn impact the graduation and retention rates (Dziuban et al., 2012). If the
university chooses to grow enrollments, they would lower entrance requirements. If, on
the other hand, they want to focus on increased graduation rates, they can use the results
of this study to restrict admissions in a manner that encourages success. To do so, they
could look at the factors that were indicators of success like entry level GPA. While
university cumulative GPA is the greatest predictor of success, other factors can be used
in setting the standards.
Faculty and support staff at the university can use the information to identify
problematic courses. For example, some departments have significant differences in
success rates between the online and face-to-face modalities. The reason for these
differences may be due to the design of the courses, or the instructional techniques
employed in the course. These courses and instructors can be identified and reviewed by
instructional designers for a redesign that can narrow the performance gap (Lockyer, et
al., 2013). Some examples include courses offered by the College of Engineering, the
communications department, world languages, chemistry and business courses.
Faculty in both face-to-face and online courses can use information on the
demographic and academic factors of the students enrolled in their courses to perform
some preliminary student analysis. For example, if an instructor learns that most of the
students enrolled in their course has work experience and is enrolled on a part-time
status, he or she may choose to integrate some of the andragogical techniques outlined by
Knowles (1984) such as providing them with opportunities to share their life experiences
and apply them to their learning. Academic advising can apply this information in

107
helping students select classes and to inform which students are in need of additional
support.
In conclusion, the action that can be taken on the specific results of this study can
help universities integrate statistical modeling and other learning analytics techniques
into their decision making processes. The type of data included in this study can be
combined with learning activity data to advance the analytics to a prescriptive level. As
the field of learning analytics continues to grow, universities will find these tools to be an
invaluable resource for advising students and making informed decisions at all levels
within the university.
This research was conducted under approval from the Institutional Review Board
at Boise State University, protocol #104-SB16-102.

108
REFERENCES
Adelman, C. (1999). Answers in the tool box: Academic intensity, attendance patterns,
and bachelor’s degree attainment. Washington D. C.: Office of Education
Research and Improvements, U. S. Department of Education.
Affendey, L. S., Paris, I. H. M., Mustapha, N., Sulaiman, M. N., & Muda, Z. (2010).
Ranking of influencing factors in predicting students’ academic performance.
Information Technology Journal, 9(4), 832-837.
Allen, I. E., & Seaman, J. (2016). Online report card: Tracking Online Education in the
United States. Babson Park, MA. Retrieved from
http://onlinelearningsurvey.com/reports/onlinereportcard.pdf
Aragon, S. R., & Johnson, E. S. (2008). Factors influencing completion and
noncompletion of community college online courses. American Journal of
Distance Education, 22(3), 146–158. http://doi.org/10.1080/08923640802239962
Astin, A. W. (1975). Preventing students from dropping out. San Francisco, CA: Jossey-
Bass.
Baker, B. M. (2007). A conceptual framework for making knowledge actionable through
capital formation (Order No. 3254328). Available from ProQuest Dissertations &
Theses Global. (304704280).
Baker, R., & Siemens, G. (2014) Educational data mining and learning analytics. In
Sawyer, K. (Ed.) Cambridge Handbook of the Learning Sciences: 2nd Edition,
pp. 253-274. Retrieved from:
http://www.columbia.edu/~rsb2162/BakerSiemensHandbook2013.pdf

109
Baum, S., Ma, J., & Payea, K. (2013). Education pays 2013: The benefits of higher
education for individuals and society. New York, NY: College Board. Retrieved
from: https://trends.collegeboard.org/sites/default/files/education-pays-2013-full-
report.pdf
Bean, J. P. (2005). Nine themes of college student retention. In A. Seidman (Ed.) College
Student Retention (pp. 215-244). Westport, CT: American Council on Education
and Praeger Publishers.
Bean, J. P., & Metzner, B. S. (1985). A conceptual model of nontraditional undergraduate
attrition. Review of Educational Research, 55(4), 485-540.
Becker, B. (2013). Learning analytics: Insights into the natural learning behavior of our
students. Behavioral and Social Sciences Librarian 32(1) 63-67. Doi:
10.1080/01639269.2013.751804
Berger, J. B., & Lyon, S. C. (2005). Past to present: A historical look at retention. In A.
Seidman (Ed.) College Student Retention (pp. 1-29). Westport, CT: American
Council on Education and Praeger Publishers.
Bok, D. (2013). Higher education in America. Princeton, NJ: Princeton University Press.
Bowen, W. G., Chingos, M. M., & McPherson, M. S. (2009). Crossing the finish line:
Completing college at America's public universities. Princeton, NJ: Princeton
University Press.
Braxton, J. M., & Hirschy, A. S. (2005). Theoretical developments in the study of college
student departure. In A. Seidman (Ed.) College Student Retention (pp. 61-87).
Westport, CT: American Council on Education and Praeger Publishers.
Brown, M. (2011). Learning Analytics: The coming third wave. EDUCAUSE Learning
Initiative Brief, 1–4. Retrieved from
https://net.educause.edu/ir/library/pdf/ELIB1101.pdf
Campbell, J. P., deBlois, P., & Oblinger, D. G. (2007). Academic analytics: A new tool
for a new era, EDUCAUSE Review, 42(4), 40-57.

110
Campbell, J. P. & Oblinger, D. G. (2007). Academic analytics. EDUCAUSE Whitepaper.
1-24. Retrieved from http://net.educause.edu/ir/library/pdf/PUB6101.pdf
Choy, S. (2001). Students whose parents did not go to college: Postsecondary access,
persistence, and attainment, (NCES Publication No. 2001–126). Retrieved from
National Center for Educational Statistics:
http://nces.ed.gov/pubs2001/2001126.pdf
Clark, R. E. (1983). Reconsidering research on learning from media. In R. E. Clark (Ed.),
Learning from Media (pp. 1-12). Charlotte, NC: Information Age Publishing.
Colorado, J. T., & Eberle, J. (2010). Student demographics and success in online learning
environments. Emporia State Research Studies, 46(1), 4–10.
Conrood, L. (2008). The effects of financial aid amounts on academic performance. The
Park Place Economist, 16(1), 24-35.
Cortes, C. M. (2013). Profile in action: Linking admission and retention. New Directions
for Higher Education, 2013(161), 59-69.
Daniel, E. L. (2000). A review of time-shortened courses across disciplines. College
Student Journal, 34(2).
de Freitas, S., Gibson, D., DuPlessis, C., Halloran, P., Williams, E., Ambrose, M.,
Dunwell, I., Arnab, S. (2015). Foundations of dynamic learning analytics: Using
university student data to increase retention. British Journal of Educational
Technology, 46(6), 1175-1188.
Demetriou, C., & Schmitz-Sciborski, A. (2011). Integration, motivation, strengths, and
optimism: Retention theories past, present, and future. In R. Hayes (Ed.),
Proceedings of the 7th National Symposium on Student Retention, 2011,
Charleston. (pp.300-312). Norman, OK: The University of Oklahoma.
Devadoss, S., & Foltz, J. (1996). Evaluation of factors influencing student class
attendance and performance. American Journal of Agricultural Economics, 78(3),
499-507. Retrieved from http://www.jstor.org/stable/1243268

111
Dringus, L. P. (2011). Learning Analytics Considered Harmful. Journal of Asynchronous
Learning Networks, 16(3), 87–101.
Dron, J., & Anderson, T. (2009). On the design of collective applications. Proceedings of
the International Conference on Computational Science and Engineering, Vol 4,
pp. 368-374. Retrieved from http://hdl.handle.net/2149/2305
Dupin-Bryant, P. (2004). Pre-entry variables related to retention in online distance
education. American Journal of Distance Education, 18(4), 199-206.
Dziuban, C., Moskal, P., Cavanagh, T., & Watts, A. (2012). Analytics that inform the
university: Using data you already have. Journal of Asynchronous Learning
Network, 16(3), 21–38.
eCampus Center, Extended Studies. (2015). Boise State eCampus Snapshot 2015 [Fact
sheet]. Retrieved from http://ecampus.boisestate.edu/wp-
content/uploads/2015/06/2014-2015-eCampusSnapshot.pdf
Elias, T. (2011). Learning analytics: Definitions, Processes, and Potential. Retrieved
from:
http://learninganalytics.net/LearningAnalyticsDefinitionsProcessesPotential.pdf
Ewert, S. (2010). Male and female pathways through four-year colleges: Disruption and
sex stratification in higher education. American Educational Research
Journal, 47(4), 744-773.
Falcon, L. (2015). Breaking down barriers: First-generation college students and college
success. Innovation, 10(6). Retrieved from: https://www.league.org/innovation-
showcase/breaking-down-barriers-first-generation-college-students-and-college-
success
Geiger, R. L. (2015). The history of American higher education: Learning and culture
from the founding to World War II. Princeton, NJ: Princeton University Press.
Grebennikov, L., & Skaines, I. (2009). Gender and higher education experience: A case
study. Higher Education Research and Development, 29(1), 71-84. doi:
10.1080/07294360802444370

112
Greller, W., & Drachsler, H. (2012). Translating learning into numbers: A generic
framework for learning analytics. Educational Technology and Society, 15(3), 42-
57.
Habley, W. R., Bloom, J. L., Robbins, S., & Gore, P. A. (2012). Increasing persistence:
Research-based strategies for college student success. Hoboken, NJ: John Wiley
& Sons.
Hand, D. J. (1998). Data mining: Statistics and more? The American Statistician, 52(2),
112-118.
Harrell, I. L., & Bower, B. L. (2011). Student characteristics that predict persistence in
community college online courses. American Journal of Distance Education,
25(3), 178–191. doi: 10.1080/08923647.2011.590107
Hart, C. (2012). Factors associated with student persistence in an online program of
study: A review of the literature. Journal of Interactive Online Learning, 11(1),
19-42.
Hofmann, E. (2012), Why dual enrollment? New Directions for Higher Education,
2012(158), 1–8. doi:10.1002/he.20009
Hofstede, G. H. (2001). Culture's consequences: Comparing values, behaviors,
institutions, and organizations across nations. Thousand Oaks, CA: Sage
Publications.
Holder, B. (2007). An investigation of hope, academics, environment, and motivation as
predictors of persistence in higher education online programs. The Internet and
Higher Education, 10(2007), 245-260. doi: 10.1016/j.iheduc.2007.08.002
Hung, J. L., Hsu, Y. C., & Rice, K. (2012). Integrating data mining in program evaluation
of K-12 online education. Educational Technology and Society, 15(3), 27-41.
Ibrahim, N., Freeman, S. A., & Shelley, M. C. (2011). Identifying predictors of academic
success for part-tie students at polytechnic institutes in Malaysia. International
Journal of Adult Vocational Education and Technology, 2 (4), 1-16.

113
Ishler, J. L. C., & Upcraft, M. L. (2004). The keys to first-year student persistence. In M.
L. Upcraft, J. N. Gardner, & B. O. Barefoot (Eds.) Challenging and Supporting
the First –Year Student: A Handbook for Improving the First Year of College
(pp. 27-46). Indianapolis, IN: Jossey-Bass.
Ivankova, N. V., & Stick, S. L. (2007). Students’ persistence in a distributed doctoral
program in educational leadership in higher education: A mixed method study.
Research in Higher Education, 48(1), 93-135.
Jayaprakash, S. M., Moody, E. W., Laura, E. J., Regan, J. R., & Baron, J. D. (2014).
Early alert of academically at-risk students: An open source analytics initiative.
Journal of Learning Analytics, 1(1), 6-47.
Kalsbeek, D. H., & Zucker, B. (2013). Reframing retention strategy: A focus on profile.
New Directions for Higher Education, 2013(161), 15-25. doi: 10.1002/he.20042
Kamens, D. H. (1971). The college charter and college size: Effects on occupational
choice and college attrition. Sociology of Education, 44(3), 270-296.
Karp, M. M., & Hughes, K. L. (2008). Dual enrollment can benefit a broad range of
students. Techniques: Connecting Education and Careers, 83(7), 14-17.
Kemp, W. C. (2002). Persistence of adult learners in distance education. American
Journal of Distance Education, 16(2), 65.
King, A. (1993). From sage on the stage to guide on the side. College Teaching, 41(1),
30.
Knowles, M. S. (1984). Andragogy in action: Applying modern principles of adult
learning. San Francisco, CA: Jossey-Bass.
Lee, Y., & Choi, J. (2011). A review of online course dropout research: Implications for
practice and future research. Educational Technology Research and Development,
59. 593-618.
Levy, Y. (2007). Comparing dropouts and persistence in e-learning courses. Computers
and Education, 48(2), 185-204.

114
Liu, S. Y., Gomez, J., & Yen, C. (2009). Community college online course retention and
final grade: Predictability of social presence. Journal of Interactive Online
Learning, 8(2), 165-182.
Lockee, B. B., Burton, J. K., & Cross, L. H. (1999). No comparison: Distance education
finds a new use for ‘no significant difference’. Educational Technology, Research
and Development, 47(3), 33-42.
Lockyer, L., Heathcote, E., & Dawson, S. (2013). Informing pedagogical action:
Aligning learning analytics with learning design. American Behavioral Scientist,
57(10), 1439-1459.
Lotsari, E., Verykios, V. S., Panagiotakopoulos, C., & Kalles, D. (2014). A learning
analytics methodology for student profiling. Lecture Notes in Computer Science,
8445(2014), 300-312.
Martin, T., & Sherin, B. (2013). Learning analytics and computational techniques for
detecting and evaluating patterns in learning: An introduction to the special issue.
Journal of the Learning Sciences, 22(4), 511-520. doi:
10.1080/10508406.2013.840466
McKenzie, K., & Schweitzer, R. (2001). Who succeeds at university? Factors predicting
academic performance in first year Australian university students. Higher
Education Research and Development, 20(1), 21-33. doi:
10.1080/07924360120043621
Menager-Beeley, R. (2001). Student success in web based distance learning: Measuring
motivation to identify at risk students and improve retention in online classes.
(Report No. 466608). Orlando, FL: World Conference on the WWW and Internet
Proceedings. Retrieved from ERIC Database.
Moore, M. G., & Kearsley, G. (2005). Distance education: A systems view (2nd ed.).
Belmont, CA: Thomson Wadsworth.
Morris, J. E. (n.d.). Cultural expectations and student learning. Education Encyclopedia.
Retrieved from: http://education.stateuniversity.com/pages/2346/Race-Ethnicity-
Culture.html

115
Morris, L. V., Wu, S.-S., & Finnegan, C. L. (2005). Predicting retention in online general
education courses. The American Journal of Distance Education, 19(1), 23-26.
Müller, T. (2008). Persistence of women in online degree-completion programs.
International Review of Research in Open and Distance Learning, 9(2), 1-18.
Muse, H. E. (2003). The web-based community college student: An examination of
factors that lead to success and risk. The Internet and Higher Education, 6(2003),
241-261. doi: 10.1016/S1096-7516-(03)00044-7
National Center for Education Statistics. (2014a). Digest of Education Statistics, 2013
(NCES Table No. 326.30). Retrieved from
http://nces.ed.gov/programs/digest/d13/tables/dt13_326.30.asp
National Center for Educational Statistics (2014b). Enrollment in distance education
courses, by state: Fall 2012 (NCES Publication No. 2014023). Retrieved from
http://nces.ed.gov/pubs2014/2014023.pdf
National Center for Education Statistics. (2015). Digest of Education Statistics,
2013 (NCES Table No. 330.10). Retrieved from
https://nces.ed.gov/programs/digest/d13/tables/dt13_330.10.asp
Nelson, G. S. (2015). Practical implications of sharing data: A primer on data privacy,
anonymization, and de-identification. [White paper]. Retrieved from
http://support.sas.com/resources/papers/proceedings15/1884-2015.pdf.
Nora, A., Barlow, E., Crisp, G. (2005). Student persistence and degree attainment beyond
the first year in college. In A. Seidman (Ed.) College Student Retention (pp. 129-
Oblinger, D. G. (2012). Let’s talk analytics. EDUCAUSE Review, 47(4), 10-13.
Office of Communications and Marketing. (2014). Facts and figures 2014-2015
Retrieved from http://scholarworks.boisestate.edu/facts_figs/22
Office of Financial Aid. (2016). Nonresident scholarship programs. Retrieved from
https://financialaid.boisestate.edu/scholarships/non-resident-tuition-assistance-
programs/

116
Office of Institutional Research, Boise State University. (2013). Retention, persistence,
and graduation rates summary. Retrieved from http://ir.boisestate.edu/wp-
content/uploads/2014/04/Ret-persistence-grad-rates-updated-10.1.13-REV.pdf
Office of the Provost, Boise State University. (2012). Focus on effectiveness: Boise State
University’s strategic plan for 2012-2017. Retrieved from
http://academics.boisestate.edu/strategic-plan/
Osborn, V. (2001). Identifying at-risk students in videoconferencing and web-based
distance education. American Journal of Distance Education, 15(1), 41-54.
Paechter, M., Maier, B., & Macher, D. (2010). Student’s expectations of, and their
experiences in e-learning: Their relation to learning achievements and course
satisfaction. Computers and Education, 54(1), 222-229.
Pardo, A. (2014). Designing learning analytics experiences. In J. A. Larusson & B. White
(Eds.) Learning analytics: From research to practice (pp. 15-38). New York, NY:
Springer.
Park, J.-H., & Choi, H. J. (2009). Factors influencing adult learners’ decision to drop out
or persist in online learning. Educational Technology and Society, 12(4), 207-217.
Patterson, B., & McFadden, C. (2009). Attrition in online campus degree programs.
Online Journal of Distance Learning Administration, 12(2). Retrieved from
http://www.westga.edu/~distance/ojdla/summer122/patterson112.html
Peng, C-Y. J., Lee, K. L., & Ingersoll, G. M. (2002). An introduction to logistic
regression analysis and reporting. Journal of Educational Research, 96 (1), 3-14.
doi: 10.1080/00220670209598786
Picciano, A. G. (2012). The evolution of big data and learning analytics in American
higher education. Journal of Asynchronous Learning Networks, 16(3), 9-20.
Pontes, M. C. F., Hasit, C., Pontes, N. M. H., Lewis, P. A., & Siefring, K. T. (2010).
Variables related to undergraduate student preferences for distance education
classes. Online Journal of Distance Learning Administration, 8(2). Retrieved
from http://www.westga.edu/~distance/ojdla/summer132/pontes_pontes132.html

117
Reason, R. D. (2003). Student variable that predict retention: Recent research and new
developments. NASPA Journal (National Association of Student Personnel
Administrators), 40(4), 172-191.
Reyes, J. A. (2015). The skinny on big data in education: Learning analytics simplified.
Tech Trends, 59(2), 75-79.
Richardson, J. E. (2012). Face-to-face versus online tuition: Preference, performance and
pass rates in white and ethnic minority students, British Journal of Educational
Technology, 43(1), 17-27. doi: 10.1111/j.1467-8535.2010.01147.x
Rovai, A. P., Ponton, M. K., & Baker, J. D. (2008). Distance learning in higher
education: A programmatic approach to planning, design, instruction, evaluation,
and accreditation. New York, NY: Teachers College Press.
Shelton, B. E., Hung, J-L., & Baughman, S. (2015). Online graduate teacher education:
Establishing an EKG for student success intervention. Technology, Knowledge,
and Learning, 20(1) doi: 10.1007/s10758-015-9254-8
Sher, S. (2013). Teaching value issues in china to chinese students enrolled in american
universities. (M. Goldman, Ed.) Teaching Philosophy, 36(4), 373–397.
doi:10.5840/teachphil20131014
Siemens, G., & Baker, R. (2012). Learning analytics and educational data mining:
Towards communication and collaboration. Proceedings of the 2nd International
Conference on Learning Analytics and Knowledge. Retrieved from
http://www.columbia.edu/~rsb2162/LAKs%20reformatting%20v2.pdf
Slade, S., & Prinsloo, P. (2013). Learning analytics: Ethical issues and dilemmas.
American Behavioral Scientist, 57(10), 1510-1529. doi:
10.1177/0002764213479366
Snyder, T. D. (1993). 120 Years of American education: A statistical portrait (NCES
Publication No. 93442). Retrieved from National Center for Educational
Statistics: http://nces.ed.gov/pubs93/93442.pdf
Spady, W. (1970). Dropouts from higher education: An interdisciplinary review and
synthesis. Interchange: A Quarterly Review of Education, 1(1), 64-85.

118
Stansfield, M., McLellan, E., & Connolly, T. (2004). Enhancing student performance in
online learning and traditional face-to-face delivery. Journal of Information
Technology Education, 3, 173-188.
Stebleton, M. J. & Soria, K. M. (2013). Breaking down barriers: Academic obstacles of
first-generation students at research universities. The Learning Assistance
Review. Retrieved from the University of Minnesota Digital Conservancy,
http://hdl.handle.net/11299/150031.
Swail, W. S. (2004). The art of student retention: A handbook for practitioners and
administrators. Austin, TX: Educational Policy Institute.
Tello, S. F. (2007). An analysis of student persistence in online education. International
Journal of Information and Communication Technology Education,3(3), 47-62.
Thayer, P. B. (2000). Retention of students from first generation and low-income
backgrounds (Report No. 446633). Washington D. C.: Department of Education.
Retrieved from ERIC Database.
Tinto, V. (1975). Dropout from higher education: A theoretical synthesis of recent
research. A Review of Educational Research, 45(1), 89-125.
U.S. Bureau of Labor Statistics, Office of Occupational Statistics and Employment
Projections. (2015). Earnings and unemployment rates by educational attainment.
Retrieved from: http://www.bls.gov/emp/ep_chart_001.htm
U.S. Department of Education, Office of Educational Technology. (2012). Enhancing
teaching and learning through educational data mining and learning analytics:
An issue brief. Washington, D.C.: U.S. Department of Education.
Valasek, T. (2001). Student persistence in web-based courses: Identifying a profile for
success. (Report No. 466276). Branchburg, NJ: Raritan Valley Community
College. Retrieved from ERIC Database.
Verbert, K. Manouselis, N., Drachsler, H., & Duval, E. (2012). Dataset-driven research to
support learning and knowledge analytics. Education Technology and Society,
15(3), 133-148.

119
Wagner, E., & Ice, P. (2012). Data changes everything: Delivering on the promise of
learning analytics in higher education. EDUCAUSE Review, 47(4), 32-42.
Wang, Y. A., & Newlin, M. H. (2002). Predictors of performance in the virtual
classroom: Identifying and helping at-risk cyber-students. THE Journal, 29(10),
21.
Watt, C., & Wagner, E. (2016). Improving Post-Traditional Student Success. Retrieved
from
https://www.hobsons.com/res/Whitepapers/PostTraditionalStudents_ParFramewo
rk_February2016.pdf
Yasmin, J. (2013). Application of the classification tree model in predicting learner
dropout behavior in open and distance learning. Distance Education, 34(2), 218-
231.