using color in visualization: a survey
TRANSCRIPT

Computers & Graphics 35 (2011) 320–333
Contents lists available at ScienceDirect
Computers & Graphics
0097-84
doi:10.1
$This� Corr
E-m
journal homepage: www.elsevier.com/locate/cag
Technical Section
Using color in visualization: A survey$
Samuel Silva a,b,�, Beatriz Sousa Santos a,b, Joaquim Madeira a,b
a Institute of Electronics and Telematics Engineering of Aveiro, University of Aveiro, 3810-193 Aveiro, Portugalb Department of Electronics, Telecommunications and Informatics, University of Aveiro, 3810-193 Aveiro, Portugal
a r t i c l e i n f o
Article history:
Received 25 March 2010
Received in revised form
17 September 2010
Accepted 18 November 2010Available online 19 December 2010
Keywords:
Visualization
Color scales
Color maps
Guidelines
93/$ - see front matter & 2010 Elsevier Ltd. A
016/j.cag.2010.11.015
article was recommended for publication by
esponding author. Tel.: +351 234 370 500; fa
ail address: [email protected] (S. Silva).
a b s t r a c t
Color mapping is an important technique used in visualization to build visual representations of data and
information. With output devices such as computer displays providing a large number of colors,
developers sometimes tend to build their visualization to be visually appealing, while forgetting the main
goal of clear depiction of the underlying data.
Visualization researchers have profited from findings in adjoining areas such as human vision and
psychophysics which, combined with their own experience, enabled them to establish guidelines that
might help practitioners to select appropriate color scales and adjust the associated color maps, for
particular applications.
This survey presents an overview on the subject of color scales by focusing on important guidelines,
experimental research work and tools proposed to help non-expert users.
& 2010 Elsevier Ltd. All rights reserved.
1. Introduction
Visualization [1] is concerned with representing, manipulatingand exploring data and information graphically in such a way as togain understanding and insight into it, i.e., mapping of data to avisual form that supports human interaction in a workspace forvisual sense making [2].
Color mapping is a very important visualization technique, but thechoice of the most appropriate color scale to use with a particular dataset is not just a matter of choosing a colorful and visually attractiverepresentation. Adding color which does not add additional insight tothe visualization can sometimes cause confusion as users try tounderstand its meaning and should, therefore, be avoided [3]. So, it isparticularly important to perform the right choice in order to buildvisualizations which depict the desired information in a clear way.
Throughout the years researchers have studied such issues and,profiting from findings in other fields such as human vision andpsychophysics, managed to establish some guidelines which mighthelp users along the process of color scale selection according, forexample, to the type of data and task to be performed. Nevertheless,those guidelines are still not always used by visualization builders,and some well-documented problems are still ignored by thevisualization community [4].
Extending a previous paper by the authors [5], a brief overview onthe subject of color use in visualization is presented, providinginformation on the main concerns, findings and resulting guidelines,
ll rights reserved.
Robert van Liere.
x: +351 234 370 545.
hopefully encouraging researchers to seek new solutions, evaluate theuse of color in their visualizations and share their experience, thuscontributing to a deeper knowledge on the subject.
After a short introduction to color models, this survey focuses onthe desired properties for color scales and the use of colorrepresentations for univariate and multivariate data, and discussesother factors conditioning the use of color in visualization (e.g., datafeatures, tasks to be accomplished and target audience), whilementioning the guidelines that should drive the choice of appro-priate color scales and representations, as well as the advantages ofapplying such guidelines. Afterwards, experimental research workon the field and some tools proposed to help non-expert users aredescribed. Finally, some conclusions regarding the existing guide-lines and their usage are presented.
2. Color models
The purpose of a color model is to allow the specification ofcolors in a standard way. In essence, a color model is a specificationof a coordinate system, and a subspace within that system, whereeach color is represented by a single point [6].
Several color models are described in the literature. Each ofthem has its own characteristics and is more or less suited toparticular tasks. Therefore, before carrying on with the use of colorin visualization, it is important to present a general overview on thedifferent ways color can be represented.
In general, color models can be divided in two classes: device-dependent, when the model allows the representation of thecolor gamut of a particular device and the same coordinates canrepresent slightly different colors depending on the device features;
S. Silva et al. / Computers & Graphics 35 (2011) 320–333 321
and device-independent, when the model provides a representationof color using a coordinate system independent of any output device.A brief description of these two classes is presented in the followingsubsections.
For extended information on the subject of color models and awider range of references the reader is forwarded to Bratkova et al.[7], which presents a new color space for computer graphics.
2.1. Device-dependent color models
In the RGB color model each color is defined by adding threeprimaries: red, green and blue. This is analogous to what happens ina CRT display where the phosphor has similar base chromaticities.Since there is no strict value for the chromaticity of the threeprimaries, the same RGB coordinates can result in slightly differentcolors on different output devices.
The CMY color model uses cyan, magenta and yellow asprimaries, which are the complementary colors of red, green andblue, respectively. Thus, while RGB is an additive color model, i.e.,by representing what is added to blackness, CMY is subtractive,representing what is subtracted to white light. This color model isusually used in color printers. In many situations black is added tothis model, in order to allow a better representation of darkercolors, and such color model is identified as CMYK.
Although the RGB color model is based on the way color isrepresented in a CRT monitor (and thus sometimes called, alongwith the CMY color model, hardware-oriented [8]), it does notrelate well with the way color is intuitively perceived. Thus, as analternative, two additional (user-oriented) color models have beenproposed: HSV (hue, saturation and value) and HSL (hue, saturationand lightness). These are based on the intuitive appeal of a painter’stint, shade, and tone.
2.2. Device-independent color models
The three primaries red, green and blue cannot be used torepresent all visible colors (at least using only positive values). In1931 the Commission Internationale de l’Eclairage (CIE) [9] defined anew color model, CIE XYZ to avoid this problem [8]. Three newstandard primaries (X, Y and Z) were defined, thus allowing aspecification of all visible colors using only positive values.
Two additional color models have been defined, derived fromCIE XYZ, which are perceptually uniform: CIE LUV and CIE LAB. In aperceptually uniform color model the euclidean distance between apair of colors in the color space is directly connected with theirperceptual distance, i.e., if two pairs of colors have the sameeuclidean distance among them, their perceptual distance is thesame. The first perceptually uniform color system, which was alsoan influence to CIE LAB, was the Munsell color system [10] which isstill in use.
3. Desired properties for color scales
Given a sequence of numerical values fv1rv2, . . .rvNg repre-sented by colors {c1, c2,y, cN}, respectively, it is possible to identifythe following desirable properties [11,12] for a color scale:
Order—The colors chosen to represent the numerical valuesmust be perceived as having the same order as them, i.e., if thevalues are ordered, the colors chosen to represent them must alsoseem ordered. An example can be the representation of a tem-perature scale by using the notions of cold and warm colors andtheir proportional mixtures in order to obtain a scale from cold tohot temperatures.
It is important to note the special case of nominal data [13]:objects should be distinguishably different but, since they are
not ordered, there should be no perceptual ordering in therepresentation.
Uniformity and representative distance—The color representa-tion of two values should convey the distance between them, andcolors representing values which equally differ from each othershould also seem equally different. Beyond that, it is required thatclearly separated values must be represented by distinguishablecolors, and that close values must be represented by colorsperceived to be closer. This is what Trumbo [12] calls the separation
principle.When representing flow information, for example, complemen-
tary colors can be used to represent flows in opposite directions andsimilar colors (with slight differences) to represent flows in thesame direction. Levkowitz et al. [11] identify analogous principlesproposed by Pizer et al. [14] (associability) and Robertson et al. [15](separation).
Boundaries—If there are no boundaries on the representednumerical data the color scale should not create this effect, i.e.,the color scale must be able to represent continuous scales.
Rows and columns principle—This is one of the principlesproposed by Trumbo [12] which applies only to bivariate informa-tion. It states that if it is important to preserve univariateinformation, then the display parameters must not obscure oneanother, i.e., rows or columns having a constant value of onevariable must have constant hue, saturation, or brightness. Forexample, using two display primaries (e.g., red and green) goesagainst this principle.
Diagonal principle—The second principle proposed by Trumbowhich only applies to bivariate information states that if the detectionof positive association of variables is a goal, the displayed colors mustbe easily identified as belonging to one of the three classes: the onesnear the minor diagonal, the ones above it, and the ones below. Thiscould be accomplished with the major diagonal made up of greys,elements of maximum saturation, or constant hue. A hue andlightness scheme violates the diagonal principle [13].
4. Univariate representations
When using a color scale to represent univariate data, each colorrepresents a single scalar value. It can be a continuous color scale, ifcolor varies along the scale in such a way that adjacent colors aresimilar to one another, or a discontinuous color scale if that doesnot happen.
In what follows some examples of continuous color scales arepresented (according to a survey by Rheingans [16]). Additionalexamples can be found in [17].
4.1. Color model components
Grey scale—This color scale (see Fig. 1) maps scalars to bright-ness. It consists in a variation from black to white, with blackrepresenting, in general, the lowest value and white the highest.
While this color scale presents some advantages, such as an easy toperceive ordering (the different and increasing brightness levels), itsuffers from the fact that it displays a low contrast between thedifferent colors, which limits its use in quantitative tasks.
Rainbow scale—This is one of the most popular color scales usedin the visualization literature [4]. It consists in a color path alongthe different colors of the rainbow, built by varying hue whilekeeping saturation and contrast at fixed values. For example, inHSV, it consists in a complete rotation around the value (V) axis.
Regardless of its popularity, this color scale presents severalproblems [18]. For example, to some users it might not present anintuitive ordering unless they are familiar with the color progression(light spectrum). The position occupied by some of the colors might

Fig. 1. From left to right and top to bottom: greyscale, rainbow, heated-object, and
linearized optimal color scales applied to a data set. (For interpretation of the
references to color in this figure legend, the reader is referred to the web version of
this article.)
S. Silva et al. / Computers & Graphics 35 (2011) 320–333322
also lead to problems. Yellow is present half way through the colorscale. This means that if one is interested in depicting extreme valuesthe middle values might interfere, since yellow has an highlightingeffect being perceived as brighter than the other colors. Anotherimportant aspect whenever using yellow in a visualization is that ithas the smallest number of perceived saturation steps [19]. Therefore,users find it harder to distinguish small saturation variations foryellow than, for example, for blue.
Another issue might be the fact that this color scale goes fromred to violet. Since these colors are quite similar, both extremes willget visually close. To avoid this problem the color scale is usuallycut at blue (as seen in Fig. 1).
4.2. Redundant color scales
Using multiple display parameters to represent data may haveseveral advantages [16]. First, one can draw benefits from thecharacteristics of various display parameters in conveying differentkinds of information: while brightness is more effective conveyingshape, hue is better in providing distinguishable display levels.
This kind of redundancy might also help in dealing withsituations where one of the parameters becomes ambiguous (e.g.,due to a visual deficiency) and is compensated by the others.
Finally, using redundancy might also allow a better distinctionbetween values by reinforcing their visual differences.
Ware [20] has studied redundant color scales and proved theirutility by performing several empirical studies, which led to asuggestion that a color scale varying in both luminance and hue canbe used to accurately represent both metric and surface properties.Some examples of such scales are:
�
Redundant model components—A straightforward redundantscale can be built by mapping data values to both hue andbrightness. That kind of color scale has the advantage of beingsuitable for use by someone with dichromatic color deficiency.
� Heated-object scale—This scale represents a compromise betweenthe grey scale and the rainbow scale. It goes from black to white,passing through orange and yellow. This color scale has a strongerperceived natural ordering than the rainbow scale, since it has amonotonic increase in brightness (see Fig. 1).
� Linearized optimal color scale—This color scale was introducedby Levkowitz et al. [11] to describe a scale which maximizes thenumber of JNDs (just noticeable differences) while preserving anatural order (see Fig. 1).
4.3. Double-ended color scales
Such color scales are created by joining two monotonicallyincreasing scales at a common end point. For example, one can joina scale from grey to red and a scale from grey to blue, building ascale from red to grey to blue. With such color scales it is possible tovisually represent high, low and middle values clearly, since theyexhibit three distinct groups of colors.
A recent work by Moreland [21] discusses the creation and useof double-ended color scales, for example, as an alternative to therainbow color scale.
5. Multivariate representations
It is common that a single visualization requires the depiction ofmultivariate data. Multivariate color scales, and color blending andweaving are presented in what follows, as alternatives for repre-senting multivariate data.
5.1. Multivariate color scales
In a multivariate color scale two or more data variables aremapped to a single color representing them all. This is the sameprinciple as the one used with redundant scales, but now eachdisplay parameter is related with a different variable.
Working with the RGB color model, it is possible to map avariable into each one of its components, thus creating a multi-variate color scale. For example, Landsat ‘‘false color’’ images arecommonly produced by representing three multispectral scannerbands with levels of red, green and blue [22]. Therefore, if therepresented bands are highly correlated, the image will be com-posed of shades of grey, since the three components will have closevalues. This scheme has the advantage that the extremes of thevariable range (black, red, green, blue) are easily detectable.
An analogous scheme can be obtained using, for example, the HSLcolor model. For more details on the possible approaches see [16].
A problem occurs when one needs to decompose the showncolors in their components. How can we detect similaritiesbetween areas that have the same value for two components butdiffer on the third?
5.2. Color blending and weaving
Another approach for multivariate representations using color canbe to use different color scales for each variable and then blend theresults. This approach might also pose a difficulty in identifyingindividual values for each variable. Urness et al. [23] introduced atechnique named color weaving, applied to flow visualization, whichconsists in coloring the line integral convolution using side-by-sidestreamlines of the different colors which need to be represented in aregion. Fig. 2 shows an example of this technique compared with colorblending.

Fig. 2. Color blending (left) and color weaving (right). Reproduced with permission from [23]. & 2003 IEEE. (For interpretation of the references to color in this figure legend,
the reader is referred to the web version of this article.)
Fig. 3. Quantitative scales available in ColorBrewer 2.0 [29] suitable for nominal
data representation. (For interpretation of the references to color in this figure
legend, the reader is referred to the web version of this article.)
S. Silva et al. / Computers & Graphics 35 (2011) 320–333 323
A study by Hagh-Shenas et al. [24] compares user performancewhen analyzing information represented on maps using color weav-ing and the more traditional color blending (consisting in a linearcombination of all the colors which need to overlap in a region). Colorweaving is performed by representing the individual colors side-by-side, in a high frequency texture which fills the region. Results showthat users perform better when color weaving is used, particularlywhen more than two colors are being represented. Nevertheless,performance decreases for more than four colors. A possible alter-native to extend this limit might be a technique earlier presented byShenas et al. [25] which uses color and texture. Further workregarding color weaving can be found, for example, in Luboschiket al. [26] who present color weaving applied to scatter plots.
Recently, Wang et al. [19] proposed a framework which uses aset of guidelines to support choosing the proper colors for avisualization when color blending is used, e.g., to depict objectsthat partially overlap and where perceiving the stacking order(which object is in front/back) is important.
Whenever two semi-transparent objects overlap, it is easier toperceive which one is in front if their colors have opposite hues(e.g., red and blue) than closer hues (e.g., red and green), since theoverlapping region in the first case will exhibit a hue closer to theobject which is in front (or at least neutral) while, in the latter case,the overlapping region will present a new (shifted) hue. Insituations where more than two objects overlap, a set of huesmust be chosen as to avoid any hues which can be generated bymixing other hues in the set: a general rule is to choose opposinghues for the two most important objects and then neutral colors forall others. Furthermore, for situations where multiple objectsoverlap, using different opacities might also help users to perceiveobject order by decreasing object opacity from front to back.Saturation might also play an important role in avoiding drastichue changes in overlapping regions, or in object order perception,by increasing saturation for front objects and decreasing it for backobjects. Finally, Wang et al. also found that cold colors (e.g., blueand green) tended to be perceived as being in front, even if theiropacity was lower than remaining objects. The opposite was truefor warm colors (e.g., red and yellow). This was an unexpectedresult since it is the opposite effect which is, in general, observed(due to chromostereopsis [3]). For several examples the reader isforwarded to Wang et al. [19].
Chuang et al. [27] extended Wang et al. [19] work. Their mainimprovement is that they manage to perform blending by preservingthe hues of each object and avoiding the appearance of new (shifted)hues, with no need for an initial careful selection of opposing hues.They also introduce the concept of dominant color, i.e., the color thathas more impact on the final image as opposed to Wang et al. whichalways consider the foremost hue to be the most important.
6. Visualization characteristics and color scale selection
The color scales and methods used to build a visualization do notdepend only on the number of data variables involved. Severalfactors such as the characteristics of the data, the tasks which needto be accomplished or the target audience are important enough tobe considered.
6.1. Data types
When designing a visualization (i.e., picking a color scale) caremust be taken to ensure that the most striking features of the imagereflect the most important features of the data. If a representationcatches the user’s attention with unimportant features of the data,more interesting features might be missed [16]. Bright colors, sharpboundaries, or high saturation areas will most likely catch theuser’s attention. Thus, it is important to consider the data that willbe represented and their type, and know what is more important:for example, to call attention to middle values or to positive/negative deviations from a zero (threshold).
It is possible to distinguish between four data types [28]:Nominal data—For nominal data no mathematical operations
are possible, since the value assigned to a particular measurementrepresents a name. An example is the categorization of differentlung diseases with numerical labels 1, 2, 3 and 4: no mathematicaloperation is meaningful on these data. Here, numbers are identi-fiers. As noted above, the representation used for these kinds ofdata should not implicitly order it. A bad choice would be to use agrey scale since users intuitively perceive an order from dark tobright or vice-versa [4].
Fig. 3 shows several segmented color scales provided by Color-Brewer [29] (part of its qualitative color scales set) which could beused to represent nominal data.
The number of colors used to represent nominal data should berestricted to seven or less [3]. This guideline is based on twoconstraints: users ability to discriminate between colors and their

S. Silva et al. / Computers & Graphics 35 (2011) 320–333324
ability to remember the meaning of each color while looking intothe visualization.
Ordinal data—With ordinal data, values are assigned to mea-surements (for example), but no assumption is made about thespacing in-between such measurements, i.e., there can exist anumbering of 1, 2, 3 and 4 but the distance between elements 1 and2 cannot be assumed to be equal to the distance between 3 and 4.Ordinal data are inherently discrete [30]. The used representationshould allow discrimination between objects and the perception oftheir relative order.
The quite common rainbow scale, for example, would not be agood idea to represent ordinal data. Even though it can be said thatit is an ordered scale, if we consider wavelengths, it is notperceptually ordered [31,32,4]. Fig. 4 shows several examples ofsuitable segmented scales provided by ColorBrewer [29] (part ofthe sequential color scales set).
Interval data—For interval data, the numerically equal distancesbetween values are assumed to be actually equal. These kinds ofdata are commonly a (experimental) measure such as temperature,etc. The used representation should account for this: equal steps indata values should correspond to equally perceived magnitude inthe representation. A perceptually uniform color space can be usedto help choosing the appropriate colors.
Fig. 4. Sequential scales available in ColorBrewer 2.0 [29] suitable for ordinal data
representation. (For interpretation of the references to color in this figure legend, the
reader is referred to the web version of this article.)
Fig. 5. Two frequency modulated gratings represented using a saturation varying color sc
from [30]. (For interpretation of the references to color in this figure legend, the reader
Ratio data—On ratio data, ratios between values are assumed to beequal and values increase/decrease monotonically about a true zeroor threshold. This feature should be preserved in the representation.An example is absolute temperature measured using the Kelvin scale.
If the ratio data have a relevant zero crossing, it can be preservedby using a double-ended color scale with a transition at zero. If thedata are to be represented by a segmented color scale, then it isprobably a good idea to have an even number of steps (with atransition at the zero level).
6.2. Spatial frequency
An important issue to consider when choosing a color scale ishuman spatial vision. The luminance and saturation mechanisms inhuman vision play an important role in spatial sensitivity, but theyhave different characteristics. The human visual system accuratelyprocesses high-resolution images, or data which varies rapidly overan area, if that spatial variation is represented as a variation inluminance, i.e., the luminance channels are responsible for proces-sing high spatial frequency information. This means that, whenrepresenting data with a high spatial frequency, it is a good idea touse a color scale which provides a strong luminance variationacross the data range [33]. On the other hand, the saturationmechanisms in human vision are more sensitive to low spatialfrequency variations.
Such kind of effects are illustrated in Fig. 5. On the top row, afrequency modulated grating beginning at one cycle per image andincreasing in spatial frequency is presented (the correspondingwaveform is presented on the first column). The variation isrepresented using a saturation varying color scale (in the center)and a luminance varying color scale (on the right). Notice how thesaturation-variation color scale makes the sinusoidal variationmore visible, at the low frequency end of the spectrum, than theluminance varying color scale. On the bottom row, the oppositehappens: with the saturation varying color scale (in the center) youcan only observe the first few cycles of the frequency modulatedgrating, observing twice as many when using the luminancevarying color scale (on the right).
ale (center) and a luminance varying color scale (right). Reproduced with permission
is referred to the web version of this article.)

S. Silva et al. / Computers & Graphics 35 (2011) 320–333 325
Looking, for example, at interval and ratio data, both luminanceand saturation varying color scales can produce the effect of havingequal steps in data to be represented by equal perceived steps onthe color scale, but the first will most certainly be more adequate tohigh spatial frequency data variations, while the second will bemore suited for low spatial frequency variations.
6.3. Task/goals
The goal of a particular visualization is an important issuewhen choosing a color scale. Tasks which require the judgmentof metric quantities in the data tend to be better accomplishedwith color scales which do not vary monotonically in theopponent color channels (brightness, red–green, yellow–blue).On the other hand, tasks involving qualitative judgmentsabout value distribution shape are better served with colorscales varying systematically in brightness, allowing our visualsystem to employ familiar shape-from-shading mechanisms[16].
In situations where the perceived size of an object is important,care must be taken in how the object is colored. An early study byTedford et al. [34] found a significant color-size effect leading to aconclusion that warm colors such as red, orange and yellow appearlarger than cool colors like green.
In another study, by Cleveland et al. [35], users were askedto judge, on a map with equal colored areas in red and green,which one was the largest: the average observers consideredthe red areas were larger. The obtained results suggest also thatthe color–size effect grows stronger for very saturated colors,which indicates that these colors might not be the better choicefor tasks where the user is expected to make judgments aboutsize.
Considering the kind of task to perform, the color scale can bedesigned accordingly [13].
For example, regarding segmentation tasks, some of the rulesused to create isomorphic color scales for ratio and interval data arealso useful for creating maps for segmented data. In high spacial
Fig. 6. Segmented color scales applied to low (top row) and high (bottom row) spatial
references to color in this figure legend, the reader is referred to the web version of thi
frequency data, luminance can be used to convey monotonicity; inlow spacial frequency data monotonicity can be conveyed throughthe saturation component.
When creating a segmented color scale, it is necessary that thesegments be discriminable from one another. This will limit thenumber of steps which can be represented. Bergman et al. [33] statethat a higher number of steps can be effectively discriminated forlow spatial frequency data than for high spatial frequency.
In Fig. 6, on the left side, a five-level segmented color scale isused and, on the right side, a ten-level segmented color scale isused. They are applied to low spatial frequency data (top) and highspatial frequency data (bottom). For the low spatial frequency data(top row), having additional levels provides additional information.For this particular case, additional features of the earth’s magneticfield are revealed (notice the southern hemisphere). On thecontrary, on the bottom row, showing high spatial frequency cloudfraction observations, additional features are not revealed byincreasing the number of color scale steps.
Another notable example concerns highlight tasks. The princi-ples which should guide the selection of a color scale for high-lighting particular features in the data can be found, for example, inJulesz [36]. Using those principles, it is possible to design colorscales which draw attention to a particular range in the data. Whendealing with high spatial frequency data, for example, a possibleapproach can be that of using varying saturation to represent theinformation (maintaining constant luminance), while modifyingthe hue in the regions needing to be highlighted.
The work of D’Zmura [37] and later work by Bauer et al. [38,39]have treated the topic of linear separability, which can also help inhighlighting tasks. When a target has a color which can beseparated from all other background colors with a single straightline in color space, it will be easier to detect, i.e., its perceiveddifference from all others will be clearer.
Another important aspect regarding hue is that similar hues areperceived as part of the same group [19] which leads to, forexample, separate regions on the display having similar hues beingperceived as having a connection. This is useful if the goal of thevisualization is to detect groups within the global data. The
frequency data. Reproduced with permission from [13]. (For interpretation of the
s article.)

S. Silva et al. / Computers & Graphics 35 (2011) 320–333326
different groups can be represented by different (more distant)hues. Nevertheless, it should be noted that color should probably bereserved for the most important groups (while using othergraphical dimensions as shape and size for other groupings) orthis advantage will be reduced [40].
Recently, Tominsky et al. [41], based on a task model proposedby Andrienko et al. [42], have presented several strategies foradapting the color mapping to specific tasks such as segmentation,localization (highlight) and comparison. For lookup tasks, forexample, they use two techniques, histogram equalization andbox-whisker plot adaptation, in order to build a color mappingwhich assigns a higher number of distinguishable colors to thevalue ranges where more data values are concentrated.
6.4. Visualization type
It is important to consider the whole visualization during theprocess of color scale design for the individual elements. For example,3D visualizations have different constraints than those imposed by 2Dvisualizations. A good example of the problems that can occur isrelated with shading: if users use shading cues to judge the 3D shapeof a representation object (e.g., an isosurface); a brightness varyingcolor scale might interfere with the brightness values resulting fromthe shading calculations. Nonetheless, a brightness varying scale maybe used in planar objects on a 3D scene.
Due to the way human vision focuses on the different colors [3]in a 2D visualization a red region is perceived as closer to the userthan a blue region thus creating a depth effect. Therefore, adjacentregions of strong blue and red should be avoided to prevent thiseffect.
Another issue might arise from the requirement of displayingmultiple variables in the same visualization. The used color scalesshould not generally overlap, with the representation for eachvariable interfering with the others as little as possible. For thispurpose, the weaving techniques reviewed above might provide asolution.
When representing multivariate data, motion can also play animportant role as it provides an additional dimension.
Even though color is commonly considered irrelevant in theperception of object movement, Weiskopf [43] proposes a set offive guidelines, supported by a set of psychophysical resultsdescribed in the literature, which concern the use of color to betterconvey motion in visualization.
Those guidelines focus on improving motion perception and thediscrimination of motion direction, on using moving color patternsto highlight and visually group data, and on the influence of thechromatic and achromatic channels in apparent speed perception.The author also proposes two calibration procedures, which arenecessary for the proper application of some of the proposedguidelines, regarding isoluminance and speed calibration. Applica-tion examples are also presented concerning data grouping andflow visualization.
It is also important to note that motion can sometimes be moreeffective to call users attention to a particular element of thevisualization than just changing its color as shown by Bartram et al.[44,45] and therefore using both motion and color in concurrentways, e.g., to highlight two objects, one using motion and the otherusing color (as opposed to Weiskopf’s work where color is used tohelp convey motion), might lead to problems, for example, with themotion highlight diverting attention from the color highlight.
6.5. Audience, cultural connotations and context
It is important to have information about the target audience ofa visualization, since it can provide some clues for color scale
design. For example, conventions in one application area mightplace blue/violet colors of a spectrum scale at the low end (in orderof increasing wavelength), while in another they may be placed atthe high end (in order of increasing frequency) [16]. Therefore,paying attention to area conventions may make the process ofdesigning the color scale easier and help avoid unintentional breakswith viewer expectations.
Furthermore, vision associated problems must also be consid-ered, e.g., older people tend to be less sensitive to color. But one ofthe most common problems is color blindness. This is an importantfactor to have in mind, since it can seriously influence userperformance by limiting the amount of information that can beextracted from color representations. This can be overcome byproviding several parameters which users can adjust, while usinghue as the only way of encoding information must be avoided. Theliterature [46] also describes several tests which can be used todetect color blindness problems in users.
Color can also have strong cultural connotations varying fromculture to culture. Following such cultural conventions it ispossible, for example, to reduce the cognitive load on the vieweror use connotations that suggest natural linkings between avariable or a variable value and the color used to represent it.For example, for an USA audience the color green is connected/associated with the color of money; a natural connotation, whenvisualizing temperatures can be that of high temperatures repre-sented in red and low temperatures in blue [16].
And what about the influence of culture in color cognition?Without going into much detail (given the complexity of thesubject), there is active discussion regarding how culture andlanguage might influence color cognition. On one side (amongothers), Berlin and Kay [48] argue that color cognition is innate andthat color category perception/cognition is universal regardless ofthe language spoken. This is called the universalist view. On theother side, the relativist view (e.g., Saunders et al. [49]) argues thatcolor cognition is a much more culture-related phenomenon andhas pointed several flaws in Berlin and Kay’s study regarding themethodology used and several a priori assumptions. Salomon et al.[31] state that cultural differences limit the number and categoriesof color recognized by an individual. Recently, Regier and Kay [50]argued that a purely universalist or relativist view on this subjectcannot stand against recent findings and, thus, a new viewgathering ideas from both sides might be a more proper approach.
Regarding color categories, Kawai et al. [51] have shown that thenamed category in which each individual color is inserted (bypeople) can influence perceived color difference, i.e., if two colorsbelong to the same named category (e.g., blue) their perceiveddifference will appear smaller than the perceived differencebetween two colors, at the same euclidean distance from eachother, but in different color categories (e.g., blue and purple). For agood illustration of these effects and a description of obtainedexperimental results see Healey et al. [52]. The question remainsregarding how the relativist view, considering color cognition isinfluenced by cultural issues, would influence these findings acrosscultures.
It is also important to understand the influence of externalconditions and how adaptation mechanisms of the eye work: forexample, the negative afterimage of what has been previously seencan result in visual stress from prolonged viewing; as well as thephenomenon of time dependent color perception influenced, forinstance, by different environmental lightings [53] and displaydevice properties. Providing adjustable parameters can be a goodsolution to deal with different output device characteristics. Forinstance, it is important to remember that the same RGB coordi-nates may result in slightly different colors in different outputdevices and, therefore, to render colors accurately some calibrationprocess might be necessary.

S. Silva et al. / Computers & Graphics 35 (2011) 320–333 327
Furthermore, the display device might influence our choice ofcolor scale to meet, for example, power consumption goals inportable devices. Researchers have been striving to propose colorscales which lower display device power consumption. A recentexample is the work of Chuang et al. [54] which propose color scalesallowing up to a 40% save in energy.
7. Learning through experimentation
In order to apply theoretical principles coming from other areas(such as psychophysics), verify the applicability of new principles,and find clues for the definition of new ones, many researchers havebeen conducting user studies [55].
Human color vision, a subject well studied (for more than acentury now), provides strong clues for using color in visualization.However, the choice of colors for a particular task is more difficult,as it is far more complex, than the simple displays used by theexperimental psychologists. So, experiments are necessary to fillthe gap between theory and practice [55]. The main goal is to usewell established theories to build design guidelines and then use anexperiment to validate the guidelines in an applied setting.
7.1. Which Blair project
The work of Rogowitz et al. [47] presents a method which usesvisual judgments to perceptually evaluate color scales. Since theliterature points out that color scales which monotonically increasein luminance are good candidates for representing the magnitudeof continuous data, the proposed method was designed to identifyscales that include a monotonic luminance component. For thatpurpose, an image of a human face was used (Tony Blair), since itprovides a structured visual pattern with gradual variations in
Fig. 7. (a) The eight color scales used in the Which Blair Project [47]; (b) The eight overla
and; (c) An example of a faces matrix used in the experiment. Reproduced with permis
luminance across its surface, thus providing the identification ofirregular variations in the luminance of color scales.
The experiment started from eight color scales (shown in Fig. 7a)and, for each of them, seven additional scales where created, eachsubtending 25% of the original scale, which gave a total of 64 colorscales. Fig. 7b shows the eight overlapping CIELAB greyscales createdand how they looked when applied to Tony Blair’s image.
During the experiment, users were shown 32 pictures randomlyordered for each observer (Fig. 7c shows an example of part of oneof the image matrices used). They then had to rate each pictureaccording to the degree to which the image appeared to be arecognizable photograph of a face. The obtained results seemed toshow that the proposed method may function as a quick procedureof identifying color scales with monotonically increasing lumi-nance with the advantage that it does not require display calibra-tion or lengthy psychophysical procedures.
7.2. Face-based luminance matching
The work of Kindlmann et al. [56] is similar to the one presented byRogowitz et al. [47]. They address the problem of color scaleluminance control by proposing a novel technique for luminancematching. Their technique, given a fixed reference color, and a testcolor with brightness varied by the user, allows matching theluminance of both. They use images of faces in their experimentsince they want to take advantage of humans being good atrecognizing faces, due to brain circuitry dedicated to this process [57].
Their method starts by a black-and-white thresholded image ofa human face: shadows in black and directly lit areas in white. Thetest pattern is then composed by the images in Fig. 8 which alsoinclude a reverse image. Next, they replace black with a shade ofgrey and white with a color. According to the luminance of thecolored region, in comparison with the luminance of the chosengrey, one of the faces will appear positive and the other negative.
pping LAB greyscales (top) and the results of applying them to the Blair photograph
sion from [47]. & 2001 IEEE.

S. Silva et al. / Computers & Graphics 35 (2011) 320–333328
For example, in Fig. 8 the left face is positive. Therefore, to matchthe luminance between the two regions it is only necessary toadjust the intensity of the grey or color region until the point wherenone of the faces appears positive or negative.
The authors claim that their method provides very good resultsand enables the creation of color scales, with any pre-determinedpattern of luminance, in devices (e.g., monitors) which are notcalibrated.
7.3. Other examples
Other examples are the work of Ware [20], which leads to somerules guiding the process of color scale construction, of Healey [58],which presents a technique for effectively choosing multiple colorsfor use during data visualization, and of Montag [59], where the
Fig. 9. A screen capture showing PRAVDAColor integrated in the Data Explorer environm
references to color in this figure legend, the reader is referred to the web version of thi
Fig. 8. Double face image. Reproduced with permission from [56]. & 2002 IEEE.
performance in judging values in univariate maps encoded usingfive different color scales is tested.
8. Auxiliary tools and methods
During the past few years some efforts have been made in orderto provide users (in particular non-experts) with tools and methodswhich allow them to select an appropriate color scale for theirparticular visualization purpose.
8.1. Dynamic exploration of color mappings
Rheingans et al. [60] propose a tool which allows the exploration ofdata sets by interactively manipulating the color scale. On the upperleft of the screen appears the image space which shows the currentlyselected color scale applied to the data. In the center of the screen a 3Dcolor space appears and a curve, within it, shows the path defining thesequence of colors composing the color scale. As the path in the 3Dcolor space is modified, the image is dynamically changed accordingly.
8.2. PRAVDAColor
Bergman et al. [33] present a tool called PRAVDAColor whichfocuses on helping users to select color scales. With that purpose,they have built a library of color scales and defined a set ofperceptual rules which allow selecting appropriate maps accordingto the structure of the data and visualization goal. They present ataxonomy for color scale selection which guides their work:starting from the type (ratio, interval, ordinal or nominal) andspatial frequency of the data, and according to the representation
ent. Reproduced with permission from [33]. & 1995 IEEE. (For interpretation of the
s article.)

Fig. 10. Three-dimensional color scale construction tool. Reproduced with permission from [33]. & 1995 IEEE. (For interpretation of the references to color in this figure
legend, the reader is referred to the web version of this article.)
S. Silva et al. / Computers & Graphics 35 (2011) 320–333 329
task (isomorphic, segmentation or highlight), several guidelines areproposed (see Bergman et al. [33]).
Fig. 9 shows PRAVDAColor integrated in the Data Explorer
environment. With PRAVDAColor the user is presented a set ofcolor scales judged appropriate to the data set (based essentiallyon the data spatial frequency, but also on the presence/absenceof a zero crossing in order to distinguish between ratio and intervaldata) and task. At first, one of those color scales is automaticallyapplied to the data in order to produce a first representation,then the user can freely apply any other of the available colorscales to the data. It is also possible to control the way thecolor scale is mapped onto the data by defining to which colorsthe data minimum, maximum and midpoint values will bemapped.
To build the color scales another tool is also available (similar tothe one proposed by [60]).1 It is a 3D color scale builder. The usercan interactively build a path along a hue–lightness–saturation(HLS) double cone (Fig. 10). This tool provides undo and movefunctions for editing that path. It is then possible to use the createdcolor scale along the Data Explorer pipeline. The output color scale
1 For recent information on 3D color pickers see Wu et al. [61].
can be a linear interpolation between the selected points on the HLS
space, or the user may obtain a discrete color scale, with equallysized segments, for each selected point (which may be suitable forsegmented representation tasks).
8.3. ColorBrewer
ColorBrewer [29] (recently updated to its version 2.0), devel-oped using Macromedia’s Flash, is not exactly a tool to create colorscales or directly decide the better color scale for a data set. Instead,it provides an environment and a set of color scales to help userschoose the best color options for maps (see Fig. 11).
The process starts by defining the number of data classes theuser wants to represent. Then, he chooses the type of legend:sequential, diverging or qualitative. After that, some legendsare presented using different color schemes and the user canchoose among them. An example map is then colored accordingto the user’s choice. It is possible to modify several map para-meters: activate/deactivate a road network, city symbols, or regionborders and their colors (using the interface presented in Fig. 12);zoom; and modify the color with which each of these parametersappear.

Fig. 11. ColorBrewer’s interface [29]. (For interpretation of the references to color in this figure legend, the reader is referred to the web version of this article.)
Fig. 12. ColorBrewer’s interface details [29]. (For interpretation of the references to
color in this figure legend, the reader is referred to the web version of this article.)
Fig. 13. Measured perception function for a rainbow color scale and for a normal-
ized rainbow color scale. Reproduced with permission from [62].
S. Silva et al. / Computers & Graphics 35 (2011) 320–333330
This tool also provides an interesting feature: it informs the userabout some properties of the chosen representation, namely:
1.
If it is suitable for color blind people. 2. If it will withstand black and white photocopying. 3. If it is suitable to view on LCD monitors. 4. If it is color printing friendly (according to tests made on someprinters).
This information is provided by the symbols presented on theleft of Fig. 12 (a red cross over a symbol means that the chosen colorscheme does not support that property).
In the interface area presented on the right of Fig. 12 it ispossible to see the chosen color scheme and obtain the parametersdefining each color using one of two color models (RGB and CMYK).The appearance of roads, cities and region borders can also beenable/disabled in this area and the color for each of these elementscan be chosen. A new feature in ColorBrewer 2.0 is the ability toselect a background for the map (a solid color or terrain data) andthen choose the level of transparency applied to the overlayed data.
The limitation of this tool is the fact that there is no possibility ofusing a different data set to perform the testing.
S. Silva et al. / Computers & Graphics 35 (2011) 320–333 331
8.4. Self-corrected perceptual colormaps
Gresh [62] presents an algorithm which, given a particular colorscale, transforms it into one that is more perceptually uniform, i.e.,equal steps in data values are equally perceived.
The perception function for a particular user on a given monitoris experimentally measured and then, based on those results, thecolor scale is modified to make it as uniform as possible. Fig. 13shows the original measured perception function and the percep-tion function measured for a normalized rainbow color scale.Notice how the new color scale presents a flatter perceptionfunction.
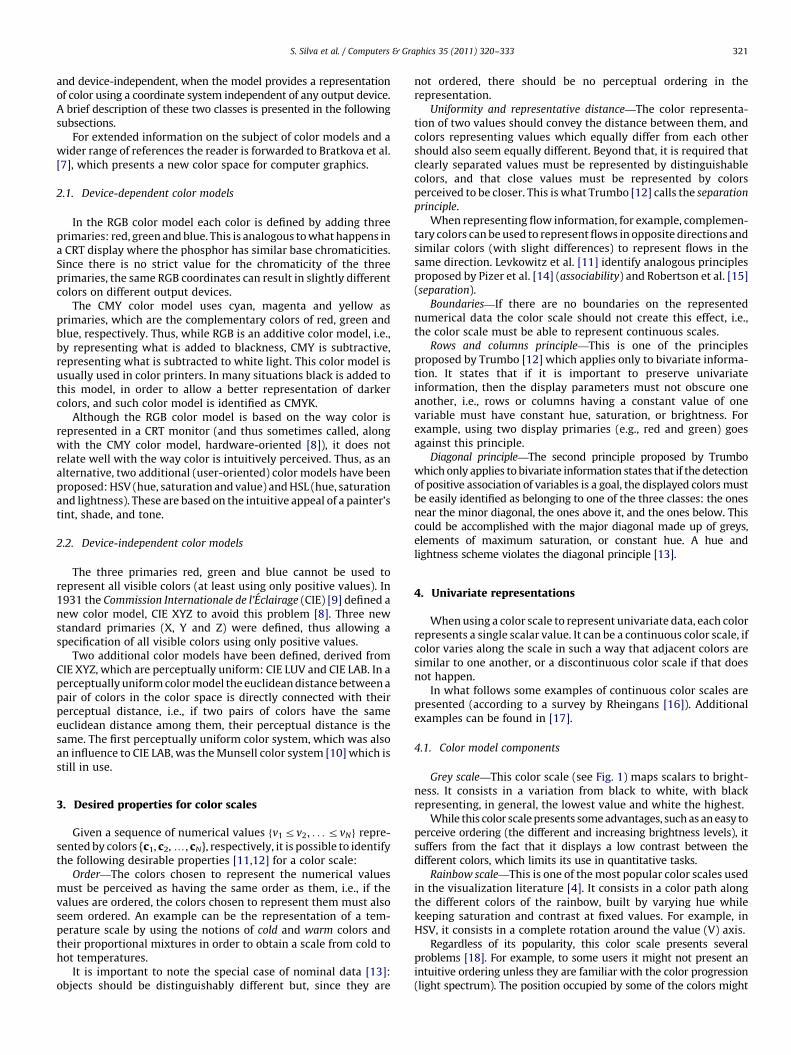
Fig. 14 shows, on the left, a standard rainbow color scale appliedto a topographic data set and, on the right, the same data set coloredwith the obtained normalized rainbow color scale. It is possible toperceive more detail in the image on the right, specially in the blueregion and a reduction of the green region.
8.5. Enhancing visual exploration by appropriate color coding
The work of Schulze-Wollgast et al. [63] extends the methodsproposed by Bergman et al. [33] by extracting statistical metadata
Fig. 14. Left, standard rainbow color scale applied to a topographic data; right, a normali
[62]. (For interpretation of the references to color in this figure legend, the reader is re
Fig. 15. On the left, color scale adapted for a segmentation task according to boxplot qua
different regions. Reproduced with permission from [63]. (For interpretation of the refer
article.)
from the data set, and then using that information to adapt thechosen color scale.
The used metadata consists in the average, median, mode,minimum, maximum, skewness and quartiles of the data set. Whileall these values can be computed for quantitative data, only asubset can be computed for ordinal and nominal data. In the lattercase, only the mode can be computed.
Based on such data several automatic color scale modificationsmay occur which include adjusting control points for setting anappropriate mapping function.
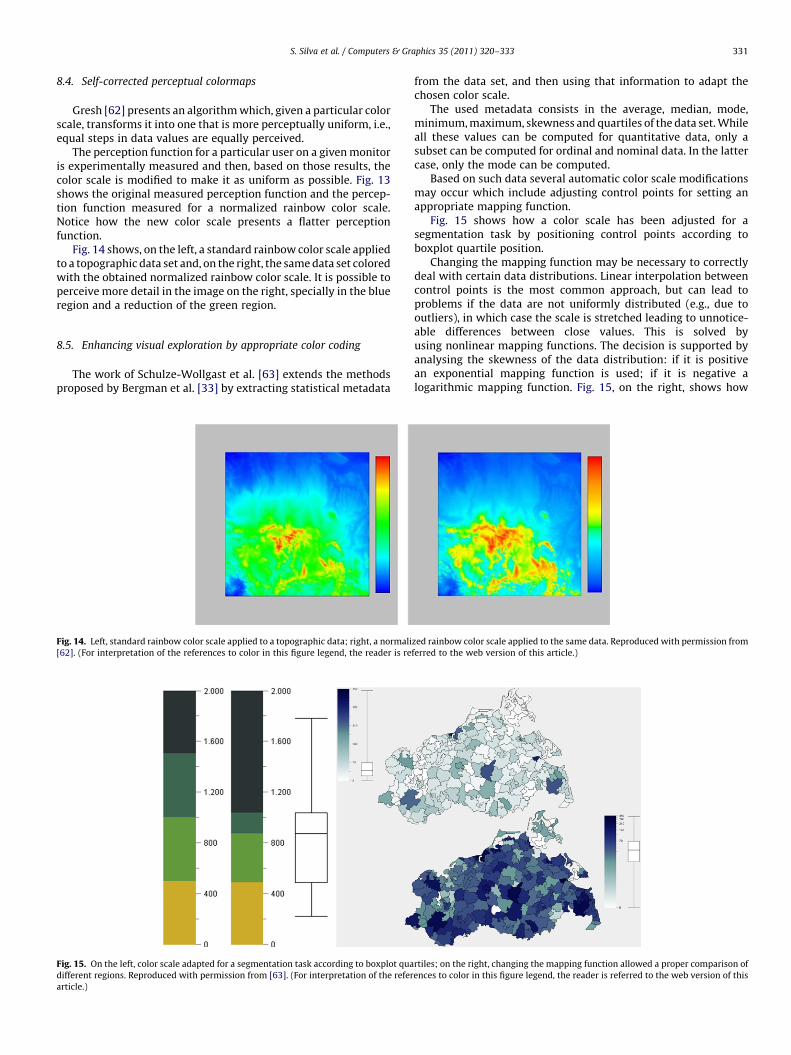
Fig. 15 shows how a color scale has been adjusted for asegmentation task by positioning control points according toboxplot quartile position.
Changing the mapping function may be necessary to correctlydeal with certain data distributions. Linear interpolation betweencontrol points is the most common approach, but can lead toproblems if the data are not uniformly distributed (e.g., due tooutliers), in which case the scale is stretched leading to unnotice-able differences between close values. This is solved byusing nonlinear mapping functions. The decision is supported byanalysing the skewness of the data distribution: if it is positivean exponential mapping function is used; if it is negative alogarithmic mapping function. Fig. 15, on the right, shows how
zed rainbow color scale applied to the same data. Reproduced with permission from
ferred to the web version of this article.)
rtiles; on the right, changing the mapping function allowed a proper comparison of
ences to color in this figure legend, the reader is referred to the web version of this

S. Silva et al. / Computers & Graphics 35 (2011) 320–333332
changing the mapping function allows a better comparison amongregions.
Another feature presented by Schulze-Wollgast et al. [63] is acolor legend which includes a boxplot side-by-side with the colorscale, thus providing a better insight on the data distribution. Thisfeature can be observed in Fig. 15.
8.6. VisCheck and Daltonize
VisCheck [64] is a tool which shows how an image or site is seenby an user with some kind of colorblindness. It is possible to chooseamong three different types of vision deficiencies, deuteranope(red/green deficit), protanope (another red/green deficit) andtritanope (blue/yellow deficit), and then see how it influencesthe perceived colors.
Daltonize [65] is a tool which allows correcting a particularimage in order to allow a better perception of color differences byusers with vision deficiencies.
8.7. Other examples
Other examples are the work of Hyun [66], which deals with thecreation and usage of non-linear color scales, and of Ventura et al.[67], which deals with the problem of ordered/unordered colorscales, and its generation in a device-independent color space,through a computer-aided color coding system based on funda-mental principles of human vision.
9. Conclusion
Given the importance of color in data and information visua-lization, an overview of relevant work regarding the use of color invisualization scenarios is presented. From surveyed literature, it isclear that more detailed knowledge is of paramount importance foran informed use of color in visualization. The guidelines proposedby several authors do not provide a solution for all scenarios, buthelp users to understand the advantages and disadvantages ofusing particular color scales in specific situations, and contributefor a greater awareness to possible issues in their visualizations.The fact that these guidelines are produced with the support ofexperimental work is very important, as it increases their value andhelps in understanding the subjacent concepts and ideas.
The tools proposed to help create color scales which are suitedfor particular data or visualization goals, or which provide envir-onments where color scales can be applied to data using specifictaxonomies, allow that several of those guidelines be transparently(or, at least, with some support) applied by users.
But, even though these guidelines and tools exist, they are notbeing systematically used by practitioners. In fact, one of the mostproblematic color scales known (the rainbow color scale) is still themost used in visualization tools [4]. Therefore, efforts must bemade to motivate the community to pay more attention to theissues related with color usage in visualization, and to justify theirchoices with more than an aesthetic motive.
The surveyed literature also reveals how important it is to learnwith the work of others and will hopefully motivate researchers toshare their experiences in different application areas wherevisualization is present.
By presenting this survey, we aim to provide a contribution tosuch efforts.
Acknowledgment
The first author’s work is funded by grant SFRH/BD/38073/2007awarded by the Portuguese Science and Technology Foundation(FCT).
References
[1] Brodlie K, Carpenter L, Earnshaw R, Gallop J, Hubbold R, Mumford A, et al.Scientific visualization, techniques and applications. Springer; 1992.
[2] Card S, Mackinlay J, Shneiderman B. Readings in information visualization:using vision to think. Morgan Kauffman Publishers; 1999.
[3] MacDonald L. Using color effectively in computer graphics. IEEE ComputerGraphics & Applications 1999;19(4):20–35.
[4] Borland D, Taylor R. Rainbow color map (still) considered harmful. IEEEComputer Graphics & Applications 2007;27(2):14–7.
[5] Silva S, Madeira J, Sousa Santos B. There is more to color scales than meetsthe eye: a review on the use of color in visualization. In: Proceedings of the11th international conference on information visualization (IV07). Zurich,Switzerland: IEEE Computer Society; 2007. p. 943–8.
[6] Gonzalez R, Woods R. Digital image processing. Addison-Wesley; 2002.[7] Bratkova M, Boulos S, Shirley P. oRGB pratical opponent color space
for computer graphics. IEEE Computer Graphics & Applications 2009;29(1):42–55.
[8] Foley JD, van Dam A, Feiner SK, Hughes JF. Computer graphics: principles andpractice. Addison-Wesley; 1990.
[9] CIE, Comission internationale de l’eclairage /http://www.cie.co.atS, onlineMarch 2010.
[10] Landa E, Fairchild M. Charting color for the eye of the beholder. AmericanScientist 2005;93(5):436–43.
[11] Levkowitz H, Herman G. Color scales for image data. IEEE Computer Graphics &Applications 1992;12(1):72–80.
[12] Trumbo B. Theory for coloring bivariate statistical maps. The AmericanStatistician 1981;35(4):220–6.
[13] Rogowitz B, Treinish L. How not to lie with visualization. Computers in Physics1996;10(3):268–73.
[14] Pizer SM, Zimmerman JB, Johnston RE. Contrast transmission in medical imagedisplay. In: Proceedings of the 1st international symposium on medicalimaging and interpretation; 1982. p. 2–9.
[15] Robertson PK, O’Callaghan JF. The generation of color sequences for univariateand bivariate mapping. IEEE Computer Graphics & Applications 1986;6(2):24–32.
[16] Rheingans P. Task-based color scale design. In: Proceedings of the SPIE—28thAIPR workshop: 3D visualization for data exploration and decision making, vol.3905; 2000. p. 35–43.
[17] Bourke P. Color ramping for data visualization /http://local.wasp.uwa.edu.au/pbourke/texture_colour/colourramp/S, online March 2010.
[18] Rogowitz B, Treinish L. Data visualization: the end of the rainbow. IEEESpectrum 1998;35(12):52–9.
[19] Wang L, Giesen J, McDonnell K, Zoliker P, Mueller K. Color design for illustrativevisualization. IEEE Transactions on Visualization and Computer Graphics2008;14(6):1739–54.
[20] Ware C. Color sequences for univariate maps: theory, experiments, andprinciples. IEEE Computer Graphics & Applications 1988;8(5):41–9.
[21] Moreland K. Diverging colormaps for scientific visualization. In: Proceedings ofthe 5th international symposium on visual computing. Lecture Notes inCompuer Science, vol. 5876; 2009. p. 92–103.
[22] Robertson PK. Visualizing color gamuts: a user interface for the effective use ofperceptual color spaces in data displays. IEEE Computer Graphics & Applica-tions 1988;8(5):50–63.
[23] Urness T, Interrante V, Marusic I, Longmire E, Ganapathisubramani B.Effectively visualizing multi-valued flow data using color and texture. In:Proceedings of the IEEE Visualization 2003 (VIS 2003); 2003. p. 115–21.
[24] Hagh-Shenas H, Kim S, Interrante V, Healey CG. Weaving versus blending: aquantitative assessment of the information carrying capacities of two alter-native methods for conveying multivariate data with color. IEEE Transactionson Visualization and Computer Graphics 2007;13(6):1270–7.
[25] Shenas H, Interrante V. Compositing color with texture for multi-variatevisualization. In: Proceedings of the 3rd international conference on computergraphics and interactive techniques in Australasia and South East Asia; 2005.p. 443–6.
[26] Luboschik M, Radloff A, Schumann H. A new weaving technique for handlingoverlapping regions. In: Proceedings of the international conference onadvanced visual interfaces (AVI’10); 2010. p. 25–32.
[27] Chuang J, Weiskopf D, Moller T. Hue-preserving color blending. IEEE Transac-tions on Visualization and Computer Graphics 2009;15(6):1275–82.
[28] Spence R. Information visualization: design for interaction. 2nd ed. PrenticeHall; 2006.
[29] Brewer CA. COLORBREWER 2.0 /http://www.ColorBrewer2.orgS, online March2010.
[30] Rogowitz B, Treinish L. Why should engineers and scientists be worriedabout color? /http://www.research.ibm.com/people/l/lloydt/color/color.htmS, online March 2010.
[31] Salomon G. New uses for color. In: Laurel B, editor. The art of human computerinterface design. Addison-Wesley; 1990. p. 269–78.
[32] Light A, Bartlein PJ. The end of the rainbow? Color schemes for improveddata graphics. EOS Transactions American Geophysical Union 2004;85(40):385–91.
[33] Bergman LD, Rogowitz BE, Treimish LA. A rule-based tool for assisting colormap selection. In: Proceedings of the IEEE visualization ’95, 1995. p. 118–25.

S. Silva et al. / Computers & Graphics 35 (2011) 320–333 333
[34] Tedford WH, Berquist SL, Flynn WE. The size-color illusion. The Journal ofGeneral Psychology 1977;97:145–50.
[35] Cleveland WS, McGill R. A color-caused optical illusion on a statistical graph.The American Statistician 1983;37(2):101–5.
[36] Julesz BT. The elements of texture perception, and their interactions. Nature1981;290(12):91–7.
[37] D’Zmura M. Color in visual search. Vision Research 1991;31(6):951–66.[38] Bauer B, Jolicouer P, Cowan WB. Visual search for color targets that are or are
not linearly-separable from distractors. Vision Research 1996;36:1439–46.[39] Bauer B, Jolicouer P, Cowan WB. The linear separability effect in color visual
search: ruling out the additive color hypothesis. Perception and Psychophysics1998;60(6):1083–93.
[40] Color usage research lab: Using color in information display graphics /http://colorusage.arc.nasa.gov/grouping.phpS, online September 2010.
[41] Tominski C, Fuch G, Schumann H. Task-driven color coding, In: Proceedingsof the 12th international conference on information visualization (IV08); 2008.p. 373–80.
[42] Andrienko N, Andrienko G. Exploratory analysis of spatial and temporal data.Berlin, Germany: Springer; 2006.
[43] Weiskopf D. On the role of color in the perception of motion in animatedvisualizations. In: Proceedings of the IEEE visualization 2004 (VIS 2004); 2004,p. 305–12.
[44] Bartram L, Ware C, Calvert T. Moving icons: detection and distraction. In:Proceedings of the international conference on human–computer interaction(INTERACT 2001); 2001. p. 157–65.
[45] Bartram L, Ware C, Calvert T. Filtering and integrating visual information withmotion. Information Visualization 2002;1(1):66–79.
[46] Meyer G, Greenberg D. Color defective vision and computer graphics displays.IEEE Computer Graphics & Applications 1988;8(5):28–40.
[47] Rogowitz B, Kalvin AD. The which blair project: a quick visual method forevaluating perceptual color maps. In: Proceedings of the IEEE visualization2001 (VIS 2001); 2001. p. 21–6.
[48] Berlin B, Kay P. Basic color terms: their universality and evolution. CambridgeUniversity Press; 1991.
[49] Saunders B, Brakel J. The trajectory of color. Perceptions on Science2002;10(3):302–55.
[50] Regier T, Kay P. Language, thought and color: Whorf was half right. Trends inCognitive Sciences 2009;13(10):439–46.
[51] Kawai M, Uchikawa K, Ujike H. Influence of color category in visual search. In:Proceedings of the annual meeting association for research in vision andophtalmology; 1995. p. 2991.
[52] Healey CG, Enns JT. Large datasets at a glance: combining textures and colors inscientific visualization. IEEE Transactions on Visualization and ComputerGraphics 1999;5(2):145–67.
[53] Gregory R. Eye and brain: the psychology of seeing. 5th ed. Oxford UniversityPress; 1998. p. 133–5.
[54] Chuang J, Weiskopf D, Moller T. Energy aware color sets. Computer GraphicsForum (EUROGRAPHICS 2009) 2009;28(2):203–11.
[55] Kosara R, Healey C, Interrante V, Laidlaw D, Ware C. Visualization view-points—user studies: why, how, and when? IEEE Computer Graphics &Applications 2003;23(4):20–5.
[56] Kindlmann G, Reinhard E, Creem S. Face-based luminance matching forperceptual colormap generation. In: Proceedings of the IEEE visualization2002 (VIS 2002); 2002.
[57] Biederman I, Kalocsai P. 1998. Neural and psychological analysis of object andface recognition. In: Face recognition: from theory to applications. New York:Springer-Verlag, 1998, pp. 3–25.
[58] Healey C. Choosing effective colours for data visualization. In: Proceedings ofthe IEEE visualization ’96; 1996. p. 263–70.
[59] Montag ED. The use of color in multidimensional graphical informationdisplay. In: Proceedings of the IS&T/SID 7th color imaging conference; 1999.p. 222–6.
[60] Rheingans P, Tebbs B. A tool for dynamic explorations of color mappings. ACMComputer Graphics 1990;24(2):145–6.
[61] Wu Y, Takatsuka M. Three dimensional colour pickers. In: Proceedings of the 2005Asia–Pacific symposium on information visualization, vol. 45; 2005. p. 107–14.
[62] Gresh D. Self-corrected perceptual colormaps /http://www.research.ibm.com/people/g/donnagresh/colormaps.pdfS, online March 2010.
[63] Shulze-Wollgast P, Tominski C, Schumann H. Enhancing visual exploration byappropriate color coding. In: Proceedings of the international conference incentral Europe on graphics, visualization and computer vision (WSCG’05);2005. p. 203–10.
[64] Dougherty B, Wade A. Vischeck /http://www.vischeck.com/vischeck/S,online March 2010.
[65] Dougherty B, Wade A. Daltonize /http://www.vischeck.com/daltonize/S,online March 2010.
[66] Hyun Y. Nonlinear color scales for interactive exploration /http://www.caida.org/youngh/colorscales/nonlinear.htmlS, online March 2010.
[67] Ventura A, Schettini R. Computer-aided color coding for data display. In:Proceedings of the 11th IAPR international conference on pattern recognition;1992. p. 29–32.