using crash and injury data to assess vehicles: used … · 11 holden rodeo 96-98 28 4runner/hilux...
TRANSCRIPT
Using crash and injury data to assess
vehicles: Used Car Safety Ratings
OUTLINE Use of crash data – injury severity as a marker of safety
How secondary safety is evaluated using NZ and Australian crash data
– Crashworthiness
– Aggressivity
– Total safety
Related research using fleet data from NZ and Australia
– Safety of NZ vehicle fleet vs. Australian states
– Correspondence between ANCAP ratings and crashworthiness
– Rollover risk for different vehicle types and driver groups
– Effectiveness of Electronic Stability Control for different vehicle types
– Side airbags
– Are high powered vehicle restrictions for you drivers worthwhile?
– Injuries to pedestrians according to vehicle type
– Impacts of NZ WoF regime
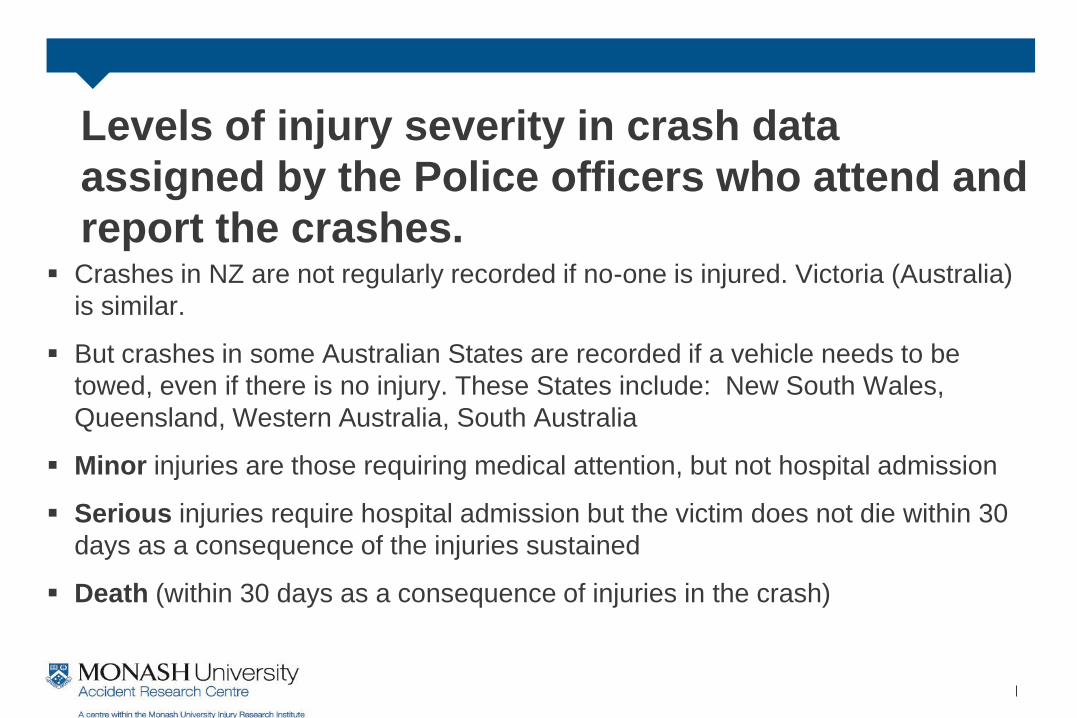
Levels of injury severity in crash data
assigned by the Police officers who attend and
report the crashes. Crashes in NZ are not regularly recorded if no-one is injured. Victoria (Australia)
is similar.
But crashes in some Australian States are recorded if a vehicle needs to be
towed, even if there is no injury. These States include: New South Wales,
Queensland, Western Australia, South Australia
Minor injuries are those requiring medical attention, but not hospital admission
Serious injuries require hospital admission but the victim does not die within 30
days as a consequence of the injuries sustained
Death (within 30 days as a consequence of injuries in the crash)
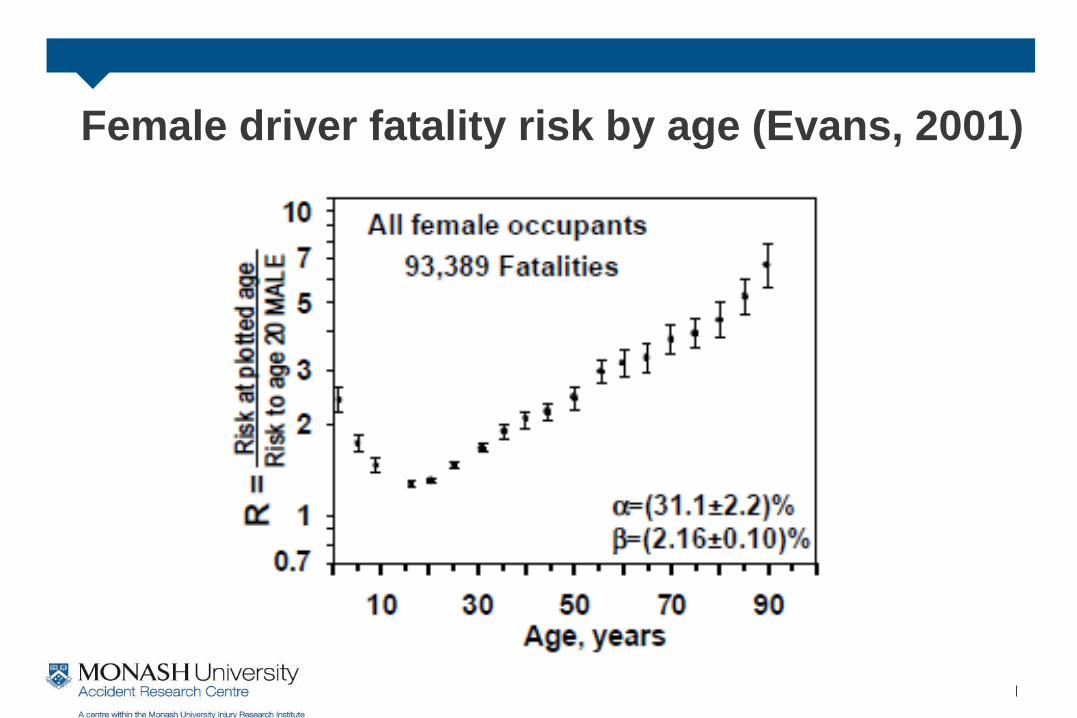
Female driver fatality risk by age (Evans, 2001)
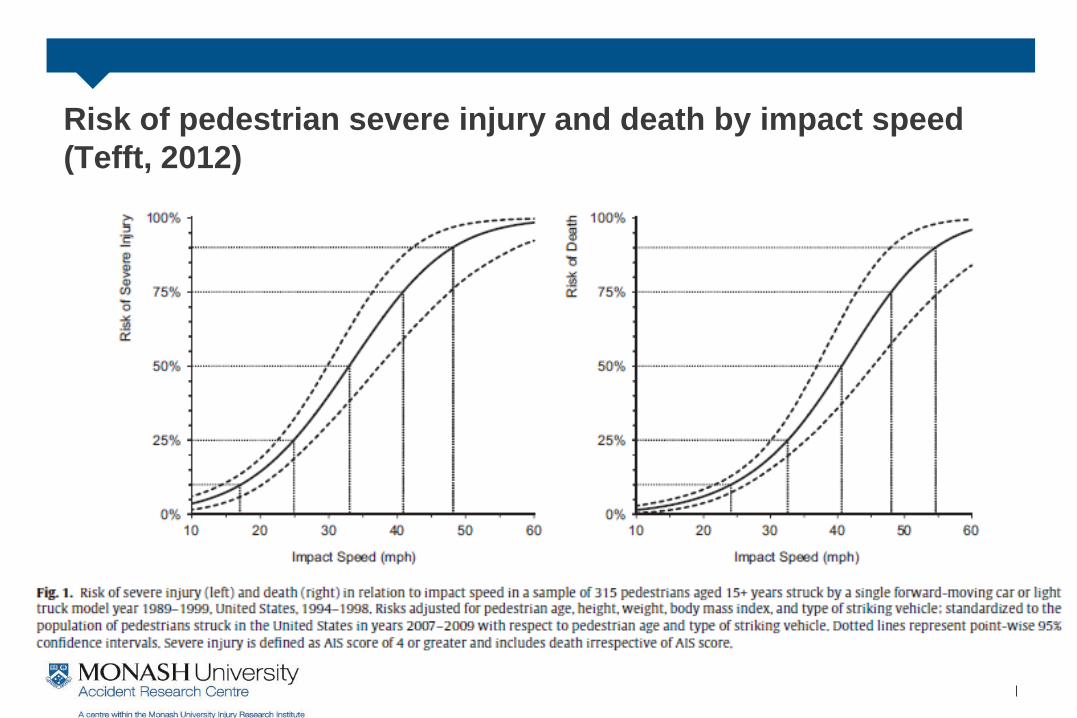
Risk of pedestrian severe injury and death by impact speed
(Tefft, 2012)
How can ACC levies based on vehicle safety
ratings improve safety? NZ currently has a vehicle fleet that is considerably less safe than the Australian
fleet (see some examples later in presentation)
This is almost certainly influenced by the relatively low price of imported second-
hand vehicles
We need initiatives to increase safety
Via levies, vehicle purchasers may become more aware of $ value of safety (as
well as personal value)
This may affect resale value of used cars (increase value for safer vehicles)
Signal to market leading to changes in fleet
– Potential small influence on manufacturers (in vehicle production)
– Influence on importers of new and used vehicles
INTERNATIONAL VEHICLE SAFETY
RATING SYSTEMS USING CRASH DATA
Insurance Institute for Highway Safety, USA
Highway Loss Data Institute, USA
Folksam Insurance, Sweden
Department of Transport, UK
University of Oulo, Finland
Monash University Accident Research Centre, Australia
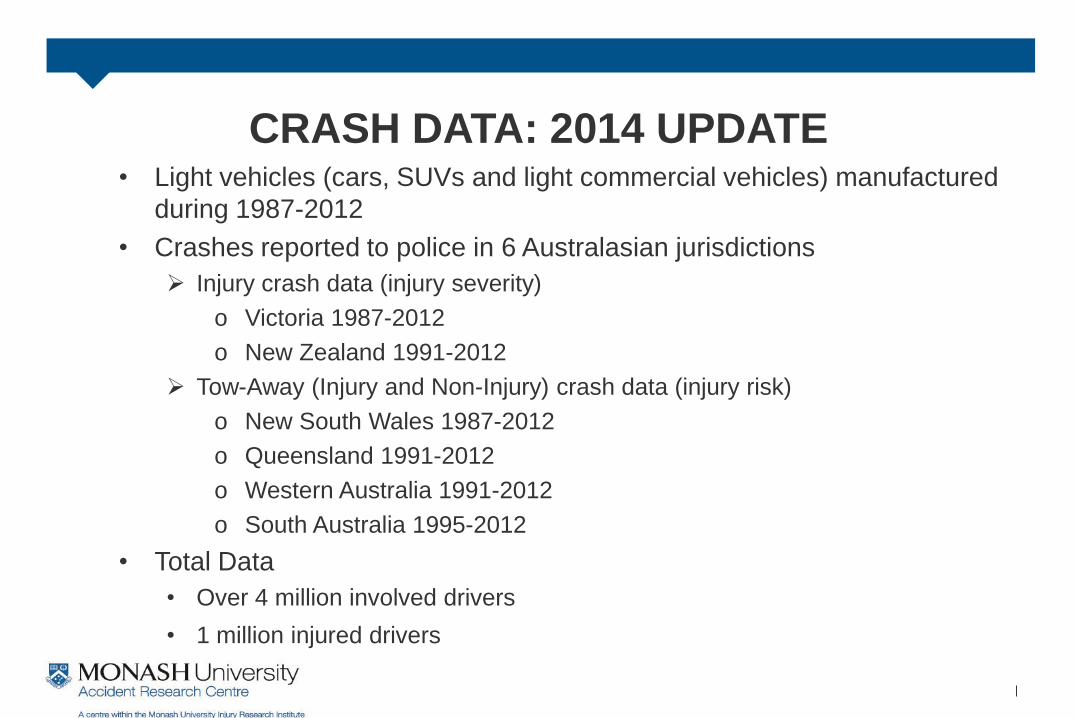
CRASH DATA: 2014 UPDATE • Light vehicles (cars, SUVs and light commercial vehicles) manufactured
during 1987-2012
• Crashes reported to police in 6 Australasian jurisdictions
Injury crash data (injury severity)
o Victoria 1987-2012
o New Zealand 1991-2012
Tow-Away (Injury and Non-Injury) crash data (injury risk)
o New South Wales 1987-2012
o Queensland 1991-2012
o Western Australia 1991-2012
o South Australia 1995-2012
• Total Data
• Over 4 million involved drivers
• 1 million injured drivers
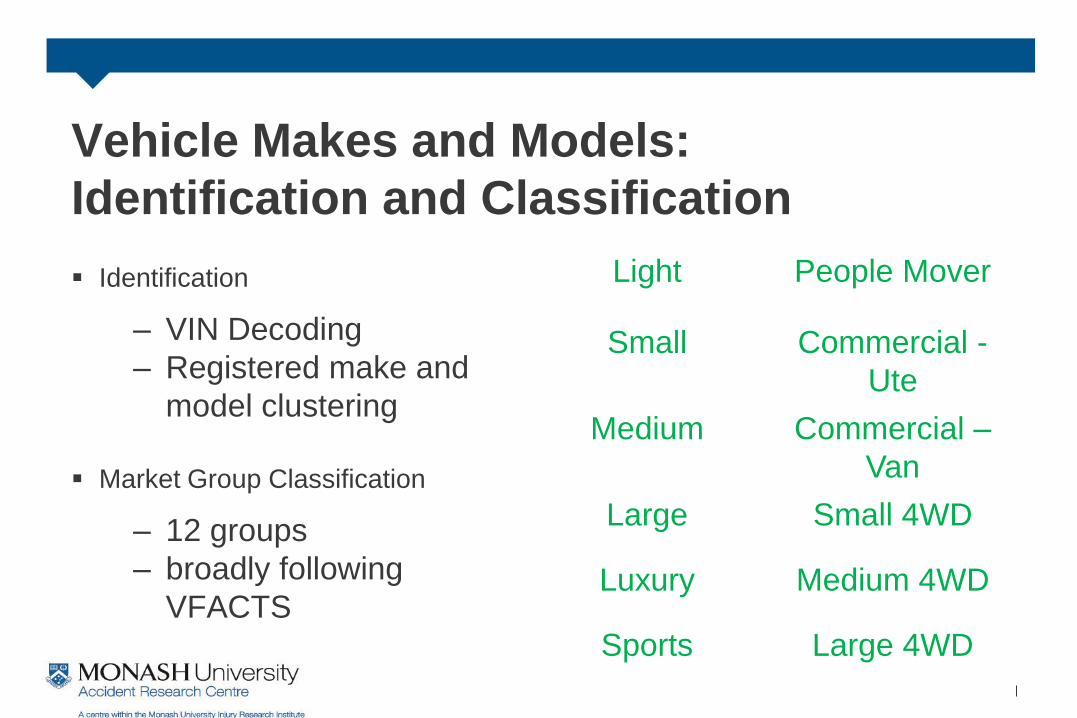
Vehicle Makes and Models:
Identification and Classification
Identification
– VIN Decoding
– Registered make and
model clustering
Market Group Classification
– 12 groups
– broadly following
VFACTS
Light People Mover
Small Commercial -
Ute
Medium Commercial –
Van
Large Small 4WD
Luxury Medium 4WD
Sports Large 4WD
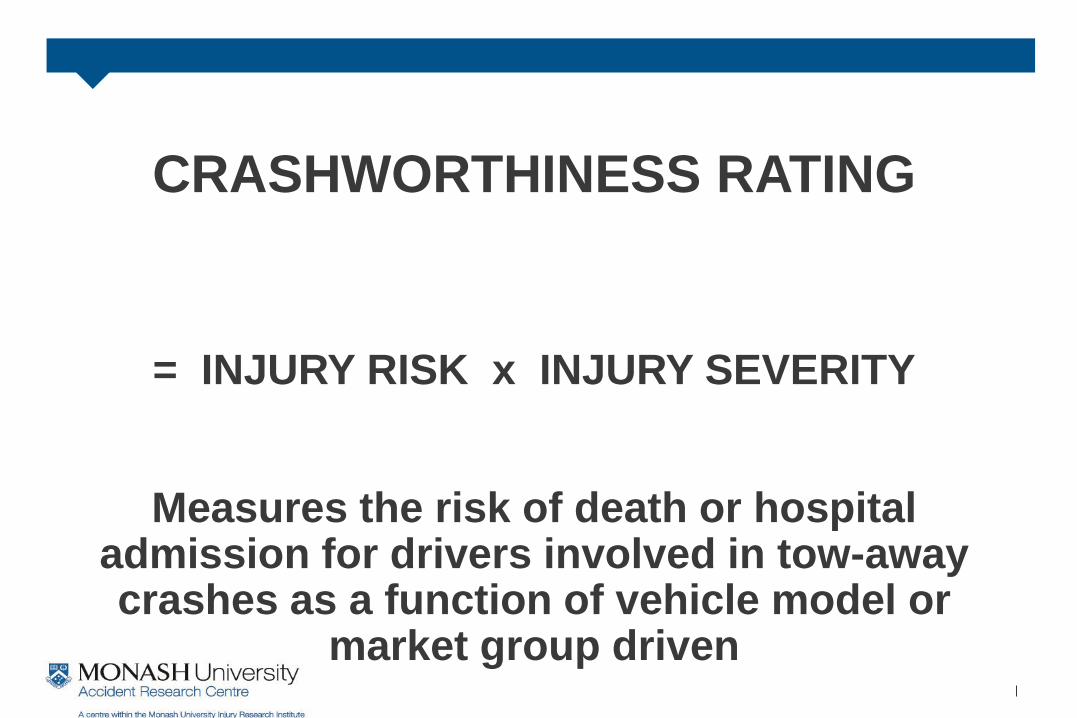
CRASHWORTHINESS RATING
= INJURY RISK x INJURY SEVERITY
Measures the risk of death or hospital admission for drivers involved in tow-away crashes as a function of vehicle model or
market group driven
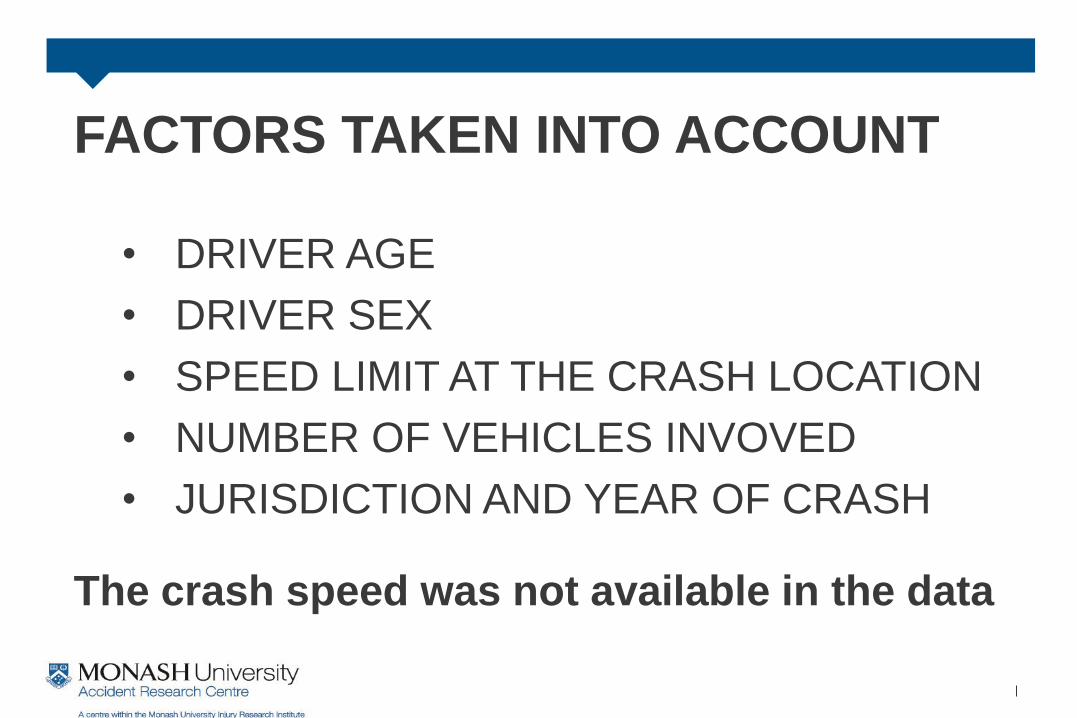
FACTORS TAKEN INTO ACCOUNT
• DRIVER AGE
• DRIVER SEX
• SPEED LIMIT AT THE CRASH LOCATION
• NUMBER OF VEHICLES INVOVED
• JURISDICTION AND YEAR OF CRASH
The crash speed was not available in the data
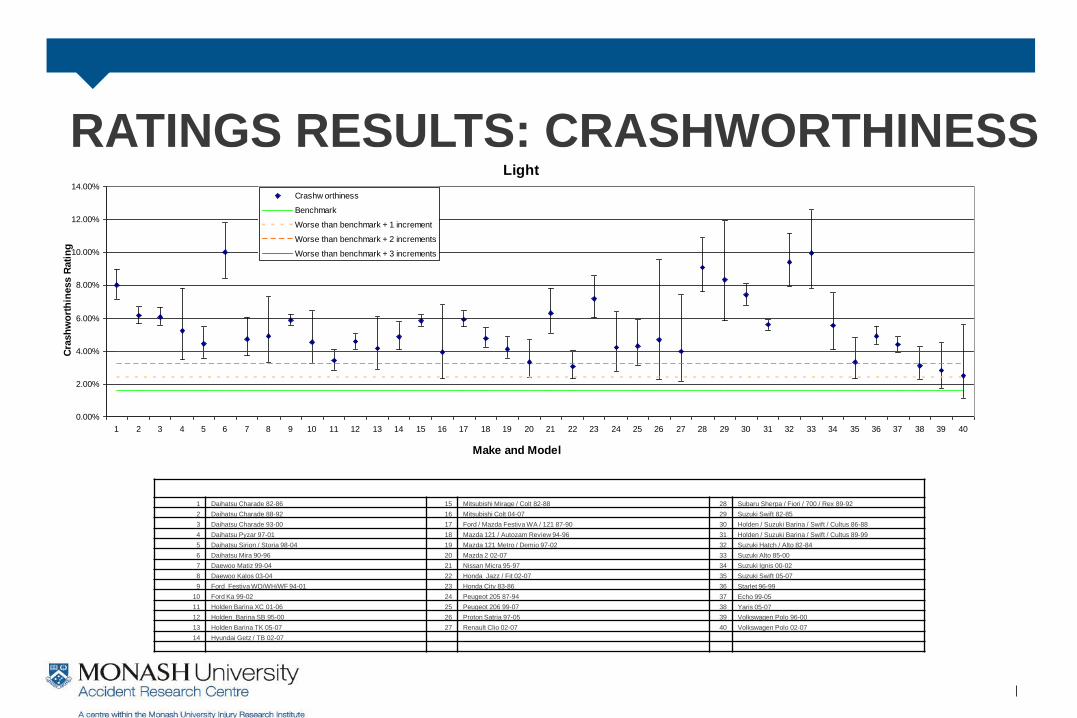
RATINGS RESULTS: CRASHWORTHINESS
1 Daihatsu Charade 82-86 15 Mitsubishi Mirage / Colt 82-88 28 Subaru Sherpa / Fiori / 700 / Rex 89-92
2 Daihatsu Charade 88-92 16 Mitsubishi Colt 04-07 29 Suzuki Swift 82-85
3 Daihatsu Charade 93-00 17 Ford / Mazda Festiva WA / 121 87-90 30 Holden / Suzuki Barina / Swift / Cultus 86-88
4 Daihatsu Pyzar 97-01 18 Mazda 121 / Autozam Review 94-96 31 Holden / Suzuki Barina / Swift / Cultus 89-99
5 Daihatsu Sirion / Storia 98-04 19 Mazda 121 Metro / Demio 97-02 32 Suzuki Hatch / Alto 82-84
6 Daihatsu Mira 90-96 20 Mazda 2 02-07 33 Suzuki Alto 85-00
7 Daewoo Matiz 99-04 21 Nissan Micra 95-97 34 Suzuki Ignis 00-02
8 Daewoo Kalos 03-04 22 Honda Jazz / Fit 02-07 35 Suzuki Swift 05-07
9 Ford Festiva WD/WH/WF 94-01 23 Honda City 83-86 36 Starlet 96-99
10 Ford Ka 99-02 24 Peugeot 205 87-94 37 Echo 99-05
11 Holden Barina XC 01-06 25 Peugeot 206 99-07 38 Yaris 05-07
12 Holden Barina SB 95-00 26 Proton Satria 97-05 39 Volkswagen Polo 96-00
13 Holden Barina TK 05-07 27 Renault Clio 02-07 40 Volkswagen Polo 02-07
14 Hyundai Getz / TB 02-07
Light
0.00%
2.00%
4.00%
6.00%
8.00%
10.00%
12.00%
14.00%
1 2 3 4 5 6 7 8 9 10 11 12 13 14 15 16 17 18 19 20 21 22 23 24 25 26 27 28 29 30 31 32 33 34 35 36 37 38 39 40
Make and Model
Cra
sh
wo
rth
iness R
ati
ng
Crashw orthiness
Benchmark
Worse than benchmark + 1 increment
Worse than benchmark + 2 increments
Worse than benchmark + 3 increments
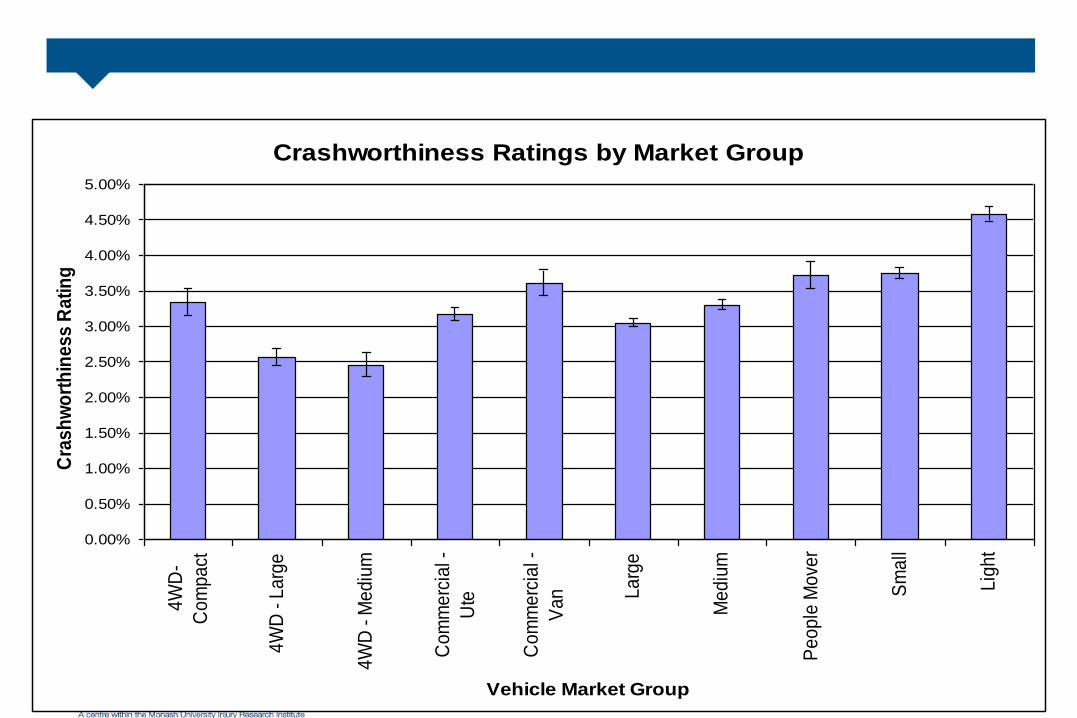
Crashworthiness Ratings by Market Group
0.00%
0.50%
1.00%
1.50%
2.00%
2.50%
3.00%
3.50%
4.00%
4.50%
5.00%4
WD
-
Co
mp
act
4W
D -
La
rge
4W
D -
Me
diu
m
Co
mm
erc
ial -
Ute
Co
mm
erc
ial -
Va
n La
rge
Me
diu
m
Pe
op
le M
ove
r
Sm
all
Lig
ht
Vehicle Market Group
Cra
sh
wo
rth
ine
ss
Ra
tin
g
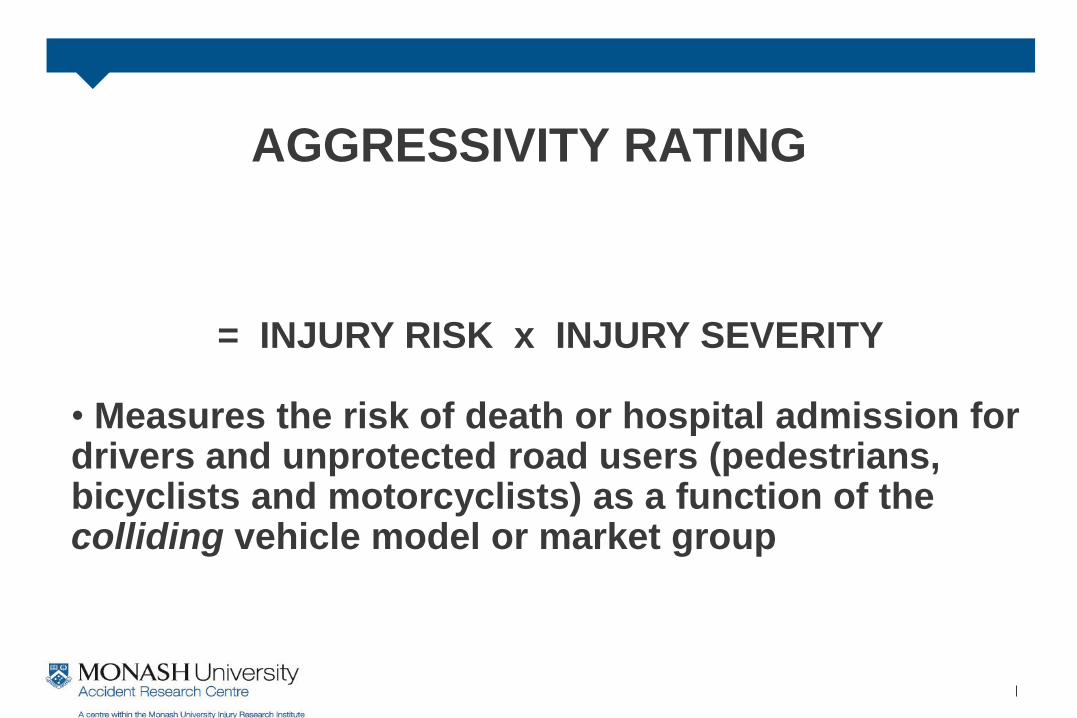
AGGRESSIVITY RATING
= INJURY RISK x INJURY SEVERITY
• Measures the risk of death or hospital admission for drivers and unprotected road users (pedestrians, bicyclists and motorcyclists) as a function of the colliding vehicle model or market group
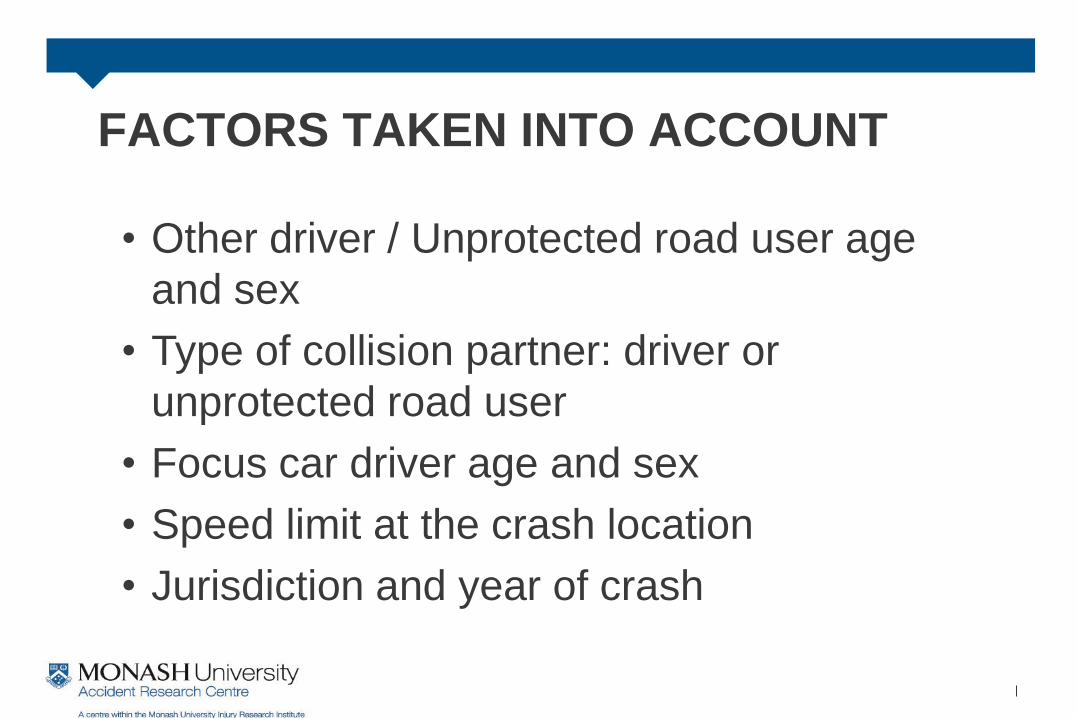
FACTORS TAKEN INTO ACCOUNT
• Other driver / Unprotected road user age
and sex
• Type of collision partner: driver or
unprotected road user
• Focus car driver age and sex
• Speed limit at the crash location
• Jurisdiction and year of crash
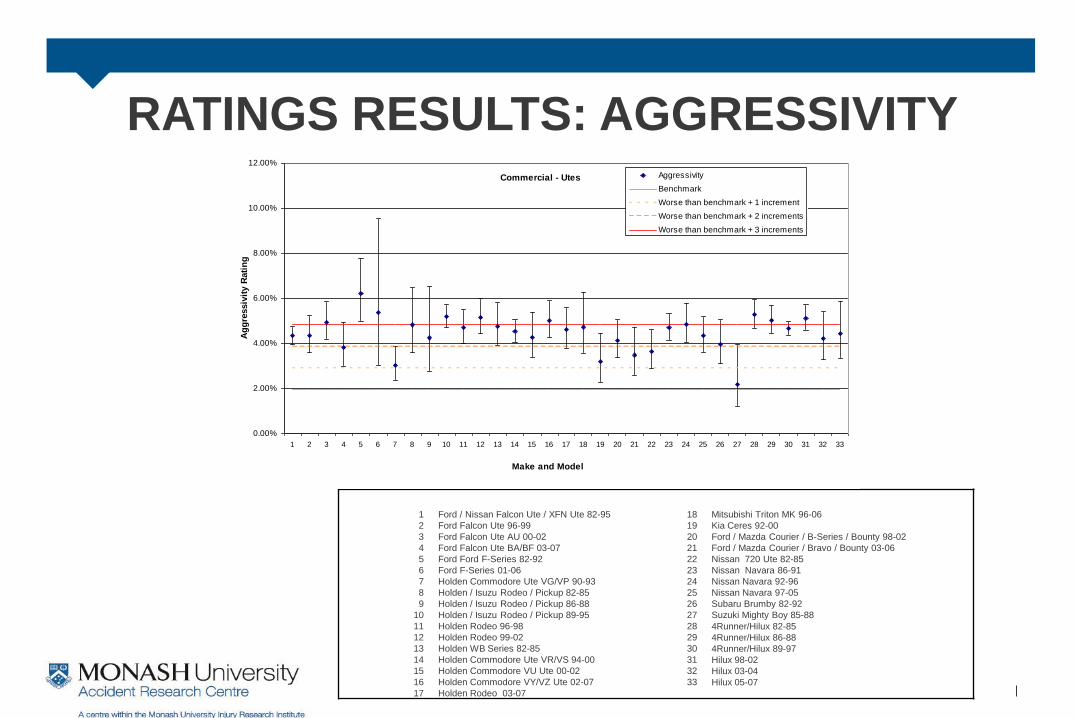
RATINGS RESULTS: AGGRESSIVITY
1 Ford / Nissan Falcon Ute / XFN Ute 82-95 18 Mitsubishi Triton MK 96-06
2 Ford Falcon Ute 96-99 19 Kia Ceres 92-00
3 Ford Falcon Ute AU 00-02 20 Ford / Mazda Courier / B-Series / Bounty 98-02
4 Ford Falcon Ute BA/BF 03-07 21 Ford / Mazda Courier / Bravo / Bounty 03-06
5 Ford Ford F-Series 82-92 22 Nissan 720 Ute 82-85
6 Ford F-Series 01-06 23 Nissan Navara 86-91
7 Holden Commodore Ute VG/VP 90-93 24 Nissan Navara 92-96
8 Holden / Isuzu Rodeo / Pickup 82-85 25 Nissan Navara 97-05
9 Holden / Isuzu Rodeo / Pickup 86-88 26 Subaru Brumby 82-92
10 Holden / Isuzu Rodeo / Pickup 89-95 27 Suzuki Mighty Boy 85-88
11 Holden Rodeo 96-98 28 4Runner/Hilux 82-85
12 Holden Rodeo 99-02 29 4Runner/Hilux 86-88
13 Holden WB Series 82-85 30 4Runner/Hilux 89-97
14 Holden Commodore Ute VR/VS 94-00 31 Hilux 98-02
15 Holden Commodore VU Ute 00-02 32 Hilux 03-04
16 Holden Commodore VY/VZ Ute 02-07 33 Hilux 05-07
17 Holden Rodeo 03-07
Commercial - Utes
0.00%
2.00%
4.00%
6.00%
8.00%
10.00%
12.00%
1 2 3 4 5 6 7 8 9 10 11 12 13 14 15 16 17 18 19 20 21 22 23 24 25 26 27 28 29 30 31 32 33
Make and Model
Ag
gre
ssiv
ity R
ati
ng
Aggressivity
Benchmark
Worse than benchmark + 1 increment
Worse than benchmark + 2 increments
Worse than benchmark + 3 increments
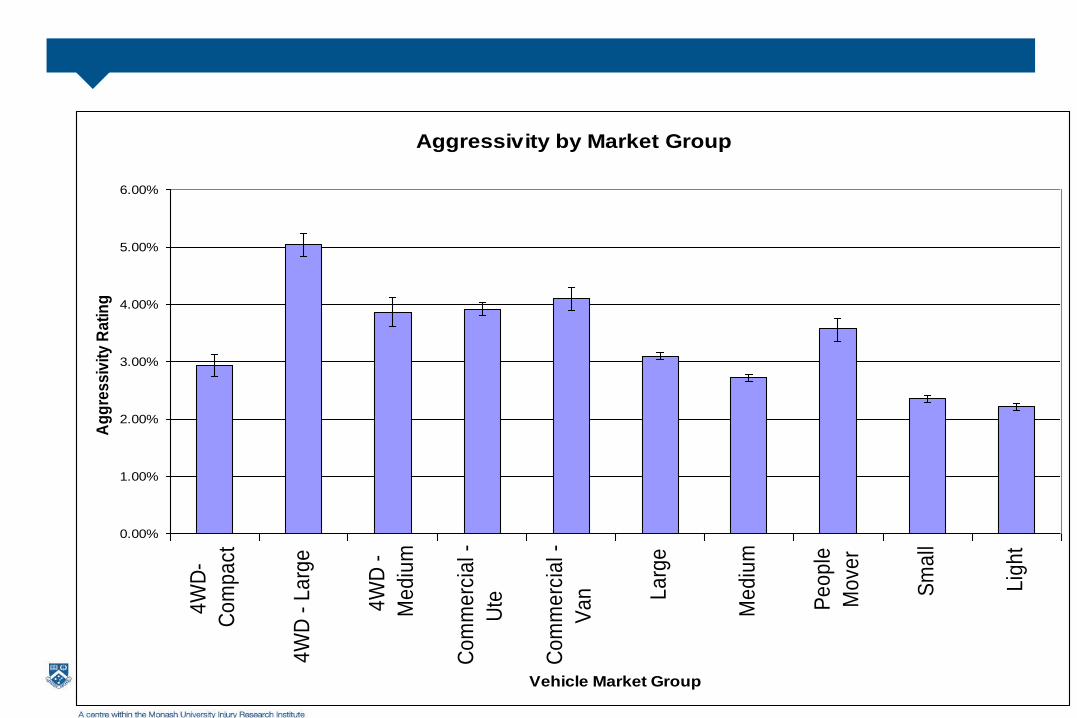
Aggressivity by Market Group
0.00%
1.00%
2.00%
3.00%
4.00%
5.00%
6.00%4
WD
-
Co
mp
act
4W
D -
La
rge
4W
D -
Me
diu
m
Co
mm
erc
ial -
Ute
Co
mm
erc
ial -
Va
n La
rge
Me
diu
m
Pe
op
le
Mo
ver
Sm
all
Lig
ht
Vehicle Market Group
Ag
gre
ss
ivit
y R
ati
ng
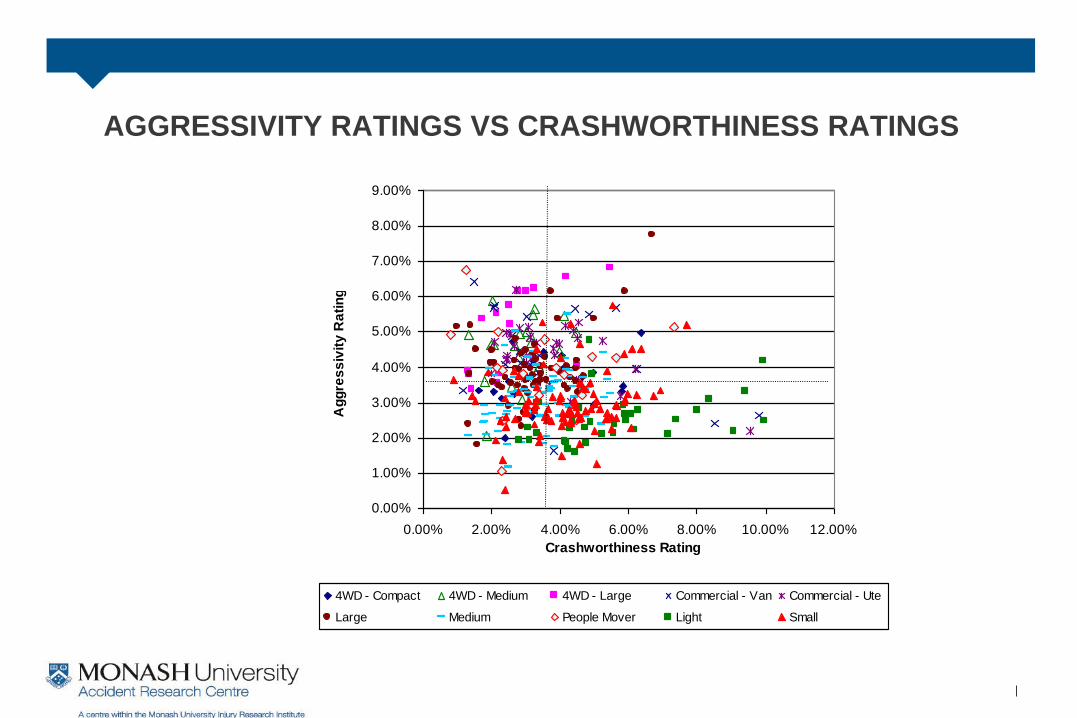
AGGRESSIVITY RATINGS VS CRASHWORTHINESS RATINGS
0.00%
1.00%
2.00%
3.00%
4.00%
5.00%
6.00%
7.00%
8.00%
9.00%
0.00% 2.00% 4.00% 6.00% 8.00% 10.00% 12.00%
Crashworthiness Rating
Ag
gre
ss
ivit
y R
ati
ng
4WD - Compact 4WD - Medium 4WD - Large Commercial - Van Commercial - Ute
Large Medium People Mover Light Small
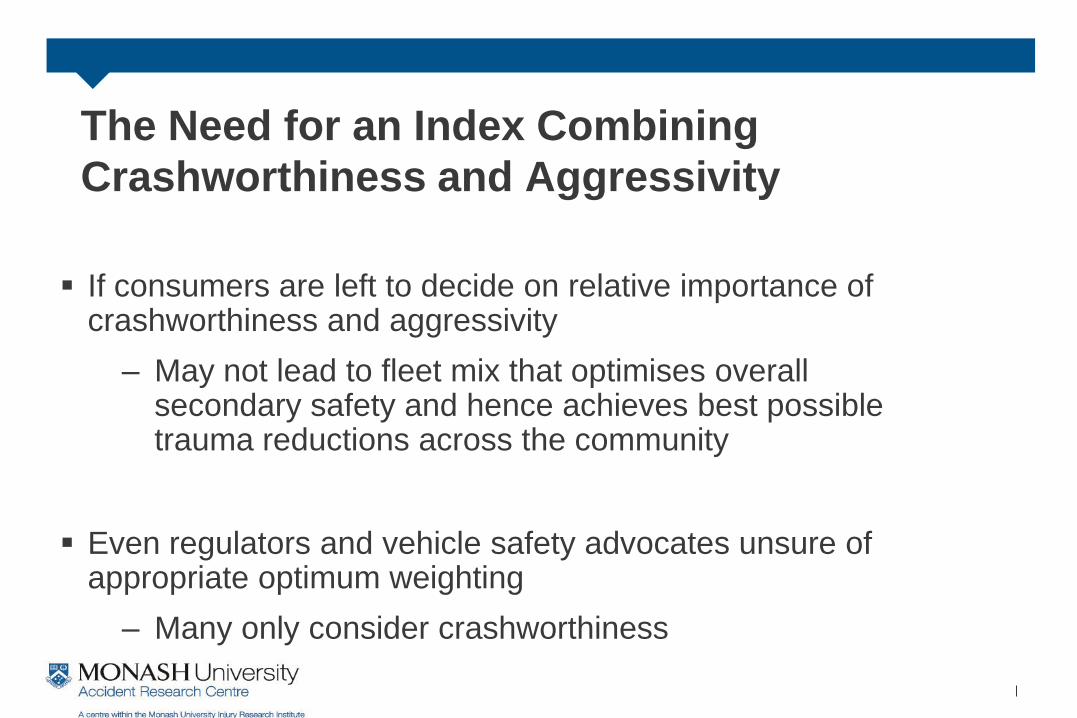
The Need for an Index Combining
Crashworthiness and Aggressivity
If consumers are left to decide on relative importance of crashworthiness and aggressivity
– May not lead to fleet mix that optimises overall secondary safety and hence achieves best possible trauma reductions across the community
Even regulators and vehicle safety advocates unsure of appropriate optimum weighting
– Many only consider crashworthiness
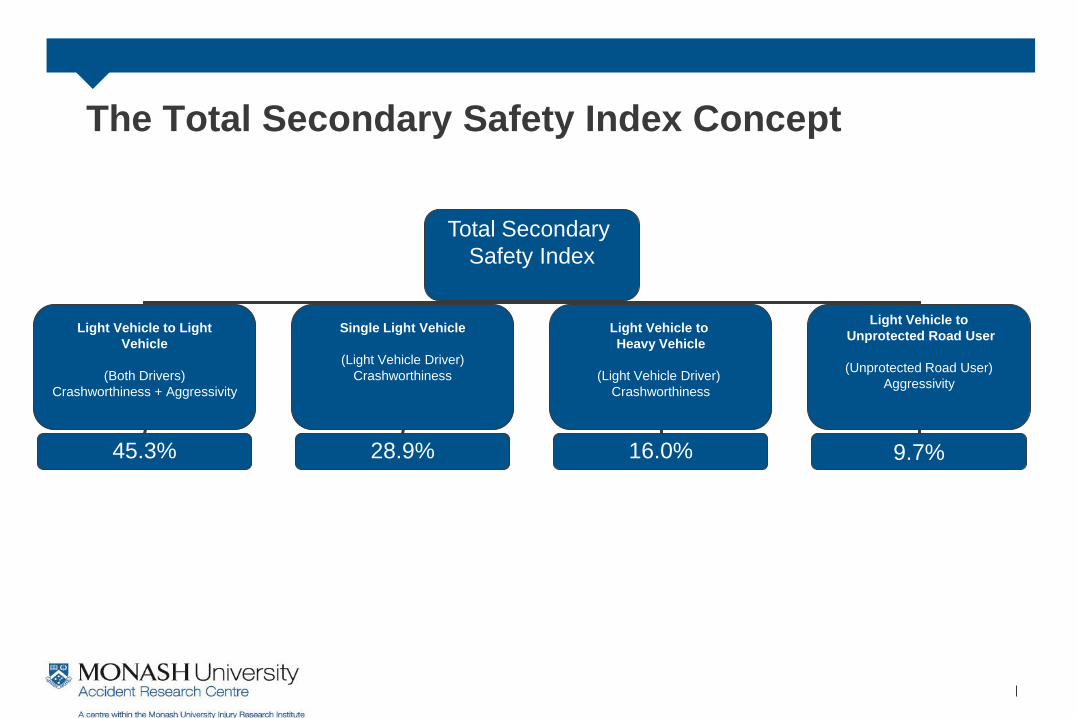
The Total Secondary Safety Index Concept
Total Secondary
Safety Index
Light Vehicle to Light
Vehicle
(Both Drivers)
Crashworthiness + Aggressivity
Single Light Vehicle
(Light Vehicle Driver)
Crashworthiness
Light Vehicle to
Heavy Vehicle
(Light Vehicle Driver)
Crashworthiness
Light Vehicle to
Unprotected Road User
(Unprotected Road User)
Aggressivity
45.3%
28.9%
16.0%
9.7%
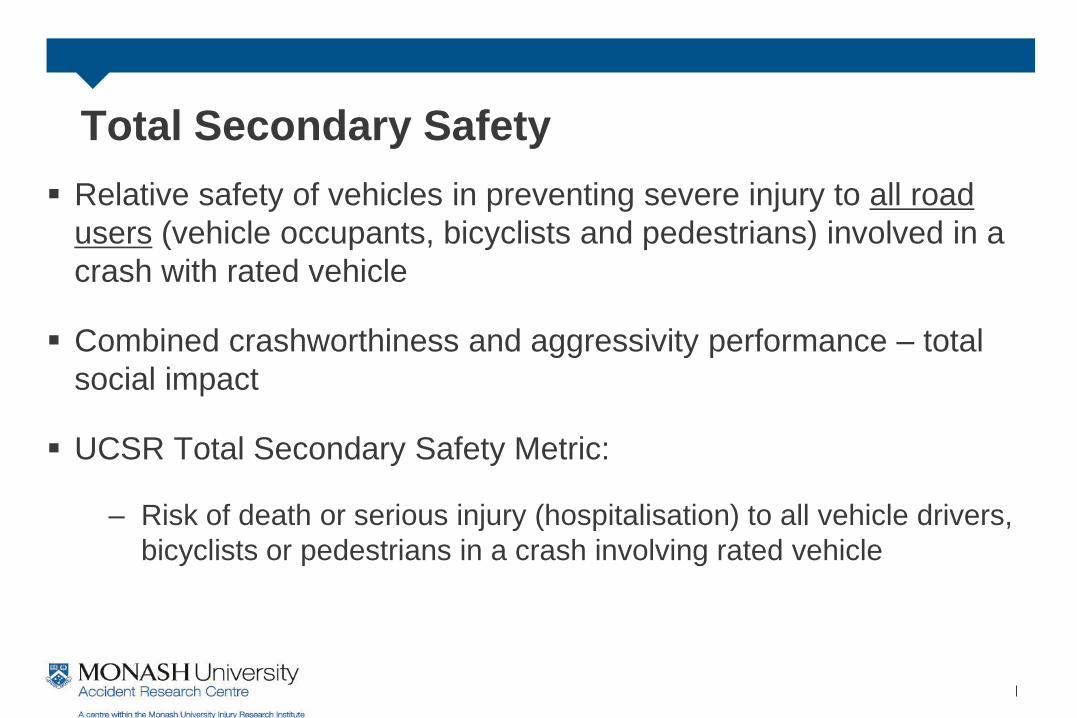
Total Secondary Safety
Relative safety of vehicles in preventing severe injury to all road
users (vehicle occupants, bicyclists and pedestrians) involved in a
crash with rated vehicle
Combined crashworthiness and aggressivity performance – total
social impact
UCSR Total Secondary Safety Metric:
– Risk of death or serious injury (hospitalisation) to all vehicle drivers,
bicyclists or pedestrians in a crash involving rated vehicle
Total Secondary Safety
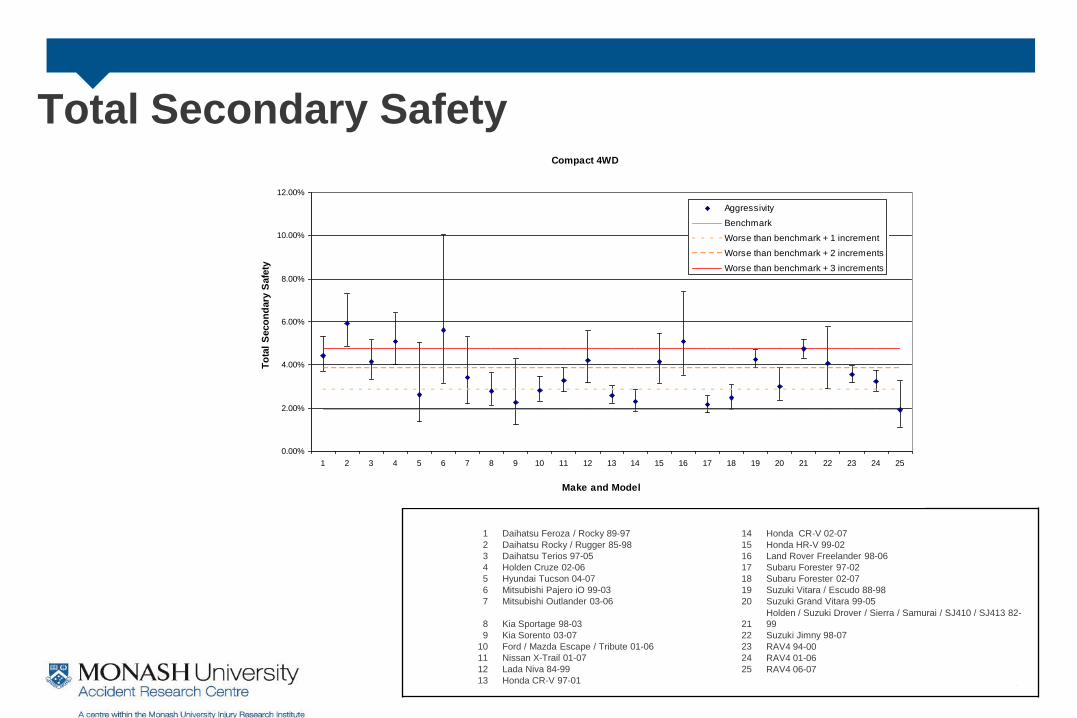
1 Daihatsu Feroza / Rocky 89-97 14 Honda CR-V 02-07
2 Daihatsu Rocky / Rugger 85-98 15 Honda HR-V 99-02
3 Daihatsu Terios 97-05 16 Land Rover Freelander 98-06
4 Holden Cruze 02-06 17 Subaru Forester 97-02
5 Hyundai Tucson 04-07 18 Subaru Forester 02-07
6 Mitsubishi Pajero iO 99-03 19 Suzuki Vitara / Escudo 88-98
7 Mitsubishi Outlander 03-06 20 Suzuki Grand Vitara 99-05
8 Kia Sportage 98-03 21
Holden / Suzuki Drover / Sierra / Samurai / SJ410 / SJ413 82-
99
9 Kia Sorento 03-07 22 Suzuki Jimny 98-07
10 Ford / Mazda Escape / Tribute 01-06 23 RAV4 94-00
11 Nissan X-Trail 01-07 24 RAV4 01-06
12 Lada Niva 84-99 25 RAV4 06-07
13 Honda CR-V 97-01
Compact 4WD
0.00%
2.00%
4.00%
6.00%
8.00%
10.00%
12.00%
1 2 3 4 5 6 7 8 9 10 11 12 13 14 15 16 17 18 19 20 21 22 23 24 25
Make and Model
To
tal
Seco
nd
ary
Safe
ty
Aggressivity
Benchmark
Worse than benchmark + 1 increment
Worse than benchmark + 2 increments
Worse than benchmark + 3 increments

Total Secondary Safety by Market Group Total Secondary safety Rating by Market Group
0.00%
0.50%
1.00%
1.50%
2.00%
2.50%
3.00%
3.50%
4.00%
4.50%
4WD-
Compact
4WD -
Large
4WD -
Medium
Commercial
- Ute
Commercial
- Van
Large Medium People
Mover
Small Light
Vehicle Market Group
To
tal S
ec
on
da
ry S
afe
ty R
ati
ng
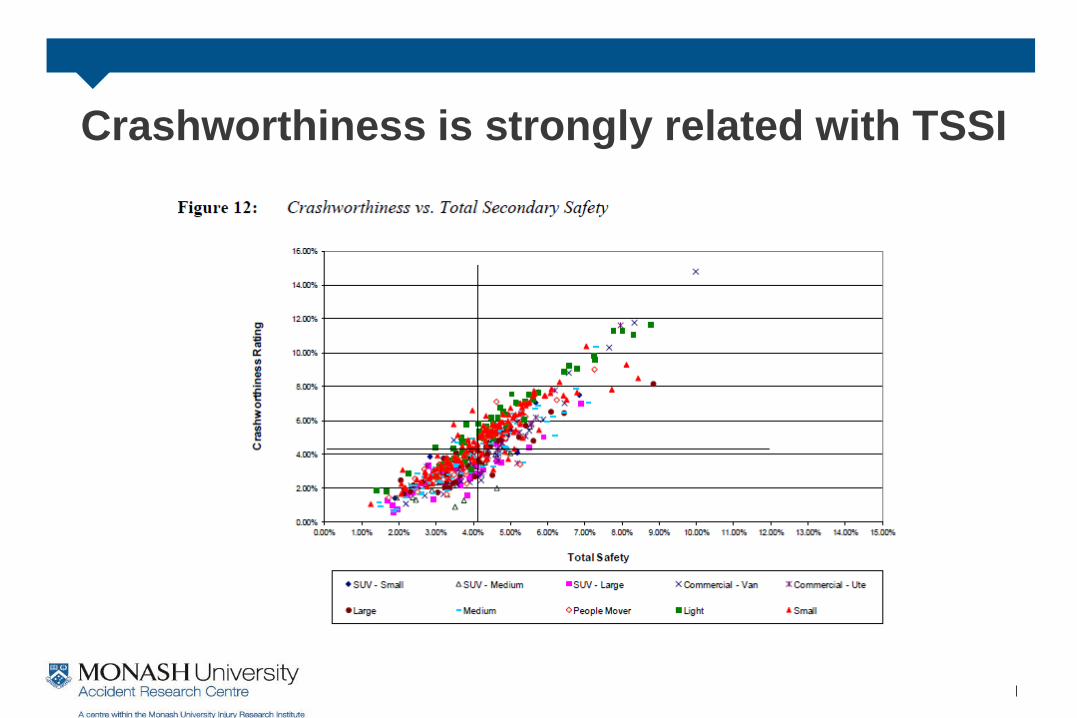
Crashworthiness is strongly related with TSSI
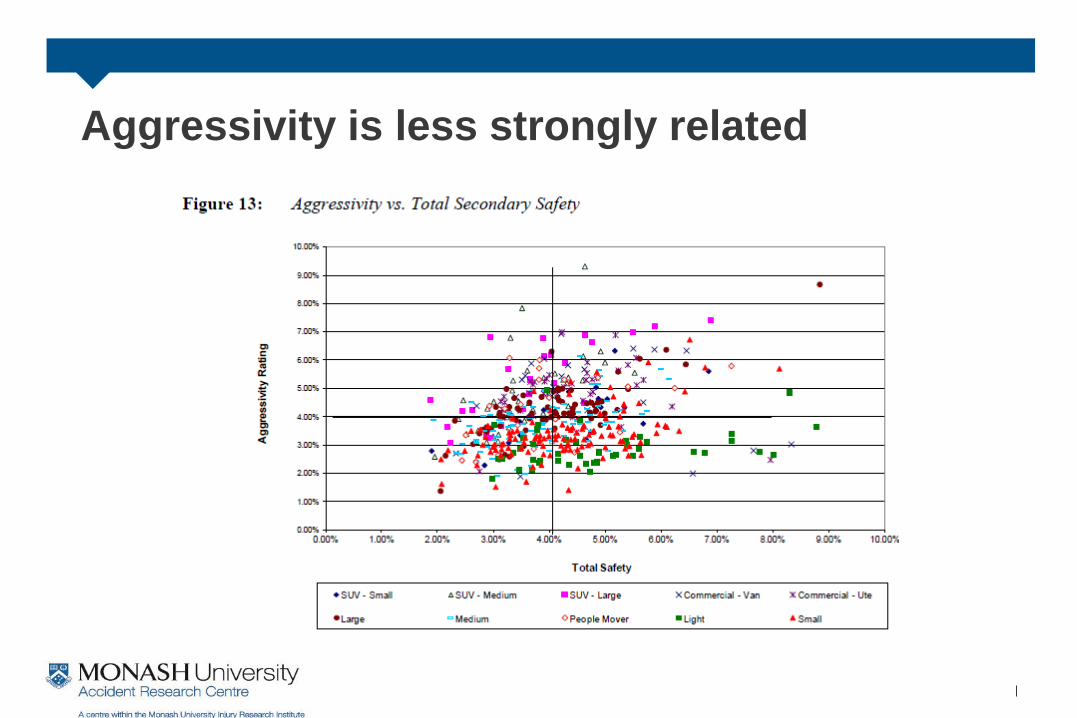
Aggressivity is less strongly related
ALLOCATING RATINGS TO THE NZ
FLEET
NZ fleet is unusual (only 12% are <6 years old)
0%
1%
2%
3%
4%
5%
6%
7%
8%
1970 1975 1980 1985 1990 1995 2000 2005 2010
pro
po
rtio
n o
f fl
eet
year of manufacture
Secondary safety has improved with time
Market group secondary safety has improved…
Challenges – NZ fleet
There are almost 3 million licensed light passenger vehicles
There were 86,317 unique make/model combinations (including
typos on the register) for licensed light passenger vehicles in 2014
Imported used vehicles make up 51% of licensed fleet (2012 data)
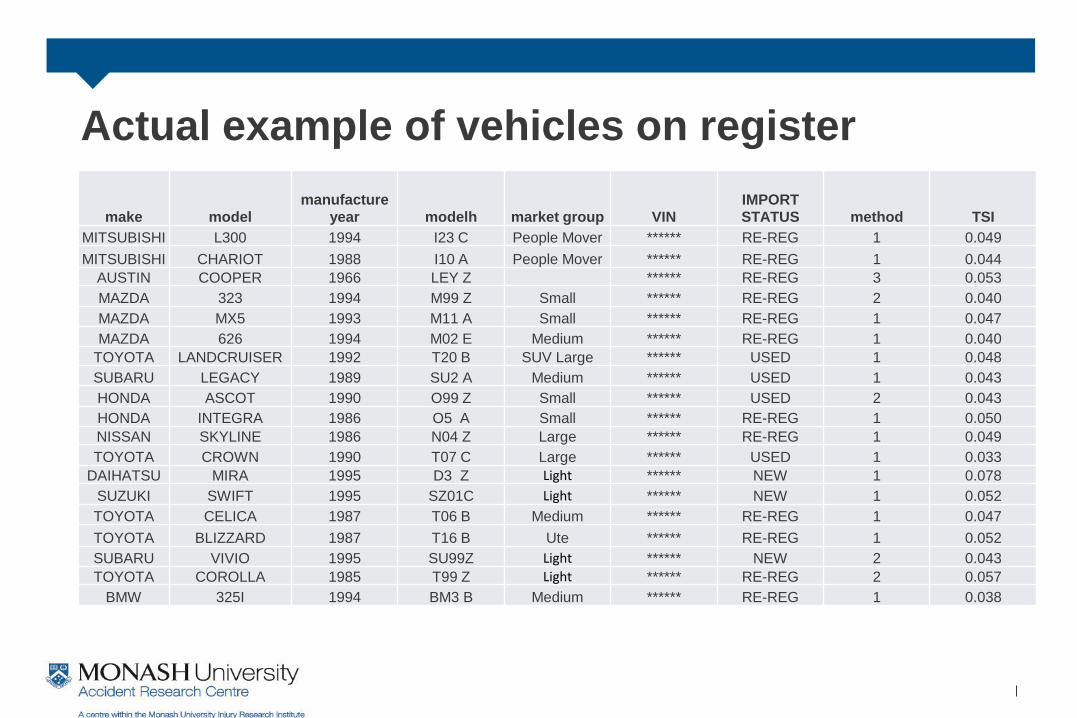
Actual example of vehicles on register
make model manufacture
year modelh market group VIN IMPORT STATUS method TSI
MITSUBISHI L300 1994 I23 C People Mover ****** RE-REG 1 0.049
MITSUBISHI CHARIOT 1988 I10 A People Mover ****** RE-REG 1 0.044
AUSTIN COOPER 1966 LEY Z ****** RE-REG 3 0.053
MAZDA 323 1994 M99 Z Small ****** RE-REG 2 0.040
MAZDA MX5 1993 M11 A Small ****** RE-REG 1 0.047
MAZDA 626 1994 M02 E Medium ****** RE-REG 1 0.040
TOYOTA LANDCRUISER 1992 T20 B SUV Large ****** USED 1 0.048
SUBARU LEGACY 1989 SU2 A Medium ****** USED 1 0.043
HONDA ASCOT 1990 O99 Z Small ****** USED 2 0.043
HONDA INTEGRA 1986 O5 A Small ****** RE-REG 1 0.050
NISSAN SKYLINE 1986 N04 Z Large ****** RE-REG 1 0.049
TOYOTA CROWN 1990 T07 C Large ****** USED 1 0.033
DAIHATSU MIRA 1995 D3 Z Light ****** NEW 1 0.078
SUZUKI SWIFT 1995 SZ01C Light ****** NEW 1 0.052
TOYOTA CELICA 1987 T06 B Medium ****** RE-REG 1 0.047
TOYOTA BLIZZARD 1987 T16 B Ute ****** RE-REG 1 0.052
SUBARU VIVIO 1995 SU99Z Light ****** NEW 2 0.043
TOYOTA COROLLA 1985 T99 Z Light ****** RE-REG 2 0.057
BMW 325I 1994 BM3 B Medium ****** RE-REG 1 0.038
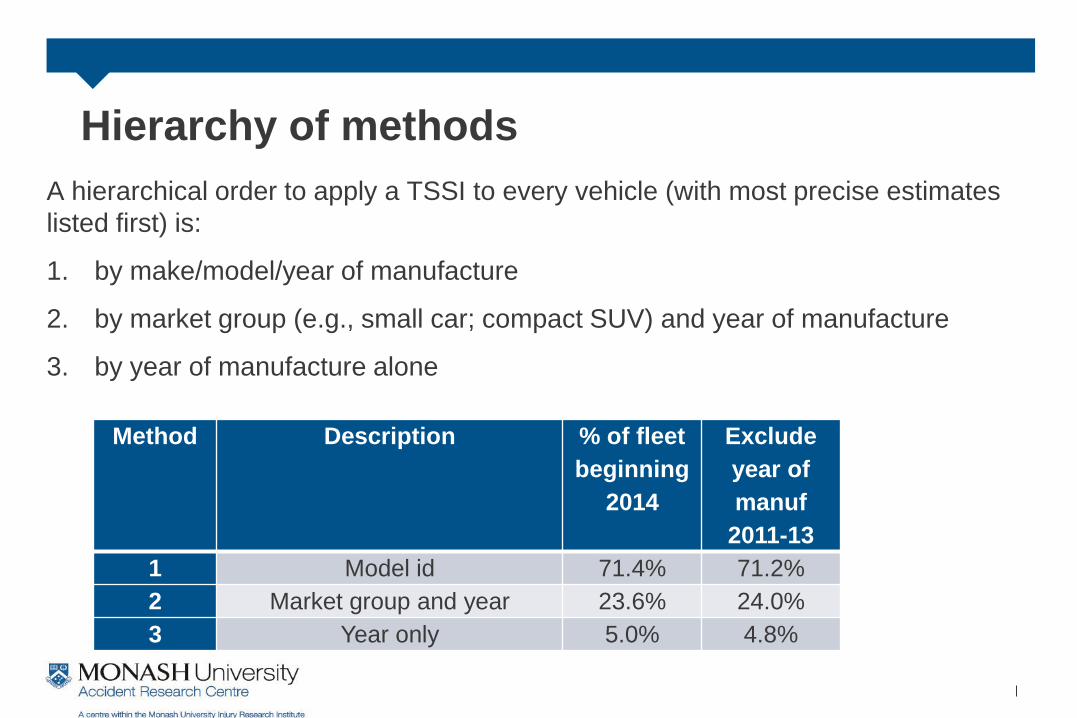
Hierarchy of methods
A hierarchical order to apply a TSSI to every vehicle (with most precise estimates
listed first) is:
1. by make/model/year of manufacture
2. by market group (e.g., small car; compact SUV) and year of manufacture
3. by year of manufacture alone
Method Description % of fleet
beginning
2014
Exclude
year of
manuf
2011-13
1 Model id 71.4% 71.2%
2 Market group and year 23.6% 24.0%
3 Year only 5.0% 4.8%
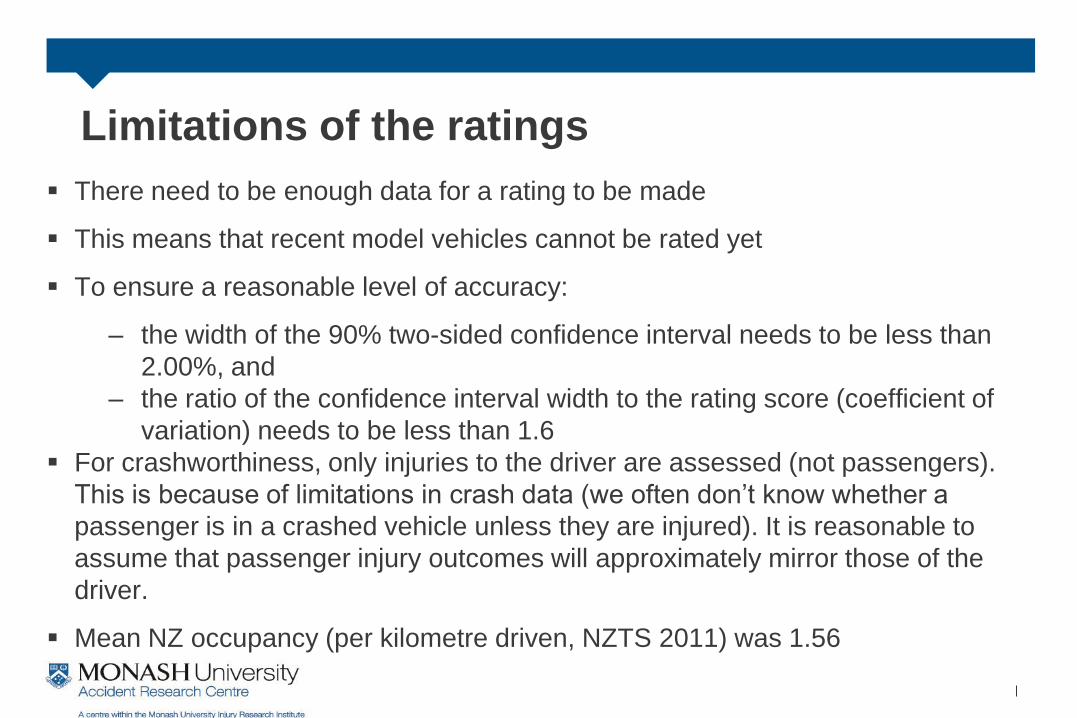
Limitations of the ratings
There need to be enough data for a rating to be made
This means that recent model vehicles cannot be rated yet
To ensure a reasonable level of accuracy:
– the width of the 90% two-sided confidence interval needs to be less than
2.00%, and
– the ratio of the confidence interval width to the rating score (coefficient of
variation) needs to be less than 1.6
For crashworthiness, only injuries to the driver are assessed (not passengers).
This is because of limitations in crash data (we often don’t know whether a
passenger is in a crashed vehicle unless they are injured). It is reasonable to
assume that passenger injury outcomes will approximately mirror those of the
driver.
Mean NZ occupancy (per kilometre driven, NZTS 2011) was 1.56
PRESENTATION OF THE RATINGS
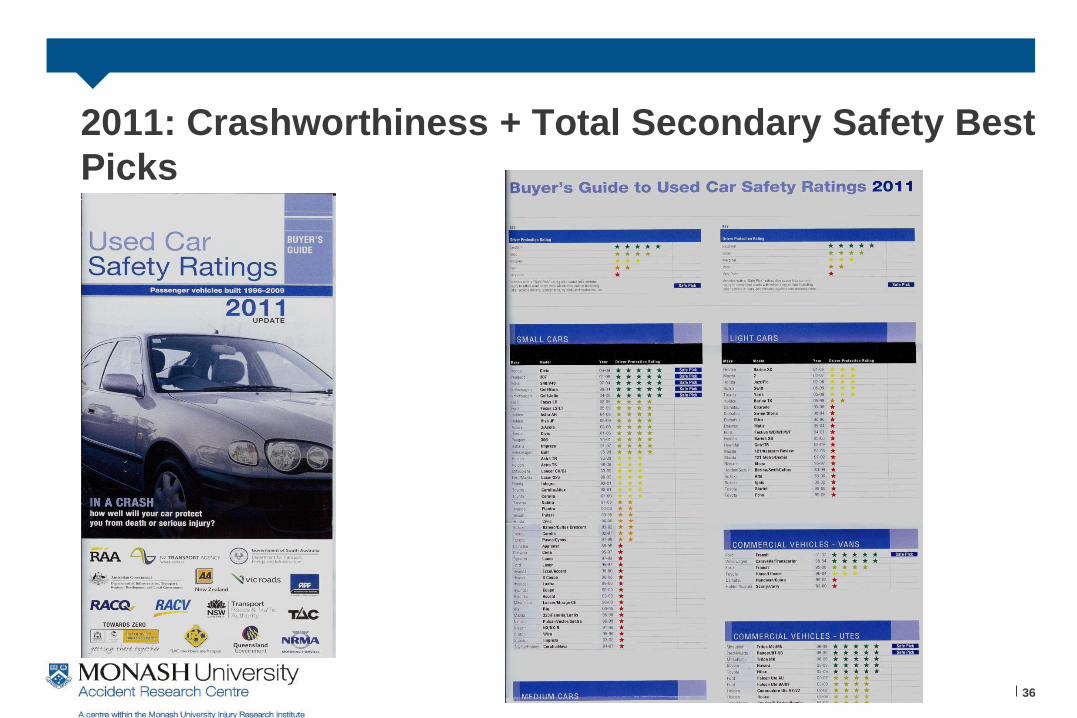
2011: Crashworthiness + Total Secondary Safety Best
Picks
36
Vehicle Safety Research Group:
The Broader Research Programme
Crash fleets by crashworthiness quintile: Region
0%
5%
10%
15%
20%
25%
30%
35%
40%
1 2 3 4 5
Vehicle CWR quintile
%c
ras
h f
leet
quintile
NSW
VIC
QLD
WA
NZ
SA
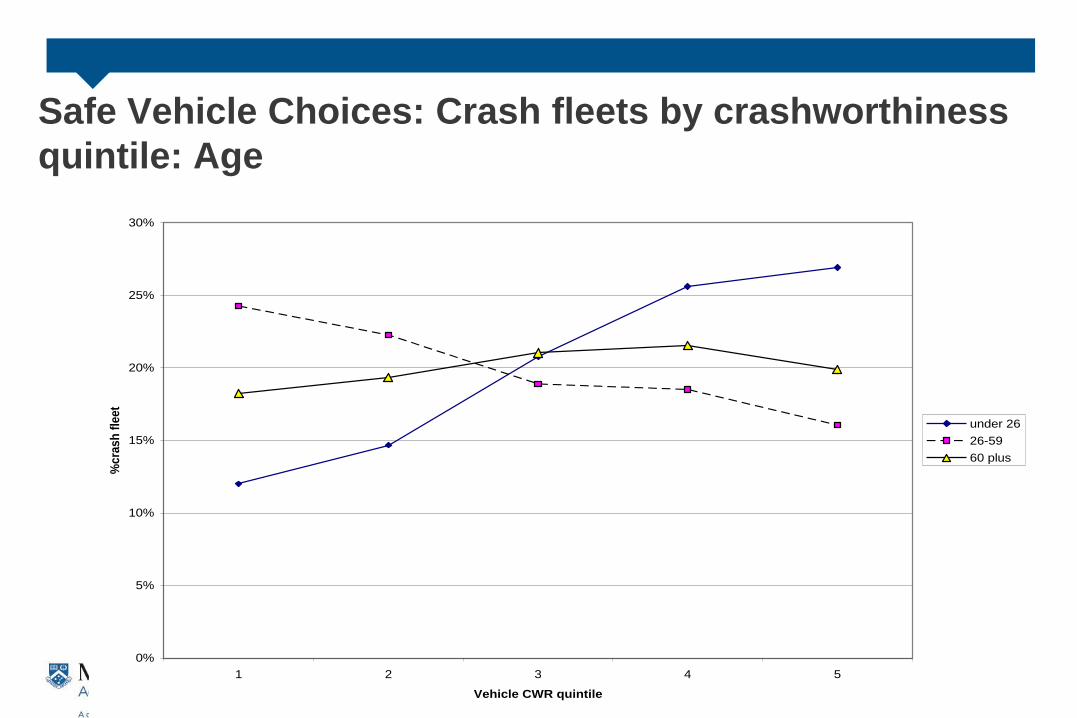
Safe Vehicle Choices: Crash fleets by crashworthiness
quintile: Age
0%
5%
10%
15%
20%
25%
30%
1 2 3 4 5
Vehicle CWR quintile
%cra
sh
fle
et
under 26
26-59
60 plus
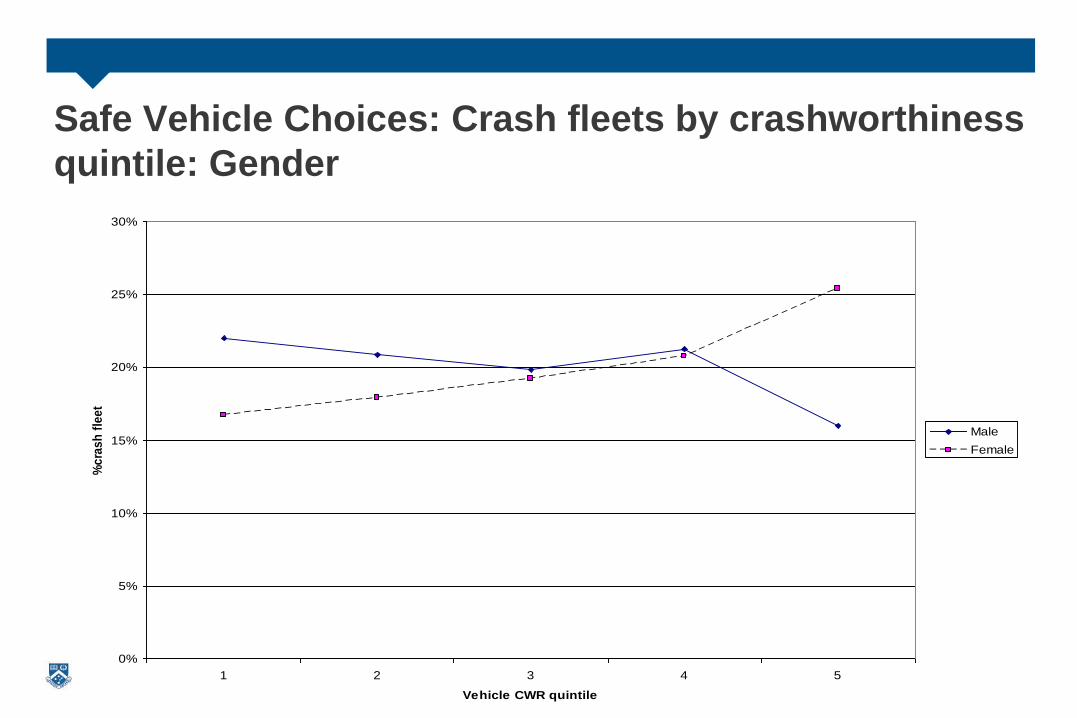
Safe Vehicle Choices: Crash fleets by crashworthiness
quintile: Gender
0%
5%
10%
15%
20%
25%
30%
1 2 3 4 5
Vehicle CWR quintile
%c
ras
h f
lee
t
Male
Female
Older Driver Vehicle Choice
Older drivers tend to drive vehicles which were purchased new or only a few years old
and they retain the vehicles for long periods, possibly until they no longer wish to drive
anymore.
– to prevent missing critical technology, it is vital that older drivers buy the safest
vehicle with the most advanced relevant safety technology. The features
contained in their purchase need to be relevant for years to come.
Choosing the vehicle with the best possible crashworthiness can reduce injury risk by up
to 80% but a minimum of 30% on average
Forward collision avoidance technology with automatic braking across all speeds was
identified as the optional advanced safety technology which best matched the crash
types and driving behaviour of older drivers. It was found to be associated with
expected injury crash reductions for older drivers of about 10-23%. Curtain airbags and
ESC also important.
ANCAP results to predict crashworthiness
(chance of fatal or serious injury in a crash)
ANCAP crash test results conducted from 1997 to 2007
69 cars were able to also have crashworthiness ratings estimated
Problems with this sort of exercise include:
– ANCAP safety ratings should not generally be compared across vehicle
categories, particularly if there is a large mass difference
– ANCAP ratings protocols change over time to reflect increased safety
levels, so comparing ratings across time periods can be problematic
– The crashworthiness ratings (from the Used Car Safety Ratings) are
based on crash data, so have statistical uncertainty
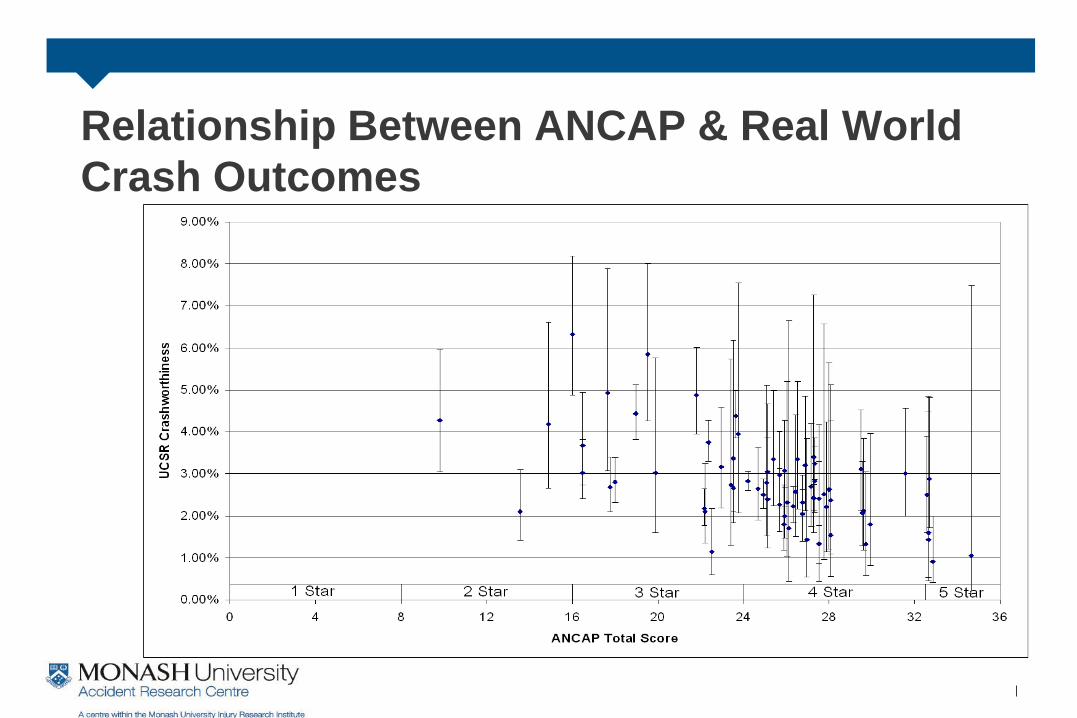
Relationship Between ANCAP & Real World
Crash Outcomes
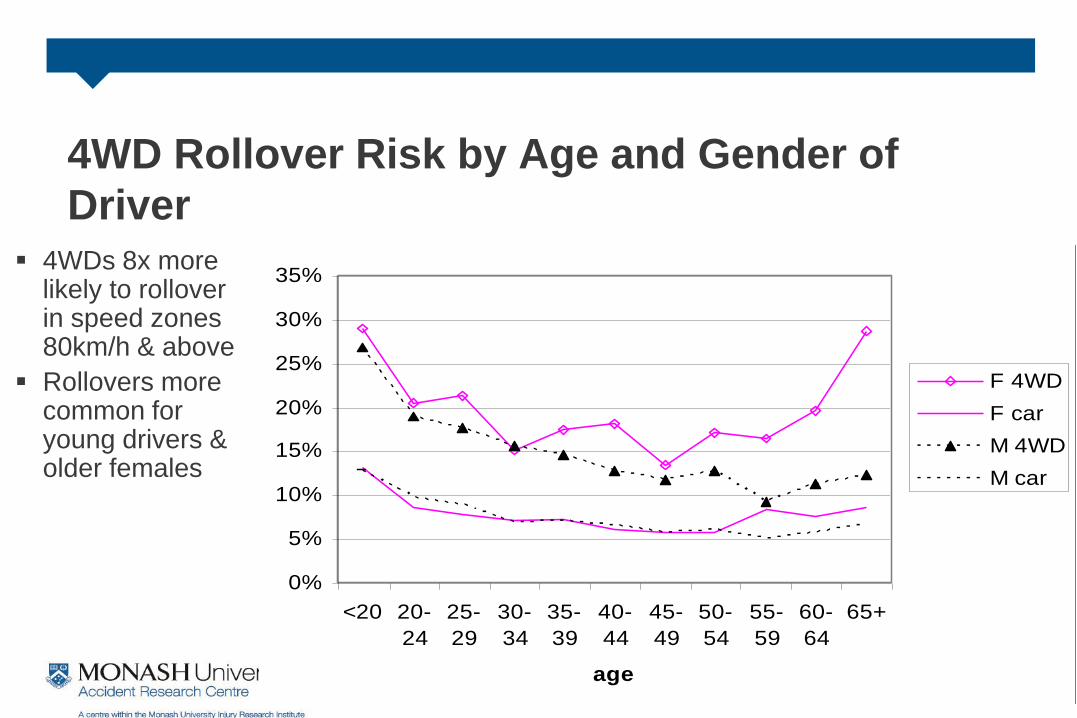
4WD Rollover Risk by Age and Gender of
Driver 4WDs 8x more
likely to rollover in speed zones 80km/h & above
Rollovers more common for young drivers & older females
% of crash-involved drivers in rollover vehicle
crashes on RURAL speed limit roads by car / 4WD,
sex and age
0%
5%
10%
15%
20%
25%
30%
35%
<20 20-
24
25-
29
30-
34
35-
39
40-
44
45-
49
50-
54
55-
59
60-
64
65+
age
F 4WD
F car
M 4WD
M car
-100
-80
-60
-40
-20
0
20
40
60
80
100
All Crashes SVA only MVA only
Crash Type
Ad
juste
d E
ffecti
ven
ess (
%)
ALL VEHICLES
SUVS
CARS
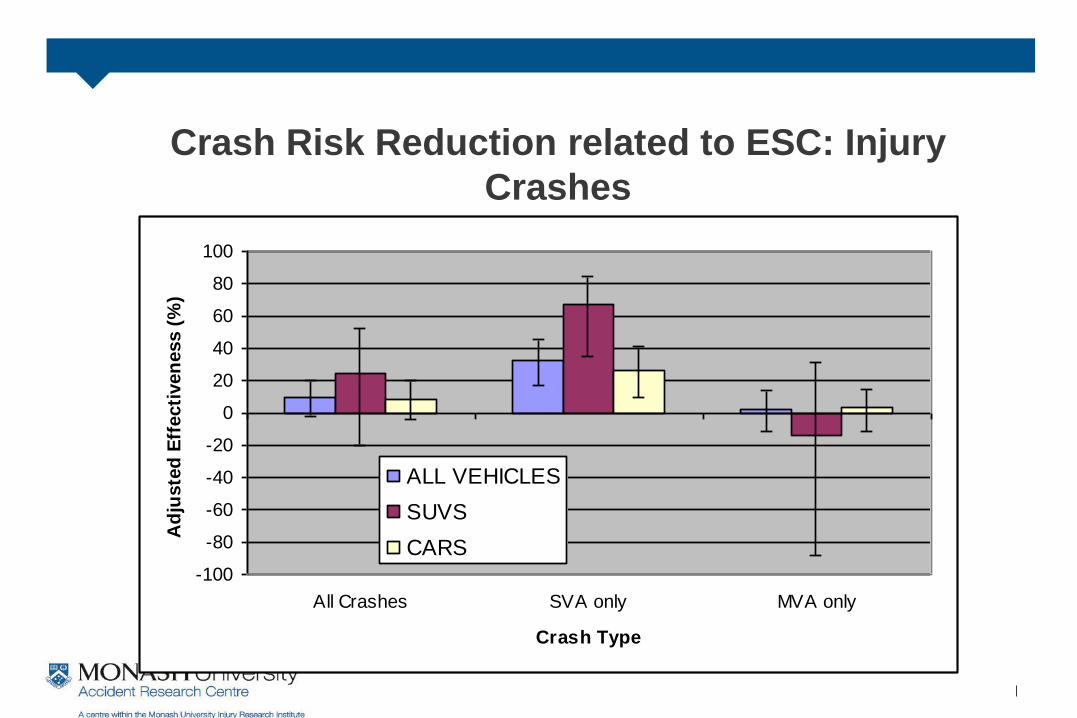
Crash Risk Reduction related to ESC: Injury
Crashes
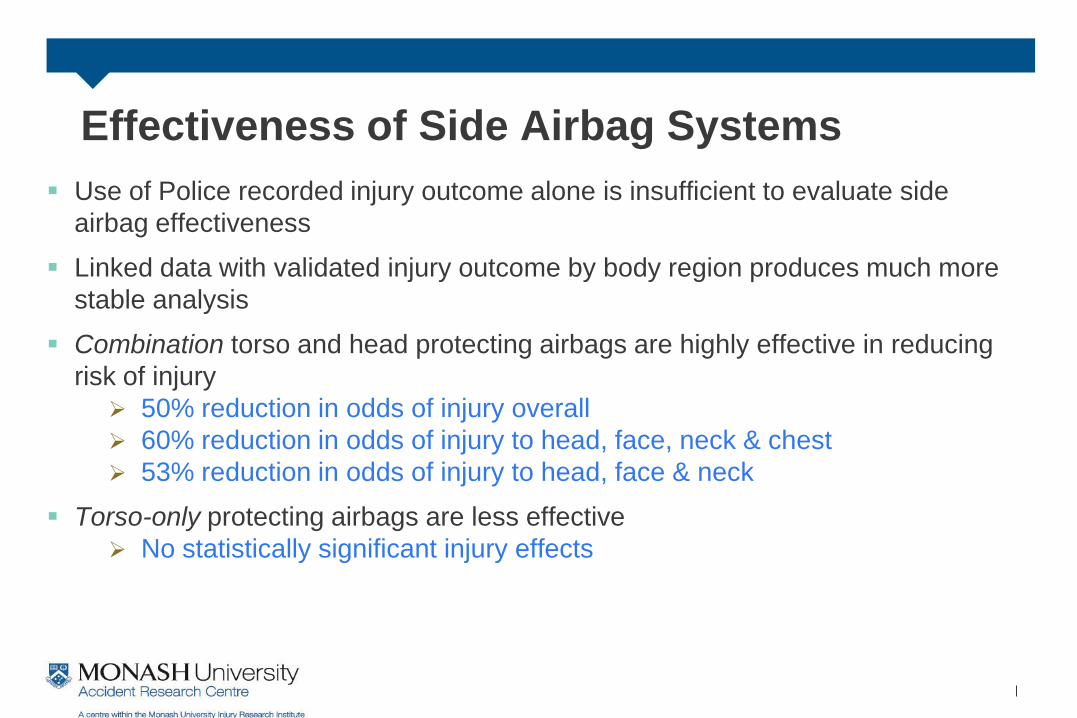
Effectiveness of Side Airbag Systems
Use of Police recorded injury outcome alone is insufficient to evaluate side
airbag effectiveness
Linked data with validated injury outcome by body region produces much more
stable analysis
Combination torso and head protecting airbags are highly effective in reducing
risk of injury
50% reduction in odds of injury overall
60% reduction in odds of injury to head, face, neck & chest
53% reduction in odds of injury to head, face & neck
Torso-only protecting airbags are less effective
No statistically significant injury effects
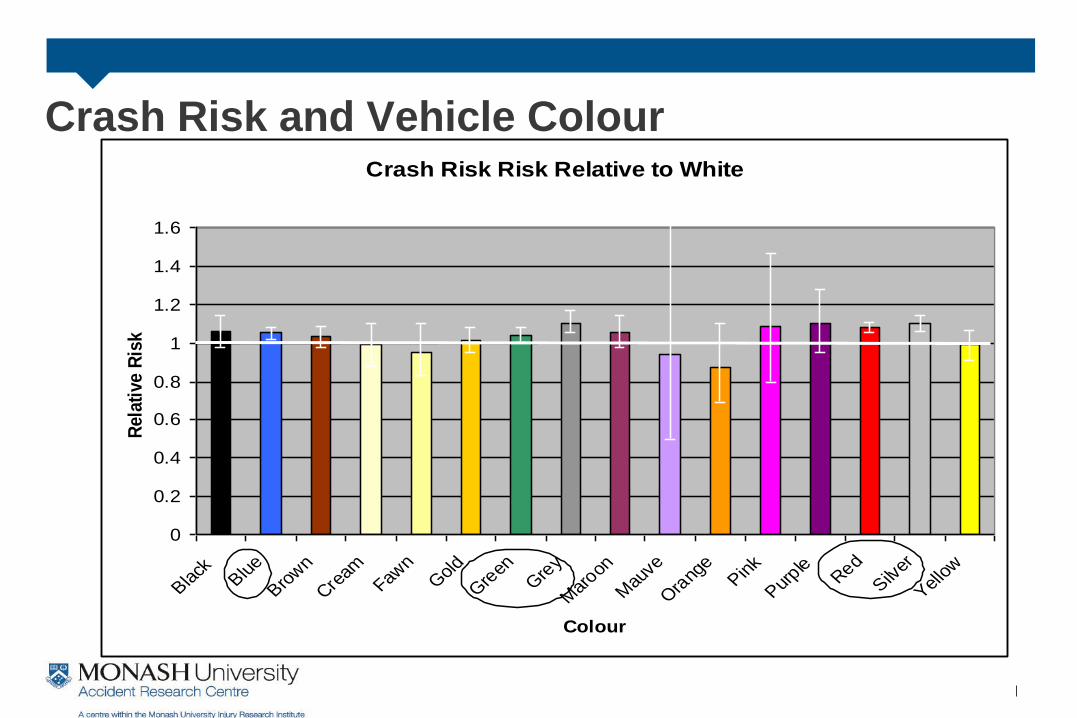
Crash Risk and Vehicle Colour Crash Risk Risk Relative to White
0
0.2
0.4
0.6
0.8
1
1.2
1.4
1.6
Black
Blue
Brow
n
Cream
Fawn
Gol
d
Gre
enG
rey
Mar
oon
Mau
ve
Ora
nge
Pink
Purple
Red
Silver
Yello
w
Colour
Rela
tive R
isk
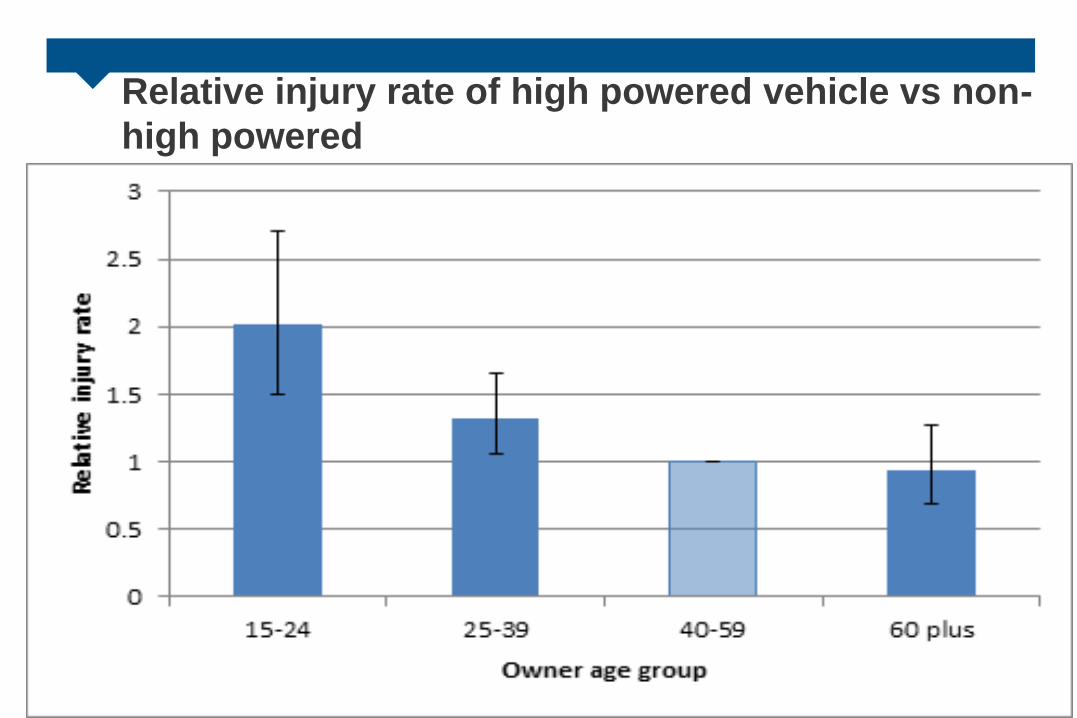
Relative injury rate of high powered vehicle vs non-
high powered
High Powered Vehicle Restrictions:
Policy Implications
Half of the injuries from young people’s high performance vehicle crashes could be
prevented, given optimistic assumptions
But high performance vehicles are rare (1%-4% of young driver crash fleet)
Only 0.4%-1.8% injuries arising from crashes involving young drivers could be
prevented
Regulations are expensive to establish and police. There appear to be only very
modest potential safety gains compared to the effort.
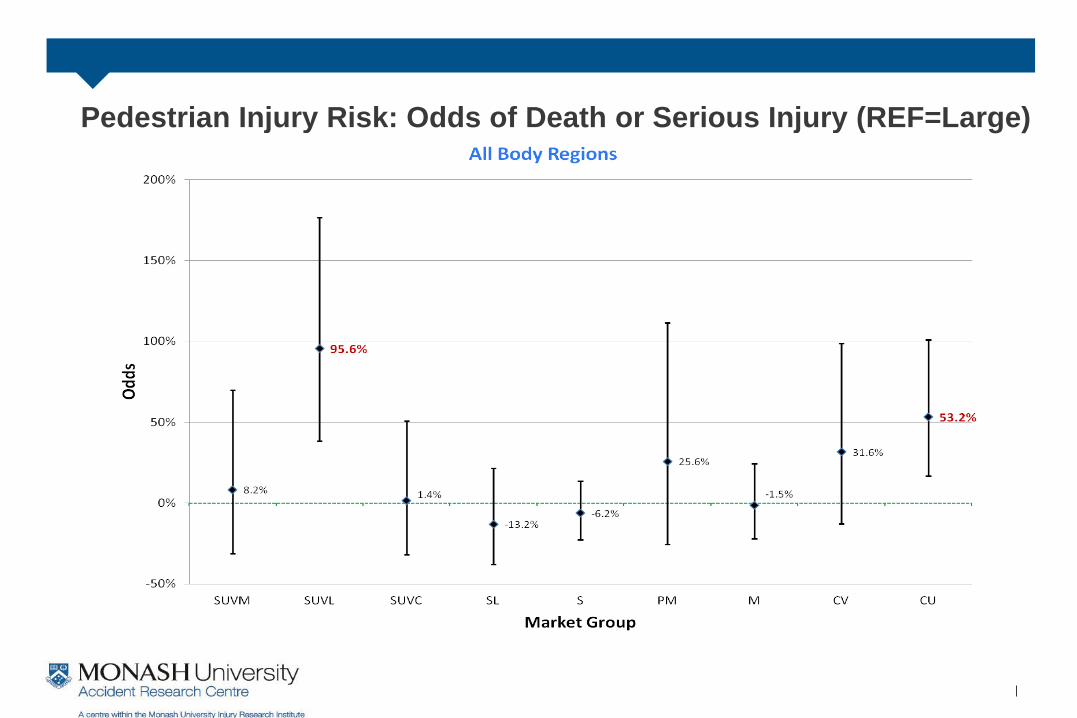
Pedestrian Injury Risk: Odds of Death or Serious Injury (REF=Large)
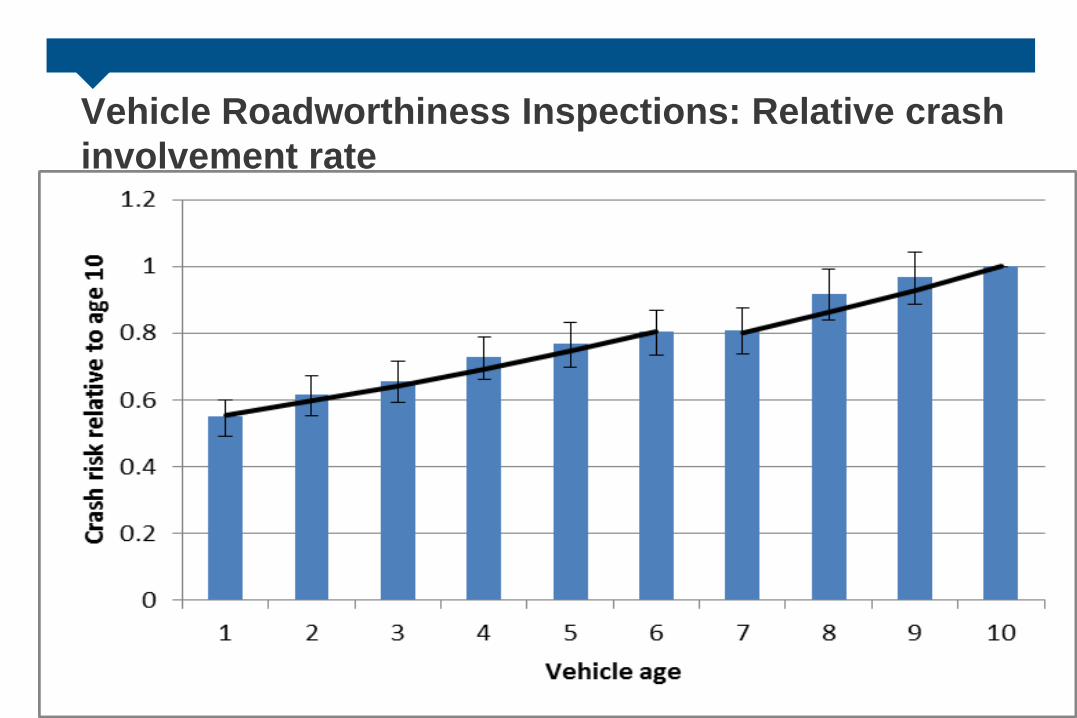
Vehicle Roadworthiness Inspections: Relative crash
involvement rate
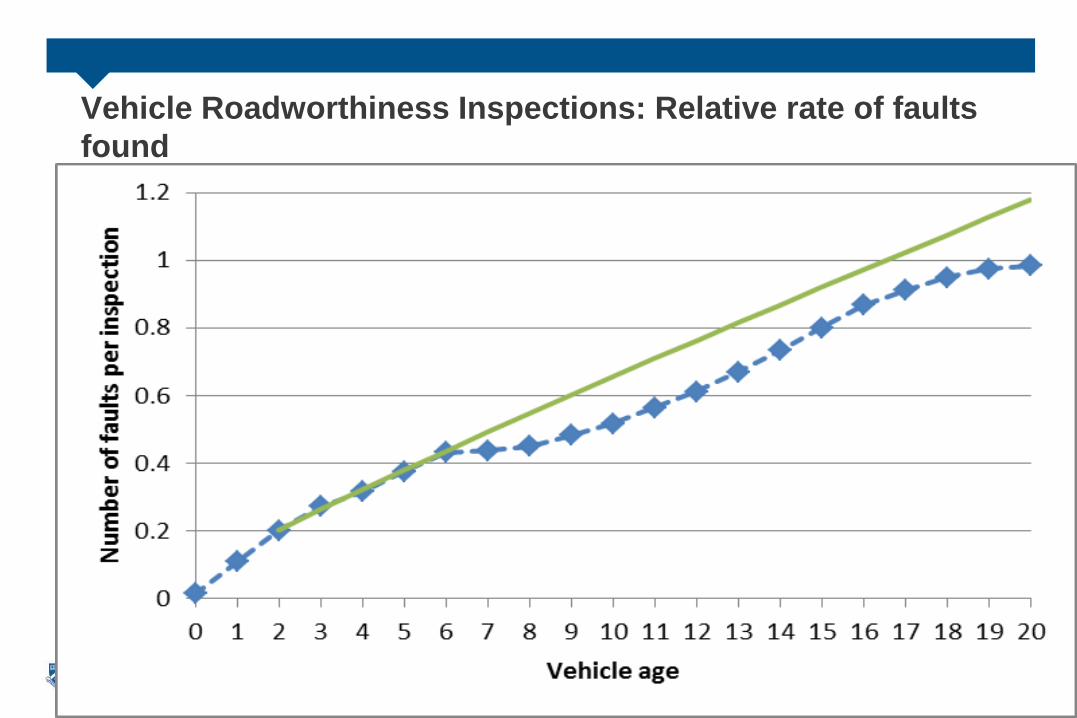
Vehicle Roadworthiness Inspections: Relative rate of faults
found
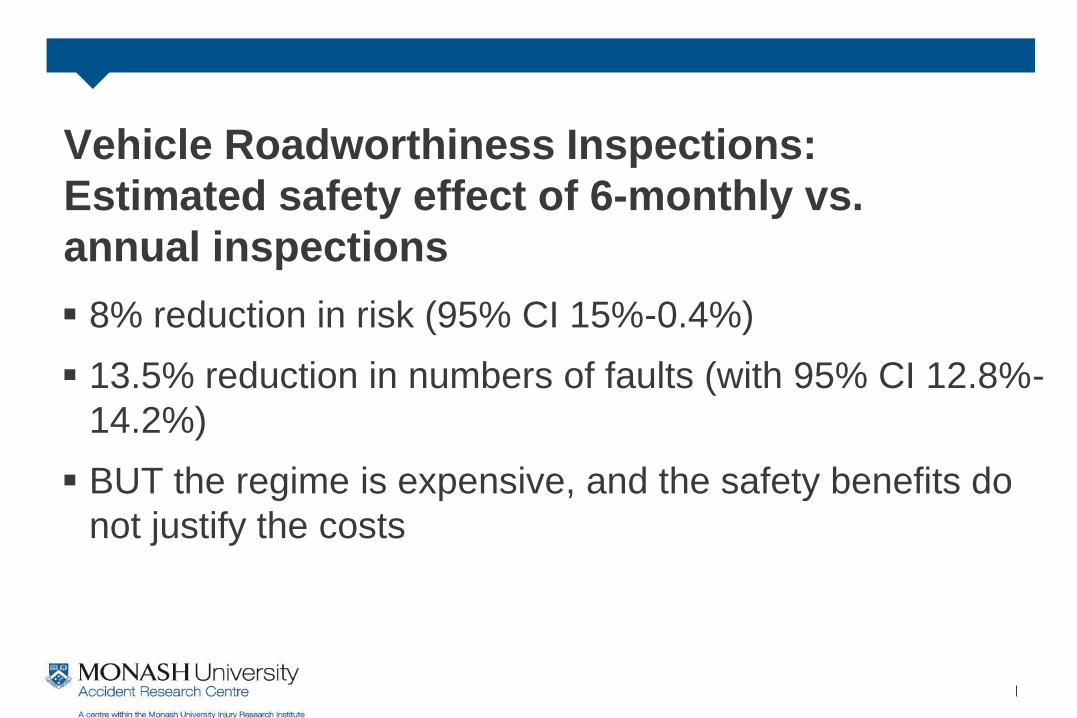
Vehicle Roadworthiness Inspections:
Estimated safety effect of 6-monthly vs.
annual inspections
8% reduction in risk (95% CI 15%-0.4%)
13.5% reduction in numbers of faults (with 95% CI 12.8%-
14.2%)
BUT the regime is expensive, and the safety benefits do
not justify the costs
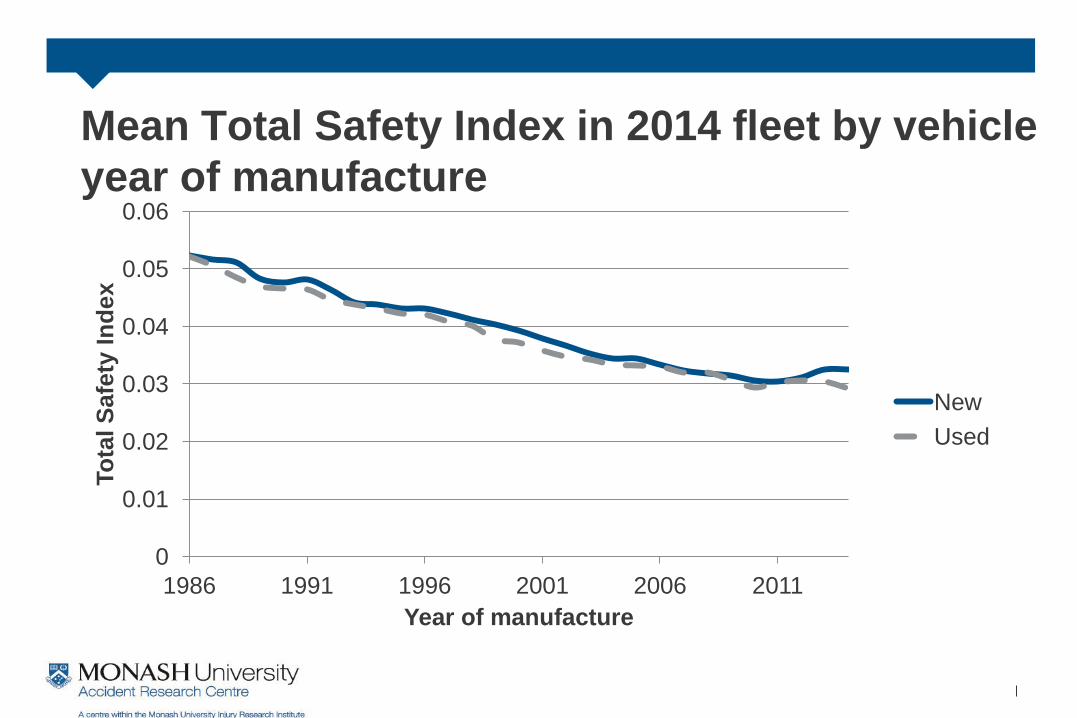
Mean Total Safety Index in 2014 fleet by vehicle
year of manufacture
0
0.01
0.02
0.03
0.04
0.05
0.06
1986 1991 1996 2001 2006 2011
To
tal S
afe
ty I
nd
ex
Year of manufacture
New
Used
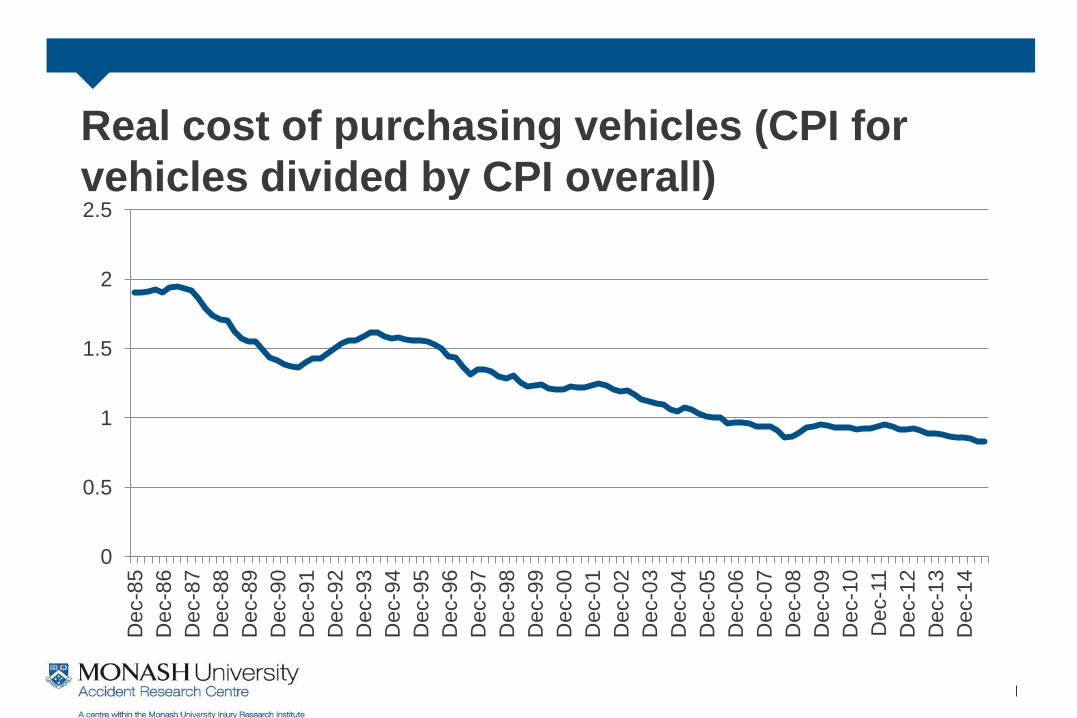
Real cost of purchasing vehicles (CPI for
vehicles divided by CPI overall)
0
0.5
1
1.5
2
2.5
Dec-8
5
Dec-8
6
Dec-8
7
Dec-8
8
Dec-8
9
Dec-9
0
Dec-9
1
Dec-9
2
Dec-9
3
Dec-9
4
Dec-9
5
Dec-9
6
Dec-9
7
Dec-9
8
Dec-9
9
Dec-0
0
Dec-0
1
Dec-0
2
Dec-0
3
Dec-0
4
Dec-0
5
Dec-0
6
De
c-0
7
Dec-0
8
Dec-0
9
Dec-1
0
Dec-1
1
Dec-1
2
Dec-1
3
Dec-1
4
Safety effects of used imported vehicles in NZ
The real cost of purchasing motor vehicles has fallen considerably, approximately halving in the past 30 years
This implies that the used importation programme should have improved safety considerably by decreasing the real costs of safer vehicles
However, rather than choosing to improve the quality of the vehicles they drive, New Zealanders consumers have preferred to spend their money on other things
Perhaps because of the glut of older used imported vehicles, driving such vehicles has become normalised in a way that might not have happened in the absence of the programme
Purely from a vehicle safety perspective, the used importation programme has provided vehicles that are marginally safer for a given year of manufacture
Yet the New Zealand fleet has got older on average, with consequent poorer fleet safety than a younger fleet
Current Research Focus
Continued updates of the UCSRs
Effects of future fleet changes and vehicle safety technology on
pedestrian related road trauma
Past and future improvement in the safety of the vehicle fleet and
the role of future technologies
Establishing a vehicle crash risk ratings system
Heavy vehicle crashes and future benefits of emerging technology
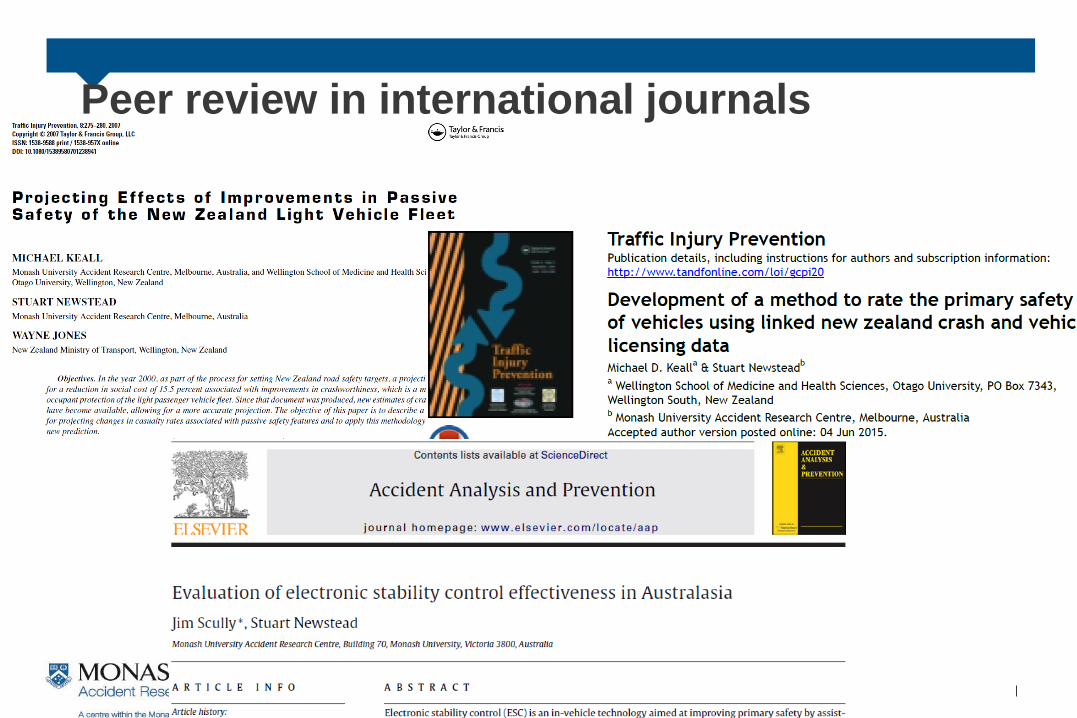
Peer review in international journals