using data to manage and market your program marcia finlayson & joy hammel university of...
TRANSCRIPT

Using Data to Manage and Market Your Program
Marcia Finlayson & Joy HammelUniversity of Illinois at ChicagoAFP & ATF Technical Assistance
Program
Federal Accountability Initiative “If you don’t measure results, you
can’t tell success from failure” (C. Mindel)
“If you CAN demonstrate results, you CAN win public support” (C.Mindel)
Session Objectives To discuss how to effectively use AFP
outcome data in your state program & systems change initiatives
To share examples of state use To review the process for requesting
custom data runs and reports for your state
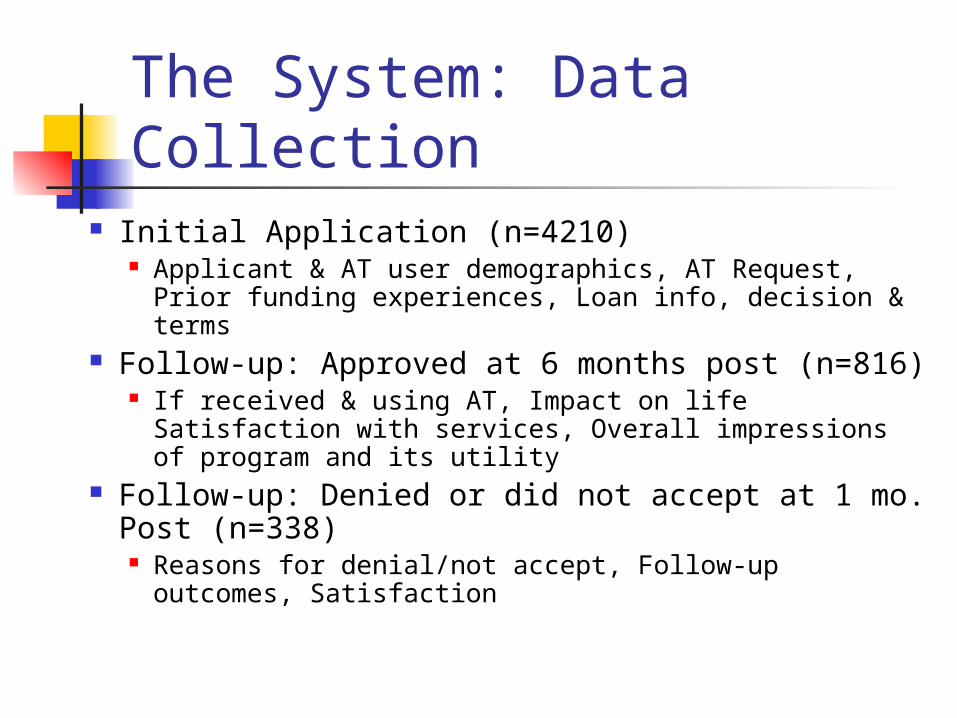
The System: Data Collection
Initial Application (n=4210) Applicant & AT user demographics, AT Request,
Prior funding experiences, Loan info, decision & terms
Follow-up: Approved at 6 months post (n=816) If received & using AT, Impact on life
Satisfaction with services, Overall impressions of program and its utility
Follow-up: Denied or did not accept at 1 mo. Post (n=338) Reasons for denial/not accept, Follow-up outcomes,
Satisfaction
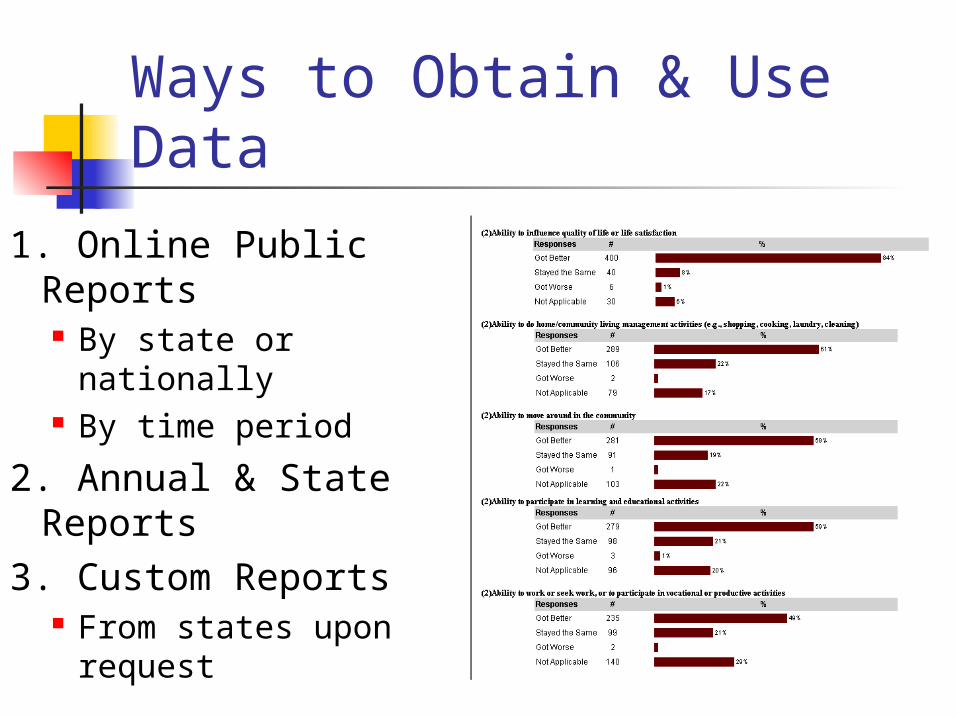
Ways to Obtain & Use Data
1. Online Public Reports By state or nationally By time period
2. Annual & State Reports
3. Custom Reports From states upon
request
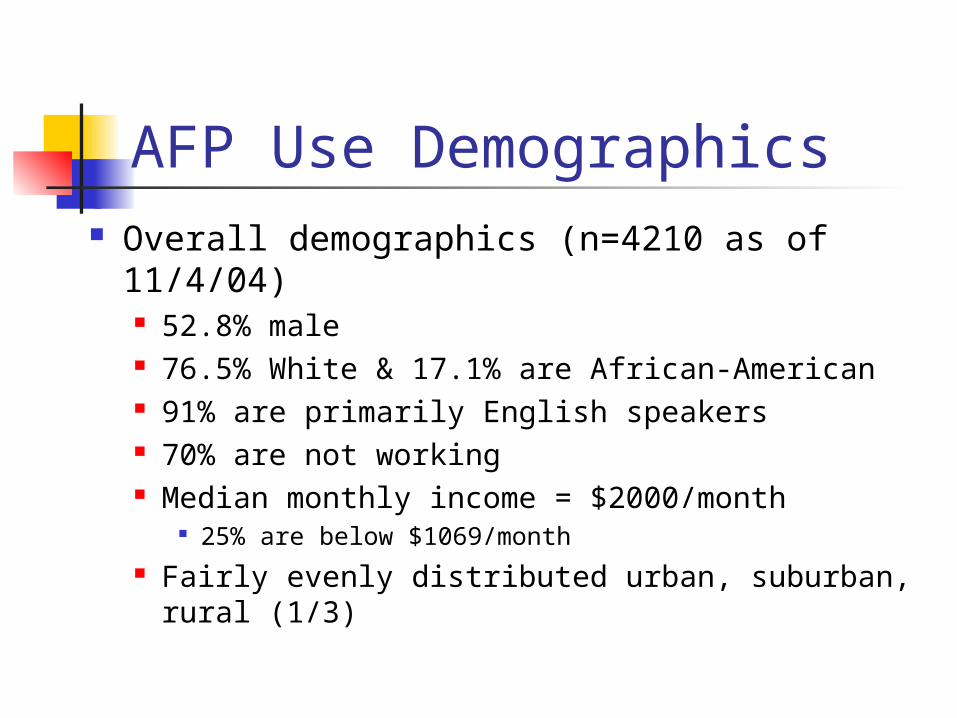
AFP Use Demographics Overall demographics (n=4210 as of
11/4/04) 52.8% male 76.5% White & 17.1% are African-American 91% are primarily English speakers 70% are not working Median monthly income = $2000/month
25% are below $1069/month Fairly evenly distributed urban, suburban, rural
(1/3)
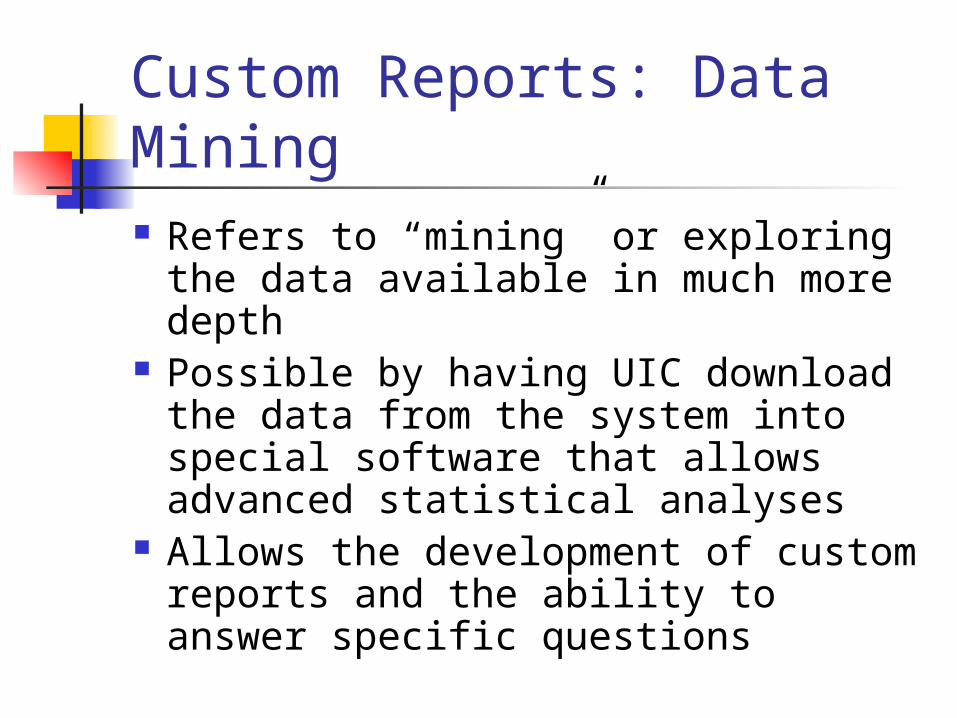
Custom Reports: Data Mining Refers to “mining” or exploring the
data available in much more depth Possible by having UIC download
the data from the system into special software that allows advanced statistical analyses
Allows the development of custom reports and the ability to answer specific questions

Data Mining: Example
Question: How are older adults using AFP and are there differences in AFP
use & outcomes by age?

Findings Age distribution: Range: 6 months
to 95 years 0.5-39: 33% (n=1386) 40+: 60% (n=2512)
40-49: 16.5% (n=693) 50-59: 17.4% (n=733) 60-69: 12.3% (n=516) 70+: 13.5% (n=570)
Not reported/unknown: 7% (n=312)
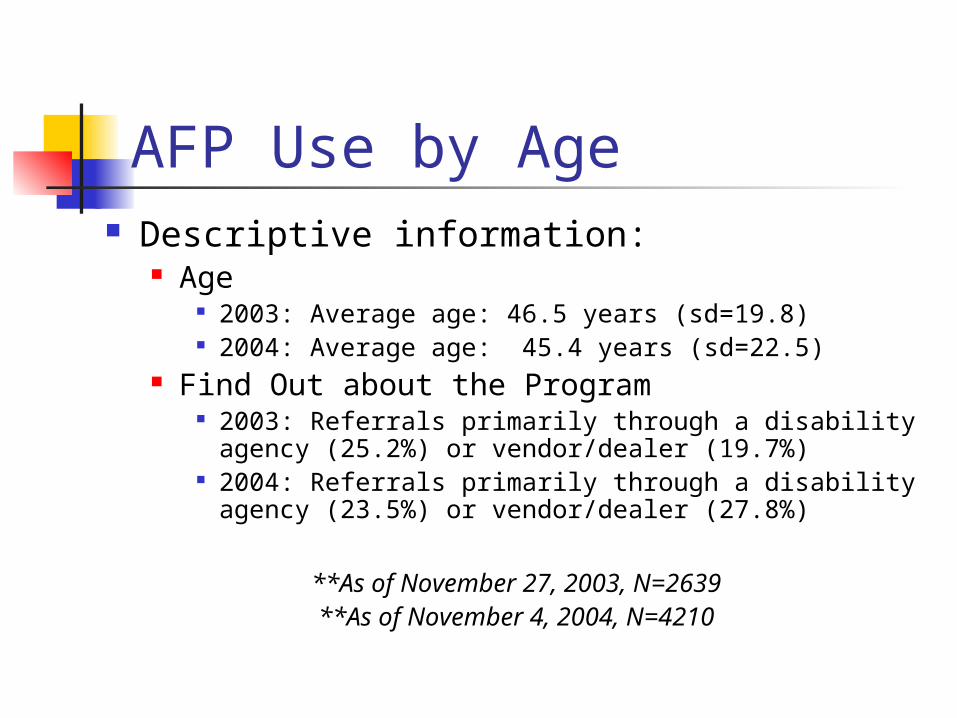
AFP Use by Age Descriptive information:
Age 2003: Average age: 46.5 years (sd=19.8) 2004: Average age: 45.4 years (sd=22.5)
Find Out about the Program 2003: Referrals primarily through a disability
agency (25.2%) or vendor/dealer (19.7%) 2004: Referrals primarily through a disability
agency (23.5%) or vendor/dealer (27.8%)
**As of November 27, 2003, N=2639**As of November 4, 2004, N=4210

Finding the AF Program
0
5
10
15
20
25
30
35
40
45
40-49 50-59 60-69 70+
VendorProfessionalMailDisability Agency
p<0.0001
Age of applicants
% v
ia m
eth
od
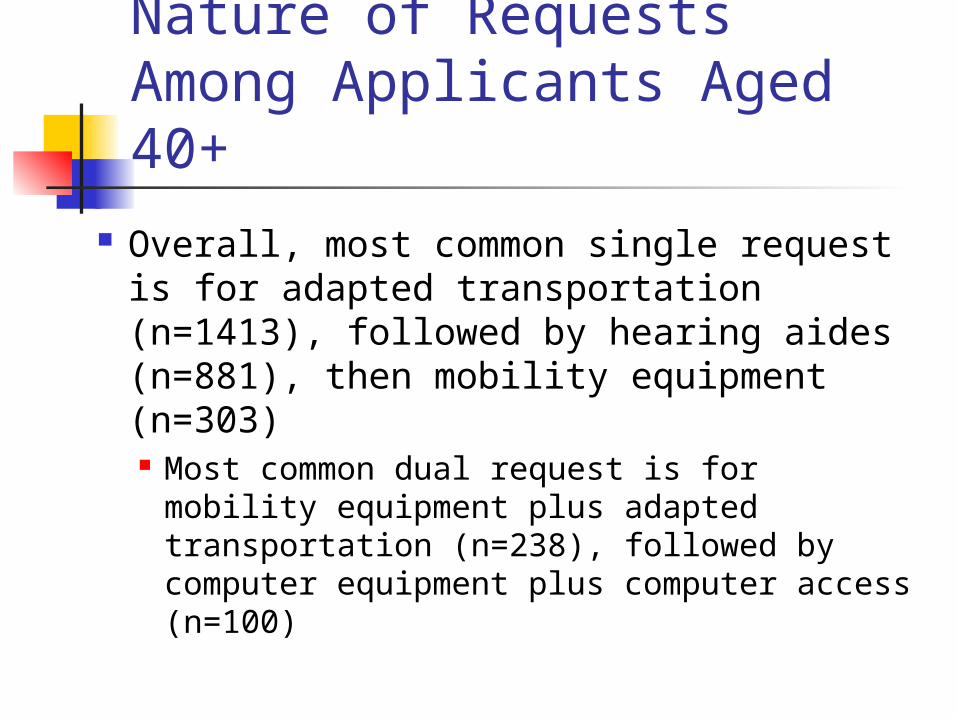
Nature of Requests Among Applicants Aged 40+
Overall, most common single request is for adapted transportation (n=1413), followed by hearing aides (n=881), then mobility equipment (n=303) Most common dual request is for mobility
equipment plus adapted transportation (n=238), followed by computer equipment plus computer access (n=100)

% of Requests for Specific AT, by Age Group
0%
10%
20%
30%
40%
50%
60%
70%
80%
90%
100%
40-49 50-59 60-69 70+
Age groups
% o
f re
qu
es
ts
adapted transportation
hearing aides
mobility equipment
p<0.0001
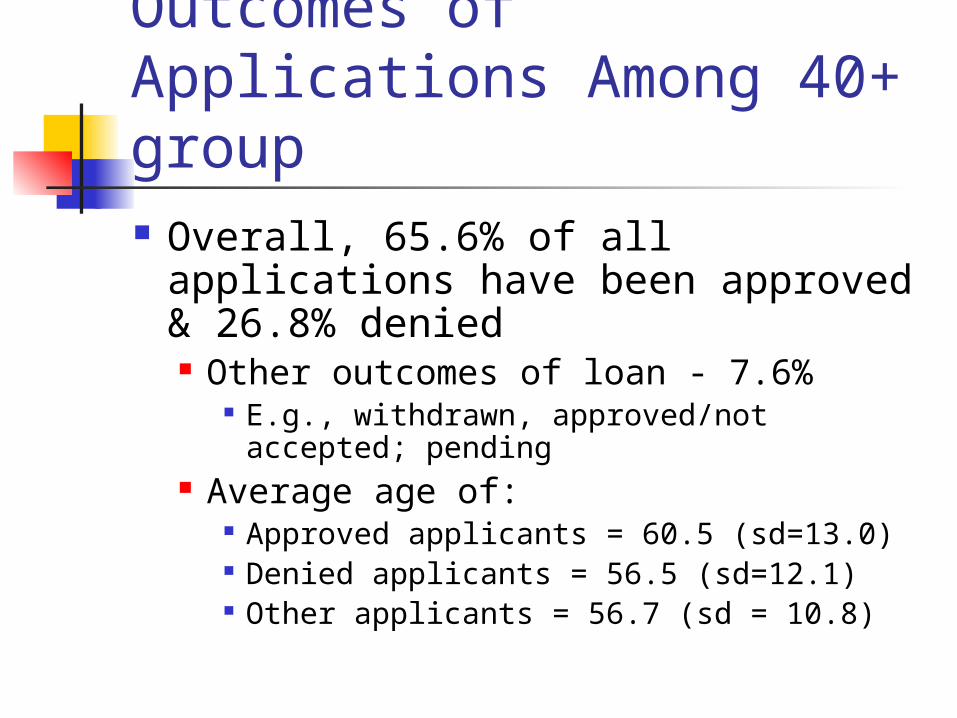
Outcomes of Applications Among 40+ group Overall, 65.6% of all applications
have been approved & 26.8% denied Other outcomes of loan - 7.6%
E.g., withdrawn, approved/not accepted; pending
Average age of: Approved applicants = 60.5 (sd=13.0) Denied applicants = 56.5 (sd=12.1) Other applicants = 56.7 (sd = 10.8)
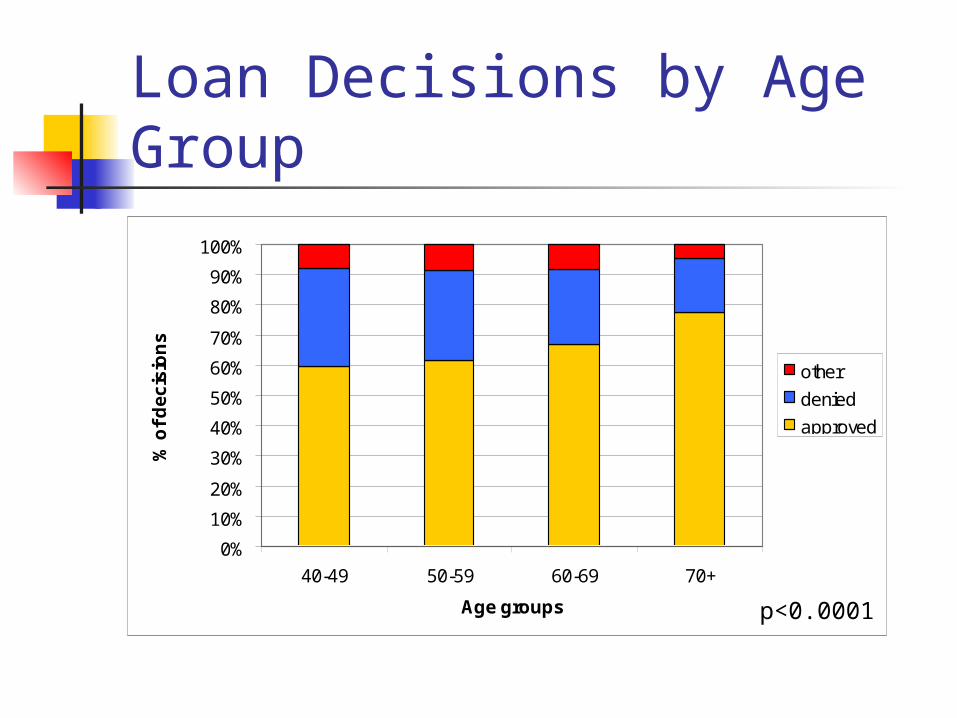
Loan Decisions by Age Group
0%
10%
20%
30%
40%
50%
60%
70%
80%
90%
100%
40-49 50-59 60-69 70+
Age groups
% o
f d
ec
isio
ns
other
denied
approved
p<0.0001
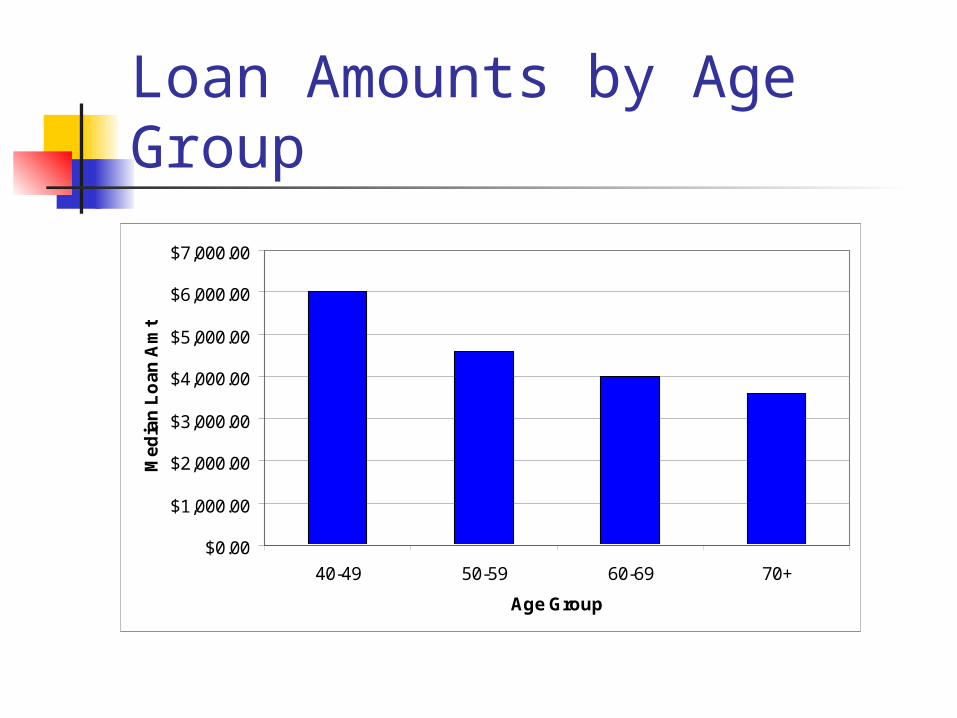
Loan Amounts by Age Group
$0.00
$1,000.00
$2,000.00
$3,000.00
$4,000.00
$5,000.00
$6,000.00
$7,000.00
40-49 50-59 60-69 70+
Age Group
Me
dia
n L
oa
n A
mt

Follow-Up on Approved Loans 474 people 40+ participated in at
least part of an approved follow-up interview Missing data for individual questions
depending on applicability to loan request – up to 30% for some questions
Results must be considered exploratory

Follow-up on Approved Loans Status of AT equipment receipt
(N=337 age 40+) 90.5% had received their AT and were
using it 3.6% had not yet received Remainder (5.9%) had received but not
using (e.g., broken, don’t know how, doesn’t meet needs, etc)= abandoned
No differences by age
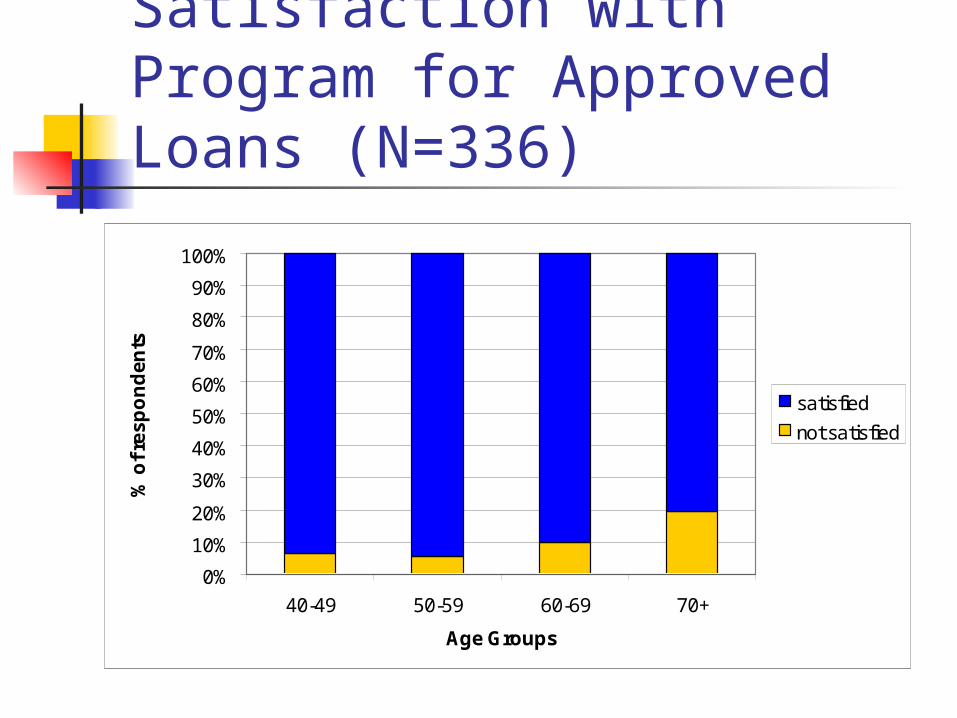
Satisfaction with Program for Approved Loans (N=336)
0%
10%
20%
30%
40%
50%
60%
70%
80%
90%
100%
40-49 50-59 60-69 70+
Age Groups
% o
f re
sp
on
de
nts
satisfied
not satisfied
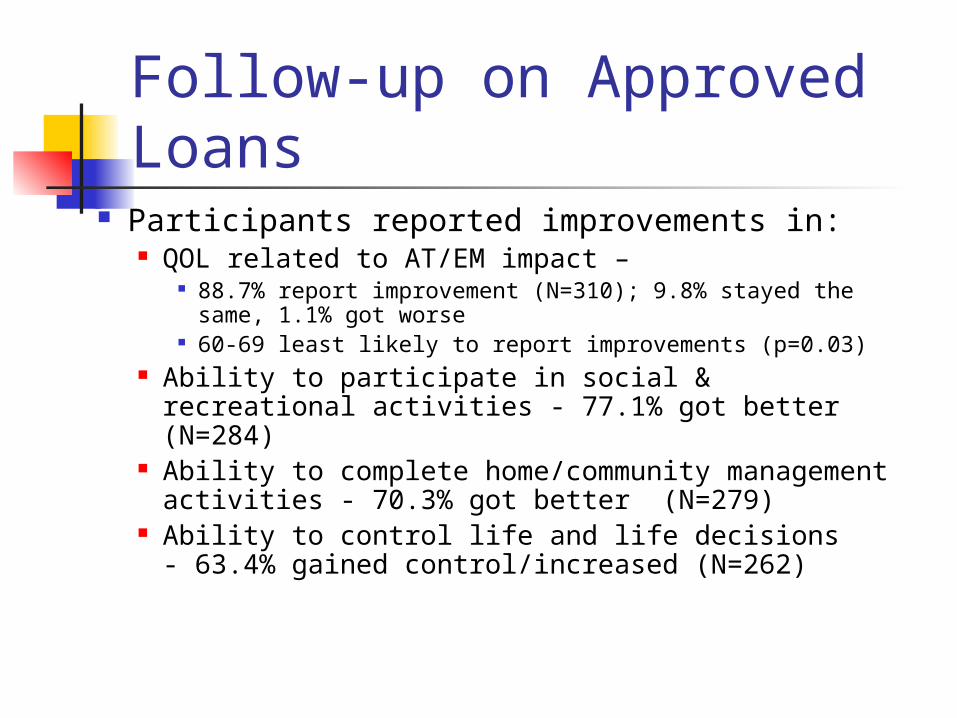
Follow-up on Approved Loans
Participants reported improvements in: QOL related to AT/EM impact –
88.7% report improvement (N=310); 9.8% stayed the same, 1.1% got worse
60-69 least likely to report improvements (p=0.03) Ability to participate in social & recreational
activities - 77.1% got better (N=284) Ability to complete home/community
management activities - 70.3% got better (N=279)
Ability to control life and life decisions - 63.4% gained control/increased (N=262)
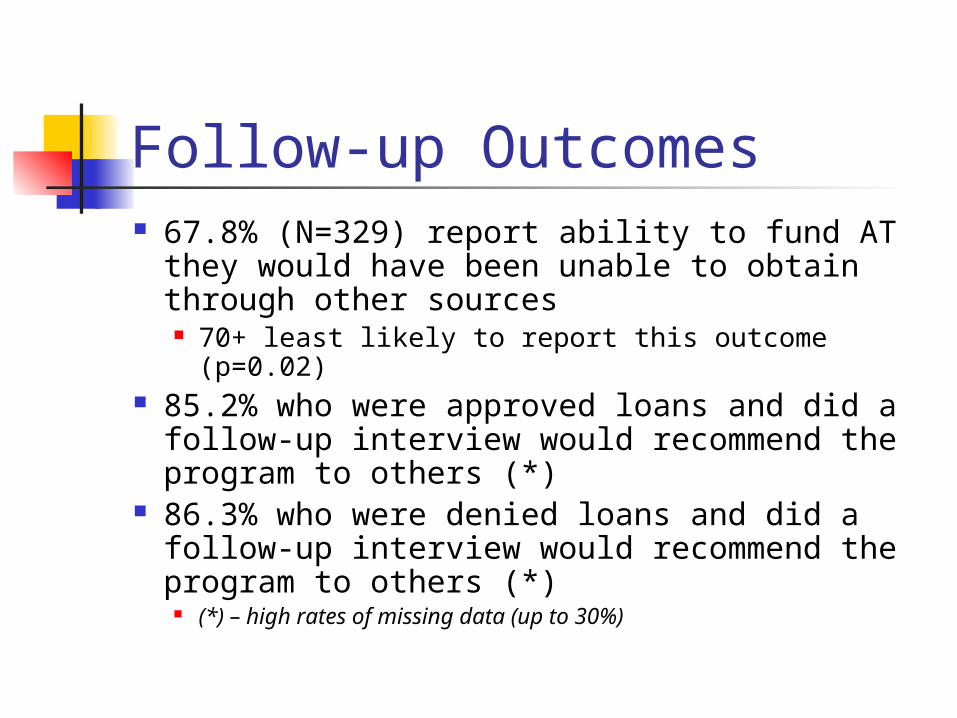
Follow-up Outcomes 67.8% (N=329) report ability to fund AT
they would have been unable to obtain through other sources 70+ least likely to report this outcome (p=0.02)
85.2% who were approved loans and did a follow-up interview would recommend the program to others (*)
86.3% who were denied loans and did a follow-up interview would recommend the program to others (*)
(*) – high rates of missing data (up to 30%)

Outreach to Older Adults
State Specific Examples of Data Use
Additional ways to use AFP Data
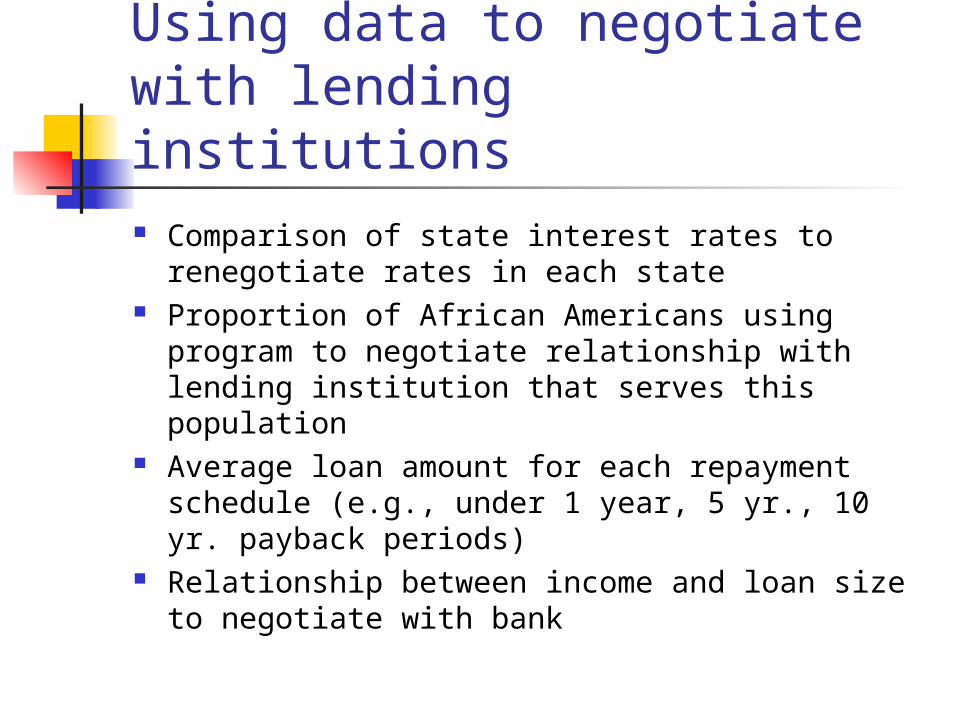
Using data to negotiate with lending institutions Comparison of state interest rates to
renegotiate rates in each state Proportion of African Americans using program
to negotiate relationship with lending institution that serves this population
Average loan amount for each repayment schedule (e.g., under 1 year, 5 yr., 10 yr. payback periods)
Relationship between income and loan size to negotiate with bank
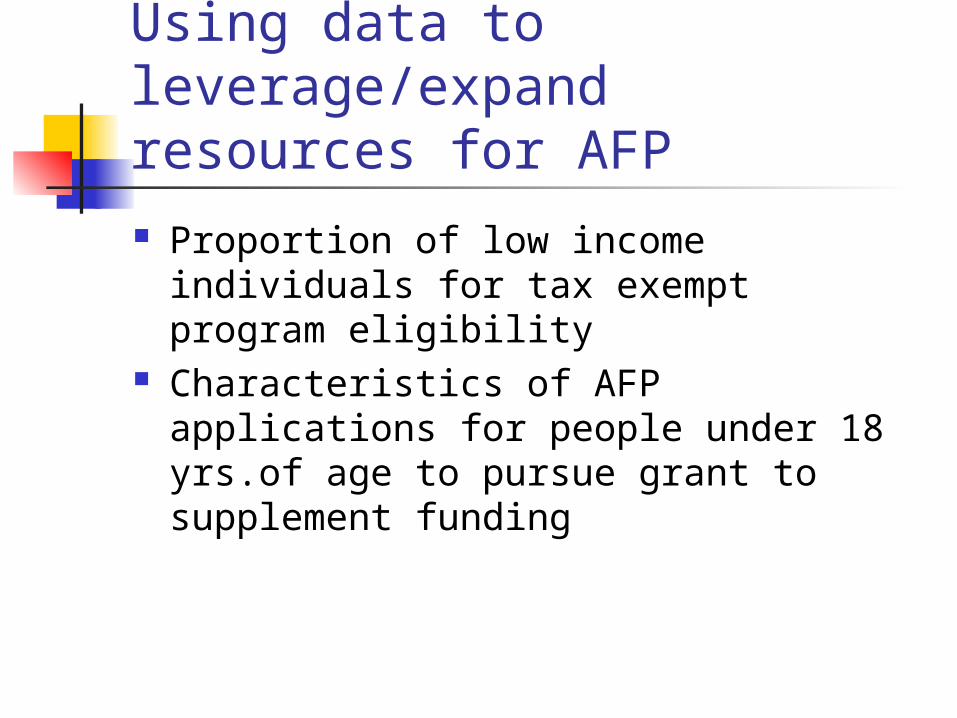
Using data to leverage/expand resources for AFP Proportion of low income individuals for
tax exempt program eligibility Characteristics of AFP applications for
people under 18 yrs.of age to pursue grant to supplement funding
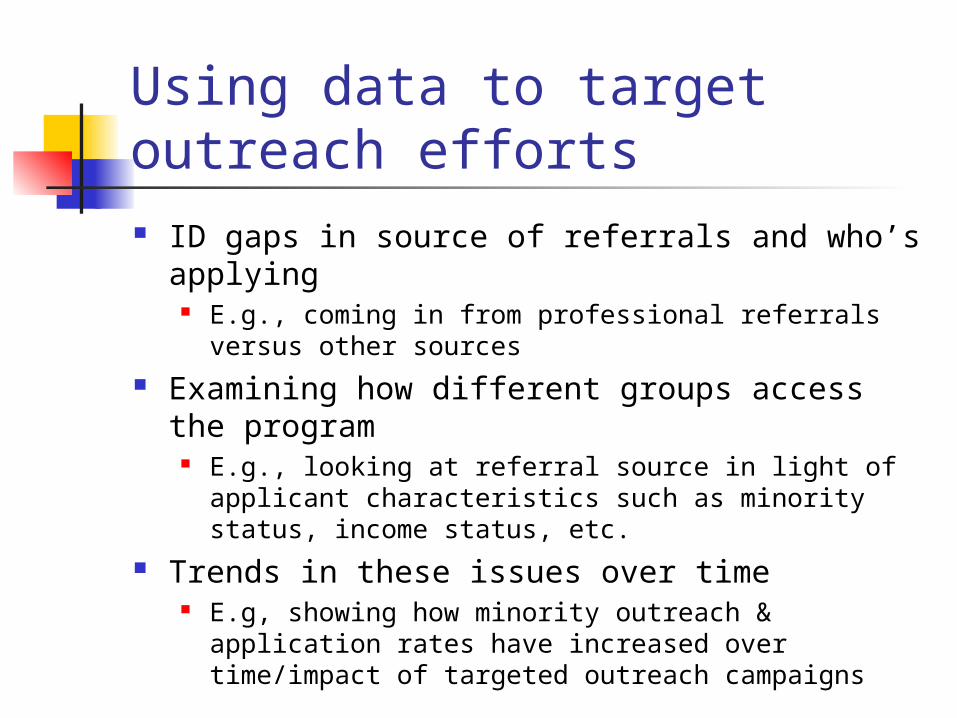
Using data to target outreach efforts ID gaps in source of referrals and who’s
applying E.g., coming in from professional referrals versus
other sources Examining how different groups access the
program E.g., looking at referral source in light of applicant
characteristics such as minority status, income status, etc.
Trends in these issues over time E.g, showing how minority outreach & application
rates have increased over time/impact of targeted outreach campaigns

How to request your own custom analyses
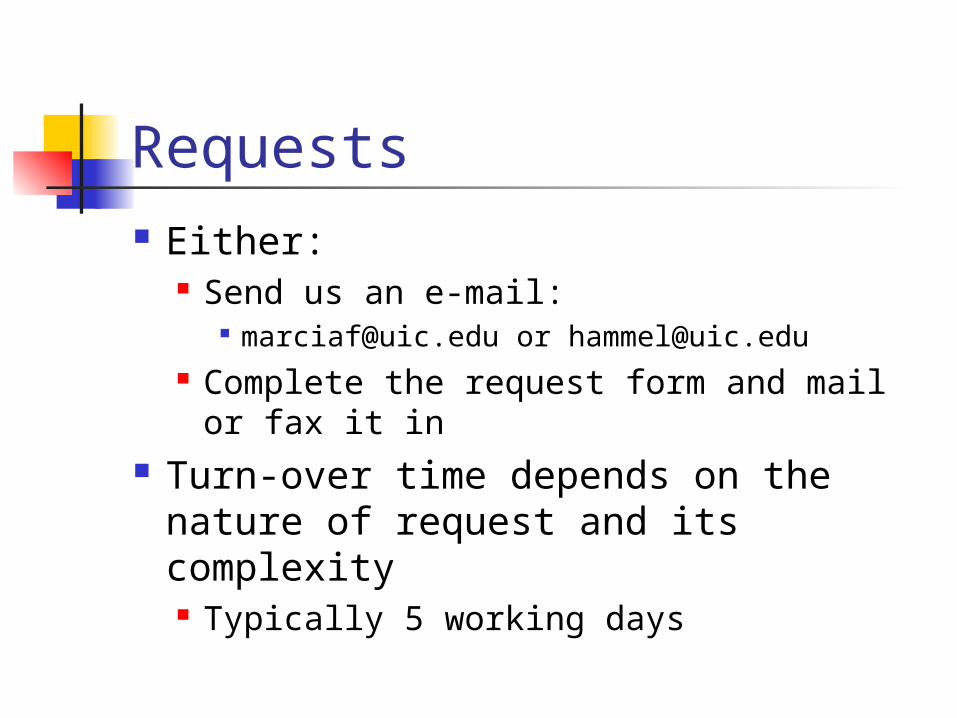
Requests Either:
Send us an e-mail: [email protected] or [email protected]
Complete the request form and mail or fax it in
Turn-over time depends on the nature of request and its complexity Typically 5 working days

Questions & Comments