using dna barcodes to identify and classify living things
TRANSCRIPT
Using DNA Barcodesto Identify and Classify
Living Things
INTRODUCTION
Taxonomy, the science of classifying living things according to shared features, hasalways been a part of human society. Carl Linneas formalized biological classifica-tion with his system of binomial nomenclature that assigns each organism a genusand species name. Identifying organisms has grown in importance as we monitor the biologicaleffects of global climate change and attempt to preserve species diversity in the faceof accelerating habitat destruction. We know very little about the diversity of plantsand animals—let alone microbes—living in many unique ecosystems on earth. Lessthan two million of the estimated 5–50 million plant and animal species have beenidentified. Scientists agree that the yearly rate of extinction has increased from aboutone species per million to 100–1,000 species per million. This means that thousandsof plants and animals are lost each year. Most of these have not yet been identified. Classical taxonomy falls short in this race to catalog biological diversity before itdisappears. Specimens must be carefully collected and handled to preserve their dis-
LABORATORY Using DNA Barcodes to Identify and ClassifyLiving Things
O B J E C T I V E S
This laboratory demonstrates several important concepts of modern biology. During this labo-ratory, you will:
• Collect and analyze sequence data from plants, fungi, or animals—or products made fromthem.
• Use DNA sequence to identify species.
• Explore relationships between species.
In addition, this laboratory utilizes several experimental and bioinformatics methods in modernbiological research. You will:
• Collect plants, fungi, animals, or products in your local environment or neighborhood.
• Extract and purify DNA from tissue or processed material.
• Amplify a specific region of the chloroplast, mitochondrial, or nuclear genome by polymerasechain reaction (PCR) and analyze PCR products by gel electrophoresis.
• Use the Basic Local Alignment Search Tool (BLAST) to identify sequences in databases.
• Use multiple sequence alignment and tree-building tools to analyze phylogenetic relation-ships.
3
Copyright 2014 Cold Spring Harbor Laboratory DNA Learning Center
4 DNA Barcoding 101
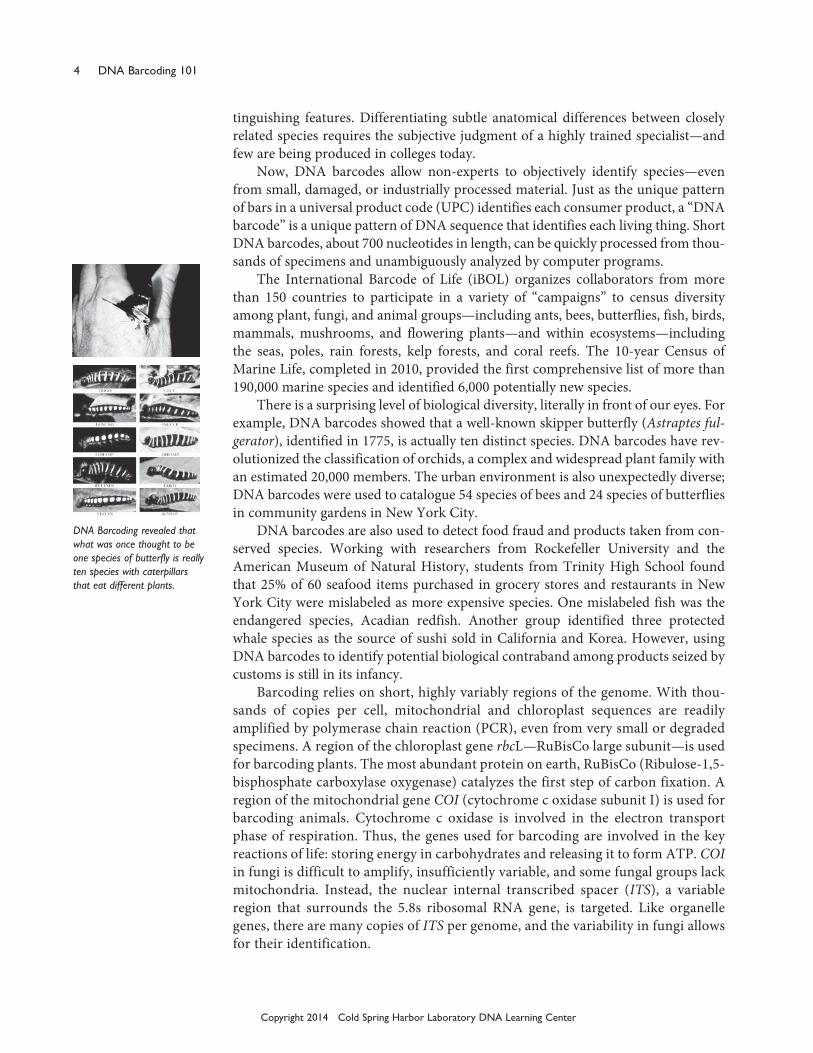
tinguishing features. Differentiating subtle anatomical differences between closelyrelated species requires the subjective judgment of a highly trained specialist—andfew are being produced in colleges today. Now, DNA barcodes allow non-experts to objectively identify species—evenfrom small, damaged, or industrially processed material. Just as the unique patternof bars in a universal product code (UPC) identifies each consumer product, a “DNAbarcode” is a unique pattern of DNA sequence that identifies each living thing. ShortDNA barcodes, about 700 nucleotides in length, can be quickly processed from thou-sands of specimens and unambiguously analyzed by computer programs. The International Barcode of Life (iBOL) organizes collaborators from morethan 150 countries to participate in a variety of “campaigns” to census diversityamong plant, fungi, and animal groups—including ants, bees, butterflies, fish, birds,mammals, mushrooms, and flowering plants—and within ecosystems—includingthe seas, poles, rain forests, kelp forests, and coral reefs. The 10-year Census ofMarine Life, completed in 2010, provided the first comprehensive list of more than190,000 marine species and identified 6,000 potentially new species. There is a surprising level of biological diversity, literally in front of our eyes. Forexample, DNA barcodes showed that a well-known skipper butterfly (Astraptes ful-gerator), identified in 1775, is actually ten distinct species. DNA barcodes have rev-olutionized the classification of orchids, a complex and widespread plant family withan estimated 20,000 members. The urban environment is also unexpectedly diverse;DNA barcodes were used to catalogue 54 species of bees and 24 species of butterfliesin community gardens in New York City. DNA barcodes are also used to detect food fraud and products taken from con-served species. Working with researchers from Rockefeller University and theAmerican Museum of Natural History, students from Trinity High School foundthat 25% of 60 seafood items purchased in grocery stores and restaurants in NewYork City were mislabeled as more expensive species. One mislabeled fish was theendangered species, Acadian redfish. Another group identified three protectedwhale species as the source of sushi sold in California and Korea. However, usingDNA barcodes to identify potential biological contraband among products seized bycustoms is still in its infancy. Barcoding relies on short, highly variably regions of the genome. With thou-sands of copies per cell, mitochondrial and chloroplast sequences are readilyamplified by polymerase chain reaction (PCR), even from very small or degradedspecimens. A region of the chloroplast gene rbcL—RuBisCo large subunit—is usedfor barcoding plants. The most abundant protein on earth, RuBisCo (Ribulose-1,5-bisphosphate carboxylase oxygenase) catalyzes the first step of carbon fixation. Aregion of the mitochondrial gene COI (cytochrome c oxidase subunit I) is used forbarcoding animals. Cytochrome c oxidase is involved in the electron transportphase of respiration. Thus, the genes used for barcoding are involved in the keyreactions of life: storing energy in carbohydrates and releasing it to form ATP. COIin fungi is difficult to amplify, insufficiently variable, and some fungal groups lackmitochondria. Instead, the nuclear internal transcribed spacer (ITS), a variableregion that surrounds the 5.8s ribosomal RNA gene, is targeted. Like organellegenes, there are many copies of ITS per genome, and the variability in fungi allowsfor their identification.
Copyright 2014 Cold Spring Harbor Laboratory DNA Learning Center
DNA Barcoding revealed thatwhat was once thought to beone species of butterfly is reallyten species with caterpillarsthat eat different plants.
USING DNA BARCODES TO IDENTIFY AND CLASSIFY LIVING THINGS 5
This laboratory uses DNA barcoding to identify plants, fungi, or animals—orproducts made from them. First, a sample of tissue is collected, preserving the spec-imen whenever possible and noting its geographical location and local environment.A small leaf disc, a whole insect, or samples of muscle are suitable sources. DNA isextracted from the tissue sample, and the barcode portion of the rbcL, COI, or ITSgene is amplified by PCR. The amplified sequence (amplicon) is submitted forsequencing in one or both directions. The sequencing results are then used to search a DNA database. A close matchquickly identifies a species that is already represented in the database. However,some barcodes will be entirely new, and identification may rely on placing theunknown species in a phylogenetic tree with near relatives. Novel DNA barcodescan be submitted to GenBank® (www.ncbi.nlm.nih.gov).
FURTHER READING
Benson D.A., Cavanaugh M., Clark K., Karsch-Mizrachi I, Lipman D.J., Ostell J., Sayers E.W.(2013). Nucleic Acids Res. GenBank®. 41(D1): D36–D42.
Hebert P.D., Cywinska A., Ball S.L., deWaard J.R. (2003). Biological identifications through DNAbarcodes. Proceedings of the Royal Society B: Biological Sciences 270(1512): 313-21.
Hebert P.D.N., Penton E.H., Burns J.M., Janzen D.H., Hallwachs W. (2004). Ten species in one:DNA barcoding reveals cryptic species in the neotropical skipper butterfly Astraptes fulgera-tor. Proc Natl Acad Sci U S A. 101(41):14812-7.
Hollingsworth P.M. et al (2009). A DNA barcode for land plants. Proc Natl Acad Sci U S A106(31): 12794-7.
Ratnasingham, S., Hebert, P.D.N (2007). Barcoding BOLD: The Barcode of Life Data System.Molecular Ecology Notes 7(3): 355-64.
Stoeckle M. (2003). Taxonomy, DNA, and the Bar Code of Life. BioScience 53(9): 2-3.Van Den Berg C., Higgins W.E., Dressler R.L., Whitten W.M., Soto-Arenas M.A., Chase M.W.
(2009) A phylogenetic study of laeliinae (Orchidaceae) based on combined nuclear and plastidDNA sequences. Annals of Botany 104(3): 417-30.
Copyright 2014 Cold Spring Harbor Laboratory DNA Learning Center
Copyright 2014 Cold Spring Harbor Laboratory DNA Learning Center
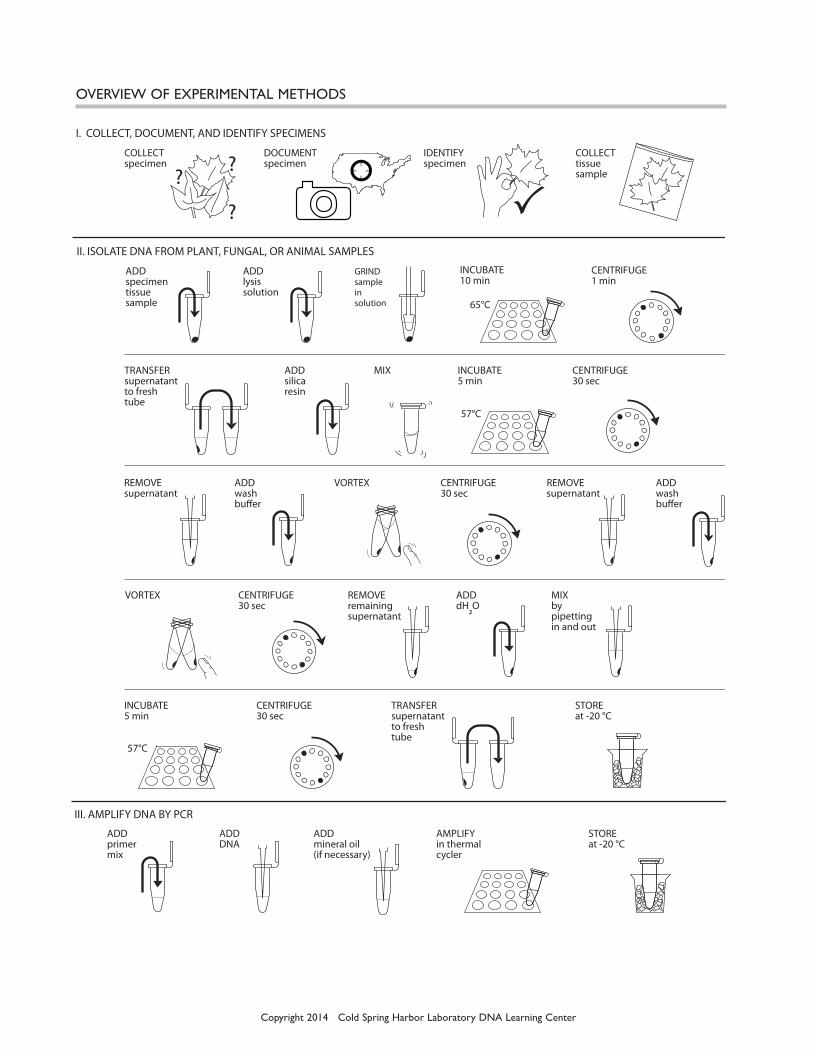
OvERvIEw OF ExPERImENTAL mETHODS
ADD specimen tissue sample
ADD lysis solution
GRIND sample in solution
II. ISOLATE DNA FROM PLANT, FUNGAL, OR ANIMAL SAMPLES
I. COLLECT, DOCUMENT, AND IDENTIFY SPECIMENS
COLLECT specimen
DOCUMENT specimen
COLLECT tissue sample
IDENTIFY specimen
ADD silicaresin
VORTEX
TRANSFER supernatantto fresh tube
TRANSFER supernatantto fresh tube
MIX CENTRIFUGE30 sec
CENTRIFUGE30 sec
CENTRIFUGE 1 min
REMOVE supernatant
?
?
?
INCUBATE 5 min
INCUBATE 10 min
65°C
57°C
STOREat -20 °C
ADD wash bu"er
ADD dH2O
MIXby pipettingin and out
VORTEX CENTRIFUGE30 sec
CENTRIFUGE30 sec
REMOVE supernatant
ADD wash bu"er
REMOVE remaining supernatant
III. AMPLIFY DNA BY PCR
ADDprimer mix
ADDDNA
ADDmineral oil (if necessary)
AMPLIFYin thermalcycler
STOREat -20 °C
INCUBATE 5 min
57°C

IV. ANALYZE PCR PRODUCTS BY GEL ELECTROPHORESIS
POURgel
SET20 min
LOADgel
ELECTROPHORESE130 volts30 min
SEQUENCE PCR PRODUCT AND ANALYZE RESULTS
SEND sample for sequencing
ANALYZE results using bioinformatics
PP
PP
PP
N N T T TA A AC C CG G G
Copyright 2014 Cold Spring Harbor Laboratory DNA Learning Center

8 DNA Barcoding 101
Copyright 2014 Cold Spring Harbor Laboratory DNA Learning Center
ExPERImENTAL mETHODS
I. Collect, Document, and Identify Specimens
The DNA isolation and amplification methods used in this laboratory work for avariety of plants, fungi, and animals—and many products derived from them. Your collection of specimens may support a census of life in a specific area orhabitat, an evaluation of products purchased in restaurants or supermarkets, or maycontribute to a larger “campaign” to assess biodiversity across large areas. It maymake sense for you to use sampling techniques from ecology. For example, a quadratsamples the plant and/or animal life in one square meter (or ¼ square meter) ofhabitat, while a transect collects samples along a fixed path through a habitat. Use common sense when collecting specimens. Respect private property; obtainpermission to collect in non-public places. Respect the environment; protect sensi-tive habitats, and collect only enough of a sample for barcoding. Do not collect spec-imens that may be threatened or endangered. Be wary of poisonous or venomousplants and animals. Consult your teacher if you are in doubt about the safety or con-servation status of a potential specimen. You will also need a small sample for clas-sical taxonomic analysis and to act as a reference sample if you plan to submit yourdata to GenBank®. Do not take more sample than you need. Only a small amount of tissue is neededfor DNA extraction—a piece of plant leaf about ¼ inch in diameter or a piece of ani-mal or fungal tissue the size of a pencil eraser. Minimize damage to living plants by collecting a single leaf or bud, or severalneedles. When possible, use young, fresh leaves or buds. Flexible, non-waxy leaveswork best. Tougher materials, such as pine needles or holly leaves, can work if thesample is kept small and is ground well. Dormant leaf buds can often be obtainedfrom bushes and trees that have dropped leaves. Fresh frozen leaves work well. Driedleaves and herbarium samples are variable. Avoid twigs or bark. If woody material must be used, select flexible twigs withsoft pith inside. As a last resort, scrape a small sample of the softer, growing cambi-um just beneath the bark. Roots and tubers are a poor choice, because high concen-trations of storage starches and other sugars can interfere with DNA extraction. For fungi, obtain fruit bodies (such as mushrooms) when possible, as DNA iseasier to obtain from fruiting bodies than mycelia. Only include multiple fruitingbodies in the same sample when they are clearly growing together and appear simi-lar, and avoid contamination by other fungi. Fresh samples work well for DNA iso-lation, while dried samples give variable results. Fungal fruiting is weather and cli-mate dependent, so their abundance will vary. Small invertebrate animals, such as insects, can be collected whole and eutha-nized in a kill jar by placing them in a freezer for several hours. Samples of muscletissue can be taken from animal foods—such as fish, poultry, or red meat. Blood,internal organs, and bone marrow are all good sources of DNA. Fresh and frozensamples, and those recently preserved in ethanol, work well. However, bone, skin,leather, feather, dessicated, and processed samples are challenging.

USING DNA BARCODES TO IDENTIFY AND CLASSIFY LIVING THINGS 9
Copyright 2014 Cold Spring Harbor Laboratory DNA Learning Center
1. Collect specimens according to a strategy or campaign outlined by your teacher.“Field Techniques Used by Missouri Botanical Garden” has many good methodsfor collecting and preparing plant specimens: http://www.mobot.org/MOBOT/molib/fieldtechbook/pdf/handbook.pdf.
2. Use a smartphone or digital camera to photograph your specimen in its naturalenvironment, or where it was obtained or purchased.
a. Take wide, medium, and close-up views. b. Include a person for scale in wide and medium shots. Include a ruler or coin
for scale in close-ups.3. A global positioning system (GPS)-enabled phone or camera stores latitude, lon-
gitude, and altitude coordinates along with other metadata for each photo.Visualize or extract this geotag information:
a. In Apple iPhoto, click on “i” (image properties) to plot the photo on a map.Click on “Photo,” then “Show extended photo info” to find GPS coordinates.
b. GeoSetter, photo metadata freeware for PCs, will plot your photo on a map. c. In Google Picasa photo editor, click on “i’ to find GPS coordinates. d. Your smartphone’s manual should explain how to use the GPS feature to
obtain coordinates. e. Many smartphones also have apps that make it easy to harvest GPS coordi-
nates. 4. Share your collection location by dropping a pin on a Google map. a. Sign in to or create a Google Maps account. b. Create and name a new map. c. Zoom in as much as possible on the collection location. d. Click on the pin icon to create a pin, then click the collection location. e. Give a title to the pin, and add any collection notes in the description field. f. To add a link to a photo or other url, click on the picture icon under the
“Rich text” option. g. Click on “Done” to save your pin drop. h. Click on “Collaborate” or “Share” to share your map with others.
5. Use a field guide or taxonomic key to identify your specimen as precisely as pos-sible: kingdom > phylum > class > order > family > genus > species. Taxonomickeys for local plants, fungi, or animals are often available online, at libraries, orfrom universities, natural history museums, and botanical gardens.
If a camera is not available,make sketches of the locationand sample.
Please be aware that detailsdescribed in steps 3 and 4 maychange as the devices, soft-ware, and websites developover time.
A smartphone app can contin-uously record your location,making it easy to document acollection trip or a samplingtransect.
REAGENTS, SUPPLIES, & EQUIPmENTTo ShareCollection tubes, jars, or bagsTweezers, scalpel, and scissorsSmartphone with camera or digital camera with GPS (optional)Field guide or taxonomic key
10 DNA Barcoding 101
Copyright 2014 Cold Spring Harbor Laboratory DNA Learning Center
6. Check to see if your specimen is represented in the Barcode of Life Database,BOLD (www.boldsystems.org) or GenBank®® (www.ncbi.nlm.nih.gov):
a. Search by entering genus and species names in the search bar at top right. Ifthe species is represented in the database, the “Taxonomy Browser” will listthe number and sources of specimen records.
b. Click on “Download Public Sequences” for a fasta file of available barcodesequences.
c. Click on “Taxonomy Browser” at top left to explore barcode records bygroup.
7. Use tweezers, scalpel, or scissors to collect a small sample of tissue.8 Freeze your sample at -20°C until you are ready to begin Part II.
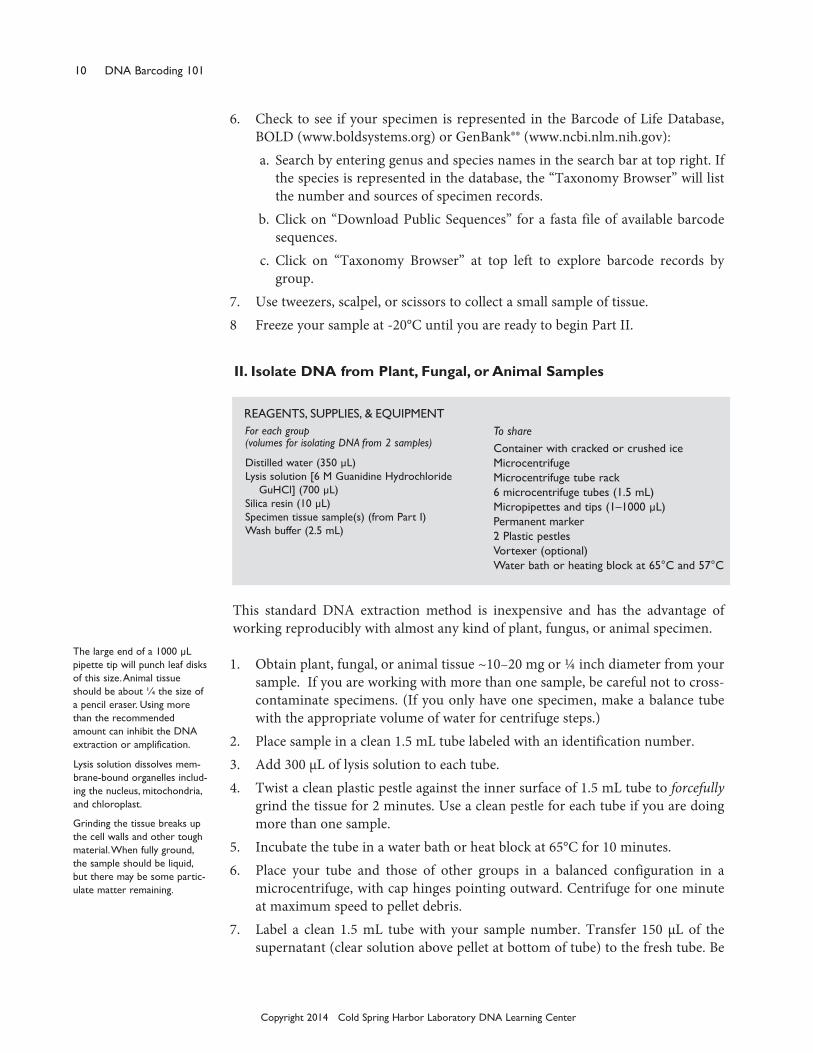
II. Isolate DNA from Plant, Fungal, or Animal Samples
This standard DNA extraction method is inexpensive and has the advantage ofworking reproducibly with almost any kind of plant, fungus, or animal specimen.
1. Obtain plant, fungal, or animal tissue ~10–20 mg or ¼ inch diameter from yoursample. If you are working with more than one sample, be careful not to cross-contaminate specimens. (If you only have one specimen, make a balance tubewith the appropriate volume of water for centrifuge steps.)
2. Place sample in a clean 1.5 mL tube labeled with an identification number.3. Add 300 µL of lysis solution to each tube.4. Twist a clean plastic pestle against the inner surface of 1.5 mL tube to forcefully
grind the tissue for 2 minutes. Use a clean pestle for each tube if you are doingmore than one sample.
5. Incubate the tube in a water bath or heat block at 65°C for 10 minutes.6. Place your tube and those of other groups in a balanced configuration in a
microcentrifuge, with cap hinges pointing outward. Centrifuge for one minuteat maximum speed to pellet debris.
7. Label a clean 1.5 mL tube with your sample number. Transfer 150 μL of thesupernatant (clear solution above pellet at bottom of tube) to the fresh tube. Be
The large end of a 1000 µLpipette tip will punch leaf disksof this size. Animal tissueshould be about ¼ the size ofa pencil eraser. Using morethan the recommendedamount can inhibit the DNAextraction or amplification.
REAGENTS, SUPPLIES, & EQUIPmENTFor each group(volumes for isolating DNA from 2 samples)
Distilled water (350 µL)Lysis solution [6 m Guanidine Hydrochloride
GuHCl] (700 µL)Silica resin (10 µL)Specimen tissue sample(s) (from Part I)wash buffer (2.5 mL)
To shareContainer with cracked or crushed icemicrocentrifuge microcentrifuge tube rack6 microcentrifuge tubes (1.5 mL)micropipettes and tips (1–1000 µL)Permanent marker2 Plastic pestlesvortexer (optional)water bath or heating block at 65°C and 57°C
Lysis solution dissolves mem-brane-bound organelles includ-ing the nucleus, mitochondria,and chloroplast.
Grinding the tissue breaks upthe cell walls and other toughmaterial. when fully ground,the sample should be liquid,but there may be some partic-ulate matter remaining.

USING DNA BARCODES TO IDENTIFY AND CLASSIFY LIVING THINGS 11
Copyright 2014 Cold Spring Harbor Laboratory DNA Learning Center
careful not to disturb the debris pellet when transferring the supernatant.Discard old tube containing the debris.
8. Add 3 μL of silica resin to tube. Mix well by pipetting up and down. Close andincubate the tube for 5 minutes in a water bath or heat block at 57 °C.
9. Place your tube and those of other groups in a balanced configuration in amicrocentrifuge, with cap hinges pointing outward. Centrifuge for 30 seconds atmaximum speed to pellet the resin. Use a micropipette with fresh tip to removeall supernatant, being careful not to disrupt the white silica resin pellet at the bot-tom of the tube.
10. Add 500 μL of ice cold wash buffer to the pellet. Close tube and mix well by vor-texing or by pipetting up and down to resuspend the silica resin.
11. Place your tube and those of other groups in a balanced configuration in amicrocentrifuge, with cap hinges pointing outward. Centrifuge for 30 seconds atmaximum speed to pellet the resin. Use a micropipette with fresh tip to removeall supernatant, being careful not to disrupt the white silica resin pellet at the bot-tom of the tube.
12. Once again, add 500 μL of ice cold wash buffer to the pellet. Close tube and mixwell by vortexing or by pipetting up and down to resuspend the silica resin.
13. Place your tube and those of other groups in a balanced configuration in amicrocentrifuge, with cap hinges pointing outward. Centrifuge for 30 seconds atmaximum speed to pellet the resin.
14. Use a micropipette with fresh tip to remove the supernatant, being careful not todisrupt the white pellet at the bottom of the tube. Spin the tube briefly to collectany drops of supernatant and then remove these with a micropipette.
15. Add 100 μL of distilled water (or TE buffer) to the silica resin and mix well byvortexing or by pipetting up and down. Incubate the mixture at 57°C for 5 min-utes.
16. Place your tube and those of other groups in a balanced configuration in amicrocentrifuge, with cap hinges pointing outward. Centrifuge for 30 seconds atmaximum speed to pellet the resin.
17. Label a clean 1.5 mL tube with your sample number. Transfer 90 μL of the super-natant (clear solution) to the fresh tube. Be careful not to disturb the pellet whentransferring the supernatant. Discard old tube containing the resin.
18. Store your sample on ice or at -20°C until you are ready to begin Part III.
Centrifugation pellets the silicaresin, which is now bound tonucleic acid. The pellet willappear as a tiny teardrop-shaped smear or particles onthe bottom side of the tubeunderneath the hinge.
washing twice is much moreeffective than washing oncewith twice the volume.
wash buffer removes contami-nants from the sample whilenucleic acids remain bound tothe resin. The silica resin is notsoluble in the wash buffer. Thesilica resin may stay as a pelletor break up during the washing.
Silica resin is a DNA bindingmatrix that is white. In thepresence of the lysis solutionthe silica resin binds readily tonucleic acids.
In the presence of water or TEbuffer, nucleic acids are elutedfrom the Silica resin.
In Part III, you will use 2 μL ofDNA for each PCR reaction.This is a crude DNA extractand contains nucleases that willeventually fragment the DNA atroom temperature. Keep thesample cold to limit this activity.
For long-term storage it is rec-ommended DNA samples bestored in TE buffer (Tris/EDTA).Tris provides a pH 8.0 environ-ment to keep DNA and RNAnucleases less active. EDTA fur-ther inactivates nucleases by bind-ing cations required by nucleases.
Sample DNA eluted in TE mayrequire a 1:10, 1:20 or 1:50 dilu-tion in water prior to PCR, if theinitial amplification of the targetgene from the eluted DNA isunsuccessful (this may occur par-ticularly in plant samples).

12 DNA Barcoding 101
Copyright 2014 Cold Spring Harbor Laboratory DNA Learning Center
III. Amplify DNA by PCR
To amplify a DNA barcode region, choose the most appropriate set of primers foreach sample. The table below lists available primer sets, the type of organism theytarget, and the PCR protocol for each set. For detailed information on the primersets, go to Primer Sequences & References.
1. Obtain PCR tube containing Ready-To-Go PCR Bead. Label the tube with youridentification number.
2. Use a micropipette with a fresh tip to add 23 µL of one of the followingprimer/loading dye mixes to each tube. Allow the beads to dissolve for 1 minute.
Plant cocktail: rbcL primers (rbcLaF / rbcLa rev) Fungi cocktail: ITS primers (ITS1F/ITS4) Fish cocktail: COI primers (VF2_t1/ FishF2_t1/ FishR2_t1/ FR1d_t1) Vertebrate (non-fish) Cocktail:
(VF1_t1/VF1d_t1/VF1i_t1/VR1d_t1/VR1_t1/VR1i_t1) Invertebrate cocktail: (LCO1490/ HC02198)3. Use a micropipette with fresh tip to add 2 µL of your DNA (from Part II) directly
into the appropriate primer/loading dye mix. Ensure that no DNA remains inthe tip after pipetting.
4. Store your sample on ice until your class is ready to begin thermal cycling.5. Place your PCR tube, along with those of the other students, in a thermal cycler
that has been programmed with the appropriate PCR protocol.
REAGENTS, SUPPLIES, & EQUIPmENT
For each groupAppropriate primer/loading dye mix (25 µL)*
per reactionDNA from specimen(s) (from Part II)*Ready-To-Go PCR Bead in 0.2- or 0.5-mL
PCR tube per reaction OR NEB Taq 2x master mix (12.5 µL)* per reaction
To shareContainer with cracked or crushed icemicropipettes and tips (1–100 µL )microcentrifuge tube rackPermanent markerThermal cycler
*Store on ice
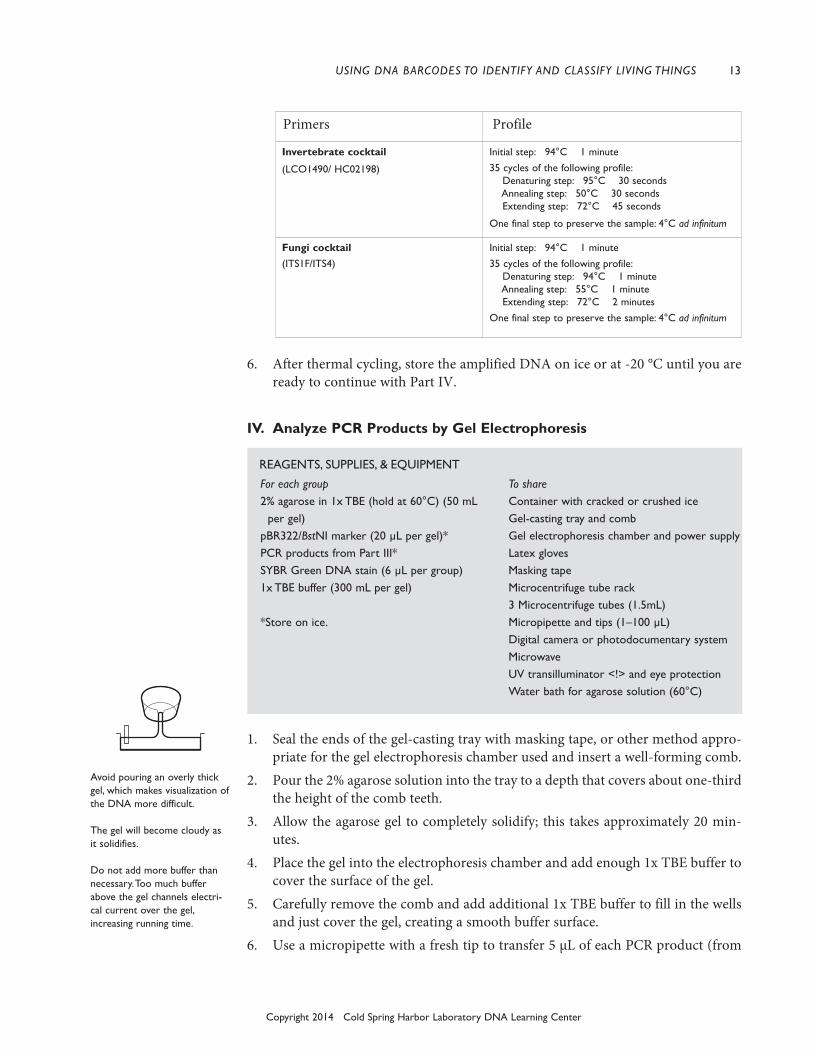
Primers Profile
Plant cocktail
(rbcLaF / rbcLa rev)
Vertebrate (non-fish) cocktail
(vF1_t1/ vF1d_t1/ vF1i_t1/vR1d_t1/ vR1_t1/ vR1i_t1)
Initial step: 94°C 1 minute35 cycles of the following profile:
Denaturing step: 94°C 15 secondsAnnealing step: 54°C 15 secondsExtending step: 72°C 30 seconds
One final step to preserve the sample: 4°C ad infinitum
Fish cocktail
(vF2_t1/ FishF2_t1/FishR2_t1/ FR1d_t1)
Initial step: 94°C 1 minute
35 cycles of the following profile:Denaturing step: 94°C 15 secondsAnnealing step: 54°C 15 secondsExtending step: 72°C 30 seconds
One final step to preserve the sample: 4°C ad infinitum
If the reagents become splat-tered on the wall of the tube,pool them by pulsing the sam-ple in a microcentrifuge or bysharply tapping the tube bot-tom on the lab bench.
USING DNA BARCODES TO IDENTIFY AND CLASSIFY LIVING THINGS 13
Copyright 2014 Cold Spring Harbor Laboratory DNA Learning Center
6. After thermal cycling, store the amplified DNA on ice or at -20 °C until you areready to continue with Part IV.
IV. Analyze PCR Products by Gel Electrophoresis
1. Seal the ends of the gel-casting tray with masking tape, or other method appro-priate for the gel electrophoresis chamber used and insert a well-forming comb.
2. Pour the 2% agarose solution into the tray to a depth that covers about one-thirdthe height of the comb teeth.
3. Allow the agarose gel to completely solidify; this takes approximately 20 min-utes.
4. Place the gel into the electrophoresis chamber and add enough 1x TBE buffer tocover the surface of the gel.
5. Carefully remove the comb and add additional 1x TBE buffer to fill in the wellsand just cover the gel, creating a smooth buffer surface.
6. Use a micropipette with a fresh tip to transfer 5 µL of each PCR product (from
Primers Profile
Invertebrate cocktail
(LCO1490/ HC02198)
Initial step: 94°C 1 minute35 cycles of the following profile:
Denaturing step: 95°C 30 secondsAnnealing step: 50°C 30 secondsExtending step: 72°C 45 seconds
One final step to preserve the sample: 4°C ad infinitum
Fungi cocktail(ITS1F/ITS4)
Initial step: 94°C 1 minute35 cycles of the following profile:
Denaturing step: 94°C 1 minuteAnnealing step: 55°C 1 minuteExtending step: 72°C 2 minutes
One final step to preserve the sample: 4°C ad infinitum
Avoid pouring an overly thickgel, which makes visualization ofthe DNA more difficult.
The gel will become cloudy asit solidifies.
Do not add more buffer thannecessary. Too much bufferabove the gel channels electri-cal current over the gel,increasing running time.
REAGENTS, SUPPLIES, & EQUIPmENT
For each group2% agarose in 1x TBE (hold at 60°C) (50 mL
per gel)pBR322/BstNI marker (20 µL per gel)*PCR products from Part III*SYBR Green DNA stain (6 µL per group)1x TBE buffer (300 mL per gel)
*Store on ice.
To shareContainer with cracked or crushed iceGel-casting tray and combGel electrophoresis chamber and power supplyLatex glovesmasking tapemicrocentrifuge tube rack3 microcentrifuge tubes (1.5mL)micropipette and tips (1–100 µL)Digital camera or photodocumentary systemmicrowaveUv transilluminator <!> and eye protectionwater bath for agarose solution (60°C)

14 DNA Barcoding 101
Copyright 2014 Cold Spring Harbor Laboratory DNA Learning Center
part III) to a fresh 1.5 mL microcentrifuge tube. Add 2 µL of SYBR Green DNAstain to tube.
7. Add 2 µL of SYBR Green DNA stain to 20 µL of pBR322/BstNI marker. 8. Orient the gel according to the diagram below, so the wells are along the top of
the gel. Use a micropipette with a fresh tip to load 20 μL of pBR322/BstNI sizemarker into the far left well.
9. Use a micropipette with a fresh tip to load each sample from Step 6 in yourassigned wells, similar to the following diagram:
The samples you load may not be exactly the same as those shown.10. Store the remaining 20 µL of your PCR product on ice or at -20°C until you are
ready to submit your samples for sequencing.11. Run the gel for approximately 30 minutes at 130V. Adequate separation will have
occurred when the cresol red dye front has moved at least 50 mm from the wells.12. View the gel using UV transillumination. Photograph the gel using a digital cam-
era or photodocumentary system.
RESULTS AND DISCUSSION
I. Think About the Experimental Methods1. Describe the effect of each of the following steps or reagents used in DNA isola-
tion (Part I of Experimental Methods): i. Collecting fresh or dried specimens ii. Using only a small amount of tissue iii. Grinding tissue with pestle iv. Lysis solution v. Heating or boiling.II. Interpret Your Gel and Think About the Experiment1. Observe the photograph of the stained gel containing your PCR samples and those
from other students. Orient the photograph with the sample wells at the top. Usethe sample gel shown on the next page to help interpret the band(s) in each lane ofthe gel.
2. Locate the lane containing the pBR322/BstNI markers on the left side of the gel.Working down from the well, locate the bands corresponding to each restrictionfragment: 1857, 1058, 929, 383, and 121 bp. The 1058- and 929-bp fragments will
MARKERpBR322/ rbcL COI ITSBstNI PLANT 1 PLANT 2 ANIMAL 1 ANIMAL 2 FUNGI 1 FUNGI 2
Expel any air from the tipbefore loading, and be carefulnot to push the tip of thepipette through the bottom ofthe sample well.
A 100-bp ladder may also beused as a marker.
Transillumination, where thelight source is below the gel,increases brightness and con-trast.

USING DNA BARCODES TO IDENTIFY AND CLASSIFY LIVING THINGS 15
Copyright 2014 Cold Spring Harbor Laboratory DNA Learning Center
be very close together or may appear as a single large band. The 121-bp bandmay be very faint or not visible.
3. Looking across the gel at the PCR products, do the bands all appear to be thesame bp size and intensity?
4. It is common to see a diffuse (fuzzy) band that runs ahead of the 121-bp marker.This is “primer dimer,” an artifact of the PCR that results from the primers over-lapping one another and amplifying themselves.
5. Which samples amplified well, and which ones did not? Give several reasonswhy some samples may not have amplified; some of these may be errors in pro-cedure.
6. Generally, DNA sequence can be obtained from any sample that gives an obvi-ous band on the gel.
BIOINFORmATICS
I. Use BLAST to Find DNA Sequences in Databases (Electronic PCR)
1. Perform a BLAST search as follows: a. Do an Internet search for “ncbi blast.” b. Click the link for the result BLAST: Basic Local Alignment Search Tool. This
will take you to the Internet site of the National Center for BiotechnologyInformation (NCBI).
c. Under the heading “Basic BLAST,” click “nucleotide blast.” d. Enter the primer set you used into the search window. These are the query
sequences. (See box at top of next page.) e. Omit any non-nucleotide characters from the window because they will not
be recognized by the BLAST algorithm. f. Under “Choose Search Set,” select “NCBI Genomes (chromosome)” from the
pull-down menu. g. Under “Program Selection,” optimize for “Somewhat similar sequences
(blastn).”
mARKER mARKER
pBR322/ rbcL COI ITS 100-bpBstNI PLANT 1 PLANT 2 ANImAL 1 ANImAL 2 FUNGI 1 FUNGI 2 ladder
1857 bp1058 bp929 bp
580 bp383 bp
121 bp
primer dimer(if present)
If you have a very faint productor none at all, your teacher willhelp you decide if your sampleshould be sent for sequencing.
Additional faint bands at otherpositions occur when theprimers bind to chromosomeloci other than the intendedlocus and give rise to “nonspe-cific” amplification products.
16 DNA Barcoding 101
Copyright 2014 Cold Spring Harbor Laboratory DNA Learning Center
h. Click “BLAST.” This sends your query sequences to a server at the NationalCenter for Biotechnology Information in Bethesda, Maryland. There, theBLAST algorithm will attempt to match the primer sequences to the DNAsequences stored in its database. A temporary page showing the status of yoursearch will be displayed until your results are available. This may take only afew seconds or more than a minute if many other searches are queued at theserver.
2. The results of the BLAST search are displayed in three ways as you scroll downthe page:
a. First, a Graphic Summary illustrates how significant matches, or “hits,” alignwith the query sequence. Why are some alignments longer than others?
b. This is followed by Descriptions of sequences producing significant alignments,a table with links to database reports.
• The accession number is a unique identifier given to a sequence when it issubmitted to a database, such as Genbank®. The accession link leads to adetailed report on the sequence.
• Note the scores in the “E Value” column on the right. The Expectation, orE, value is the number of alignments with the query sequence that wouldbe expected to occur by chance in the database. The lower the E value, thehigher the probability that the hit is related to the query. For example, anE value of 1 means that a search with your sequence would be expected toturn up one match by chance.
• What is the E value of your most significant hit, and what does it mean?What does it mean if there are multiple hits with similar E values?
• What do the descriptions of significant hits have in common? c. Next is an Alignments section, which provides a detailed view of each primer
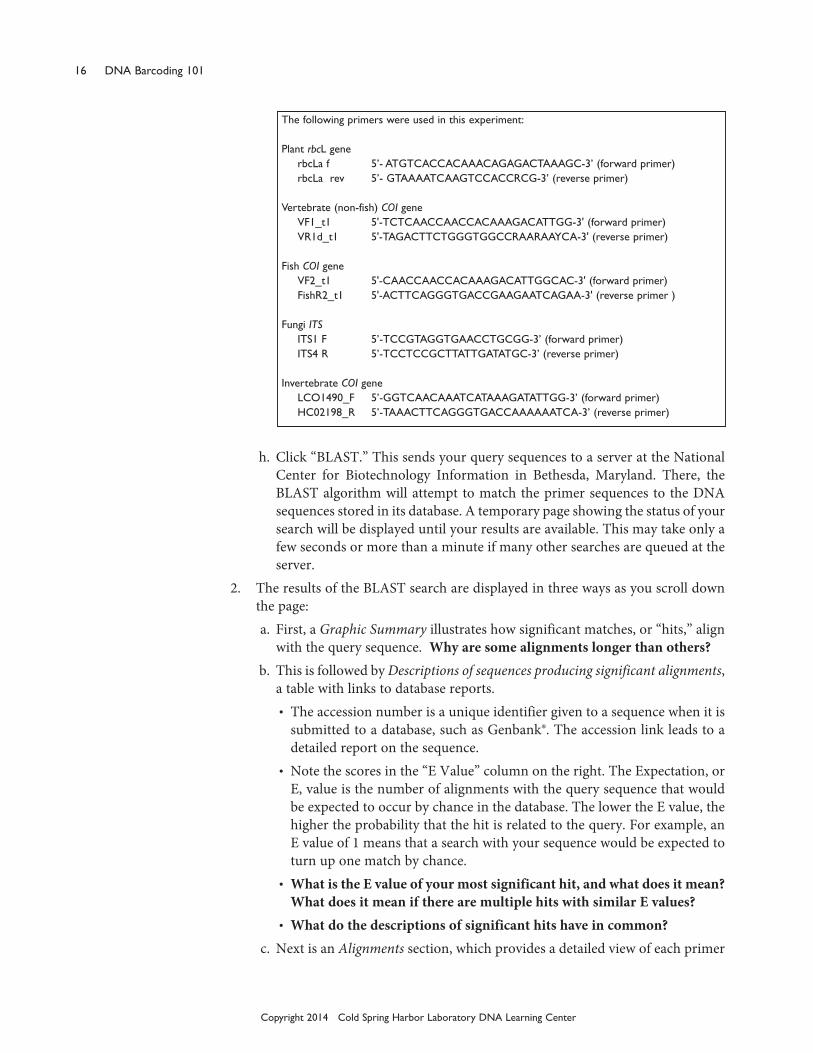
The following primers were used in this experiment:
Plant rbcL generbcLa f 5’- ATGTCACCACAAACAGAGACTAAAGC-3’ (forward primer)rbcLa rev 5’- GTAAAATCAAGTCCACCRCG-3’ (reverse primer)
vertebrate (non-fish) COI genevF1_t1 5'-TCTCAACCAACCACAAAGACATTGG-3' (forward primer)vR1d_t1 5'-TAGACTTCTGGGTGGCCRAARAAYCA-3' (reverse primer)
Fish COI genevF2_t1 5'-CAACCAACCACAAAGACATTGGCAC-3' (forward primer) FishR2_t1 5'-ACTTCAGGGTGACCGAAGAATCAGAA-3' (reverse primer )
Fungi ITSITS1 F 5’-TCCGTAGGTGAACCTGCGG-3’ (forward primer)ITS4 R 5’-TCCTCCGCTTATTGATATGC-3’ (reverse primer)
Invertebrate COI geneLCO1490_F 5’-GGTCAACAAATCATAAAGATATTGG-3’ (forward primer)HC02198_R 5’-TAAACTTCAGGGTGACCAAAAAATCA-3’ (reverse primer)
USING DNA BARCODES TO IDENTIFY AND CLASSIFY LIVING THINGS 17
Copyright 2014 Cold Spring Harbor Laboratory DNA Learning Center
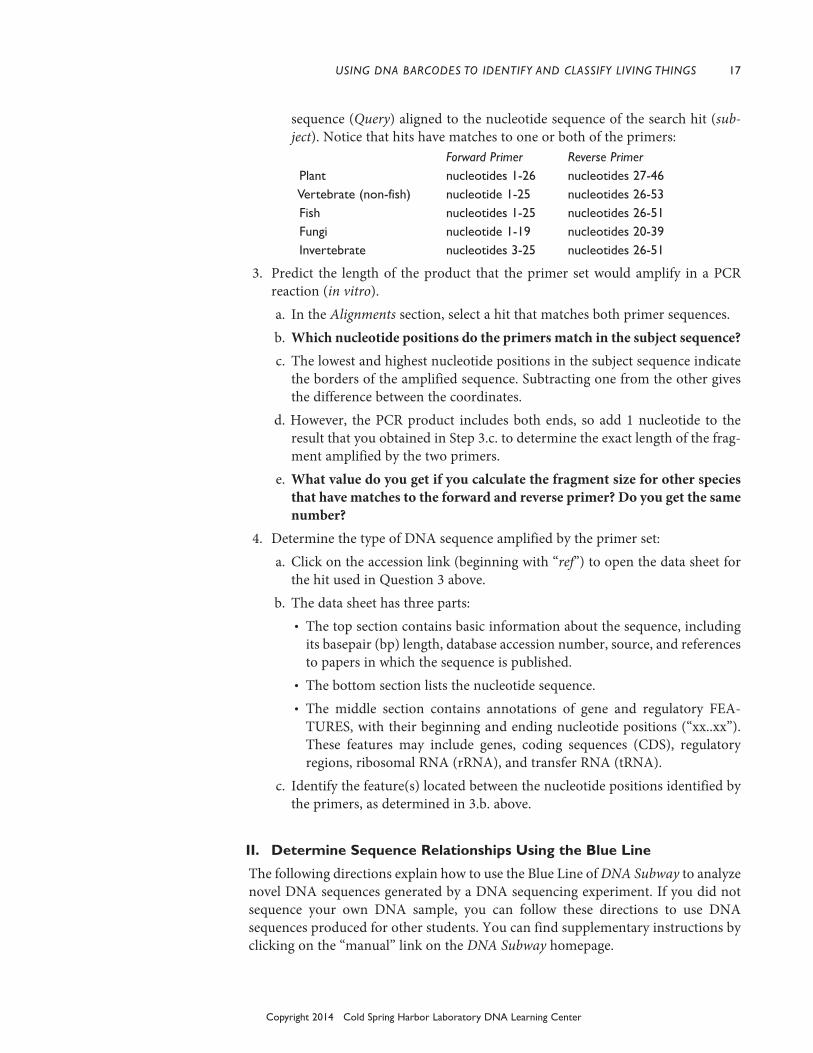
sequence (Query) aligned to the nucleotide sequence of the search hit (sub-ject). Notice that hits have matches to one or both of the primers:
Forward Primer Reverse Primer Plant nucleotides 1-26 nucleotides 27-46 vertebrate (non-fish) nucleotide 1-25 nucleotides 26-53 Fish nucleotides 1-25 nucleotides 26-51 Fungi nucleotide 1-19 nucleotides 20-39 Invertebrate nucleotides 3-25 nucleotides 26-51
3. Predict the length of the product that the primer set would amplify in a PCRreaction (in vitro).
a. In the Alignments section, select a hit that matches both primer sequences. b. Which nucleotide positions do the primers match in the subject sequence? c. The lowest and highest nucleotide positions in the subject sequence indicate
the borders of the amplified sequence. Subtracting one from the other givesthe difference between the coordinates.
d. However, the PCR product includes both ends, so add 1 nucleotide to theresult that you obtained in Step 3.c. to determine the exact length of the frag-ment amplified by the two primers.
e. What value do you get if you calculate the fragment size for other speciesthat have matches to the forward and reverse primer? Do you get the samenumber?
4. Determine the type of DNA sequence amplified by the primer set: a. Click on the accession link (beginning with “ref”) to open the data sheet for
the hit used in Question 3 above. b. The data sheet has three parts:
• The top section contains basic information about the sequence, includingits basepair (bp) length, database accession number, source, and referencesto papers in which the sequence is published.
• The bottom section lists the nucleotide sequence. • The middle section contains annotations of gene and regulatory FEA-
TURES, with their beginning and ending nucleotide positions (“xx..xx”).These features may include genes, coding sequences (CDS), regulatoryregions, ribosomal RNA (rRNA), and transfer RNA (tRNA).
c. Identify the feature(s) located between the nucleotide positions identified bythe primers, as determined in 3.b. above.
II. Determine Sequence Relationships Using the Blue Line
The following directions explain how to use the Blue Line of DNA Subway to analyzenovel DNA sequences generated by a DNA sequencing experiment. If you did notsequence your own DNA sample, you can follow these directions to use DNAsequences produced for other students. You can find supplementary instructions byclicking on the “manual” link on the DNA Subway homepage.

18 DNA Barcoding 101
Copyright 2014 Cold Spring Harbor Laboratory DNA Learning Center
DNA Subway is an intuitive interface for analyzing DNA barcodes. Generally, youprogress in a stepwise fashion through the button “stops“ on each “branch line." An“R" indicates that analysis is available. A blinking “R" indicates an analysis is inprocess. A “V" means that results are ready to view.
You can analyze relationships between DNA sequences by comparing them to a setof sequences you have compiled yourself, or by comparing your sequences to othersthat have been published in databases such as GenBank® (National Center forBiotechnology Information). Generating a phylogenetic tree from DNA sequencesderived from related species can also allow you to draw inferences about how thesespecies may be related. By sequencing variable sections of DNA (barcode regions)you can also use the Blue Line to help you identify an unknown species, or publisha DNA barcode for a species you have identified, which is not represented in pub-lished databases like GenBank® (www.ncbi.nlm.nig.gov/genbank).
1. Create a DNA Subway Project and Upload DNA Sequences a. Log in to DNA Subway at www.dnasubway.org. If you do not have an
account, you will need to register first to save and share your work. b. Select “Determine Sequence Relationships” (Blue Line) to begin a project. c. Select “rbcL” or “COI” from the “Select Project Type” section. (rbcL (plant)
sequences must be analyzed separately from COI (animal) sequences.) If youare analyzing a barcode region that is not listed, select “DNA."
d. “Select Sequence Source” provides several ways to obtain sequences for bar-code analysis:
• Upload sequence(s) in ab1 (files ending with .ab1) or FASTA format. Click“Browse” to navigate to a folder on your desktop or drive containing yoursequence(s). Select a sequence by clicking on its file name. Select morethan one sequence by holding down the ctrl key while clicking file names.Once you have selected the sequences you want, click “Open”.
• Enter a sequence in FASTA format. Below is an example of this format. The“>” symbol demarcates the sequence name. The sequence is started on thenext line.
>sequence name atcgccccttaatattgcctt….. • Import a sequence/trace from the DNALC. Click your tracking number.
Select one or more files from the list. Click to “Add” selected files. • Select a sample sequence.
e. Provide a title in the Name Your Project section. f. Write a short description of your project in the Description section (optional). g. Click “Continue” to load the project into DNA Subway.
2. View and Build Sequences There are many plants, animals, and fungi which do not have a documented bar-
code sequence. For instance, there are an estimated 350,000 species of
USING DNA BARCODES TO IDENTIFY AND CLASSIFY LIVING THINGS 19
Copyright 2014 Cold Spring Harbor Laboratory DNA Learning Center
angiosperms (flowering plants), but as of June 2013 there were only about74,000 rbcL angiosperm sequences in GenBank®. For other species, diversity inthe barcode sequences are not well characterized. This means that there areopportunities to submit novel sequences and contribute to the global barcodingeffort. Only samples that have high quality sequence for both the forward andreverse reads are good enough to ensure a low error rate and can be publishedto GenBank®, so the sequence quality must be checked. Sequences for whichthere is only one high quality read are not considered high enough quality topublish. These sequences and those with no high quality sequence can still beanalyzed even though the results are not publishing quality.
a. On the Assemble Sequences branch line, Click “Sequence Viewer” to displaythe sequences you have input in the project creation section. If you did notupload trace files, you can scroll to see the sequence. If you uploaded tracefiles, click on the file names to view the trace files.
• The DNA sequencing software measures the fluorescence emitted in eachof four channels—A, T, C, G—and records these as a trace, or electro-pherogram. In a good sequencing reaction, the nucleotide at a given posi-tion will be fluorescently labeled far in excess of background (random)labeling of the other three nucleotides, producing a “peak” at that positionin the trace. Thus, peaks in the electropherogram correlate to nucleotidepositions in the DNA sequence.
• A software program called Phred analyzes the sequence file and “calls” anucleotide (A, T, C, G) for each peak. If two or more nucleotides have rel-atively strong signals at the same position, the software calls an “N” for anundetermined nucleotide.
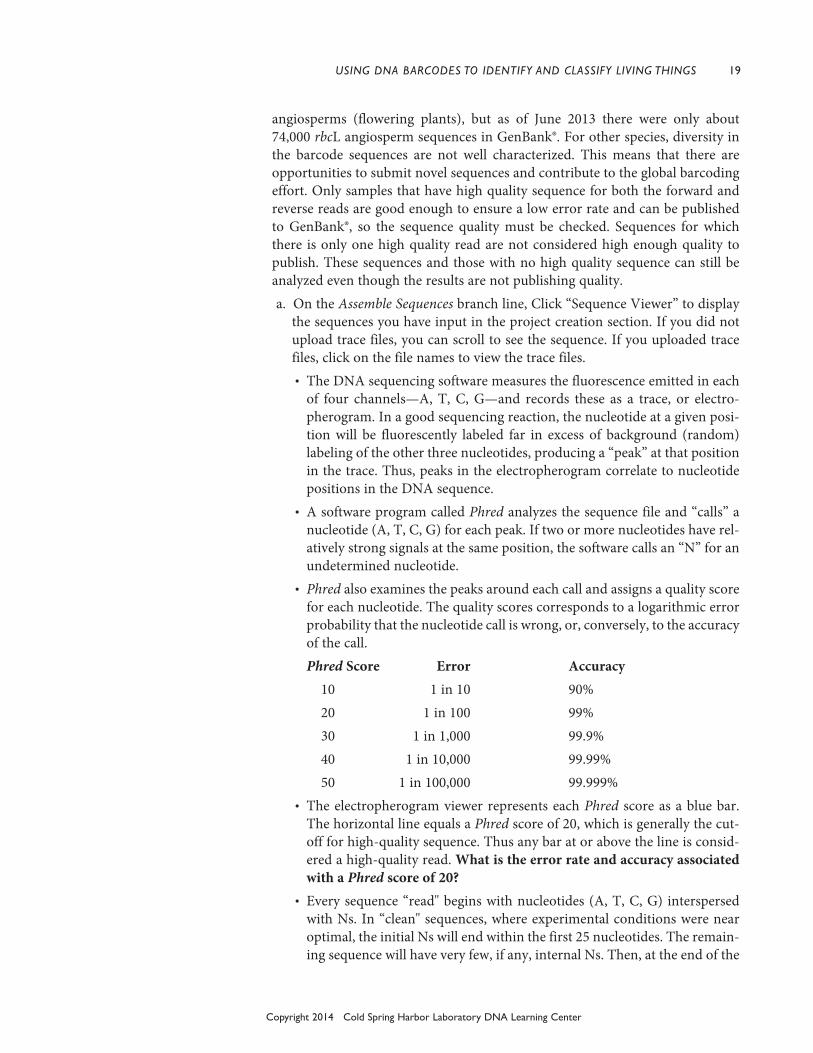
• Phred also examines the peaks around each call and assigns a quality scorefor each nucleotide. The quality scores corresponds to a logarithmic errorprobability that the nucleotide call is wrong, or, conversely, to the accuracyof the call.Phred Score Error Accuracy 10 1 in 10 90% 20 1 in 100 99% 30 1 in 1,000 99.9% 40 1 in 10,000 99.99% 50 1 in 100,000 99.999%
• The electropherogram viewer represents each Phred score as a blue bar.The horizontal line equals a Phred score of 20, which is generally the cut-off for high-quality sequence. Thus any bar at or above the line is consid-ered a high-quality read. What is the error rate and accuracy associatedwith a Phred score of 20?
• Every sequence “read" begins with nucleotides (A, T, C, G) interspersedwith Ns. In “clean" sequences, where experimental conditions were nearoptimal, the initial Ns will end within the first 25 nucleotides. The remain-ing sequence will have very few, if any, internal Ns. Then, at the end of the
read the sequence will abruptly change over to Ns. • Large numbers of Ns scattered throughout the sequence indicate poor
quality sequence. Sequences with average Phred scores below 20 will beflagged with a “Low Quality Score Alert.” You will need to be careful whendrawing conclusions from analyses made with poor quality sequence.What do you notice about the electropherogram peaks and qualityscores at nucleotide positions labeled “N”?
• Note: The exclamation icon (!) indicates poor quality sequence. b. Use the “X” and “Y” buttons to adjust the level of zoom. You can undo zoom-
ing by pressing the “Reset” button. c. Examine the quality of the sequence(s). Any sequence for which the forward
or reverse has the warning icon indicating a low quality score is not of goodenough quality to publish and any determination of novelty will be tentativeas sequencing errors could appear to be novel polymorphisms.
d. Click “Sequence Trimmer” to trim your sequences; this automaticallyremoves Ns from the 5’ and 3’ ends of selected sequences. Click again to viewthe trimmed sequences. Why is it important to remove excess Ns from theends of the sequences?
e. If you wish to view trimmed sequences, click on the file name.3. Pair and Build Consensus for Forward and Reverse Reads a. If you have two reads for a sample, pair the sequences by checking the box to
the right of each read for the sample. By default, DNA Subway assumes thatall reads are in the forward orientation, and displays an “F” to the right of thesequence. If any sequence is not in that orientation, click the F to reversecomplement the sequence. The sequence will display an “R” to indicate thechange.
b. After checking the second read, a dialogue box will appear asking if you wishto designate the sequences as a pair. Alternatively, Click “Try auto pairing” topair sequences which have identical sample names, but appended with an For R based on sequencing direction.
c. Click “Save” to save your pair assignments. d. Once you have created sequence pairs, click “Consensus Editor” to make a
consensus sequence from both sequences in the selected pairs. To examinethe consensus sequence click “Consensus Editor” again, and then click on thelink to the pair you wish to examine. How does the consensus sequence opti-mize the amount of sequence information available for analysis? Why doesthis occur?
e. If there are any mismatched nucleotides between the first and secondsequence, these will be highlighted yellow in the consensus editor window.Do differences tend to occur in certain areas of the sequence? Why?
f. Large numbers of yellow mismatches—especially in long blocks—may indi-cate that you have incorrectly paired sequences from two different sources(organisms), or that you failed to reverse complement the reverse strand.
20 DNA Barcoding 101
Copyright 2014 Cold Spring Harbor Laboratory DNA Learning Center
USING DNA BARCODES TO IDENTIFY AND CLASSIFY LIVING THINGS 21
Copyright 2014 Cold Spring Harbor Laboratory DNA Learning Center
• Return to Pair Builder to check your pairs and reverse complements. • Click the red “x” to redo a pairing, and toggle “F” and “R” settings, as needed.
h. A large number of mismatches in properly paired and reverse complementedsequences indicate that one or both sequences is of poor quality. Often, oneof the sequencing reactions produces a high quality read that can be used onits own. To determine this:
• Examine the distribution of Ns to see if they are mainly confined to one ofthe two sequences.
• Examine the electropherograms to see if one of the two sequences is ofgood quality.
• If one of the sequences seems of good quality, return to Pair Builder, andclick the red x to undo the pairing.
• Continue on to Step 4. i. Few or no internal mismatches indicate good quality sequence from forward
and reverse reads. If you like, you can check the consensus sequence at yellowmismatches and override the judgment made by the software:
• Click a highlighted mismatch to see the electropherograms and graphicsummarizing Phred scores for each read.
• Click the desired nucleotide in the black rectangle to change the consensussequence at that position. You should only change the consensus if youhave a strong reason to believe the consensus is wrong.
• Click the button to “Save Change(s).”4. BLAST Your Sequence A BLAST search can quickly identify any close matches to your sequence in
sequence databases. In this way, you can often quickly identify an unknownsample to the genus or species level. It also provides a means to add samples fora phylogenetic analysis.
a. On the Add Sequences branch, click “BLASTN”. Then, click the “BLAST”button next to the sequence you want to query against DNA databases.
b. The returned list has information about the 20 most significant alignments(hits):
• Accession number, a unique identifier given to each sequence submittedto a database. Prefixes indicate the database name—including gb(GenBank®), emb (European Molecular Biology Laboratory), and dbj(DNA Databank of Japan).
• Organism and sequence description or gene name of the hit. Click thegenus and species name for a link to an image of the organism, with addi-tional links to detailed descriptions at Wikipedia and Encyclopedia of Life(EOL).
• Several statistics allow comparison of hits across different searches. Thenumber of mismatches over the length of the alignment gives a rough ideaof how closely two sequences match. The Bit Score formula takes into

22 DNA Barcoding 101
Copyright 2014 Cold Spring Harbor Laboratory DNA Learning Center
account gaps in the sequence; the higher the score the better the alignment.The Expectation or E-value is the number of alignments with the querysequence that would be expected to occur by chance in the database. Thelower the E-value, the higher the probability that the hit is related to thequery. For example, an E value of 0 means that a search with your sequencewould be expected to turn up no matches by chance. Why do the most sig-nificant hits typically have E-values of 0? (This is not the case withBLAST searches with primers.) What does it mean when there are multi-ple BLAST hits with similar E values?
• Examine the last column in the report called “Mismatches.” For barcodes,this is the informative column, with the best hits being those with the low-est number of mismatches. Note that hits with low numbers of mismatchescan sometimes be lower on the list, as the bit scores are used to arrange thehits in the table. High bit scores can occur when the alignment length islonger, even when there are more mismatches than for other hits.
• If there are zero mismatches between your sequence and a BLAST result,it is unlikely that your sequence is unique. Instead, the identical sequencesprobably match because they are in the same taxonomic group as yoursample. Check to see if the matching sequences are from species that seemreasonable for your sample. If your best matches include some mismatch-es, you may have identified a novel barcode. The more mismatches youfind, the more likely that your sequence is unique, especially in regions ofthe sequence with high quality scores. However, sequencing errors couldexplain the difference, so it will be important to reexamine the trace files atany sites with mismatches to ensure that the consensus at those locationsis of high quality.
c. Add BLAST sequence data to your phylogenetic analysis by checking thebox(es) next to any accession number(s), then clicking on “Add BLAST hitsto project” at the bottom of the BLAST results window.
5. Add Sequences to Your Analysis a. Click “Upload Data” to add additional sequence data to your analysis without
starting a new project. Use “Upload Sequence(s)” to upload ab1 trace files orFASTA-formatted sequences stored locally on your computer; Use “EnterSequences(s)” to paste or type sequences in FASTA format.
b. If you would like to import sequences from non-local sources you can use“Import Sequence” to search a sequence database using a sequence identifier.For GenBank® sequences you can search by identification number (GI orVersion). Search BOLD by species name, or search the DNALC sequencedatabase by tracking number for sequences you processed with GENEWIZthrough the DNALC system.
c. If your sequence had no hits with zero mismatches, you may use NCBIBLAST to confirm that the sequence is novel. Click on the BLASTN buttonand then double-click on the sequence (the actual nucleotides) that you iden-tified as possibly novel to select them. Right-click (PC) or command-click(Mac) and then select copy to move the sequence to your clipboard.
• In a web browser go to http://blast.ncbi.nlm.nih.gov. From this page clickon “nucleotide blast.”
• Paste your sequence into the “Enter Query Sequence” window under“enter accession number(s), gi(s), or FASTA sequence(s).”
• Under “Program Selection” select “Highly similar sequences (megablast)”;next click “BLAST.”
• On the results page you will get a list of results very similar to what wasreturned by DNA Subway.
• Scrolling down the page, you will find alignments of your sequence(Query) to the sequences from the closest matches in GenBank® (Sbjct).
• Analyze the results of the BLAST search, which are displayed in three waysas you scroll down the page:
∙ First, a graphical overview illustrates how significant matches (hits)align with the query sequence. Matches of differing lengths are indicatedby color-coded bars. For barcoding results, it is likely that most matcheswill be red, indicating high scores, and cover most of the width of thetable, showing matches that span the length of your query sequence.
∙ This is followed by a table with “Descriptions of sequences producingsignificant alignments” much like the table for BLAST results in DNASubway.
∙ Next is an “Alignments” section, which provides a detailed view of eachprimer sequence (“Query”) aligned to the nucleotide sequence of thesearch hit (“Sbjct,” “subject”).
∙ From the table, identify any matches that are 100% identical or anymatches with high identity that appear to represent species or sequencesyou have not identified previously. Select these sequences by clicking onthe box to the left of each hit. After selecting sequences, click Download,ensure FASTA (complete sequence) is selected, and then click Continue.
∙ Open the resulting FASTA file (named seqdump). Double-click thesequences to select them all, then right-click (PC) or command-click(Mac) and select copy to move the sequence to your clipboard. Addthese sequences to your project using the Upload Data function, as instep 1.
• Click “Sequence Viewer” back on DNA Subway, and view the trace file forthe forward read of your query sequence. Locate the position on your tablewhere the query sequence differed from the GenBank® match. Determineif the nucleotides you identified as different were of high quality (e.g. notsequencing errors). Because of sequence trimming, you may have to searchfor the polymorphic site, as the numbers from the BLAST alignment andin the trace file may not correspond.
d. You may also choose to search for your sequence at the InternationalBarcode of Life (IBOL) database, BOLD (Barcode of Life Online Database);their records are not all in GenBank®.
USING DNA BARCODES TO IDENTIFY AND CLASSIFY LIVING THINGS 23
Copyright 2014 Cold Spring Harbor Laboratory DNA Learning Center

24 DNA Barcoding 101
Copyright 2014 Cold Spring Harbor Laboratory DNA Learning Center
• Click the BLAST button and then double-click the nucleotides for thesequence you are analyzing. Right-click (PC) or command-click (Mac) andthen select copy to move the sequence to your clipboard.
• In a web browser go to http://boldsystems.org. From this page, click on“Identification.”
• Select the tab that corresponds to the appropriate kingdom for the sample(animal, plant, or fungal).
• Under the Animal Identification [COI] tab, select “Species Level BarcodeRecords.” On the Fungal Identification [ITS] tab, select “ITS Sequences.”On the Plant Identification [rcbL & matK] tab, select “Plant Sequences.”
• Paste the sequence into the search box labeled “Enter sequences in fastaformat”; next click “Submit.”
• Again, a results table is produced. The column labeled “similarity” indi-cates how similar your sequence was to the records in the BOLD, with a100% match indicating they were exact matches. Some records in BOLDare not public, or are not accompanied by species-level identifications.Scrolling down the list of matches you will see a pairwise alignment of yoursequence (Query) to the matched sequences (Subj). Once again, identifyany new hits that may be identical to your sequence. For published hits,you can download the sequence by clicking the link to the right of“Published,” then clicking “FASTA” and saving the file. This FASTA filecan be uploaded, as described above, in step 1.
e. Click “Reference Data” (optional) to include additional sequences.Depending on the project type you have created, you will have access to addi-tional sequence data that may be of interest. For example, if you are doing aDNA barcoding project using the rbcL gene, samples of rbcL sequence frommajor plant groups (Angiosperms, Gymnosperms, etc.) will be provided.Choose any data set to add it to your analysis; you will be able to include orexclude individual sequences within the set in the next step.
6. Analyze Sequences: Select and Align Many unknown species can be rapidly identified by a BLAST search. In this case,
a phylogenetic analysis adds depth to your understanding by showing how yoursequence fits into a broader taxonomy of living things. If your BLAST searchfails to identify your sequence, phylogenetic analysis can usually identify it to atleast the family level.
a. Click “Select Data” to display all the sequences you have brought into youranalysis, including “user data,” BLAST hits, or reference data. Check offsequences you wish to include in an alignment. In general, to determine therelationship of your sequence to species with known barcodes, it is best toconcentrate on similar sequences. For instance, you should align sequencesfrom samples that you believe are the same species and any close matchesfrom database searches. You may also use the “Select all” feature to includeall sequences; to deselect all sequences, click “Select all” a second time. Youmay run new alignments or download different sequences at any time after

USING DNA BARCODES TO IDENTIFY AND CLASSIFY LIVING THINGS 25
Copyright 2014 Cold Spring Harbor Laboratory DNA Learning Center
selecting a new set of sequences. • To download selected sequences to a FASTA file click the “Download”
button and save the resulting file. • To save your selections, click “Save Selections” in the blue dialog box that
appears when you make any selections. b. Click “MUSCLE” to run the MUSCLE multiple alignment software. This
software will align all sequences that were included in the “Select Data” step.Click “MUSCLE” again to open the created multiple alignment. An align-ment that is suitable for creating a phylogenetic tree will have an overall highSequence Conservation Score (represented by the height of the gray barsalong the Sequence Conservation row at the top).
• Scroll through your alignments to see similarities between sequences.Nucleotides are color coded, and each row of nucleotides is the sequenceof a single organism or sequencing reaction. Columns are matches (or mis-matches) at a single nucleotide position across all sequences. Dashes (-) aregaps in sequence, where nucleotides in one sequence are not representedin other sequences.
• Note that the 5’ (leftmost) and 3’ (rightmost) ends of the sequences areusually misaligned, due to gaps (-) or undetermined nucleotides (Ns).What causes these problems?
• Note any sequence that introduces large, internal gaps (-----) in the align-ment. This is either poor quality or unrelated sequence that should beexcluded from the analysis. To remove it, return to Select Data, uncheckthat sequence, and save your change. Then click “MUSCLE” to recalculate.
c. You will need to “trim” the alignment. To trim, click the “Trim Alignment”button on the upper-left of the Alignment Viewer. Why is it important toremove sequence gaps and unaligned ends?
7. Analyze Sequences: Create a Phylogenetic Tree a. Click “PHYLIP ML” to generate a phylogenetic tree using the maximum like-
lihood method. Click “PHYLIP ML”again and a tree will open in a new win-dow, and the MUSCLE alignment used to produce it will open in anotherwindow.
b. A phylogenetic tree is a graphical representation of relationships betweentaxonomic groups. In this experiment, a gene tree is determined by analyzingthe similarities and differences in DNA sequence.
c. Look at your tree. • The branch tips are the DNA sequences of individual species or samples
you analyzed. Any two branches are connected to each other by a node,which represents the common ancestor of the two sequences.
• The length of each branch is a measure of the evolutionary distance fromthe ancestral sequence at the node. Species or sequences with shortbranches from a node are closely related, while those with longer branchesare more distantly related.

• A group formed by a common ancestor and its descendants is called aclade. Related clades, in turn, are connected by nodes to make larger, lessclosely-related clades.
• Click on a node to highlight sequences in that clade. Click the node againto deselect the clade. What assumptions are made when one infers evo-lutionary relationships from sequence differences?
• Generally, the clades will follow established phylogenetic relationshipsascending from genus > family > order > class > phylum. However, geneand phylogenetic trees do disagree on some placements, and muchresearch is focused on “reconciling” these differences. Why do gene andphylogenetic trees sometimes disagree?
d. Find and evaluate your sequence’s position in the tree. • If your sequence is closely related to any of the reference or uploaded
sequences, it will share a single node with those species. • If your sequence is identical to another sequence, the two will diverge
directly from the node without branches. • If your sequence is distantly related to all of the species in your tree, your
sequence will sit on a branch by itself—with the other sequences groupingtogether as a clade.
• Look at the scientific names of sequences within the most closely associat-ed clade. If all members share the same genus name, you have identifiedyour sequence as belonging to that genus. If different genus names are rep-resented, check and see if they belong to the same family or order.
e. Return to the menu, and click on “PHYLIP NJ” to generate a phylogenetictree using the neighbor joining method. How does it compare to the maxi-mum likelihood tree? What does this tell you?
f. If neither tree places your sequence within an identifiable clade—or if thatclade is only at order level—you will need to add more sequences that mayincrease the resolution of your analysis. Return to Step 5, and add more ref-erence sequences or obtain sequences within the order or family clade thatcontained your sequence. Then repeat Steps 6-7 to select, align, and generatetrees from your refined data set.
8. Exporting Sequences to GenBank® If you do not identify any identical hits through searches in DNA Subway,
GenBank®, and BOLD, and you have determined that your sequence is of highquality, you may have a novel sequence.
Once you have identified a potentially novel sequence there are additional stepsthat you can take, including publishing your sequence to GenBank® throughDNA Subway. It is not required that a sequence be novel to publish it toGenBank®. However, discretion should be used, and sequences that are alreadypresent in GenBank® multiple times for a particular species or without vettedmetadata (definitive species identification, collection information, etc.) shouldnot be published.
26 DNA Barcoding 101
Copyright 2014 Cold Spring Harbor Laboratory DNA Learning Center
Note: Only high quality consensus sequences that have been generated by a sub-mitter, and which have not been previously submitted can be exported toGenBank®.
a. Click “Export to GenBank®” in the project window. b. Click “New submission.” (If you are working with an animal sample, you
need to specify if it is from a vertebrate, invertebrate, or echinoderm) thenClick “Proceed.”
d. If you have already collected information of your samples in the DNALCBarcoding Samples Database, write the sample’s code number. Its informa-tion will be retrieved automatically. If not, you can enter the sample informa-tion manually in the next step; click “Continue.”
e. Verify and fill in the information required in the “Specimen info” window;click “Continue”.
f. Add photos of the sample if you have any available. g. Verify your submission information, make any appropriate changes if neces-
sary, and finally click “Submit.” You will receive a notification that yoursequence has been submitted to NCBI and a specialist there will check it. Ifyour submission passes NCBI’s verification procedure, you will receive anotification that your sequence has been published in GenBank®.
ANSwERS TO RESULTS AND DISCUSSION QUESTIONS
I. Think About the Experimental Methods1. Describe the purpose of each of the following steps or reagents used in DNA
isolation (Part II or Part IIa of Experimental Methods): i. Collecting fresh or dried specimens Fresh samples are easier to isolate DNA from than other samples, so they
maximize the chances of success. Dried specimens are common for plant andfungal collections and often contain intact DNA, although this DNA can bemore difficult to isolate. Other samples, such as those that are processed ordegraded, can have less intact DNA or PCR inhibitors.
ii. Using only a small amount of tissue Using a small amount of tissue reduces carry-forward of PCR inhibitors pre-
sent in the sample. These include metal ions (plants and animals), polysac-charides, and secondary metabolites (plants).
iii. Grinding tissue with pestle Grinding disrupts plant cell walls and animal chitin or connective tissue. It
also produces small clumps of cells that are more easily lysed to release DNA. iv. Lysis solution GuHCl lysis solution is a chaotropic agent, which interferes with hydrogen
bonds and other interactions that stabilize stuctures. This dissolves the cellmembrane and membrane-bound organelles (nucleus, mitochondria,
USING DNA BARCODES TO IDENTIFY AND CLASSIFY LIVING THINGS 27
Copyright 2014 Cold Spring Harbor Laboratory DNA Learning Center
chloroplast, etc.). In addition, GuHCL denatures biomolecules by disruptinghydrogen bonds with water surrounding them. This allows positivelycharged ions to form a salt bridge between the negatively charged silica andthe negatively charged DNA backbone in high salt concentration.
v. Heating or boiling Heating to 65°C with the GuHCl lysis solution helps to break down the cell
and nuclear membranes and also denatures enzymes that can degrade thepurified DNA. Heating to 57°C helps with the binding and release of DNA tothe silica resin in the presence of the GuHCl lysis solution and distilled waterrespectively.
II. Interpret Your Gel and Think About the Experiment3. Looking across the gel at the PCR products, do the bands all appear to be the
same bp size and intensity? rbcL, COI, and ITS primers amplify differently sized products that migrate to dif-
ferent positions on the gel. However, each barcode primer set is optimized toamplify the same region across a range of species. Although the size of productsfor each primer can vary, the majority of PCR products will be of similar base-pair size and, therefore, will migrate to the same position on the gel. However,the intensity of staining (thickness of bands) will vary between reactions. This isrelated to the mass of DNA product produced by the PCR reaction and the vol-ume of the reaction that is successfully loaded in the well.
5. Which samples amplified well, and which ones did not? Give several reasonswhy some samples may not have amplified; some of these may be errors inprocedure.
It may be difficult to extract enough DNA from tough leaves or dry materials.Some primer sets may not work with certain groups of organisms; for example,rbcL primers work less well with non-vascular plants (mosses and liverworts).
Major problems in PCR amplification typically occur at several points in theprocedure: a) grinding step did not sufficiently disrupt the tissue, b) supernatanttransferred after protein precipitation carried forward too many inhibitors, c)the nucleic acid pellet was lost after the precipitation step, or d) the small volumeof DNA template was not pipetted directly into the PCR reaction (it was left inpipette or on wall of PCR tube).
ANSwERS TO BIOINFORmATICS QUESTIONS
I. Use BLAST to Find DNA Sequences in Databases (Electronic PCR) 2.a.Why are some alignments longer than others?
The main difference in length occurs between hits that align to both primers ver-sus those that align only to the forward or reverse primer. The lengths and colorsof the alignment bars tell how much of your query matched sequences in thedatabase. Where the forward and reverse primer matches, you will see a blackvertical line between the forward and reverse primer in the graphic summary.
28 DNA Barcoding 101
Copyright 2014 Cold Spring Harbor Laboratory DNA Learning Center
Typically, most of the significant alignments will have complete matches to theforward and reverse primers.
2.b. What is the E value of the most significant hit and what does it mean? Whatdoes it mean if there are multiple hits with similar E values?
The lowest E value obtained for a match to both primers should be in the rangeof 0.001 to 2e-04, or 0.0002. This might seem high for a probability, but in facteach of these values means that a match of this quality would be expected tooccur by chance less than once in this database! For example, a score of 0.33would mean that a single match would be expected to occur by chance once inevery three searches. E values are based on the length of the search sequence, andthus the relatively short primers used in this experiment produce relatively highE values. Searches with longer primers or long DNA sequences return E valueswith smaller values. Multiple hits with similar E values are from closely relatedspecies.
What do the descriptions of significant hits have in common? For the plant primers, the sequence sources should all be chloroplast genomes.
For the vertebrate, fish, and invertebrate primers, the hits should all be mito-chondrial genomes. For the fungi primers, the hits should all be to the nuclearinternal transcribed spacer of the 5.8s ribosomal RNA gene.
3.b. Which nucleotide positions do the primers match in the subject sequence? The answers will vary for each hit and primer set. For Silene Conoidea (NC_023358.1), the plant primers match 43684–43709 and
43111–43130, respectively. For Pucrasia macrolopha (NC_020587.1), the vertebrate (non-fish) primers
match 6589–6613 and 7272–7298 respectively. For Mallotus villosus (NC_015244.1), the fish primers match 5556–5584 and
6233–6258 respectively. For Candida orthopsilosis (NC_018301.1), the fungi primers match 344066–
344085 and 344559–344577 respectively. For Choristoneura longicellana (NC_019996.1), the invertebrate primers match
1474–1498 and 2155–2180 respectively. 3.e. What value do you get if you calculate the fragment size for other species
that have matches to the forward and reverse primer? Do you get the samenumber?
The length range of the products produced from the primers will be between 450to 800 nucleotides.
For the plant primers, using Silene Conoidea (NC_023358.1) as an example gives43709 – 43111 = 599 nucleotides. These are the absolute nucleotide coordinatesfor this blast hit, and the total length will vary. The range in possible lengthsshould be between 550 and 600 nucleotides.
For the vertebrate (non-fish) primers, Pucrasia macrolopha (NC_020587.1) as anexample gives 7298 – 6589 = 710 nucleotides.
For the fish primers, Mallotus villosus (NC_015244.1) as an example gives 6258
USING DNA BARCODES TO IDENTIFY AND CLASSIFY LIVING THINGS 29
Copyright 2014 Cold Spring Harbor Laboratory DNA Learning Center

– 5556 = 703 nucleotides. For the fungi primers, Candida orthopsilosis (NC_018301.1) as an example gives
344577 – 344066 = 512 nucleotides.4.c. Identify the feature(s) located between the nucleotide positions identified by
the primers, as determined in 3.b. above. Depending on the hit, the name of features may vary. However, for plant
primers, the feature is usually a gene named rbcL that codes for a product called“ribulose 1,5-bisphosphate carboxylase/oxygenase large subunit.” For the verte-brate (non-fish), fish, and invertebrate primers, the feature is usually a genenamed COI or COXI, which codes for cytochrome C oxidase subunit I. For thefungi primers, the feature is usually the nuclear internal transcribed spacer (ITS),a variable region that surrounds the 5.8s ribosomal RNA gene.
II. Identify Species and Phylogenetic Relationships Using DNA Subway2.a. What is the error rate and accuracy associated with a Phred score of 20? A Phred score of 20 equals 1 error in 100 or 99% accuracy. What do you notice about the electropherogram peaks and quality scores at
nucleotide positions labeled N? At N positions, peaks representing different nucleotides have similar amplitudes
(heights) and overlap, or no single peak rises above the background of loweramplitude peaks. Quality scores are very low.
2.b. Why is it important to remove excess Ns from the ends of the sequences? Each N is scored as a misalignment, causing experimental sequences to appear
to be less related to reference sequences than they actually are. This will signifi-cantly impact tree building, potentially placing related sequences in differentclades.
3.e. How does the consensus sequence optimize the amount of sequence informa-tion available for analysis? Why does this occur?
The consensus sequence extends the length of the sequence and improves theaccuracy of the sequence in regions where one read is of low quality. Sequenceimmediately following each primer has many errors and this sequence should betrimmed from the results. The read from the opposite strand usually extendsinto this region and provides data for the sequence at either end of the ampliconthat would otherwise be lost. Also, the sequence quality can be low at differentpositions because of high GC content or other characteristics of the DNA. Often,the sequence quality from one direction is better than from the other direction.By selecting the best sequence for these regions, the overall quality of the consen-sus will be better than either forward or reverse sequences.
3.f. Do differences tend to occur in certain areas of the sequence? Why? Differences cluster at the 5’ and 3’ ends because the sequence quality at the ends
is poor.4.b. Why do the most significant hits typically have E values of 0? (This is not the
case with BLAST searches with primers.) What does it mean when there aremultiple BLAST hits with similar E values?
30 DNA Barcoding 101
Copyright 2014 Cold Spring Harbor Laboratory DNA Learning Center

The lower the E value, the lower the probability of a random match and the high-er the probability that the BLAST hit is related to the query. Searching with along (500 bp or more) barcode sequence increases the number of significantalignments with high scores compared to searches with short primers. It is com-mon to have multiple hits with identical or very similar E values. Of course, iden-tical matches to the same species would be expected to have an E value of zero.However, other hits with 0 or very low E values are often found for members ofthe same genus. In some families of plants, fungi, or animals, the barcode regionsused in this experiment are not variable enough to make a conclusive speciesdetermination. Similar E values would also be obtained when two sequenceshave the same number of sequence differences, but at different positions.
6.b. What causes these problems? The quality of sequences may be low at either end, contributing to gaps and Ns,
and the length of the sequences in the databases may also be of different lengths,which can lead to gaps.
6.c. Why is it important to remove sequence gaps and unaligned ends? Gaps and unaligned ends are scored as mismatches by the tree-building algo-
rithms, making sequences appear less related than they actually are, forcingrelated sequences into different clades.
7.c. What assumptions are made when one infers evolutionary relationships fromsequence differences?
The major assumption is that mutations occur at a constant rate; the “molecularclock” provides the measure of evolutionary time. Since branch lengths of a phy-logenetic tree represent mutations per unit of time, an increase in the mutationrate at some point in evolutionary time would artificially lengthen branchlengths. If the barcode region mutates more frequently in one clade, then a largernumber of differences would be incorrectly interpreted as increased phylogenet-ic distance between it and other clades. Also, although there is a chance that anygiven nucleotide has undergone multiple substitutions (for example A>T>C orA>T>A), tree-building algorithms only evaluate nucleotide positions as theyoccur in the sequences being compared. If the sequences being evaluated do notinclude a variation that happened during evolution, it will not be taken intoaccount, and the algorithm will assume the minimum number of substitutions.Since the chance of multiple substitutions increases over time, the phylogenetictree will tend to overestimate relatedness between distantly related species thatdiverged extremely long ago.
Why do gene and phylogenetic trees sometimes disagree? Traditional phylogenetic trees are primarily based on morphological (physical)
features. Related clades share morphological features by descent from a commonancestor. However, unrelated groups may develop a similar morphological fea-ture when they independently adapt to similar challenges or environments. (Forexample, bats and birds have wings, but this feature arose independent of a com-mon ancestor.) Gene trees can call attention to situations—at many taxonomiclevels—where morphological similarities have been misinterpreted as a closephylogenetic relationship. Also, gene trees may identify new species that cannot
USING DNA BARCODES TO IDENTIFY AND CLASSIFY LIVING THINGS 31
Copyright 2014 Cold Spring Harbor Laboratory DNA Learning Center

be differentiated by morphology alone.7.e. How does it compare to the maximum likelihood tree? What does this tell
you? The trees will likely have a different arrangement of nodes and place some
sequences on different nodes. This tells you that there are multiple possible solu-tions for most phylogenetic trees, and different algorithms will calculate differ-ent optimum trees.
32 DNA Barcoding 101
Copyright 2014 Cold Spring Harbor Laboratory DNA Learning Center

PLANNING AND PREPARATION
The following table will help you to plan and integrate the different experimentalmethods.
Experiment Part Day Time Activity
I. Collect, Document, and Identify Specimens -1 varies Lab: Collect tissue or processed material
II. Isolate DNA from Plant, Fungal, or Animal Samples 1 30-60 min Pre-lab: Aliquot distilled water, lysis solution, silica resin, and wash buffer Set up student stations 80 min Lab: Isolate DNA
III. Amplify DNA by PCR 2 15 min Pre-lab: Prepare and aliquot primer mix Set up student stations 10 min Lab: Set up PCR reactions
70 min Post-Lab: Amplify DNA in thermal cycler
Iv. Analyze PCR Products by Gel Electrophoresis 3 30 min Pre-lab: Dilute TBE electrophoresis buffer
Prepare agarose gel solution
Set up student stations
30 min Lab: Cast gels
45+ min Load DNA samples into gels
Electrophorese samples
Photograph gels
Collecting Samples
Brainstorm in class to identify one or more organized campaigns that students can be involved with. Studentsmay select samples of their own choosing; this can be done as a homework assignment or in class if the seasonpermits. Alternatively, teachers can provide samples.
Obtain permission to collect on private property, parks, or nature preserves.One application of DNA barcoding is to survey species from a particular location or habitat. Since
accounting for every plant and animal in a habitat is usually impossible, samples are collected to generally rep-resent the habitat. A common sampling unit is a quadrat, a 1-meter square frame that is laid over the groundand from which each different plant and animal is collected for barcoding. Quadrats make it possible to com-pare samples from different locations or habitats. Nets are useful for collecting flying insects or swimming inver-tebrates. A sample of freshwater or marine organisms can be strained from a defined amount of water.
Plants and Fungi
Avoid collecting woody parts, which are difficult to break up, and starchy storage tissue, which includesmetabolites that may interfere with PCR. If fresh green plants are not available, DNA is readily isolated fromfrozen or dried material. Students may also bring in items from the grocery store. Fresh produce works well, andmany processed foods containing plant material will also work. It is difficult to isolate DNA from fatty or oilyfoods, such as peanut butter.
For fungi, obtain fruit bodies (such as mushrooms) when possible. Avoid contamination by otherfungi, such as moldy mushrooms or multiple species growing together. Fresh samples from soft mush-
USING DNA BARCODES TO IDENTIFY AND CLASSIFY LIVING THINGS 33
Copyright 2014 Cold Spring Harbor Laboratory DNA Learning Center
rooms work well for DNA isolation, while dried samples and hard fungi give variable results. Fungal fruit-ing is weather and climate dependent, so their abundance will vary, although both fresh and dried mush-rooms are readily available from stores.
Animals
Insects offer great opportunities for barcoding. A kill jar is a simple and humane way to collect and kill insects.Make a kill jar from a wide-mouth plastic jar with tight fitting lid. Cut enough discs of paper towel to make a ½inch stack in the bottom of the jar, then soak the toweling with acetone (nail polish remover). Keep the jar tight-ly capped, away from flames. Alternatively, kill insects by placing them in the freezer for at least one hour. Largeranimals may be safely sampled, and without injury, by isolating DNA from hair, feathers, or dung. Hair roots(follicles) and flesh scraped from the base of the feather shaft are reliable sources. Fresh meats and fish from thegrocery store are good sources of DNA for barcoding. Many processed foods, and food scraps obtained at nocost, are good sources of DNA.
Isolating DNA
Part II works well for plant, fungal or animal samples, and uses a silica resin DNA isolation method.Alternates Part IIa and b (online only) work well for animal and plant or fungal samples, respectively, but
use reagents from the Qiagen® DNeasy Blood, and Tissue Kit catalogue number 69506 (250 preps) and Qiagen®DNeasy Plant Kit, catalogue number 69106 (250 preps).
Ethylenediaminetetraacetic Acid (EDTA) (0.5 M, pH 8.0)
Makes 100 mL.Store at room temperature (indefinitely).
1. Add 18.6 g of EDTA (disodium salt dihydrate, MW 372.24) to 80 mL of deionized or distilled water. 2. Adjust the pH by slowly adding ~2.2 g of sodium hydroxide (NaOH) pellets (MW 40.00); monitor with a
pH meter or strips of pH paper. (If neither is available, adding 2.2 g of NaOH pellets will make a solutionof ~pH 8.0.)
3. Mix vigorously with a magnetic stirrer or by hand. 4. Add deionized or distilled water to make a total volume of 100 mL of solution. 5. Make sure that the bottle cap is loose and autoclave for 15 min at 121°C. 6. After autoclaving, cool the solution to room temperature and tighten the lid for storage.Note: Use only the disodium salt of EDTA. EDTA will only dissolve after the pH has reached 8.0 or higher.
6 M Guanidine Hydrochloride Solution
Makes 100 mL.Store at room temperature (for 6 months).
1. Dissolve 57.32 g of guanidine hydrochloride (m.w. = 95.53) in 50 mL of deonized or distilled water. 2. Add deionized or distilled water to make a total volume of 100 mL of solution.
34 DNA Barcoding 101
Copyright 2014 Cold Spring Harbor Laboratory DNA Learning Center
Silica Resin Solution
Makes 50 mL.Store at 4°C.
1. Dissolve 25 g of silicon dioxide (m.w. = 60.08) in 35 mL of deionized or distilled water. 2. Add deionized or distilled water to make a total volume of 50 mL of solution.Note: The silica resin must be rinsed with 50 mL distilled water 3-4 times by centrifugation prior to bringingthe total volume to 50 mL.
Sodium Chloride (NaCl) (5 M)
Makes 500 mL.Store at room temperature (indefinitely).
1. Dissolve 146.1 g of NaCl (MW 58.44) in 250 mL of deionized or distilled water. 2. Add deionized or distilled water to make a total volume of 500 mL of solution.
Tris/EDTA (TE) Buffer
Makes 100 mL.Store at room temperature (indefinitely).
1. In a 200-mL beaker mix the following:99 mL of deionized or distilled water1 mL of 1 M Tris pH 8.0200 µL of 0.5 M EDTA
2. Mix well.
Tris-HCl (1 M, pH 8.0 and 8.3)
Makes 100 mL.Store at room temperature (indefinitely).
1. Dissolve 12.1 g of Tris base (MW 121.10) in 70 mL of deionized or distilled water. 2. Adjust the pH by slowly adding concentrated hydrochloric acid (HCl) for the desired pH listed below.
pH 8.0: 5.0 mLpH 8.3: 4.5 mL
3. Monitor with a pH meter or strips of pH paper. (If neither is available, adding the volumes of concentratedHCl listed here will yield a solution with approximately the desired pH.)
4. Add deionized or distilled water to make a total volume of 100 mL of solution. 5. Make sure that the bottle cap is loose and autoclave for 15 min at 121°C. 6. After autoclaving, cool the solution to room temperature and tighten the lid for storage.Note: A yellow-colored solution indicates poor-quality Tris. If your solution is yellow, discard it and obtain aTris solution from a different source. The pH of Tris solutions is temperature dependent, so make sure to mea-sure the pH at room temperature. Many types of electrodes do not accurately measure the pH of Tris solutions;check with the manufacturer to obtain a suitable one.
USING DNA BARCODES TO IDENTIFY AND CLASSIFY LIVING THINGS 35
Copyright 2014 Cold Spring Harbor Laboratory DNA Learning Center

Wash Buffer
Makes 500 mL.Store at -20°C (indefinitely). 1. Combine the following:
Deionized or distilled water, 234 mL1 M Tris (pH 7.4), 10 mL5 M NaCl, 5 mL0.5 M EDTA, 1 mL100% Ethanol, 250 mL
2. Mix thoroughly.
Primer Strategy and Design
DNA barcoding relies on finding a universal chromosome location (locus) that has retained enough sequenceconservation through evolutionary history that it can be identified in many organisms, but that also has enoughsequence diversity to differentiate organisms to at least the family level. Regions of the chloroplast rbcL gene,mitochondrial COI gene, and nuclear ITS region generally fulfill these requirements.
Primers are designed to target conserved sequences that flank the variable barcode regions. However, eventhe conserved flanking regions have accumulated enough sequence differences over evolutionary time that it isimpossible to identify universal primer sets that will work across all taxonomic groups of plants and animals.Thus, barcode primers often need to accommodate sequence variation, or degeneracy, at one or severalnucleotide positions.
The degeneracy problem is often solved when the oligonucleotide primers are synthesized. Traditionally,a mixture of primers is synthesized – each having a different nucleotide in any of the variable positions.However, synthetic nucleotides are now available that pair with multiple nucleotides and can be incorporatedat variable positions in a single primer.
The table below shows the letter abbreviation given for degenerate nucleotides. For example, a primer withthe sequence ‘ATCCR’ contains both ATCCA and ATCCG.
Even degenerate primers cannot ensure amplification in taxonomic groups in which all or part of a par-ticular primer sequence is deleted. Thus, broad surveys of unknown plants or animals typically employ multipleprimer sets against slightly different flanking regions, which are combined in a multiplex PCR reaction.
The rbcL primer set used in this laboratory will work well for most green plants. We suggest starting withone of three COI primer sets for animals: one for fish, one for vertebrates, and one for other invertebrates(DMI). For fungal species, use the ITS primer set, which has the highest chance of success for identifying a broadrange of fungi. These primer sets will not uniformly work across all groups. If the primers in this laboratory donot work with a group of organisms you are studying, consult the primer list (http://www.boldsystems.org/views/primerlist.php) at the Barcode of Life Online Database web site for alternatives.
36 DNA Barcoding 101
Copyright 2014 Cold Spring Harbor Laboratory DNA Learning Center
W = A or TS = G or CM = A or CK = G or TR = A or GY = C or T
B = C or G or TD = A or G or TH = A or C or TV = A or C or GN = A or C or G or T

Barcode Primer Sequences
Plant cocktail
5'-TGTAAAACGACGGCCAGTATGTCACCACAAACAGAGACTAAAGC-3' (forward primer–rbcLaf-M13)5'-CAGGAAACAGCTATGACGTAAAATCAAGTCCACCRCG-3' (reverse primer–rbcLa-revM13)
Fish Cocktail
5'-TGTAAAACGACGGCCAGTCAACCAACCACAAAGACATTGGCAC-3' (forward primer–VF2_t1)5'-TGTAAAACGACGGCCAGTCGACTAATCATAAAGATATCGGCAC-3' (forward primer–FishF2_t1)5'-CAGGAAACAGCTATGACACTTCAGGGTGACCGAAGAATCAGAA-3' (reverse primer–FishR2_t1)5'-CAGGAAACAGCTATGACACCTCAGGGTGTCCGAARAAYCARAA-3' (reverse primer–FR1d_t1)
Vertebrate cocktail (non-fish)
5'-TGTAAAACGACGGCCAGTTCTCAACCAACCACAAAGACATTGG-3' (forward primer–VF1_t1)5'-TGTAAAACGACGGCCAGTTCTCAACCAACCACAARGAYATYGG-3' (forward primer–VF1d_t1)5'-TGTAAAACGACGGCCAGTTCTCAACCAACCAIAAIGAIATIGG-3' (forward primer–VF1i_t1)5'-CAGGAAACAGCTATGACTAGACTTCTGGGTGGCCRAARAAYCA-3' (reverse primer–VR1d_t1)5'-CAGGAAACAGCTATGACTAGACTTCTGGGTGGCCAAAGAATCA-3' (reverse primer–VR1_t1)5'-CAGGAAACAGCTATGACTAGACTTCTGGGTGICCIAAIAAICA-3' (reverse primer–VR1i_t1)
Invertebrate cocktail
5’-TGTAAAACGACGGCCAGTGGTCAACAAATCATAAAGATATTGG-3’ (forward primer LCO1490)5’-CAGGAAACAGCTATGACTAAACTTCAGGGTGACCAAAAAATCA-3’ (reverse primer HC02198)
Fungi Cocktail
5’-TGTAAAACGACGGCCAGTTCCGTAGGTGAACCTGCGG-3’ (ITS1 F)5’-CAGGAAACAGCTATGACTCCTCCGCTTATTGATATGC-3’ (ITS4 R)
Ready-to-Go PCR Beads
Ready-To-Go™ PCR beads limit reagent waste and optimize PCR reactions in a classroom setting. Each beadcontains reagents so that when brought to a final volume of 25 µL, the reaction contains 2.5 units of Taq DNApolymerase, 10 mM Tris-HCl (pH 9.0), 50 mM KCl, 1.5 mM MgCl2, and 200 µM of each dNTP.
The lyophilized Taq DNA polymerase in the bead becomes active immediately upon addition of theprimer/loading dye mix and template DNA. In the absence of thermal cycling, “nonspecific priming” at roomtemperature allows the polymerase to begin generating erroneous products, which can show up as extra bandsin gel analysis. Therefore, work quickly. Be sure the thermal cycler is set and have all experimenters set up theirPCR reactions as a coordinated effort. Add primer/loading dye mix to all reaction tubes, then add each studenttemplate, and begin thermal cycling as quickly as possible. Hold reactions on ice until all student samples areready to load into the thermal cycler.
NEB Taq 2X Master Mix
The NEB Taq 2X master mix is a cost-effective alternative to PCR beads and works well in a classroom setting.Taq 2X Master Mix is an optimized ready-to-use solution containing Taq DNA Polymerase, dNTPs, MgCl2,KCI and stabilizers. The Master Mix is used at a 1X final concentration with DNA template and primers in a
USING DNA BARCODES TO IDENTIFY AND CLASSIFY LIVING THINGS 37
Copyright 2014 Cold Spring Harbor Laboratory DNA Learning Center

total reaction volume of 25 μL. It is stable for fifteen freeze-thaw cycles when stored at -20°C or for threemonths at 4°C, so for frequent use, an aliquot may be kept at 4°C.
Primer/Loading Dye Mix (for Ready-to-Go PCR Beads)
The primer/loading dye mix customizes the PCR reaction for DNA barcoding. The mix incorporates the appro-priate primer pair (0.26 picomoles/µL of each primer), 13.8% sucrose, and 0.0081% cresol red. The inclusion ofthe loading dye components, sucrose and cresol red, allows the amplified product to be directly loaded into anagarose gel for electrophoresis.
Makes enough for 50 reactions. Store at –20°C for 1 year.
Mix in a 1.5-ml tube:
640 µL of distilled water460 µL of Cresol Red Loading Dye (see recipes below)20 µL of 15 pmol/ µL 5' primer20 µL of 15 pmol/ µL 3' primer
(For multiplex primers, add 20 µL of each primer, and reduce volume of distilled water by 20 µL for each addi-tional primer.)
Primer/Loading Dye Mix (for NEB Taq 2X Master Mix (#M0270)
The primer/loading dye mix customizes the PCR reaction for DNA barcoding. The mix incorporates the appro-priate primer pair (0.526 picomoles/µL of each primer), 13.8% sucrose, and 0.0081% cresol red. The inclusionof the loading dye components, sucrose and cresol red, allows the amplified product to be directly loaded intoan agarose gel for electrophoresis.
Makes enough for 50 reactions. Store at –20°C for 1 year. 1. Mix in a 1.5-ml tube:
600 µL of distilled water460 µL of Cresol Red Loading Dye (see recipes below)40 µL of 15 pmol/ µL 5' primer40 µL of 15 pmol/ µL 3' primer
(For multiplex primers, add 40 µL of each primer, and reduce volume of distilled water by 40 µL for eachadditional primer.)
Alternative PCR protocol for NEB Taq 2X Master Mix
1. Obtain a PCR tube and use a micropipette with a fresh tip to add 12.5 µLof the master mix to each tube. 2. Use a micropipette with a fresh tip to add 10.5 µL of the appropriate primer/loading dye mix (for NEB Taq
2X Master Mix ) to each tube. Mix well by pepetting up and down.Plantcocktail: rbcL primers (rbcLaF / rbcLa rev)Fungi cocktail: ITS primers (ITS1F/ITS4)Fish cocktail: COI primers (VF2_t1/ FishF2_t1/ FishR2_t1/ FR1d_t1)Vertebrate (non-fish): (VF1_t1/ VF1d_t1/ VF1i_t1 / VR1d_t1/ VR1_t1/ VR1i_t1)Invertebrate cocktail: (LCO1490/ HC02198)
38 DNA Barcoding 101
Copyright 2014 Cold Spring Harbor Laboratory DNA Learning Center

3. Use a micropipette with fresh tip to add 2 µL of DNA (from Part II) directly into the appropriateprimer/loading dye mix. Ensure that no DNA remains in the tip after pipetting. Mix well by pepetting upand down.
4. Store your sample on ice until your class is ready to begin thermal cycling. 5. Place your PCR tube, along with those of the other students, in a thermal cycler that has been programmed
with the appropriate PCR protocol.
1% Cresol Red Dye
Makes 50 mL.Store at room temperature (indefinitely).
1. Mix in a 50-mL tube:500 mg cresol red dye50 mL of distilled water
Cresol Red Loading Dye
Makes 50 ml.Store at –20°C (indefinitely).
1. Dissolve 17 g of sucrose in 49 mL of distilled water in a 50-mL tube. 2. Add 1 mL of 1% cresol red dye and mix well.
Thermal Cycling
Amplification of rbcL and COI is simplified by the large number of chloroplast and mitochondrial genomes,which are present at 100-1,000s of copies per cell. ITS is also present at high copy number in most fungi. Thus,the barcode regions are amplified more readily than most nuclear loci and small amount of specimen collectedprovides enough starting template to produce large quantities of the target sequence, reducing the concentrationof contaminants that might inhibit PCR. The recommended amplification times and temperatures will workadequately for most common thermal cyclers, which ramp between temperatures within a single heating/cool-ing block. IMPORTANT: Follow manufacturer’s instructions for Robocycler or other brands of thermal cyclersthat physically move PCR reaction tubes between multiple temperature blocks. These machines have no ramp-ing time between temperatures, and may require longer cycles.
Troubleshooting for Failed PCR Reactions
When PCR reactions fail, there are many possible reasons. A common source of difficulty is low quality DNAcaused by using too much sample for the isolation. If you suspect your students have used too much materialand their PCR failed, consider re-isolating the DNA with the standard protocol while ensuring the students useless material. For dried, degraded, or processed samples, PCR may fail due to low yield, in which case using theappropriate alternative method may allow amplification. For the silica isolation, other possible sources of trou-ble include evaporation of ethanol from the wash buffer, which can be avoided by storing the wash buffer at lowtemperature in a sealed container, and failing to remove wash buffer before elution, which can be avoided bycarefully removing the wash buffer and drying briefly before elution. Mixing the DNA/silica mixture duringincubation may also increase yields.
The PCR may also fail due to changes in the sequence at the primer binding sites, making it impossible to
USING DNA BARCODES TO IDENTIFY AND CLASSIFY LIVING THINGS 39
Copyright 2014 Cold Spring Harbor Laboratory DNA Learning Center
amplify even with high quality DNA. Consulting the literature on the taxa you are studying may help determinewhether this is the case. It may also help to re-amplify after lowering the annealing temperature a few degrees,as this may allow the primers to anneal even if the primer binding sites have mutated.
Gel Electrophoresis
CAUTION: Be sure to electrophorese only 5 µL of each amplified product. The remaining 20 µL must beretained for DNA sequencing: 10 µL for the forward read and, potentially, 10 µL for the reverse read.
Plasmid pBR322 digested with the restriction endonuclease BstNI is an inexpensive marker and producesfragments that are useful as size markers in this experiment. The size of the DNA fragments in the marker are1,857 bp, 1,058 bp, 929 bp, 383 bp, and 121 bp. Use 20 µL of a 0.075 µg/µL stock solution of this DNA ladderper gel. Other markers or a 100-bp ladder may be substituted.
View and photograph gels as soon as possible after electrophoresis or appropriate staining/destaining. Overtime, the small-sized PCR products will diffuse through the gel and the bands they form will lose sharpness.
DNA Sequencing
DNA sequencing of the rbcL, COI or ITS amplicon is required to determine the nucleotide sequence that con-stitutes the DNA barcode. The forward, the reverse, or both DNA strands of the amplified barcode region maybe sequenced. A single, good-quality barcode from the forward strand is sufficient to identify an organism. Themajority of database sequences are from the forward strand, so sequencing only the forward strand reducessequencing cost and simplifies analysis. If you only do a forward read, save the remaining 10 µL of amplicon. Ifthe forward read fails, and time permits, you can send the remainder out to sequence the reverse strand.
However, bi-directional sequencing is important for several reasons. 1) A reverse sequence may provide areadable barcode when the forward sequence fails. 2) Good forward and reverse reads can be combined to pro-duce a consensus sequence that extends the read up to 40 or more nucleotides. This is because the primer itselfis not sequenced for either strand, and additional nucleotides downstream from the primer are typically unread-able. Thus, good forward and reverse primers complement these missing sequences, adding most of the primersequences on either end. 3) One direction may provide a read through a region that is refractory to sequencingin the other direction, such as a homopolymeric region containing a long string of C residues. Thus, the insur-ance provided by bi-directional sequencing may be worth the added cost, especially if you have need to completean analysis in a limited time.
Sequencing different barcode regions – rbcL, COI and ITS – and using degenerate and multiplexprimers complicate DNA sequencing. Strictly speaking, each different primer would need to be provided forforward and reverse sequencing reactions. As a work-around for this problem, the primers used in thisexperiment incorporate a universal M13 primer sequence. In addition to a sequence specific to the rbcL, COIor ITS barcode locus, the 5’ end of each primer has an identical 17 or 18 nucleotide sequence from the bac-teriophage vector M13.
In the traditional approach to genome sequencing, genomic DNA is cloned into an M13 vector. Thena universal M13 primer is used to sequence the genomic insert just downstream from the primer. This samestrategy is used in sequencing rbcL, COI and ITS barcodes in this experiment. During the first cycle of PCR,the M13 portion of the primer does not bind to the template DNA. However, the entire primer sequence iscovalently linked to the newly-synthesized DNA and is amplified in subsequent rounds of PCR. Thus, theM13 sequence is included in every full-length PCR product. This allows a sequencing center to use universalforward and reverse M13 primers for the PCR-based reactions that prepare any rbcL, COI, or ITS ampliconfor sequencing.The sequence of the M13 forward and reverse primers are:
M13F(-21): TGTAAAACGACGGCCAGT
40 DNA Barcoding 101
Copyright 2014 Cold Spring Harbor Laboratory DNA Learning Center
M13R(-27): CAGGAAACAGCTATGAC
Using Genewiz DNA Sequencing Services
We recommend using GENEWIZ, Inc. for DNA barcode sequencing. GENEWIZ has optimized reaction con-ditions for producing the barcode sequences in this laboratory and produces excellent quality sequence withrapid turnaround –usually within 48 hours of receipt of samples. GENEWIZ sequences are automaticallyuploaded to the DNALC’s DNA Subway website.
Before submitting samples for sequencing, consult the GENEWIZ guide.
Prepare PCR Products
1. Verify that you can see a PCR product of the correct predicted length on an agarose gel. DNA sequence canbe obtained from virtually every PCR product that is visible on the gel. (You can take a chance on samplesthat do not produce bands, as a fair proportion of these will also produce sequences.)
2. Prepare 8-strips of 0.2 mL PCR tubes appropriate for the number of samples you wish to submit. If you willbe submitting a large number of samples (≥48), submit the samples on a 96 well plate arranging them ver-tically (A1 to H1). See the “Tubes and Plates” tab for more details at www.GENEWIZ.com.
3. You must submit 10 µL of PCR product for each sequencing reaction. Forward and reverse sequencing reac-tions must be submitted in separate tubes.
Register and Submit Samples for Sequencing
1. Go to www.GENEWIZ.com and click "Register" to create a user account. 2. When creating your account enter your institution name followed by "–DNALC" (very important!). The suf-
fix “-DNALC” must be added exactly to your name, otherwise your sequence will not be processed properlyor may be delayed.
3. Obtain a valid Purchase Order number from your Purchasing department, or use a valid credit card. 4 .Log in to your user account to place your sequencing order. Under “Place an Order,” select “Create
Sequencing Order.” 5. Under “Service Priority:” select “Standard.” 6. Under “Create Order by:” select “Online Form.” (Alternatively, you can select “Upload Excel Form,” then
download the “Custom” GENEWIZ Excel template, fill in the information in Steps 10-18, and upload thefile.)
7. Under “Sample Type,” select “Custom.” 8. When prompted to “Create and online form for,” enter the number of samples you will be sending for
sequencing. (If you elect to do bi-directional sequencing, you need to count separate forward and reversereactions for each sample).
9. Click on “Create New Form,” and a sample submission form will be displayed.10. For “DNA Name,” enter a name for each sample. This may be a number or initials.11. For “DNA Type,” select “Un-Purified PCR” from the dropdown menu.12. For “DNA Length (vector + insert in bp),” enter 650 for rbcL or 800 for COI and ITS.13. Leave “DNA Conc. (ng/uL)” blank. It is best to send in a gel image of representative samples. This will be
used by GENEWIZ to calculate the correct amount of clean up reagents to use and the amount of productto use in the sequencing reaction. If a gel image is not supplied, GENEWIZ will use default amounts to set
USING DNA BARCODES TO IDENTIFY AND CLASSIFY LIVING THINGS 41
Copyright 2014 Cold Spring Harbor Laboratory DNA Learning Center
up the sequencing reactions.14. Leave “My Primer Name” and “My Primer Conc.” blank.15. For “GENEWIZ Primer,” select from the dropdown menu: “M13F(-21)” – to sequence the forward strand.
“M13R” – to sequence the reverse strand.16. Under “Special Request,” be sure that “PCR-Clean Up” has been automatically selected. (This is the default
when unpurified PCR is selected as the DNA type).17. In the “Comments” box at the bottom of the form, type “Primer stored at GENEWIZ under DNALC.”18. Click on “Save & Next.”19. Carefully review your form, then click on “Next Step.”20. Enter your payment information, and click on “Next Step.”21. Review your order, then click on “Submit.”
Ship Samples to GENEWIZ
1. Print a copy of the order form, and mail it along with your samples. 2. Be sure that the tubes are labeled exactly the same in the gel photo and on the order form. Failure to do so
may delay sequencing or make it impossible to complete. Email [email protected] if you need help. 3. Ship your samples via standard overnight delivery service (Federal Express, if possible). 4. Pack your samples in a letter pack or small shipping box, padding samples to prevent too much shifting.
Room temperature shipping – with no ice or ice pack – is expected. PCR products are stable at ambient tem-perature, even if shipped on a Friday for Monday delivery.
5. Address the shipment to GENEWIZ at the following location:GENEWIZ, Inc.115 Corporate Blvd.South Plainfield, NJ 07080
6. You may be able to reduce shipping costs by using a GENEWIZ drop box. Call 1-877-436-3949 to find outif one is available in your area.
42 DNA Barcoding 101
Copyright 2014 Cold Spring Harbor Laboratory DNA Learning Center