using gis to make urban mobility more...
TRANSCRIPT

Using GIS to Make Urban Mobility More Sustainable
Harvey J. MillerDepartment of Geography &
Center for Urban and Regional Analysis (CURA)The Ohio State University
Email: [email protected]: u.osu.edu/miller.81
Twitter: @MobileHarv
2
Department of GeographyCenter for Urban and Regional Analysis (CURA)
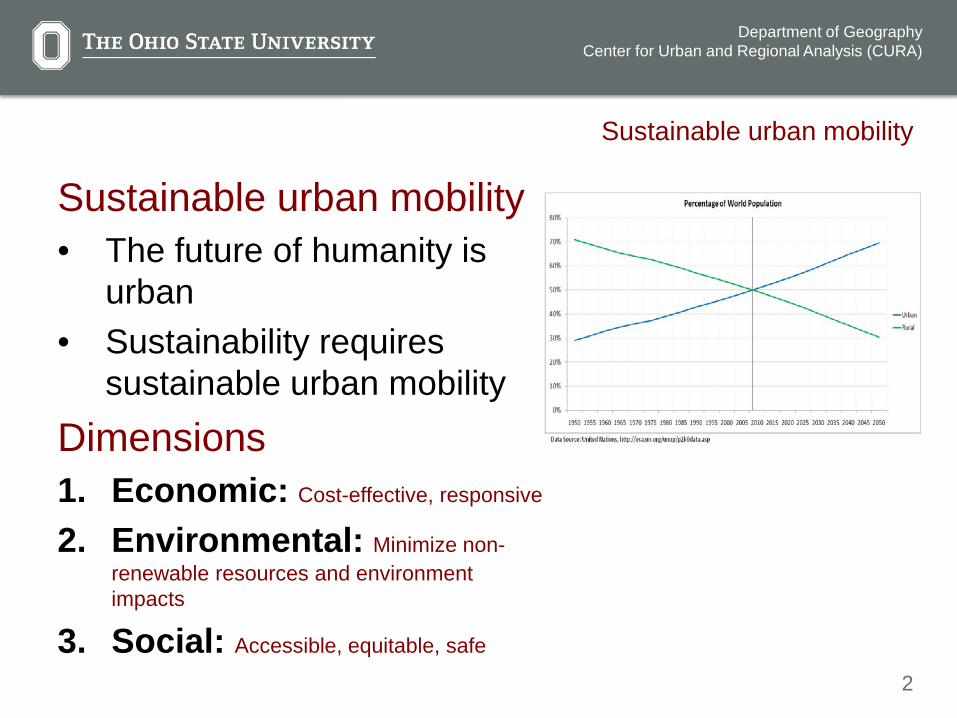
Sustainable urban mobility• The future of humanity is
urban• Sustainability requires
sustainable urban mobilityDimensions1. Economic: Cost-effective, responsive
2. Environmental: Minimize non-renewable resources and environment impacts
3. Social: Accessible, equitable, safe
Sustainable urban mobility
3
Department of GeographyCenter for Urban and Regional Analysis (CURA)
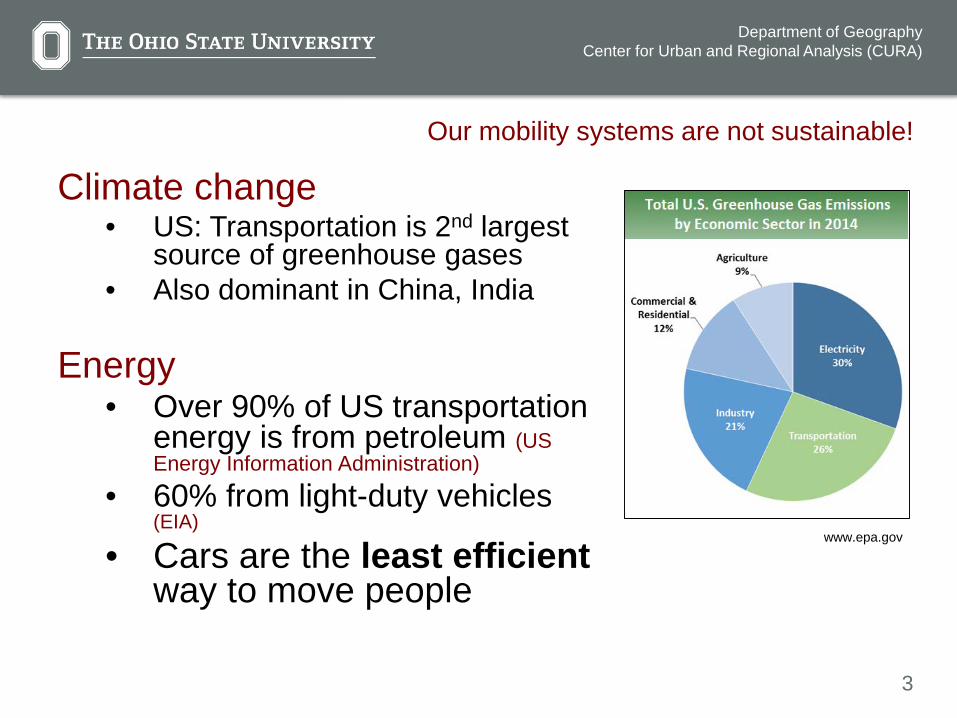
Climate change• US: Transportation is 2nd largest
source of greenhouse gases • Also dominant in China, India
Energy• Over 90% of US transportation
energy is from petroleum (US Energy Information Administration)
• 60% from light-duty vehicles (EIA)
• Cars are the least efficient way to move people
www.epa.gov
Our mobility systems are not sustainable!
4
Department of GeographyCenter for Urban and Regional Analysis (CURA)
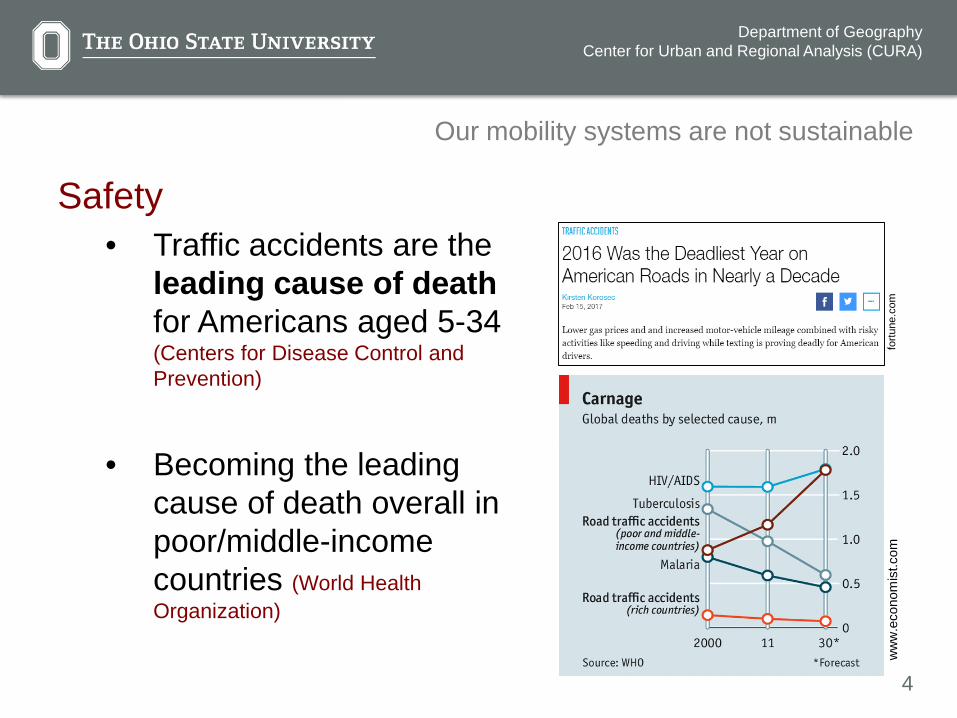
Safety• Traffic accidents are the
leading cause of death for Americans aged 5-34 (Centers for Disease Control and Prevention)
• Becoming the leading cause of death overall in poor/middle-income countries (World Health Organization)
ww
w.e
cono
mis
t.com
Our mobility systems are not sustainable
fortu
ne.c
om
5
Department of GeographyCenter for Urban and Regional Analysis (CURA)
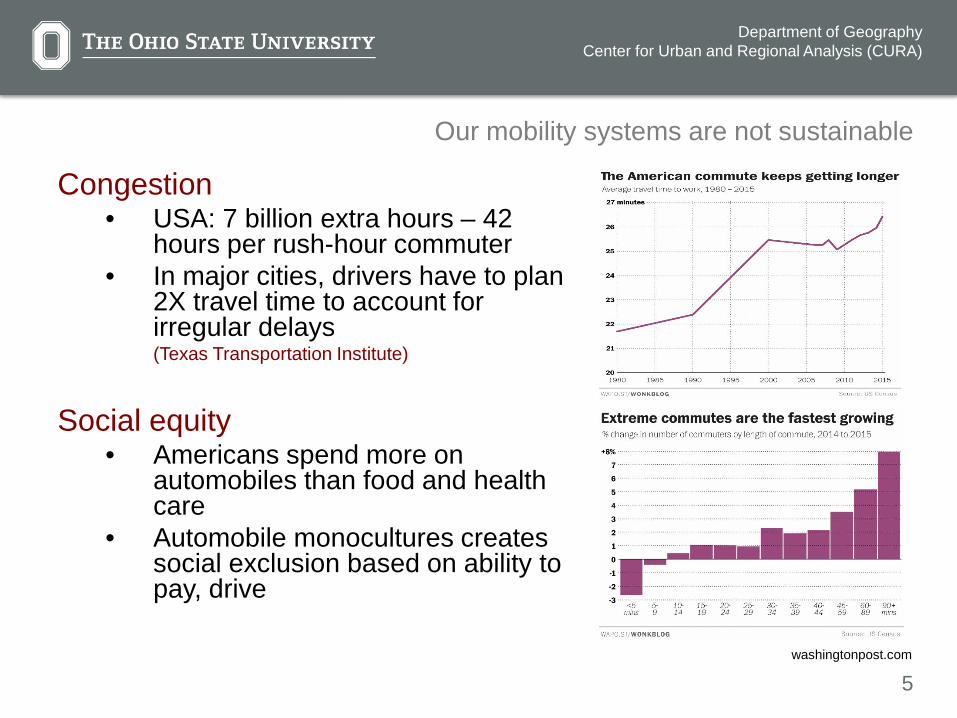
Congestion• USA: 7 billion extra hours – 42
hours per rush-hour commuter • In major cities, drivers have to plan
2X travel time to account for irregular delays (Texas Transportation Institute)
Social equity• Americans spend more on
automobiles than food and health care
• Automobile monocultures creates social exclusion based on ability to pay, drive
Our mobility systems are not sustainable
washingtonpost.com

6
Department of GeographyCenter for Urban and Regional Analysis (CURA)
Department of GeographyCenter for Urban and Regional Analysis (CURA)
Public health• Physically inactive
lifestyles are a major public health crisis
Air quality• Ground-level ozone,
PM, SOx, NOx
• Wide range of bad health impacts
Our mobility systems are not sustainable
www.epa.gov
7
Department of GeographyCenter for Urban and Regional Analysis (CURA)
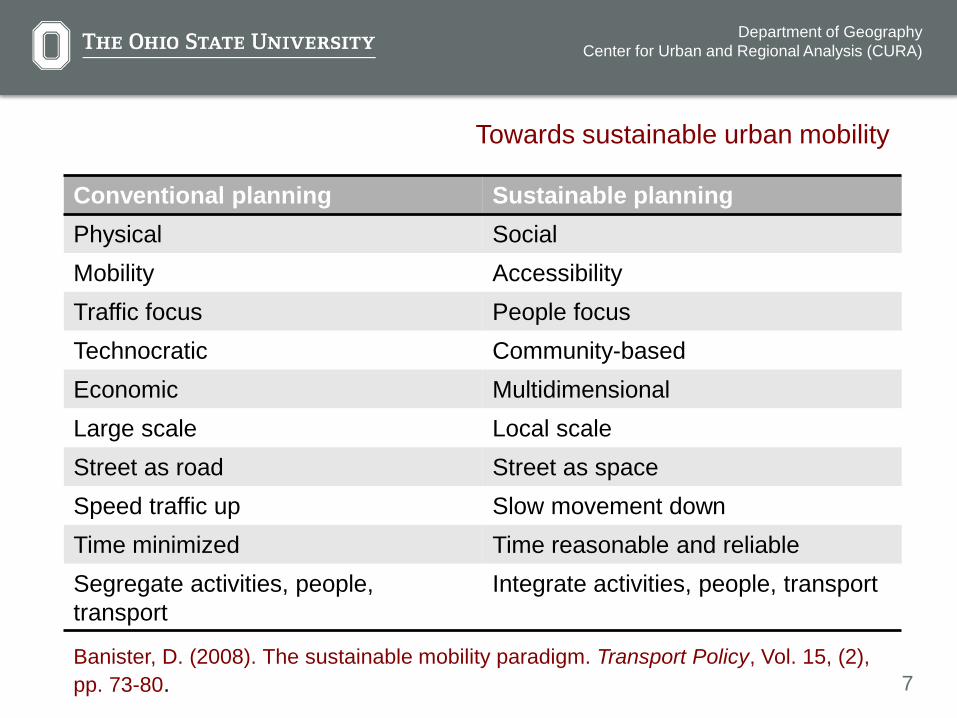
Conventional planning Sustainable planningPhysical SocialMobility AccessibilityTraffic focus People focusTechnocratic Community-basedEconomic MultidimensionalLarge scale Local scaleStreet as road Street as spaceSpeed traffic up Slow movement downTime minimized Time reasonable and reliableSegregate activities, people, transport
Integrate activities, people, transport
Towards sustainable urban mobility
Banister, D. (2008). The sustainable mobility paradigm. Transport Policy, Vol. 15, (2), pp. 73-80.
8
Department of GeographyCenter for Urban and Regional Analysis (CURA)
Department of GeographyCenter for Urban and Regional Analysis (CURA)
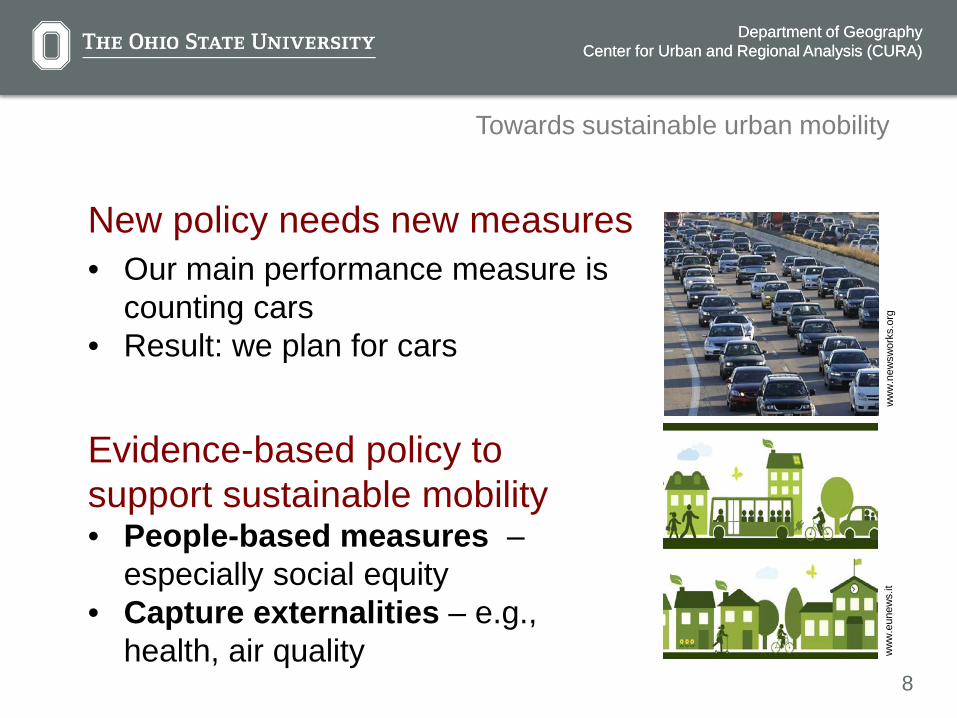
New policy needs new measures• Our main performance measure is
counting cars• Result: we plan for cars
Evidence-based policy to support sustainable mobility• People-based measures –
especially social equity• Capture externalities – e.g.,
health, air quality
Towards sustainable urban mobility
ww
w.n
ewsw
orks
.org
ww
w.e
unew
s.it
9
Department of GeographyCenter for Urban and Regional Analysis (CURA)
Department of GeographyCenter for Urban and Regional Analysis (CURA)
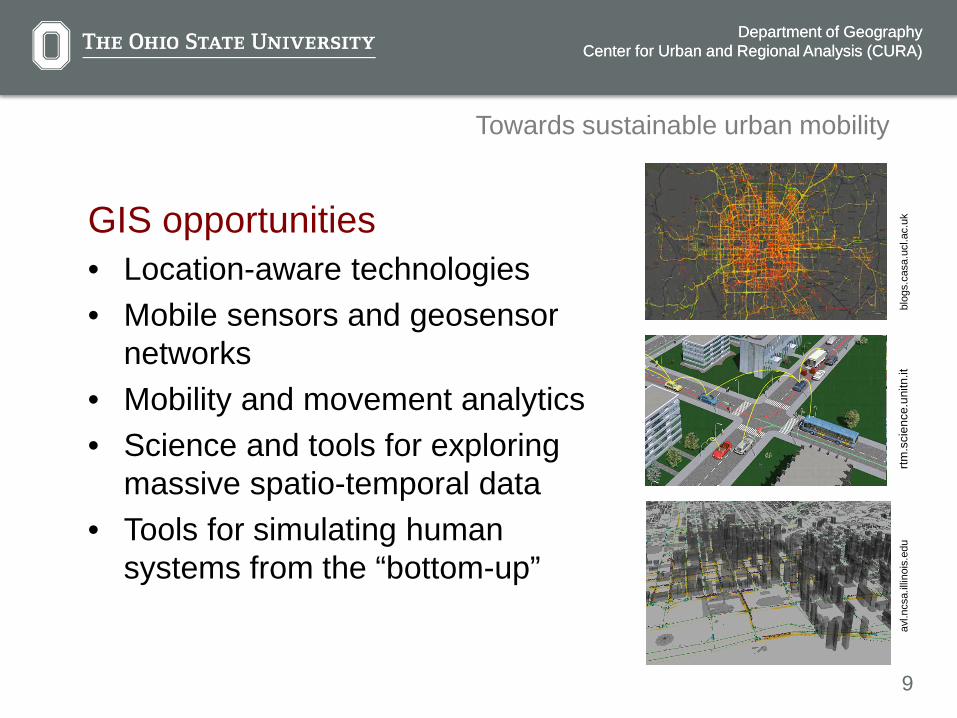
GIS opportunities• Location-aware technologies• Mobile sensors and geosensor
networks • Mobility and movement analytics• Science and tools for exploring
massive spatio-temporal data• Tools for simulating human
systems from the “bottom-up”
Towards sustainable urban mobility
rtm.s
cien
ce.u
nitn
.itav
l.ncs
a.illi
nois
.edu
blog
s.ca
sa.u
cl.a
c.uk
10
Department of GeographyCenter for Urban and Regional Analysis (CURA)
Department of GeographyCenter for Urban and Regional Analysis (CURA)
Examples from my research1. Moving Across Places Study (MAPS): Public transit,
Complete Streets and physical activityBarbara Brown (PI), Harvey J. Miller, Ken Smith and Carol Werner, National Cancer Institute, National Institutes of Health
2. Green accessibility: Measuring the environmental costs of space-time prisms in sustainable transportation planningKeith Bartholomew, Harvey J. Miller (PI) and Xuesong Zhou, National Science Foundation
GIS for sustainable urban mobility
11
Department of GeographyCenter for Urban and Regional Analysis (CURA)
Department of GeographyCenter for Urban and Regional Analysis (CURA)
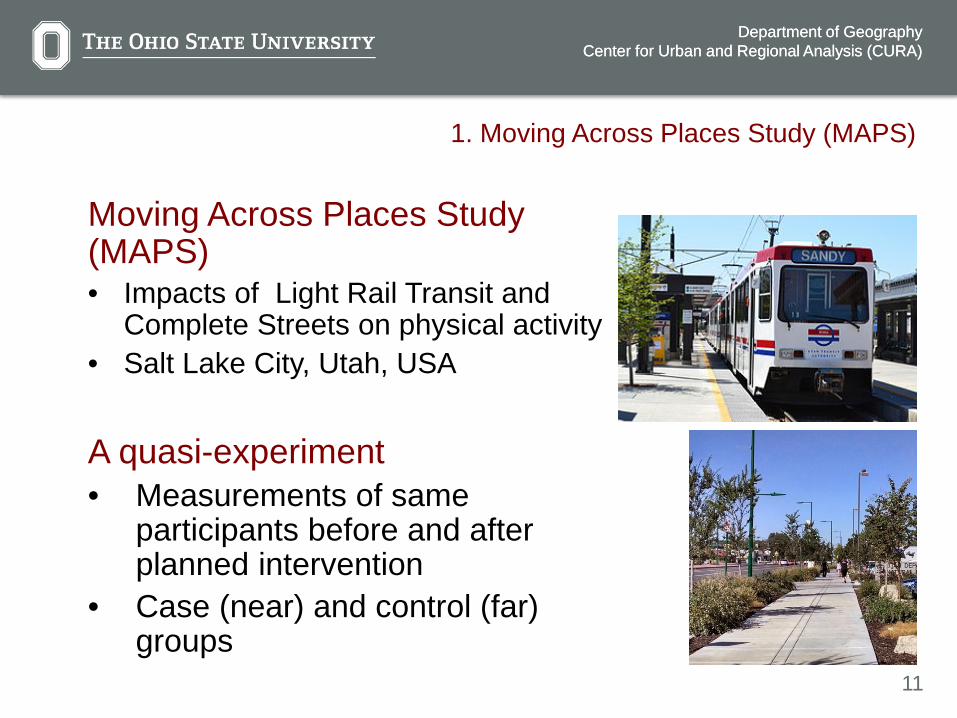
Moving Across Places Study (MAPS) • Impacts of Light Rail Transit and
Complete Streets on physical activity• Salt Lake City, Utah, USA
A quasi-experiment• Measurements of same
participants before and after planned intervention
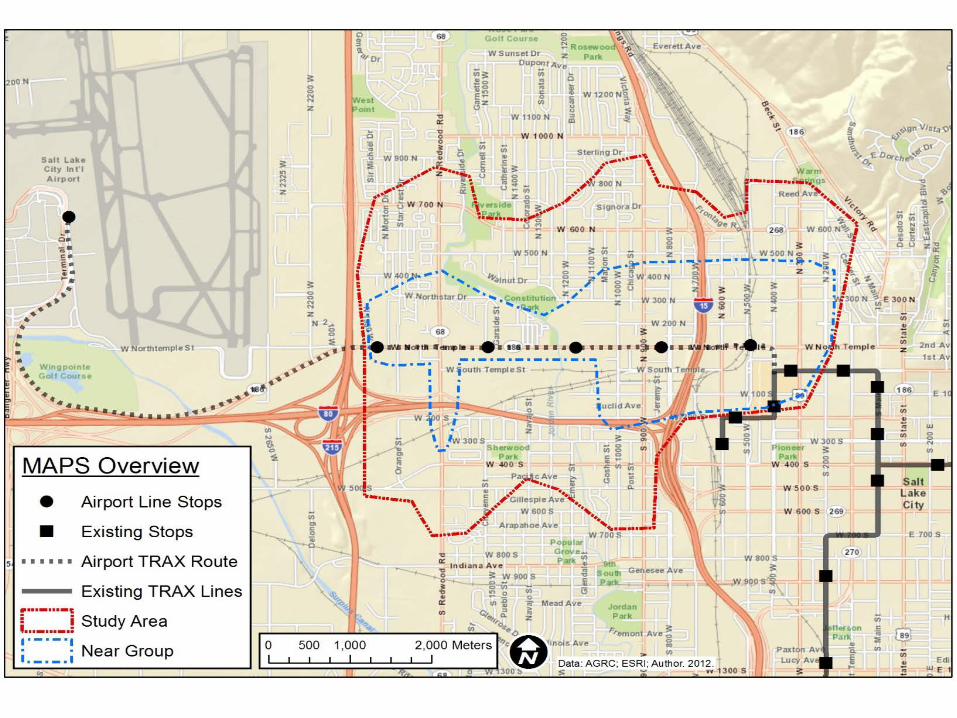
• Case (near) and control (far) groups
1. Moving Across Places Study (MAPS)
13
Department of GeographyCenter for Urban and Regional Analysis (CURA)
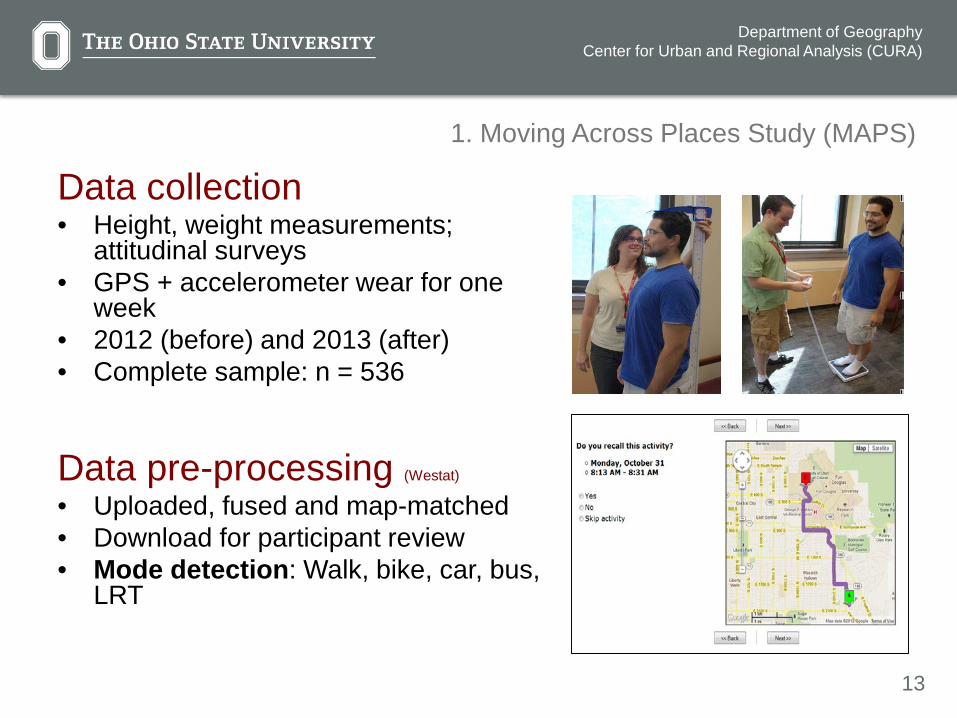
Data collection• Height, weight measurements;
attitudinal surveys• GPS + accelerometer wear for one
week• 2012 (before) and 2013 (after)• Complete sample: n = 536
Data pre-processing (Westat)
• Uploaded, fused and map-matched • Download for participant review• Mode detection: Walk, bike, car, bus,
LRT
1. Moving Across Places Study (MAPS)

14
Department of GeographyCenter for Urban and Regional Analysis (CURA)
Department of GeographyCenter for Urban and Regional Analysis (CURA)
(My bike ride from home to work in Oct. 2011)
15
Department of GeographyCenter for Urban and Regional Analysis (CURA)
Department of GeographyCenter for Urban and Regional Analysis (CURA)
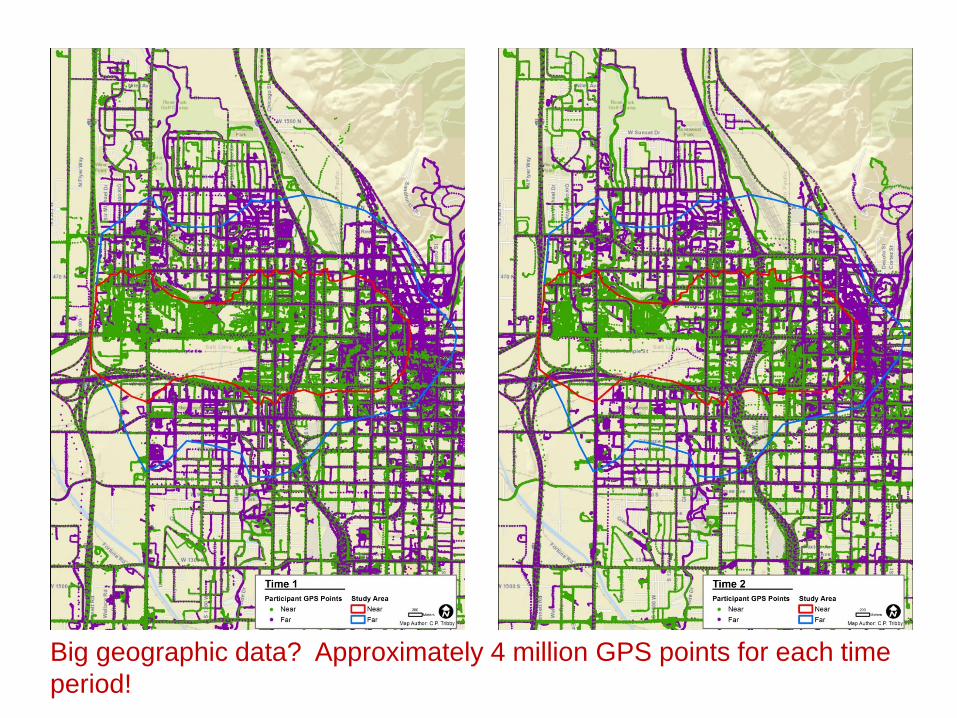
Big geographic data? Approximately 4 million GPS points for each time period!
17
Department of GeographyCenter for Urban and Regional Analysis (CURA)
Department of GeographyCenter for Urban and Regional Analysis (CURA)
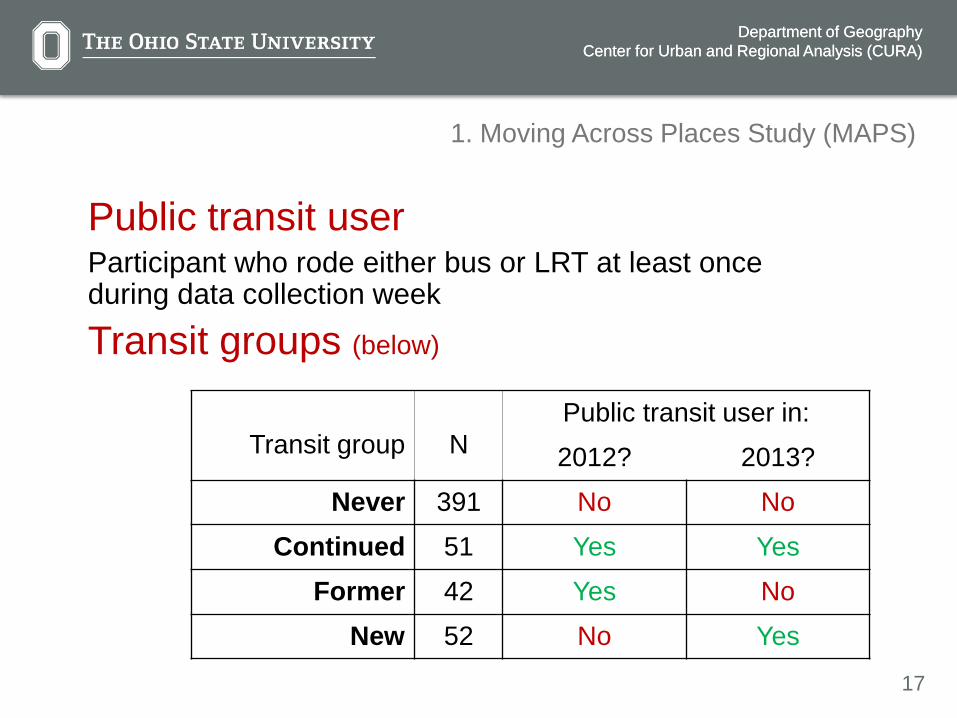
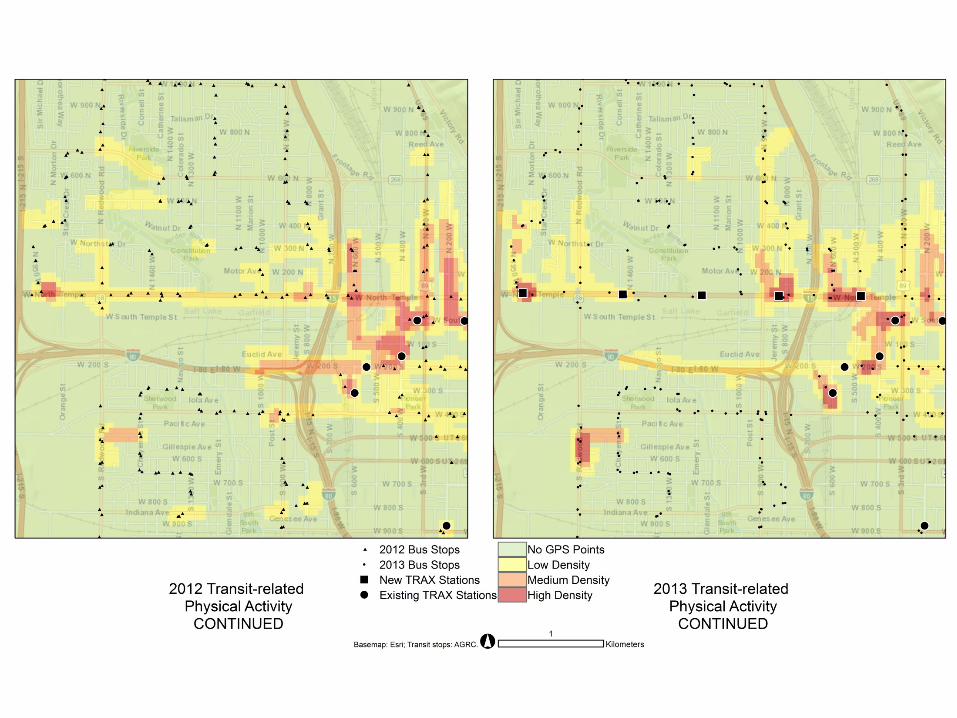
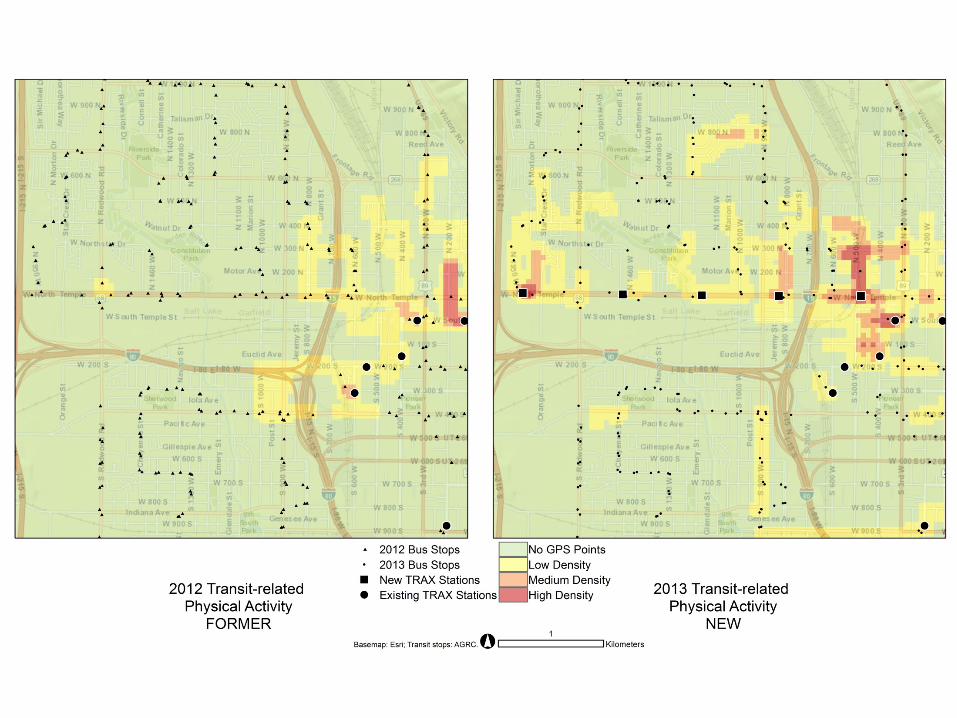
Public transit userParticipant who rode either bus or LRT at least once during data collection week
Transit groups (below)
Transit group NPublic transit user in:2012? 2013?
Never 391 No NoContinued 51 Yes Yes
Former 42 Yes NoNew 52 No Yes
1. Moving Across Places Study (MAPS)
18
Department of GeographyCenter for Urban and Regional Analysis (CURA)
Department of GeographyCenter for Urban and Regional Analysis (CURA)
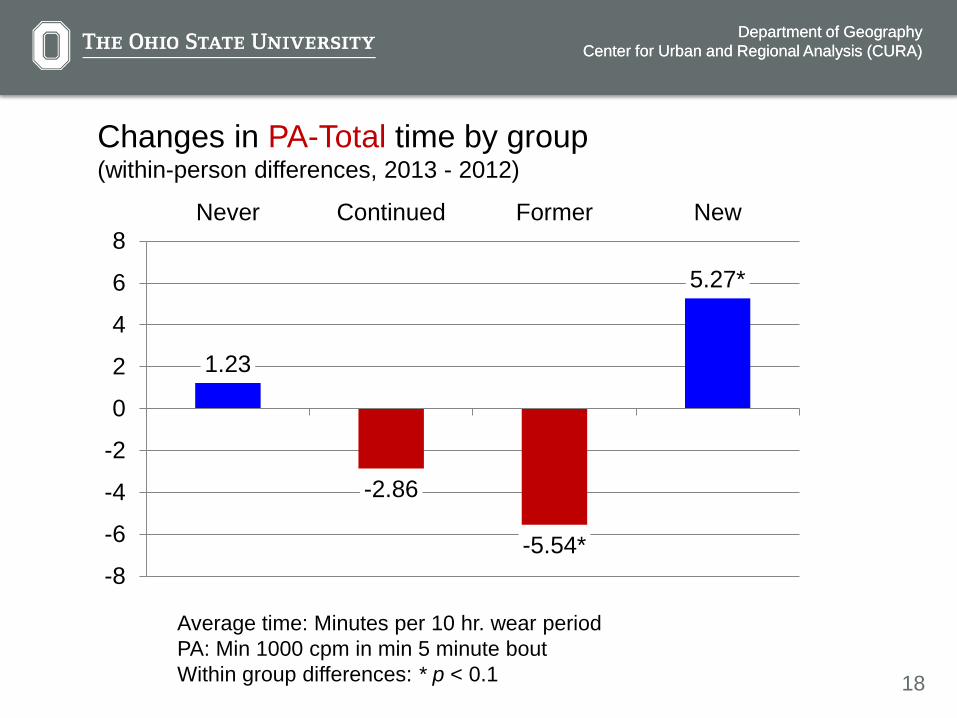
Average time: Minutes per 10 hr. wear period PA: Min 1000 cpm in min 5 minute boutWithin group differences: * p < 0.1
Changes in PA-Total time by group (within-person differences, 2013 - 2012)
1.23
-2.86
-5.54*
5.27*
-8
-6
-4
-2
0
2
4
6
8Never Continued Former New
19
Department of GeographyCenter for Urban and Regional Analysis (CURA)
Department of GeographyCenter for Urban and Regional Analysis (CURA)
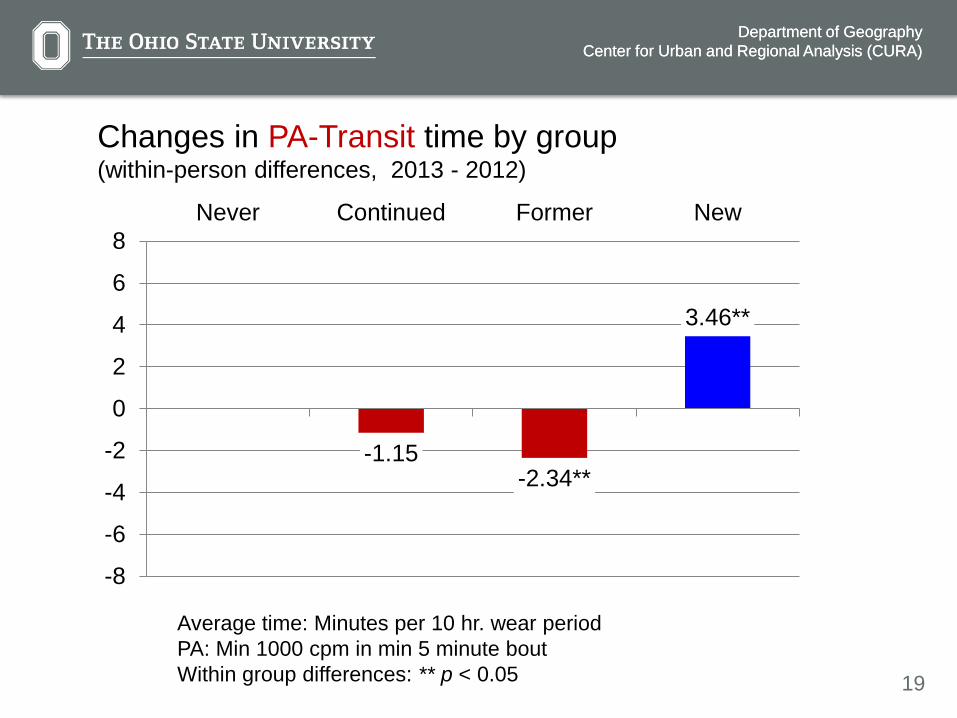
Changes in PA-Transit time by group(within-person differences, 2013 - 2012)
-1.15-2.34**
3.46**
-8
-6
-4
-2
0
2
4
6
8Never Continued Former New
Average time: Minutes per 10 hr. wear period PA: Min 1000 cpm in min 5 minute boutWithin group differences: ** p < 0.05
20
Department of GeographyCenter for Urban and Regional Analysis (CURA)
Department of GeographyCenter for Urban and Regional Analysis (CURA)
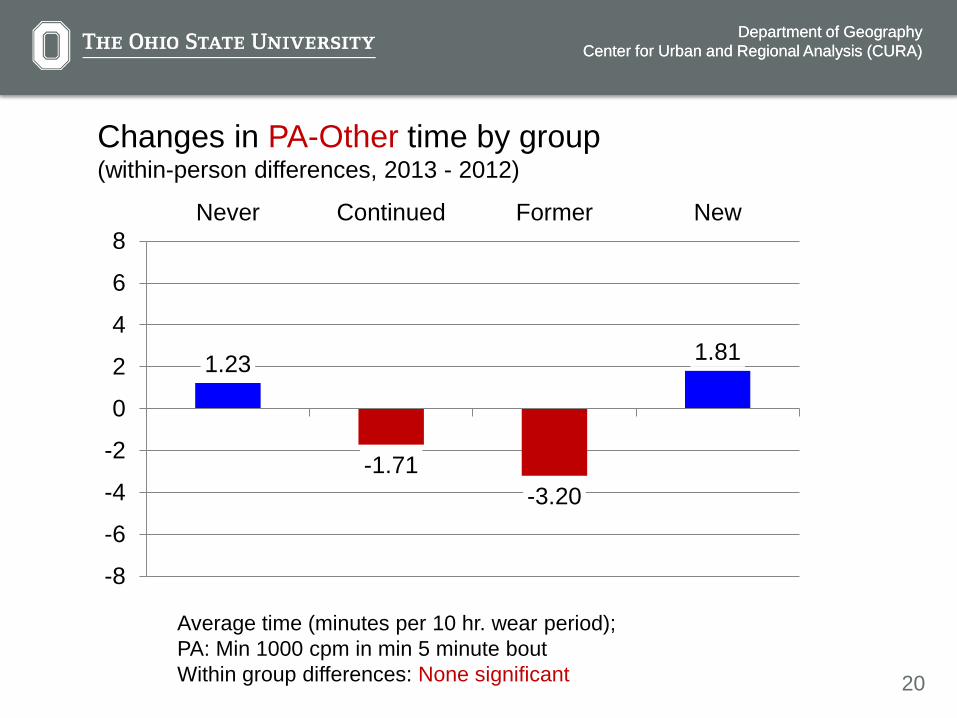
Changes in PA-Other time by group(within-person differences, 2013 - 2012)
1.23
-1.71-3.20
1.81
-8
-6
-4
-2
0
2
4
6
8Never Continued Former New
Average time (minutes per 10 hr. wear period); PA: Min 1000 cpm in min 5 minute boutWithin group differences: None significant

21
Department of GeographyCenter for Urban and Regional Analysis (CURA)
Department of GeographyCenter for Urban and Regional Analysis (CURA)
User behavior (2013 vs. 2012)
PA-Total PA-Transit PA-Other
Did not change(Never; Continuing)
No change No change No change
Stopped using transit(Former)
Decrease Decrease No change
Started using transit(New)
Increase Increase No change
Summary
No confounding factorsNo substitution for non-transit PA→ LRT generated new PA

25
Department of GeographyCenter for Urban and Regional Analysis (CURA)
Department of GeographyCenter for Urban and Regional Analysis (CURA)
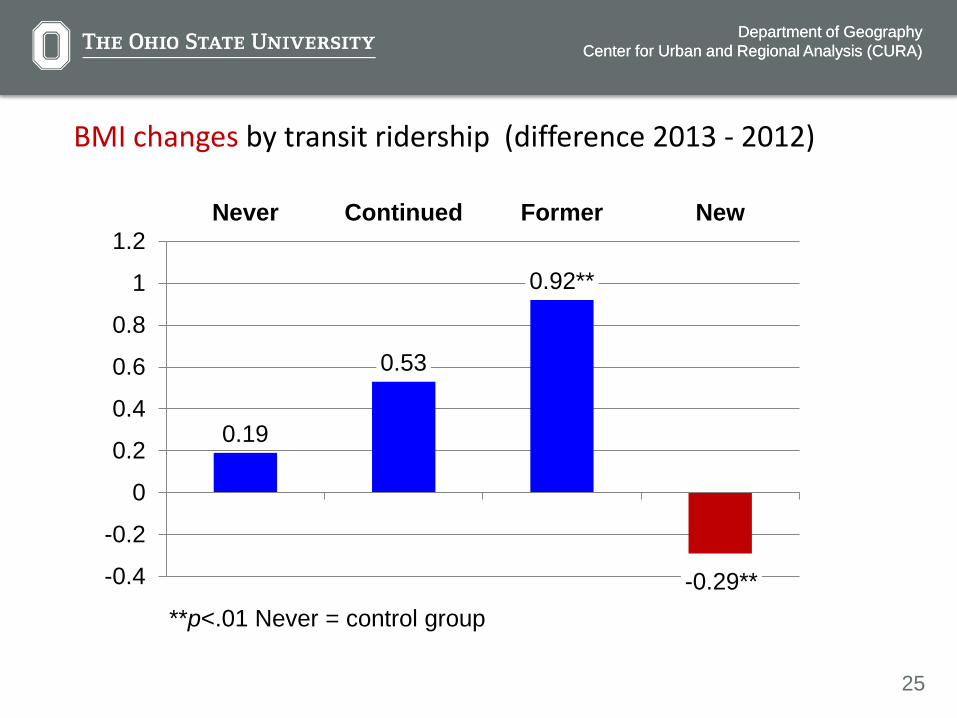
0.19
0.53
0.92**
-0.29**-0.4
-0.2
0
0.2
0.4
0.6
0.8
1
1.2Never Continued Former New
**p<.01 Never = control group
BMI changes by transit ridership (difference 2013 - 2012)
26
Department of GeographyCenter for Urban and Regional Analysis (CURA)
Department of GeographyCenter for Urban and Regional Analysis (CURA)
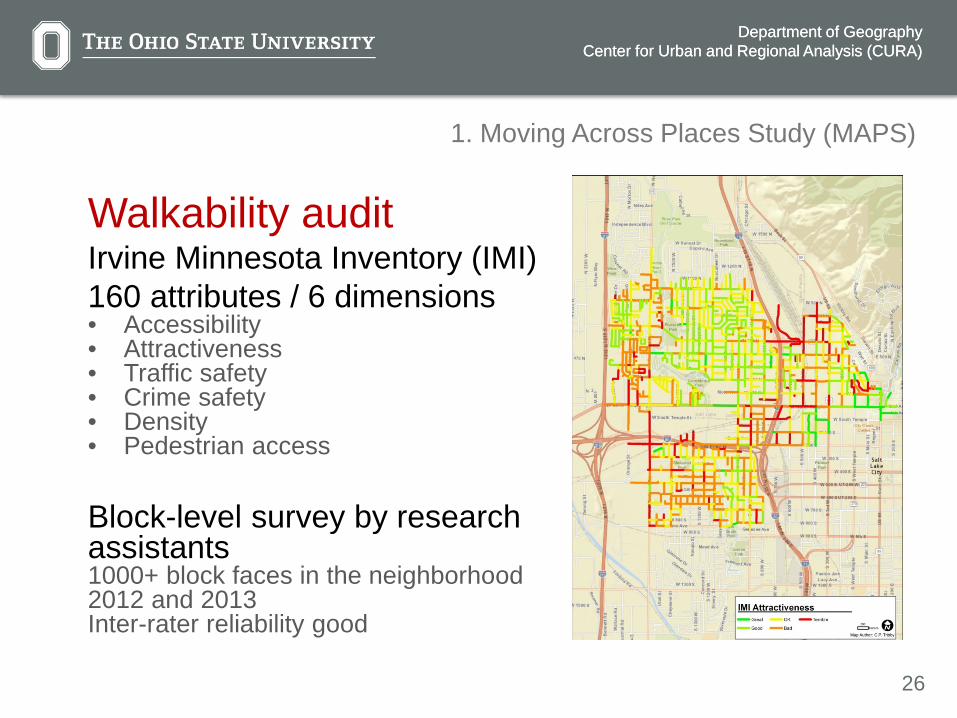
Walkability auditIrvine Minnesota Inventory (IMI)160 attributes / 6 dimensions • Accessibility • Attractiveness • Traffic safety • Crime safety• Density• Pedestrian access
Block-level survey by research assistants1000+ block faces in the neighborhood2012 and 2013Inter-rater reliability good
1. Moving Across Places Study (MAPS)
27
Department of GeographyCenter for Urban and Regional Analysis (CURA)
Department of GeographyCenter for Urban and Regional Analysis (CURA)
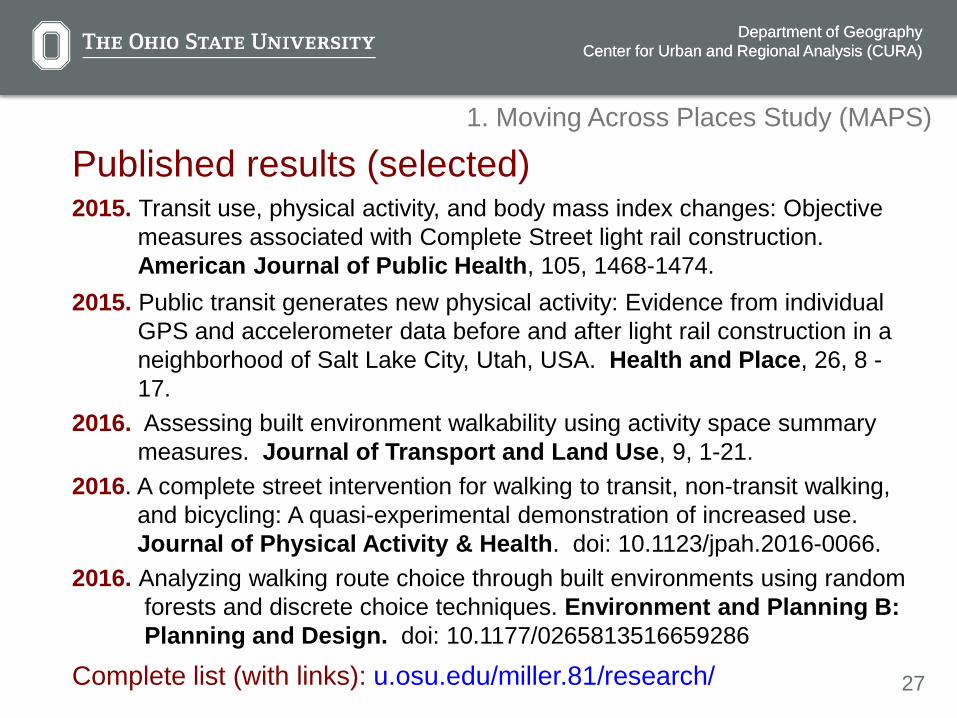
Published results (selected)2015. Transit use, physical activity, and body mass index changes: Objective
measures associated with Complete Street light rail construction. American Journal of Public Health, 105, 1468-1474.
2015. Public transit generates new physical activity: Evidence from individual GPS and accelerometer data before and after light rail construction in a neighborhood of Salt Lake City, Utah, USA. Health and Place, 26, 8 -17.
2016. Assessing built environment walkability using activity space summary measures. Journal of Transport and Land Use, 9, 1-21.
2016. A complete street intervention for walking to transit, non-transit walking, and bicycling: A quasi-experimental demonstration of increased use. Journal of Physical Activity & Health. doi: 10.1123/jpah.2016-0066.
2016. Analyzing walking route choice through built environments using random forests and discrete choice techniques. Environment and Planning B: Planning and Design. doi: 10.1177/0265813516659286
Complete list (with links): u.osu.edu/miller.81/research/
1. Moving Across Places Study (MAPS)
28
Department of GeographyCenter for Urban and Regional Analysis (CURA)
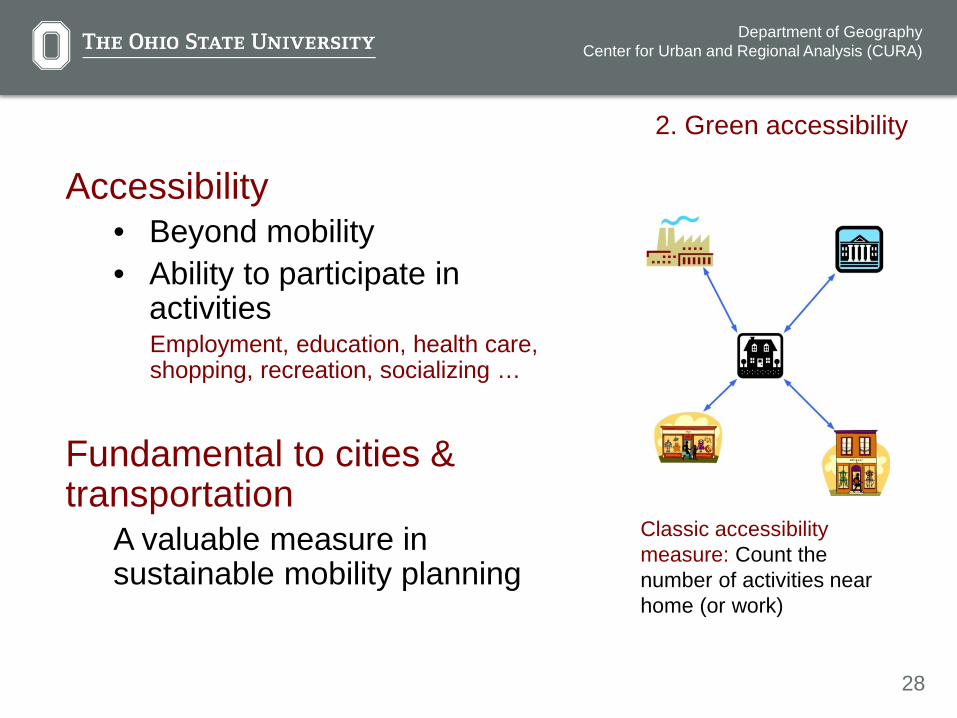
Accessibility• Beyond mobility• Ability to participate in
activitiesEmployment, education, health care, shopping, recreation, socializing …
Fundamental to cities & transportation
A valuable measure in sustainable mobility planning
2. Green accessibility
Classic accessibility measure: Count the number of activities near home (or work)

29
Department of GeographyCenter for Urban and Regional Analysis (CURA)
Space-time prismsEnvelope of all possible space-time paths between two locations and times given maximum speed and any stationary time
A socially sensitive measure of accessibility
Considers both location and time constraints
2. Green accessibility
A space time prism (STP) in continuous space

30
Department of GeographyCenter for Urban and Regional Analysis (CURA)
Department of GeographyCenter for Urban and Regional Analysis (CURA)
A more realistic space-time prism: Travel from western to eastern Salt Lake City with a 35 minute time budget
31
Department of GeographyCenter for Urban and Regional Analysis (CURA)
Department of GeographyCenter for Urban and Regional Analysis (CURA)
2. Green accessibility
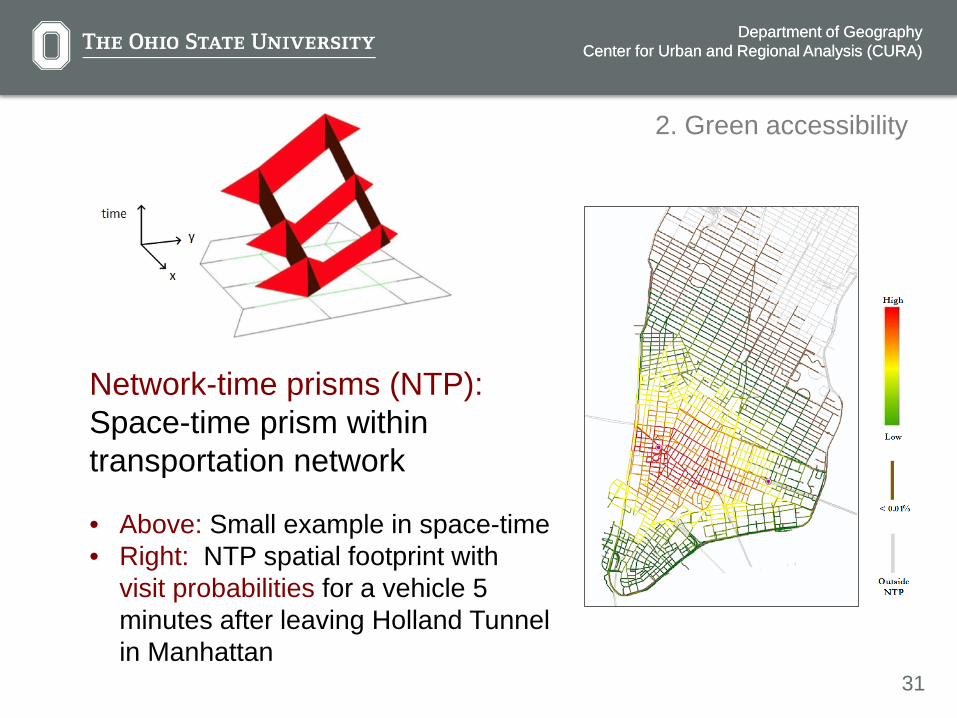
Network-time prisms (NTP): Space-time prism within transportation network
• Above: Small example in space-time• Right: NTP spatial footprint with
visit probabilities for a vehicle 5 minutes after leaving Holland Tunnel in Manhattan
32
Department of GeographyCenter for Urban and Regional Analysis (CURA)
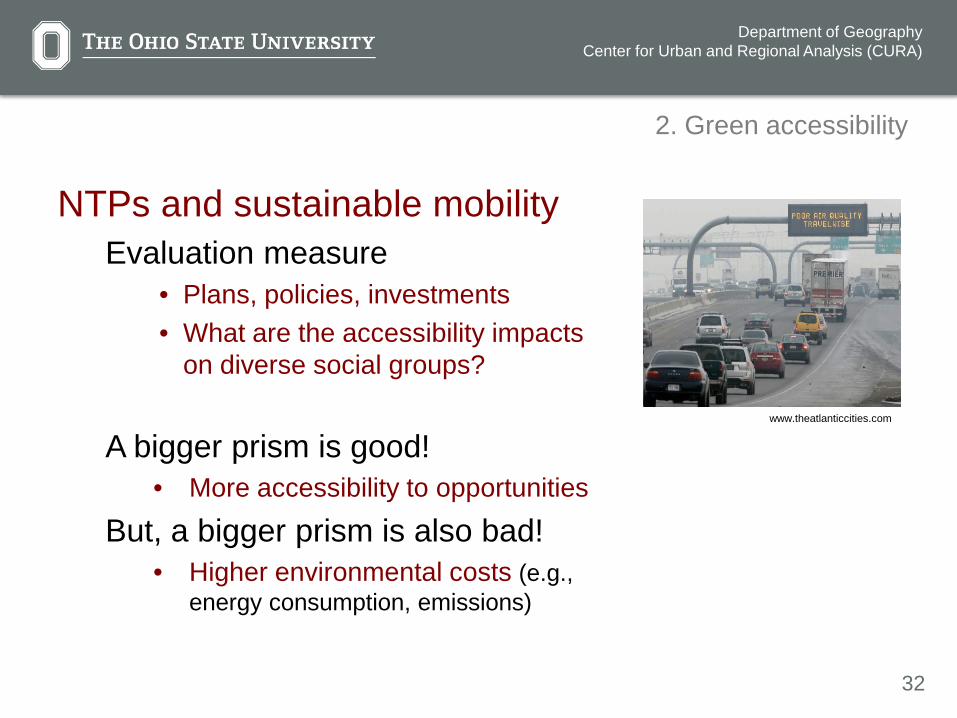
NTPs and sustainable mobilityEvaluation measure
• Plans, policies, investments• What are the accessibility impacts
on diverse social groups?
A bigger prism is good!• More accessibility to opportunities
But, a bigger prism is also bad!• Higher environmental costs (e.g.,
energy consumption, emissions)
2. Green accessibility
www.theatlanticcities.com
33
Department of GeographyCenter for Urban and Regional Analysis (CURA)
Department of GeographyCenter for Urban and Regional Analysis (CURA)
Research objectiveEstimate and validate environmental costs of a NTP
• A single space-time path (e.g., GPS trajectory) is easy
• NTP: Many paths, only one realized
Application: Emissions in Phoenix, AZ• Model expected locations and speeds within
NTP• Estimate expected emissions (MOVESLite)• Validate using primary data from instrumented
vehicles
2. Green accessibility
34
Department of GeographyCenter for Urban and Regional Analysis (CURA)
Department of GeographyCenter for Urban and Regional Analysis (CURA)
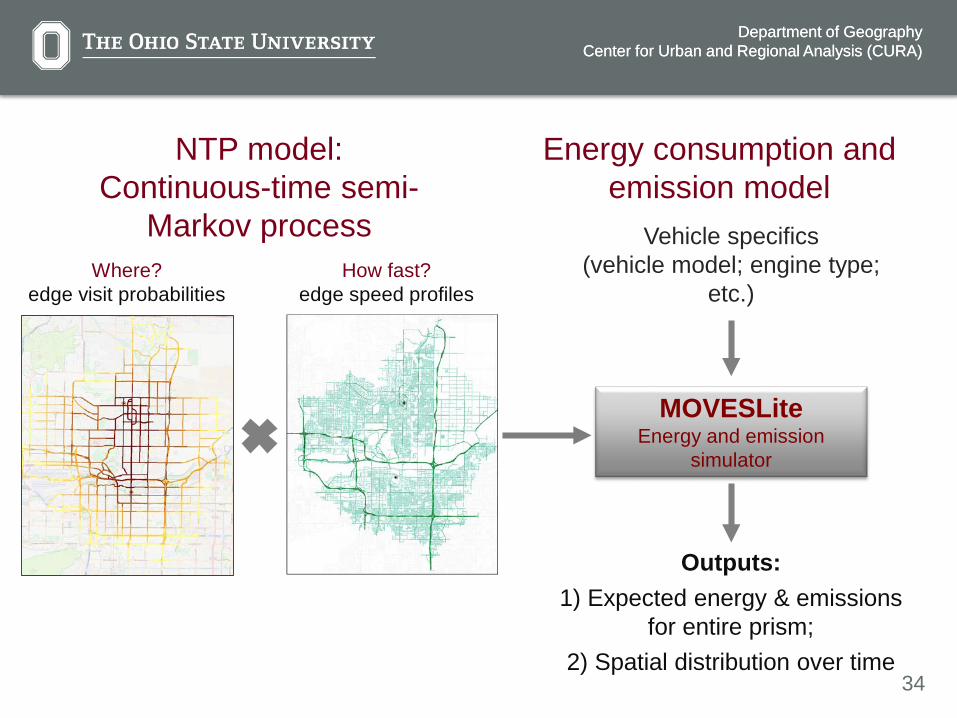
NTP model: Continuous-time semi-
Markov processWhere?
edge visit probabilitiesHow fast?
edge speed profiles
Energy consumption and emission model
Vehicle specifics(vehicle model; engine type;
etc.)
MOVESLiteEnergy and emission
simulator
Outputs:1) Expected energy & emissions
for entire prism; 2) Spatial distribution over time
35
Department of GeographyCenter for Urban and Regional Analysis (CURA)
Department of GeographyCenter for Urban and Regional Analysis (CURA)
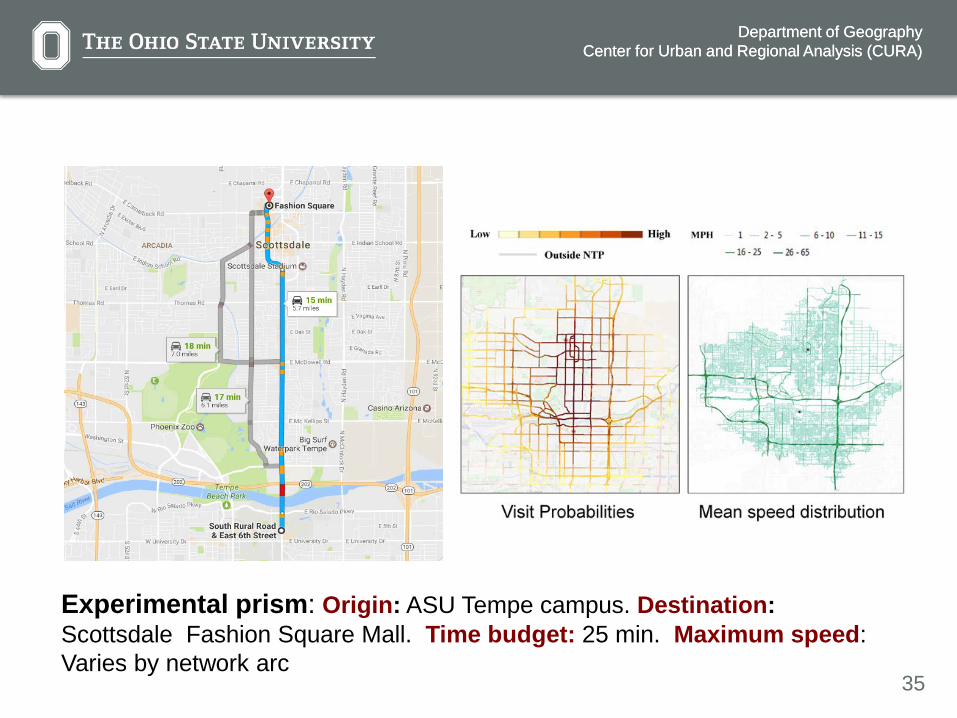
Experimental prism: Origin: ASU Tempe campus. Destination:Scottsdale Fashion Square Mall. Time budget: 25 min. Maximum speed: Varies by network arc

36
Department of GeographyCenter for Urban and Regional Analysis (CURA)
Department of GeographyCenter for Urban and Regional Analysis (CURA)
Primary Data Collection for model validation
Route Design40 trips along 5 designated routes within 25 minutes
Arizona State University (Tempe, AZ)
Scottsdale Fashion Square Mall
Data CollectionSecond-by-second (location, speed, engine performance) via GPS-enabled Onboard Diagnostic (OBD) devices
Detailed instructions to research assistants
Turn left
37
Department of GeographyCenter for Urban and Regional Analysis (CURA)
Department of GeographyCenter for Urban and Regional Analysis (CURA)
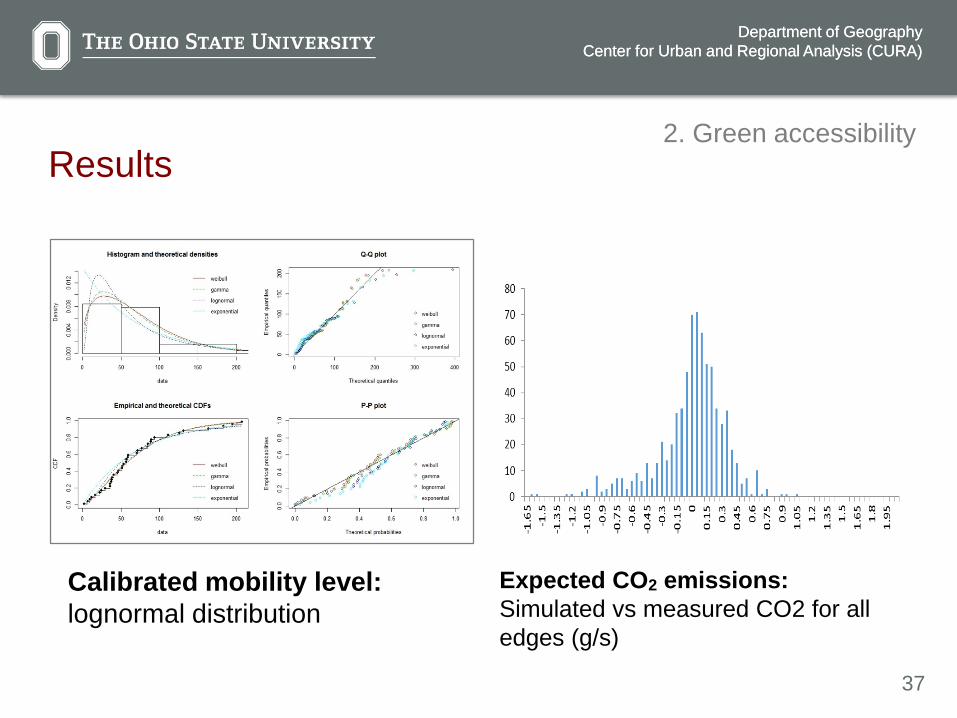
Results
Expected CO2 emissions: Simulated vs measured CO2 for all edges (g/s)
Calibrated mobility level: lognormal distribution
2. Green accessibility
38
Department of GeographyCenter for Urban and Regional Analysis (CURA)
Department of GeographyCenter for Urban and Regional Analysis (CURA)
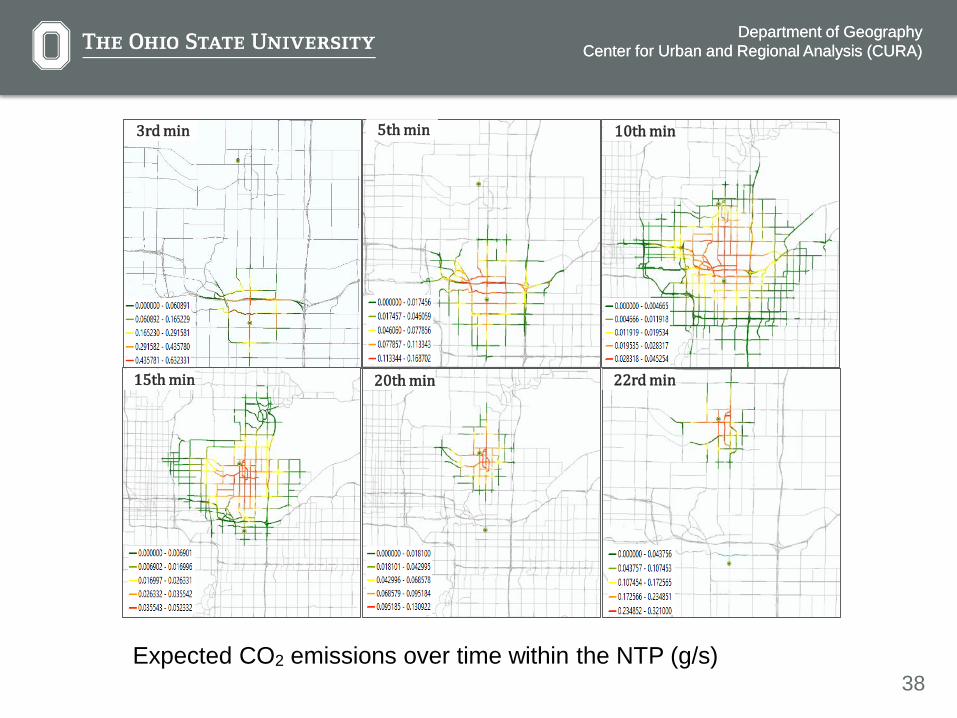
Expected CO2 emissions over time within the NTP (g/s)
3rd min 5th min 10th min
15th min 20th min 22rd min
39
Department of GeographyCenter for Urban and Regional Analysis (CURA)
Department of GeographyCenter for Urban and Regional Analysis (CURA)
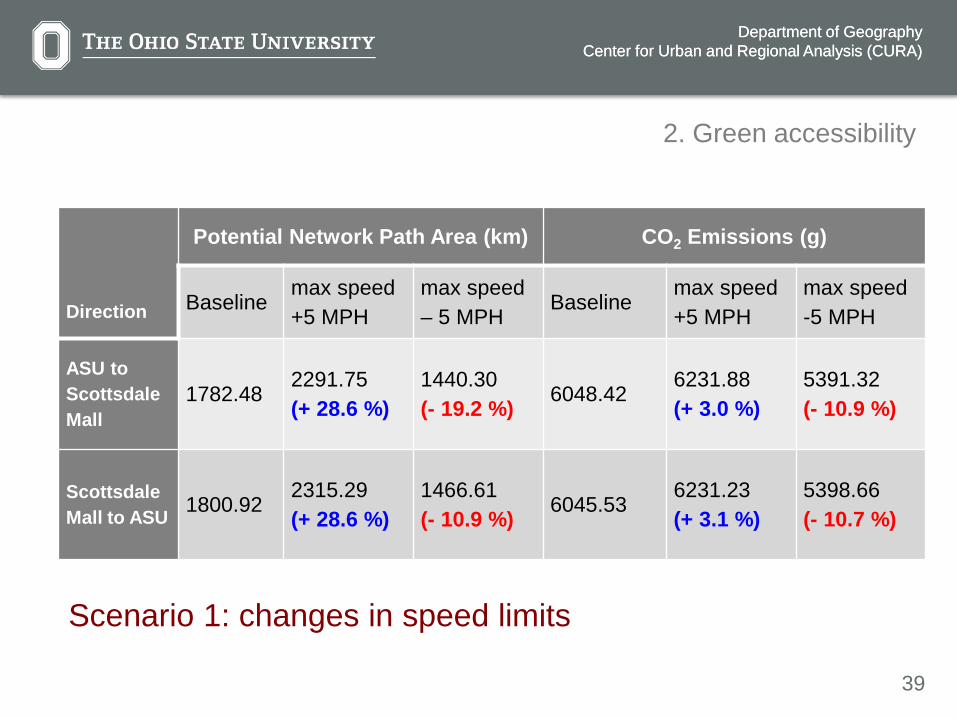
Direction
Potential Network Path Area (km) CO2 Emissions (g)
Baselinemax speed+5 MPH
max speed – 5 MPH
Baselinemax speed+5 MPH
max speed-5 MPH
ASU to Scottsdale Mall
1782.482291.75(+ 28.6 %)
1440.30(- 19.2 %) 6048.42
6231.88(+ 3.0 %)
5391.32(- 10.9 %)
Scottsdale Mall to ASU 1800.92
2315.29(+ 28.6 %)
1466.61(- 10.9 %) 6045.53
6231.23(+ 3.1 %)
5398.66(- 10.7 %)
Scenario 1: changes in speed limits
2. Green accessibility
40
Department of GeographyCenter for Urban and Regional Analysis (CURA)
Department of GeographyCenter for Urban and Regional Analysis (CURA)
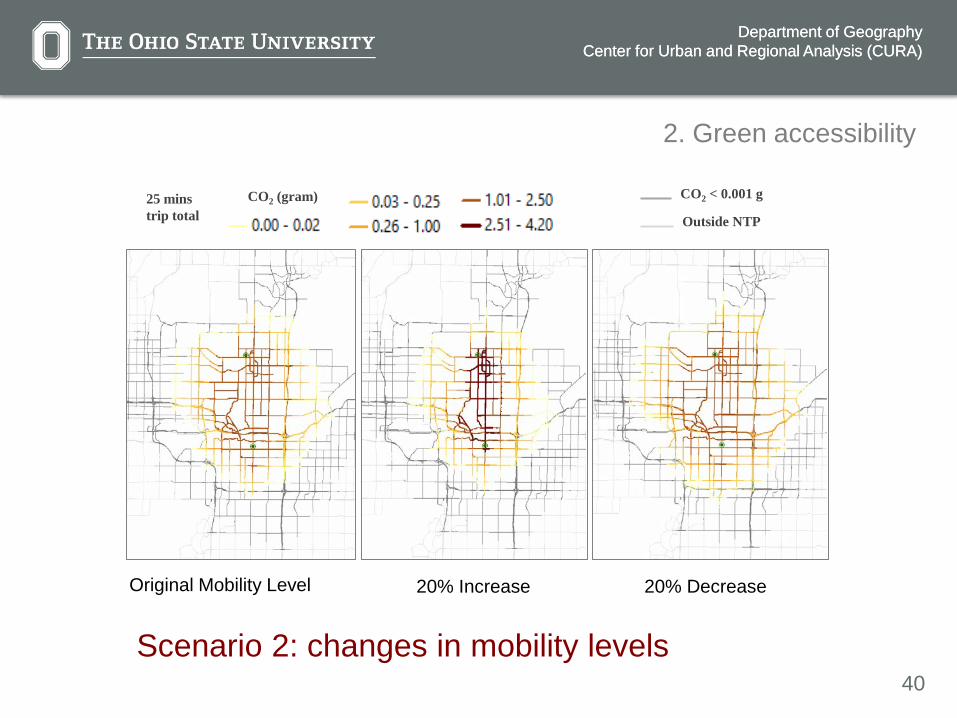
20% Increase 20% Decrease
CO2 < 0.001 g
Outside NTP
Original Mobility Level
CO2 (gram)25 minstrip total
Scenario 2: changes in mobility levels
2. Green accessibility

41
Department of GeographyCenter for Urban and Regional Analysis (CURA)
Department of GeographyCenter for Urban and Regional Analysis (CURA)
Published results (so far)
2014. Simulating visit probability distributions within planar space-time prisms. International Journal of Geographical Information Science, 28, 104-125.
2015. Transportation network design for maximizing space-time accessibility. Transportation Research B, 81, 555-576.
2016. Modeling visit probabilities within network time prisms using Markov techniques. Geographical Analysis, 48, 18-42.
2016. Estimating the most likely space-time paths, dwell times and path uncertainties from vehicle trajectory data: A time geographic method. Transportation Research C, 66, 176-194.
2. Green accessibility
Links to papers: u.osu.edu/miller.81/research/
42
Department of GeographyCenter for Urban and Regional Analysis (CURA)
Department of GeographyCenter for Urban and Regional Analysis (CURA)
• We cannot have sustainability without sustainable urban transportation
• Our current transportation systems are unsustainable
• We need (among other things):1. Evidence that shows the health benefits of
active transportation, including public transport2. Methods to estimate social + environmental
externalities of mobility
Conclusion
43
Department of GeographyCenter for Urban and Regional Analysis (CURA)
Department of GeographyCenter for Urban and Regional Analysis (CURA)
Human systems are complex• Policy and planning interventions have unintended consequences• Fostering sustainable mobility is a good example
Geographic data collection is much easier• Allows researchers to design and execute real-world experiments,
with stronger support for causality• Opportunities for natural/quasi experiments are happening all the
time!
Next step: Geographic information observatories • Persistent observation of geographic data to support opportunistic
observation, experimentation and shared decision-making
To the future!
44
Department of GeographyCenter for Urban and Regional Analysis (CURA)
Department of GeographyCenter for Urban and Regional Analysis (CURA)
Contact• Email: [email protected]• Web: u.osu.edu/miller.81• Twitter: @MobileHarv
Support• Complete the streets 3 ways: Effects on Activity and BMI (1R01CA157509-01),
Obesity Policy Research: Evaluation and Measures, National Institutes of Health.• Green accessibility: Measuring the environmental costs of space-time prisms in
sustainable transportation planning” (BCS-1224102), Geography and Spatial Sciences and Environmental Sustainability programs, National Science Foundation.
Students • Calvin Tribby, PhD. Now: Cancer Prevention Fellow, NCI, NIH• Ying Song, PhD. Now: Assistant Professor, University of Minnesota
Thank you!