using modeling to select catalyst dilution methods for
TRANSCRIPT

Using modeling to select catalyst dilution methods for masstransfer intensification in lab gas–liquid fixed-bed reactorsAlberto Servia*
IFP Energies nouvelles, Rond-point de l’échangeur de Solaize, BP 3, 69360 Solaize, France
Received: 25 June 2020 / Accepted: 7 September 2020
Abstract. Heterogeneous catalyst testing methodology at the lab scale must provide intrinsic kinetics data forreactor design purposes as well as the intrinsic activity ranking during catalyst screening in the field of refiningand petrochemistry. The significant downscaling of the past century coupled with the increasingly activecatalytic formulations may introduce considerable momentum, mass and heat effects in experiments at smallscale. Catalyst dilution has emerged as one versatile and robust way to reduce the impact of momentumand heat effects on heterogeneous catalyst testing. This paper presents a methodology based on global phenom-ena and catalyst dilution modeling to assess and optimize reactor loading techniques for specific problems. Moreparticularly, the aim is to provide catalysts developers and kinetics experts with concrete guidelines forintensifying gas-liquid mass transfer in lab gas–liquid fixed-bed reactors through catalyst dilution. The method-ology is applied to the kinetics determination of the oil residue Hydrodemetallation (HDM) and to the screeningof catalysts for benzene hydrogenation. Layered dilution, consisting on the split of the catalyst in two bedsseparated by an intermediate bed containing an inert material of the same size as the catalyst, poorly improvesgas–liquid mass transfer. Uniform dilution, based on the direct mixture of catalyst and inert material of thesame size, significantly enhances gas–liquid mass transfer as the reactant local consumption per reactor unitvolume is strongly reduced. Combinations of both abovementioned dilution techniques can be used with fastand/or high stoichiometric factor chemical systems operated at conversions higher than 70%. A new criterionis proposed to calculate the minimum dilution factor to guarantee negligible gas–liquid mass transfer limita-tions as a function of conversion, external mass transfer and global pseudo second-order kinetics.
Nomenclature
a Gas–liquid contact area [m2/m3reactor]
aLS Effective liquid–solid contact area[m2/m3
reactor]AR Atmospheric Residueat External area of particles per unit volume of
reactor [m2/m3reactor]
C Molar concentration [mol m�3]CFD Computational Fluid DynamicsDax Axial dispersion coefficient [m2 s�1]Deff Effective diffusion [m2 s�1]Dm Molecular diffusion [m2 s�1]Dp Particle diameter [m]Dr Reactor diameter [m]DS DesulfurizationEa Activation energy [J mol�1]H Henry constant
[molgas m3liquid mol�1
liquid m�3gas]
HDM HydrodemetallationID Internal Diameterk0 Pre-exponential factor [mol kg�1
catalyst s�1]
K i Adsorption constant of species “i” [m3 mol�1]kL Gas–liquid mass transfer coefficient [m s�1]kLS Liquid–solid mass transfer coefficient [m s�1]LHSV Liquid Hourly Space Velocity [s�1]M Metal atomN NitrogenNi NickelP Absolute pressure [Pa]r Catalyst particle radial coordinate [m]R Perfect gas constant [J mol�1 K�1]R&D Research and DevelopmentRe Reynolds numberr j Rate of chemical reaction “j”
[mol kg�1catalyst.s
�1]Rp Catalyst partice radius [m]S Sulfurt Time [s]* Corresponding author: [email protected]
This is an Open Access article distributed under the terms of the Creative Commons Attribution License (https://creativecommons.org/licenses/by/4.0),which permits unrestricted use, distribution, and reproduction in any medium, provided the original work is properly cited.
Oil & Gas Science and Technology – Rev. IFP Energies nouvelles 75, 74 (2020) Available online at:�A. Servia et al., published by IFP Energies nouvelles, 2020 ogst.ifpenergiesnouvelles.fr
https://doi.org/10.2516/ogst/2020071
REGULAR ARTICLEREGULAR ARTICLE

T Temperature [K]V VanadiumVR Vacuum residuevS Superficial velocity [m s�1]X Conversionz Axial coordinate [m]
Subscripts and superscripts
* Equilibrium conditionsG Gasin Reactor inletL Liquidf Liquid filmP ParticleS Solid
Greek symbols
a Ratio between H2 molar concentration in thegas and in the liquid phases
sG Global dilution factor[m3
catalyst m�3
catalyst+inert]sL Local dilution factor [m3
catalyst m�3
catalyst+inert]ei Relative volume of phase “i” [m3
i m�3
reactor]eP Catalyst particle porosity [m3 m�3
catalyst]q Density [kg m�3]mi,j Stoichiometric coefficient of species “i” in
reaction “j”l Viscosity [Pa s]
1 Introduction
The exponential growth of the demand for petrochemicalintermediates and the increasing market volume of hetero-geneous catalysts for refinery applications ensure the attrac-tiveness of this sector for the main world catalysts suppliers[1, 2]. The competitiveness of this field is expected to bereinforced in the upcoming years, and consequently, newgenerations of catalysts with improved activity, selectivityand stability will be developed to allow catalyst suppliersto acquire or raise market shares.
The vast majority of the refining and petrochemicalprocesses uses fixed-bed reactor technology due to its lowcapital cost and easy operation. Pilot and laboratoryfixed-bed reactor technology has experienced a great evolu-tion over the past half century. Lab reactor volumes havebeen substantially reduced from some liters to a few millili-ters or even less with the high throughput experimentation[3], with highly parallelized fixed-bed reactors containingless than 100 catalyst particles. This downscaling coupledwith the increasing chemical reaction rate of new catalyticformulations has triggered many studies on reactor perfor-mances, i.e. hydrodynamics, heat and mass transfer. Poorreactor performance may significantly affect the resultsand prevent from a reliable up-scaling.
Generally, experiments at lab scale are carried outunder isothermal conditions and at the same residence timeas in the industrial reactor, resulting in a constant ratiobetween reactor bed length and fluid velocity at both scales.Typically, lab catalytic beds are a few decimeters heightwhereas industrial reactors are 10–30 m long. Fluids linearvelocities in lab reactors are, hence, two orders of magni-tude lower than within industrial reactors, which stronglyaffects heat and mass transfer performances at the lab scale.Indeed, for fast and/or highly endothermic or exothermicchemical reactions, this yields important momentum, massand/or heat mass transfer limitations in lab reactors [4].Momentum and mass transfer limitations are often respon-sible for conversion decrease, selectivity modification and insome cases accelerated catalyst deactivation [5]. Heat trans-fer limitations result in a non-uniform temperature fieldthat might change the reaction pathways as well as catalystselectivity and stability. In the worst case, non-isothermalreactor operation may lead to reactor runaway for highlyexothermic reactions.
Three approaches exist to guarantee the determinationof the intrinsic kinetics from lab data, to be used afterwardsin the design of industrial reactors. The first approach con-sists on operating lab reactors in the kinetically controlledregime allowing experimental results to be directly scaled-up. Design criteria have been developed over the past yearsto minimize momentum, heat and mass transfer limitationsin lab reactors [6]. Sie proposed a criterion on how to ensurea proper distribution of liquids in downflow gas–liquidfixed-bed reactors [7]. Mears [8] and Gierman [9] developeda conversion-dependent criterion to prevent from axial massdispersion effects. Thiele proposed a criterion to account forinternal mass transfer limitations [10]. Mears developed acriterion to ensure external mass transfer limitations to beminimized during heterogeneous catalyst testing [11]. Morerecently, Rolland and Fonte established new criteria on theminimum number of catalytic pellets to be used to ensureexperiments reproducibility [12]. There is no universal ruleas the optimal reactor depends on the chemical systemunder consideration. Furthermore, one corrective actionto reduce a specific limiting phenomenon can have a nega-tive influence on another phenomenon. An example is thereduction of the reactor diameter for radial temperaturegradients elimination, which, in contrast, may increase flowmal-distribution through preferential passages.
For fast and/or highly exothermic or endothermicchemical reactions the abovementioned criteria might notbe met. In that case, a second approach consists on the indi-rect determination of kinetics from experimental measure-ments through the use of mathematical models describinghydrodynamics, heat and mass transfer inside the reactor.The selection of mass and heat transfer correlations, oftenpresenting high deviations between them and usually cali-brated with data coming from cold mock-up experiments,may introduce some uncertainties in the regressed kineticparameters.
Recently, Computational Fluid Dynamics (CFD)coupled with both mass and heat transport equations hasemerged as an interesting tool to perform the direct numer-ical simulation of the different physics encountered in a
A. Servia: Oil & Gas Science and Technology – Rev. IFP Energies nouvelles 75, 74 (2020)2

pilot plant reactor with no assumptions on the physics[13–15]. However, this third approach is still limited tothe calculation of small cases with around 100 particles asthe mesh resolution to capture concentration gradients isbeyond today’s computing capabilities.
Bed dilution appears to be one of the most versatile androbust way to improve hydrodynamics and heat transfer.Adding powder finer than the catalyst helps preventingpreferential paths and reduces axial dispersion effects[7–9]. Nevertheless, the coupling between high dilutionfactors and operation at high conversions must be avoideddue to a possible catalyst misdistribution resulting in cata-lyst by-passing inside the reactor [16–18]. Adding the inertmaterial can be executed by filling up the catalyst bedporosity which does not change the overall bed length orby expanding the bed length through dilution. Porosityfilling can only be performed with very fine powder(50–300 lm) for millimetric size pellets while dilution canbe carried out with any powder size, eventually mixturesof several powder sizes. Diluting the catalyst in a highlythermal conductive material such as SiC or non-porousceramics (alumina, zirconia, etc.) reduced thermal gradients[19] due to the reduction of the amount of heat generatedper unit volume and to a faster heat dissipation. Regardingmass transfer, catalyst dilution is expected to improve theresults through the reduction of the amount of reactivedemand per unit volume of reactor, while keeping thegas–liquid transfer rate unchanged. Nevertheless, it is notlikely to improve liquid–solid mass transfer as liquid–solidmass flux and reactive demand per unit reactor volumeare reduced to the same extent. To the best of our knowl-edge, there is no work showing the benefits of catalyst dilu-tion for mass transfer enhancement purposes. Dilution canbe uniform or vary along the reactor length. It can alsobe performed by alternating layers of catalyst and inertmaterial. What is the most suitable dilution method for agiven application? What amount of diluent is needed?Where should it be added? In what proportion?
This paper investigates bed dilution techniques in orderto intensify mass transfer within lab gas–liquid fixed-bedreactors. More precisely, this paper offers a discussion onhow to decide the optimal strategy for improving reactorperformance using inert material in a fixed-bed reactor inorder to answer to the abovementioned inquiries.
2 Methodology
An isothermal 1D (one-dimensional) reactor model couplingaxial mass dispersion effects, external and internal masstransfer, vapor–liquid equilibrium and kinetics was devel-oped to study the influence of different types of dilutionapproaches on the performance of lab packed-bed reactorswith gas–liquid mixtures flowing upwards. Dilution withpowder finer than catalyst is not addressed in this workas the resulting flow is expected to be capillary [20] andmass transfer correlations for capillary flow in packed-bedreactors are not available in literature. Simulations are thuscarried out by assuming the same size and shape forcatalyst and inert particles. The oil residue HDM and the
benzene hydrogenation are the case studies, and thecoupling between simulations and experimental results isused to carry out reactor performance diagnosis and dilu-tion method selection and optimization. The liquid reactantis the limiting species from the diffusion point of view forboth applications, as suggested by the calculation of specificcriteria [21], fact that justifies the selection of the upflowmode of operation. A sensitivity analysis on the oil residueHDM kinetics is performed at the end of the work for devel-oping new criteria to ensure negligible gas–liquid masstransfer limitations as a function of conversion, externalmass transfer and global pseudo second-order kinetics.The details of the dilution methods, the reactor model,the case studies and the sensitivity analysis are given inthe upcoming sections.
2.1 Dilution methods
The different dilution approaches studied in this work aredepicted in Figure 1. Both dilution methods intensify gas–liquid mass transfer without modifying the role of liquid-solid mass transfer as particles size remains constant.Gas–liquid mass transfer is indeed expected to be thelimiting factor as liquid–solid mass transfer is faster thanthe former in packed-bed reactors over a wide range of flowrates [22].
The layered dilution, in which the catalytic volume issplit in one or more beds separated by inert zones, is repre-sented in Figure 1a. The role of the inert material is to bringback the gas–liquid mixture to equilibrium conditions tocompensate the gas–liquid limitations induced by theprevious catalytic bed. The uniform dilution, in which cat-alyst particles are uniformly mixed with inert particles, isillustrated in Figure 1b. The goal is to reduce reactantsconsumption per unit volume of reactor while keeping thegas–liquid mass transfer performance constant. Combina-tions of both techniques can be interesting for specific chem-ical systems, as it is shown later in this paper. Whendiscussing dilution methods, one must introduce the localdilution factor parameter sL, defined as the local volumefraction of catalyst within the mixture constituted by thecatalyst itself and the inert material, and the global dilutionfactor sG, defined as the global volume fraction of catalystwithin the entire reactor volume, defined as the spacebetween the first and the last catalytic beds. Thus, inertbeds immediately before the first catalytic bed or afterthe last catalytic bed are not considered in the simulationnor in the dilution factor calculation. The higher the dilu-tion factor, the higher the reduction expected on gas–liquidmass transfer limitations.
2.2 Reactor model
The following assumptions are considered in order to sim-plify model formulation for gas–liquid packed-bed reactorsoperated in upflow:
� Isothermal operation.� Negligible pressure drop.� Ideal plug-flow for the gas phase.� Plug-flow with axial dispersion for the liquid phase.
A. Servia: Oil & Gas Science and Technology – Rev. IFP Energies nouvelles 75, 74 (2020) 3

� Radial concentration gradients around catalystparticles neglected.
� Constant liquid velocity.� Constant gas, liquid and solid hold-up.� Complete wetting conditions.� Gas and liquid considered ideal from a thermody-namic point of view.
� Gas–liquid equilibrium at the reactor inlet.� Catalyst particles are considered spheres with thesame volume as the real catalyst particles.
Mass balance equations are solved for all the specieswithin the gas phase (Eq. (1)), liquid phase (Eq. (2)), liquidfilm surrounding the catalyst particle (Eq. (3)), and withinthe catalyst particle itself (Eq. (4)):
oCGi
ot|ffl{zffl}Accumulation
¼ � 1eG
o vGSCGi
� �oz|fflfflfflfflffl{zfflfflfflfflffl}
Convection
þ k iLaCG
i
H i� CL
i
� �|fflfflfflfflfflfflfflfflfflfflfflfflffl{zfflfflfflfflfflfflfflfflfflfflfflfflffl}
G�L transfer
2664
3775; ð1Þ
oCLi
ot|{z}Accumulation
¼ � 1eL
"vLS
oCLi
oz|fflfflffl{zfflfflffl}Convection
� k iLaCG
i
H i� CL
i
� �|fflfflfflfflfflfflfflfflfflfflfflfflffl{zfflfflfflfflfflfflfflfflfflfflfflfflffl}
G�L transfer
þ sLk iLSeS6Dp
CLi � C f
i
� �|fflfflfflfflfflfflfflfflfflfflfflfflfflfflfflffl{zfflfflfflfflfflfflfflfflfflfflfflfflfflfflfflffl}
L�film transfer
#þ Dax
o oCLi
oz
� �oz|fflfflfflfflfflfflffl{zfflfflfflfflfflfflffl}
Axial dispersion
; ð2Þ
Di
k iLS
oC fi
ot|fflfflfflffl{zfflfflfflffl}Accumulation
¼ k iLS CLi � C f
i
� �|fflfflfflfflfflfflfflfflfflffl{zfflfflfflfflfflfflfflfflfflffl}L�film transfer
�Dieff
oCPi
or
r¼Rp|fflfflfflfflfflfflfflfflffl{zfflfflfflfflfflfflfflfflffl}
Catalyst diffusion
; ð3Þ
ePoCP
i
ot|fflfflffl{zfflfflffl}Accumulation
¼ 1r2
o Dieffr
2 oCPi
or
� �or|fflfflfflfflfflfflfflfflfflfflfflffl{zfflfflfflfflfflfflfflfflfflfflfflffl}
Catalyst diffusion
þXi;j
ti;jr jqs|fflfflfflfflfflffl{zfflfflfflfflfflffl}Kinetics
: ð4Þ
The gas velocity changes due to H2 consumption andconstant pressure operation. The sum of the different massbalances within the gas phase and the expression of thetotal gas concentration as a function of pressure andtemperature through the perfect gas law allow gas velocityto be computed as a function of reactor height:
o vGSPRT
� �oz|fflfflfflfflffl{zfflfflfflfflffl}
Convection
¼ �Xi
kiLaCG
i
H i� CL
i
� �|fflfflfflfflfflfflfflfflfflfflfflfflfflfflfflffl{zfflfflfflfflfflfflfflfflfflfflfflfflfflfflfflffl}
G�L transfer
: ð5Þ
The solution of the partial differential equations systemabovementioned needs the establishment of boundaryconditions for the stationary solution. Both gas and liquidconcentrations at the reactor inlet respect thermodynamicequilibrium (Eqs. (6) and (7)). Both inlet and outlet areclosed to axial dispersion effects (Eq. (8)). For the resolu-tion of the diffusion-reaction equation for each species,two boundary conditions are needed. The first one is thesymmetrical condition at the particle center (Eq. (9)),whereas the second one is the continuity of mass fluxes atthe external surface (Eq. (10)):
CGi z ¼ 0ð Þ ¼ CG;�
i ; ð6Þ
CLi z ¼ 0ð Þ ¼ CL;�
i ; ð7Þ
CLi z ¼ 0ð Þ ¼ CL
i;in þDax
vLS
oCLi
ozz ¼ 0ð Þ;�Dax
oCLi
ozz ¼ Lð Þ ¼ 0;
ð8Þ
a) b) c)
τG =1:2, 3 beds τG =1:2, 2 beds τG = τL = 1:3 τG = τL = 1:2 τL1 = τL2 = 1:2 τL1=1:2 τL2 = 1
Fig. 1. Illustration of the dilution techniques considered in this work: layered dilution (a) uniform dilution (b) and combination ofboth (c). Black, white and grey represent catalyst, inert material and mixtures of both. The arrow represents flow direction.
A. Servia: Oil & Gas Science and Technology – Rev. IFP Energies nouvelles 75, 74 (2020)4

Dieff
oCPi
or
r¼0
¼ 0; ð9Þ
k iLS CLi � C f
i
� � ¼ Dieff
oCPi
or
r¼Rp
: ð10Þ
Gas–liquid equilibrium constants for the different specieswere computed from flash calculations at constant pressureand temperature performed in ProII 10.1.
Liquid–solid and gas–liquid mass transfer coefficientswere determined by the correlations from the works of Gotoet al. [22] and Saada [23] based on the recommendationsfrom the review of Larachi et al. [24]. Related equationsalong with the validation ranges are given below. Bothcorrelations were obtained under laminar conditions inthe upflow mode of operation, conditions that match theoperating conditions used during the experiments of thiswork.
JD ¼ 1:31 ReLð Þ�0:436 with JD ¼ kLSaLS
at
1vSL
� �lL
qLDm
� �2=3
0:2 < ReL < 20ð Þ; ð11Þ
Sh ¼ kLad2p
Dm¼ 10:72Re0:22G Re0:32L
Dp
DR
� �0:33
4 < ReL < 105ð Þ; 20 < ReG < 450ð Þ: ð12ÞLiquid axial dispersion values were computed from Belfareset al. [25]. Liquid hold-up was obtained from the correlationof Bensetiti et al. [26] calibrated with an experimental data-base of 1322 points from experiments carried out in upflow.Both correlations mentioned before are not presented hereas they have been directly coded within the flooded-bed-simulator developed by the Université de Laval, Canada.The conditions used during the experiments of this work fallwithin the validation range of both correlations. Diffusioncoefficients were calculated with the well-known Wilke–Chang equation [27], for which molar volume at normalboiling point for the diffusing species is needed, and com-puted from the equation of Le Bas [27]. All other propertiessuch as liquid and gas density and viscosity, and liquid sur-face tension, except for residue viscosity, calculated with anin-house correlation, were computed from ProII 10.1simulations.
The system of differential equations along with thedifferent physico-chemical properties is implemented inFortran and the equations are discretized by using theexplicit finite differences method with the central differencescheme for second order derivatives. Sensitivity analysis isperformed to guarantee grid-independent numerical simula-tions results. Hundred elements were considered in the axialdirection, whereas 30 elements were used for discretizing thecatalyst particle. All grid points are equidistant betweenthem.
2.3 Case studies
Experiments used for kinetic parameters regression and forreactor performance diagnosis as well as the different dilu-tion strategies numerically evaluated are presented for bothcase studies in the following section.
2.3.1 Oil residue Hydrodemetallation (HDM)
Oil atmospheric or vacuum residue contains importantamounts of impurities such as Ni, V, S and N. The removalof the metal content from these feedstocks is mandatory asthese species act as poisons of downstream catalysts. Thisremoval is carried out in the first catalytic bed of theAtmospheric/Vacuum Residue Desulfurization (ARDS/VRDS) process, in which the oil residue is hydrotreatedunder high hydrogen pressures of around 200 bar. The cou-pling between very low liquid velocities (liquid hourly spacevelocities – LHSV are in between 0.4 and 1.5 h�1) andsignificant liquid viscosities, depending on the crude origin,may introduce mass transfer limitations at the lab scale.The lab HDM reactor has a 3.6 cm internal diameter andcontains a thermowell with 6.5 mm external diameterplaced in the middle of the reactor for temperature controlpurposes. Thermal effects are neglected from temperatureprofiles evaluation. Catalyst particles with an equivalentdiameter of 2.2 mm are loaded within the reactor withoutdilution.
The HDM chemical reaction is given by the followingequation:
C49H71S1:1N0:2O0:1M0:0021 þ 6:28H2 ! 2C24:5H41S0:3N0:02O0:03
þ 0:5H2Sþ 0:04H2Oþ 0:16NH3 þ 0:0021M: ð13ÞThe molecular formula of the two lumps (boiling pointsabove and below 520 �C) considered for the HDM chemicalreaction are determined by using simulated distillation,elemental analysis for each lump and average molecularweight data for each lump. No distinction is consideredbetween the reactivity of Ni and V (M – metal), and theyare supposed to be contained within molecules presentingboiling points above 520 �C. Finally, the reaction schemeassumes that the metal molecule hydrodemetallation isaccompanied by a cracking reaction.
The kinetic law is calibrated for reaction order ofthe metal-containing reactivity family (520 �C+) andpre-exponential factor determination purposes. Fiveexperimental tests are used for model calibration, atconstant temperature of 370 �C, pressure of 140 bar, H2/hydrocarbon of 1000 NL/L and at LHSV’s ranging from0.45 to 1.2 h�1. The feed is a mixture of 70% of AtmosphericResidue (AR) and 30% of Vacuum Residue (VR) in a massbasis. The resulting kinetic-law expression for the residueHDM is given by the following equation:
rHDM ¼ 5:72 exp � 125 000RT
� �Cp
C49H71S1:1N0:2O0:1M0:0021
� �1:1�Cp
H2HH2 : ð14Þ
A. Servia: Oil & Gas Science and Technology – Rev. IFP Energies nouvelles 75, 74 (2020) 5

The different dilution techniques numerically tested forgas–liquid mass transfer intensification purposes for thatspecific case study are illustrated in Figure 2. Two strategiesare considered in the case of layered dilution: only one inertbed with different global dilution factors or one constantglobal dilution factor of 1:2 with two or more inert beds(Fig. 2a). Regarding the uniform dilution technique, dilu-tion factors between 1:2 and 1:6 are simulated (Fig. 2b).One should note that catalyst height is not kept constantbetween figures for illustration simplification purposes. Nev-ertheless, the catalyst volume is kept constant for all simu-lations and equal to the catalyst volume of the standardexperiments without dilution.
2.3.2 Benzene hydrogenation
Cyclohexane, which is an intermediate in nylon production,is usually produced from benzene under moderate hydrogenpressures of around 20 bar on Ni-containing catalysts.Unlike the previous case, benzene hydrogenation is carriedout at high LHSV due to the high benzene hydrogenationreaction rate. Benzene hydrogenation is a fast chemicalreaction and consequently, it is likely to be affected by masstransfer limitations, especially within small lab reactors inwhich catalyst screening is for instance carried out. Oneshould note that the aim of catalyst screening is to ensurea reliable catalyst ranking as well as enough difference in
catalytic performances to justify candidate selection andfurther developments. Experiments are carried out in a10.2 mm ID (Internal Diameter) reactor with an oil circula-tion within a double jacket surrounding the reactor to guar-antee isothermal operation, confirmed from experimentalevidence. Reactors are loaded either with catalyst A, withan equivalent diameter of 2.5 mm, or with catalyst B, withan equivalent diameter of 1.2 mm. Two catalyst bedsare separated by a 9.5 cm long inert bed and diluted with3 volumes of SiC (sL1 = sL2 = 1:4).
The kinetic law expression for this chemical reactions istaken from the work of Toppinen et al. [28]:
rBZ ¼ k0exp � EaR
1T � 1
373:15
� � �KBZC
pBZKH2C
pH2
3KBZCpBZ þ KH2C
pH2
� �0:5þ 1
� �3 : ð15Þ
Experiments with a model feed containing 1% of benzene inn-heptane in a mass basis at a LHSV of 40 h�1, pressure of30 bar, H2/benzene of 250 NL/L and at temperatures rang-ing from 95 to 140 �C are used for pre-exponential factorcalibration of catalyst A. Catalyst B pre-exponential factoris determined by assuming a linear correlation between thisparameter and the catalyst metal content of both catalysts.The resulting kinetic parameters are given in Table 1.Activation energy and adsorption constants are taken from
a) Layered dilutionτG 1:2-1:3, two catalytic beds τG 1:2, 2-5 catalytic beds
b) Uniform dilution, τG = τL = 1:2-1:6
Fig. 2. Loading methods numerically tested for the HDM lab reactor case study. The arrow represents flow direction.
A. Servia: Oil & Gas Science and Technology – Rev. IFP Energies nouvelles 75, 74 (2020)6

a literature work [28] performed on a catalytic formulationequivalent to Catalyst A. The pre-exponential factorregressed for catalyst A from experimental data is close tothe one reported in literature [28], result expected account-ing for the similarity of both catalytic formulations.
The effect of dilution is tested by considering the simu-lation of a non-diluted bed for both catalysts as representedin Figure 3a. Different dilution approaches (Figs. 3b–3d)are also evaluated to gain insight on dilution interest forfast chemical reactions operated at conversions higher thanin the case of the oil residue hydrodemetallation. Thelayered dilution with a global dilution factor of 1:2 is
considered in Figure 3b whereas the uniform dilution withdilution factors ranging from 1:2 to 1:4 is illustrated inFigure 3c. Finally, combinations of both dilution techniquesare also evaluated for this specific case (Fig. 3d), since theinitial experiments submitted to diagnosis are performedby using this particular configuration. The inert bed sepa-rating the uniformly diluted catalyst beds is kept constantfor all simulations and equal to 9.5 cm. Uniform dilutionsbetween 1:2 and 1:4 are considered at the catalyst bed inlet,outlet and both, as represented in Figure 3d. One shouldnote, as for the HDM case study, that representations aregiven for illustration simplification purposes, and they donot exactly represent the actual beds dimensions. Thecatalyst volume remains constant for all simulations.
2.4 Sensitivity analysis
The sensitivity analysis consists on increasing the oil residuehydrodemetallation kinetics by a factor of 5 and 10 andperforming simulations for local dilution factors in theuniform dilution configuration ranging from 1:2 to 1:51(no gas–liquid mass transfer limitations) at four differentlevels of conversion: 35, 56, 78 and 89%. The goal of thisanalysis is to determine the minimum local dilution factor,
Table 1. Kinetic parameters of the benzene hydrogena-tion kinetic law.
Catalyst A Catalyst B
k0 [mol/(kg s)] 2 3Ea [kJ/mol] 53.9 53.9KBZ � 104 [m3/mol] 18.3 18.3KH2 � 104 [m3/mol] 7074.5 7074.5
a) No dilution b) Layered dilution τG = 1:2 c) Uniform τG = τL = 1:2-1:4
d) Combinations, inert bed of 9 cmUniform τL1 = 1:2-1:4 τL2 = 1 Uniform τL1 = 1 τL2 = 1:2-1:4 Uniform τL1 = τL2 = 1:2-1:4
Fig. 3. Loading methods numerically tested for the benzene hydrogenation lab reactor case study. The arrow represents flowdirection.
A. Servia: Oil & Gas Science and Technology – Rev. IFP Energies nouvelles 75, 74 (2020) 7

defined as the dilution factor necessary to reach 33, 53.4,75.5 and 87.1% conversion respectively for the previousconversion values, computed from simulations at a dilutionfactor of 1:51. The target conversions are calculated byimposing the temperature of the initial simulation minusthe typical uncertainty of catalytic activity measurements,which is equal to 2 �C. All simulations were carried out byassuming no liquid–solid mass transfer limitations for the520 �C+ cut. Based on the results obtained, a new criterionbased on measurable variables is proposed to guaranteegas–liquid mass transfer limitations minimization as a func-tion of external mass transfer, global pseudo second-orderkinetics and conversion.
3 Results
This section presents the results in terms of model calibra-tion and concentration fields with and without catalystdilution for each of the abovementioned case studies as wellas the sensitivity analysis for the development of criteria onthe minimum necessary dilution factor for ensuring negligi-ble gas–liquid mass transfer limitations.
3.1 Oil residue HDM
The parity plot between experimental and simulationresults is illustrated in Figure 4 in terms of HDM conver-sion. A good agreement exists between experimental andmodel data, which allows the numerical experiments to becarried out. The considerations made hereinafter for onespecific experiment can be translated to the otherexperiments.
Liquid interface, liquid and film normalized profileconcentrations for the two reactants, H2 and 520 �C+, arerepresented as a function of the normalized axial coordinatein Figure 5. The 520 �C+ liquid concentration is practicallyequal to the 520 �C+ liquid interface concentration, whichmeans that gas–liquid mass transfer is not limiting for thislump. This is explained by the low volatility of this family ofcompounds, that preferably remains in the liquid phase.Hydrogen behavior is completely different, presenting a sig-nificant depletion in the liquid phase immediately after thereactor inlet, due to its fast consumption at the beginning ofthe reactor. One should remind that each mol of 520 �C+
requires 6.28 mol of hydrogen to react. The ratio betweenH2 and 520 �C+ molar concentrations at the reactor inletis equal to 0.4, which clearly shows the need for hydrogendissolution to reach experimental conversions between50% and 75%. Hydrogen liquid concentration passesthrough a minimum and then increases as the reactionproceeds. Equilibrium conditions for hydrogen are neverachieved as conversion remains at a moderate value of60%. Species concentration in the liquid phase and in theliquid film for H2 and 520 �C+ are close indicating moderateliquid–solid mass transfer limitations. Thus, and concerningonly external mass transfer limitations, the experiments aremainly limited by H2 dissolution.
The synthesis of the results obtained from the simula-tion of the dilution methods exposed in Section 2.3 is
presented in Figure 6 for the layered dilution with increas-ing global dilution factor and catalyst beds number and inFigure 7 for the uniform dilution with increasing dilutionfactor. Layered dilution with increasing dilution factorand two catalytic beds does not improve gas–liquid masstransfer despite the fast dissolution of hydrogen to reachequilibrium conditions in the inert bed (Figs. 6a and 6f).Immediately after the inert bed, gas–liquid mass transferlimitations take place as hydrogen is sharply depleted inthe liquid phase. The increase of the inert bed size doesnot enhance results due to the low dissolution characteristictime of hydrogen compared to the liquid residence time inthis zone (Fig. 6b). Results of catalyst bed split into 3–5catalytic beds with inert beds in between are illustrated inFigures 6c–6e. These simulations allow the determinationof the necessary inert bed length for ensuring equilibriumconditions for hydrogen, as illustrated in Figure 6e.
Uniform dilution strongly decreases the relative rate ofhydrogen consumption compared to its dissolution, asshown by Figure 7a–7c. A simple dilution of 1:2 reduceshydrogen consumption per unit volume of reactor by a
Fig. 4. Parity plot between experimental and simulated HDMconversions.
Fig. 5. Liquid interface, liquid and film normalized concentra-tions field for H2 and 520�C+ as a function of the normalizedaxial coordinate.
A. Servia: Oil & Gas Science and Technology – Rev. IFP Energies nouvelles 75, 74 (2020)8

factor of 2, while mass transfer rate is kept constant. That istraduced by a reduction on hydrogen depletion in the liquidphase from more than 30% for the non-diluted standardcase to 20% (Fig. 7a) of the theoretical equilibrium concen-tration. This effect is equivalent to multiply the gas–liquidmass transfer coefficient by a factor of 2 and thus liquidvelocity by 4, since in a laminar flow, the Sherwood numberis expected to be proportional to the square root of thesuperficial velocity [29]. The impact on HDM conversionis notorious, as conversion is increased by 3 points from61% to 64% (Fig. 7d). The same trend is observed whenincreasing dilution factor, nevertheless, the impact becomes
lower as equilibrium conditions are approached in the wholereactor (Figs. 7b and 7c). The evolution of the HDMconversion as a function of dilution factor in the uniformdilution approach, represented in Figure 7d suggests thatconversion can be increased from 61% to 66% by applyinga dilution factor of 1:4, considered as optimal as higherdilution factors benefits may not be noticeable due to exper-imental uncertainties.
HDM conversions for the initial loading, the opti-mized dilution strategy (uniform dilution with dilutionfactor 1:4) and theoretical loadings without gas–liquidand gas–liquid/liquid–solid mass transfer limitations are
Fig. 6. Layered dilution with increasing global dilution factor and increasing number of catalytic beds effect on gas–liquid masstransfer and on HDM conversion.
A. Servia: Oil & Gas Science and Technology – Rev. IFP Energies nouvelles 75, 74 (2020) 9

presented in Figure 7d. The selected dilution techniqueapproaches the theoretical loading with no gas–liquid masstransfer limitations, with a conversion difference of 1 point,which is well below the experiments uncertainty. Whencompared to the ideal case without any mass transferlimitations as expected in the industrial scale, the conver-sion difference is predicted at three points, which is approx-imately equal to the experiments reproducibility. Thus,using the uniform dilution method with a dilution factorof 1:4 performed with particles of the same size as thecatalyst allows the experimental data to be directlyscaled-up and used for industrial reactor design purposes.
3.2 Benzene hydrogenation
Benzene molar fraction at the reactor outlet is representedas a function of temperature for both catalysts togetherwith model predictions in Figure 8. Model predictions arein quite good agreement with experimental results, leadingto the validation of the dilution modeling approach.
Liquid interface and liquid concentration profiles as afunction of the reactor axial coordinate are representedfor H2 and benzene and for both catalysts in Figures 9aand 9b at 140 �C, conditions under which mass transferresistance is more pronounced. A small gas–liquid masstransfer limitation can be observed for H2 for both catalystsat the reactor inlet as the chemical reaction rate is the
fastest in this point. Catalyst B is more limited by externalmass transfer than catalyst A as it contains more Ni andhas a smaller diameter. Even if not presented here, experi-ments were subject to important internal mass transferlimitations, with determined catalyst effectiveness in therange of 30%–50%, in agreement with catalyst effectiveness
Fig. 7. Uniform dilution with increasing dilution factor effect on gas–liquid mass transfer and on HDM conversion.
Fig. 8. Experimental and numerical benzene molar fractionresults at the reactor outlet as a function of temperature forcatalysts A and B. A relative uncertainty of 30% on the obtainedbenzene molar concentration is considered.
A. Servia: Oil & Gas Science and Technology – Rev. IFP Energies nouvelles 75, 74 (2020)10

measurements not presented in this paper. The gas–liquidmass transfer limitation is lower in the second catalyticbed, as the chemical reaction is almost completed at thispoint and H2 demand greatly reduced. Unlike the HDMexperiments, gas–liquid limitations also affect benzene asthis compound is volatile. The impact is nevertheless lesspronounced than for hydrogen, as three molecules of thelater are required per molecule of benzene for the reactionto be carried out. All abovementioned considerations allowto conclude that the dilution approach used in this case issatisfactory since the expected performance difference isobtained from the experiments (Fig. 9c). Furthermore,these experiments can be used directly for scale-uppurposes, as liquid deviation from equilibrium conditionsdoes not exceed 10%.
The direct influence of catalyst dilution is illustrated inFigure 10 through the simulation of the undiluted catalystin one single bed. The undiluted bed loading guarantees areliable catalyst screening even if the differences betweenapparent catalysts performances are lower than in theprevious case due to significant gas–liquid mass transferlimitations for both species. One should keep in mind thatcatalyst screening can sometimes be performed between sim-ilar catalytic formulations. The difference in performance forclose catalytic formulations can easily be suppressed by gas–liquid mass transfer limitations and dilution should thus bepracticed in that case. Furthermore, the development of a
new catalytic formulation is often driven by a particularspecification, that can be for instance the achievement of agiven concentration at the reactor outlet under constantoperating conditions. In our case, one can imagine that thecatalyst provider should develop a new catalytic formulationallowing to achieve 10 ppmmol/mol of benzene or less in theeffluent under screening conditions. In the case under study,catalyst B, which intrinsically allows the specification to bemet, gives an effluent containing 70 ppm mol/mol ofbenzene without dilution. Catalyst B is hence not expectedto capture the catalyst supplier attention, whomay intensifyR&D efforts to find a good candidate, despite it intrinsicallymeets the requirements.
The impact of several reactor loading configurations onthe performance measurements of catalyst B is shownhereinafter. From now on, catalyst A is left out of theanalysis, since all dilution techniques are expected to beable to perform catalyst screening from the abovementionedconsiderations. The goal of this analysis is to find a way tooptimize and potentially simplify, reactor loading for accel-erating catalyst screening.
The single layered dilution enhances gas–liquid masstransfer in that case as illustrated in Figure 11a, probablydue to a quite high experimental conversion. Uniformdilution drastically reduces gas–liquid mass transfer limita-tions, even without the inert bed splitting consecutivecatalytic beds, as seen in Figure 11b. A dilution factor of
Fig. 9. Liquid interface and liquid normalized concentrations profile for hydrogen and benzene as a function of the normalized reactoraxial coordinate for diluted catalyst and residual benzene at the reactor outlet for both catalysts at 140 �C.
A. Servia: Oil & Gas Science and Technology – Rev. IFP Energies nouvelles 75, 74 (2020) 11

1:4 allows to obtain a benzene outlet concentration of11 ppm mol/mol, performances close to the base case,for which the benzene outlet concentration is10 ppm mol/mol. The simulation of both catalytic beds uni-form dilution with increasing dilution with and without theintermediate inert layer gives similar results (Fig. 11e). Theintermediate inert bed allows the performance to beimproved, but not significantly, as most of the gas–liquidmass transfer limitations are suppressed through the prac-tice of uniform dilution. The aim of the last set of simula-tions is to provide information about where to preferablyuse uniform dilution, and in which proportion. For fastchemical reactions and at rather high conversion (>70%),the inert material should be introduced in the first catalyticbed, preferably with a dilution factor of 1:4, as suggested byFigures 11c and 11e. Indeed, the chemical reaction rate isthe highest at the beginning of the reactor, and as a result,one should dilute this part of the reactor rather than down-stream catalytic beds. The addition of one inert bed isoptional, as the effect on gas–liquid mass transfer limita-tions is reduced when uniform dilution is considered. Theeffect of the second catalytic bed dilution on performancesis low as the chemical reaction is almost completed at thispoint (Figs. 11d and 11e).
The simulations carried out for this case study showthat catalyst screening of substantially different catalytic
formulations can be performed, even with considerablegas–liquid mass transfer limitations. In the case of a specifi-cation-driven or close catalytic formulations screening,uniform dilution with a factor of 1:4 is advised. The useof two catalytic beds with different dilution factors splitby an intermediate inert bed is also possible. In that case,the first catalytic bed should be diluted by a factor of 1:4whereas a dilution factor of 1:2 should be sufficient forthe second bed. The height of the inert bed can be easilydetermined by ensuring that the dissolution characteristictime is lower than the residence time within this bed.
3.3 Optimizing the dilution factor
The results from both case studies, despite they are intrin-sically different, allow to conclude that a dilution factor of1:4 in the uniform dilution configuration is sufficient to min-imize the impact of gas–liquid mass transfer limitations oncatalytic performance measurements. A sensitivity analysisis performed to understand the evolution of the optimizeddilution factor as a function of kinetics at different conver-sion levels. The result of the HDM conversion evolutionwith dilution factor for different kinetics and conversionlevels is illustrated in Figure 12. It includes the conversiontarget for neglecting gas–liquid mass transfer limitations,defined as the conversion corresponding to a temperature
Fig. 10. Liquid interface and liquid normalized concentrations profile for hydrogen and benzene as a function of the normalizedreactor axial coordinate for undiluted catalyst and residual benzene at the reactor outlet for both catalysts at 140 �C.
A. Servia: Oil & Gas Science and Technology – Rev. IFP Energies nouvelles 75, 74 (2020)12

2 �C lower than the temperature set during numericalexperiments (370 �C). This value corresponds to the typicaluncertainty of catalytic activity measurements.
The conversion rapidly increases as the dilution factorincreases (traduced by a decrease of parameter s) untilreaching the conversion at which gas–liquid mass transferlimitations are negligible for all cases. This increase issharper for faster kinetics due to stronger mass transfer lim-itations. The minimum dilution factor increases for fasterkinetics, as the gas–liquid mass transfer limitations becomestronger in that case. The optimized dilution factordecreases with an increase of conversion, which is due to adramatic drop of the chemical reaction rate near the reactor
outlet. This effect is stronger than the gas–liquid mass trans-fer limitation near the reactor inlet at high conversion, factthat explains why an optimum dilution factor of 1:4 is foundfor both case studies, although the benzene hydrogenation isquite faster than the oil residue HDM.
The minimum necessary dilution factor can be deter-mined from the following expression, that accounts forexternal mass transfer effects, kinetics and conversion.The deduction of this equation is exposed in Appendix.
sL ¼ kLa
kLSaLSa
1�a
� �1� kLSaLS
kLSaLSþkmH2CL520�Cþ esqs
� � : ð16Þ
Fig. 11. Liquid interface and liquid normalized concentrations profile for hydrogen and benzene as a function of the normalizedreactor axial coordinate for different dilution techniques and residual benzene at the reactor outlet for catalyst B at 140 �C.
A. Servia: Oil & Gas Science and Technology – Rev. IFP Energies nouvelles 75, 74 (2020) 13
Intuitively, in the case of fast kinetics, the dilution factor toensure negligible gas–liquid mass transfer limitations shoulddepend on the liquid–solid mass transfer coefficient. Thehigher the liquid–solid mass transfer coefficient, the higherthe dilution needed, as suggested by the criterion. Forextremely low kinetics rates, the dilution factor parametersL approaches infinity, which means that no dilution isneeded, result expected as, in this case, the operation isexpected to be completely controlled by the chemical reac-tion. Finally, the higher the parameter alpha, the higher thedilution needed, which is intuitive, as a lower gradientbetween the gas and the liquid phases concentrationsrequires higher dilution factors.
a depends on the activation energy as well as on the DTuncertainty, which is equal to 2 �C. It can be obtainedthrough the following expression, whose deduction is shownin the Appendix, and in that case, it takes the value of 0.93:
a ¼ exp�Ea
R1
T ��T� 1
T
� � �: ð17Þ
In equation (16) CL520 �Cþ is the 520 �C+ cut concentration
within the liquid phase at the reactor outlet and it can beobtained by performing a mass balance equation to thislump in the liquid phase by assuming a constant value of0.93 for a. The ratio kLS aLS
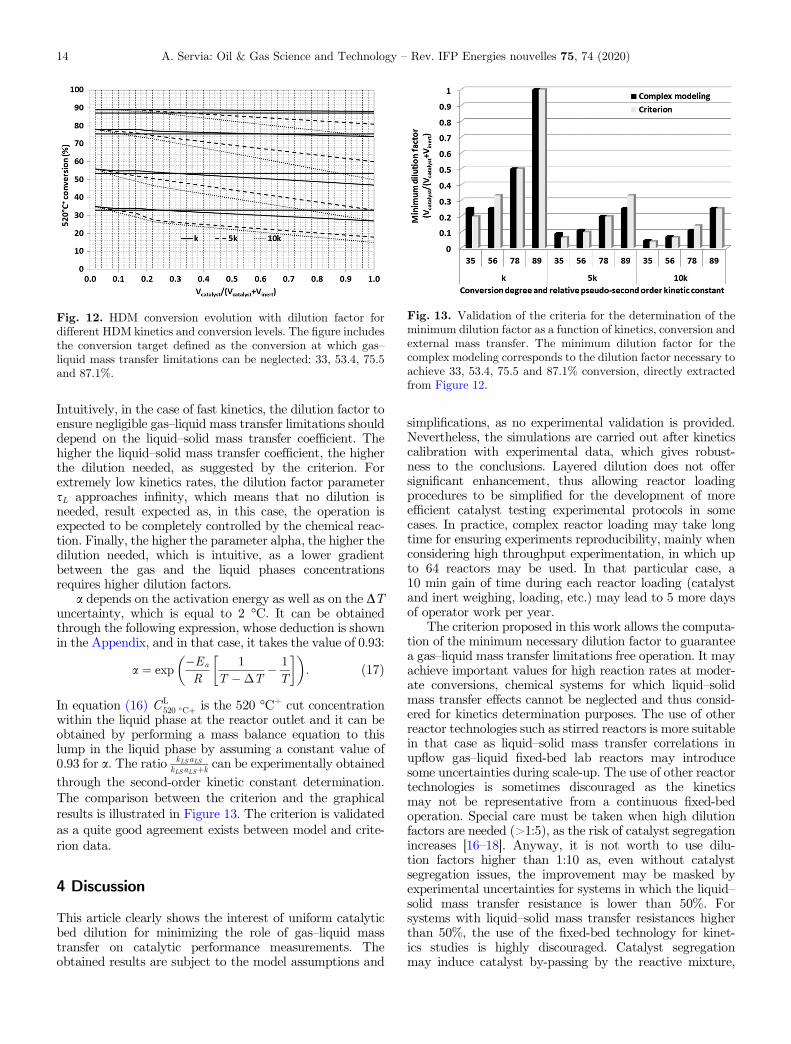
kLSaLSþk can be experimentally obtainedthrough the second-order kinetic constant determination.The comparison between the criterion and the graphicalresults is illustrated in Figure 13. The criterion is validatedas a quite good agreement exists between model and crite-rion data.
4 Discussion
This article clearly shows the interest of uniform catalyticbed dilution for minimizing the role of gas–liquid masstransfer on catalytic performance measurements. Theobtained results are subject to the model assumptions and
simplifications, as no experimental validation is provided.Nevertheless, the simulations are carried out after kineticscalibration with experimental data, which gives robust-ness to the conclusions. Layered dilution does not offersignificant enhancement, thus allowing reactor loadingprocedures to be simplified for the development of moreefficient catalyst testing experimental protocols in somecases. In practice, complex reactor loading may take longtime for ensuring experiments reproducibility, mainly whenconsidering high throughput experimentation, in which upto 64 reactors may be used. In that particular case, a10 min gain of time during each reactor loading (catalystand inert weighing, loading, etc.) may lead to 5 more daysof operator work per year.
The criterion proposed in this work allows the computa-tion of the minimum necessary dilution factor to guaranteea gas–liquid mass transfer limitations free operation. It mayachieve important values for high reaction rates at moder-ate conversions, chemical systems for which liquid–solidmass transfer effects cannot be neglected and thus consid-ered for kinetics determination purposes. The use of otherreactor technologies such as stirred reactors is more suitablein that case as liquid–solid mass transfer correlations inupflow gas–liquid fixed-bed lab reactors may introducesome uncertainties during scale-up. The use of other reactortechnologies is sometimes discouraged as the kineticsmay not be representative from a continuous fixed-bedoperation. Special care must be taken when high dilutionfactors are needed (>1:5), as the risk of catalyst segregationincreases [16–18]. Anyway, it is not worth to use dilu-tion factors higher than 1:10 as, even without catalystsegregation issues, the improvement may be masked byexperimental uncertainties for systems in which the liquid–solid mass transfer resistance is lower than 50%. Forsystems with liquid–solid mass transfer resistances higherthan 50%, the use of the fixed-bed technology for kinet-ics studies is highly discouraged. Catalyst segregationmay induce catalyst by-passing by the reactive mixture,
Fig. 12. HDM conversion evolution with dilution factor fordifferent HDM kinetics and conversion levels. The figure includesthe conversion target defined as the conversion at which gas–liquid mass transfer limitations can be neglected: 33, 53.4, 75.5and 87.1%.
Fig. 13. Validation of the criteria for the determination of theminimum dilution factor as a function of kinetics, conversion andexternal mass transfer. The minimum dilution factor for thecomplex modeling corresponds to the dilution factor necessary toachieve 33, 53.4, 75.5 and 87.1% conversion, directly extractedfrom Figure 12.
A. Servia: Oil & Gas Science and Technology – Rev. IFP Energies nouvelles 75, 74 (2020)14

leading to an important deviation between observed andintrinsic kinetics when radial dispersion is not sufficient toguarantee perfect mixing conditions in the radial direction.This deviation may be negative for positive reaction ordersand positive for negative reaction orders in gas–solid sys-tems, as suggested by Berger et al. [16]. Radial dispersionissues are likely to occur in systems presenting low liquidvelocities, such as for example the HDM reaction, or in reac-tors filled with small powder [30]. In these cases, hydrogenmay flow through preferential paths inside the reactor,and dispersion may not be sufficiently high to guarantee azero-radial-gradient operation. The model considers perfectmixing of the liquid phase in the radial direction, and as aresult, radial dispersion is expected to be lumped withinthe regressed kinetic constant. Since the velocity, reactordiameter and particle size remain unchanged betweensimulations of each dilution technique, the preferential pathsare expected to be the same in practice, and as a result, theconclusions drawn from the study are expected to be valid.One possible way of taking into account radial dispersionin the model is to consider the reactor as a 2D (two-dimensional) domain, and to stochastically determined if agiven point in the space is either filled with gas or liquid orwith catalyst or inert. Experimental porosity, phases hold-up, complete wetting conditions and bed dilution shouldbe accounting for as constraints during domain generation,in which mass balances equations coupled with a liquid-cell-liquid-cell radial dispersion coefficient are applied andsolved for determining the optimized dilution factor to min-imize gas–liquid mass transfer and radial dispersion effects.
5 Conclusion
Hydrodynamics and external mass transfer modeling inpresence of catalyst dilution has been used to evaluateand optimize lab reactor loading. Catalyst dilution repre-sents a versatile and robust solution for gas–liquid masstransfer intensification of gas–liquid fixed-bed lab reactorsand for ensuring a reliable experimental data scale-up.
Layered dilution, consisting on separating two consecu-tive catalytic beds by an inert material bed of the samesize as the catalyst, ensures the return to equilibrium condi-tions in the liquid phase. This technique is poorly effectivesince limiting species are severely depleted in the liquidphase immediately after entering a new catalytic bed. Theaddition of multiple beds does not improve gas–liquid masstransfer neither, and the same behavior is observed at thebeginning of each catalytic bed.
Uniform dilution, consisting on mixing both the catalystand the inert material with the same size as the catalyst in agiven proportion, substantially decreases gas–liquid masstransfer effects as the local species consumption is decreasedwhereas mass transfer is kept constant. Increasing dilutionfactor from 1:2 up to 1:4 rapidly decreases gas–liquid masstransfer limitations. Further improvement through theincrease in catalyst dilution may be masked by experimentaluncertainties.
Combinations of both types of dilution approaches canbe used for high conversion experiments (>70%) and with
chemical systems presenting either high reactions rates orhigh stoichiometric factors in presence of mass transferlimitations. Uniform dilution with a dilution factor of 1:4should be used in the first catalytic bed constituted by50% of the catalyst total volume, while a dilution factorof 1:2 is expected to be enough for the second catalyticbed. Both beds are separated by an inert bed in order toavoid beds mixture. The dilution of all the catalyst volumeby a factor of 1:4 is also expected to give good results frommass transfer limitations reduction considerations.
Screening of quite different catalytic formulations canbe carried out without dilution even if the differences inperformance are expected to be lower than the intrinsicones. Whereas dilution must be used during the screeningof similar catalytic formulations or when a given specifica-tion is required for candidate selection. In the same way,dilution must be used in kinetic studies for scale-uppurposes following the guidelines mentioned previously.
A new criterion is proposed in this work to determinethe minimum necessary dilution factor to neglect gas–liquidmass transfer limitations as a function of kinetics andexternal mass transfer and for different levels of conversion.The minimum value of the dilution factor increases with anincrease of the chemical reaction rate as gas–liquid masstransfer limitations become stronger in that case, whereasit decreases at higher conversions due to a dramatic dropof the kinetics rate near the reactor exit.
The effect of diluting catalyst with small powderthrough porosity filling is not considered in this worksince no mass transfer correlations are available for thisparticular case. Small particles are expected to locallychange flow pattern and related mass transfer, and theymay constitute a good solution for applications limited byliquid–solid mass transfer and/or thermal effects. Neverthe-less, the introduction of small powder should be avoided insystems presenting quite low liquid velocities, as the pres-ence of gas preferential paths is very likely in this type ofconfiguration [30].
Acknowledgments. I thank Dr. Matthieu Rolland, IFP Energiesnouvelles, for useful discussions and paper revision.
References
1 Grand View Research (2019) Refinery Catalysts Market Size,Share & Trends Analysis Report By Material (Zeolites,Chemical Compounds), By Application (FCC, Hydrocrack-ing, Catalytic Hydrotreating), By Region, And SegmentForecasts, 2019–2025, 172 p.
2 IEA (2018) The Future of Petrochemicals, InternationalEnergy Agency.
3 Hakeem A. (2019) High Throughput catalyst testing toenhance refinery operations, in: SPE Kuwait Oil & Gas Showand Conference, Society of Petroleum Engineers, 8 p.
4 Wehinger G.D., Kreitz B., Nagy A.J., Turek T. (2020)Characterization of a modular Temkin reactor with exper-iments and computational fluid dynamics simulations,Chem. Eng. J. 389, 124342. doi: 10.1016/j.cej.2020.124342
5 Figueiredo J.L. (1982) Progress in catalyst deactivation,Springer, Dordrecht.
A. Servia: Oil & Gas Science and Technology – Rev. IFP Energies nouvelles 75, 74 (2020) 15

6 Mederos F.S., Ancheyta J., Chen J. (2009) Review on criteriato ensure ideal behaviors in trickle-bed reactors, Appl. Catal.A Gen. 355, 1–19.
7 Sie S.T. (1996) Miniaturization of hydroprocessing catalysttesting systems: Theory and practice, AIChE J. 42, 12,3498–3507.
8 Mears D.E. (1971) The role of axial dispersion in trickle-flowlaboratory reactors, Chem. Eng. Sc. 26, 1361–1366.
9 Gierman H. (1988) Design of laboratory hydrotreatingreactors: Scaling down of trickle-flow reactors, Appl. Catal.43, 277–286.
10 Thiele E.W. (1939) Relation between catalytic activity andsize of particle, Ind. Eng. Chem. Res. 31, 916–920.
11 Mears D.E. (1971) Tests for transport limitations in exper-imental catalytic reactors, Ind. Eng. Chem. Process. Des.Dev. 10, 4, 541–547.
12 Rolland M., Fonte C. (2015) Incertitude induced by testing asmall number of catalytic pellets in fixed beds, Chem. Eng.Sci. 138, 698–705.
13 Raynal L., Augier F., Bazer-Bachi F., Haroun Y., Pereira daFonte C. (2016) CFD applied to process development in theoil and gas industry – a review, Oil Gas Sci. Technol. - Rev.IFP Energies nouvelles 71, 42.
14 Dixon A.G., Nijemeisland M. (2001) CFD as a design tool forfixed-bed reactors, Ind. Eng. Chem. Res 40, 23, 5246–5254.
15 Dorai F., Teixeira C.M., Rolland M., Climent E., Marcoux M.,Wachs A. (2015) Fully resolved simulations of the flowthrough a packed bed of cylinders: Effect of size distribution,Chem. Eng. Sci. 129, 180–192.
16 Berger R.J., Perez-Ramirez J., Kapteijn F., Moulijn J.A.(2002) Catalyst performance testing. Radial and axialdispersion related to dilution in fixed-bed laboratory reac-tors, Appl. Catal. A Gen. 227, 321–333.
17 Berger R.J., Perez-Ramirez J., Kapteijn F., Moulijn J.A. (2002)Catalyst performance testing: the influence of catalyst beddilution on the conversion observed, Chem. Eng. J. 90, 173–183.
18 Berger R.J., Perez-Ramirez J., Kapteijn F., Moulijn J.A.(2002) Catalyst performance testing: bed dilution revisited,Chem. Eng. Sci. 57, 4921–4932.
19 Taniewski M., Lachowicz A., Skutil K., Czechowicz D.(1996) The effect of dilution of the catalyst bed on its heat-transfer characteristics in oxidative coupling of methane,Chem. Eng. Sci. 51, 18, 4271–4278.
20 Rolland M. (2014) Des limites à la reduction d’échelle enréacteur de test catalytique en lit fixe ? PhD thesis,Université Claude Bernard – Lyon I, Lyon, 214 p.
21 Khadilkar M.R., Wu Y.X., Al-Dahhan M.H., DudukovićM.P.,Colakyan M. (1996) Comparison of trickle-bed and upflowreactor performance at high pressure: Model predictions andexperimental observations, Chem. Eng. Sci. 51, 10, 2139–2148.
22 Goto S., Levec J., Smith J.M. (1975) Mass transfer in packedbeds with two-phase flow, Ind. Eng. Chem. Process. Des.Dev. 14, 4, 473–478.
23 Saada N.Y. (1972) Assessment of interfacial area in co-currenttwo-phase flow in packed beds, Chim. Ind. Génie chimique105, 1415.
24 Larachi F., Belfares L., Iliuta I., Grandjean B.P.A. (2003)Heat and mass transfer in cocurrent gas-liquid packed beds.Analysis, recommendations and new correlations, Ind. Eng.Chem. Res. 42, 222–242.
25 Belfares L., Cassanello M.C., Grandjean B.P.A., Larachi F.(2001) Liquid back-mixing in packed-bubble column reac-tors: a state-of-the-art correlation, Catal. Today 64, 321–332.
26 Bensetiti Z., Larachi F., Grandjean B.P.A. (1997) Liquidsaturation in cocurrent upflow fixed-bed reactors: a state-of-the-art correlation, Chem. Eng. Sci. 52, 4239–4247.
27 Poling B.E., Prausnitz J.M., O’Connell J.P. (2000) Theproperties of Gases and Liquids, 5th edn., McGraw-HillProfessional.
28 Toppinen S., Salmi T., Rantakylae T.K., Aittamaa J. (1996)Kinetics of the Liquid-Phase Hydrogenation of Benzene andSome Monosubstituted Alkylbenzenes over a Nickel Cata-lyst, Ind. Eng. Chem. Res. 35, 1824–1833.
29 Ranz W.E., Marshall W.R. (1952) Evaporation from Drops,Chem. Eng. Prog. 48, 141–146, 173–180.
30 Moulijn J.A., Makkee M., Berger R.J. (2016) Catalysttesting in multiphase micro-packed-bed reactors; criterionfor radial mass transport, Catal. Today 259, 354–359.
Appendix
A.1 Criterion deduction
For a given reactor slice, the gas–liquid flux of the limitingspecies must be equal to the liquid–solid and to the chemicalflux, as suggested by the following equation:
kLaCG
H2
H� a
CGH2
H
!¼ sLkLSaLS a
CGH2
H� CF
H2
!
¼ sLesqsmH2kCFH2CF
520�Cþ : ðA:1Þ
The concentration in the film surrounding the catalyst canbe determined through the equality between the liquid–solid and the chemical flux, leading to the followingexpression:
CFH2
¼ kLSaLSCG
H2H a
kLSaLS þ esqskmH2CF520�Cþ
: ðA:2Þ
Introducing equation (A.2) in the first equality of equation(A.1) and neglecting external mass transfer limitations forthe liquid phase reactant yields the criterion developed inthis work for the determination of the minimum necessarydilution factor allowing gas–liquid mass transfer limitationsto be neglected:
sL ¼ kLa
kLSaLSa
1�a
� �1� kLSaLS
kLSaLSþesqskmH2CL520�Cþ
� � ðA:3Þ
“a” can be calculated by performing a mass balance to the520 �C+ cut in the liquid phase, as shown in equation (A.4):
ln 1� Xð Þ ¼ � k Tð ÞLHSV
aCG
H2
Hesqs ¼ � k T ��Tð Þ
LHSVCG
H2
Hesqs:
ðA:4ÞThe second equality of the previous equation allows thecomputation of a:
a ¼ k T ��Tð Þk Tð Þ ¼ exp �Ea
R1
T ��T� 1T
� � �: ðA:5Þ
A. Servia: Oil & Gas Science and Technology – Rev. IFP Energies nouvelles 75, 74 (2020)16