using needs assessment to drive decision · pdf fileusing needs assessment to drive decision...
TRANSCRIPT
Using Needs Assessment toUsing Needs Assessment toDrive Decision MakingDrive Decision Making
Jim O’Neill, Ph.D.Jim O’Neill, Ph.D.Madonna UniversityMadonna University
EE--mail: mail: [email protected]@madonna.edu

Learning ObjectivesLearning Objectives
Describe with concept of need assessment and how it Describe with concept of need assessment and how it applies to SDFS programmingapplies to SDFS programming
Identify and learn to access various types of local data Identify and learn to access various types of local data relevant to SDFS prevention effortsrelevant to SDFS prevention efforts
Interpret and summarize data into key findingsInterpret and summarize data into key findings
Consider how to prioritize key findings for SDFSConsider how to prioritize key findings for SDFS
Use prioritized key findings to develop SDFS outcome Use prioritized key findings to develop SDFS outcome goalsgoals
Anticipate and plan to address common roadblocks in Anticipate and plan to address common roadblocks in effective SDFS needs assessment and goal developmenteffective SDFS needs assessment and goal development
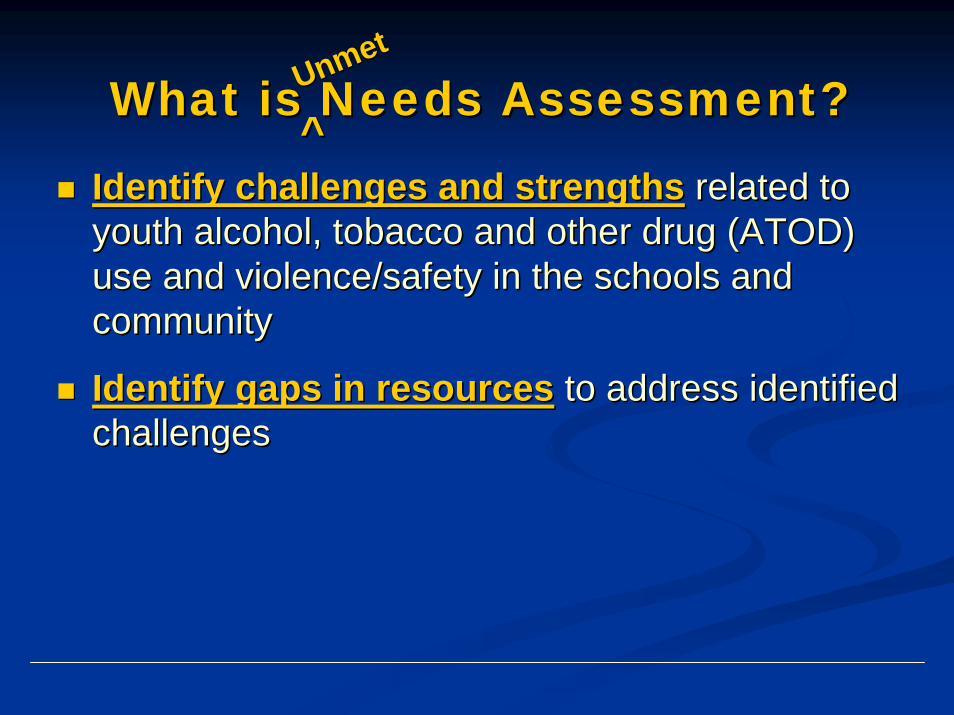
What is Needs Assessment?What is Needs Assessment?
Identify challenges and strengthsIdentify challenges and strengths related to related to youth alcohol, tobacco and other drug (ATOD) youth alcohol, tobacco and other drug (ATOD) use and violence/safety in the schools and use and violence/safety in the schools and communitycommunity
Identify gaps in resourcesIdentify gaps in resources to address identified to address identified challengeschallenges
UnmetUnmet
^̂
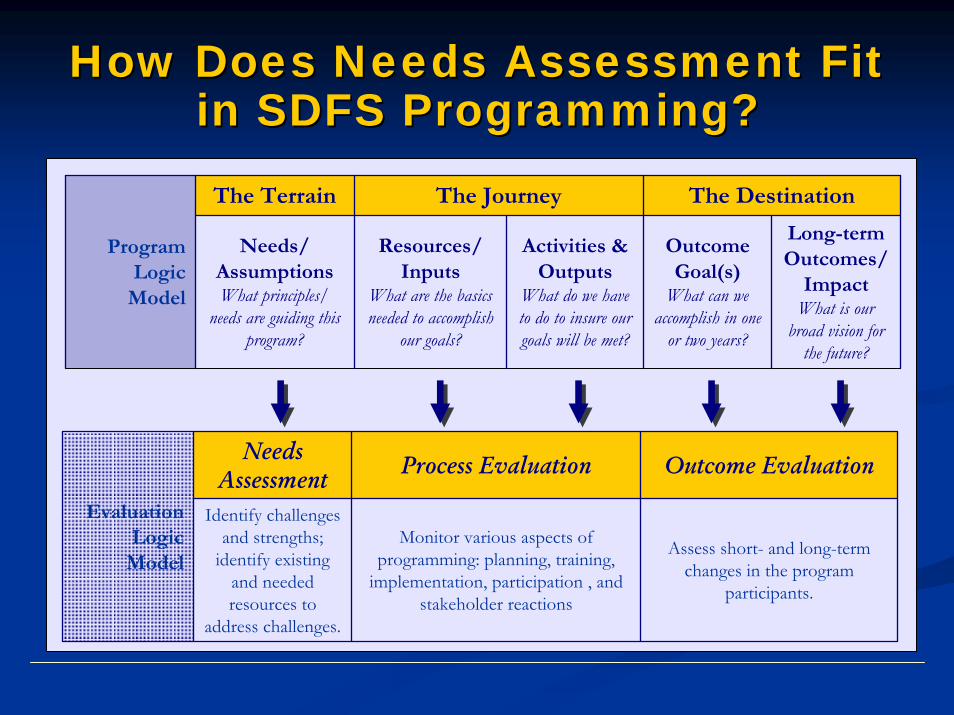
How Does Needs Assessment Fit How Does Needs Assessment Fit in SDFS Programming?in SDFS Programming?
The Terrain The Journey The Destination
Needs/ AssumptionsWhat principles/
needs are guiding this program?
Resources/ Inputs
What are the basics needed to accomplish
our goals?
Activities & Outputs
What do we have to do to insure our goals will be met?
Outcome Goal(s)
What can we accomplish in one
or two years?
Long-term Outcomes/
ImpactWhat is our
broad vision for the future?
Program Logic
Model
Assess short- and long-term changes in the program
participants.
Monitor various aspects of programming: planning, training,
implementation, participation , and stakeholder reactions
Identify challenges and strengths;
identify existing and needed resources to
address challenges.
Outcome EvaluationProcess EvaluationNeeds Assessment
EvaluationLogic
Model

What Does Good Needs What Does Good Needs Assessment Look Like?Assessment Look Like?
Maximum clarityMaximum clarity in understanding challenges in understanding challenges and strengths and identifying gaps in resources and strengths and identifying gaps in resources to adequately address challengesto adequately address challenges
AAA
BBB

Needs Assessment: Gaining Needs Assessment: Gaining Maximum ClarityMaximum Clarity
Risk Risk BehaviorsBehaviors
Risk Risk FactorsFactors
ProtectiveProtectiveFactorsFactors
Contextual Contextual FactorsFactors
What?What?What?
Why?Why?Why?Why Here?WhyWhy Here?Here?

Types of Local Data for SDFSTypes of Local Data for SDFS
Risk behaviorsRisk behaviors are behaviors that:are behaviors that:contribute to the leading causes of morbidity and contribute to the leading causes of morbidity and mortality among youth and adults, mortality among youth and adults, often are established during youth, often are established during youth, extend into adulthood, extend into adulthood, are interrelated, and are interrelated, and are preventable are preventable
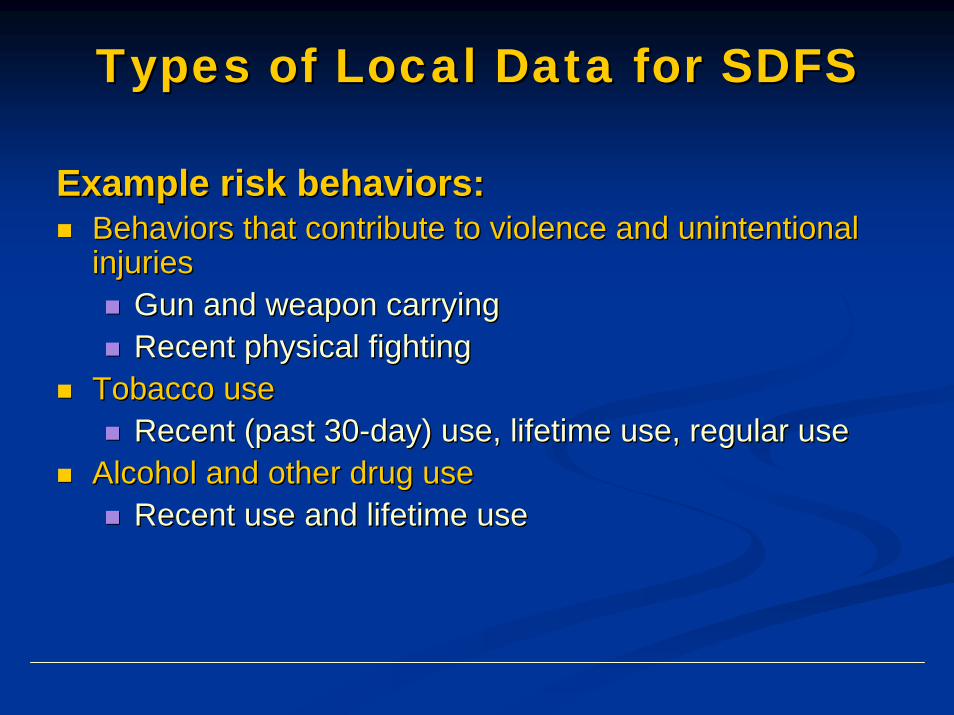
Example risk behaviors:Example risk behaviors:Behaviors that contribute to violence and unintentional Behaviors that contribute to violence and unintentional injuriesinjuries
Gun and weapon carryingGun and weapon carryingRecent physical fightingRecent physical fighting
Tobacco use Tobacco use Recent (past 30Recent (past 30--day) use, lifetime use, regular useday) use, lifetime use, regular use
Alcohol and other drug useAlcohol and other drug useRecent use and lifetime useRecent use and lifetime use
Types of Local Data for SDFSTypes of Local Data for SDFS
Types of Local Data for SDFSTypes of Local Data for SDFS
What risk behaviors seem most What risk behaviors seem most prevalent in your district/community?prevalent in your district/community?
How do you know?How do you know?

Risk factorsRisk factorsAny circumstances that increase youths’ likelihood of Any circumstances that increase youths’ likelihood of engaging in risky behaviors.engaging in risky behaviors.
IndividualIndividual
Family and PeersFamily and Peers
SchoolSchool
CommunityCommunity
Types of Local Data for SDFSTypes of Local Data for SDFS
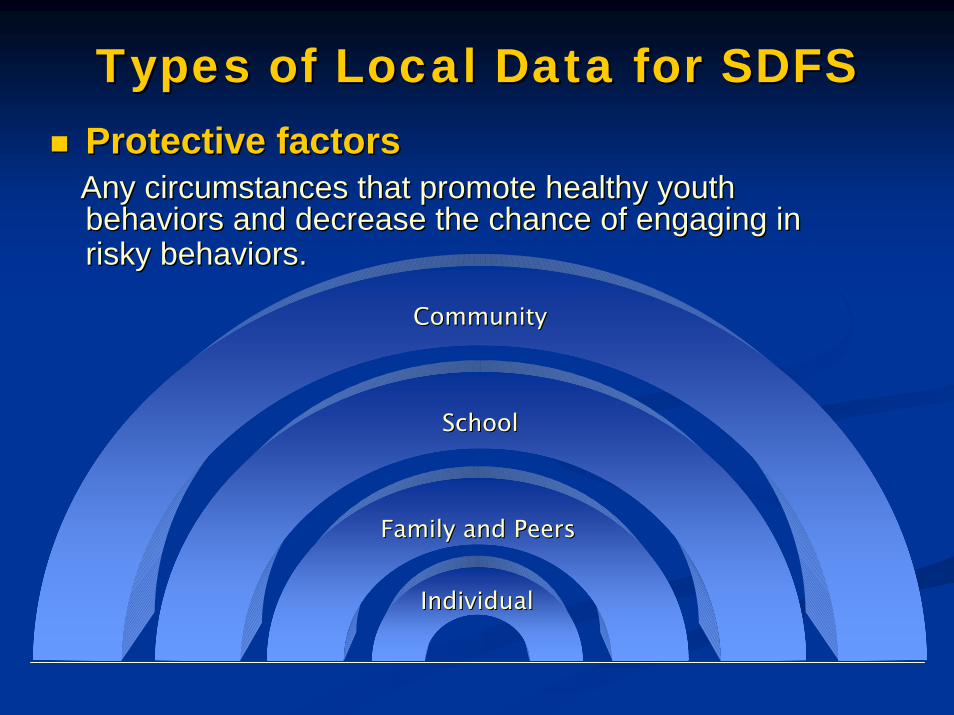
Protective factorsProtective factorsAny circumstances that promote healthy youth Any circumstances that promote healthy youth behaviors and decrease the chance of engaging in behaviors and decrease the chance of engaging in risky behaviors.risky behaviors.
IndividualIndividual
Family and PeersFamily and Peers
SchoolSchool
CommunityCommunity
Types of Local Data for SDFSTypes of Local Data for SDFS

What risk and protective factors seem What risk and protective factors seem connected to the prevalent risk connected to the prevalent risk behaviors in your district/community?behaviors in your district/community?
How do you know?How do you know?
Types of Local Data for SDFSTypes of Local Data for SDFS
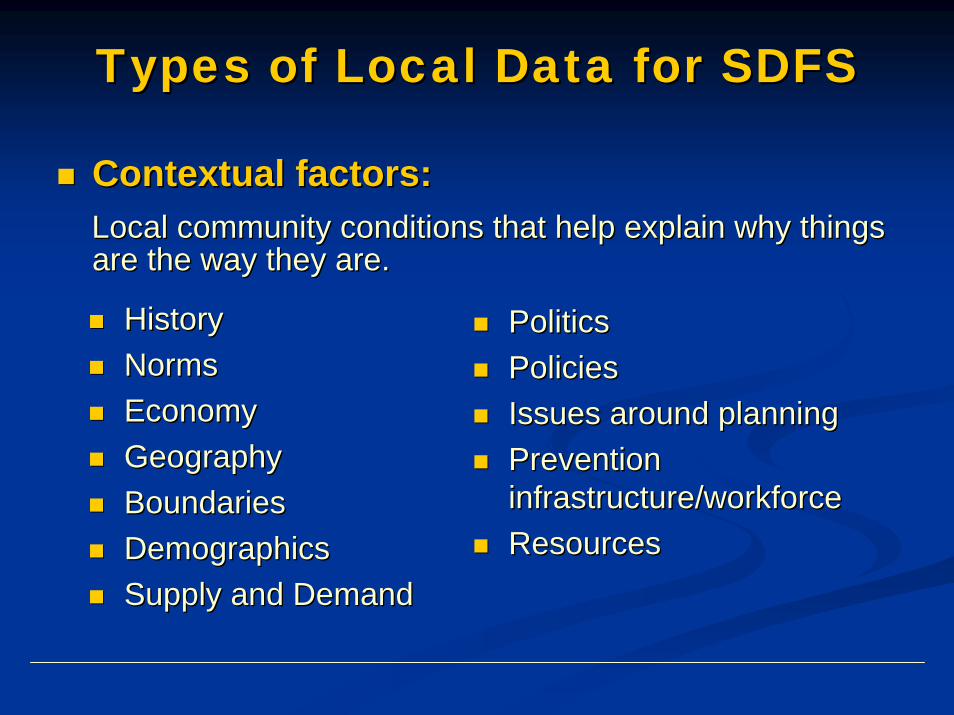
Contextual factors:Contextual factors:Local community conditions that help explain why things Local community conditions that help explain why things are the way they are.are the way they are.
HistoryHistoryNormsNormsEconomy Economy GeographyGeographyBoundariesBoundariesDemographicsDemographicsSupply and DemandSupply and Demand
PoliticsPoliticsPoliciesPoliciesIssues around planningIssues around planningPrevention Prevention infrastructure/workforceinfrastructure/workforceResourcesResources
Types of Local Data for SDFSTypes of Local Data for SDFS
What contextual factors seem What contextual factors seem connected to the prevalent risk/ connected to the prevalent risk/ protective factors in your district/ protective factors in your district/ community?community?
How do you know?How do you know?
Types of Local Data for SDFSTypes of Local Data for SDFS
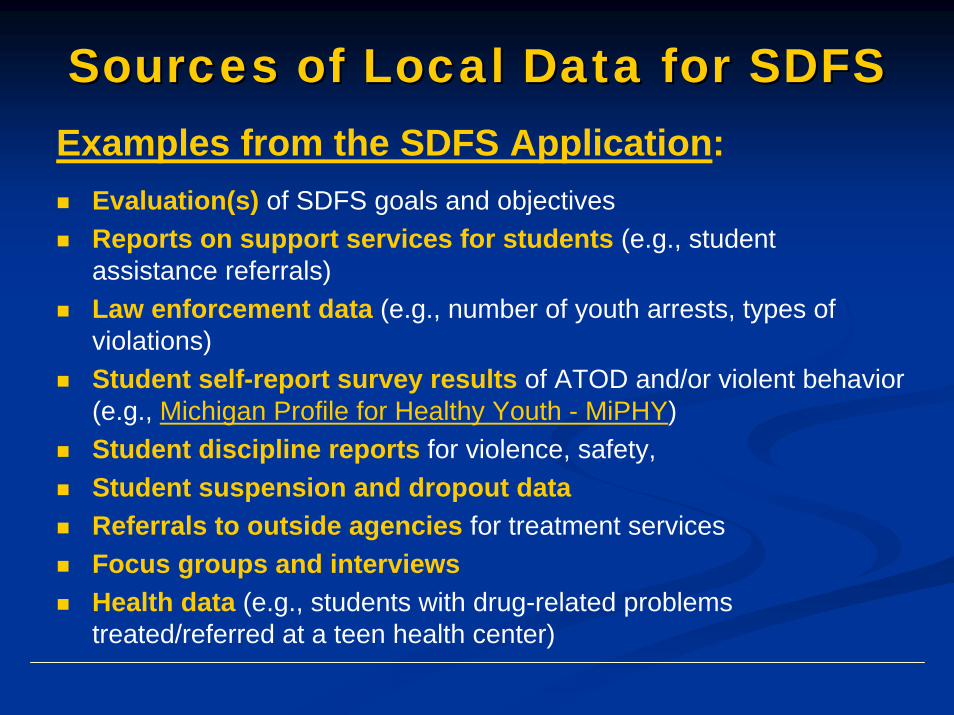
Examples from the SDFS Application:Evaluation(s) of SDFS goals and objectivesReports on support services for students (e.g., student assistance referrals)Law enforcement data (e.g., number of youth arrests, types of violations)Student self-report survey results of ATOD and/or violent behavior (e.g., Michigan Profile for Healthy Youth - MiPHY)Student discipline reports for violence, safety, Student suspension and dropout dataReferrals to outside agencies for treatment services Focus groups and interviewsHealth data (e.g., students with drug-related problems treated/referred at a teen health center)
Sources of Local Data for SDFSSources of Local Data for SDFS
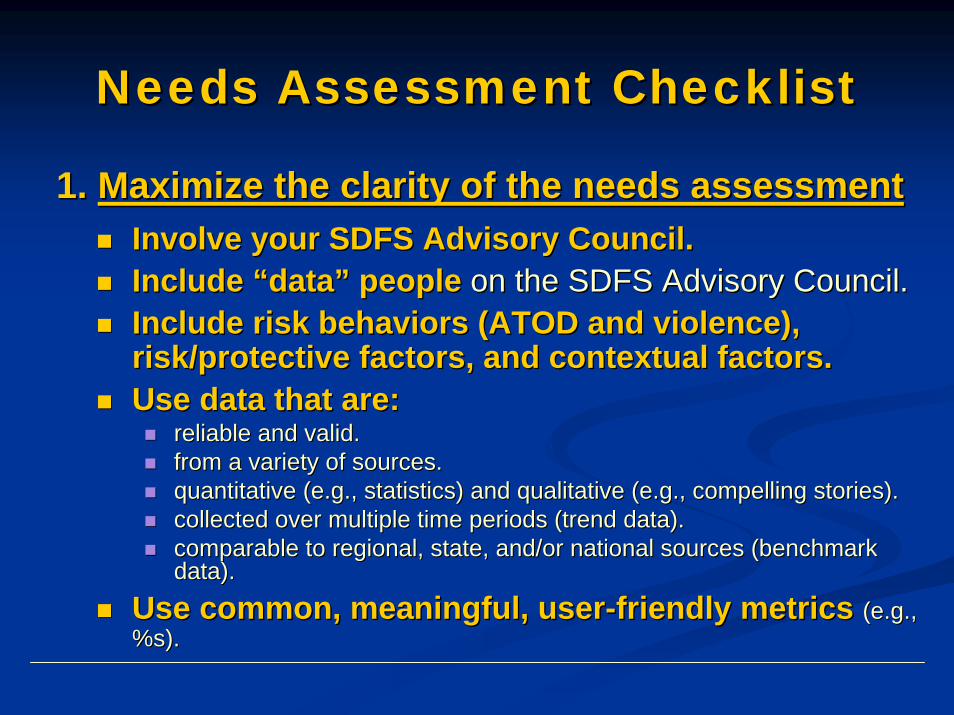
Needs Assessment ChecklistNeeds Assessment Checklist
Involve your SDFS Advisory Council.Involve your SDFS Advisory Council.Include “data” peopleInclude “data” people on the SDFS Advisory Council.on the SDFS Advisory Council.Include risk behaviors (ATOD and violence), Include risk behaviors (ATOD and violence), risk/protective factors, and contextual factors.risk/protective factors, and contextual factors.Use data that are:Use data that are:
reliable and valid.reliable and valid.from a variety of sources.from a variety of sources.quantitative (e.g., statistics) and qualitative (e.g., compellinquantitative (e.g., statistics) and qualitative (e.g., compelling stories).g stories).collected over multiple time periods (trend data).collected over multiple time periods (trend data).comparable to regional, state, and/or national sources (benchmarcomparable to regional, state, and/or national sources (benchmark k data).data).
Use common, meaningful, userUse common, meaningful, user--friendly metricsfriendly metrics (e.g., (e.g., %s). %s).
1. 1. Maximize the clarity of the needs assessmentMaximize the clarity of the needs assessment

Identify one risk behavior problem at a time.Identify one risk behavior problem at a time.Avoid blame. Avoid blame. Avoid naming specific solutions. Avoid naming specific solutions. Define the problem by the Define the problem by the behaviorsbehaviors and and conditionsconditions that affect it. that affect it. Reflect school/community concerns as heard Reflect school/community concerns as heard during the assessment process.during the assessment process.Keep good notes.Keep good notes.
Needs Assessment ChecklistNeeds Assessment Checklist
2. 2. Keep the process focused and productiveKeep the process focused and productive
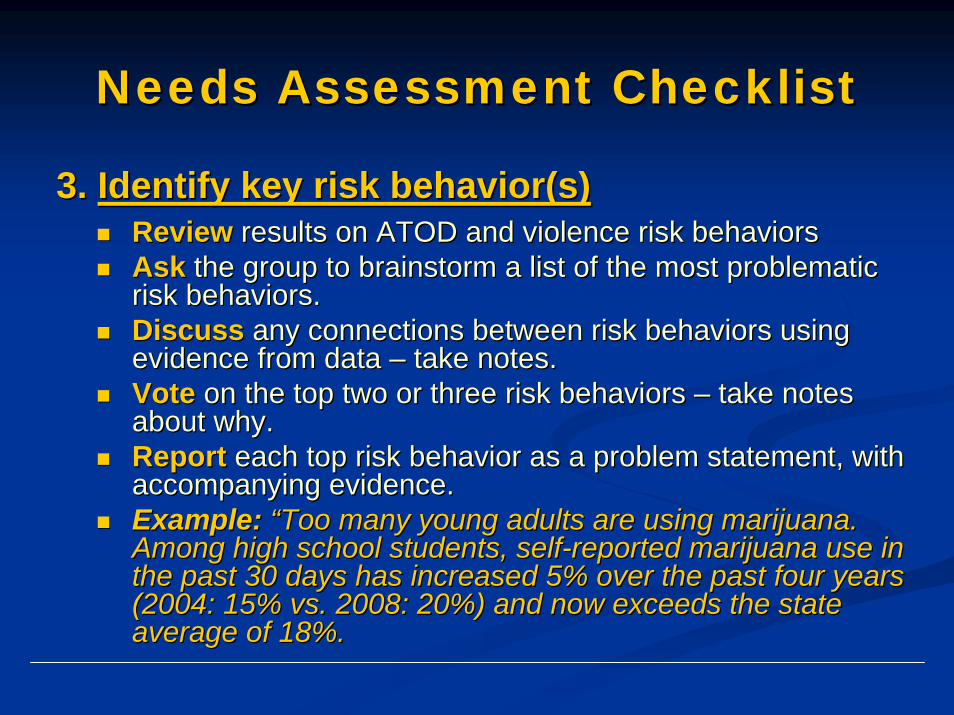
Review Review results on ATOD and violence risk behaviorsresults on ATOD and violence risk behaviorsAsk Ask the group to brainstorm a list of the group to brainstorm a list of the most problematic the most problematic risk behaviors.risk behaviors.Discuss Discuss any connections between risk behaviors using any connections between risk behaviors using evidence from data evidence from data –– take notes.take notes.Vote Vote on the top two or three risk behaviors on the top two or three risk behaviors –– take notes take notes about why.about why.Report Report each top risk behavior as a problem statement, with each top risk behavior as a problem statement, with accompanying evidence.accompanying evidence.Example:Example: “Too many young adults are using marijuana. “Too many young adults are using marijuana. Among high school students, selfAmong high school students, self--reported marijuana use in reported marijuana use in the past 30 days has increased 5% over the past four years the past 30 days has increased 5% over the past four years (2004: 15% vs. 2008: 20%) and now exceeds the state (2004: 15% vs. 2008: 20%) and now exceeds the state average of 18%.average of 18%.
Needs Assessment ChecklistNeeds Assessment Checklist
3. 3. Identify key risk Identify key risk behavior(sbehavior(s))

ReviewReview available data on risk and protective factors.available data on risk and protective factors.WriteWrite the key risk behavior in the middle of a large piece of the key risk behavior in the middle of a large piece of flip chart paper. Use a separate page for each risk behavior. flip chart paper. Use a separate page for each risk behavior. AskAsk the group to brainstorm a list of risk/protective factors the group to brainstorm a list of risk/protective factors linked to the risk linked to the risk behavior(sbehavior(s) by asking, ) by asking, “But why (this risk “But why (this risk behavior)?” behavior)?” ListList the risk/protective factors on the flip chart next to the the risk/protective factors on the flip chart next to the risk behavior.risk behavior.VoteVote on the top two or three risk/protective factors. Take on the top two or three risk/protective factors. Take notes about why.notes about why.
Needs Assessment ChecklistNeeds Assessment Checklist
4. 4. For each risk behavior, answer the question, For each risk behavior, answer the question, “But why (this risk behavior)?”“But why (this risk behavior)?”

WriteWrite a summary of the data, including statistics, associated a summary of the data, including statistics, associated with the top risk/protective factors.with the top risk/protective factors.Example:Example: “High levels of marijuana use among high school “High levels of marijuana use among high school students seems linked to their perceptions of easy access to students seems linked to their perceptions of easy access to marijuana and low perceived harm in using marijuana. Both marijuana and low perceived harm in using marijuana. Both of these risk factors were higher for high school students in of these risk factors were higher for high school students in 2008 (perceived easy access: 35%; perceived harm: 40%) 2008 (perceived easy access: 35%; perceived harm: 40%) than in 2004 (perceived easy access: 45%; perceived harm: than in 2004 (perceived easy access: 45%; perceived harm: 50%).50%).
Needs Assessment ChecklistNeeds Assessment Checklist
4. 4. (continued) (continued) “But why (this risk behavior)?”“But why (this risk behavior)?”

ReviewReview available data on contextual factors.available data on contextual factors.UseUse the results of the “But why?” exercise and select an the results of the “But why?” exercise and select an identified risk/protective factor.identified risk/protective factor.AskAsk the group to brainstorm contextual factors linked to the the group to brainstorm contextual factors linked to the risk/protective factor by asking, “But why here in our risk/protective factor by asking, “But why here in our community?”community?”ListList the contextual factors on the flip chart next to the the contextual factors on the flip chart next to the risk/protective factor.risk/protective factor.VoteVote on the top two or three contextual factors. Take notes on the top two or three contextual factors. Take notes about why.about why.
Needs Assessment ChecklistNeeds Assessment Checklist
5. 5. For each risk/protective factor, answer the For each risk/protective factor, answer the question,question, “But why here (in our community)?”“But why here (in our community)?”

WriteWrite a summary of the data, including statistics, associated a summary of the data, including statistics, associated with the top contextual factors.with the top contextual factors.Example:Example: “High school students perceptions of easy access to “High school students perceptions of easy access to marijuana seem connected to a lot of drug dealers who are not marijuana seem connected to a lot of drug dealers who are not students in the district, but have been seen by students and students in the district, but have been seen by students and staff near afterstaff near after--school events and who have made friends with school events and who have made friends with several of our district students. Our students’ perceptions of several of our district students. Our students’ perceptions of little or no harm from using marijuana can be attributed to little or no harm from using marijuana can be attributed to several factors: (a) less emphasis on the dangers of marijuana several factors: (a) less emphasis on the dangers of marijuana use in our new health education curriculum (vs. the old use in our new health education curriculum (vs. the old curriculum), (b) a large influx of new students in the district curriculum), (b) a large influx of new students in the district (over 100) who have not been exposed in previous grades to (over 100) who have not been exposed in previous grades to any health lessons about the dangers of marijuana use, and (c) any health lessons about the dangers of marijuana use, and (c) a lower percentage of new students who felt connected to a lower percentage of new students who felt connected to school (35%) compared to students in the district for at least school (35%) compared to students in the district for at least two years (58%). two years (58%).
Needs Assessment ChecklistNeeds Assessment Checklist
5. 5. (continued) (continued) “But why here (in our community)?”“But why here (in our community)?”

Importance:Importance: How important is this behavior to key How important is this behavior to key stakeholders?stakeholders?Impact:Impact: How much will a change in this risk behavior How much will a change in this risk behavior improve the health and safety of our youth?improve the health and safety of our youth?Effort:Effort: How much in human and physical resources and How much in human and physical resources and expertise is needed to reduce this risk behavior among our expertise is needed to reduce this risk behavior among our youth?youth?Collaboration:Collaboration: Can the behavior be addressed more Can the behavior be addressed more effectively by having other sectors (e.g., health community) effectively by having other sectors (e.g., health community) lead or collaborate in the effort?lead or collaborate in the effort?
Needs Assessment ChecklistNeeds Assessment Checklist
6. 6. Determine which risk Determine which risk behavior(sbehavior(s) will be the ) will be the focus of your SDFS grant by considering:focus of your SDFS grant by considering:

Zooming in on the SDFS grantZooming in on the SDFS grant
Write Needs Assessment SummaryWrite Needs Assessment Summary
Develop Outcome Develop Outcome Goal(sGoal(s))
Select Select Program(sProgram(s))
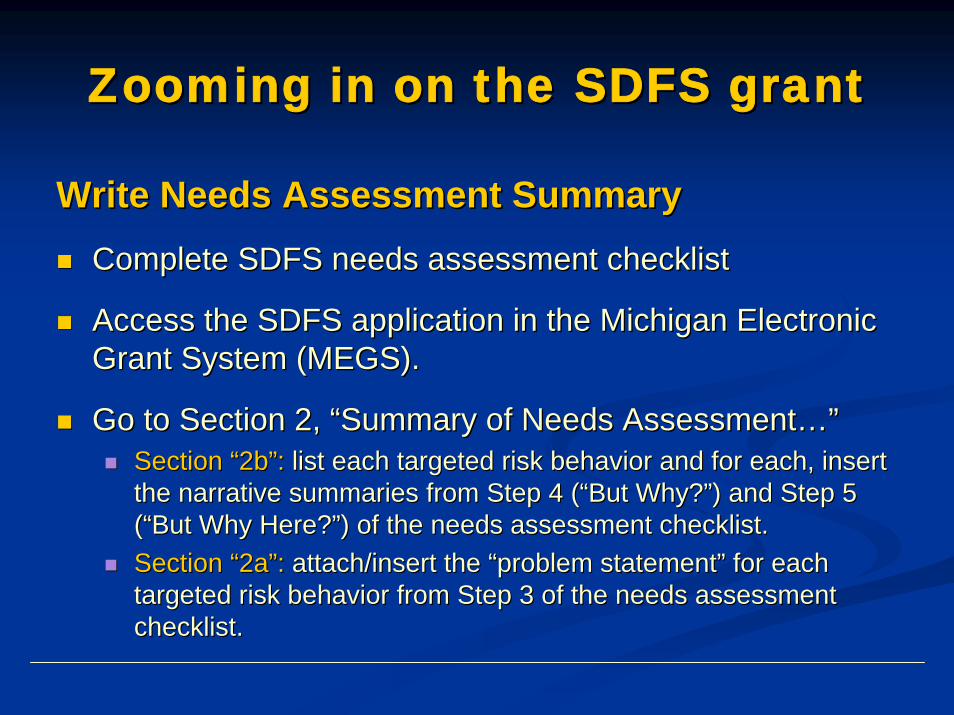
Zooming in on the SDFS grantZooming in on the SDFS grant
Write Needs Assessment SummaryWrite Needs Assessment SummaryComplete SDFS needs assessment checklistComplete SDFS needs assessment checklist
Access the SDFS application in the Michigan Electronic Access the SDFS application in the Michigan Electronic Grant System (MEGS).Grant System (MEGS).
Go to Section 2, “Summary of Needs Assessment…”Go to Section 2, “Summary of Needs Assessment…”Section “2b”:Section “2b”: list each targeted risk behavior and for each, insert list each targeted risk behavior and for each, insert the narrative summaries from Step 4 (“But Why?”) and Step 5 the narrative summaries from Step 4 (“But Why?”) and Step 5 (“But Why Here?”) of the needs assessment checklist.(“But Why Here?”) of the needs assessment checklist.Section “2a”:Section “2a”: attach/insert the “problem statement” for each attach/insert the “problem statement” for each targeted risk behavior from Step 3 of the needs assessment targeted risk behavior from Step 3 of the needs assessment checklist.checklist.
Zooming in on the SDFS grantZooming in on the SDFS grant
Develop Outcome Develop Outcome Goal(sGoal(s) ) -- See handout1. What constitutes an outcome goal for the SDFS Program?
2. Why must the outcome goal include so much information?
3. Does each participating local education agency (LEA) need an outcome goal?
4. Is a consortium required to have an outcome goal?
5. Are nonpublic schools required to have needs assessment, goals, and evaluation?
6. How many outcome goals are required? Do I have to have outcome goals for drug use prevention and violence prevention?

Zooming in on the SDFS grantZooming in on the SDFS grant
Develop Outcome Develop Outcome Goal(sGoal(s) ) -- See handout7. I’m not sure what percentage of change expected in
attitude/behavior. What should I do?
8. How broad/narrow should my target population be?
9. What should I consider in selecting a program?
10. What types of measures can I use to assess outcomes?
11. Where can I find measures to assess my outcome goal(s)?
12. Can I develop my own measure or customize an existing measure?

Questions?Questions?