using refundable tax credits to help low- income taxpayers by jon forman alfred p. murrah professor...
TRANSCRIPT

Using Refundable Tax Credits to Help Low-
income Taxpayersby Jon Forman
Alfred P. Murrah Professor of LawUniversity of Oklahoma
Norman, Oklahoma& ATAX Fellow, UNSW
University of MelbourneMelbourne, Australia
August 16, 2011

2
Figure 1. Share of Household Income
0
10
20
30
40
50
60
Poorest 20% Middle 20% Richest 20%
Per
cent
Free market After taxes & transfers
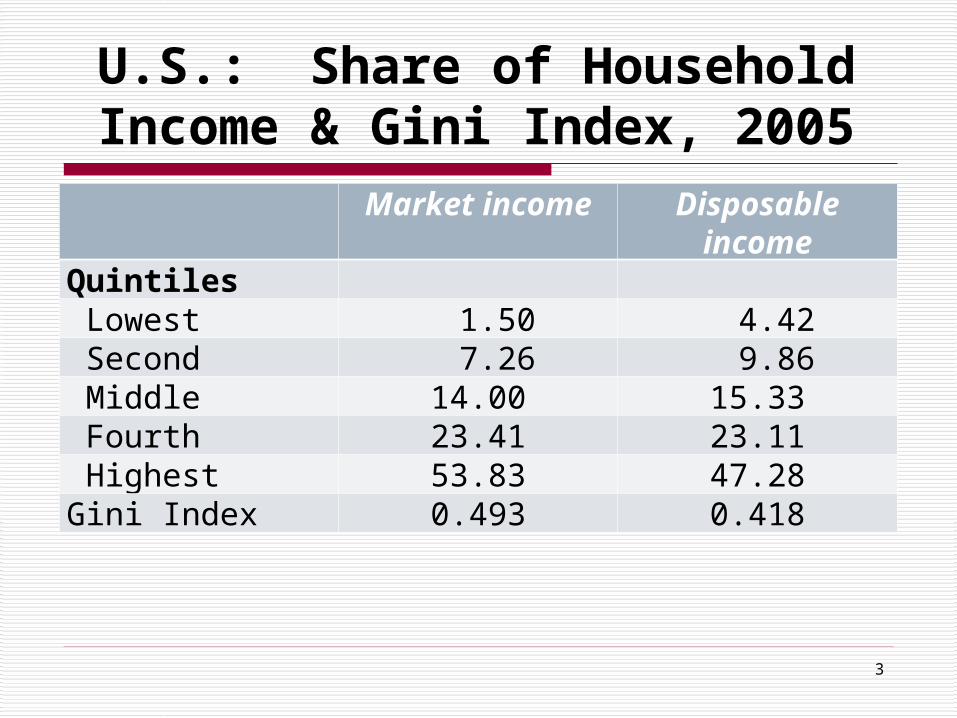
U.S.: Share of Household Income & Gini Index, 2005
Market income Disposable incomeQuintiles Lowest 1.50 4.42 Second 7.26 9.86 Middle 14.00 15.33 Fourth 23.41 23.11 Highest 53.83 47.28Gini Index 0.493 0.418
3

Rising Inequality
4

Inequality and Redistribution
CountryGini
Before Gini
After
Poverty Before
(50% of median
income)
Poverty After
(50% of median
income)
Tax %
GDP
Social Spending
%GDP
Australia 0.46 0.3 28.6 12.4 30.6 17.1
Canada 0.44 0.32 23.1 12.0 33.3 16.5
Mexico n/a 0.47 21.0 18.4 20.6 7.0
Sweden 0.43 0.23 26.7 5.3 49.1 29.4United Kingdom 0.46 0.34 26.3 8.3 37.1 21.3
United States 0.46 0.38 26.3 17.1 28.0 15.9OECD 0.45 0.31 26.4 10.6 35.9 20.5
5
6
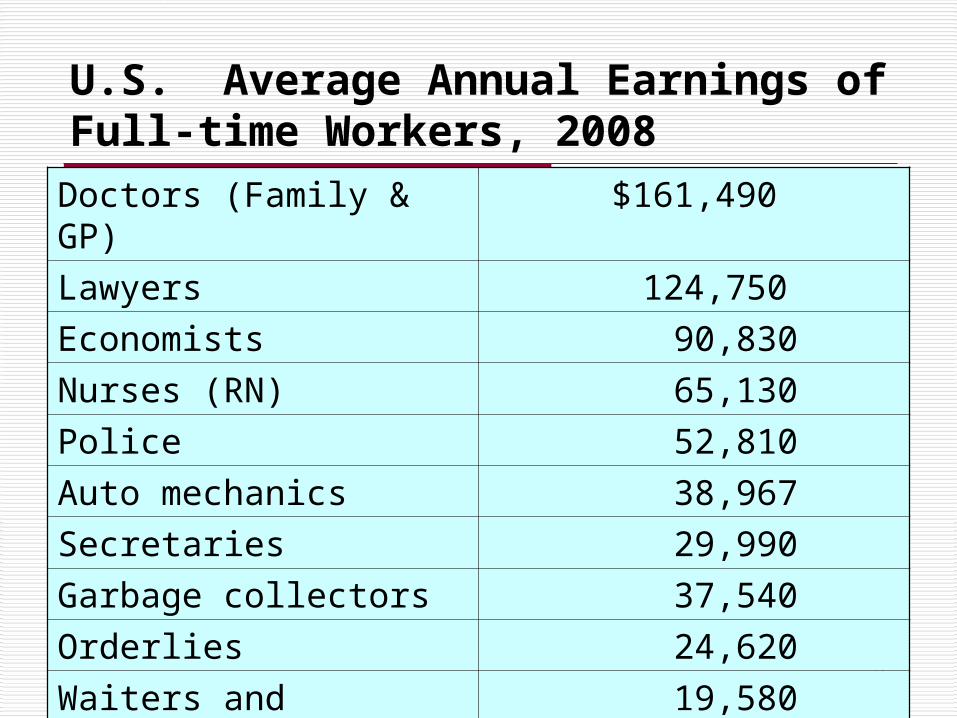
U.S. Average Annual Earnings of Full-time Workers, 2008
Doctors (Family & GP) $161,490
Lawyers 124,750
Economists 90,830
Nurses (RN) 65,130
Police 52,810
Auto mechanics 38,967
Secretaries 29,990
Garbage collectors 37,540
Orderlies 24,620
Waiters and waitresses 19,580
7
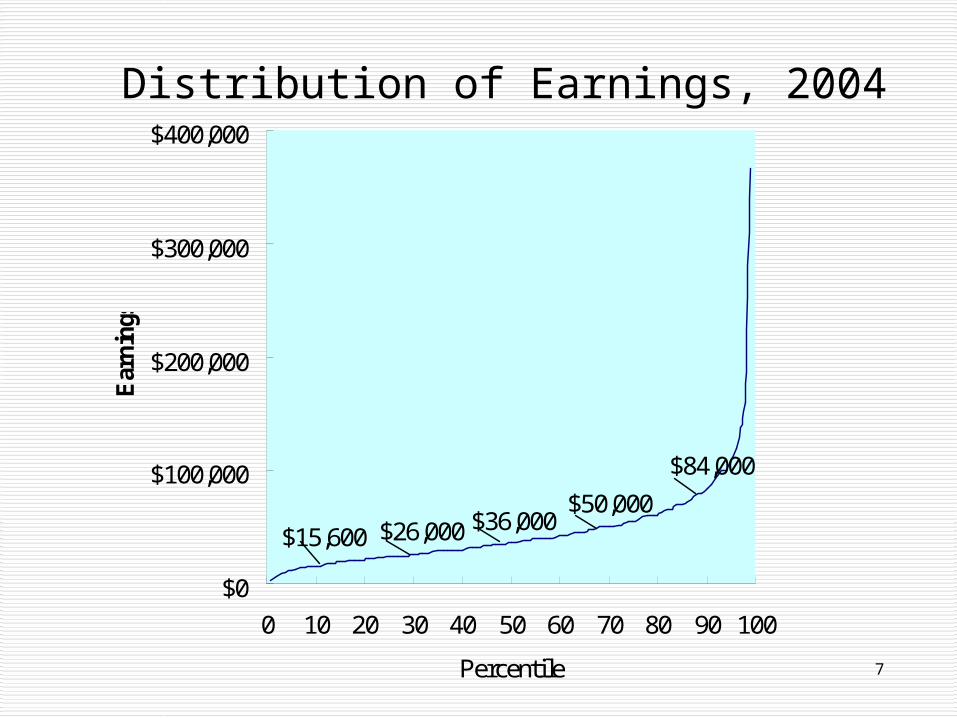
Distribution of Earnings, 2004
$15,600 $26,000 $36,000$50,000
$84,000
$0
$100,000
$200,000
$300,000
$400,000
0 10 20 30 40 50 60 70 80 90 100
Percentile
Ear
nin
gs
8
9
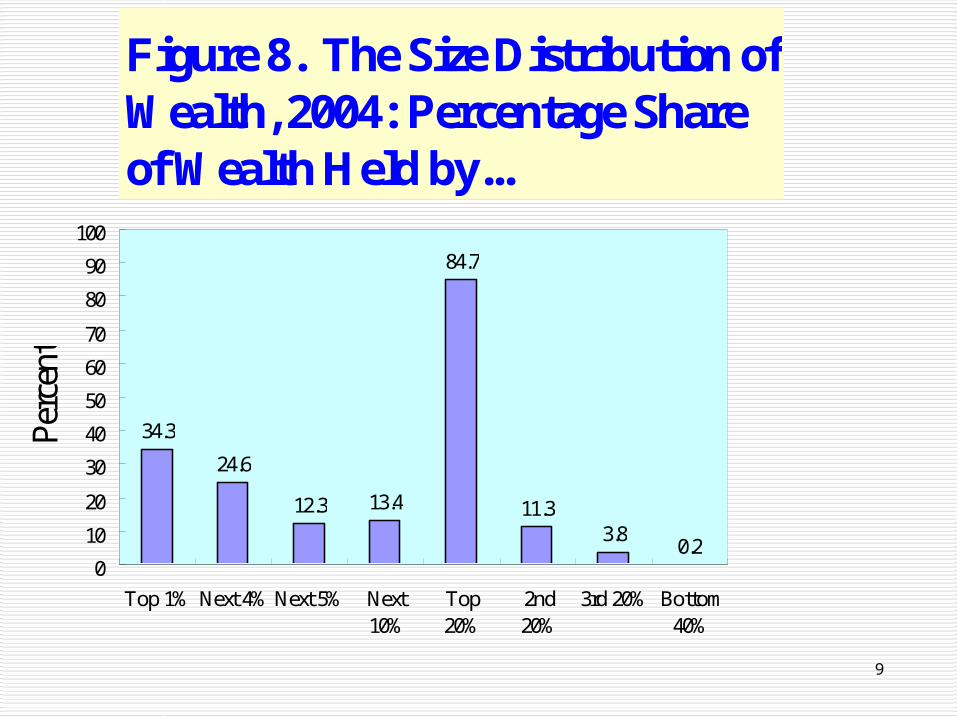
Figure 8. The Size Distribution of Wealth, 2004: Percentage Share of Wealth Held by...
34.3
24.6
12.3 13.4
84.7
11.33.8
0.20
10
20
30
40
50
60
70
80
90
100
Top 1% Next 4% Next 5% Next10%
Top20%
2nd20%
3rd 20% Bottom40%
Per
cent

10
Figure 10. Share of Household Income
0
10
20
30
40
50
60
Poorest20%
Middle 20% Richest20%
Per
cen
t
Egalitarian Free market After taxes & transfers Just?
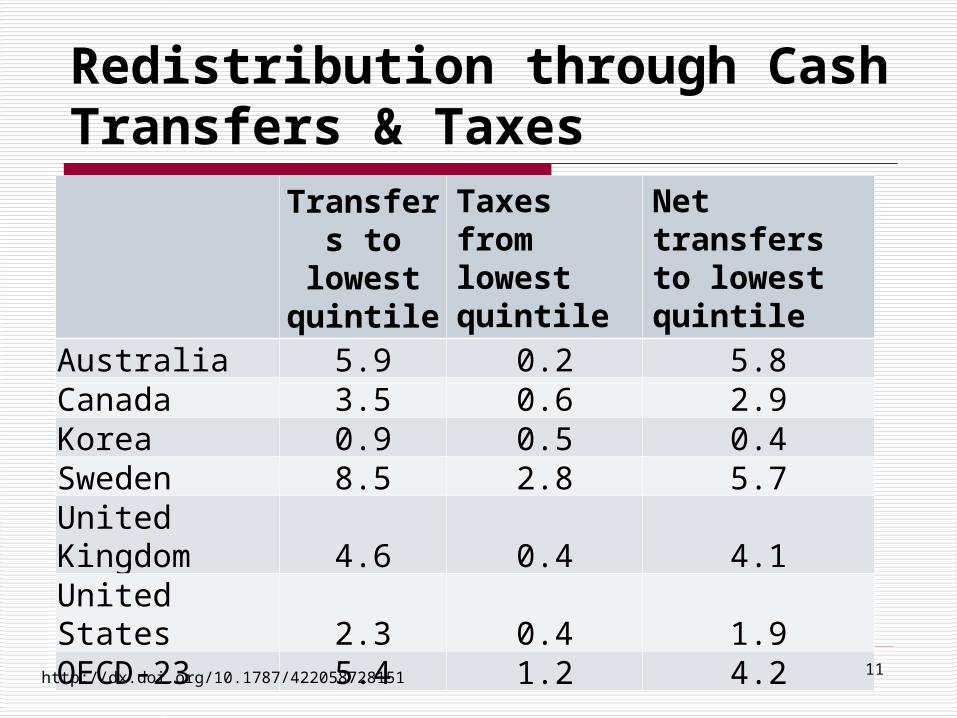
Redistribution through Cash Transfers & Taxes
Transfers to lowest quintile
Taxes from lowest quintile
Net transfers to lowest quintile
Australia 5.9 0.2 5.8Canada 3.5 0.6 2.9Korea 0.9 0.5 0.4Sweden 8.5 2.8 5.7United Kingdom 4.6 0.4 4.1United States 2.3 0.4 1.9OECD-23 5.4 1.2 4.2
11http://dx.doi.org/10.1787/422058728151

U.S. Standard Deductions, Personal Exemptions, and Simple Income Tax Thresholds, 2011
Unmarried individuals
Heads of household with one
child
Married couples filing joint returns
with two children
Standard deduction $5,800 $ 8,500 $11,600
Personal exemptions $3,700 $ 7,400 $14,800
Simple income tax threshold
$9,500 $15,900 $26,400
12Rev. Proc. 2011-12, 2011-2 IRB 297, http://www.irs.gov/pub/irs-irbs/irb11-02.pdf.
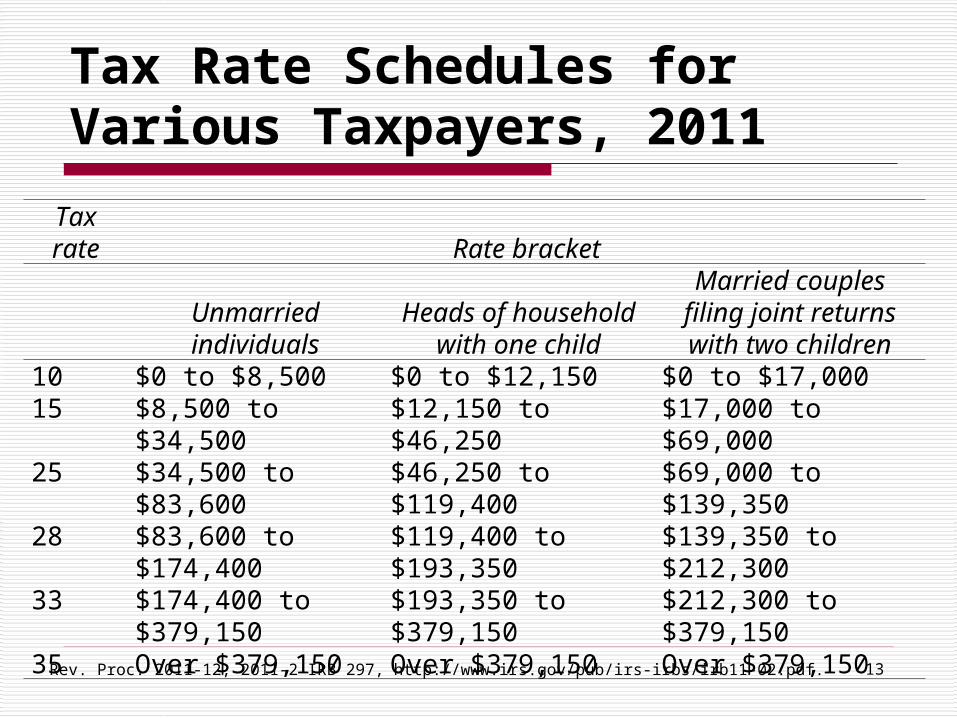
Tax Rate Schedules for Various Taxpayers, 2011
13
Tax rate Rate bracket
Unmarried individuals
Heads of household with one child
Married couples filing joint returns with two
children10 $0 to $8,500 $0 to $12,150 $0 to $17,00015 $8,500 to $34,500 $12,150 to $46,250 $17,000 to $69,00025 $34,500 to $83,600 $46,250 to $119,400 $69,000 to $139,35028 $83,600 to $174,400 $119,400 to $193,350 $139,350 to $212,30033 $174,400 to $379,150 $193,350 to $379,150 $212,300 to $379,15035 Over $379,150 Over $379,150 Over $379,150
Rev. Proc. 2011-12, 2011-2 IRB 297, http://www.irs.gov/pub/irs-irbs/irb11-02.pdf.

14Congressional Budget Office, Trends in Federal Tax Revenues and Rates (December 2, 2010), at 10, http://finance.senate.gov/imo/media/doc/120210DEtest.pdf.
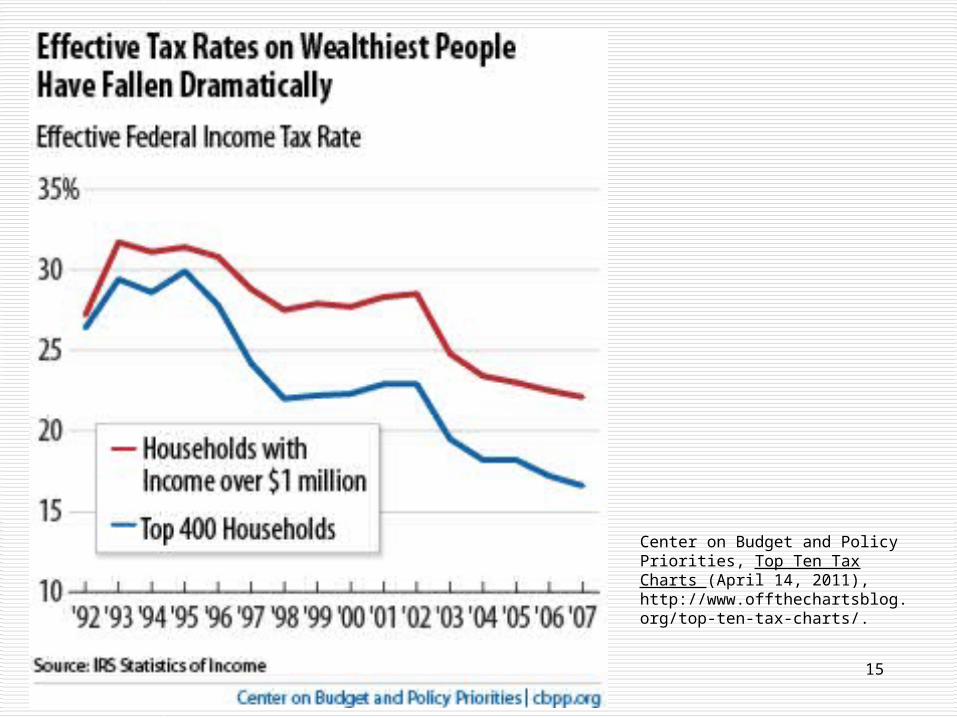
15
Center on Budget and Policy Priorities, Top Ten Tax Charts (April 14, 2011), http://www.offthechartsblog.org/top-ten-tax-charts/.

1620 Facts About U.S. Inequality that Everyone Should Know, http://stanford.edu/group/scspi/cgi-bin/facts.php.
Productivity and Real Income
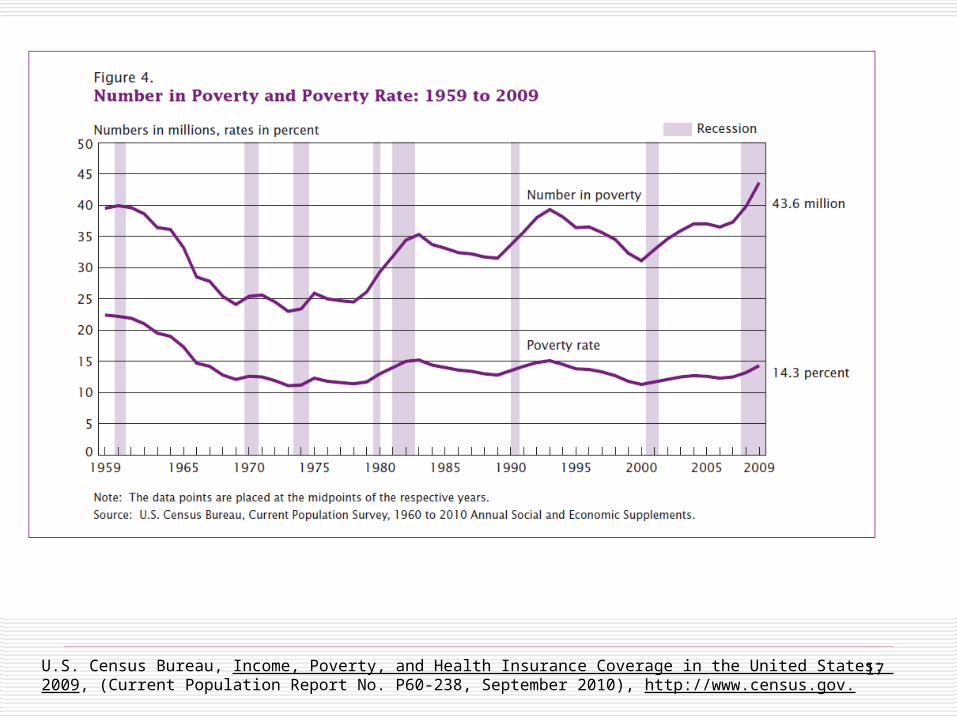
Rising Poverty
17U.S. Census Bureau, Income, Poverty, and Health Insurance Coverage in the United States: 2009, (Current Population Report No. P60-238, September 2010), http://www.census.gov.
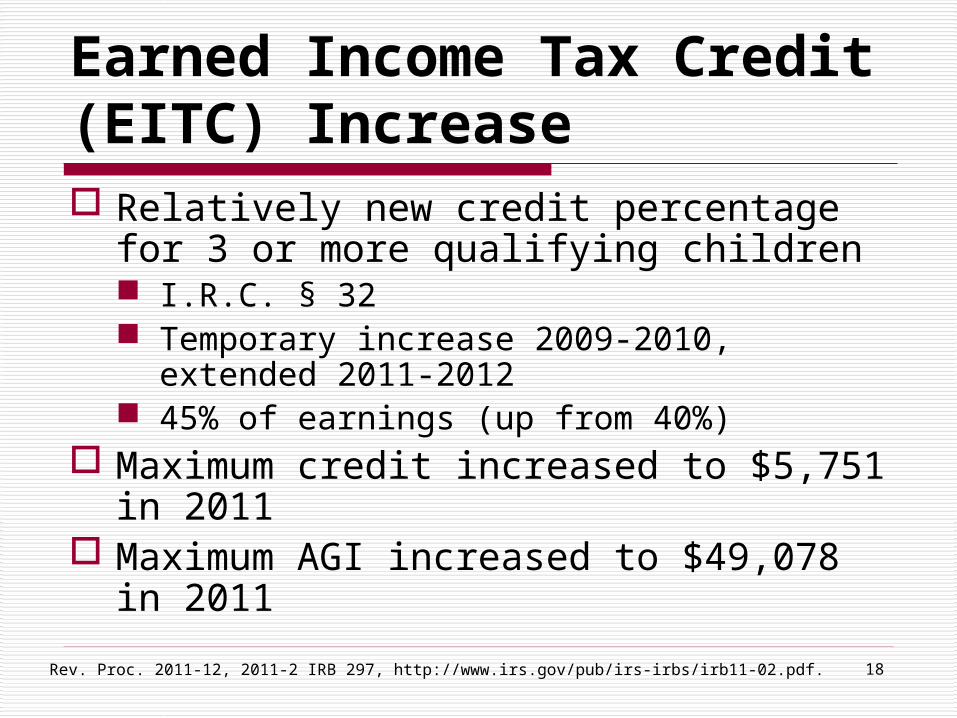
Earned Income Tax Credit (EITC) Increase Relatively new credit percentage for 3
or more qualifying children I.R.C. § 32 Temporary increase 2009-2010,
extended 2011-2012 45% of earnings (up from 40%)
Maximum credit increased to $5,751 in 2011
Maximum AGI increased to $49,078 in 2011
18Rev. Proc. 2011-12, 2011-2 IRB 297, http://www.irs.gov/pub/irs-irbs/irb11-02.pdf.

Child Tax Credit
$1,000 per qualifying child I.R.C. § 24
Temporary expansion of eligibility for refundable credit (15% × earned income minus $3,000 threshold)
More lower income families qualify: 2008 – threshold amount was = $8,500 2009-2012 – threshold amount = $3,000
19
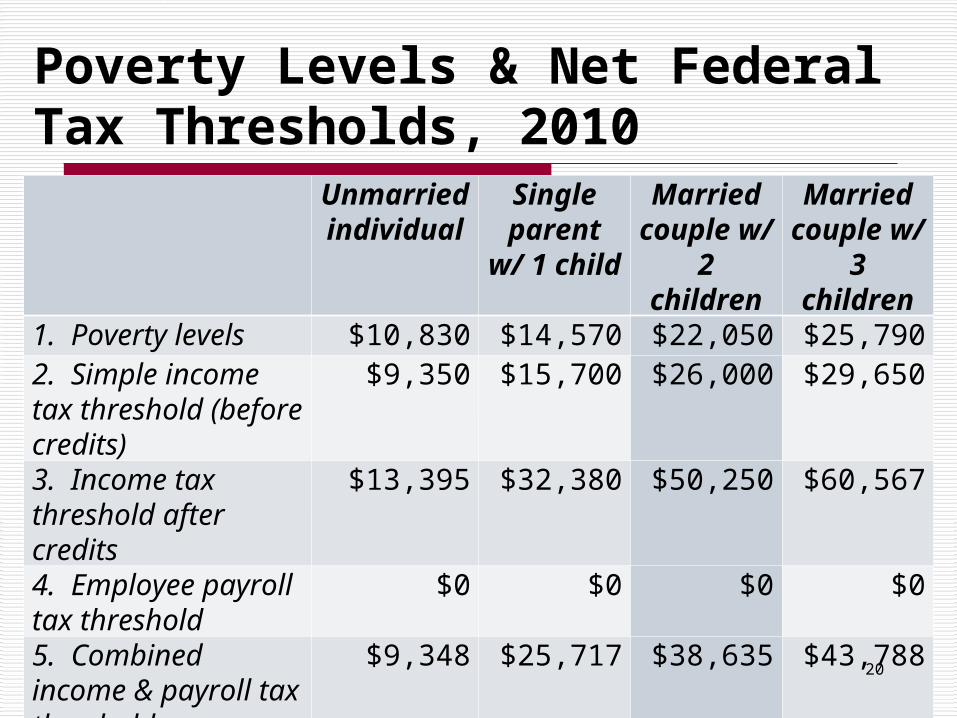
Poverty Levels & Net Federal Tax Thresholds, 2010
Unmarried individual
Single parent w/ 1
child
Married couple w/ 2 children
Married couple w/ 3 children
1. Poverty levels $10,830 $14,570 $22,050 $25,7902. Simple income tax threshold (before credits)
$9,350 $15,700 $26,000 $29,650
3. Income tax threshold after credits
$13,395 $32,380 $50,250 $60,567
4. Employee payroll tax threshold
$0 $0 $0 $0
5. Combined income & payroll tax threshold
$9,348 $25,717 $38,635 $43,788
20
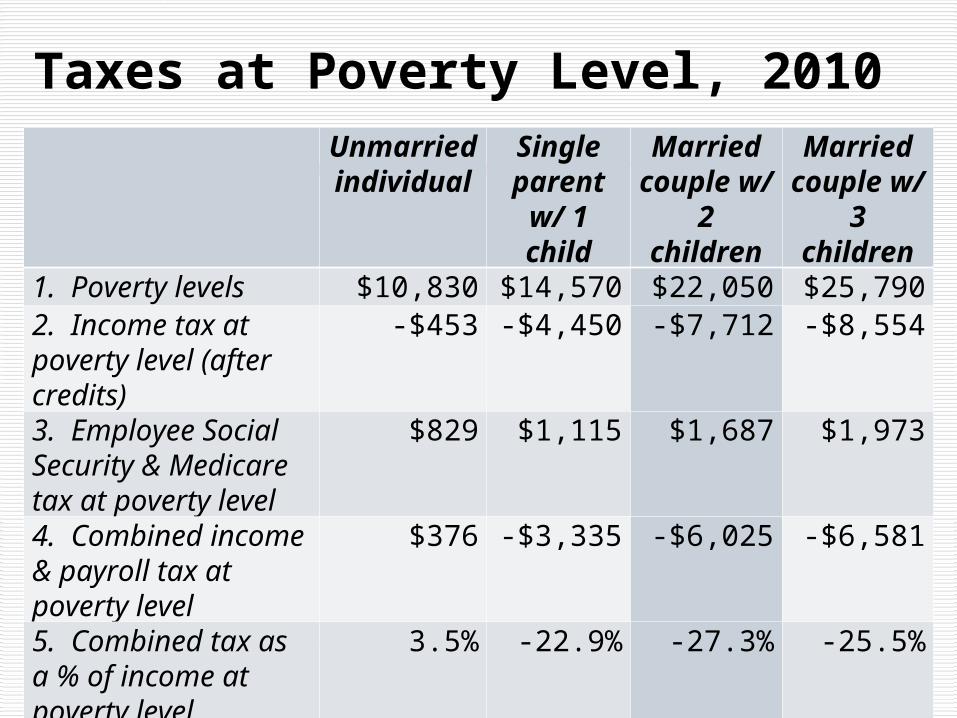
Taxes at Poverty Level, 2010
21
Unmarried individual
Single parent w/
1 child
Married couple w/ 2 children
Married couple w/ 3 children
1. Poverty levels $10,830 $14,570 $22,050 $25,7902. Income tax at poverty level (after credits)
-$453 -$4,450 -$7,712 -$8,554
3. Employee Social Security & Medicare tax at poverty level
$829 $1,115 $1,687 $1,973
4. Combined income & payroll tax at poverty level
$376 -$3,335 -$6,025 -$6,581
5. Combined tax as a % of income at poverty level
3.5% -22.9% -27.3% -25.5%

22
23
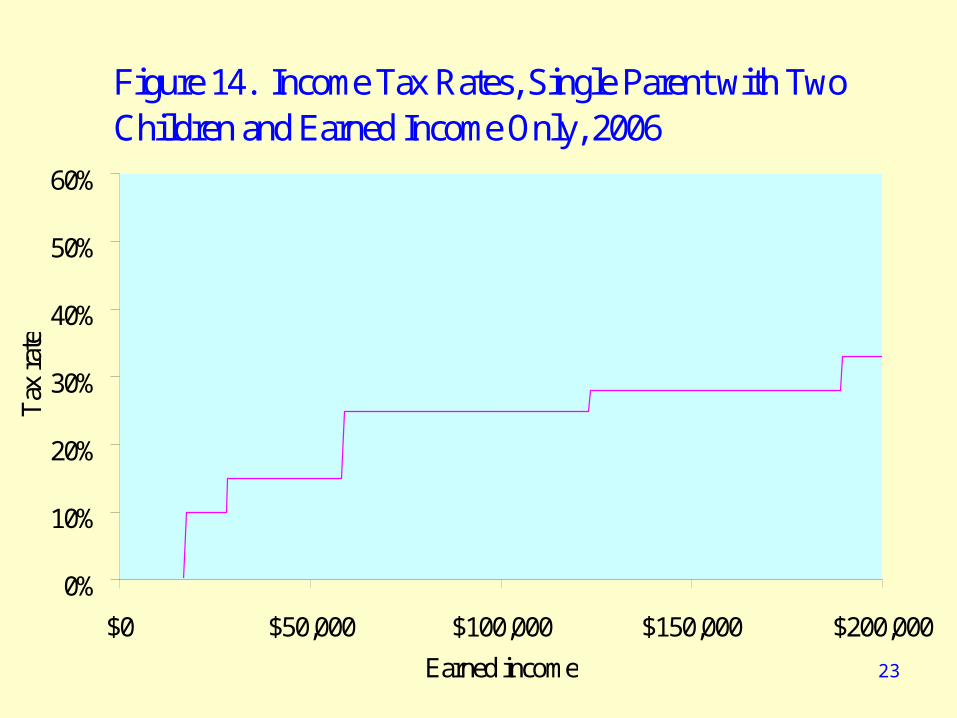
Figure 14. Income Tax Rates, Single Parent with Two Children and Earned Income Only, 2006
0%
10%
20%
30%
40%
50%
60%
$0 $50,000 $100,000 $150,000 $200,000
Earned income
Tax
rate
24
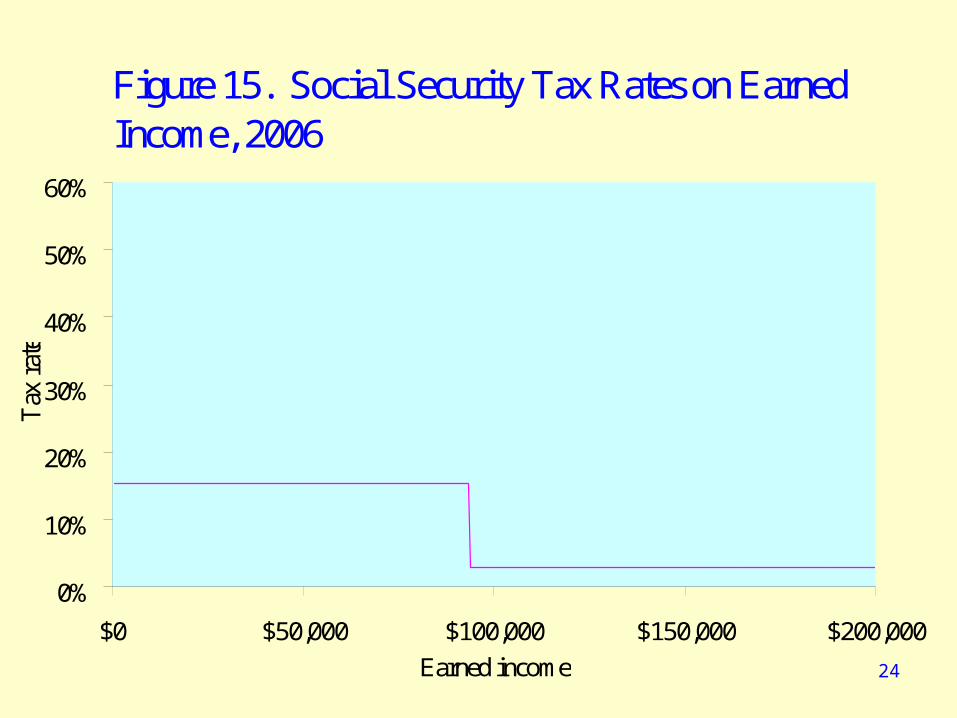
Figure 15. Social Security Tax Rates on Earned Income, 2006
0%
10%
20%
30%
40%
50%
60%
$0 $50,000 $100,000 $150,000 $200,000
Earned income
Tax
rat
e

25
Figure 17. Actual Tax Rate on Single Parents with Earned Income Only, 2006
-40%
-20%
0%
20%
40%
60%
$0 $50,000 $100,000 $150,000 $200,000
Earned income
Eff
ecti
ve t
ax r
ate
Effective tax rate Linear trend line

Outlays for the Principal Federal Benefit Programs in the United States (billions of dollars)
26
2009 actual 2015 estimateSocial Security $678 $893Medicare 425 651Medicaid 251 336Unemployment compensation 119 65Supplemental Security Income 41 52Earned income tax credit 42 45Child tax credit 24 26Making work pay tax credit <1 n/aFood assistance 72 89Family support 26 25Housing assistance 10 5General retirement and disability 8 10Federal employee retirement and disability 118 141Veterans benefits and services 49 84
27
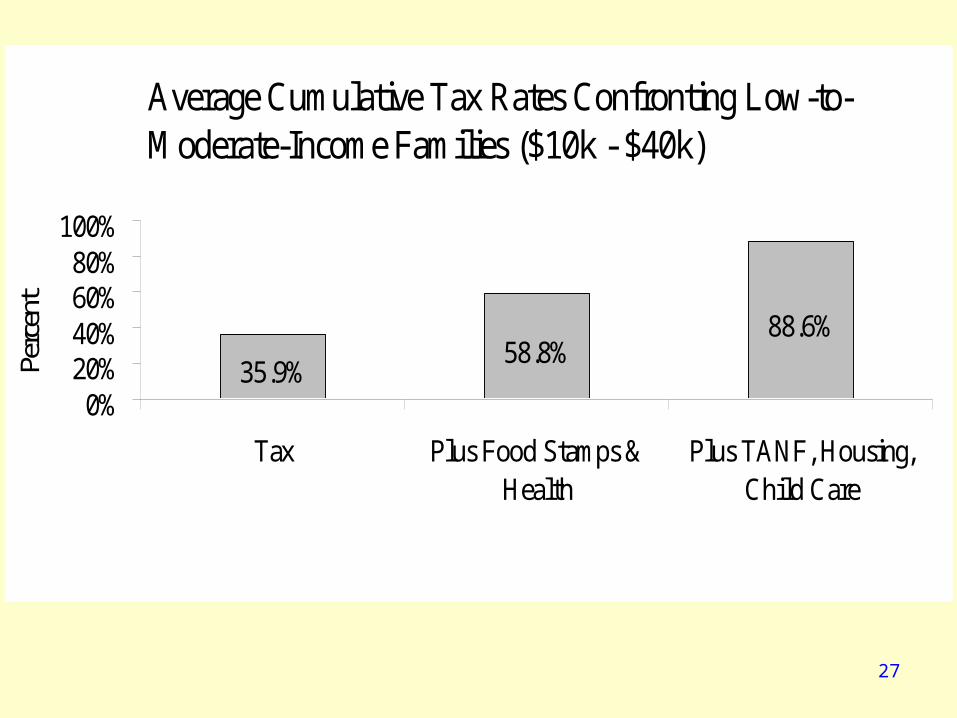
Average Cumulative Tax Rates Confronting Low-to-Moderate-Income Families ($10k - $40k)
35.9%58.8%
88.6%
0%20%40%60%80%
100%
Tax Plus Food Stamps &Health
Plus TANF, Housing,Child Care
Perc
ent
Source: Adam Carasso & C. Eugene Steuerle, The True Tax Rates Confronting Families with Children, Tax Notes 253 (October 10, 2005).
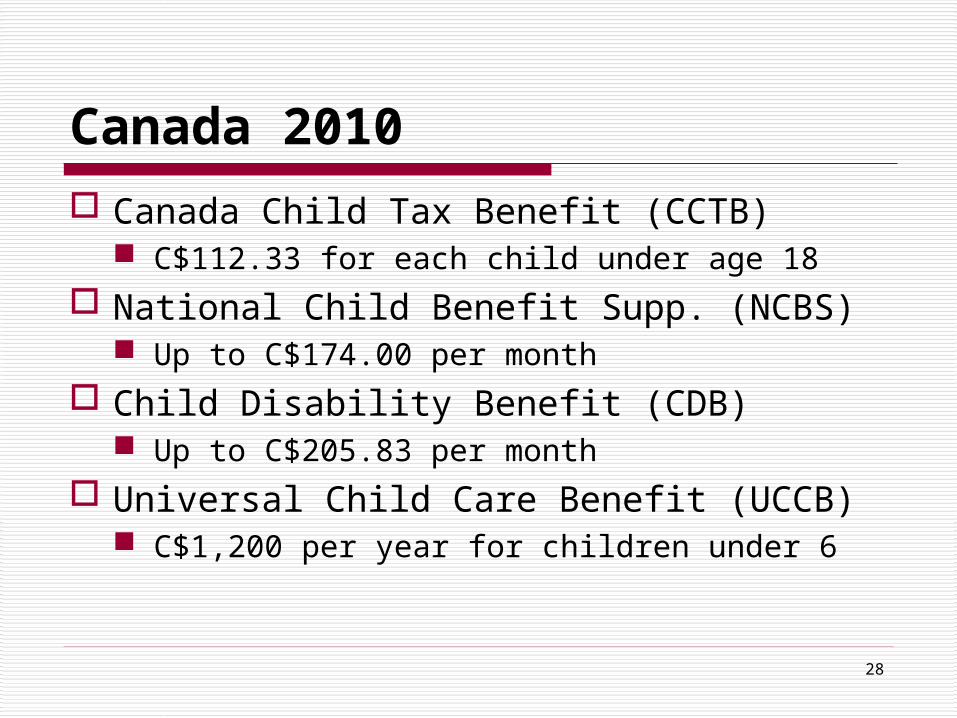
Canada 2010
Canada Child Tax Benefit (CCTB) C$112.33 for each child under age 18
National Child Benefit Supp. (NCBS) Up to C$174.00 per month
Child Disability Benefit (CDB) Up to C$205.83 per month
Universal Child Care Benefit (UCCB) C$1,200 per year for children under 6
28
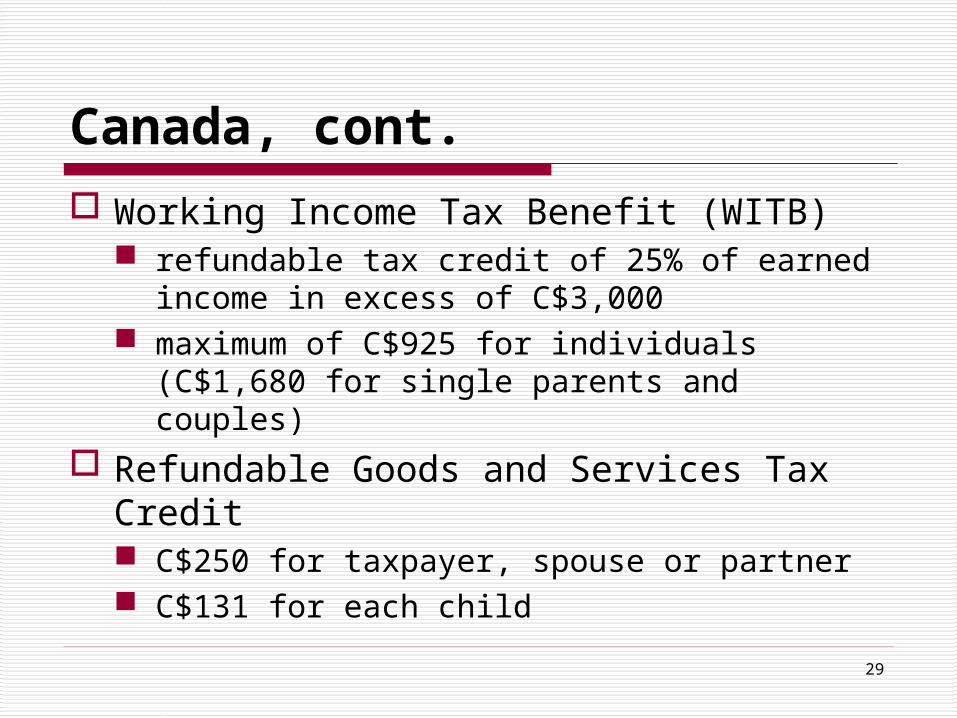
Canada, cont.
Working Income Tax Benefit (WITB) refundable tax credit of 25% of earned
income in excess of C$3,000 maximum of C$925 for individuals
(C$1,680 for single parents and couples)
Refundable Goods and Services Tax Credit C$250 for taxpayer, spouse or partner C$131 for each child
29
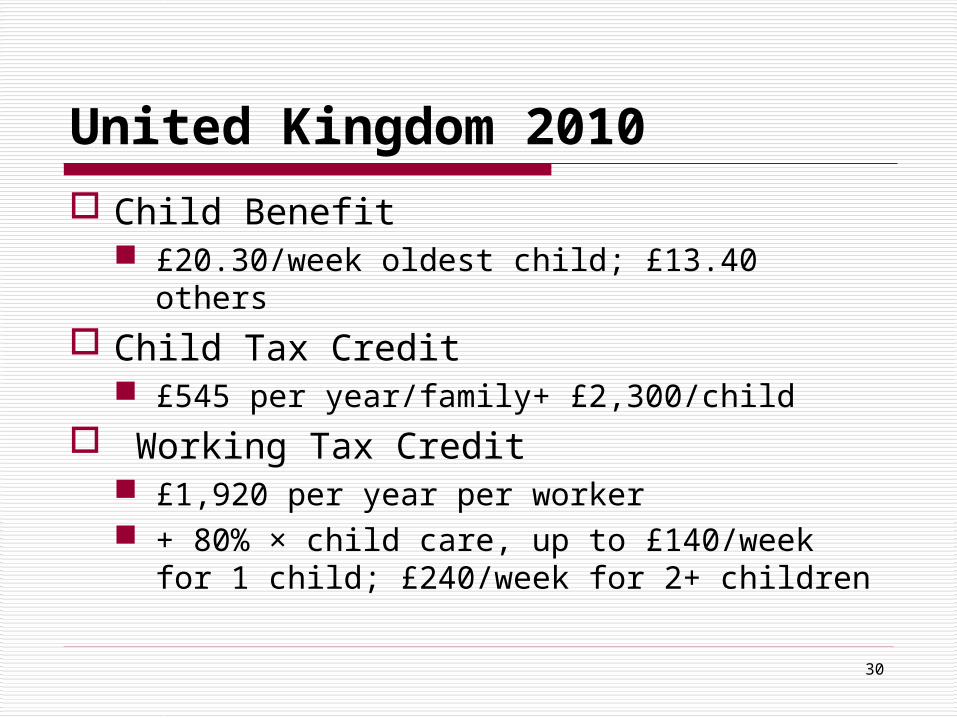
United Kingdom 2010
Child Benefit £20.30/week oldest child; £13.40 others
Child Tax Credit £545 per year/family+ £2,300/child
Working Tax Credit £1,920 per year per worker + 80% × child care, up to £140/week for
1 child; £240/week for 2+ children
30
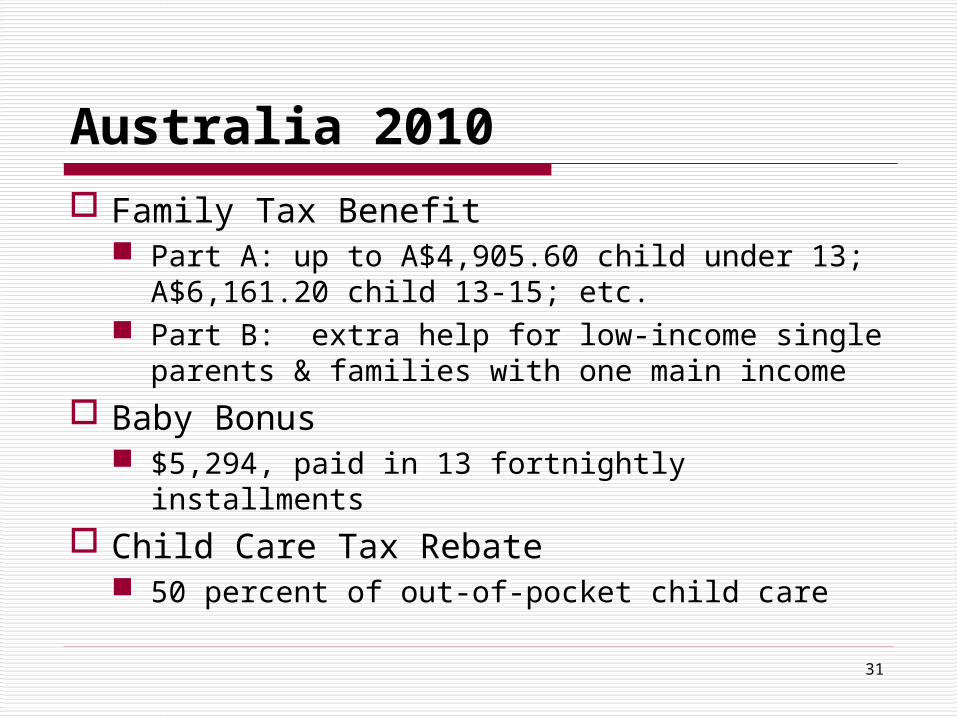
Australia 2010
Family Tax Benefit Part A: up to A$4,905.60 child under 13;
A$6,161.20 child 13-15; etc. Part B: extra help for low-income single
parents & families with one main income Baby Bonus
$5,294, paid in 13 fortnightly installments Child Care Tax Rebate
50 percent of out-of-pocket child care
31
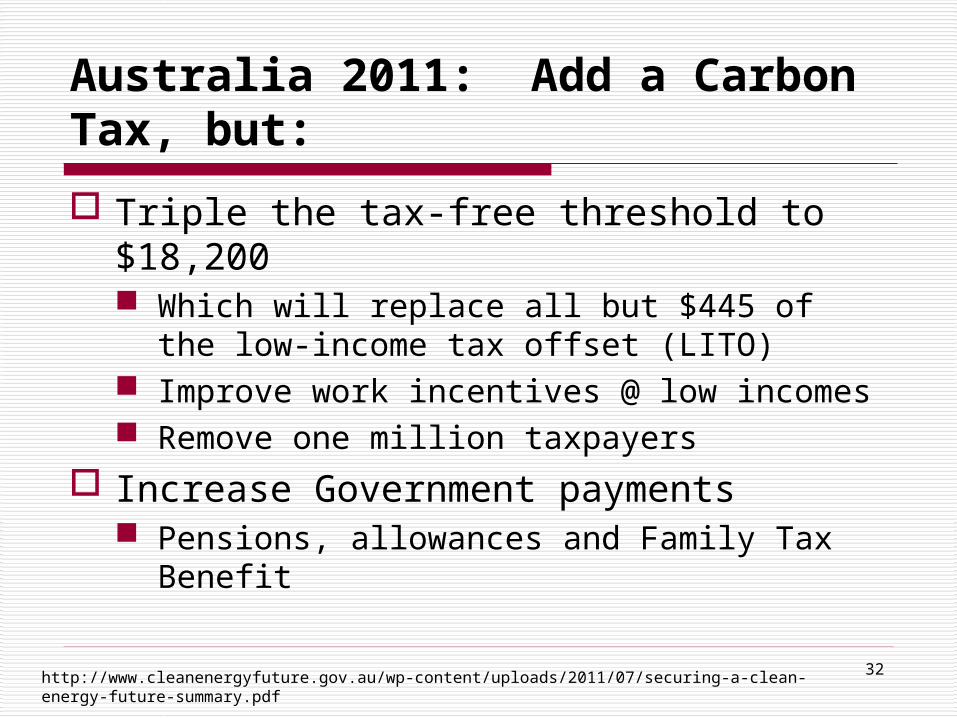
Australia 2011: Add a Carbon Tax, but:
Triple the tax-free threshold to $18,200 Which will replace all but $445 of the
low-income tax offset (LITO) Improve work incentives @ low incomes Remove one million taxpayers
Increase Government payments Pensions, allowances and Family Tax
Benefit
32http://www.cleanenergyfuture.gov.au/wp-content/uploads/2011/07/securing-a-clean-energy-future-summary.pdf
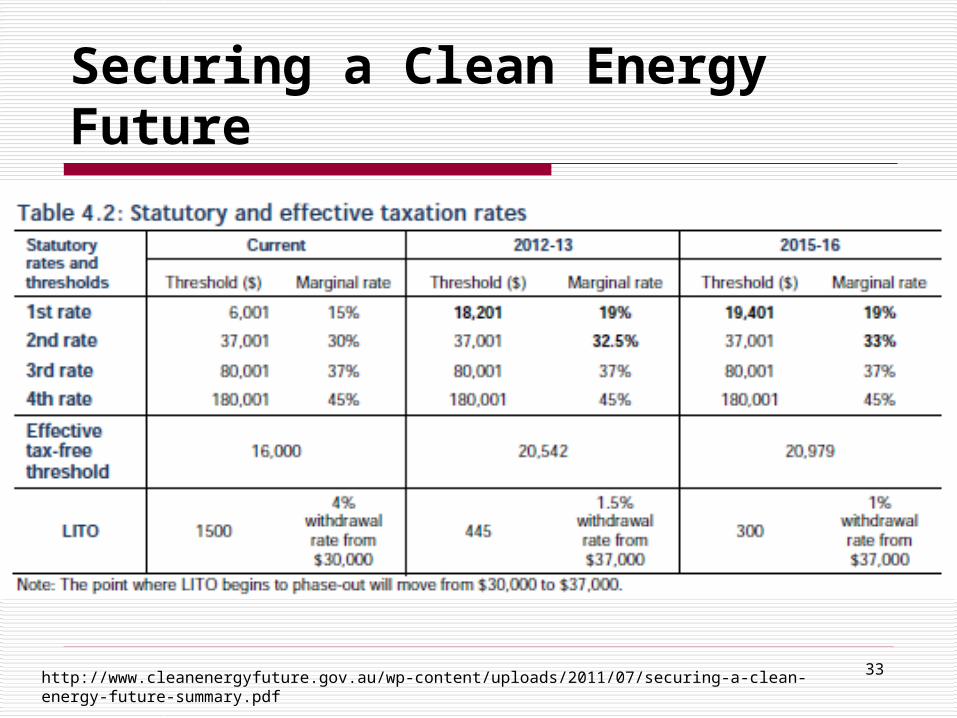
Securing a Clean Energy Future
33http://www.cleanenergyfuture.gov.au/wp-content/uploads/2011/07/securing-a-clean-energy-future-summary.pdf

34http://www.futuretax.gov.au/content/TaxForum/discussion_paper/tax_forum_next_steps_for_Australia_20110729.pdf

35
36
37
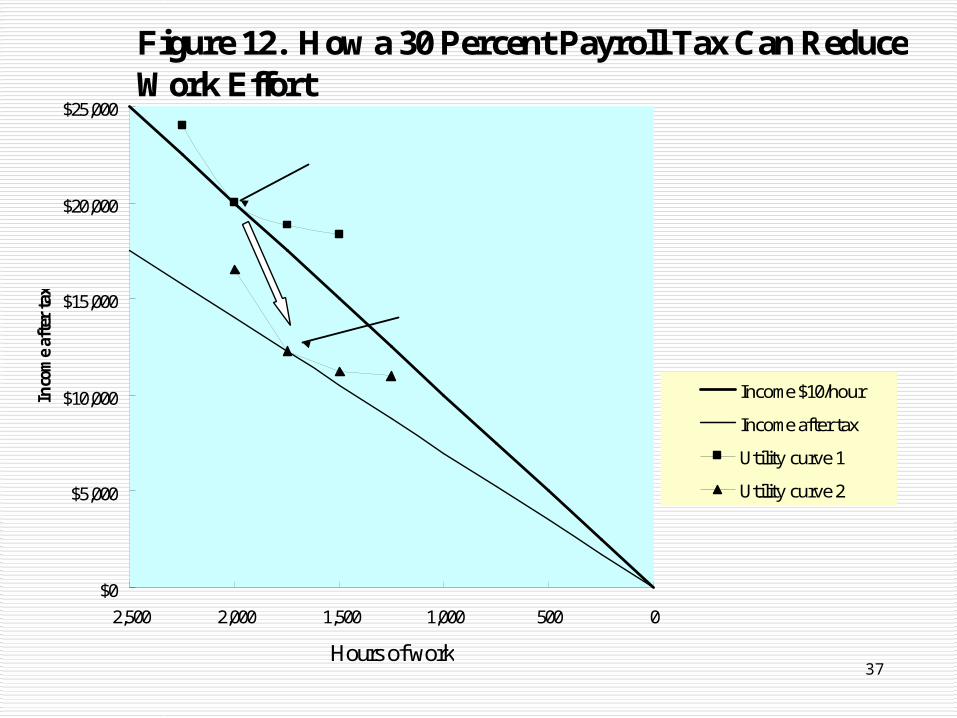
Figure 12. How a 30 Percent Payroll Tax Can Reduce Work Effort
$0
$5,000
$10,000
$15,000
$20,000
$25,000
05001,0001,5002,0002,500
Hours of work
Inco
me
afte
r ta
x
Income $10/hour
Income after tax
Utility curve 1
Utility curve 2
After: 1,750 hours, $12,500/year
Before: 2,000 hours, $20,000/year

38
Figure 21. How a Simple 50 Percent Earnings Subsidy Can Increase Work Effort
$0
$2,500
$5,000
$7,500
$10,000
$12,500
$15,000
$17,500
$20,000
05001,0001,5002,0002,500
Hours of work
Pos
t-tr
ansf
er I
ncom
e
Income $5/hour
Income after transfer
Utility curve 1
Utility curve 2
After: 1,750 hours, $13,125/year
Before:
1,500 hours,$7,500/year
39
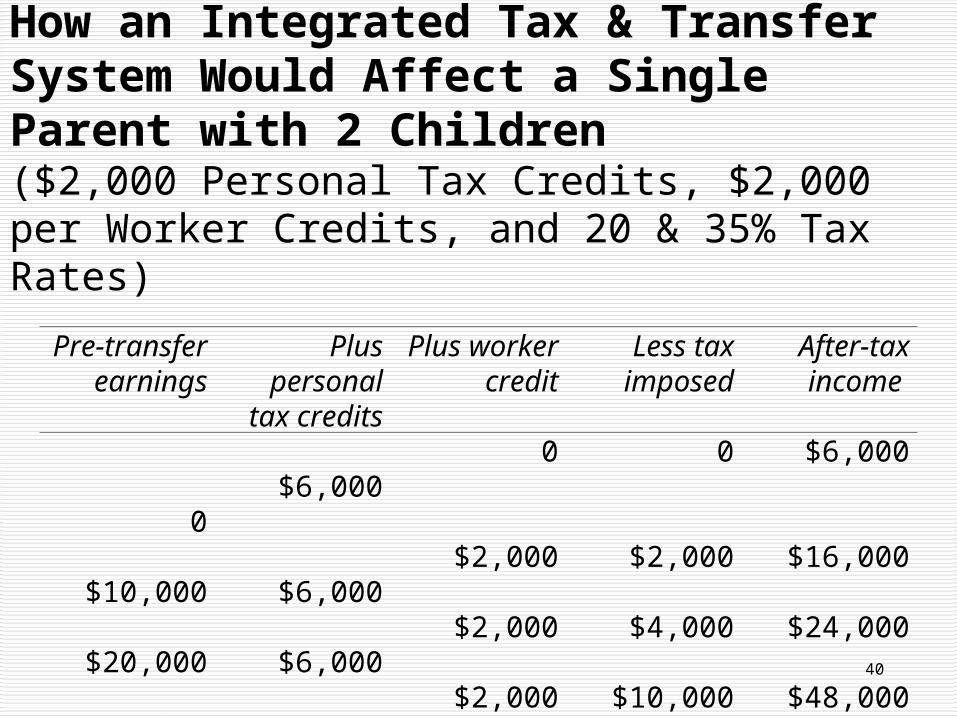
How an Integrated Tax & Transfer System Would Affect a Single Parent with 2 Children($2,000 Personal Tax Credits, $2,000 per Worker Credits, and 20 & 35% Tax Rates)
40
Pre-transfer earnings
Plus personal tax
credits
Plus worker credit
Less tax imposed
After-tax income
0 $6,000 0 0 $6,000 $10,000 $6,000 $2,000 $2,000 $16,000 $20,000 $6,000 $2,000 $4,000 $24,000 $50,000 $6,000 $2,000 $10,000 $48,000 $100,000 $6,000 $2,000 $27,500 $80,500 $200,000 $6,000 $2,000 $62,500 $145,500
41
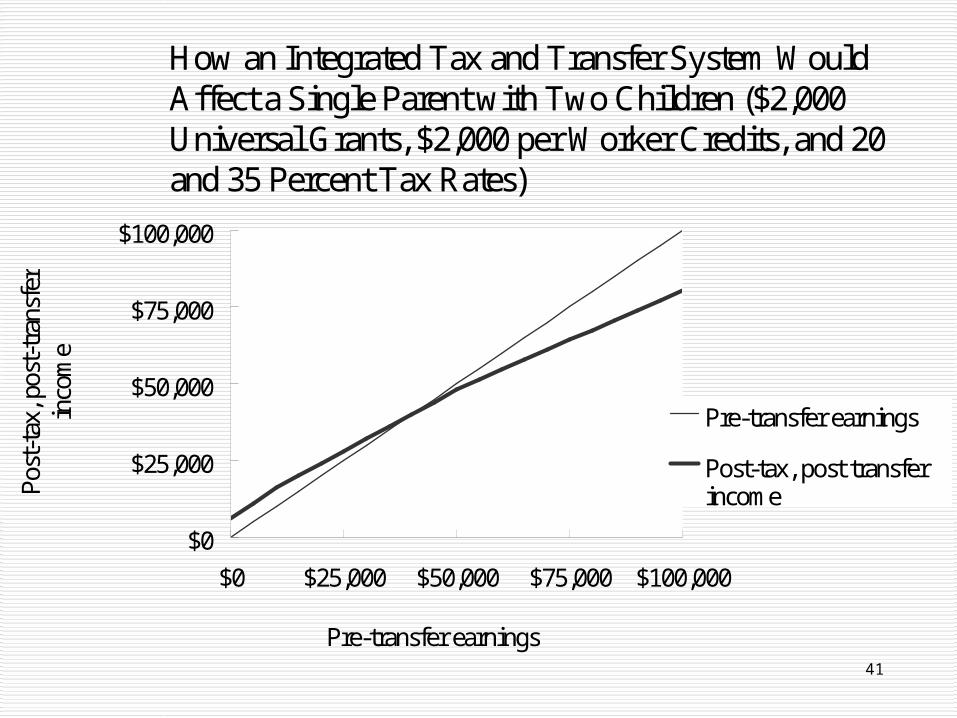
How an Integrated Tax and Transfer System Would Affect a Single Parent with Two Children ($2,000 Universal Grants, $2,000 per Worker Credits, and 20 and 35 Percent Tax Rates)
$0
$25,000
$50,000
$75,000
$100,000
$0 $25,000 $50,000 $75,000 $100,000
Pre-transfer earnings
Post
-tax
, pos
t-tr
ansf
er
inco
me
Pre-transfer earnings
Post-tax, post transferincome

About the Author Jonathan Barry Forman (“Jon”) is the Alfred P.
Murrah Professor of Law at the University of Oklahoma College of Law and the author of Making America Work (Washington, DC: Urban Institute Press, 2006).
Jon was the Professor in Residence at the Internal Revenue Service Office of Chief Counsel, Washington, DC, for the 2009-2010 academic year.
Jon can be reached at [email protected], +1-405-325-4779, www.law.ou.edu/faculty/forman.shtml.
42