using remotely sensed imagery to examine changing urban
TRANSCRIPT

Western Michigan University Western Michigan University
ScholarWorks at WMU ScholarWorks at WMU
Master's Theses Graduate College
4-2019
Using Remotely Sensed Imagery to Examine Changing Urban Using Remotely Sensed Imagery to Examine Changing Urban
Land Cover Across Time and Topography: A Study of Nepal’s Land Cover Across Time and Topography: A Study of Nepal’s
Kathmandu Valley Kathmandu Valley
Rajesh Sigdel
Follow this and additional works at: https://scholarworks.wmich.edu/masters_theses
Part of the Geography Commons
Recommended Citation Recommended Citation Sigdel, Rajesh, "Using Remotely Sensed Imagery to Examine Changing Urban Land Cover Across Time and Topography: A Study of Nepal’s Kathmandu Valley" (2019). Master's Theses. 4299. https://scholarworks.wmich.edu/masters_theses/4299
This Masters Thesis-Open Access is brought to you for free and open access by the Graduate College at ScholarWorks at WMU. It has been accepted for inclusion in Master's Theses by an authorized administrator of ScholarWorks at WMU. For more information, please contact [email protected].

USING REMOTELY SENSED IMAGERY TO EXAMINE CHANGING URBAN LAND COVER ACROSS TIME AND TOPOGRAPHY:
A STUDY OF NEPAL’S KATHMANDU VALLEY
by
Rajesh Sigdel
A thesis submitted to the Graduate College in partial fulfillment of the requirements
for the degree of Master of Science Geography
Western Michigan University April 2019
Thesis Committee:
Chansheng He, Ph.D., Chair Gregory Veeck, Ph.D. Laiyin Zhu, Ph.D.

© 2019 Rajesh Sigdel
ii
ACKNOWLEDGMENTS
First of all, I am thankful to my family back in Nepal for their continuous support as I
pursue my education in America. I am also very grateful to my host family in the United States. I
would like to especially thank my thesis advisor, Dr. Chansheng He for his continuous
mentorship and supervision over the past two years. Dr. He’s commitment to research excellence
is something that I hope to emulate throughout my entire career as a researcher. I would also like
to thank Dr. Laiyun Zhu and Dr. Gregory Veeck for making valuable contributions to this
research through serving on my committee and offering feedback and advice.
I would also like to recognize the departmental administration for supporting my research
and study, with special thanks to Dr. Benjamin Ofori-Amoah and Mary Lou Brooks, and Leesa
Jaqueys who have helped to guide and shape my coursework and academic life over the course
of this master’s program. The Department of Geography and Western Michigan University
provided a teaching assistantship, without which my master’s degree would have been
impossible. I am also very thankful to the Graduate College and the Lucia Harrison Endowment
Fund for providing me with a grant to conduct fieldwork on Nepal to collect data for my
research.
Rajesh Sigdel
USING REMOTELY SENSED IMAGERY TO EXAMINE CHANGING URBAN LAND COVER ACROSS TIME AND TOPOGRAPHY:
A STUDY OF NEPAL’S KATHMANDU VALLEY
Rajesh Sigdel, M.S.
Western Michigan University, 2019
The Kathmandu Valley, located in Nepal, is the most rapidly growing demographic
region in the country. With this demographic transformation, urban land is also expanding within
the valley. It is important to understand the rate and extent of urban land cover change for
effective land use planning. This study analyzed the urban land cover change in the Kathmandu
Valley in 1990, 2006, and 2018 using remote sensing. It also analyzed the shift in the urban
topography of the valley during the same period. Landsat 5 and Landsat 8 were used to study the
transformation of urban land cover in the valley. A supervised maximum likelihood
classification method was utilized for the delineation of the urban areas. A slope raster file was
overlaid with urban land cover to understand the changing topography of the valley. This study
found that the urban land cover of the valley increased by 227% between 1990 and 2018. The
valley experienced an outward expansion of urban growth which emerged from the central
business districts. Similarly, the results indicate that there is a noticeable shift in urban
development in the valley, with development now expanding from the flat lands to steeper
sloped areas. Historical developments, economic activities, political instability in the country, the
centralized government, and the valley’s status as a hub of education and technology were
identified as the key drivers of urban growth.

iii
TABLE OF CONTENTS
ACKNOWLEDGMENTS .............................................................................................................. ii
LIST OF TABLES .......................................................................................................................... v
LIST OF FIGURES ....................................................................................................................... vi
CHAPTER
I. INTRODUCTION .............................................................................................................. 1
Rationale for choosing 1990 to 2018 time period ...................................................... 4
Definition of terms ..................................................................................................... 4
II. LITERATURE REVIEW ................................................................................................... 7
Economic Liberalization in 1990 ............................................................................... 7
The Maoist movement in Nepal ................................................................................. 9
Peace process ........................................................................................................... 11
Tourism in the Kathmandu Valley ........................................................................... 12
Landsat satellites ...................................................................................................... 14
Use of remote sensing to study urban land cover .................................................... 15
Image classification techniques ............................................................................... 19
Land cover mapping in the Kathmandu Valley, Nepal ........................................... 22
III. MATERIALS AND METHODS ...................................................................................... 26
Study area ................................................................................................................ 26
Datasets .................................................................................................................... 29
Field data collection ................................................................................................. 30

iv
Table of Contents—Continued CHAPTER
Image processing and classification ........................................................................ 31
Topographic analysis of urban land ......................................................................... 34
3 dimensional model ................................................................................................ 35
Post classification smoothing and accuracy assessment .......................................... 37
IV. RESULTS AND DISCUSSION ....................................................................................... 39
Classified images and accuracy assessments ........................................................... 39
Topographic analysis ............................................................................................... 49
Drivers of urban land cover change ......................................................................... 50
Historical development ............................................................................................ 51
Economic hub .......................................................................................................... 51
Political factors ........................................................................................................ 52
Centralized government ........................................................................................... 52
Center of education and technology ........................................................................ 53
Summary .................................................................................................................. 54
V. CONCLUSIONS ............................................................................................................... 55
Implications of the study .......................................................................................... 56
Limitations of the study ........................................................................................... 57
REFERENCES ............................................................................................................................. 59
v
LIST OF TABLES
1. Anderson land use/land cover classification system. .......................................................... 6
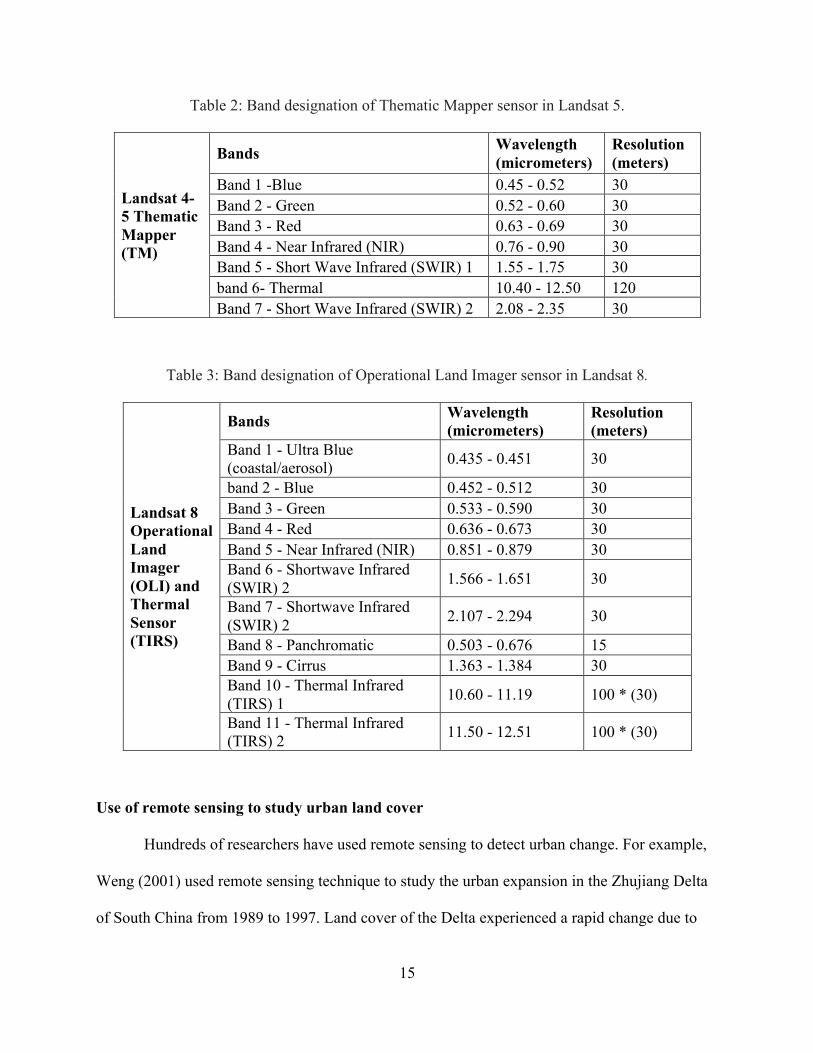
2. Band designation of Thematic Mapper sensor in Landsat 5. ............................................ 15
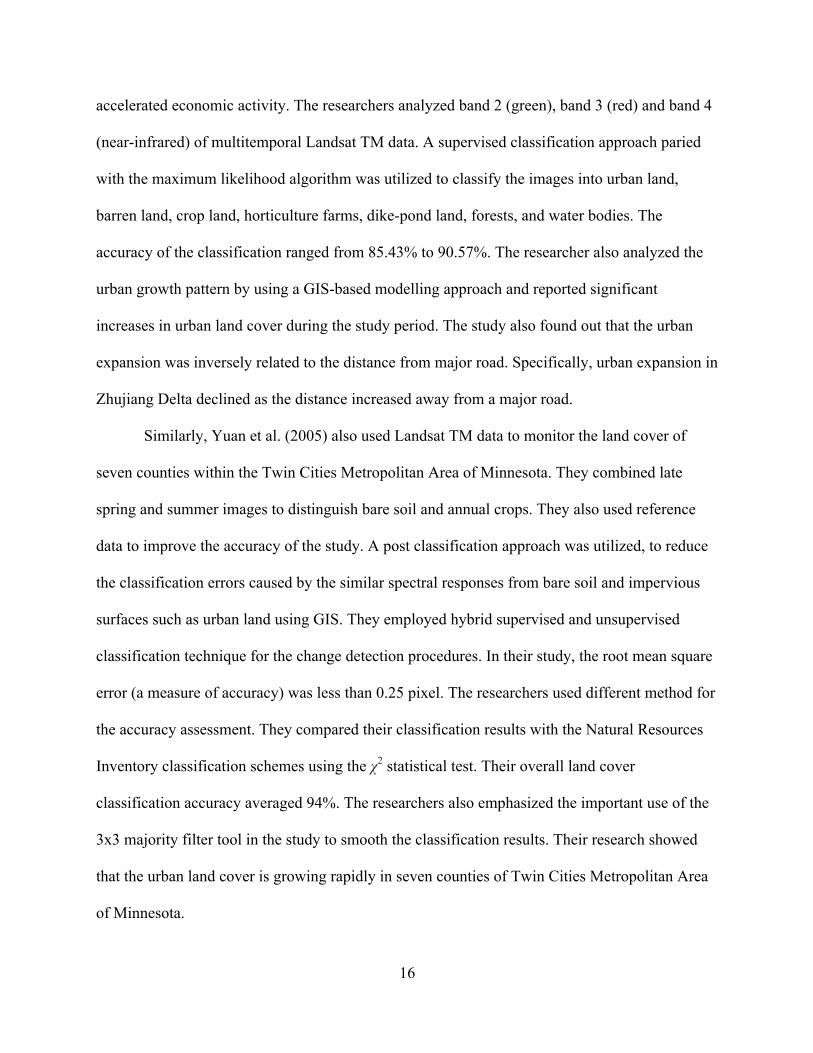
3. Band designation of Operational Land Imager sensor in Landsat 8. ................................ 15
4. ICIMOD classification of the land cover of the Kathmandu Valley. ............................... 24
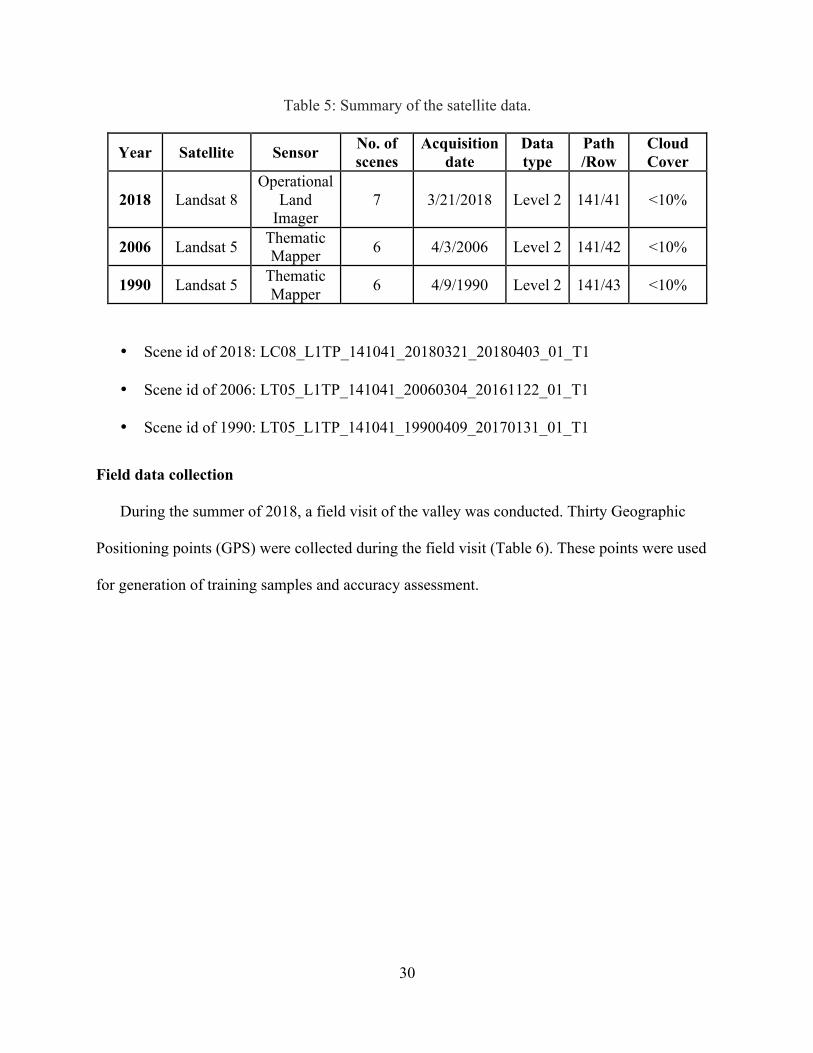
5. Summary of the satellite data. ........................................................................................... 30
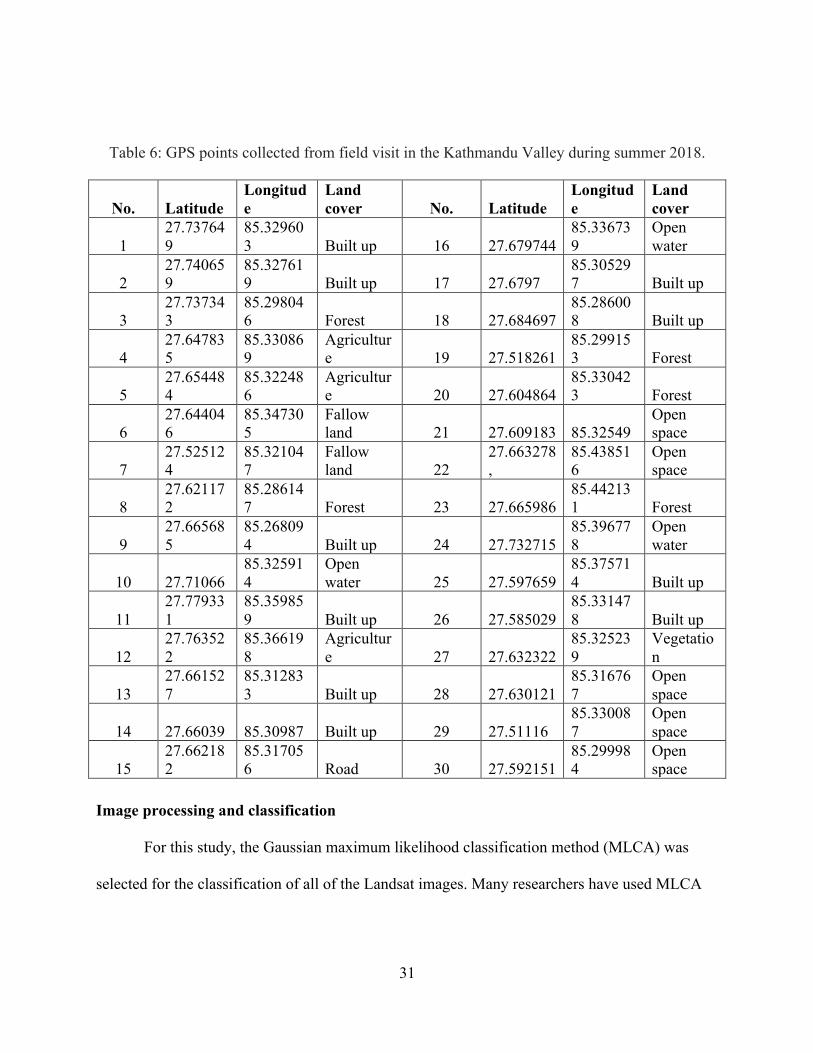
6. GPS points collected from field visit in the Kathmandu Valley during summer 2018. ... 31
7. Error matrix for 1990, 2006, and 2018 classified images. ................................................ 39
8. Urban land cover of the Kathmandu Valley. .................................................................... 45
9. Change in percentage of the urban land cover of the Kathmandu Valley. ....................... 45
10. Urban land cover of districts in the Kathmandu Valley in 1990. ..................................... 46
11. Urban land cover of districts in the Kathmandu Valley in 2006. ..................................... 47
12. Urban land cover of districts in the Kathmandu Valley in 2018. ..................................... 47
13. Urban land cover of Kathmandu City, Lalitpur City, and Bhaktapur City. ...................... 48
14. ICIMOD classification of urban land cover of the valley. ................................................ 48
15. Population of the Kathmandu Valley. ............................................................................... 51

vi
LIST OF FIGURES
1. Number of tourists visiting Nepal from 1991 to 2017. ..................................................... 13
2. Location of the Kathmandu Valley in Nepal. ................................................................... 28
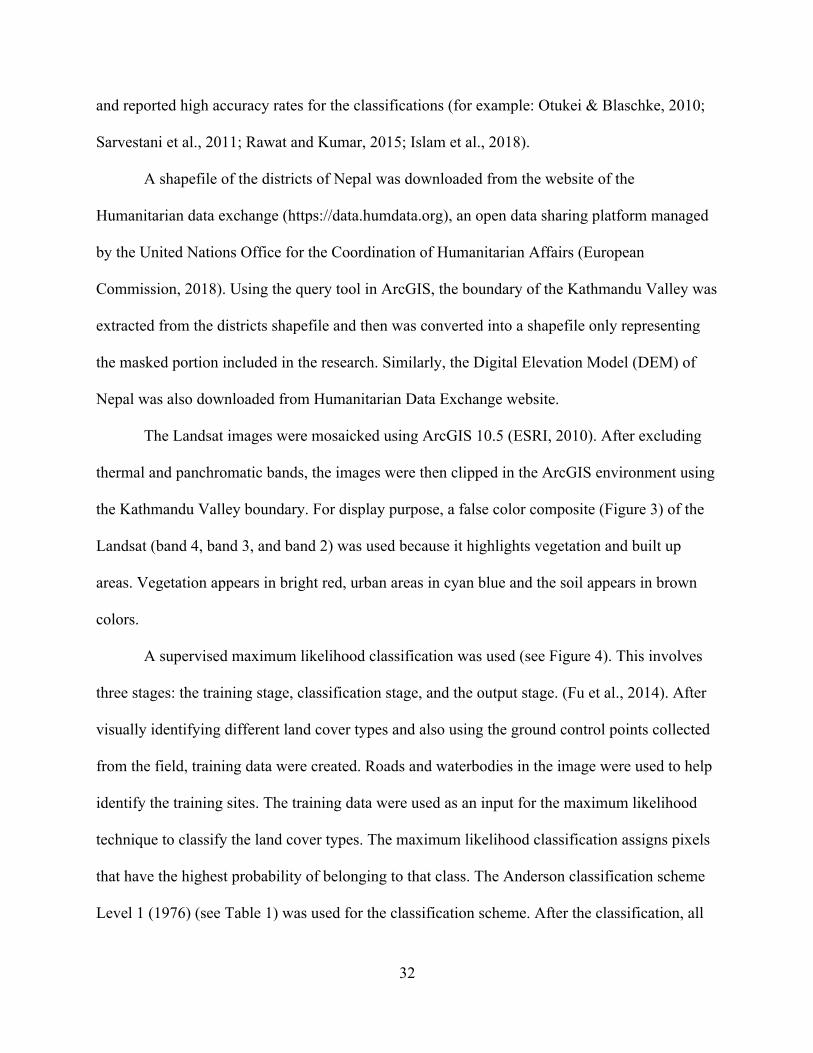
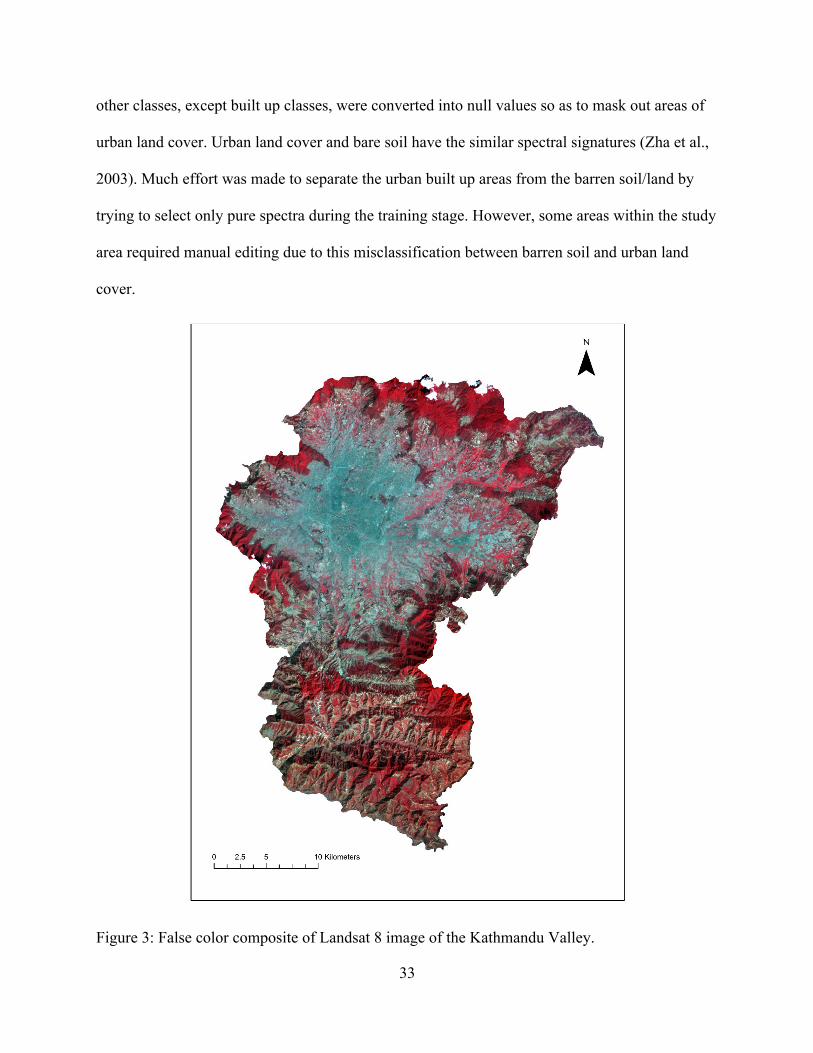
3. False color composite of Landsat 8 image of the Kathmandu Valley. ............................. 33
4. Workflow of classification of remotely sensed data. ........................................................ 34
5. Workflow of the topographic analysis. ............................................................................. 35
6. Slope raster file of the Kathmandu Valley. ....................................................................... 36
7. Urban land cover map of the Kathmandu Valley of 1990. ............................................... 40
8. Urban land cover map of the Kathmandu Valley of 2006. ............................................... 41
9. Urban land cover map of the Kathmandu Valley of 2018. ............................................... 42
10. Overlay map of the urban land cover of the Kathmandu Valley of 1990, 2006, and 2018. ................................................................................................................. 43
11. Urban land cover of the Kathmandu Valley in 1990, 2006, and 2018. ............................ 45
12. Topographic analysis of the urban land cover of the Kathmandu Valley of 1990, 2006, and 2018. ................................................................................................................. 49
13. Three dimensional image of the Kathmandu Valley. ....................................................... 50
14. Driving factors of urban growth/ built up area from 1990 to 2018. ................................. 54
1
CHAPTER I
INTRODUCTION
Land use/land cover (LULC) has been changing in an unprecedented rate throughout the
world (Turner et al., 1994; Watson et al., 1996; Dewan & Yamaguchi, 2009). Most of the LULC
change has been attributed to human activities (Foley et al., 2005; Goldewijk, 2001; Meyer &
Turner, 1992). The increase in human population is a major reason for the modification of LULC
through urbanization and agriculture expansion as global human population has surpassed 7.68
billion (Worldmeters, 2019). This growth has significantly impacted natural ecosystems and
radically changed land cover as humans use natural resources to meet growing multiple needs.
For instance, global cropland and pasture increased 5.5-fold and 6.6-fold, respectively, over the
past 300 years (Goldewijk, 2001). About 3% of the earth’s land surface has already been
converted into urban areas (Dewan & Yamaguchi, 2009). It is projected that two-thirds of the
world’s population will live in urban areas by 2060 (United Nations, 2014). Unfortunately,
urbanization has been accompanied by a decline of native habitats (Alphan, 2003), a reduction in
the services of remaining ecosystems (Imhoff et al., 2004), an increase in temperature of cities,
(Olson et al., 2001; Imhoff, 2010), and a decline of air quality throughout many parts of the
world (Martin, 2008; Lyons & Husar, 1976; Ramachandran, 2007). The LULC modifications
such as the encroachment of urban areas into other LULC categories have a pervasive impact,
especially on developing countries (Dewan et al., 2012; McMichael, 2000) as the urban areas in
those countries are growing five times faster than those in the developed countries due to the
change in economy (Lo´pez et al., 2001). This is particularly true within Hindu Kush Himalayan
countries which have already witnessed massive changes in their LULC, especially rapid
2
increases in urban built up areas, for example in Nepal (Gautam et al., 2003), Pakistan (Qasim et
al., 2011), India (Rao & Pant, 2001), and Bangladesh (Dewan & Yamaguchi, 2009).
Information about land use and land cover change such as change to urban built up land
is necessary for optimal distribution of resources (Liu et al., 2012). Remote sensing technology
helps provide rapid and precise information about the extent of each land cover type. Land use
/land cover maps of various times provide us information such as vegetation condition (Lunetta
et al., 2006), urban sprawl (Irwin & Bockstael, 2007), urban housing density and its distribution
(Irwin & Bockstael, 2007). This information can support decision making to urban planning and
resource management.
Remote sensing has been widely used in monitoring and analyzing land cover change.
For example, Schneider et al. (2009) developed global urban maps using satellite imagery. Dahl
(2004) used remote sensing to monitor wetlands habitat change. Landsat data are freely available
and of moderate resolutions after mid-1980s. Seto et al. (2002) used Landsat Thematic Mapper
(TM) data to monitor Pearl River Delta in China. Furthermore, Elmqvist and Khatir (2007) used
remote sensing to study the dynamics of agricultural expansion in the Sahel of Sudan. This
information helps in assessment of potential environmental impacts (Rozario et al., 2016) and
planning strategies (Porter-Bolland et al., 2007).
The Kathmandu Valley, located in Nepal, is the most rapidly growing demographic
region in Nepal (Thapa and Murayama, 2010). It is important to understand the rate and extent of
urban land cover for effective land use planning. Land use planning refers to scientific and
orderly disposition of land for economic and social purposes. A proper urban land cover map
helps in hazard zoning (Fell et al., 2008). Land use exhibits unique temporal (time) and spatial
(space) variability (Yang & Lo, 2002). Although there have been studies done to map the land
3
cover of Nepal in the past, the literature lacks the current urban land cover map of the valley. For
example, International Development for Integrated Mountain Development (ICIMOD) has been
playing a crucial role in mapping the land cover dynamics of Nepal. ICIMOD conducted detailed
land cover classifications of Nepal for the years of 1990, 2000, and 2010. These maps were
prepared for the development of baseline information for future environmental management and
land use planning (ICIMOD, 2013). Landsat TM images with 30 m resolution were used for the
development of those maps and the results show significant changes in land cover types. These
studies, carried out for the complete geographic extent of Nepal, utilized coarser classification
techniques and tended to be more general than the classifications done in smaller area.
Classifications done over large geographic extent exhibit biases in urban and suburban areas and
might be less accurate than that in fine spatial –scales (Smith et al., 2010). Rimal (2011) also
studied the land cover of Kathmandu City and Lalitpur City from 1976 to 2009 and reported
rapid increases in the urban land cover. They used Markov Chain Analysis to predict the 2017
land cover. However, their study did not cover Bhaktapur City within the valley. Similarly,
Thapa and Murayama (2011) also conducted a study of urban land cover of 2010 and predicted
the future change in 2020. This study also excluded some parts of the valley. The Kathmandu
Valley (comprised of Kathmandu District, Bhaktapur District, and Lalitpur District) is the major
social, political, economic and cultural hub of the country (Pant & Dangol, 2009) and therefore,
should be studied as a whole. Hence, this research will seek to understand the changes in the
spatial extent of urban land cover of the entire Kathmandu Valley. The purpose of the study is to
understand the growth rate in urban area from 1990 to 2006 and from 2006 to 2018, so as to
compare urban land cover changes between the 1990 – 2006 and the 2006 – 2018. The specific
objectives of this study are to:

4
1) Collect ground truth data and relevant DEM, land use maps, and social economic
data;
2) Classify urban land cover for the periods of 1990, 2006, and 2018 by Landsat TM
images;
3) Analyze the patterns of the urban expansion for the period of 1990-2018;
4) Understand the causes/drivers of the urban land cover change in the study area.
Rationale for choosing 1990 to 2018 time period
The year of 1990 was important, both politically and economically, for Nepal. Nepal not
only gained multiparty democracy in this year, but also started the free market economic
liberalization of the country. This economic liberalization increased Gross Domestic Product
(GDP) of the country (World Bank, 2002), and it is hypothesized that change in urban land cover
was directly related to the growth in GDP (Wu et al., 2013). Similarly, the Maoist Party, which
had been conducting armed struggles to replace the government before this, signed a
comprehensive peace agreement in 2006, which was a major milestone for the long term peace
process in the country. Kathmandu Valley was the major hotspot for those important events and
brought diverse groups from rural areas to participate in this political transition (Routledge,
2010). This had led to the planned residential developments in the fringe and rural areas along
with significant expansion of transportation network and commercial land use.
Definition of terms
Remote sensing refers to the monitoring of earth resources without physically touching it
(Lillesand et al., 2014). In this study, remote sensing means the acquisition of land surface
information by Landsat TM images.

5
Spatial resolution means the pixel size covering the land surface. The spatial resolution of
Landsat TM is 30m (except for thermal and panchromatic bands), meaning a pixel covers 30m X
30m of ground surface. Another key term in remote sensing is the temporal resolution. Temporal
resolution refers to the frequency to which a satellite sensor captures a feature of the earth
surface with respect to time. There is a tradeoff between the temporal and spatial resolution.
Satellites having high temporal resolutions covers larger areas with low spatial resolution
(Lillesand et al., 2014).
Land cover is defined as what is actual on the land surface. For example, forest, water,
built up areas, and diverse types of vegetation. Whereas land use is defined as how humans use
the land. For example, forest parks, agriculture, and so forth (Anderson, 1976). The objective of
the image classification is to categorize all pixels of the image into appropriate land cover classes
or themes (Lillesand et al., 2014). There are many land cover classification schemes used for
worldwide research and planning activities. The Anderson 1976 land use/land cover
classification system (Anderson, 1976) is one of the most widely used globally. Level 1 of the
Anderson classification system consists of 9 land cover classes (Table 1). This study utilizes the
Anderson classification Level 1 system. After the classification, all the pixels except pixels
belonging to “developed” class were converted into null values to separate urban land cover from
non-urban areas in this study.

6
Table 1: Anderson land use/land cover classification system.
Level I Level II
1. Urban or Built up Land
11. Residential 12. Commercial and Services 13. Industrial 14. Transportation, Communications and Utilities 16. Mixed Urban or Built-up Land 17. Other Urban or Built-up Land
2. Agricultural Land
21. Cropland and Pasture 22. Orchards, Groves, Vineyards, and Nurseries 23. Confined Feeding Operations 24. Other Agriculture Land
3. Rangeland 31. Herbaceous Rangeland 32. Shrub and Brush Rangeland 33. Mixed Rangeland
4. Forest Land 41. Deciduous Forest Land 42. Evergreen Forest Land 43. Mixed Forest Land
5. Water
51. Streams and Canals 52. Lakes 53. Reservoirs 54. Bays and Estuaries
6. Wetlands 61. Forested Wetlands 62. Nonforested Wetland
7. Barren Land
71. Dry Salt Flats 72. Beaches 73. Sandy Areas Other than Beaches 74 Bare Exposed Rock 75. Strip Mines, Quarries, and Gravel Pits 76. Transitional Areas 77. Mixed Barren Land
8. Tundra
81. Shrub and Brush Tundra 82. Herbaceous Tundra 83. Bare Ground 84. Wet Tundra 85. Mixed Tundra
9. Perennial Snow or Ice 91. Perennial Snowfields 92. Glaciers

7
CHAPTER II
LITERATURE REVIEW
It has been noted that urban land cover has been rapidly expanding within the Kathmandu
Valley over the past few decades (Ishtiaque et al., 2017), and that there are many drivers behind
this change. In order to make sense of this change, it is first important to establish a fuller picture
of the drivers that fuel it. Many drivers of LULC change have been noted in the research record,
but there are a few categories of change that seem to be altering the valley to a greater degree
than others; these drivers include economic liberalization, the Maoist movement, the peace
process and tourism. This section discusses different drivers of urban land cover change in the
Kathmandu Valley.
Economic Liberalization in 1990
Economic conditions are one of the major drivers of LULC change. Jain et al. (2016)
reported that the economic reforms of 1991 in India was one of the main drivers of
unprecedented rate of LULC change. Nepal entered into a new era of economic liberalization
after its achievement of democracy in 1990. Before 1990, the country was ruled by a
“Panchayat” system, which is a party-less self-governing system under the king. The king had
the highest and absolute authority, and civil liberties and press freedom were curtailed. Nepal
achieved its democracy after a successful people’s movement. It should be noted that before
1990, Nepal was inside a closed door under the Panchayat system. The peoples’ movement did
not only bring reform in the country, but also opened its gate to the global market.
Although Nepal had signed treaty with World Bank and International Monetary Fund
(IMF) in 1986 and 1989 to deregulate the domestic market and promote greater international
trade, the true economic liberalization of Nepal was not carried out until the passing of the
8
Industrial Act in 1990 (Sakya, 2010). The Act guided the nation to market-based capitalism,
although the ruling parties were inclined towards the Marxist-Leninist philosophy. Nepal also
reduced international tariff and non-tariff barriers to trade significantly. There were various laws
and policies made after the liberalization to promote the free market concept. The country
established the Foreign Investment and Technology Transfer Act in 1996. The main objective of
the Act was to help foreign business ventures to invest in the Nepalese market without the need
for having a Nepali business partner. The act also helped reduce unnecessary controls on capital
repatriation (Sakya, 2010). Similarly, Nepal also established an Industrial Promotion Board in
1997 whose main objective was to help ensure that the policies of free market were implemented
throughout the country. The economic liberalization combined with the democratic people’s
movement not only provided an opportunity to compete in market-based competitive capitalism,
it also brought profound change in the social organization of the country.
As a consequence of these change, economic dependency of Nepal became much more
complex and closer with its neighboring country of India. Exports to and imports from India
increased significantly, the number of tourists visiting Nepal from India also grew significantly,
and Nepal’s economic performance improved as measured by increase in per capita income
throughout the 1990s. According to the World Bank (2002), economic liberalization and
macroeconomic stability were the two major factors for this improvement.
Increases in economy and GDP could lead to increase in the conversion of land to urban
areas. Wu et al. (2013) reported that urban land cover of Hangzhou metropolitan area was
positively correlated with changes in Gross Domestic Product. Similarly, Deng et al. (2010) also
reported a similar relationship between GDP and urban development in China in their study.
However, Karmacharya (2001) pointed out that the economic growth of Nepal was not sustained
9
after 1996. He pointed out that the benefits of the globalization were not fully materialized in
Nepal. Many of the infant industries in Nepal simply could not compete in the global market.
Karmacharya also pointed out that the service industry was one of the back buttresses of rapid
economic growth from 1990 to 1995. It should be pointed out that the majority of service
industries were located within Kathmandu Valley. However, the service sector was not backed
up by the strong domestic production of expended services (Karmacharya, 2001). Similarly, the
distribution of income, generated from entering the liberal market, was very unequal. Urban
areas took most of the share of the increase in revenues and income, putting rural areas suffered
due to migration. This income disparity put more pressure on the urban areas. Lambin et al.
(2001) pointed out that the integration in the global market through globalization always leads to
the rapid change in land use and land cover change. This is especially true in developing
countries whose economies is nascent and there are lots of opportunities for exploitation.
Kathmandu is one of example of rapid urban land use change after the implementation of the
economic liberalization policy in the country.
The Maoist movement in Nepal
Civil war may also be one of the drivers of urbanization (Fay & Opal, 1999). There was
a wide income gap between the income of urban and peri-urban Kathmandu and rural districts of
Nepal. Murshed and Gates (2005) reported that many of the far western districts has average
income of less than 25 % of Kathmandu, which led to civil war in the country. After the
liberalization of economy in Nepal in 1990, some of the political parties in Nepal were not happy
with the economic and political situation of the country. The Maoist insurgency or Maoist
revolution armed war was fought from 1996 to 2006, between the Communist Party of Nepal
(CPN) and the government of Nepal. According to CPN, one of the main reason for the war was
10
due to the disparity of income and wealth among people in the nation. The wealth was largely
centered in urban centers, especially in the Kathmandu Valley, and the government of Nepal
basically neglected the rural population. The war resulted in deaths over 17,000 people including
civilians, army personals, and the members of CPN party (Hutt, 2004).
The movement or the war was launched from the rural areas (Pettigrew & Shneiderman,
2004). Cities were often regarded as a safe place from the war. The movement was stronger in
the districts and villages with rates of poverty and inequality (Hatlebakk, 2010). Relatively rich
people, and higher caste people felt insecure to live in village. Although Nepal was a Hindu
Kingdom, the country has a deep seated caste system within the society. Maoist party established
their own “Jan Sarkar” in their bastion villages. One of the primary objective of the movement
was to remove caste system in the country. Higher caste people tended to incline away from the
ideology of the party. According to the party, Jar Sarkar is the government of people. Maoist
party had formed their own judicial system as well. During the war, the economic progress of the
rural areas almost halted to full stop as the engines of growth such as banks, and other financial
institutions were targeted in the war by the both parties. The war displaced thousands of people
from rural place to urban areas. Relatively rich people and higher caste people moved to cities as
way to escape from the war as they were targeted by the party.
Beyond economic upheaval, urbanization in the Kathmandu Valley is also directly related
to the Maoist (CPN) war and the people’s movement in the country. Rural areas were heavily
affected by the war between the government of Nepal and CPN party. People migrated to the
urban areas like the Kathmandu Valley to escape the war and to get jobs (Adhikari, 2012).
Many people also migrated to cities as they found themselves targeted by the CPN for not
accepting the Maoist ideology. Much of the government power resided in the cities, especially

11
Kathmandu Valley since the rural areas were controlled by the forces sympathetic to Maoist
movement. This led to the heterogeneous distribution of the country’s resources. The Kathmandu
Valley became a major hotspot for any political incidents. The valley was very important both
politically and economically (Sharma, 2006). These factors helped draw large population to the
valley from rural and fringe areas into the valley, thus increasing the rate of urbanization in the
valley.
Peace process
Nepal entered into a new era after the Maoist party decided to put an end into an armed
struggle and to participate in the merging democratic movement. When the then king of Nepal,
Gynendra Bir Bikram Shaha took direct control of the government of Nepal in 2005, the Maoist
party and 7 other major political parties formed an alliance and called for a nationwide strike
through the country. The King banned all political parties citing that they failed to control or
solve the Maoist insurgency. The leaders of the political parties were arrested and media outlets
were also suppressed by the King. Protestors and cadres from the all the political parties
demonstrated in all the major cities of the country. The Royal Palace was also located within the
Kathmandu Valley, hence, the political parties focused their energy for protest in the Kathmandu
Valley to apply more pressure on the king for reform (Wagle, 2006). There is evidence that
people from villages were imported/brought to the Kathmandu Valley for the strike. The
nineteen days of strike/protest ended after the King formally stepped down from power and the
political parties took control over the government once again. The 10-years long Maoist war
formally ended in 2006 with the signing of a comprehensive peace agreement between the newly
formed government of Nepal and the Maoist party. The peace agreement not only stopped the
12
violence, but also brought the insurgent Maoist party into ballet from bullets (von Einsiedel,
2012; Upreti, 2012).
The year of 2006 also marked another important event in the history of Nepal. After the
Maoist party put their arms and ammunitions to the rest, they participated into an election to
produce a new constitution for the country. The new constitution replaced the king with a
presidential form of government. Although ceremonial, the presidential form of government
played a major role in reshaping the urban centers of Nepal. Once again, all the major activities
such as the constitutional assembly happened within the Kathmandu Valley, putting the valley
into the center once again. Routledge (2008) noted that urban places such as Kathmandu offered
key spaces to bring diverse groups from rural areas to participate in the democratic movement.
According to Routledge (2008), these urban places provides suitable sites for the mass
mobilization of citizens during protests against the King.
Tourism in the Kathmandu Valley
Previous research has shown that tourism is another drivers of urbanization. Qian et al.
(2012) reported that tourism can cause significant expansion of the urban built up environment.
Nepal is a popular destination for mountain climbers, trekkers, religious pilgrims, and for many
other types of people who wants to enjoy authentic rural village lifestyles. Tourism is one of the
main sectors for the country. The Kathmandu Valley serves as the only one international
gateway for tourist coming to visit Nepal via airplane. At present, Nepal has only one
international airport till now, Tribhuvan International Airport and it is located in the Kathmandu
city. Hence, Kathmandu is the first destination of the tourists visiting Nepal via airplanes.
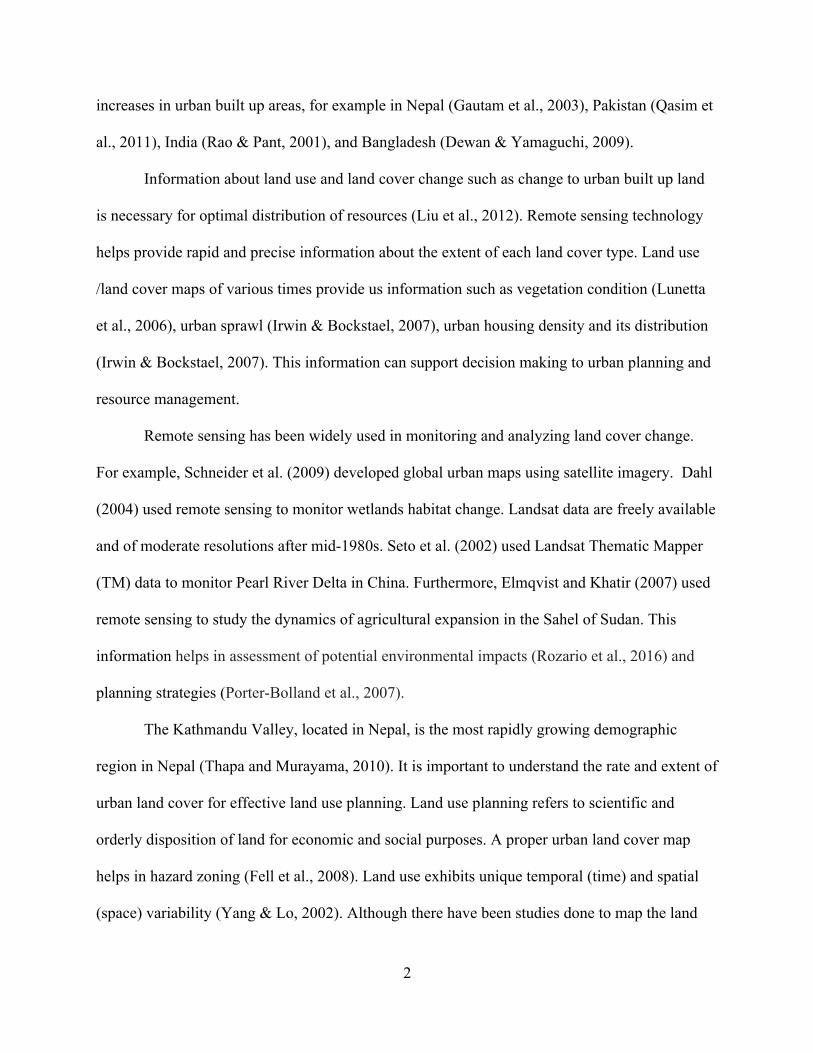
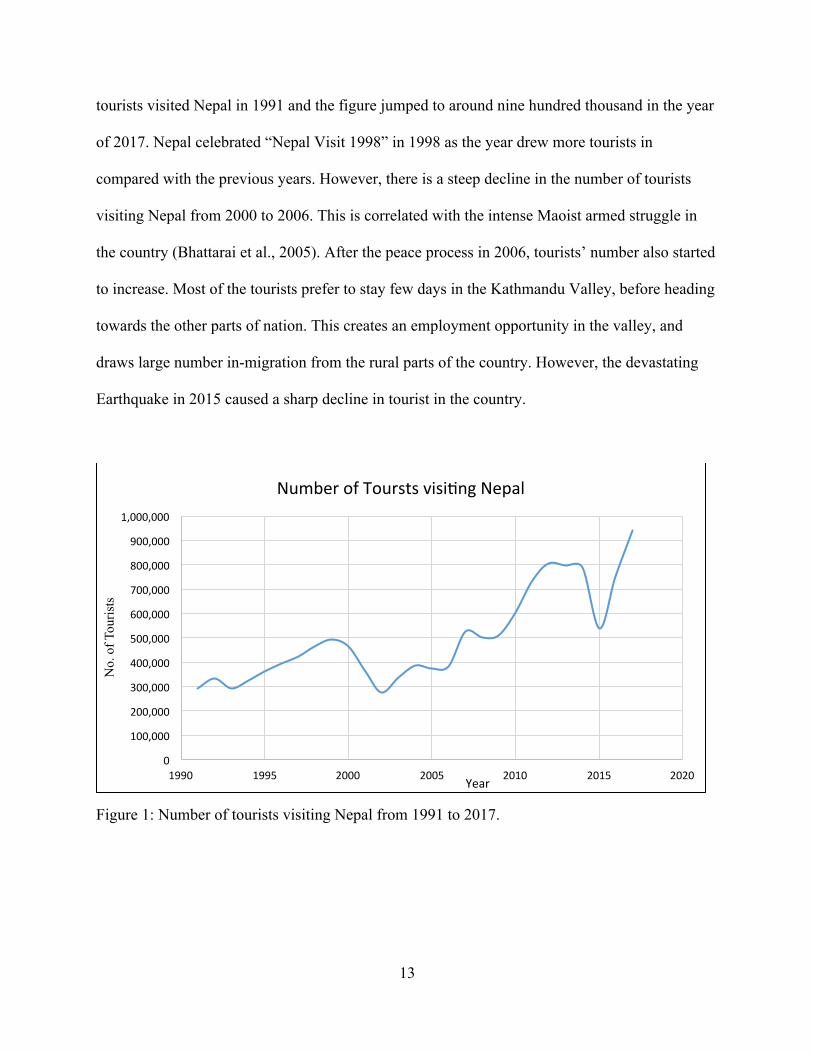
According to the data from the Ministry of Tourism of Nepal, the number of tourists
visiting Nepal has increased from 1991 to 2017 (Figure 1). About three hundred thousand
13
tourists visited Nepal in 1991 and the figure jumped to around nine hundred thousand in the year
of 2017. Nepal celebrated “Nepal Visit 1998” in 1998 as the year drew more tourists in
compared with the previous years. However, there is a steep decline in the number of tourists
visiting Nepal from 2000 to 2006. This is correlated with the intense Maoist armed struggle in
the country (Bhattarai et al., 2005). After the peace process in 2006, tourists’ number also started
to increase. Most of the tourists prefer to stay few days in the Kathmandu Valley, before heading
towards the other parts of nation. This creates an employment opportunity in the valley, and
draws large number in-migration from the rural parts of the country. However, the devastating
Earthquake in 2015 caused a sharp decline in tourist in the country.
Figure 1: Number of tourists visiting Nepal from 1991 to 2017.
0
100,000
200,000
300,000
400,000
500,000
600,000
700,000
800,000
900,000
1,000,000
1990 1995 2000 2005 2010 2015 2020
No.
of T
ouris
ts
Year
NumberofTourstsvisi<ngNepal
14
Landsat satellites
Though there are many ways that LULC can be analyzed and visualized, remote sensing
techniques are among the best outlets for studying LULC. The use of remote sensing to study
land cover change has been documented through many case studies and applied research
programs. NASA’s Landsat satellite program in particular is a valuable source of open and
accessible remote sensing data that can provide high quality imagery for analysis. Different
classification techniques can be used with Landsat imagery to provide a full accounting of land
cover change. The following section of this literature review will provide a foundational
understanding of these subjects and demonstrate their relevance to this research. This section will
first explain Landsat 5 and Landsat 8. This will be followed by a section that details the use of
remote sensing by other researchers to study urban land cover change. This section will conclude
by describing a selection of relevant image classification techniques and the history of study of
land cover change in the Kathmandu Valley.
Landsat satellites are earth observing satellites launched by the National Aeronautics and
Space Administration (NASA) and administered by the United States Geological Survey
(USGS). Landsat 5 and Landsat 8 were launched on 1984 and 2013 respectively. Landsat 5 has
both the Thematic Mapper (TM) and Multispectral Scanner (MSS) and Landsat 8 has the
Operational Land Imager (OLI) and the Thermal Infrared Sensor. Both of the satellites have a
spatial resolution of 30 m (except for panchromatic and thermal bands). The Landsat 5 TM
sensor has 7 bands (Table 2; Source: USGS), whereas Landsat OLI has 9 bands (Table 3). Both
the satellites have a temporal resolution of 16 days. This study utilizes Landsat 5 TM and
Landsat 8 OLI remotely sensed data.
15
Table 2: Band designation of Thematic Mapper sensor in Landsat 5.
Landsat 4-5 Thematic Mapper (TM)
Bands Wavelength (micrometers)
Resolution (meters)
Band 1 -Blue 0.45 - 0.52 30 Band 2 - Green 0.52 - 0.60 30 Band 3 - Red 0.63 - 0.69 30 Band 4 - Near Infrared (NIR) 0.76 - 0.90 30 Band 5 - Short Wave Infrared (SWIR) 1 1.55 - 1.75 30 band 6- Thermal 10.40 - 12.50 120 Band 7 - Short Wave Infrared (SWIR) 2 2.08 - 2.35 30
Table 3: Band designation of Operational Land Imager sensor in Landsat 8.
Landsat 8 Operational Land Imager (OLI) and Thermal Sensor (TIRS)
Bands Wavelength (micrometers)
Resolution (meters)
Band 1 - Ultra Blue (coastal/aerosol) 0.435 - 0.451 30
band 2 - Blue 0.452 - 0.512 30 Band 3 - Green 0.533 - 0.590 30 Band 4 - Red 0.636 - 0.673 30 Band 5 - Near Infrared (NIR) 0.851 - 0.879 30 Band 6 - Shortwave Infrared (SWIR) 2 1.566 - 1.651 30
Band 7 - Shortwave Infrared (SWIR) 2 2.107 - 2.294 30
Band 8 - Panchromatic 0.503 - 0.676 15 Band 9 - Cirrus 1.363 - 1.384 30 Band 10 - Thermal Infrared (TIRS) 1 10.60 - 11.19 100 * (30)
Band 11 - Thermal Infrared (TIRS) 2 11.50 - 12.51 100 * (30)
Use of remote sensing to study urban land cover
Hundreds of researchers have used remote sensing to detect urban change. For example,
Weng (2001) used remote sensing technique to study the urban expansion in the Zhujiang Delta
of South China from 1989 to 1997. Land cover of the Delta experienced a rapid change due to
16
accelerated economic activity. The researchers analyzed band 2 (green), band 3 (red) and band 4
(near-infrared) of multitemporal Landsat TM data. A supervised classification approach paried
with the maximum likelihood algorithm was utilized to classify the images into urban land,
barren land, crop land, horticulture farms, dike-pond land, forests, and water bodies. The
accuracy of the classification ranged from 85.43% to 90.57%. The researcher also analyzed the
urban growth pattern by using a GIS-based modelling approach and reported significant
increases in urban land cover during the study period. The study also found out that the urban
expansion was inversely related to the distance from major road. Specifically, urban expansion in
Zhujiang Delta declined as the distance increased away from a major road.
Similarly, Yuan et al. (2005) also used Landsat TM data to monitor the land cover of
seven counties within the Twin Cities Metropolitan Area of Minnesota. They combined late
spring and summer images to distinguish bare soil and annual crops. They also used reference
data to improve the accuracy of the study. A post classification approach was utilized, to reduce
the classification errors caused by the similar spectral responses from bare soil and impervious
surfaces such as urban land using GIS. They employed hybrid supervised and unsupervised
classification technique for the change detection procedures. In their study, the root mean square
error (a measure of accuracy) was less than 0.25 pixel. The researchers used different method for
the accuracy assessment. They compared their classification results with the Natural Resources
Inventory classification schemes using the χ2 statistical test. Their overall land cover
classification accuracy averaged 94%. The researchers also emphasized the important use of the
3x3 majority filter tool in the study to smooth the classification results. Their research showed
that the urban land cover is growing rapidly in seven counties of Twin Cities Metropolitan Area
of Minnesota.

17
A different approach is taken by Mundia and Aniya (2005) to study the urban land cover
in Nairobi of Kenya. They combined three Landsat images together with socio-economic data to
understand the spatial dynamics of the land cover change. Multispectral scanner, Thematic
Mapper and Enhanced Thematic Mapper plus (ETM+) data were used to study the land cover
change of the city from 1976 to 2000. They used the Iterative Self-Organizing Data Analysis
(also known as ISODATA) algorithm technique, which is an unsupervised classification
technique, in ERDAS Imagine. ISODATA does not require any training samples as inputs.
Landsat data were rectified according to the Clarke 1880 spheroid and UTM projections. The
images were properly georectified using 10 ground control points. They adopted the Anderson
classification design in their study to classify land cover. The overall accuracy (Kappa index)
was about 0.86. Their results indicated that the urban built up area expanded by about 47 sq. km
from 1976 to 2000. Using socioeconomic data of various years (from 1975 to 2002) after post
classification revealed that economic growth was the key factor in urban expansion. Their results
also showed that the growing network of roads played significant role in spatial distribution of
urban built area.
Lu and Weng (2004) also emphasized the importance of Landsat data to study
impervious land cover. They examined the characteristics of urban land cover using spectral
mixture analysis by employing ETM+ images. The images of Indianapolis in the US state of
Indiana was chosen as a study site by the researchers. They transformed the values from the
images into principal components after applying minimum noise fraction transformation to the
data. For land covers’ end members: shade, green vegetation, impervious surface, and soils, were
selected as the inputs. The researchers employed a maximum likelihood classification algorithm
along with spectral mixture analysis in the study. After applying 3 x 3 focal window, they were
18
able to achieve up to 86% accuracy. Their results indicated that Landsat data are very useful to
study urban land cover.
A different algorithm, the Spectral angle mapper (SAM) was used by Girouard et al.
(2004) to study the usefulness of Landsat TM data for Landsat thematic mapper data for
geological mapping in Central Jebilet of Morocco. Their purpose was to compare Quickbird and
Landsat data using SAM. They corrected the atmospheric effects on images using the Herman
transfer radiative code. They applied Principal Component (PC) transformation as a guide for
their end member selection to train SAM classification algorithm. One of the interesting things to
point out from their study is that although Quickbird data has a high spatial resolution compared
to TM data from Landsat, Quickbird did not provide good results compared to TM because of its
low spectral resolution. Although Landsat data has medium spatial resolution, Quickbird data has
only 4 spectral resolutions whereas Landsat data has 7 spectral resolutions. Hence, Landsat
outperformed Quickbird in geological mapping in Central Jebilet of Moracco.
Sarvestani et al. (2011) studied three decades of urban growth in the city of Shiraz, Iran
using remote sensing. This study uses Landsat MSS, Landsat TM, and Landsat ETM+, along
with SPOT 4 to study the urban cover change from 1976 to 2005. They applied supervised
classifications to all the images to classify them into four classes urban built- up area, vegetated
land, bare land, and water. The kappa index ranged from 0.88 to 0.95. Urban areas grew by
181% over the period of three decades. The researchers coupled the results of the classification
with population data, obtained from United Nations and Iranian censuses, for various years and
reported that the population growth rate and the city growth rate in area were very close. Their
results also revealed that the vegetated areas per capita decreased from 60.50 m2 to 31.36 m 2 and
19
recommended including protection and development of vegetation area in a comprehensive
master plan of the city to preserve the quality of life of the residents.
A similar approach is taken by Rawat and Kumar (2015) to study land use/land cover
change of the Hawalbagh block of Almora district in Uttarakhand, India from 1990 to 2010.
They also utilized Landsat TM data for the change detection. Supervised maximum likelihood
classification technique was employed in ERDAS Imagine software to categorize into
vegetation, agriculture, barren land, built-up, and water body. The overall accuracy of the
classification was 90.29% for 1990 and 92.13% for 2010 data. Built up area increased from 2.72
km2 to 12.20 km2. Unlike other studies, the researchers reported that the vegetation of
Hawalbagh block also increased by 9.39 km2 from 1990 to 2010. They attributed afforestation
programs promoted by the government as a major factor for the increase of vegetation.
Islam et al. (2018) also employed maximum likelihood classification technique to study
change detection by using multi temporal Landsat 5 TM and Landsat 8 OLI remotely sensed data
in Chunati wildlife sanctuary, Bangladesh. The scholars considered 2005 as a base year and
examined the change from 2005 to 2015. The scholars categorized the images into sixteen
different classes, and the accuracy ranged from 83 percent to 100 percent. Natural forest
preserves decreased by 1911 ha. The researchers attributed this change to intense pressures from
the growth of surrounding populations. The researchers warned that the fragmented land could
affect natural habitat of Asian elephant and other wildlife.
Image classification techniques
The primary objective of image classification is to convert the digital numbers of the
images, collected by satellite sensors, into land cover classes, also known as themes. Several
image classification method exists for image processing. Image classification techniques can be
20
grouped into two types: pixel based classification, and object based classification technique
(Schowengerdt, 2012). In pixel based classification, an algorithm is applied to the individual
pixels. Whereas in object based classification, pixels are grouped to form objects. Image texture,
pixel proximity, feature size, shape, repetition, and context are taken into account in object-
oriented classification (Lillesand, 2014), whereas only spectral information is used in pixel based
classification method. When using Landsat data, the classification results between pixel based
and object based are not always statistically significant (Duro et al., 2012; Dingle & King, 2011).
Several researchers have used pixel based classification to study urban areas around the globe
(for example, Zha et al., 2003; Muñoz-Marí et al., 2007; Erbek et al., 2004; Alphan, 2003). This
study employs pixel based classification technique. There are various classification algorithms
for the pixel based classification technique. They generally fall under three categories:
supervised, unsupervised, and hybrid classification technique. These three types are revised in
the next sections.
Unsupervised classification: The unsupervised classification method converts digital
numbers of the image without the utilization of training samples. The user does not provide
sample classes as an input. Unsupervised classification assumes that the digital numbers of same
land cover types are close to each other in vector space, and so the digital numbers belonging to
different land cover classes are well separated (Lillesand et al., 2014).
Supervised classification: This technique is most often applied in quantitative analysis of
remotely sensed images (Richards, 2013). In supervised classification, spectral domain are
segmented into regions that are associated with particular types of ground cover (Richards,
2013). There are three steps in supervised classification. (a.) the researchers identifies the pure
spectra of various land cover or themes, as a set of training samples, either from the field work or
21
from aerial imagery (b.) the training sample is then used to classify images to produce thematic
LULC maps (c.) finally, accuracy assessment is conducted on the classified/thematic maps.
There are several classification algorithms that may be found in the literature within the
supervised classification technique. For example, there is a minimum distance to means
classifier, a Parallelepiped classifier, and a Gaussian maximum likelihood classification
(Lillesand, 2014). The Gaussian maximum likelihood classification, also known as the
maximum likelihood method, is the most commonly used algorithm to classify images. This
classification algorithm evaluates the variance and covariance of the spectral domain of the
image (Lillesand, 2014). However, it is assumed that the probability density function of digital
numbers of each category of image, are assumed to be normally distributed. The probability
density functions generated from the training samples are used to classify unknown/unidentified
pixels of the image. The probability of any given pixels of falling into each class is computed,
and computer program assigns that pixel into the category that has the highest probability of
accurate classification.
Hybrid classification: The hybrid classification routine uses the combination of both
supervised and unsupervised classification techniques.
This type of classification is employed when there is complex variability in the spectral
response of land cover in the remotely sensed data (Lillesand et al., 2014). This type of
classification is suitable for feature reduction, and feature selection and is often combined with
guided clustering (Phillips et al., 2009).
Hundreds of researchers around the globe have used maximum likelihood classification
techniques in their research (for example: Suhura et al., 2018; Alfa et al., 2018; Mukhopadhyay
et al., 2018; Camilleri et al., 2017). The maximum likelihood method consumes less computing

22
time as compared to non-parametric methods such as backpropagation neural networks (Paola &
Schowenderdt, 1995). Many researchers have reported more than 80 percent accuracy when
employing this algorithm in their studies (for example: Otukei & Blaschke, 2010;Erbek et al.,
2004; Karan et al., 2016). For my study of urban land change in the Kathmandu Valley of Nepal,
I used the maximum likelihood classification technique to classify remotely sensed data into
thematic classes.
Land cover mapping in the Kathmandu Valley, Nepal
Thapa (2009) studied the land cover change of the Kathmandu Valley from 1967 to 2000
using remotely sensed data. He used images acquired by the Corona satellite (1m2 resolution) for
1967. However, these high resolution images were only available for a very limited area of the
valley (Thapa, 2009). Similarly, the researcher used MSS 30m2 resolution to study the urban
cover in 2000. The researcher classified the image into six land cover types: shrubs, forest,
water, urban/built up area, open space, and agriculture areas. Urban/ built up areas occupied only
2.94 percent of the total area of the valley. In 2000, the urban area increased to 14 percent of the
total. Another significant change was noticed in forest shrub land cover. Shrubs occupied 19.81
percent in 1967 and this land cover declined to 10.44 percent in 2000. From personal interviews,
the researcher found that there were very few houses along the road in 1967, and the changed
areas was agricultural land. The scholar reported that with the extension of roads in the valley,
the rural agricultural landscape gradually changed to a peri-urban landscape.
The International Centre for Integrated Mountain Development (ICIMOD) conducted a
land cover classification study of Nepal in 1990 (ICIMOD, 2014), in 2000 and in 2010
(ICIMOD, 2013). For all the years, Landsat Thematic Mapper data (30m2 resolution) was used
for the LULC classification. They used the Geographic Object Based Image Analysis technique
23
to classify land cover of whole country. The remotely sensed images were classified into eight
different classes: forest, shrubs, grass, agriculture, bare areas, water bodies, snow, and built ups.
According to the study, about 45.15% of Nepal was covered by forest and 25.41% was covered
by agriculture in 1990. Forest land cover was reduced to 41.9% in 2010, however, agricultural
land increased to 27.32% in 2010. About 0.32 percent of the entire country was covered by built
up/urban areas in 2010. According to ICIMOD, the land cover study of Nepal in 2010 is the first
and most complete national land cover classification conducted in the country.
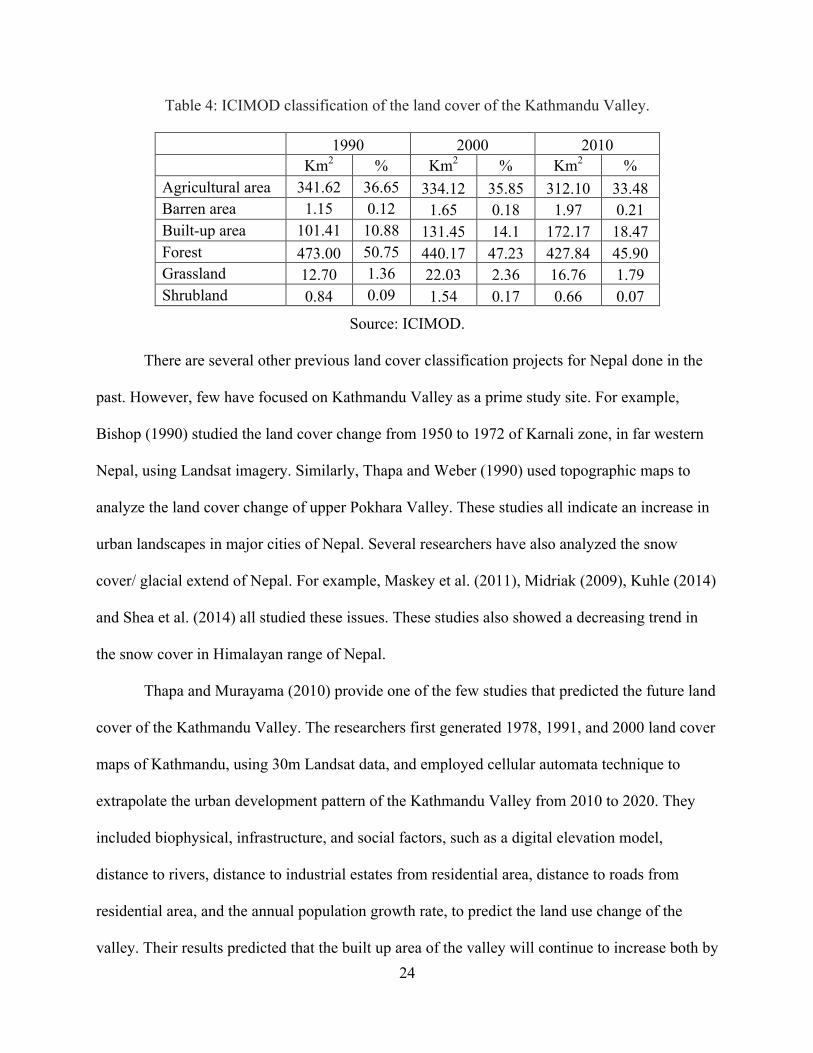
A clip was performed using ICIMOD’s national land cover dataset for the years of 1990,
2000 and 2010, in order to extract the land cover of the Kathmandu Valley specifically. This
simple geospatial procedure was conducted in order to demonstrate how the valley’s land cover
changed over time. In 1990, some 50.75% of the valley was covered in forest and 36.5% was
covered in agricultural land, with negligible amounts of barren land, grassland and shrubland
(Table 4). At this point in time, urban built-up area accounted for 10.88% of the land within the
valley. By 2000, the percentage of forested and agricultural lands had decreased slightly with
47.23% of land being classified as forest and 35.85% being classified as agricultural land. Built-
up urban areas had increased to 14.1% of the total land, roughly corresponding with the amount
of forested and agricultural land lost. By 2010, the built up area of the valley had increased to
18.47%, and forested and agricultural land had decreased to 45.9% and 33.48% respectively. The
decline of agriculture and forested lands represents a major change in the land cover of the
valley, and demonstrates very much the impact of humans on the environment. The built up
areas are expanding at the expense of agricultural and forestland in the Kathmandu Valley.
24
Table 4: ICIMOD classification of the land cover of the Kathmandu Valley.
1990 2000 2010 Km2 % Km2 % Km2 % Agricultural area 341.62 36.65 334.12 35.85 312.10 33.48 Barren area 1.15 0.12 1.65 0.18 1.97 0.21 Built-up area 101.41 10.88 131.45 14.1 172.17 18.47 Forest 473.00 50.75 440.17 47.23 427.84 45.90 Grassland 12.70 1.36 22.03 2.36 16.76 1.79 Shrubland 0.84 0.09 1.54 0.17 0.66 0.07
Source: ICIMOD.
There are several other previous land cover classification projects for Nepal done in the
past. However, few have focused on Kathmandu Valley as a prime study site. For example,
Bishop (1990) studied the land cover change from 1950 to 1972 of Karnali zone, in far western
Nepal, using Landsat imagery. Similarly, Thapa and Weber (1990) used topographic maps to
analyze the land cover change of upper Pokhara Valley. These studies all indicate an increase in
urban landscapes in major cities of Nepal. Several researchers have also analyzed the snow
cover/ glacial extend of Nepal. For example, Maskey et al. (2011), Midriak (2009), Kuhle (2014)
and Shea et al. (2014) all studied these issues. These studies also showed a decreasing trend in
the snow cover in Himalayan range of Nepal.
Thapa and Murayama (2010) provide one of the few studies that predicted the future land
cover of the Kathmandu Valley. The researchers first generated 1978, 1991, and 2000 land cover
maps of Kathmandu, using 30m Landsat data, and employed cellular automata technique to
extrapolate the urban development pattern of the Kathmandu Valley from 2010 to 2020. They
included biophysical, infrastructure, and social factors, such as a digital elevation model,
distance to rivers, distance to industrial estates from residential area, distance to roads from
residential area, and the annual population growth rate, to predict the land use change of the
valley. Their results predicted that the built up area of the valley will continue to increase both by
25
in filling of the open land inside the core area, as well as the rapid outward expansion of the built
up areas. They predicted that the future expansion will take place in eastern and southern
direction within valley. They also acknowledged that the future urban development will be
influenced by the existing roads network and the complex topography of the valley.
Similarly, Rimal (2011) used Markov chain analysis to predict the 2017 land cover of
Kathmandu city, and Lalitpur city (excluding Bhaktapur city also with in the valley). Markov
chain analysis is a stochastic process that is useful for future prediction based on the present
conditions and the history of the state. At first, the scholar studied the land cover of Kathmandu
city, and Lalitpur city of Nepal from 1976 to 2009 using Landstat MSS, TM and ETM+ data and
found out that the urban built up areas of the two cities increased from 10.90 km2 in 1976 to
43.10 km2 in 2009. This increase in the built up area is correlated with the decrease in forest
cover and water body. The cultivated land of the cities also decreased from 38.40 sq. km in 1976
to 17.30 sq. km in 2009. He then applied a Markov chain analysis model in the study site. The
probability model showed that the urban land of the two metro cities will increase by 3.60 km2
from 2009 to 2017.
All of the above studies showed that the land use and land cover of many places
throughout Nepal has been changing at a rapid pace. Remote sensing and GIS has proven to be a
valuable tool in understanding the spatial and temporal scales of land use and land cover
changes. Given the incredible rate of land use change which was observed during the field visit,
in summer 2018, there is an urgency to document and measure urban land.

26
CHAPTER III
MATERIALS AND METHODS
This chapter first describes the study area, and then transitions into datasets used for this
thesis. Finally, it discusses image classification technique and accuracy assessment of the image
classification.
Study area
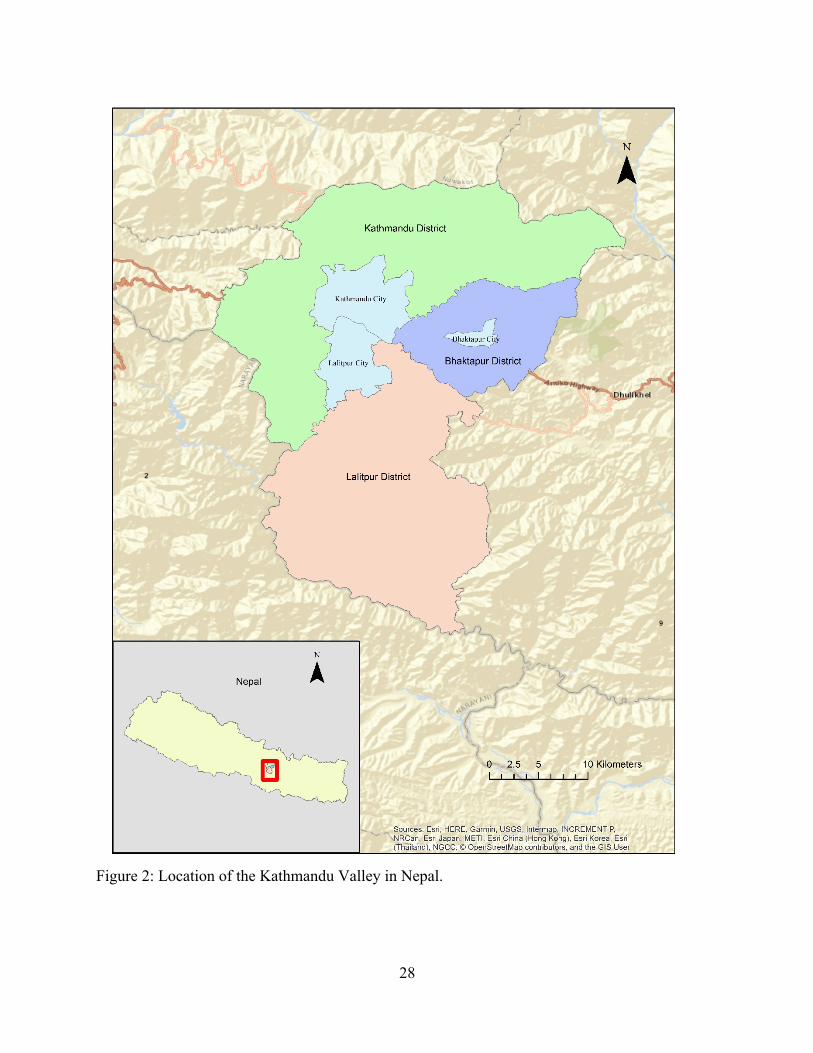
The Kathmandu Valley, located in the central part of Nepal (Figure 2), lies in 850 15`
East longitude and 270 37` North, is the most densely populated region of the country. It lies
within the central hill region and comprises of three districts: Kathmandu District, Bhaktapur
District, and Lalitpur District, with each covering an area of 395 km2, 119 km2, and 385 km2,
respectively. Kathmandu District consist of eleven municipalities (including Kathmandu City),
Lalitpur District consists of six municipalities (including Lalitpur City), and Bhaktapur District
consists of four municipalities (including Bhaktapur City) (Figure 2).
The valley is bowl shaped and surrounded by hills with elevations ranging from 1,500 m
to 2,800 m (Gurung, 2014). According to the report published by the World Bank, the
Kathmandu Valley is the fastest growing metropolitan region in the South Asia with a 4 percent
annual growth rate (Muzzini & Aparicio, 2013). Other amenities such as adequate infrastructure
and employment opportunities are not being developed at the same pace as the population
growth rate (Haack & Rafter, 2006). According to Muzzini and Aparicio (2013), the core of the
valley has a stabilized population but the peripheral portions of the valley are experiencing rapid
unstrained growth. In the hills of the valley, temperate/cool temperate climatic conditions are
prevalent whereas a subtropical climate is dominant in the basin. The maximum mean
temperature of the valley is 35.6o C for the month of April and minimum mean temperature is –
27
3o in January, with an annual average humidity of 75% (Pant & Dangol, 2009). Due to its cool
climate and fertile soil, historically, the valley is very productive in agriculture (ICIMOD, 1993).
The valley floor is intensely cultivated and terrace farming is prevalent in the hilly areas of the
valley. The crops in the valley are rice, wheat, barely. The valley is drained by the Bagmati River
Watershed. Kathmandu City and Lalitpur City are connected by a 27 km ring road which circles
the two cities. Industrial areas blend together with the residential and commercial districts in the
valley. The valley hosts many industrial businesses such as cement factories and brick factories.
Due to its bowl shape and low wind speed, the air is not quickly dispersed in the valley. Hence,
air particulates produced from the factories and road resuspension often exceed the World Health
Organization’s Air Quality guidelines (Haack & Rafter, 2006). This is called temperature
inversion. The population of the valley was 1,105,379 in 1991 and is projected to be 2,877,255
by 2020 (Central Bureau of Statistics, 2016).
28
Figure 2: Location of the Kathmandu Valley in Nepal.
29
Datasets
Landsat images: Landsat has a long history of continuously monitoring earth features and
has a moderate resolution of 30 m. and are used for urban land cover change studies (Alberti et
al., 2004; Xian and Crane, 2006; Zhang 2002)
Nepal experiences monsoon starting from July until the end of October, which causes
many images to be covered by clouds. Kondo et al. (2005) reported that the aerosols such as
NO2, and O3 are higher in the winter season in the Kathmandu Valley. Aerosols and clouds
present difficulty in isolating path radiance from the top of atmosphere radiance and affect the
Landsat scene quality (Ichoku et al., 2004; Liang et al., 2001). Hence, images of post winter
seasons are appropriate for LULC change detection. All the images were acquired for the month
of March or April to reduce phenological bias. The Landsat images have been atmospherically
corrected by United States Geological Survey (USGS) with Landsat Ecosystem Disturbance
Adaptive Processing System and the L8SR algorithm. Surface reflectance products are generated
and radiometrically corrected by USGS using specialized software “Landsat Ecosystem
Disturbance Adaptive Processing System (LEDAPS)” developed by NASA. Images with less
than 10 percent cloud cover of Landsat 5 TM and Landsat 8 Optical Land Imager (OLI) were
downloaded from the USGS website (https://earthexplorer.usgs.gov/). Surface reflectance
imageries (Level 2) instead of Level 1 were downloaded for the years of 1990, 2006, and 2018
(Table 5).
30
Table 5: Summary of the satellite data.
Year Satellite Sensor No. of scenes
Acquisition date
Data type
Path /Row
Cloud Cover
2018 Landsat 8 Operational
Land Imager
7 3/21/2018 Level 2 141/41 <10%
2006 Landsat 5 Thematic Mapper 6 4/3/2006 Level 2 141/42 <10%
1990 Landsat 5 Thematic Mapper 6 4/9/1990 Level 2 141/43 <10%
• Scene id of 2018: LC08_L1TP_141041_20180321_20180403_01_T1
• Scene id of 2006: LT05_L1TP_141041_20060304_20161122_01_T1
• Scene id of 1990: LT05_L1TP_141041_19900409_20170131_01_T1
Field data collection
During the summer of 2018, a field visit of the valley was conducted. Thirty Geographic
Positioning points (GPS) were collected during the field visit (Table 6). These points were used
for generation of training samples and accuracy assessment.
31
Table 6: GPS points collected from field visit in the Kathmandu Valley during summer 2018.
No. Latitude Longitude
Land cover No. Latitude
Longitude
Land cover
1 27.737649
85.329603 Built up 16 27.679744
85.336739
Open water
2 27.740659
85.327619 Built up 17 27.6797
85.305297 Built up
3 27.737343
85.298046 Forest 18 27.684697
85.286008 Built up
4 27.647835
85.330869
Agriculture 19 27.518261
85.299153 Forest
5 27.654484
85.322486
Agriculture 20 27.604864
85.330423 Forest
6 27.644046
85.347305
Fallow land 21 27.609183 85.32549
Open space
7 27.525124
85.321047
Fallow land 22
27.663278,
85.438516
Open space
8 27.621172
85.286147 Forest 23 27.665986
85.442131 Forest
9 27.665685
85.268094 Built up 24 27.732715
85.396778
Open water
10 27.71066 85.325914
Open water 25 27.597659
85.375714 Built up
11 27.779331
85.359859 Built up 26 27.585029
85.331478 Built up
12 27.763522
85.366198
Agriculture 27 27.632322
85.325239
Vegetation
13 27.661527
85.312833 Built up 28 27.630121
85.316767
Open space
14 27.66039 85.30987 Built up 29 27.51116 85.330087
Open space
15 27.662182
85.317056 Road 30 27.592151
85.299984
Open space
Image processing and classification
For this study, the Gaussian maximum likelihood classification method (MLCA) was
selected for the classification of all of the Landsat images. Many researchers have used MLCA
32
and reported high accuracy rates for the classifications (for example: Otukei & Blaschke, 2010;
Sarvestani et al., 2011; Rawat and Kumar, 2015; Islam et al., 2018).
A shapefile of the districts of Nepal was downloaded from the website of the
Humanitarian data exchange (https://data.humdata.org), an open data sharing platform managed
by the United Nations Office for the Coordination of Humanitarian Affairs (European
Commission, 2018). Using the query tool in ArcGIS, the boundary of the Kathmandu Valley was
extracted from the districts shapefile and then was converted into a shapefile only representing
the masked portion included in the research. Similarly, the Digital Elevation Model (DEM) of
Nepal was also downloaded from Humanitarian Data Exchange website.
The Landsat images were mosaicked using ArcGIS 10.5 (ESRI, 2010). After excluding
thermal and panchromatic bands, the images were then clipped in the ArcGIS environment using
the Kathmandu Valley boundary. For display purpose, a false color composite (Figure 3) of the
Landsat (band 4, band 3, and band 2) was used because it highlights vegetation and built up
areas. Vegetation appears in bright red, urban areas in cyan blue and the soil appears in brown
colors.
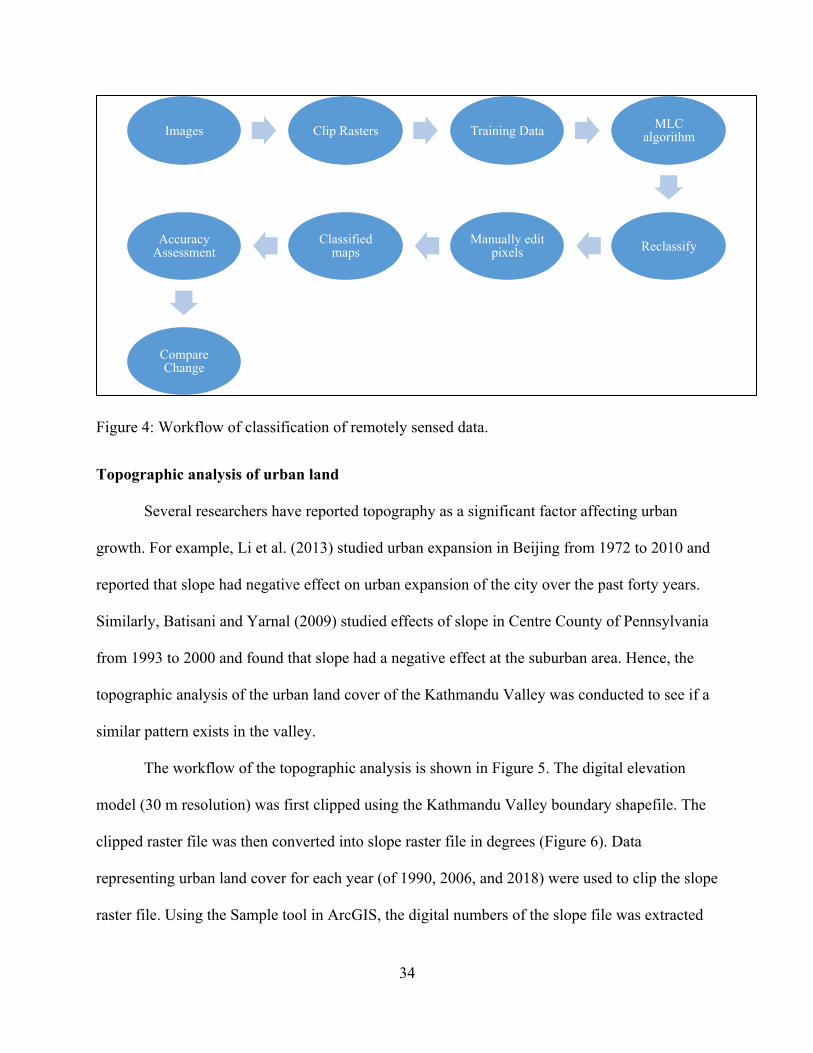
A supervised maximum likelihood classification was used (see Figure 4). This involves
three stages: the training stage, classification stage, and the output stage. (Fu et al., 2014). After
visually identifying different land cover types and also using the ground control points collected
from the field, training data were created. Roads and waterbodies in the image were used to help
identify the training sites. The training data were used as an input for the maximum likelihood
technique to classify the land cover types. The maximum likelihood classification assigns pixels
that have the highest probability of belonging to that class. The Anderson classification scheme
Level 1 (1976) (see Table 1) was used for the classification scheme. After the classification, all
33
other classes, except built up classes, were converted into null values so as to mask out areas of
urban land cover. Urban land cover and bare soil have the similar spectral signatures (Zha et al.,
2003). Much effort was made to separate the urban built up areas from the barren soil/land by
trying to select only pure spectra during the training stage. However, some areas within the study
area required manual editing due to this misclassification between barren soil and urban land
cover.
Figure 3: False color composite of Landsat 8 image of the Kathmandu Valley.
34
Figure 4: Workflow of classification of remotely sensed data.
Topographic analysis of urban land
Several researchers have reported topography as a significant factor affecting urban
growth. For example, Li et al. (2013) studied urban expansion in Beijing from 1972 to 2010 and
reported that slope had negative effect on urban expansion of the city over the past forty years.
Similarly, Batisani and Yarnal (2009) studied effects of slope in Centre County of Pennsylvania
from 1993 to 2000 and found that slope had a negative effect at the suburban area. Hence, the
topographic analysis of the urban land cover of the Kathmandu Valley was conducted to see if a
similar pattern exists in the valley.
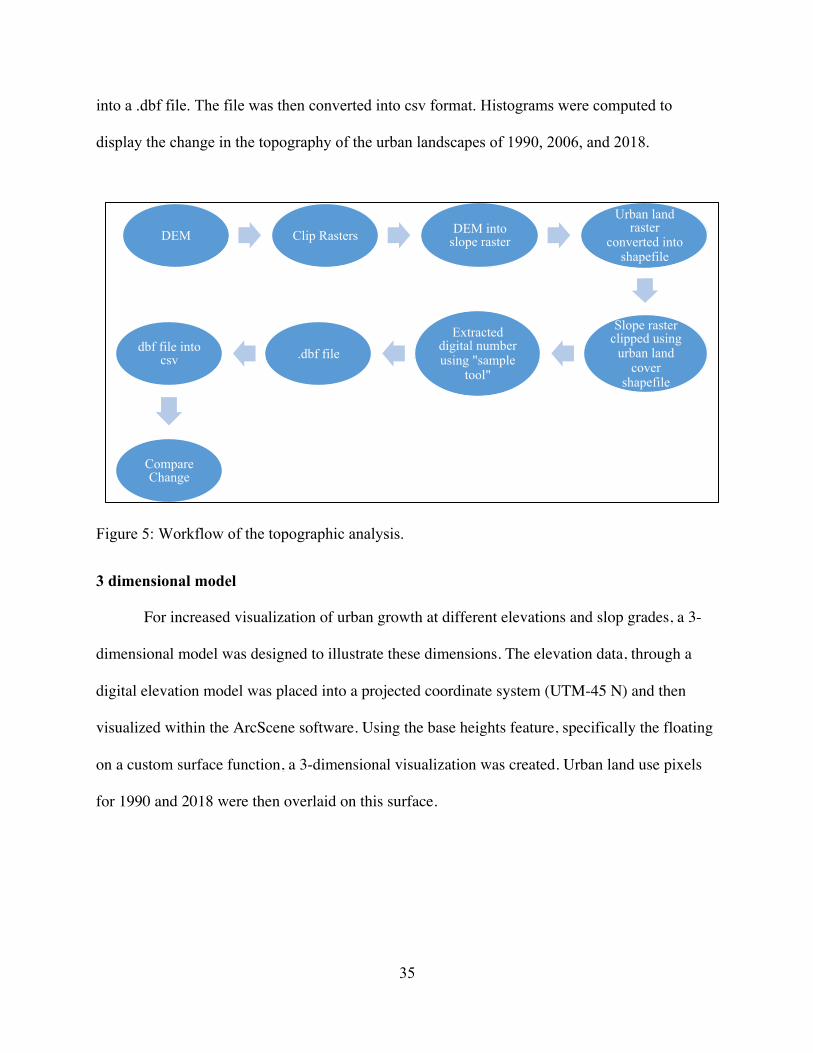
The workflow of the topographic analysis is shown in Figure 5. The digital elevation
model (30 m resolution) was first clipped using the Kathmandu Valley boundary shapefile. The
clipped raster file was then converted into slope raster file in degrees (Figure 6). Data
representing urban land cover for each year (of 1990, 2006, and 2018) were used to clip the slope
raster file. Using the Sample tool in ArcGIS, the digital numbers of the slope file was extracted
Images Clip Rasters Training Data MLC algorithm
Reclassify Manually edit pixels
Classified maps
Accuracy Assessment
Compare Change
35
into a .dbf file. The file was then converted into csv format. Histograms were computed to
display the change in the topography of the urban landscapes of 1990, 2006, and 2018.
Figure 5: Workflow of the topographic analysis.
3 dimensional model
For increased visualization of urban growth at different elevations and slop grades, a 3-
dimensional model was designed to illustrate these dimensions. The elevation data, through a
digital elevation model was placed into a projected coordinate system (UTM-45 N) and then
visualized within the ArcScene software. Using the base heights feature, specifically the floating
on a custom surface function, a 3-dimensional visualization was created. Urban land use pixels
for 1990 and 2018 were then overlaid on this surface.
DEM Clip Rasters DEM into slope raster
Urban land raster
converted into shapefile
Slope raster clipped using
urban land cover
shapefile
Extracted digital number using "sample
tool" .dbf file dbf file into
csv
Compare Change

36
Figure 6: Slope raster file of the Kathmandu Valley (Source: Author).
37
Post classification smoothing and accuracy assessment
Classified data often exhibits a salts and pepper appearance, especially when pixel-by-
pixel classification methods are applied (Lillesand, 2014). Hence, post classification refinement
was used to improve the accuracy of the classification method. Geographic Information Systems
(GIS) provides an excellent platform for facilitating the post classification smoothing process.
The use of a majority filter is one of the means of classification smoothing. A 3 x 3-pixel
majority filter was applied to the classified data. A moving window is passed through the
classified data. The pixel value is then replaced by the majority class within the moving window
(Lillesand, 2014).
An accuracy assessment was performed on this classification, which helps users calculate
the percentage of the image that was correctly classified when compared to the real world (Story
& Congalton, 1986). Accuracy assessments points were randomly generated in the ArcMap
using a stratified random sampling technique. For 1990, 90 points were randomly generated, and
for 2006, 100 points were generated, and for 2018, 100 points were generated. Ground truth was
then conducted to find the accuracy of the classified maps. The time slider of Google Earth was
utilized for 1990, and 2006. Shapefiles were converted into Keyhole Markup language (KML) to
import into Google Earth pro for the accuracy assessment. A non-parametric Kappa test was
used to measure the accuracy of the classified map as it considers all the elements in the error
matrix.
A non-parametric Kappa test (Eq.1) is used to measure the accuracy of each classified
map as it considers all the elements in the error matrix. This study also employs the post
classification detection technique. A confusion matrix is created using points classified as land
38
cover, and points from ground cover. The Kappa Value is computed as follows (Congalton,
1991).
Kappa = !"#$%&$'!!"#$%&$' !"#$$%$&' (!!!"#$%&$' !"#$$%$&')
(Eq.1)
Kappa values reflect the difference between actual agreement and agreement by chance
for the land cover classification. Kappa values ranging from 0.61 to 1.00 are considered to be
good to excellent (McHugh, 2012).

39
CHAPTER IV
RESULTS AND DISCUSSION
This chapter discusses the results of the classification and accuracy assessment of the
classification. It then transitions into the topographic analysis of the urban land cover. Finally, it
identifies the drivers of the urban land cover change in the Kathmandu Valley.
Classified images and accuracy assessments
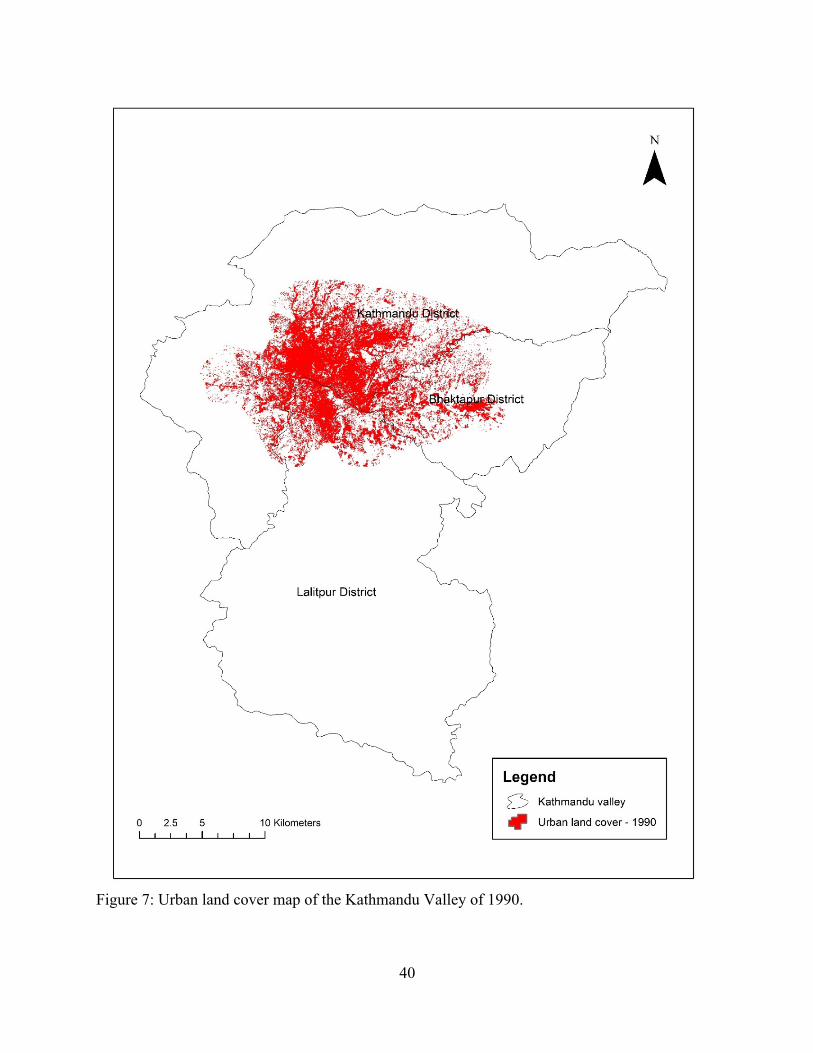
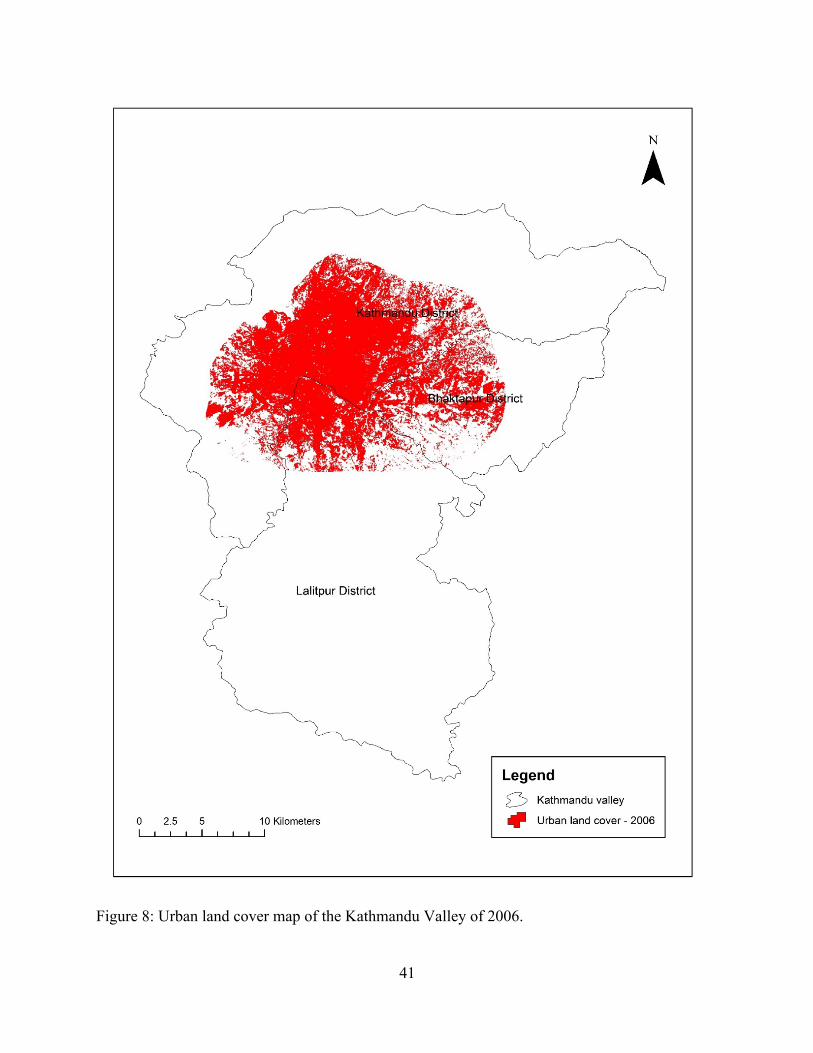
The classified urban land cover map of the Kathmandu Valley for the years 1990, 2006,
and 2018 are shown in Figures 7, 8, and 9, respectively. The combined overlaid urban land cover
map of 1990, 2006, and 2018 is shown in Figure 10.
The user accuracy ranged from 86% to 97% and the producer accuracy ranged from 92%
to 94% (Table 7). The achieved overall classification accuracies were 92%, 93%, and 93% and
overall Kappa statistics were 0.84, 0.86, and 0.84, respectively for the classification of 1990,
2006, and 2018 images. The overall accuracy more than 80% and the kappa value more than
0.80 are considered very good (Anderson, 1976; Lucas et al., 1994; Congalton et al., 1991).
Table 7: Error matrix for 1990, 2006, and 2018 classified images.
1990
Class name Urban Non - urban Total User accuracy Urban 33 4 37 0.94 Non - Urban 3 50 53 0.89 Total 36 54 90 Producer accuracy 0.92 0.93 Classification accuracy = 92%, Kappa Statistics= 0.84
2006
Urban 44 3 47 0.94 Non - urban 4 49 53 0.92 Total 48 52 100 Producer accuracy 0.92 0.94 Classification accuracy = 93%, Kappa Statistics= 0.86
2018
Urban 30 5 35 0.89 Non - Urban 2 63 65 0.94 Total 32 68 90 Producer accuracy 0.94 0.93 Classification accuracy = 93%, Kappa Statistics= 0.84
40
Figure 7: Urban land cover map of the Kathmandu Valley of 1990.
41
Figure 8: Urban land cover map of the Kathmandu Valley of 2006.
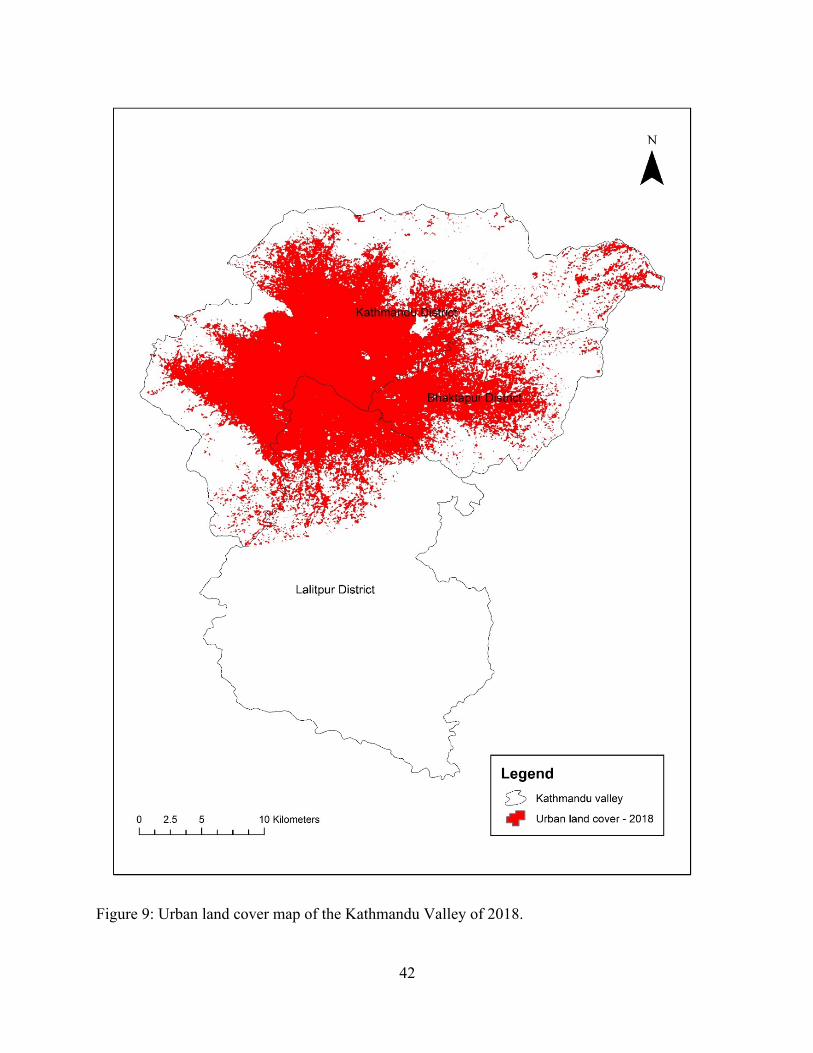
42
Figure 9: Urban land cover map of the Kathmandu Valley of 2018.

43
Figure 10: Overlay map of the urban land cover of the Kathmandu Valley of 1990, 2006, and 2018.
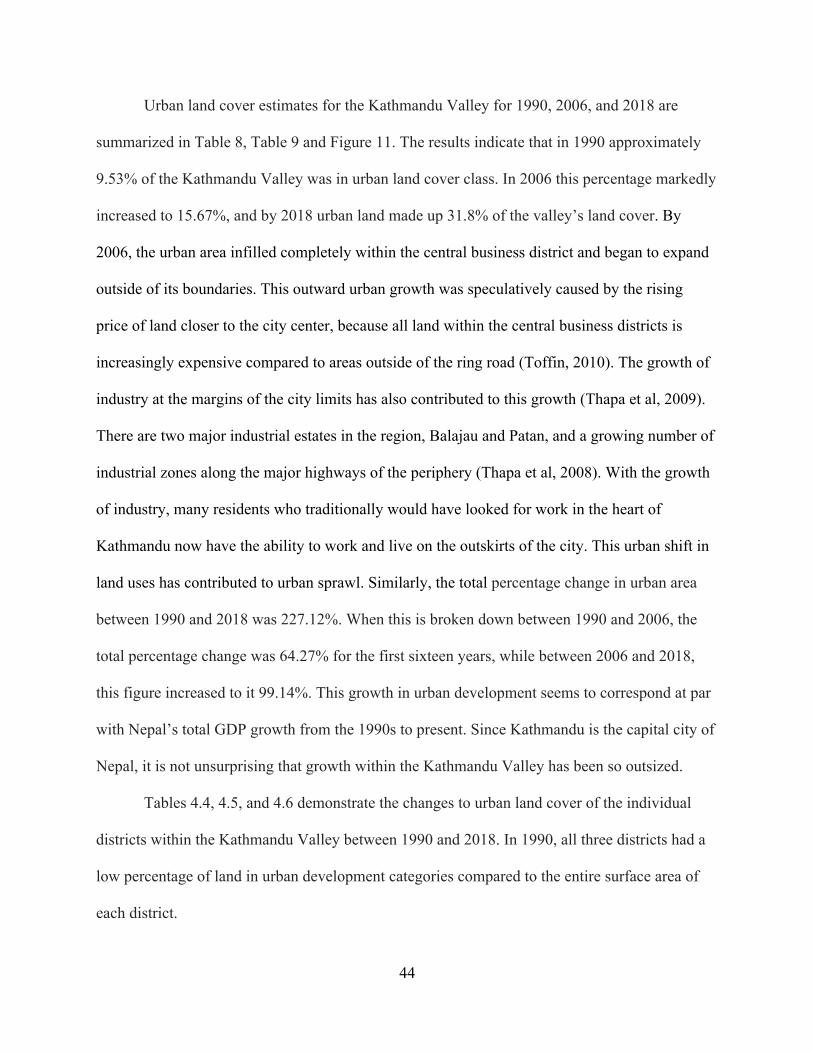
44
Urban land cover estimates for the Kathmandu Valley for 1990, 2006, and 2018 are
summarized in Table 8, Table 9 and Figure 11. The results indicate that in 1990 approximately
9.53% of the Kathmandu Valley was in urban land cover class. In 2006 this percentage markedly
increased to 15.67%, and by 2018 urban land made up 31.8% of the valley’s land cover. By
2006, the urban area infilled completely within the central business district and began to expand
outside of its boundaries. This outward urban growth was speculatively caused by the rising
price of land closer to the city center, because all land within the central business districts is
increasingly expensive compared to areas outside of the ring road (Toffin, 2010). The growth of
industry at the margins of the city limits has also contributed to this growth (Thapa et al, 2009).
There are two major industrial estates in the region, Balajau and Patan, and a growing number of
industrial zones along the major highways of the periphery (Thapa et al, 2008). With the growth
of industry, many residents who traditionally would have looked for work in the heart of
Kathmandu now have the ability to work and live on the outskirts of the city. This urban shift in
land uses has contributed to urban sprawl. Similarly, the total percentage change in urban area
between 1990 and 2018 was 227.12%. When this is broken down between 1990 and 2006, the
total percentage change was 64.27% for the first sixteen years, while between 2006 and 2018,
this figure increased to it 99.14%. This growth in urban development seems to correspond at par
with Nepal’s total GDP growth from the 1990s to present. Since Kathmandu is the capital city of
Nepal, it is not unsurprising that growth within the Kathmandu Valley has been so outsized.
Tables 4.4, 4.5, and 4.6 demonstrate the changes to urban land cover of the individual
districts within the Kathmandu Valley between 1990 and 2018. In 1990, all three districts had a
low percentage of land in urban development categories compared to the entire surface area of
each district.

45
Table 8: Urban land cover of the Kathmandu Valley.
Year Urban Land Cover Non-Urban land cover
Area in km2 Area in % Area in km2 Area in % 1990 88.96 9.53 844.44 90.47 2006 146.13 15.67 787.15 84.33 2018 291.01 31.18 642.41 68.82
Table 9: Change in percentage of the urban land cover of the Kathmandu Valley.
Time period Change in % 1990 - 2006 64.265 2006 - 2018 99.14 1990 -2018 227.12
Source: Calculated by author.
Figure 11: Urban land cover of the Kathmandu Valley in 1990, 2006, and 2018.
0
50
100
150
200
250
300
350
1990 2006 2018
Are
a in
km
2
Year
Urban land cover
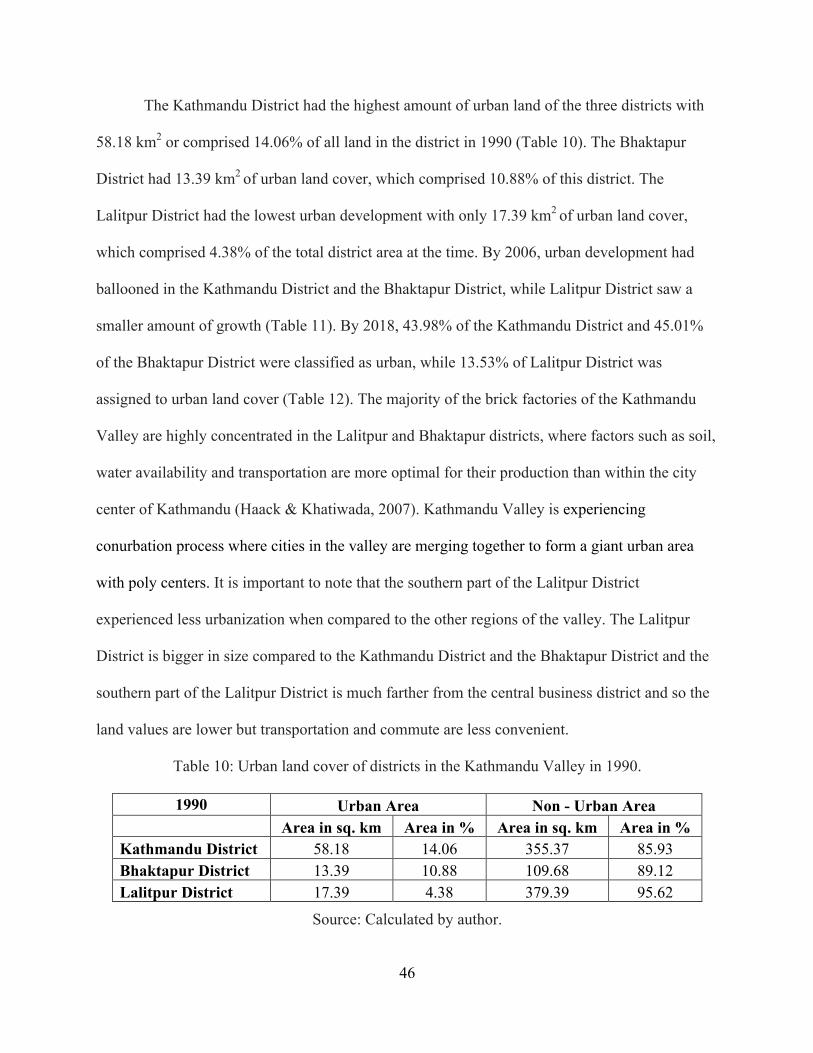
46
The Kathmandu District had the highest amount of urban land of the three districts with
58.18 km2 or comprised 14.06% of all land in the district in 1990 (Table 10). The Bhaktapur
District had 13.39 km2 of urban land cover, which comprised 10.88% of this district. The
Lalitpur District had the lowest urban development with only 17.39 km2 of urban land cover,
which comprised 4.38% of the total district area at the time. By 2006, urban development had
ballooned in the Kathmandu District and the Bhaktapur District, while Lalitpur District saw a
smaller amount of growth (Table 11). By 2018, 43.98% of the Kathmandu District and 45.01%
of the Bhaktapur District were classified as urban, while 13.53% of Lalitpur District was
assigned to urban land cover (Table 12). The majority of the brick factories of the Kathmandu
Valley are highly concentrated in the Lalitpur and Bhaktapur districts, where factors such as soil,
water availability and transportation are more optimal for their production than within the city
center of Kathmandu (Haack & Khatiwada, 2007). Kathmandu Valley is experiencing
conurbation process where cities in the valley are merging together to form a giant urban area
with poly centers. It is important to note that the southern part of the Lalitpur District
experienced less urbanization when compared to the other regions of the valley. The Lalitpur
District is bigger in size compared to the Kathmandu District and the Bhaktapur District and the
southern part of the Lalitpur District is much farther from the central business district and so the
land values are lower but transportation and commute are less convenient.
Table 10: Urban land cover of districts in the Kathmandu Valley in 1990.
1990 Urban Area Non - Urban Area Area in sq. km Area in % Area in sq. km Area in % Kathmandu District 58.18 14.06 355.37 85.93 Bhaktapur District 13.39 10.88 109.68 89.12 Lalitpur District 17.39 4.38 379.39 95.62
Source: Calculated by author.
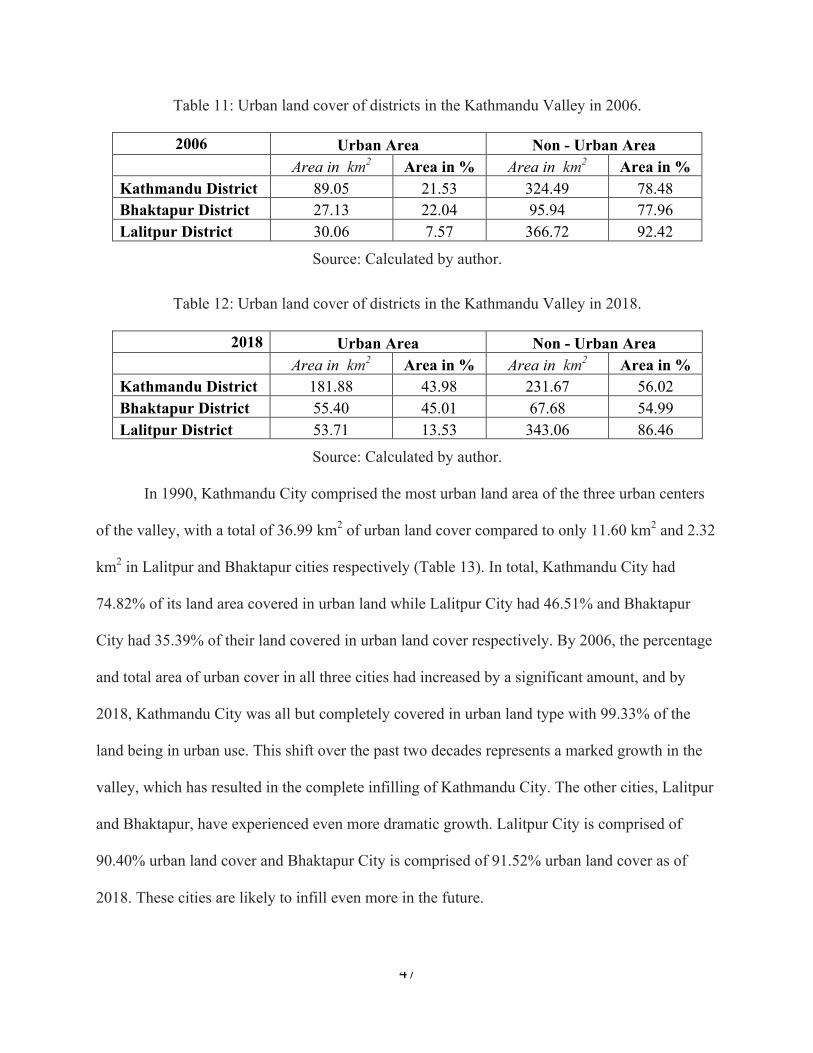
47
Table 11: Urban land cover of districts in the Kathmandu Valley in 2006.
2006 Urban Area Non - Urban Area Area in km2 Area in % Area in km2 Area in % Kathmandu District 89.05 21.53 324.49 78.48 Bhaktapur District 27.13 22.04 95.94 77.96 Lalitpur District 30.06 7.57 366.72 92.42
Source: Calculated by author.
Table 12: Urban land cover of districts in the Kathmandu Valley in 2018.
2018 Urban Area Non - Urban Area Area in km2 Area in % Area in km2 Area in % Kathmandu District 181.88 43.98 231.67 56.02 Bhaktapur District 55.40 45.01 67.68 54.99 Lalitpur District 53.71 13.53 343.06 86.46
Source: Calculated by author.
In 1990, Kathmandu City comprised the most urban land area of the three urban centers
of the valley, with a total of 36.99 km2 of urban land cover compared to only 11.60 km2 and 2.32
km2 in Lalitpur and Bhaktapur cities respectively (Table 13). In total, Kathmandu City had
74.82% of its land area covered in urban land while Lalitpur City had 46.51% and Bhaktapur
City had 35.39% of their land covered in urban land cover respectively. By 2006, the percentage
and total area of urban cover in all three cities had increased by a significant amount, and by
2018, Kathmandu City was all but completely covered in urban land type with 99.33% of the
land being in urban use. This shift over the past two decades represents a marked growth in the
valley, which has resulted in the complete infilling of Kathmandu City. The other cities, Lalitpur
and Bhaktapur, have experienced even more dramatic growth. Lalitpur City is comprised of
90.40% urban land cover and Bhaktapur City is comprised of 91.52% urban land cover as of
2018. These cities are likely to infill even more in the future.
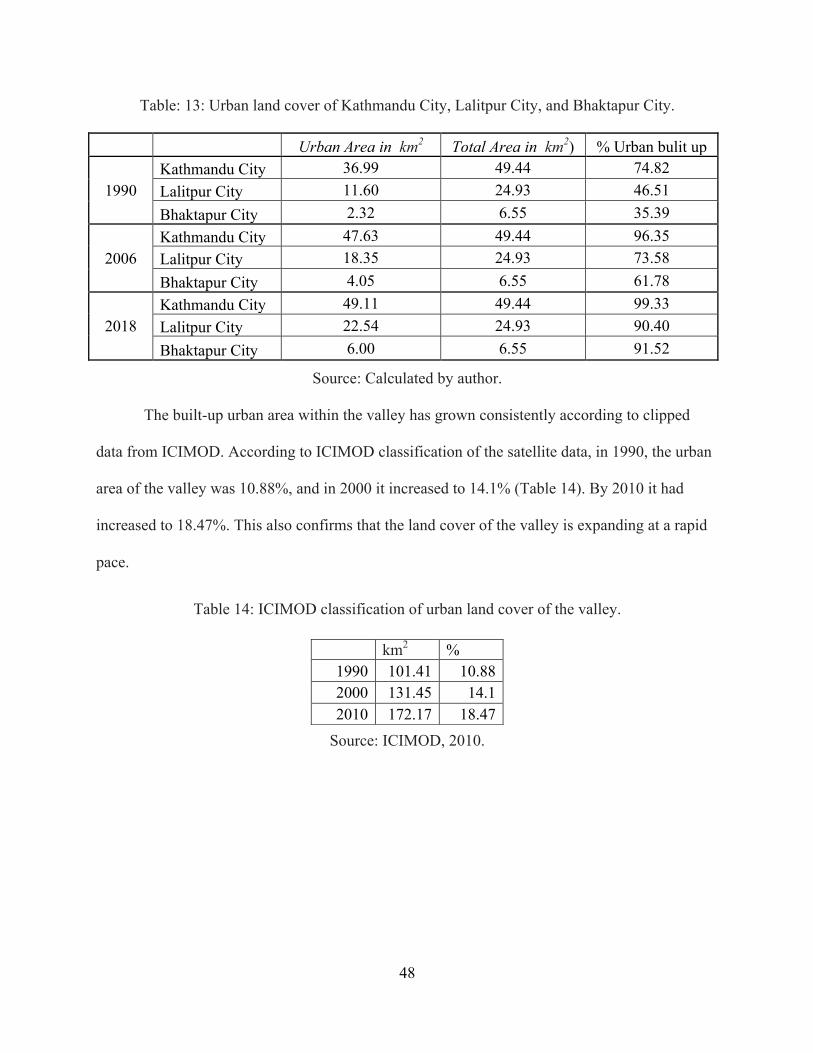
48
Table: 13: Urban land cover of Kathmandu City, Lalitpur City, and Bhaktapur City.
Urban Area in km2 Total Area in km2) % Urban bulit up
1990 Kathmandu City 36.99 49.44 74.82 Lalitpur City 11.60 24.93 46.51 Bhaktapur City 2.32 6.55 35.39
2006 Kathmandu City 47.63 49.44 96.35 Lalitpur City 18.35 24.93 73.58 Bhaktapur City 4.05 6.55 61.78
2018 Kathmandu City 49.11 49.44 99.33 Lalitpur City 22.54 24.93 90.40 Bhaktapur City 6.00 6.55 91.52
Source: Calculated by author.
The built-up urban area within the valley has grown consistently according to clipped
data from ICIMOD. According to ICIMOD classification of the satellite data, in 1990, the urban
area of the valley was 10.88%, and in 2000 it increased to 14.1% (Table 14). By 2010 it had
increased to 18.47%. This also confirms that the land cover of the valley is expanding at a rapid
pace.
Table 14: ICIMOD classification of urban land cover of the valley.
Source: ICIMOD, 2010.
km2 % 1990 101.41 10.88 2000 131.45 14.1 2010 172.17 18.47

49
Topographic analysis
Since 1990, there has been a noticeable shift of development from the flatter valley
bottom of the valley to areas with a steeper slope (Figure 12). This could be a result of there
being less flat lands available for development, and the majority of flat lands are proximate to
core areas. The flat lands that are closer to the core of the valley are also expensive (Toffin,
2010), and this could be an additional factor that is driving the change in growth patterns.
Figure 12: Topographic analysis of the urban land cover of the Kathmandu Valley of 1990, 2006, and 2018.
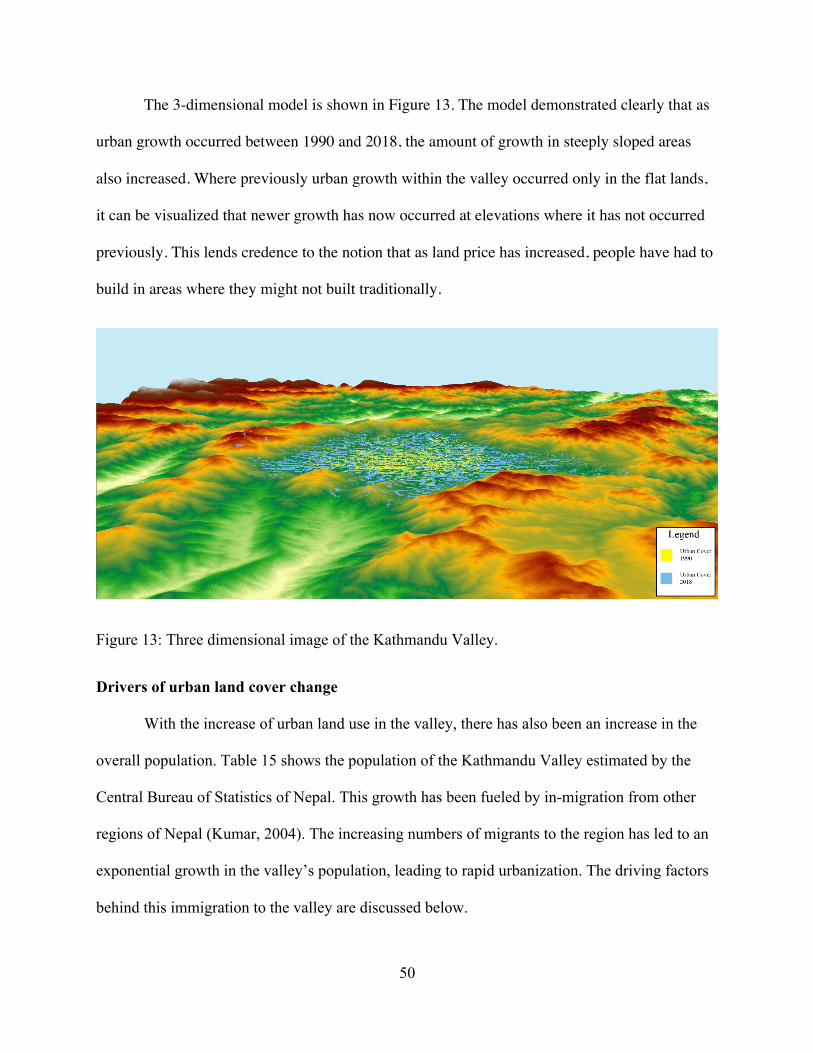
50
The 3-dimensional model is shown in Figure 13. The model demonstrated clearly that as
urban growth occurred between 1990 and 2018, the amount of growth in steeply sloped areas
also increased. Where previously urban growth within the valley occurred only in the flat lands,
it can be visualized that newer growth has now occurred at elevations where it has not occurred
previously. This lends credence to the notion that as land price has increased, people have had to
build in areas where they might not built traditionally.
Figure 13: Three dimensional image of the Kathmandu Valley.
Drivers of urban land cover change
With the increase of urban land use in the valley, there has also been an increase in the
overall population. Table 15 shows the population of the Kathmandu Valley estimated by the
Central Bureau of Statistics of Nepal. This growth has been fueled by in-migration from other
regions of Nepal (Kumar, 2004). The increasing numbers of migrants to the region has led to an
exponential growth in the valley’s population, leading to rapid urbanization. The driving factors
behind this immigration to the valley are discussed below.
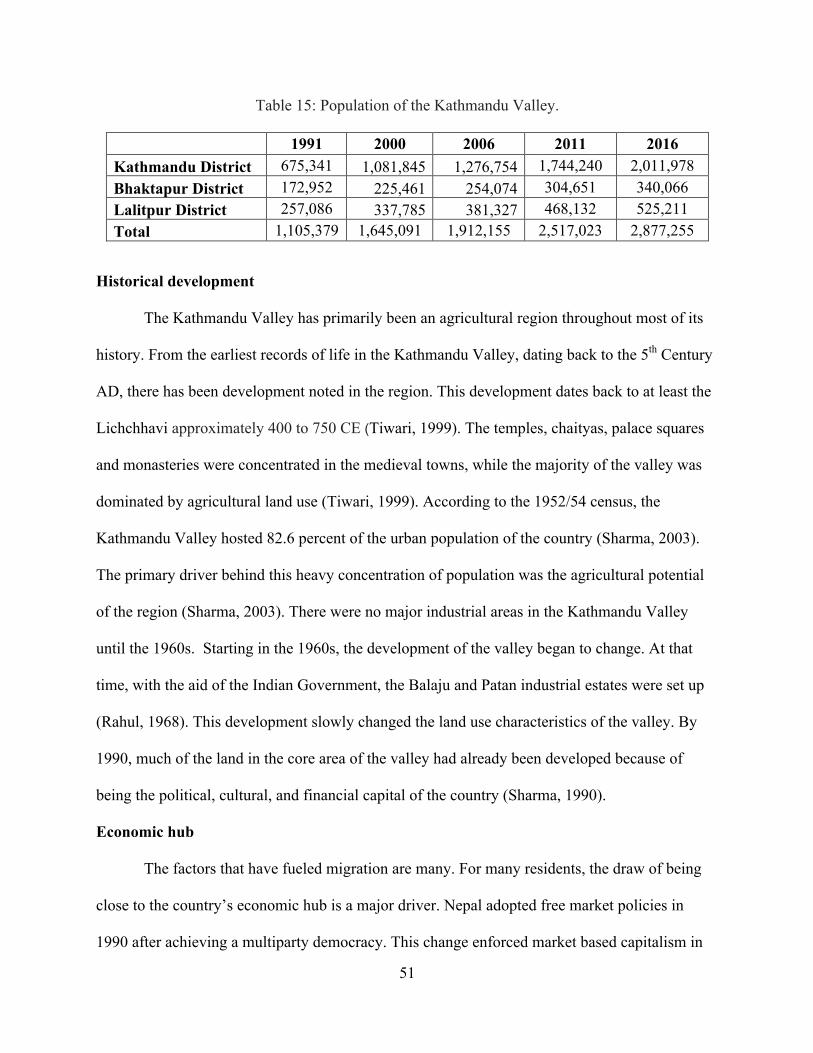
51
Table 15: Population of the Kathmandu Valley.
1991 2000 2006 2011 2016 Kathmandu District 675,341 1,081,845 1,276,754 1,744,240 2,011,978 Bhaktapur District 172,952 225,461 254,074 304,651 340,066 Lalitpur District 257,086 337,785 381,327 468,132 525,211 Total 1,105,379 1,645,091 1,912,155 2,517,023 2,877,255
Historical development
The Kathmandu Valley has primarily been an agricultural region throughout most of its
history. From the earliest records of life in the Kathmandu Valley, dating back to the 5th Century
AD, there has been development noted in the region. This development dates back to at least the
Lichchhavi approximately 400 to 750 CE (Tiwari, 1999). The temples, chaityas, palace squares
and monasteries were concentrated in the medieval towns, while the majority of the valley was
dominated by agricultural land use (Tiwari, 1999). According to the 1952/54 census, the
Kathmandu Valley hosted 82.6 percent of the urban population of the country (Sharma, 2003).
The primary driver behind this heavy concentration of population was the agricultural potential
of the region (Sharma, 2003). There were no major industrial areas in the Kathmandu Valley
until the 1960s. Starting in the 1960s, the development of the valley began to change. At that
time, with the aid of the Indian Government, the Balaju and Patan industrial estates were set up
(Rahul, 1968). This development slowly changed the land use characteristics of the valley. By
1990, much of the land in the core area of the valley had already been developed because of
being the political, cultural, and financial capital of the country (Sharma, 1990).
Economic hub
The factors that have fueled migration are many. For many residents, the draw of being
close to the country’s economic hub is a major driver. Nepal adopted free market policies in
1990 after achieving a multiparty democracy. This change enforced market based capitalism in
52
the country and reduced tariff and non-tariff barriers (Khadka, 1998). Kathmandu became the
center of these market changes. The region experienced high level changes with respect to its
local economy. Another factor that helped fuel these economic changes is the fact that
Kathmandu is the main gateway to the remaining country. Nepal’s only international airport is
located within the Kathmandu Valley, making it the primary entrance point for tourists and
investors alike. With outside capital, investors and tourists as soon as were flooding into the
valley, subsequently the job market grew which drew immigrants from other regions of the
country.
Political factors
Throughout its history, Nepal has been controlled by a monarchial form of government.
With the rise of the Maoist Army, people migrated to the capital to escape wars and get jobs
(Adhikari, 2012). In 2006, however, this changed when the Maoist insurgency came to the
forefront of Nepalese politics and forced the government to change. Today, Nepal is a
presidential democratic system with a secular government and a nation-wide focus on growth
and opportunity. With this change comes new opportunities for growth and development in the
Kathmandu Valley, but also many challenges. Increased immigration to the valley has led to
increased economic growth and a booming economy for the region, but it has also led to a
housing crisis and the development of a system that does not provide subsidized housing to
people who cannot afford increasingly expensive houses/properties (Sharma, 2006).
Centralized government
Nepal’s main governmental offices and service centers are confined to the bounds of the
Kathmandu Valley. Citizens seeking major services have no choice but to travel to the valley for
assistance. Nepal’s legislature, Supreme Courts and Executive Offices are also located in the
53
valley. For people who need access to these government offices, living in close proximity to
these buildings is a priority. For those who need medical care, legal services, and social
assistance, living within the valley is also advantageous (Murshed & Gates, 2005). As more
people seek to live close to the seat of power in Nepal, the urban areas of the Kathmandu Valley
are also experiencing enhanced growth.
Center of education and technology
The majority of Nepal’s renowned educational institutions are located in the Kathmandu
Valley (Thapa et al., 2008), this includes Tribhuvan University, which draws large numbers of
students from across the country to the valley. A 2015 report by Nepal’s Ministry of Education
found that students within the valley outperformed their peers in other regions of the county,
especially compared to students in rural areas where educational achievement, as measured by
standardized tests, has been steadily declining (Ministry of Education, 2015). Rural families with
the financial means to do so will send their children to schools in the Kathmandu Valley so that
they can receive a higher quality of education. This migration of students is a driver of growth
for the valley.

54
Figure 14: Driving factors of urban growth/ built up area from 1990 to 2018.
Summary
The factors outlined in this chapter all play a significant role in the expansion of urban
development within the Kathmandu Valley. The economic and political centralization of
Kathmandu, combined with insurrection in the countryside and a growing gap in technological
resources and education sectors have made the Kathmandu Valley the primary hub of activity in
Nepal (See Figure 14). All of the growth drivers that are influencing the valley are interrelated
and work in concert with one another, creating a system of growth that is fueling rapid change in
the region. It is unknown whether or not this growth pattern will continue into the future, but if
the same core group of drivers remain in place, the prospects for future development remain
positive. It is also unclear if these drivers will remain consistent across each district, and future
studies will have to keep this factor in mind when surveying urban growth.

55
CHAPTER V
CONCLUSIONS
This thesis research aimed to analyze urban change in the three districts of the
Kathmandu Valley for the periods of 1990, 2006, and 2018. The study first focused on
understanding the change in urban topography of the valley, and then identified different drivers
for the urban land cover change. Landsat images were used for the delineation of urban land
cover of the valley using a supervised Gaussian maximum likelihood classification. The main
findings are as follows:
1. There was a significant increase in urban land cover between 1990 and 2018. The urban
land cover increased by 227% from 1990 to 2018. Urban land in 1990 made up only
9.53% of the valley’s land cover. In 2006, the urban land occupied 15.67% of the total
land cover. This pattern changed in 2018 and the urban land cover occupied 31.18% of
the total land cover. Kathmandu District of the valley was the most urbanized in 1990
with 14.06% of the urban land followed by Bhaktapur and Lalitput with 10.88 percent
and 4.38 percent, respectively. By 2018, Kathmandu District and Bhaktapur District were
almost equally urbanized with 43.98% and 45.01% of the total land area, respectively.
Out of the three Districts, Lalitpur had always been least urbanized. This could be due to
the fact that Lalitpur is the largest district and the southern part of the district is very rural
with the least number of roads. Kathmandu Valley experienced outward expansion of
urban growth emerging from the central business district of the valley and expanded to
the perimeter where new industrial estates were being built.
2. Kathmandu Valley is experiencing urbanization process where cities in the valleys are
merging together with poly centers. Similarly, there is a noticeable shift of built up areas

56
from the flat lands of the valley to steeper slope areas from 1990 to 2018. These changes
could be attributed to the increasing land prices in the core of the urban center and less
flat lands available for the urban development.
3. The growth of urban areas of the valley is correlated with the increase in the valley’s
population. Kathmandu valley has always experienced faster development compared to
other regions of the valley since the 5th century. This historical development of the valley
attracted large population due to its agricultural potential. After the birth of democracy in
the country in 1990, the economic liberalization of the country fueled rapid growth in the
region. The region benefitted from the market based capitalism. The rise in the Maoist
armed struggle also put more pressure in the valley. This led to the immigration of
population due to the security threats. As the center of education/technology, the valley
also contributed to the rapid urban expansion as many students came to the valley for
higher education from the rest of the country.
Implications of the study
Using remotely sensed data affords the scientific community the ability to gather data on
regions where in-situ data collection might prove more problematic. Nepal, which is a
developing nation, can benefit greatly from using remotely sensed data as this research
demonstrates. By classifying urban land cover within the valley and charting its growth over
time, both across the flat lands and areas with a steeper slope, this study was able to make new
contributions to the understanding of Kathmandu’s dramatic change over the past decades. This
body of research is placed within a growing cohort of similar studies from within the region,
following up the research of Rawat and Kumar in Uttarakhand, and Islam et al. (2018) in
Chunati, Bangladesh. This research is also a successor to the studies of other scientists on land
57
cover change in Nepal including Thapa and Weber (1990), Maskey et al. (2011) and Shea et al.
(2014). This thesis study also acts as a successor to the 2010, ICIMOD study, which featured a
comprehensive examination of the land cover for the entirety of Nepal. It is hoped that other
members of the academic community will be able to use this research as a baseline for
understanding land cover change within Kathmandu, Nepal and the rest of the South Asian
region.
The fundamental problems related to the continued growth of Kathmandu Valley in the
future are as follows:
1. Profits from developed lands are greater than undeveloped, so when there is available
capital, it is logical that land is developed.
2. Only when government restricts development or create a public park system can green
space be preserved. It is not a market driven or neo-liberal outcome.
3. Land use decisions must be made by communities, not just those with economic interest
or the government.
4. Moving up in steeper slope areas are profitable but in the case of Kathmandu Valley, this
can be dangerous because of the vulnerability of the earthquake. A major earthquake
seems to occur every 100 years in Nepal. It seems reasonable to expect more earthquakes
in the future so that allowing construction of multifamily housing is ever more dangerous.
Limitations of the study
Anderson Level 2 classification allows us to classify urban land cover into residential,
commercial, and industrial thematic classes. This thesis mapped broad urban land cover type.
Industrial, residential, and commercial land cover were lumped together in the urban land cover
class. Hence, it is difficult to understand the pattern (whether commercial, or residential, or

58
industrial) is growing in the Kathmandu Valley. In the regions like Kathmandu Valley where
commercial, residential, and industrial are intermixed spatially, it is difficult to separate these
classes using Landsat imagery. Similarly, it was quite challenging to acquire base data sets that
would have allowed sufficient information to separate commercial, industrial, and residential
areas of the Kathmandu Valley. Furthermore, lack of hyperspectral imagery was another issue
faced in this study. Additionally, lack of access to socioeconomic data, such as GDP of the
Kathmandu Valley, and migration of the population to the valley, prevented quantitative analysis
of the drivers of the urban land cover change in this thesis study. Thus this study relied on
literature review to understand the drivers of urban land cover change of the Kathmandu Valley.
Future studies would need to acquire high resolution remote sensing imagery and base datasets
and social economic datasets for more detailed classification of urban change and quantitative
analysis of drivers of the urban land cover change to support informed land use planning and
decision making in the Kathmandu Valley.
59
REFERENCES
Adhikari, P. (2012). The plight of the forgotten ones: Civil war and forced migration. International Studies Quarterly, 56(3), 590-606. Alberti, M., Weeks, R., & Coe, S. (2004). Urban land-cover change analysis in central Puget Sound. Photogrammetric Engineering & Remote Sensing, 70(9), 1043-1052. Alfa, M. I., Ajibike, M. A., Adie, D. B., & Mudiare, O. J. (2018). Assessment of the effect of land use/land cover changes on total runoff from Ofu River catchment in Nigeria. Journal of Degraded and Mining Lands Management, 5(3), 1161. Alphan, H. (2003). Land use change and urbanization of Adana, Turkey. Land Degradation & Development, 14(6), 575-586. Anderson, J. R. (1976). A land use and land cover classification system for use with remote sensor data (Vol. 964). US Government Printing Office. Antonelli, P., di Bisceglie, M., Episcopo, R., & Galdi, C. (2004, September). Destriping MODIS data using IFOV overlapping. In Geoscience and Remote Sensing Symposium, 2004. IGARSS'04. Proceedings. 2004 IEEE International (Vol. 7, pp. 4568-4571). IEEE. Batisani, N., & Yarnal, B. (2009). Urban expansion in Centre County, Pennsylvania: Spatial dynamics and landscape transformations. Applied Geography, 29(2), 235-249. Bhattarai, K., Conway, D., & Shrestha, N. (2005). Tourism, terrorism and turmoil in Nepal. Annals of Tourism Research, 32(3), 669-688. Bishop, B. C. (1990). Karnali under stress: livelihood strategies and seasonal rhythms in a changing Nepal Himalaya. Camilleri, S., De Giglio, M., Stecchi, F., & Pérez-Hurtado, A. (2017). Land use and land cover change analysis in predominantly man-made coastal wetlands: towards a methodological framework. Wetlands ecology and management, 25(1), 23-43. Central Bureau of Statistics of Nepal. (2011). National Population and Housing Census 2011 (Population Projection 2011 – 2031). Kathmandu. Congalton, R. G. (1991). A review of assessing the accuracy of classifications of remotely sensed data. Remote sensing of environment, 37(1), 35-46. Dahl, T. E. (2006, September). Remote sensing as a tool for monitoring wetland habitat change. In Proceedings of the Monitoring Science and Technology Symposium: Unifying Knowledge for Sustainability in the Western Hemisphere, Denver, CO, USA (pp. 20-24).
60
Deng, X., Huang, J., Rozelle, S., & Uchida, E. (2010). Economic growth and the expansion of urban land in China. Urban studies, 47(4), 813-843. Dewan, A. M., & Yamaguchi, Y. (2009). Land use and land cover change in Greater Dhaka, Bangladesh: Using remote sensing to promote sustainable urbanization. Applied Geography, 29(3), 390-401. Dewan, A. M., Yamaguchi, Y., & Rahman, M. Z. (2012). Dynamics of land use/cover changes and the analysis of landscape fragmentation in Dhaka Metropolitan, Bangladesh. GeoJournal, 77(3), 315-330. Dingle Robertson, L., & King, D. J. (2011). Comparison of pixel-and object-based classification in land cover change mapping. International Journal of Remote Sensing, 32(6), 1505- 1529. Duro, D. C., Franklin, S. E., & Dubé, M. G. (2012). A comparison of pixel-based and object- based image analysis with selected machine learning algorithms for the classification of agricultural landscapes using SPOT-5 HRG imagery. Remote Sensing of Environment, 118, 259-272. Elmqvist, B., & Khatir, A. R. (2007). The possibilities of bush fallows with changing roles of agriculture—an analysis combining remote sensing and interview data from Sudanese drylands. Journal of Arid Environments, 70(2), 329-343. Erbek, F. S., Özkan, C., & Taberner, M. (2004). Comparison of maximum likelihood classification method with supervised artificial neural network algorithms for land use activities. International Journal of Remote Sensing, 25(9), 1733-1748. ESRI 2011. ArcGIS Desktop: Release 10. Redlands, CA: Environmental Systems Research Institute. European Commission. (2018). UN OCHA Humanitarian Data Exchange. Retrieved from https://ec.europa.eu/knowledge4policy/online-resource/un-ocha-humanitarian-data- exchange_en European Space Agency (ESA). (2014). Eduspace EN - Home - Spectral signatures. Available from http://www.esa.int/SPECIALS/Eduspace_EN/SEMPNQ3Z2OF_0.html. Fay, M., & Opal, C. (1999). Urbanization without growth: a not-so-uncommon phenomenon. The World Bank. Fell, R., Corominas, J., Bonnard, C., Cascini, L., Leroi, E., & Savage, W. Z. (2008). Guidelines for landslide susceptibility, hazard and risk zoning for land use planning. Engineering Geology, 102(3), 85-98.
61
Foley, J. A., DeFries, R., Asner, G. P., Barford, C., Bonan, G., Carpenter, S. R., ... & Helkowski, J. H. (2005). Global consequences of land use. Science, 309(5734), 570-574. Fu, L., Zhang, L., & He, C. (2014). Analysis of agricultural land use change in the middle reach of the heihe river basin, northwest china. International journal of environmental research and public health, 11(3), 2698-2712. Gautam, A. P., Webb, E. L., Shivakoti, G. P., & Zoebisch, M. A. (2003). Land use dynamics and landscape change pattern in a mountain watershed in Nepal. Agriculture, ecosystems & environment, 99(1-3), 83-96. Girouard, G., Bannari, A., El Harti, A., & Desrochers, A. (2004). Validated spectral angle mapper algorithm for geological mapping: comparative study between QuickBird and Landsat-TM. In XXth ISPRS congress, geo-imagery bridging continents, Istanbul, Turkey (pp. 12-23). Goldewijk, K. K. (2001). Estimating global land use change over the past 300 years: the HYDE database. Global biogeochemical cycles, 15(2), 417-433. Gurung, M. M. (2014). Expanding biophilic city design theory: A study of incorporating nature into the urban design elements of Kathmandu. Haack, B. N., & Khatiwada, G. (2007). Rice and bricks: environmental issues and mapping of the unusual crop rotation pattern in the Kathmandu Valley, Nepal. Environmental management, 39(6), 774-782. Haack, B. N., & Rafter, A. (2006). Urban growth analysis and modeling in the Kathmandu Valley, Nepal. Habitat International, 30(4), 1056-1065. Hatlebakk, M. (2010). Maoist control and level of civil conflict in Nepal. South Asia Economic Journal, 11(1), 99-110. Hutt, M. (2004). Himalayan people's war: Nepal's Maoist rebellion. Indiana University Press. Ichoku, C., Kaufman, Y. J., Remer, L. A., & Levy, R. (2004). Global aerosol remote sensing from MODIS. Advances in Space Research, 34(4), 820-827. Imhoff, M. L., Bounoua, L., DeFries, R., Lawrence, W. T., Stutzer, D., Tucker, C. J., & Ricketts, T. (2004). The consequences of urban land transformation on net primary productivity in the United States. Remote Sensing of Environment, 89(4), 434-443. Imhoff, M. L., Zhang, P., Wolfe, R. E., & Bounoua, L. (2010). Remote sensing of the urban heat island effect across biomes in the continental USA. Remote sensing of environment, 114(3), 504-513.

62
International Centre for International Mountain Development (ICIMOD). (1993). Economic and environmental development planning for the Bagmati Zone, Vol. 3, Kathmandu Valley Urban Region. International Centre for International Mountain Development (ICIMOD). (2014). Nepal land cover classification of 2010. Irwin, E. G., & Bockstael, N. E. (2007). The evolution of urban sprawl: Evidence of spatial heterogeneity and increasing land fragmentation. Proceedings of the National Academy of Sciences, 104(52), 20672-20677. Ishtiaque, A., Shrestha, M., & Chhetri, N. (2017). Rapid urban growth in the Kathmandu Valley, Nepal: Monitoring land use land cover dynamics of a himalayan city with landsat imageries. Environments, 4(4), 72. Islam, K., Jashimuddin, M., Nath, B., & Nath, T. K. (2018). Land use classification and change detection by using multi-temporal remotely sensed imagery: The case of Chunati wildlife sanctuary, Bangladesh. The Egyptian Journal of Remote Sensing and Space Science, 21(1), 37-47. Jain, M., Dawa, D., Mehta, R., Dimri, A. P., & Pandit, M. K. (2016). Monitoring land use change and its drivers in Delhi, India using multi-temporal satellite data. Modeling Earth Systems and Environment, 2(1), 19. Karan, S. K., & Samadder, S. R. (2016). Accuracy of land use change detection using support vector machine and maximum likelihood techniques for open-cast coal mining areas. Environmental monitoring and assessment, 188(8), 486. Karmacharya, B. K. (2001). Economic reforms in Nepal and their implications for trade, economic growth, inequality and poverty. South Asia Economic Journal, 2(1), 87-103. Khadka, N. (1998). Challenges to developing the economy of Nepal. Contemporary South Asia, 7(2), 147-165. Kondo, A., Kaga, A., Imamura, K., Inoue, Y., Sugisawa, M., Shrestha, M. L., & Sapkota, B. (2005). Investigation of air pollution concentration in Kathmandu valley during winter season. Journal of Environmental Sciences, 17(6), 1008-1013. Kuhle, M. (2014). The glacial (MIS 3-2) outlet glacier of the Marsyandi Nadi-icestream-network with its Ngadi Khola tributary glacier (Manaslu-and Lamjung Himalaya): The reconstructed lowering of the Marsyandi Nadi ice stream tongue down in to the southern Himalaya Foreland. Journal of Mountain Science, 11(1), 236-287. Kumar, B. (2004). Migration, poverty and development in Nepal. Asian and Pacific migration journal, 13(2), 205-232.

63
Lambin, E. F., Turner, B. L., Geist, H. J., Agbola, S. B., Angelsen, A., Bruce, J. W., ... & George, P. (2001). The causes of land-use and land-cover change: moving beyond the myths. Global environmental change, 11(4), 261-269. Li, X., Zhou, W., & Ouyang, Z. (2013). Forty years of urban expansion in Beijing: What is the relative importance of physical, socioeconomic, and neighborhood factors? Applied Geography, 38, 1-10. Liang, S., Fang, H., & Chen, M. (2001). Atmospheric correction of Landsat ETM+ land surface imagery. I. Methods. IEEE Transactions on geoscience and remote sensing, 39(11), 2490-2498. Lillesand, T., Kiefer, R. W., & Chipman, J. (2014). Remote sensing and image interpretation. John Wiley & Sons. Liu, J., He, X., Liang, F., & Li, T. (2018, July). Cropland Use Change Analysis in Shaanxi Province of China Based on the Shape-Matching Cropping Index Mapping Method. In IGARSS 2018-2018 IEEE International Geoscience and Remote Sensing Symposium (pp. 3011-3014). IEEE. López, E., Bocco, G., Mendoza, M., & Duhau, E. (2001). Predicting land-cover and land-use change in the urban fringe: a case in Morelia city, Mexico. Landscape and urban planning, 55(4), 271-285. Lu, D., & Weng, Q. (2004). Spectral mixture analysis of the urban landscape in Indianapolis with Landsat ETM+ imagery. Photogrammetric Engineering & Remote Sensing, 70(9), 1053-1062. Lucas, I. F. J., Janssen, F., & van der Wel, F. J. (1994). Accuracy assessment of satellite derived landcover data: A review. Photogrammetric Engineering & Remote Sensing, 60(4), 479- 426. Lunetta, R. S., Knight, J. F., Ediriwickrema, J., Lyon, J. G., & Worthy, L. D. (2006). Land-cover change detection using multi-temporal MODIS NDVI data. Remote sensing of environment, 105(2), 142-154. Lyons, W. A., & Husar, R. B. (1976). SMS/GOES visible images detect a synoptic-scale air pollution episode. Monthly Weather Review, 104(12), 1623-1626. Martin, R. V. (2008). Satellite remote sensing of surface air quality. Atmospheric environment, 42(34), 7823-7843. Maskey, S., Uhlenbrook, S., & Ojha, S. (2011). An analysis of snow cover changes in the Himalayan region using MODIS snow products and in-situ temperature data. Climatic Change, 108(1-2), 391.
64
McHugh, M. L. (2012). Interrater reliability: the kappa statistic. Biochemia medica: Biochemia medica, 22(3), 276-282. McMichael, A. J. (2000). The urban environment and health in a world of increasing globalization: issues for developing countries. Bulletin of the World Health Organization, 78, 1117-1126. Meyer, W. B., & Turner, B. L. (1992). Human population growth and global land-use/cover change. Annual review of ecology and systematics, 23(1), 39-61. Midriak, R. (2009). Changes of glaciation in the Sagarmatha National Park (Nepal) during the last 30 years. Landform Analysis, 10, 85-94. Mukhopadhyay, A., Hornby, D. D., Hutton, C. W., Lázár, A. N., Johnson, F. A., & Ghosh, T. (2018). Land Cover and Land Use Analysis in Coastal Bangladesh. In Ecosystem Services for Well-Being in Deltas (pp. 367-381). Palgrave Macmillan, Cham. Mundia, C. N., & Aniya, M. (2005). Analysis of land use/cover changes and urban expansion of Nairobi city using remote sensing and GIS. International journal of Remote sensing, 26(13), 2831-2849. Muñoz-Marí, J., Bruzzone, L., & Camps-Valls, G. (2007). A support vector domain description approach to supervised classification of remote sensing images. IEEE Transactions on Geoscience and Remote Sensing, 45(8), 2683-2692. Murshed, S. M., & Gates, S. (2005). Spatial–horizontal inequality and the Maoist insurgency in Nepal. Review of development economics, 9(1), 121-134. Muzzini, E., & Aparicio, G. (2013). Urban growth and spatial transition in Nepal. Washington, D.C., DC: The World Bank. Nepal. Ministry of Education. (2015). Education for All national review report: 2011-2015 (Nepal). Olson, D. M., Dinerstein, E., Wikramanayake, E. D., Burgess, N. D., Powell, G. V., Underwood, E. C., ... & Loucks, C. J. (2001). Terrestrial Ecoregions of the World: A New Map of Life on Earth: A new global map of terrestrial ecoregions provides an innovative tool for conserving biodiversity. BioScience, 51(11), 933-938. Otukei, J. R., & Blaschke, T. (2010). Land cover change assessment using decision trees, support vector machines and maximum likelihood classification algorithms. International Journal of Applied Earth Observation and Geoinformation, 12, S27-S31. Pant, P. R., & Dangol, D. (2009). Kathmandu valley profile. Briefing Paper, Governance and Infrastructure Development Challenges in Kathmandu Valley.

65
Paola, J. D., & Schowengerdt, R. A. (1995). A detailed comparison of backpropagation neural network and maximum-likelihood classifiers for urban land use classification. IEEE Transactions on Geoscience and remote sensing, 33(4), 981-996. Pettigrew, J., & Shneiderman, S. (2004). Women and the Maobadi: Ideology and agency in Nepal’s Maoist movement. Phillips, R. D., Watson, L. T., Wynne, R. H., & Blinn, C. E. (2009). Feature reduction using a singular value decomposition for the iterative guided spectral class rejection hybrid classifier. ISPRS Journal of Photogrammetry and Remote Sensing, 64(1), 107-116. Porter-Bolland, L., Ellis, E. A., & Gholz, H. L. (2007). Land use dynamics and landscape history in La Montaña, Campeche, Mexico. Landscape and Urban Planning, 82(4), 198-207. Qasim, M., Hubacek, K., Termansen, M., & Khan, A. (2011). Spatial and temporal dynamics of land use pattern in District Swat, Hindu Kush Himalayan region of Pakistan. Applied Geography, 31(2), 820-828. Qian, J., Feng, D., & Zhu, H. (2012). Tourism-driven urbanization in China’s small town development: A case study of Zhapo Town, 1986–2003. Habitat International, 36(1), 152-160. Rahul, R. (1968). The development program in the Himalaya. Asian Survey, 8(8), 666-677. Ramachandra, T. V., & Bachamanda, S. (2007). Environmental audit of municipal solid waste management. International Journal of Environmental Technology and Management, 7(3- 4), 369-391. Rao, K. S., & Pant, R. (2001). Land use dynamics and landscape change pattern in a typical micro watershed in the mid elevation zone of central Himalaya, India. Agriculture, ecosystems & environment, 86(2), 113-124. Rawat, J. S., & Kumar, M. (2015). Monitoring land use/cover change using remote sensing and GIS techniques: A case study of Hawalbagh block, district Almora, Uttarakhand, India. The Egyptian Journal of Remote Sensing and Space Science, 18(1), 77-84. Restrepo, J. D., Park, E., Aquino, S., & Latrubesse, E. M. (2016). Coral reefs chronically exposed to river sediment plumes in the southwestern Caribbean: Rosario Islands, Colombia. Science of the Total Environment, 553, 316-329. Richards, J. A. (2013). Supervised classification techniques. In Remote Sensing Digital Image Analysis (pp. 247-318). Springer, Berlin, Heidelberg. Rimal, B. (2011). Application of remote sensing and GIS, land use/land cover change in Kathmandu Metropolitan city, Nepal. Journal of Theoretical & Applied Information Technology, 23(2).

66
Routledge, P. (2010). Nineteen days in April: Urban protest and democracy in Nepal. Urban Studies, 47(6), 1279-1299. Sarvestani, M. S., Ibrahim, A. L., & Kanaroglou, P. (2011). Three decades of urban growth in the city of Shiraz, Iran: A remote sensing and geographic information systems application. Cities, 28(4), 320-329. Schneider, A., Friedl, M. A., & Potere, D. (2009). A new map of global urban extent from MODIS satellite data. Environmental Research Letters, 4(4), 044003. Schowengerdt, R. A. (2012). Techniques for image processing and classifications in remote sensing. Academic Press. Seto, K. C., Woodcock, C. E., Song, C., Huang, X., Lu, J., & Kaufmann, R. K. (2002). Monitoring land-use change in the Pearl River Delta using Landsat TM. International Journal of Remote Sensing, 23(10), 1985-2004. Shakya, M. (2010). Capitalism and ethnicity facing a rising wave of communism in Nepal. HIMALAYA, the Journal of the Association for Nepal and Himalayan Studies, 28(1), 4. Sharma, K. (2006). The political economy of civil war in Nepal. World Development, 34(7), 1237-1253. Sharma, P. (2003). Urbanization and development. Population monograph of Nepal, 1, 375-412. Shea, J. M., Immerzeel, W. W., Wagnon, P., Vincent, C., & Bajracharya, S. (2014). Modelling glacier change in the Everest region, Nepal Himalaya. The Cryosphere Discussions, 8, 5375-5432. Smith, M. L., Zhou, W., Cadenasso, M., Grove, M., & Band, L. E. (2010). Evaluation of the National Land Cover Database for hydrologic applications in urban and suburban Baltimore, Maryland1. JAWRA Journal of the American Water Resources Association, 46(2), 429-442. Story, M., & Congalton, R. G. (1986). Accuracy assessment: a user’s perspective. Photogrammetric Engineering and remote sensing, 52(3), 397-399. Suhura, S., Nithyapriya, B., Reddy, L. R., Philipose, N., Manisha, M., & Dwarakish, G. S. (2018). Coastal Land Use/Land Cover and Shoreline Studies for Dakshina Kannada Coast, Karnataka, India. In Water Resources Management (pp. 269-281). Springer, Singapore. Thapa, G. B., & Weber, K. E. (1990). Managing mountain watersheds: The upper Pokhara valley, Nepal. Division of Human Settlements Development, Asian Institute of Technology.
67
Thapa, R. B. (2009). Spatial process of urbanization in Kathmandu valley, Nepal (Doctoral dissertation, PhD Dissertation. Graduate School of Life and Environmental Sciences, University of Tsukuba, Ibaraki). Thapa, R. B., & Murayama, Y. (2010). Drivers of urban growth in the Kathmandu valley, Nepal: Examining the efficacy of the analytic hierarchy process. Applied Geography, 30(1), 70- 83. Thapa, R. B., & Murayama, Y. (2011). Urban growth modeling of Kathmandu metropolitan region, Nepal. Computers, Environment and Urban Systems, 35(1), 25-34. Thapa, R. B., Murayama, Y., & Ale, S. (2008). Kathmandu. Cities, 25(1), 45-57. The International Centre for Integrated Mountain Development. (2013). Land cover of Nepal 2010. In. (Ed.). Tiwari, S. R. (1999). Kathmandu Valley Urban Capital Region and Historical Urbanism Historical Environment Management: Lessons from History. In 13th Biennial Conference of Association of Development Research and Training Institutes of Asia and the Pacific (ADIPA) (Vol. 29). Toffin, G. (2010). Urban fringes: Squatter and slum settlements in the Kathmandu Valley (Nepal). Contrib Nepalese stud, 37(2), 151-68. Turner, B. L., Meyer, W. B., & Skole, D. L. (1994). Global land-use/land-cover change: towards an integrated study. Ambio. Stockholm, 23(1), 91-95. United Nations. (2014). World urbanization prospects: The 2014 revision, highlights. Department of economic and social affairs. Population Division, United Nations. Upreti, B. R. (2012). Nepal from war to peace. Peace Review, 24(1), 102-107. von Einsiedel, S., Malone, D. M., & Pradhan, S. (Eds.). (2012). Nepal in transition: from people's war to fragile peace. Cambridge University Press. Wagle, U. R. (2006). Political participation and civic engagement in Kathmandu: An empirical analysis with structural equations. International Political Science Review, 27(3), 301- 322. Routledge, P. (2010). Nineteen days in April: Urban protest and democracy in Nepal. Urban Studies, 47(6), 1279-1299. Watson, R. T., Zinyowera, M. C., & Moss, R. H. (1996). Climate change 1995. Impacts, adaptations and mitigation of climate change: Scientific-technical analyses.

68
Weng, Q. (2001). A remote sensing? GIS evaluation of urban expansion and its impact on surface temperature in the Zhujiang Delta, China. International journal of remote sensing, 22(10), 1999- 2014. World Bank. (2002). Nepal development forum – economic update 2002. Worldometers - real time world statistics - http://www.worldometers.info/ /world-population/ Wu, K. Y., Ye, X. Y., Qi, Z. F., & Zhang, H. (2013). Impacts of land use/land cover change and socioeconomic development on regional ecosystem services: The case of fast-growing Hangzhou metropolitan area, China. Cities, 31, 276-284. Xian, G., & Crane, M. (2006). An analysis of urban thermal characteristics and associated land cover in Tampa Bay and Las Vegas using Landsat satellite data. Remote Sensing of environment, 104(2), 147-156. Yang, X., & Lo, C. P. (2002). Using a time series of satellite imagery to detect land use and land cover changes in the Atlanta, Georgia metropolitan area. International Journal of Remote Sensing, 23(9), 1775-1798. Yuan, F., Sawaya, K. E., Loeffelholz, B. C., & Bauer, M. E. (2005). Land cover classification and change analysis of the Twin Cities (Minnesota) Metropolitan Area by multitemporal Landsat remote sensing. Remote sensing of Environment, 98(2-3), 317-328. Zha, Y., Gao, J., & Ni, S. (2003). Use of normalized difference built-up index in automatically mapping urban areas from TM imagery. International journal of remote sensing, 24(3), 583-594. Zhang, Q., Wang, J., Peng, X., Gong, P., & Shi, P. (2002). Urban built-up land change detection with road density and spectral information from multi-temporal Landsat TM data. International Journal of Remote Sensing, 23(15), 3057-3078.