using road pavement markings as ground control · pdf fileusing road pavement markings as...
TRANSCRIPT
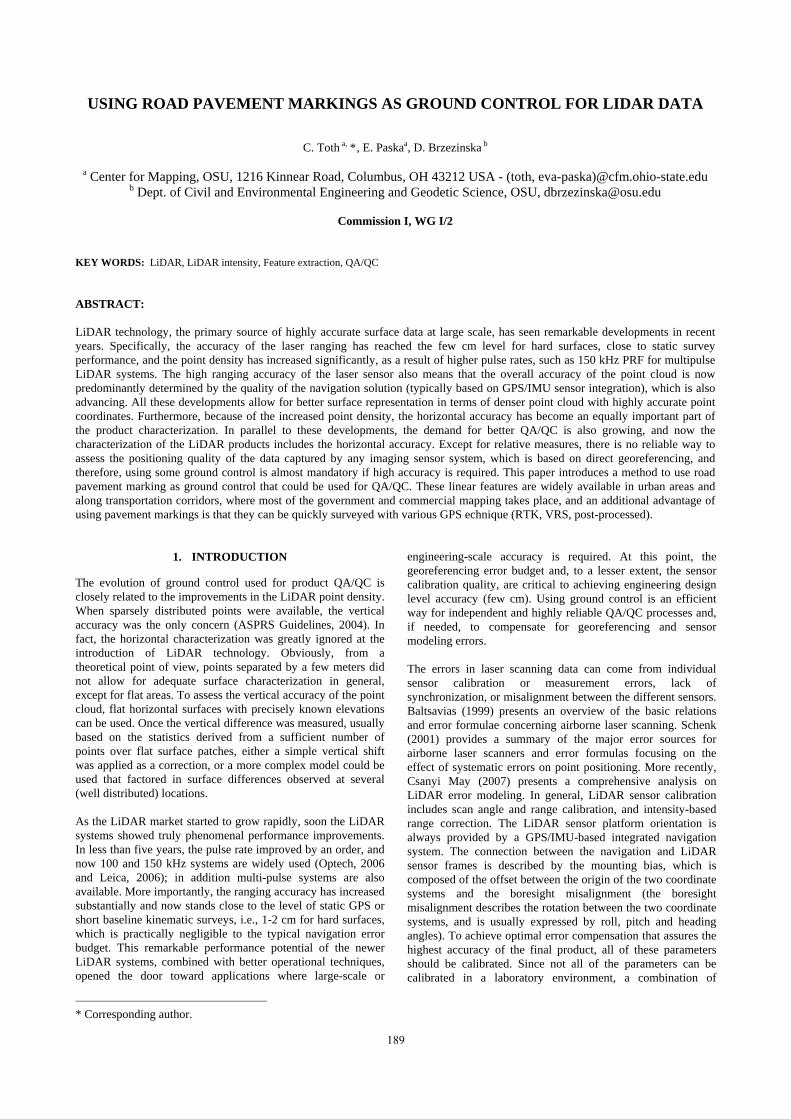
USING ROAD PAVEMENT MARKINGS AS GROUND CONTROL FOR LIDAR DATA
C. Toth a, *, E. Paskaa
, D. Brzezinska b
a Center for Mapping, OSU, 1216 Kinnear Road, Columbus, OH 43212 USA - (toth, eva-paska)@cfm.ohio-state.edu
b Dept. of Civil and Environmental Engineering and Geodetic Science, OSU, [email protected]
Commission I, WG I/2
KEY WORDS: LiDAR, LiDAR intensity, Feature extraction, QA/QC ABSTRACT: LiDAR technology, the primary source of highly accurate surface data at large scale, has seen remarkable developments in recent years. Specifically, the accuracy of the laser ranging has reached the few cm level for hard surfaces, close to static survey performance, and the point density has increased significantly, as a result of higher pulse rates, such as 150 kHz PRF for multipulse LiDAR systems. The high ranging accuracy of the laser sensor also means that the overall accuracy of the point cloud is now predominantly determined by the quality of the navigation solution (typically based on GPS/IMU sensor integration), which is also advancing. All these developments allow for better surface representation in terms of denser point cloud with highly accurate point coordinates. Furthermore, because of the increased point density, the horizontal accuracy has become an equally important part of the product characterization. In parallel to these developments, the demand for better QA/QC is also growing, and now the characterization of the LiDAR products includes the horizontal accuracy. Except for relative measures, there is no reliable way to assess the positioning quality of the data captured by any imaging sensor system, which is based on direct georeferencing, and therefore, using some ground control is almost mandatory if high accuracy is required. This paper introduces a method to use road pavement marking as ground control that could be used for QA/QC. These linear features are widely available in urban areas and along transportation corridors, where most of the government and commercial mapping takes place, and an additional advantage of using pavement markings is that they can be quickly surveyed with various GPS echnique (RTK, VRS, post-processed).
* Corresponding author.
1. INTRODUCTION
The evolution of ground control used for product QA/QC is closely related to the improvements in the LiDAR point density. When sparsely distributed points were available, the vertical accuracy was the only concern (ASPRS Guidelines, 2004). In fact, the horizontal characterization was greatly ignored at the introduction of LiDAR technology. Obviously, from a theoretical point of view, points separated by a few meters did not allow for adequate surface characterization in general, except for flat areas. To assess the vertical accuracy of the point cloud, flat horizontal surfaces with precisely known elevations can be used. Once the vertical difference was measured, usually based on the statistics derived from a sufficient number of points over flat surface patches, either a simple vertical shift was applied as a correction, or a more complex model could be used that factored in surface differences observed at several (well distributed) locations. As the LiDAR market started to grow rapidly, soon the LiDAR systems showed truly phenomenal performance improvements. In less than five years, the pulse rate improved by an order, and now 100 and 150 kHz systems are widely used (Optech, 2006 and Leica, 2006); in addition multi-pulse systems are also available. More importantly, the ranging accuracy has increased substantially and now stands close to the level of static GPS or short baseline kinematic surveys, i.e., 1-2 cm for hard surfaces, which is practically negligible to the typical navigation error budget. This remarkable performance potential of the newer LiDAR systems, combined with better operational techniques, opened the door toward applications where large-scale or
engineering-scale accuracy is required. At this point, the georeferencing error budget and, to a lesser extent, the sensor calibration quality, are critical to achieving engineering design level accuracy (few cm). Using ground control is an efficient way for independent and highly reliable QA/QC processes and, if needed, to compensate for georeferencing and sensor modeling errors. The errors in laser scanning data can come from individual sensor calibration or measurement errors, lack of synchronization, or misalignment between the different sensors. Baltsavias (1999) presents an overview of the basic relations and error formulae concerning airborne laser scanning. Schenk (2001) provides a summary of the major error sources for airborne laser scanners and error formulas focusing on the effect of systematic errors on point positioning. More recently, Csanyi May (2007) presents a comprehensive analysis on LiDAR error modeling. In general, LiDAR sensor calibration includes scan angle and range calibration, and intensity-based range correction. The LiDAR sensor platform orientation is always provided by a GPS/IMU-based integrated navigation system. The connection between the navigation and LiDAR sensor frames is described by the mounting bias, which is composed of the offset between the origin of the two coordinate systems and the boresight misalignment (the boresight misalignment describes the rotation between the two coordinate systems, and is usually expressed by roll, pitch and heading angles). To achieve optimal error compensation that assures the highest accuracy of the final product, all of these parameters should be calibrated. Since not all of the parameters can be calibrated in a laboratory environment, a combination of
189

laboratory and in situ calibrations is the only viable option for LiDAR system calibration. Typical anomalies in the LiDAR data indicating system calibration errors are: edges of the strips could bend up or down (scan angle error), horizontal surfaces have a visible mismatch between the known and the LiDAR point-defined surfaces (boresight misalignment or navigation error), vertical coordinates of LiDAR points over flat areas do not match the known vertical coordinate of the area (ranging or navigation error), objects, such as pavement markings made of retro reflective coatings, may show up above the surface level, although they should practically have identical vertical coordinates (lack of intensity correction of the range data), etc. The techniques to detect and ultimately compensate for errors fall into two broad categories based on whether they use absolute control or not. The first group includes most of the strip adjustment techniques and some of the sensor and boresight calibration methods. The ground control-based techniques encompass comparisons to reference surfaces, such as parking lots and buildings, and methods using LiDAR-specific control targets. Another categorization of the techniques is whether they only aim to remove observed differences, also called data driven methods, or they try to achieve the same objective through the sensor model, in other words, to calibrate the sensor model parameters. The use of dedicated LiDAR targets is a basic method to observe LiDAR point cloud differences at reference points and, consequently, to estimate errors. One of the first approaches to use LiDAR-specific ground targets was developed at OSU (Csanyi and Toth, 2007). The circular targets, optimized for a point density of 3-4 pts/m2 and above, had a diameter of 2 m and used a different reflective coating on the center circle and outer ring. At the required point cloud density, the number of points returned from the targets allowed for accurate estimation of both vertical and horizontal differences. The technique has been used in several projects and provided highly accurate ground control for QA/QC (Toth et al., 2007a). In a similar implementation, small retro reflectors are placed in a certain shape of similar size, in which case the construction of the target is simpler while the processing is more complicated. Although, these solutions provide excellent results, their use is somewhat limited by economic factors; i.e., the installation and the necessary survey of the targets could be quite labor-intensive. Note that the processing of the LiDAR-specific ground targets is highly automated, and human intervention is only needed for the final evaluation of the results. To advance the use of ground targets for transportation corridor surveys, an economic method is proposed here that can achieve results comparable to using LiDAR-specific ground targets (Toth et al., 2007b). The use of pavement markings as ground control offers the advantage of being widely available in excellent spatial distribution, and require no installation. Certainly, the surveying of the targets is still needed, but it becomes less difficult with the increasing use of GPS VRS systems that can provide cm-level accuracy in real-time. The other condition of using pavement markings is the availability of LiDAR intensity data that is hardly a restriction with modern LiDAR systems. Note that the distinct appearance of the pavement markings in the LiDAR intensity image is essential to the proposed method, see Figure 1. The main steps of using pavement marking as ground control are briefly described in this paper.
Figure 1. Typical pavement markings at an intersection (LiDAR point density was about 4 pts/m2).
2. THE CONCEPT
The concept of the proposed method, including pavement marking extraction together with the parameterization of the marks based on LiDAR intensity data, the comparison with ground truth, and the determination of a transformation to correct the point cloud, analysis of the result, etc., is shown in Figure 2. The GPS-surveyed data of the pavement markings, represented in a series of points with cm-level accuracy are assumed to be available. For sensor calibration and/or strip adjustment, sufficient number of pavement markings with good spatial distribution is required to achieve good performance. Currently, only the most commonly found types of pavement markings are considered, such as stop bars, straight edge lines and curved edge lines. In each case, the survey data of the pavement markings are provided as point observed along the centerline of the markings. The LiDAR data, including range and intensity components, are assumed to be of a reasonable quality; i.e., with no gross errors, and thus, the point cloud accuracy is better than a meter.
Figure 2. Overall workflow of the proposed method.
Extraction of pavement markings from LiDAR,
based on intensity
Piecewise weighted least squares curve
ICP-based matching, establishing 2D/3D transformation
Analyzing results, based on magnitude and distribution of residuals, creating QA/QC report; if needed, deciding
on the complexity of the transformation that will be applied to the LiDAR point cloud
Piecewise weighted least squares curve
Processed LiDAR point cloud and intensit
GPS-surveyed ground control pointsy data
190
The International Archives of the Photogrammetry, Remote Sensing and Spatial Information Sciences. Vol. XXXVII. Part B1. Beijing 2008
Based on the comparison of the two representations of pavement markings, one obtained from the GPS survey and the other one from LiDAR intensity and range data, 2D/3D offset and orientation differences can be detected. Since the road surfaces are predominantly flat and mostly horizontal, the horizontal and vertical discrepancies can be separated in most of the cases. Analyzing the magnitudes of the observed differences and their spatial distribution, the LiDAR data quality can be assessed and, if needed, corrections can be applied to the LiDAR point cloud to improve the point position accuracy. The methodology for the correction could be based on either introducing a spatial transformation to reduce the differences at the controls, or trying to adjust the sensor parameters to achieve the same objective. In most of the cases, a 3D similarity transformation is applied, and the accuracy terms for both data sets are needed to properly characterize the data quality after applying the correction. Note that assessing the horizontal accuracy of the LiDAR point cloud is difficult, as it is mainly defined by the footprint of the laser pulse, which depends on the flying height and beam convergence; in addition, the impact of object surface characteristics could be also significant. In the following sections, the three key components of the proposed method, pavement marking extraction, curve fitting and matching, are discussed in detail.
3. EXTRACTING PAVEMENT MARKINGS
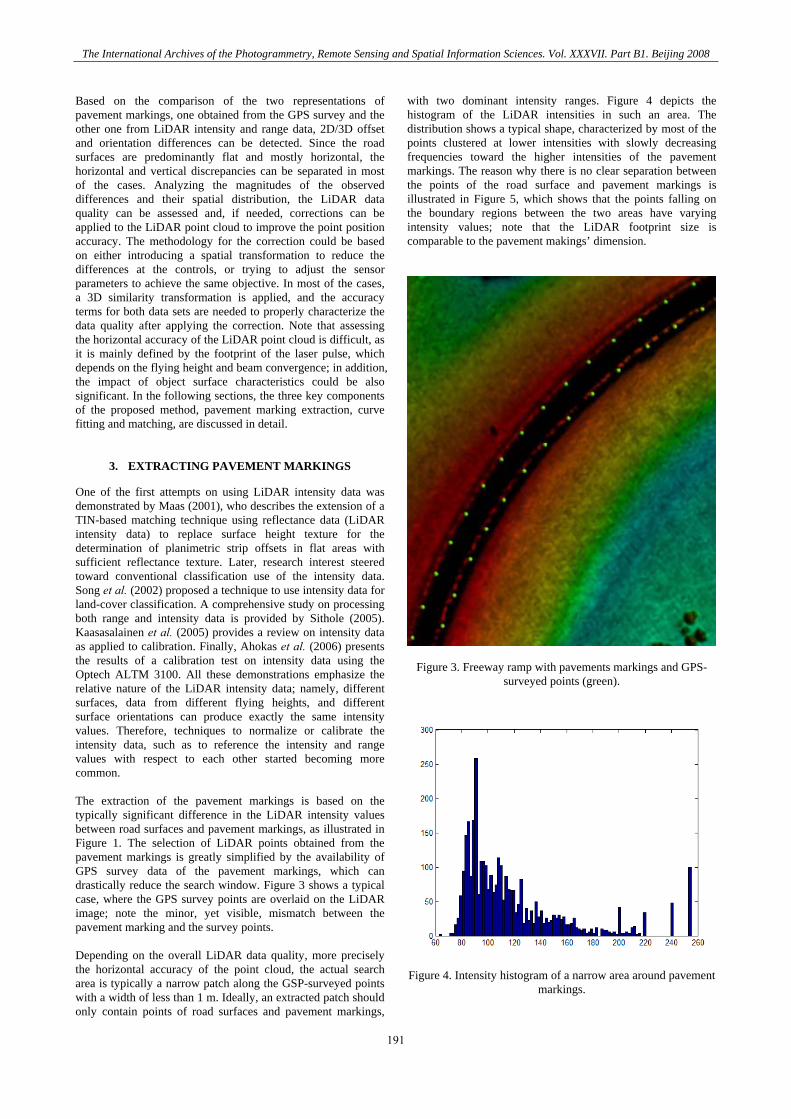
One of the first attempts on using LiDAR intensity data was demonstrated by Maas (2001), who describes the extension of a TIN-based matching technique using reflectance data (LiDAR intensity data) to replace surface height texture for the determination of planimetric strip offsets in flat areas with sufficient reflectance texture. Later, research interest steered toward conventional classification use of the intensity data. Song et al. (2002) proposed a technique to use intensity data for land-cover classification. A comprehensive study on processing both range and intensity data is provided by Sithole (2005). Kaasasalainen et al. (2005) provides a review on intensity data as applied to calibration. Finally, Ahokas et al. (2006) presents the results of a calibration test on intensity data using the Optech ALTM 3100. All these demonstrations emphasize the relative nature of the LiDAR intensity data; namely, different surfaces, data from different flying heights, and different surface orientations can produce exactly the same intensity values. Therefore, techniques to normalize or calibrate the intensity data, such as to reference the intensity and range values with respect to each other started becoming more common. The extraction of the pavement markings is based on the typically significant difference in the LiDAR intensity values between road surfaces and pavement markings, as illustrated in Figure 1. The selection of LiDAR points obtained from the pavement markings is greatly simplified by the availability of GPS survey data of the pavement markings, which can drastically reduce the search window. Figure 3 shows a typical case, where the GPS survey points are overlaid on the LiDAR image; note the minor, yet visible, mismatch between the pavement marking and the survey points. Depending on the overall LiDAR data quality, more precisely the horizontal accuracy of the point cloud, the actual search area is typically a narrow patch along the GSP-surveyed points with a width of less than 1 m. Ideally, an extracted patch should only contain points of road surfaces and pavement markings,
with two dominant intensity ranges. Figure 4 depicts the histogram of the LiDAR intensities in such an area. The distribution shows a typical shape, characterized by most of the points clustered at lower intensities with slowly decreasing frequencies toward the higher intensities of the pavement markings. The reason why there is no clear separation between the points of the road surface and pavement markings is illustrated in Figure 5, which shows that the points falling on the boundary regions between the two areas have varying intensity values; note that the LiDAR footprint size is comparable to the pavement makings’ dimension.
Figure 3. Freeway ramp with pavements markings and GPS-
surveyed points (green).
Figure 4. Intensity histogram of a narrow area around pavement markings.
191
The International Archives of the Photogrammetry, Remote Sensing and Spatial Information Sciences. Vol. XXXVII. Part B1. Beijing 2008
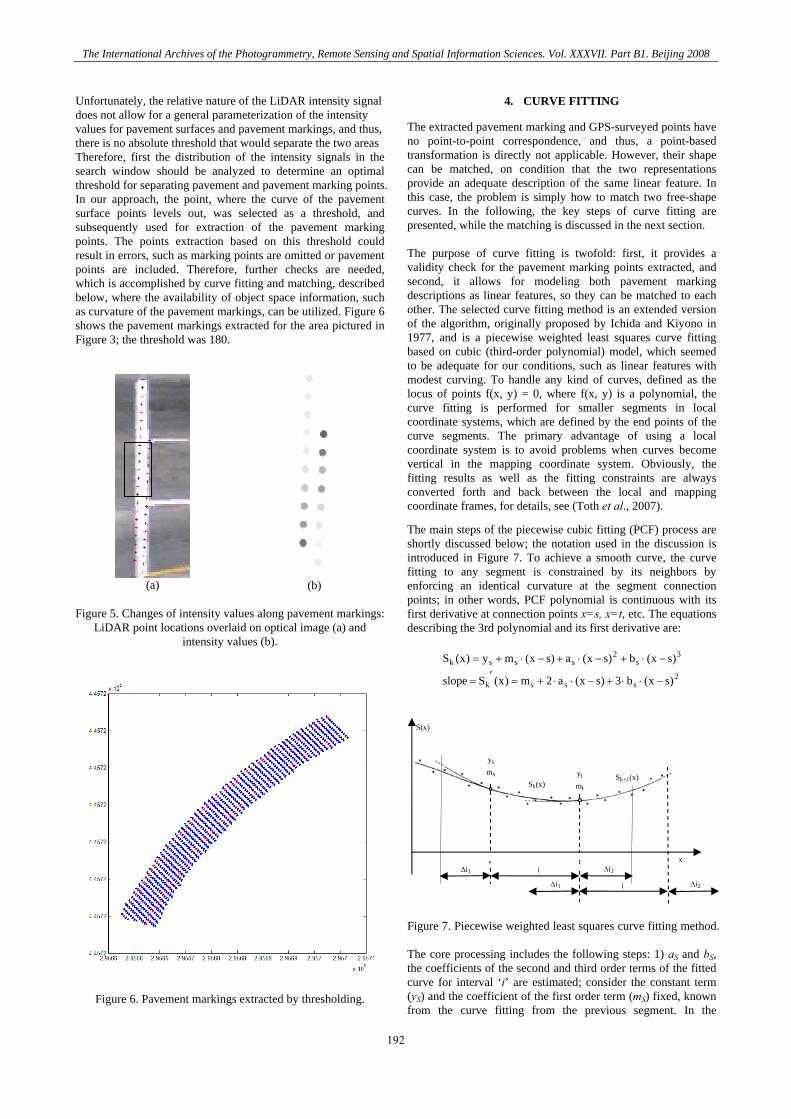
Unfortunately, the relative nature of the LiDAR intensity signal does not allow for a general parameterization of the intensity values for pavement surfaces and pavement markings, and thus, there is no absolute threshold that would separate the two areas Therefore, first the distribution of the intensity signals in the search window should be analyzed to determine an optimal threshold for separating pavement and pavement marking points. In our approach, the point, where the curve of the pavement surface points levels out, was selected as a threshold, and subsequently used for extraction of the pavement marking points. The points extraction based on this threshold could result in errors, such as marking points are omitted or pavement points are included. Therefore, further checks are needed, which is accomplished by curve fitting and matching, described below, where the availability of object space information, such as curvature of the pavement markings, can be utilized. Figure 6 shows the pavement markings extracted for the area pictured in Figure 3; the threshold was 180.
(a)
(b)
Figure 5. Changes of intensity values along pavement markings:
LiDAR point locations overlaid on optical image (a) and intensity values (b).
Figure 6. Pavement markings extracted by thresholding.
4. CURVE FITTING
The extracted pavement marking and GPS-surveyed points have no point-to-point correspondence, and thus, a point-based transformation is directly not applicable. However, their shape can be matched, on condition that the two representations provide an adequate description of the same linear feature. In this case, the problem is simply how to match two free-shape curves. In the following, the key steps of curve fitting are presented, while the matching is discussed in the next section. The purpose of curve fitting is twofold: first, it provides a validity check for the pavement marking points extracted, and second, it allows for modeling both pavement marking descriptions as linear features, so they can be matched to each other. The selected curve fitting method is an extended version of the algorithm, originally proposed by Ichida and Kiyono in 1977, and is a piecewise weighted least squares curve fitting based on cubic (third-order polynomial) model, which seemed to be adequate for our conditions, such as linear features with modest curving. To handle any kind of curves, defined as the locus of points f(x, y) = 0, where f(x, y) is a polynomial, the curve fitting is performed for smaller segments in local coordinate systems, which are defined by the end points of the curve segments. The primary advantage of using a local coordinate system is to avoid problems when curves become vertical in the mapping coordinate system. Obviously, the fitting results as well as the fitting constraints are always converted forth and back between the local and mapping coordinate frames, for details, see (Toth et al., 2007). The main steps of the piecewise cubic fitting (PCF) process are shortly discussed below; the notation used in the discussion is introduced in Figure 7. To achieve a smooth curve, the curve fitting to any segment is constrained by its neighbors by enforcing an identical curvature at the segment connection points; in other words, PCF polynomial is continuous with its first derivative at connection points x=s, x=t, etc. The equations describing the 3rd polynomial and its first derivative are:
2sssk
3s
2sssk
)sx(b3)sx(a2m)x(Sslope
)sx(b)sx(a)sx(my)x(S
−⋅⋅+−⋅⋅+=′=
−⋅+−⋅+−⋅+=
Figure 7. Piecewise weighted least squares curve fitting method. The core processing includes the following steps: 1) aS and bS, the coefficients of the second and third order terms of the fitted curve for interval ‘i’ are estimated; consider the constant term (yS) and the coefficient of the first order term (mS) fixed, known from the curve fitting from the previous segment. In the
Δi1 i
S(x)
yt mt Sk(x)
Sk+1(x)
s xΔi2
t
Δi1 Δi2i
ys
ms
192
The International Archives of the Photogrammetry, Remote Sensing and Spatial Information Sciences. Vol. XXXVII. Part B1. Beijing 2008

adjustment, the points in interval Δ i2+ i+Δ i1 (past, present, and future data points) are used, 2) the value (yt) and the slope (mt) at x=t are computed; these values are used as fixed constraints in the curve fitting for the next segment, and 3) step 1 is repeated to process the next segment. Additional details can be found in (Toth et al., 2007). Curves fitted to pavement markings’ and GPS-surveyed points are shown in Figure 8; the LiDAR scanlines are readily visible.
Figure 8. Curve fitting, LiDAR and GPS-surveyed points (blue
and magenta) and fitted curves (red and cyan)
5. MATCHING CURVES
The objective of curve matching is to find the spatial relationship between two data representations of the pavement markings, the curve-fitted pavement markings and the GPS surveyed points. Assuming that the two representations, such as the curve fitted ones, provide an adequate description of the same shape, the free-shape curve matching techniques can be applied. Since the pavement markings’ descriptions in both original and curve-fitted representations for both LiDAR and GPS-surveyed points are spatially close to each other, the well-known Iterative Closest Point (ICP) algorithm (Besl and McKay, 1992; Madhavan et al., 2005) was selected to perform this task. Iterative registration algorithms are increasingly used for registering 2D/3D curves and range images. Due to its consistent performance, the ICP algorithm was adopted here to match curves describing pavement markings obtained from LiDAR intensity and GPS measurements. The ICP algorithm finds the best correspondence between two curves (point sets) by iteratively determining the translations and rotations parameters of a 2D/3D rigid body transformation.
∑ +−i
iiTR TRDM2
),( )(min
Where R is a 2×2 rotation matrix, T is a 2×1 translation vector, and subscript i refers to the corresponding points of the sets M (model) and D (data). The ICP algorithm can be briefly summarized as follows:
1. For each point in D, compute the closest point in M 2. Compute the incremental transformation (R, T) 3. Apply incremental transformation from step (2) to D 4. If relative changes in R and T are less than a given
threshold, terminate, otherwise go to step (1) ICP can be applied to individual pavement markings or to a group of pavement markings. Figure 9 shows an intersection where four lines were matched.
Figure 9. Curve matching based on four curves; magenta:
curves fitted to control points, red: GPS control points, cyan: curve points derived from LiDAR, and blue: transformed curve
points after ICP. The ICP algorithm was implemented in Matlab and space-scale optimization was incorporated to reduce execution time.
6. EXPRIMENTAL RESULTS
Initial performance tests of the proposed method were performed using typical intersection and freeway ramp data from a recently flown LiDAR survey, where GPS-surveyed pavement markings were available, both were provided by the Ohio Department of Transportation. The LiDAR point spacing varied in the 1-3 pts/m range, and the horizontal accuracy of the GPS-surveyed points, provided by a VRS system was 1-2 cm. In the curve fitting process both data representations were fitted, with a point spacing of 1 cm, and various combinations were processed by the ICP-based curve matching in 2D and 3D. In order to assess the accuracy of the transformation, the correspondence between the LiDAR-derived curve and the control curve was established. Since the two curves, in general, are not entirely identical, even after the final ICP iteration, the transformed LiDAR point-derived curve is close but not necessarily falls on the control curve. However, the location of the transformed LiDAR-derived points represents the best fit to the control curve in the least squares sense. Therefore, these points are projected to the closest points of the control curve, and then they are considered as conjugate points. Figure 10
193
The International Archives of the Photogrammetry, Remote Sensing and Spatial Information Sciences. Vol. XXXVII. Part B1. Beijing 2008

shows the results for the ramp area pictured in Figure 3. The transformation parameters between these two point sets (the original LiDAR-derived points and their corresponding points on the control curve) are calculated in a least squares adjustment. Table 1 shows the 2D transformation parameters for three different cases, clearly indicating the robustness of the ICP method with respect to noisy data, such as using the original LiDAR points. The differences between curves and residuals after ICP matching for the three cases are shown in Table 2. The 2 cm horizontal precision is realistic, given the fact that the GPS-surveyed points are known at a 1-2 cm-level accuracy, and the LiDAR-based pavement marking positioning accuracy is estimated at the few cm range. The 9-10 cm precision terms in case 2 correspond to the use of the noisy LiDAR data (no curve-fitting applied to smoothly model the pavement markings).
Figure 10. ICP matched curves; magenta: curves fitted to
control points, red: GPS control points, cyan: LiDAR point and curves fitted, and blue: matched points.
ICP-adjusted transformation parametersICP input data ΔX [m] ΔY [m] ϕ [°]
Both, LiDAR and GPS points are curve-fitted 0.153 -0.114 0.000
No fitting of LiDAR points, GPS points curve-fitted 0.150 -0.114 0.000
No fitting of GPS points, LiDAR points curve-fitted 0.158 -0.116 0.000
Table 1. Transformation results (2D).
Differences/Residuals X [m] Y[m]
Before After Before After Case
mean Std mean std mean std mean Std 1 0.16 0.02 0.00 0.02 -0.11 0.02 0.00 0.022 0.16 0.10 0.00 0.10 -0.12 0.09 0.00 0.093 0.16 0.02 0.00 0.02 -0.12 0.01 0.00 0.01
Table 2. Original differences and residuals after ICP (2D). 7. CONCLUSION
The new method that introduced the use of pavement markings as LiDAR ground control delivered encouraging initial results. The performance of the three main processing steps, including the extraction of pavement markings, curve fitting, and ICP-based matching has been validated. Using a dataset acquired over a transportation network by a state-of-the-art LiDAR system, pavement markings from several intersections and freeway ramps have been processed delivering robust results. In particular, the performance of the ICP matching algorithm is noteworthy.
ACKNOWLEDGEMENT
The authors would like to thank the Ohio Department of Transportation for the GPS survey of pavement markings and flying LiDAR surveys to acquire essential data for this research.
REFERENCES:
Ahokas, E., Kaassalainen, S., Hyyppa, J. and Suomalainen, J., 2006. Calibration of the Optech ALTM 3100 Laser Scanner Intensity Data Using Brightness Targets, Proceedings of ISPRS Commission I. Symposium. ASPRS LiDAR Committee, 2004. ASPRS Guidelines Vertical Accuracy Reporting for LiDAR Data http://www.asprs.org/society/committees/lidar/Downloads/Vertical_Accuracy_Reporting_for_Lidar_Data.pdf Baltsavias, E.P., 1999. Airborne Laser Scanning: Basic Relations and Formulas. ISPRS Journal of Photogrammetry & Remote Sensing, Vol. 54: 199-214. Besl, P. J. and McKay, N. D. A method for registration of 3-d shapes. IEEE Trans. Pat. Anal. and Mach. Intel. 14(2), pp 239-256, Feb 1992. Csanyi N, Toth C., Grejner-Brzezinska D. and Ray J., 2005. Improving LiDAR data accuracy using LiDAR-specific ground targets, ASPRS Annual Conference, Baltimore, MD, March 7-11, CD-ROM. Csanyi May, N., 2007. A Rigorous Approach to Comprehensive Performance Analysis of State-Of-The-Art Airborne Mobile Mapping Systems, PhD dissertation, The Ohio State University. Csanyi, N. and Toth, C., 2007. Improvement of LiDAR Data Accuracy Using LiDAR-Specific Ground Targets, Photogrammetric Engineering & Remote Sensing, Vol. 73, No. 4, pp. 385-396. Ichida, K. and Kiyono, T.1977. Curve Fitting with One-Pass Method with a Piecewise Cubic Polynomial, ACM Transactions on Mathematical Software, Vol. 3, No. 2, pp. 164-174. Leica Geosystems, ALS50, http://gis.leica-geosystems.com Maas, H.-G., 2001. On the Use of Pulse Reflectance Data for Laserscanner Strip Adjustment. International Archives of
194
The International Archives of the Photogrammetry, Remote Sensing and Spatial Information Sciences. Vol. XXXVII. Part B1. Beijing 2008

Photogrammetry, Remote Sensing and Spatial Information Sciences, 33 (Part 3/W4): 53-56. Madhavan, R., Hong, T., Messina, E. Temporal Range Registration for Unmanned Ground and Aerial Vehicles, Journal of Intelligent and Robotic Systems, Vol. 44, No. 1, September, 2005, pp. 47-69. Optech, ALTM 3100AE, 2006, www.optech.ca/pdf/Brochures/ALTM3100EAwspecsfnl.pdf Schenk, T., 2001. Modeling and Analyzing Systematic Errors in Airborne Laser Scanners. Technical Notes in Photogrammetry, vol. 19. The Ohio State University, Columbus, USA. Sithole, G., 2005. Segmentation and Classification of Airborne Laser Scanner Data, Publication of Geodesy 59, Nederlandse Commissie voor Geodesie, Delft (184 pages). Song, J-H., Han, S-H., Yu, K, and Kim, Y., 2002. Assessing the Possibility of Land-Cover Classification Using LiDAR Intensity Data, International Archives of Photogrammetry, 34. pp. 4. Toth C., Csanyi N. and Grejner-Brzezinska D. 2002. Automating the Calibration of Airborne Multisensor Imaging Systems, Proc. ACSM-ASPRS Annual Conference, Washington, DC, April 19-26, CD ROM. Toth, C., D. Brzezinska, N. Csanyi, E. Paska and N. Yastikly, (2007a). LiDAR Mapping Supporting Earthquake Research of the San Andreas Fault, ASPRS Annual Conference, Tampa, Florida, May 7–11, CD ROM. Toth, C., Paska, E., Grejner-Brzezinska, D.A. (2007b): Using Pavement Markings to Support the QA/QC of LiDAR Data, PIA 2007, International Archives of Photogrammetry and Remote Sensing, Vol. XXXVI, 3/W49B, pp. 173-178.
195
The International Archives of the Photogrammetry, Remote Sensing and Spatial Information Sciences. Vol. XXXVII. Part B1. Beijing 2008

The International Archives of the Photogrammetry, Remote Sensing and Spatial Information Sciences. Vol. XXXVII. Part B1. Beijing 2008
196