using visual modeling tools to reach students with
TRANSCRIPT

Using Visual ModelingTools to Reach Studentswith Learning DisabilitiesCasey Hord, University of CincinnatiSusan A. Gregson, University of CincinnatiJennifer B. Walsh, Sycamore Community SchoolsSamantha Marita, University of Cincinnati
Abstract: Teachers can use electronic visual modeling tools to help students with learning disabilitiesvisualize and understand mathematical concepts such as proportions, dilations, and scale factors. In thisarticle, the authors describe strategies for using static and dynamic visuals for supporting the memoryand processing of students with learning disabilities as they engage in challenging mathematics.
Keywords: visualization, differentiation, special needs instruction
1 Introduction
When your students are struggling, sometimes a picture is worth a thousand words. Sometimes, amoving picture can be even more valuable—especially with respect to important topics like ratioand proportion, scale drawing, dilation, and similarity. Strategic use of dynamic geometry tools canhelp students with learning disabilities (LD) visualize relationships between mathematical conceptswhile providing a key scaffold for these students’ memory and processing.
1.1 Geometry and Students with LD
Students in the United States often struggle with geometry concepts such as the connection betweentransformations and similarity (Seago et al., 2013). Yet, both general and special education teachersare under increased pressure to teach such complex mathematical concepts not only to generaleducation students, but also to students with LD. These students are expected to progress througha learning trajectory where they develop conceptual connections between ratio and proportion,scale drawing, dilations, and similarity (Confrey et al., 2012) and they will be expected to succeedwith related problems on high-stakes assessments (e.g., Partnership for Assessment of Readinessfor College and Careers [PARCC], 2014).
Students with LD are certainly capable of high levels of success with complex mathematicalconcepts, especially when they are supported with visual representations (Marita & Hord, 2017).However, students with LD often struggle with working memory (i.e., processing, storing, and inte-grating multiple sets of information) especially when they encounter multi-step problems (Swanson& Siegel, 2001). Teachers can give these students better opportunities for success in multi-step
Ohio Journal of School Mathematics 79 Page 19

situations if they help students with LD utilize visual representations to organize their thinkingand minimize the demands on working memory (e.g., van Garderen, 2007). For instance, whenstudents with LD are solving a two-step problem, if they can store information from the first stepof a problem on paper, process the second step, store information from the second step on paper,and then connect information from the two steps, they have a better chance of processing, storing,and integrating all parts of the problem. Therefore, helping students with LD store and processinformation as they work through transformation and similarity tasks may be essential for studentsuccess with these problems.
1.2 Access to Geometry through Technology
While visual representations on paper are often effective tools for teaching students with LD (Marita& Hord, 2017), teachers should also consider the benefits of moving representations. Dynamicgeometry software has long been a productive tool for supporting geometric thinking (see Olive,1998). This software can be used to construct and explore geometric objects and their properties,propose and test mathematical conjectures, and develop informal concepts of proof (Battista, 2009).The ability to precisely construct and move shapes on a computer screen mitigates the limitations ofstatic textbook images and can help to make patterns more visible. By moving a point or changingthe length of a segment as they explore a mathematical concept, students have rich opportunities tosee relationships between geometric figures.
Given these benefits, teachers can use dynamic geometry software both to establish high expecta-tions and provide key supports for students with LD (National Council of Teachers of Mathematics[NCTM], 2000). When teaching students with LD and using dynamic technology, teachers mustconsider which technologies and tasks are the best fit for students, including how visuals align withstudents’ prior experiences and whether the models prepare students for their future experiences.For example, in the context of ratio, proportion, and similarity, a secondary teacher might considerhow students with LD have previously experienced similarity in elementary classes as well as howthe visuals introduced for solving scale-drawing problems in the eighth grade might support orlimit a transformational conception of similarity in high school.
1.3 Case Study: Building a Dynamic Conception of Similarity
As a special education student since elementary school, Jasmine has worked diligently and hasmade significant progress. However, mathematics is becoming more complicated for Jasmine in theeighth grade. For high school, she must develop a more sophisticated and abstract understandingof mathematics. During this transition, she is likely to benefit from scaffolded conversations withteachers using visuals of many types (static and dynamic) to support her memory and processingas well as her learning of challenging mathematics.
We based our work with Jasmine on the Triangles and Transformations Learning Trajectory (Confreyet al. 2012), teacher research about transformational approaches to similarity (Seago et al., 2013),and related Common Core Standards (2010) (e.g., 7.G.1—Solve problems involving scale drawingsof geometric figures, including computing actual lengths and areas from a scale drawing andreproducing a scale drawing at a different scale. and 8.G—Understand congruence and similarityusing physical models, transparencies, or geometry software). We began with the following samplePARCC problem:
Page 20 Ohio Journal of School Mathematics 79

Sample PARCC Problem
A right triangle has legs measuring 4.5 meters and 1.5 meters. The lengths
of the legs of a second triangle are proportional to the lengths of the legs
of the first triangle.
Which could be the lengths of the legs of the second triangle? Select each
correct pair of lengths.
a) 6 m and 2 m
b) 8 m and 5 m
c) 7 m and 3.5 m
d) 10 m and 2.5 m
e) 11.25 m and 3.75 m
Jasmine began reading the word problem, whispering to herself, and underlining key words suchas measuring, meters, lengths, proportional, and legs of the second triangle. Over the course ofseveral minutes, she typed numbers into her calculator and recorded the series of calculations (seeFigure 1). The teacher, Mrs. Karr, asked for clarification: “You are doing some division?” Jasmine
Fig. 1: Record of student findings from calculator.
replied, “Yes . . . To see if they have the same answers . . . The reason I am writing this down is so Ican get the answers that go in this spot” (pointing to the multiple choice responses). “I like to writefor some reason. I always like to check my work.”
Jasmine used productive strategies to manage demands on her working memory (e.g., offloadinginformation from short-term memory onto her scratch paper to allow her to not have to hold somuch information in her head as she thought about upcoming steps in the problem; see Risko& Dunn, 2015) as she worked through this problem including underlining, using a calculator,recording her progress carefully, and checking her work that she strategically organized on paper.Moreover, she determined the correct answer. Yet, Mrs. Karr needed to know more about Jasmine’sproblem solving process to plan subsequent instruction.
Ohio Journal of School Mathematics 79 Page 21

MRS. KARR Your work is very organized. It’s excellent. Let’s talk more about this problem. Whatis the problem about?
JASMINE It’s about measurement in meters. Who’s got the same ratio.
MRS. KARR I don’t see the word ratio at all. Why do you know it has to do with a ratio?
JASMINE (She paused for a moment and reread the problem out loud. When she got to the word proportional,she exclaimed) That’s it! Proportion means ratio. I had it in my mind, but as soon as I startedlike doing the work, it just went out of here.
MRS. KARR So, you thought of proportion and you decided to divide all of the pairs, and see ifany of the pairs . . .
JASMINE (jumping in) The only way to figure out if they have the same ratio is to divide these two(pointing to her the side lengths listed in her work).
MRS. KARR So, the sides had the same ratio. So, you are not picturing the triangle when you thinkabout this problem?
JASMINE No.
MRS. KARR Okay, that’s fine. Your work is awesome. Now, we are going to go back and talk aboutproportional triangles in a whole different way.
Building on her existing knowledge, Mrs. Karr wanted to support Jasmine’s thinking about theproportional figures using a transformational approach. She had Jasmine use a ruler to draw ageneric triangle and they worked together to make a larger, similar version of that triangle usingthe process of dilation (Figure 2). During this process, Mrs. Karr made the points for the largertriangle and Jasmine connected the dots.
Fig. 2: Sketch of dilation transformation.
JASMINE (As she made the triangle) It’s a bigger version of the other one! And, if we want to make itthree times as big we go on farther.
MRS. KARR Yes! (Then, she shaded the smaller rectangle and drew polka-dots inside the larger triangle.)The one with polka-dots in it is twice as big, but it’s still the same shape.
Page 22 Ohio Journal of School Mathematics 79
JASMINE Yeah, but it’s going to have different . . . The meters . . . Because, it is twice more than theother number.
Then, Mrs. Karr gestured to one side of the triangle moving the tip of her pencil back and forthalong that side (i.e., a dynamic representation in the form of a moving gesture) to demonstrate thelength of that side.
MRS. KARR Let’s look at these sides. If this is three (pointing to the side on the smaller triangle), whatis this? (pointing to corresponding side on the larger triangle while gesturing back and forth with herpencil tip along that side)
JASMINE It’s six!
MRS. KARR You are getting the big idea. This is about two (pointing and gesturing along another sideof the smaller triangle and then to a corresponding side on the larger triangle) so what is that?
JASMINE Four.
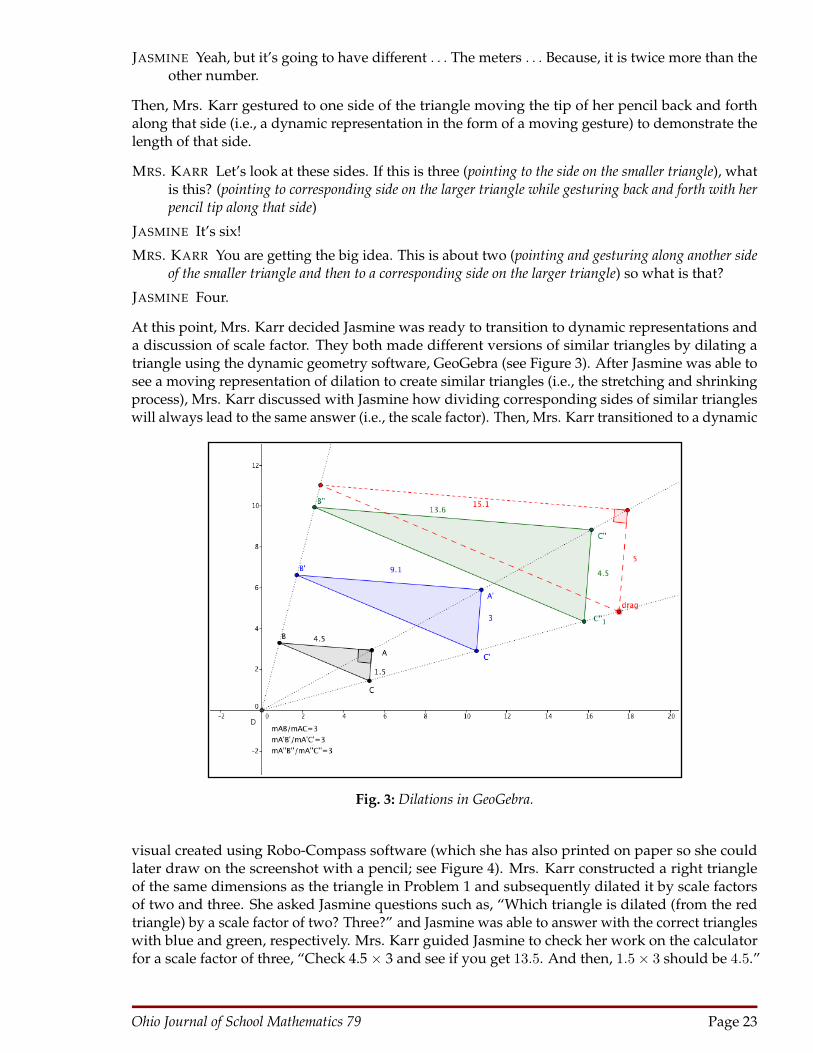
At this point, Mrs. Karr decided Jasmine was ready to transition to dynamic representations anda discussion of scale factor. They both made different versions of similar triangles by dilating atriangle using the dynamic geometry software, GeoGebra (see Figure 3). After Jasmine was able tosee a moving representation of dilation to create similar triangles (i.e., the stretching and shrinkingprocess), Mrs. Karr discussed with Jasmine how dividing corresponding sides of similar triangleswill always lead to the same answer (i.e., the scale factor). Then, Mrs. Karr transitioned to a dynamic
Fig. 3: Dilations in GeoGebra.
visual created using Robo-Compass software (which she has also printed on paper so she couldlater draw on the screenshot with a pencil; see Figure 4). Mrs. Karr constructed a right triangleof the same dimensions as the triangle in Problem 1 and subsequently dilated it by scale factorsof two and three. She asked Jasmine questions such as, “Which triangle is dilated (from the redtriangle) by a scale factor of two? Three?” and Jasmine was able to answer with the correct triangleswith blue and green, respectively. Mrs. Karr guided Jasmine to check her work on the calculatorfor a scale factor of three, “Check 4.5 × 3 and see if you get 13.5. And then, 1.5× 3 should be 4.5.”
Ohio Journal of School Mathematics 79 Page 23
They experimented with using numbers with decimals as scale factors (e.g., 1.5 as a scale factor; seethe pencil-drawn triangles). Jasmine said, “You can still make a triangle out of that.” Mrs. Karrobserved, “It is still the same shape as the other one.”
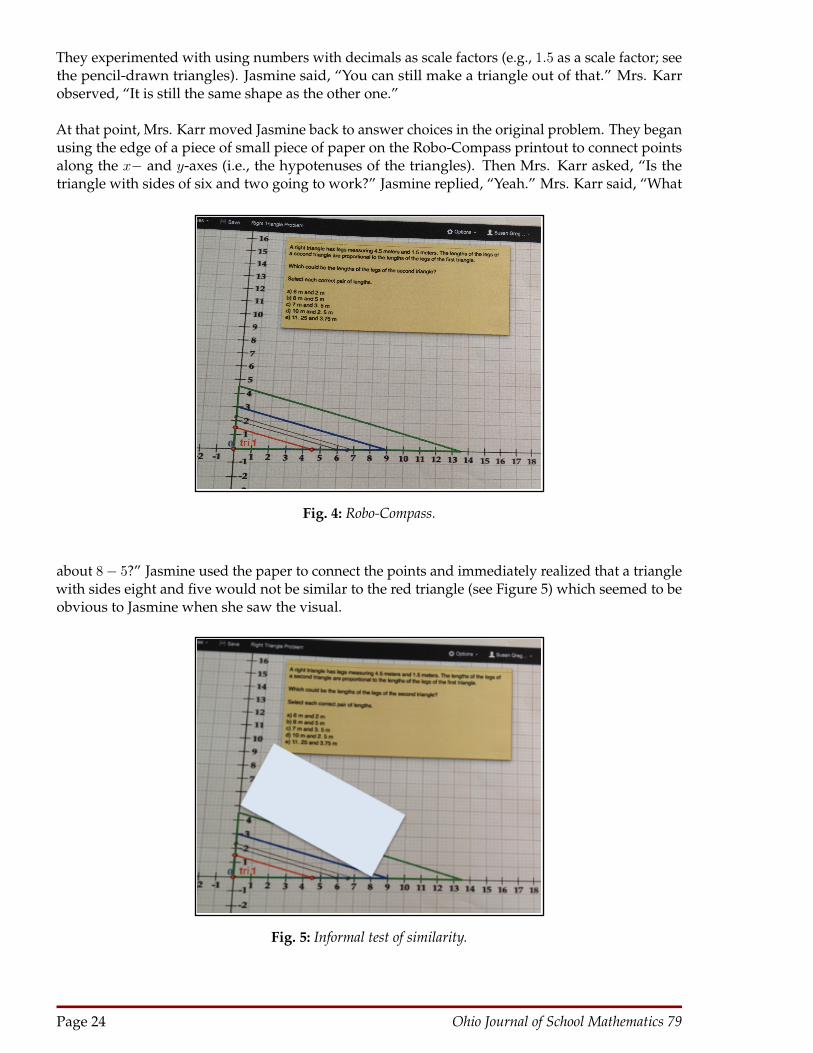
At that point, Mrs. Karr moved Jasmine back to answer choices in the original problem. They beganusing the edge of a piece of small piece of paper on the Robo-Compass printout to connect pointsalong the x− and y-axes (i.e., the hypotenuses of the triangles). Then Mrs. Karr asked, “Is thetriangle with sides of six and two going to work?” Jasmine replied, “Yeah.” Mrs. Karr said, “What
Fig. 4: Robo-Compass.
about 8− 5?” Jasmine used the paper to connect the points and immediately realized that a trianglewith sides eight and five would not be similar to the red triangle (see Figure 5) which seemed to beobvious to Jasmine when she saw the visual.
Fig. 5: Informal test of similarity.
Page 24 Ohio Journal of School Mathematics 79

Then Jasmine easily finished checking her calculations against the visual. Both of these tasksallowed Jasmine to connect a proportional situation with which she had some understanding, to ageometric model chosen to support a transformational view of similarity.
2 Summary
To find ways to support students with LD as they engage with geometric concepts, we recommendthat teachers experiment with different combinations of visual representations from a multiplesources. We recommend trying a variety of software products in combination with drawing onpaper (and gesturing at times to support the other visuals) to facilitate productive mathematicalconversations. High quality representations support better mathematical thinking and discussionsfor all students (Sfard, 2002); we stress that these representations are possibly even more crucial forstudents with LD due to the working memory deficits these children need to overcome to succeedwith challenging mathematics.
References
Battista, M. T. (2009). Highlights of research on learning school geometry. In T. V. Craine & RhetaRubenstein (Eds.), Understanding geometry for a changing world, 2009 yearbook of the NationalCouncil of Teachers of Mathematics (pp. 91–108). Reston, VA: National Council of Teachers ofMathematics.
Confrey, J., Nguyen, K. H., Lee, K., Panorkou, N., Corley, A. K., & Maloney, A. P. (2012). Turn-on Common Core Math: Learning Trajectories for the Common Core State Standards forMathematics. Retrieved from http://www.turnonccmath.net
Council of Chief State School Officers and National Governors Association. (2010). Common CoreStandards. Retrieved from http://www.corestandards.org/about-the-standards/key-points-in-mathematics
Goldin-Meadow, S., Nusbaum, H., Kelly, S. D., & Wagner, S. (2001). Explaining math: Gesturinglightens the load. Psychological Science, 12, 516–522.
Marita, S., & Hord, C. (2017). Review of mathematics interventions for secondary students withlearning disabilities. Learning Disability Quarterly, 40, 29–40.
National Council of Teachers of Mathematics (2000). Principles and Standards for School Mathematics.Reston, VA: Author.
Olive, J. (1998). Opportunities to explore and integrate mathematics with the Geometers Sketchpad.In R. Lehrer & D. Chazan, (Eds). Designing learning environments for developing understanding ofgeometry and space (pp. 395–418). Hillsdale, NJ: Lawrence Earlbaum.
Partnership for Assessment of Readiness for College and Careers (2014). PARCC Mathematics PracticeTests. Pearson Education. Retrieved from http://parcc.pearson.com/practice-tests/math/
Risko, E. F., & Dunn, T. L. (2010). Storing information in-the-world: Metacognition and cognitiveoffloading in a short-term memory task. Consciousness and Cognition, 36, 61–74.
Seago, N., Jacobs, J., Driscoll, M., Nikula, J., Matassa, M., & Callahan, P. (2013). Developing teachers’knowledge of a transformation-based approach to geometric similarity. Mathematics TeacherEducator, 2, 74–85.
Ohio Journal of School Mathematics 79 Page 25

Sfard, A. (2002). The interplay of intimations and implementations: Generating new discourse withnew symbolic tools. Journal of the Learning Sciences, 11, 319–357.
Swanson, H. L., & Siegel, L. (2001). Learning disabilities as a working memory deficit. Issues inEducation, 7, 1–48.
van Garderen, D. (2007). Teaching students with LD to use diagrams to solve mathematical wordproblems. Journal of Learning Disabilities, 40, 540–553.
Casey Hord, [email protected], is an Assistant Professor in the De-partment of Special Education. He coordinates the Special EducationPhD and EdD programs at the University of Cincinnati. His primary re-search interest is developing interventions in mathematics for studentswith high incidence disabilities.
Susan A. Gregson, [email protected], is an Assistant Profes-sor of Mathematics Education at the University of Cincinnati. She has16 years experience coaching teachers and teaching middle and highschool mathematics in urban and rural contexts in the U.S. and abroad.
Jennifer B. Walsh, [email protected], is a special educa-tion teacher at Sycamore High School in Cincinnati, Ohio. Ms. Walsh isinterested in helping reach all mathematics students with differentiatedteaching methods.
Samantha Marita, [email protected], is an Educational Advisor forMath and Science Support Center at the University of Cincinnati. Sheoversees the student staff for the Supplemental Review Sessions pro-gram which provides support for students in Calculus and many othermath and science courses.
Page 26 Ohio Journal of School Mathematics 79