using zrs and the zacks valuation model to identify … cola & pepsico: what is all the fizz...
TRANSCRIPT

COCA COLA & PEPSICO:
WHAT IS ALL THE FIZZ ABOUT?
Zacks Investment Research, Inc. (312) 630-9880 [email protected]
Using ZRS and the Zacks Valuation
Model to identify factors impacting
equity valuations in 3 minutes or less

Coca Cola & PepsiCo: What is all the fizz about?
The Coca Cola Company (Ticker: KO) and PepsiCo (Ticker: PEP) are two inescapable behemoths within the beverage
& food space. On one hand you have Coca Cola: the unequivocal global leader in the beverage marketplace with a
portfolio of more than 500 carbonated and non-carbonated beverages, an extensive global distribution channel and
numerous bottling operations. On the other hand, you have PepsiCo: a dynamically-diversified global food and
beverage operator that markets hundreds of diverse products in over 200 countries.
For numerous years, these two companies have battled each other for market share and brand recognition in every
conceivable way, with the effervescent Coca Cola winning the ‘cola wars’ of the 80s and 90s. However, is there more
that meets the eye to these competitors? Are they even fair comparables? If so, which is stock will provide better
returns over long-term?
These are all questions that the Zacks Equity Research System (ZRS) can help the user uncover, analyze and
understand about the two companies. Whether it understanding their complex business structures or evaluating
current valuations and trends, ZRS offers all the necessary tools allows users to make educated investment
decisions.
So prior to digging into the fundamental analysis of the two firms, let’s get an idea of the general opinions on the
two firms using our consensus sell-side reports that are available within the Digest section of ZRS.

Next, let us begin with a broad view of the S&P 500 sector equal-weighted performance and then subsequently look
at each firms’ relative performance.
Since the beginning of 2013 and the advent of QE4 by the Fed, what may strike one as bit odd — but hardly
unnoticed by the investment community —is the noticeable resolve of consumer staples and other defensive
sectors in the face of numerous headwinds that would indicate riskier sectors should be leading the way (though
cyclicals appear to have broken-out over the past couple weeks). While this fact may confound, there are many
veritable reasons as to why this is occurring: search for yield in low interest rate environment, demand for lower
volatility strategies, continual domestic/global growth risks, indefatigable US consumers, etc.)
So given their recent leadership, lets dig into the absolute and relative performance of KO and PEP to the Consumer
Staples sector and the S&P 500.

Judging from the charts, it becomes clearly obvious of Coca Cola’s cumulative performance has outstripped that of
PepsiCo by over 30% since the recovery began. The divergence in performance, beginning in the last half 2010, can
be traced to the investment community’s concern around PepsiCo’s change in corporate strategy towards
health/wellness awareness, which now looks to be unfounded and is a source of enthusiasm for the company.
Looking at the second graph above, these two stocks have been on a tear over the past five months with PepsiCo
slightly edging-out Coca Cola. There are many reasons as to why this has unfolded, which we will cover later in the
paper; however, let us next take a look at the two companies relative to the equal-weighted sector category and the
S&P 500.
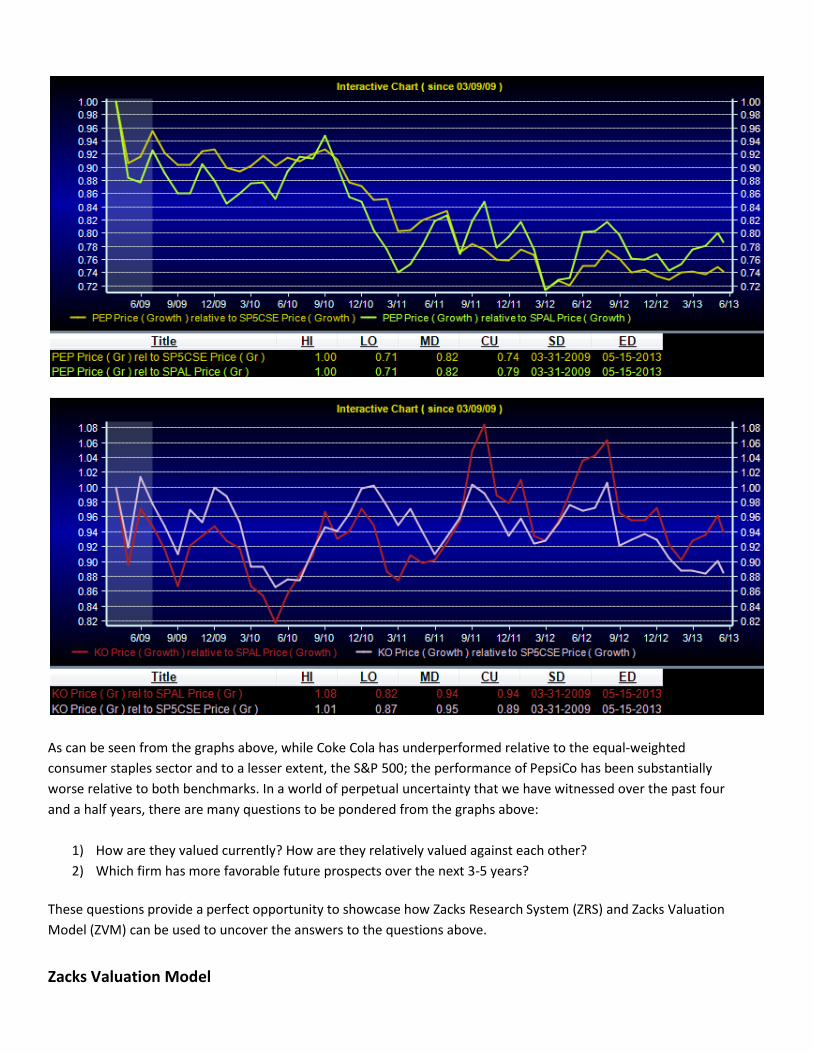
As can be seen from the graphs above, while Coke Cola has underperformed relative to the equal-weighted
consumer staples sector and to a lesser extent, the S&P 500; the performance of PepsiCo has been substantially
worse relative to both benchmarks. In a world of perpetual uncertainty that we have witnessed over the past four
and a half years, there are many questions to be pondered from the graphs above:
1) How are they valued currently? How are they relatively valued against each other?
2) Which firm has more favorable future prospects over the next 3-5 years?
These questions provide a perfect opportunity to showcase how Zacks Research System (ZRS) and Zacks Valuation
Model (ZVM) can be used to uncover the answers to the questions above.
Zacks Valuation Model
The Zacks Valuation Model (ZVM) is a visually‐oriented, five factor discounted earnings model that first appears in
“default” mode. Default model inputs are derived exclusively from data contained within ZRS; no subjective
adjustments to the data have been made by the Zacks analyst staff. Default results are objectively set with
algorithms that generate the best possible starting point for analysis from which users are expected to provide
overrides based on individual knowledge or forecasts of both company specific and macroeconomic factors. ZVM
can quantify any combination of:
1) Earnings Forecasts
2) Earnings Growth Forecasts
3) Equity Risk Premium Forecasts
4) Interest Rate Forecasts
5) Company Specific Risk Issues.
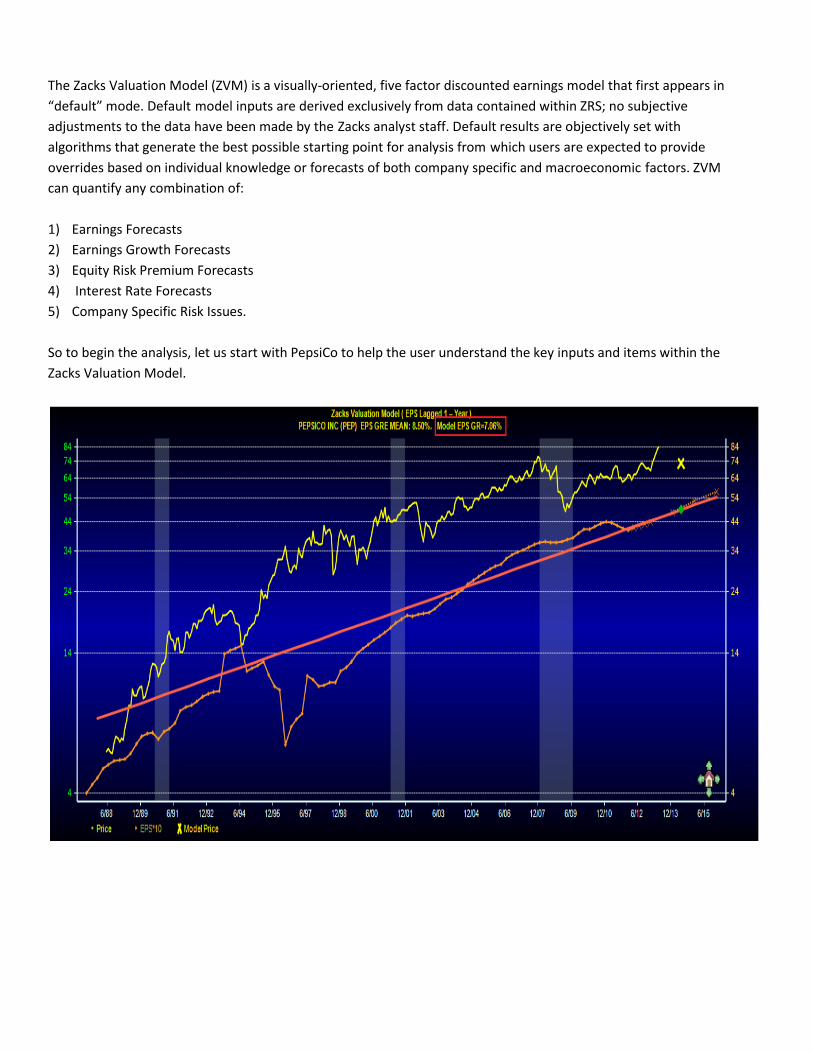
So to begin the analysis, let us start with PepsiCo to help the user understand the key inputs and items within the
Zacks Valuation Model.
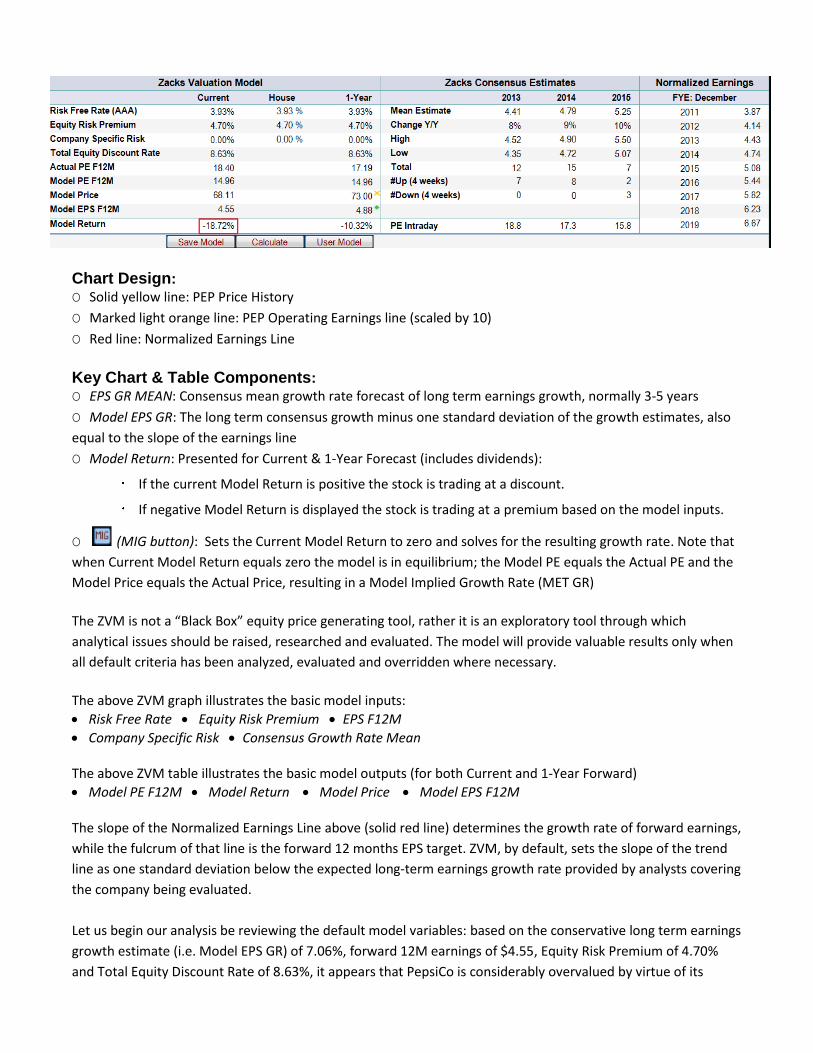
Chart Design:
O Solid yellow line: PEP Price History
O Marked light orange line: PEP Operating Earnings line (scaled by 10)
O Red line: Normalized Earnings Line
Key Chart & Table Components:
O EPS GR MEAN: Consensus mean growth rate forecast of long term earnings growth, normally 3‐5 years
O Model EPS GR: The long term consensus growth minus one standard deviation of the growth estimates, also
equal to the slope of the earnings line
O Model Return: Presented for Current & 1‐Year Forecast (includes dividends):
If the current Model Return is positive the stock is trading at a discount.
If negative Model Return is displayed the stock is trading at a premium based on the model inputs.
O (MIG button): Sets the Current Model Return to zero and solves for the resulting growth rate. Note that
when Current Model Return equals zero the model is in equilibrium; the Model PE equals the Actual PE and the
Model Price equals the Actual Price, resulting in a Model Implied Growth Rate (MET GR)
The ZVM is not a “Black Box” equity price generating tool, rather it is an exploratory tool through which
analytical issues should be raised, researched and evaluated. The model will provide valuable results only when
all default criteria has been analyzed, evaluated and overridden where necessary.
The above ZVM graph illustrates the basic model inputs:
Risk Free Rate Equity Risk Premium EPS F12M
Company Specific Risk Consensus Growth Rate Mean The above ZVM table illustrates the basic model outputs (for both Current and 1‐Year Forward)
Model PE F12M Model Return Model Price Model EPS F12M The slope of the Normalized Earnings Line above (solid red line) determines the growth rate of forward earnings,
while the fulcrum of that line is the forward 12 months EPS target. ZVM, by default, sets the slope of the trend
line as one standard deviation below the expected long‐term earnings growth rate provided by analysts covering
the company being evaluated.
Let us begin our analysis be reviewing the default model variables: based on the conservative long term earnings
growth estimate (i.e. Model EPS GR) of 7.06%, forward 12M earnings of $4.55, Equity Risk Premium of 4.70%
and Total Equity Discount Rate of 8.63%, it appears that PepsiCo is considerably overvalued by virtue of its

current Model Return of ‐18.72%. The ZVM model is telling us that if we expect earnings growth of only 7.06%,
then PEP stock warrants a current price of $68.11. Based on this output alone, we need to consider why the
current price is significantly higher than the consensus sell side growth forecast — the default model growth
input. Could our consensus growth rates be different than what the market is using to price PEP?
In order to unearth this information, let’s assume the market is currently efficient, hold all other inputs constant
and adjust Model EPS GR to arrive at a current Model Return of 0%. This will allow us to view the market’s
earnings growth rate expectation (i.e. Market Implied Growth Rate) based on the stock’s current price. We are
able to easily accomplish this by pressing the MIG button, which sets the current model return to 0%.
Note that when the current Model Return is zero, the Model PE equals the Actual PE and the Model Price equals
the Actual Price, resulting in a market implied growth rate (Model EPS GR). In essence, Model EPS GR now
represents the long term growth rate at which the market (i.e. investment/buy-side community) is currently
willing to pay for the stock.

As we can see above, the current Market Implied Growth Rate is 252 basis points greater than conservative L.T.
earnings growth estimate. Based on the assumption that the market is in equilibrium at its current price level,
one can infer that there is quite the disagreement between the sell-side community expectations and the
implied valuations from the buy-side community, as quantified by the ZVM Market Implied Growth Rate.
But before we can make any more inferences for PEP, let’s take a look Coke Cola, using the same steps that were
described above.
Next, let us assume the market is currently in equilibrium and hold all other inputs constant while adjusting
Model EPS GR to arrive at a current Model Return of 0%, through the use of the MIG button.

Similar to what we saw from PEP, it appears that the investment/buy-side community has bid-up Coca Cola to
precarious heights, relative to what the street is forecasting, which results in nearly a 20% current overvaluation.
In addition, there is a difference of 262 basis points between the current market implied growth rate and the
conservative street L.T. growth estimate (i.e. Model Implied Growth of 10.12% vs. Model EPS GR of 7.5%).
Now we have come to a point where we have uncovered some interesting facts: 1) PEP has underperformed
relative to KO, Consumer Staples and S&P 500 2) the dissonance in valuation between the market and the street
for both stocks. These observations present us with the perfect opportunity to utilize the ZRS platform to
investigate the merits of the disparity in valuation and the relative value prospects of the two stocks going
forward.
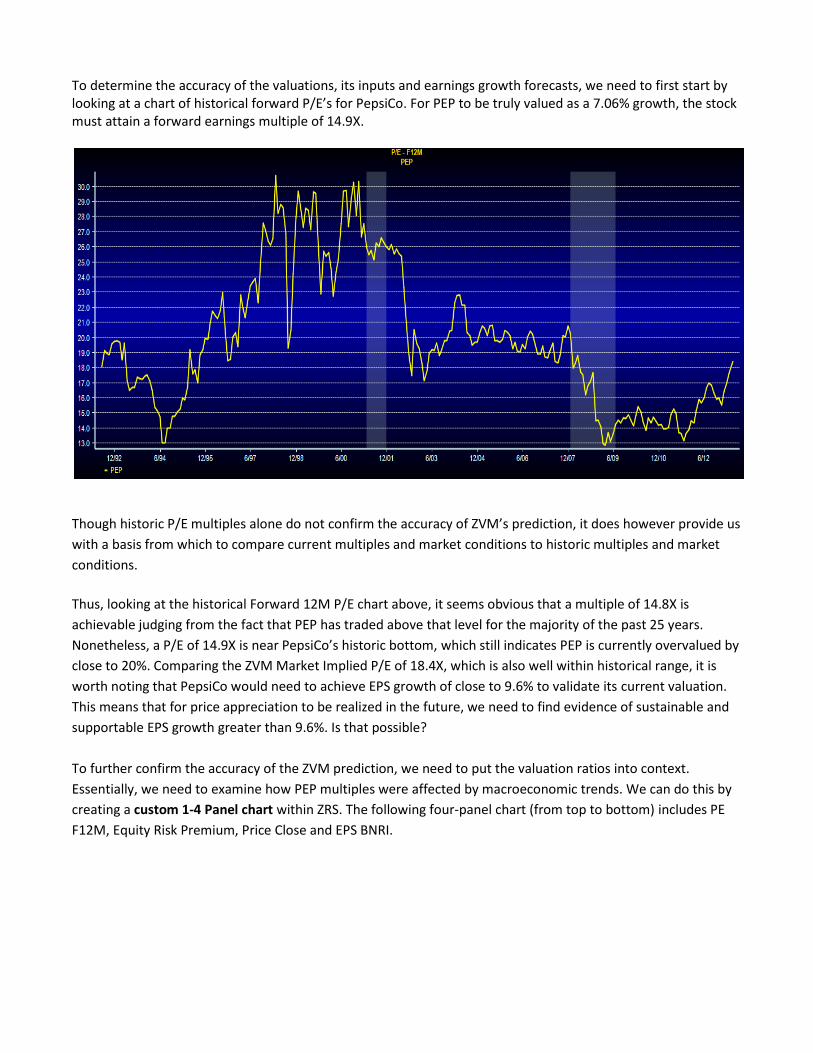
To determine the accuracy of the valuations, its inputs and earnings growth forecasts, we need to first start by looking at a chart of historical forward P/E’s for PepsiCo. For PEP to be truly valued as a 7.06% growth, the stock must attain a forward earnings multiple of 14.9X.
Though historic P/E multiples alone do not confirm the accuracy of ZVM’s prediction, it does however provide us
with a basis from which to compare current multiples and market conditions to historic multiples and market
conditions.
Thus, looking at the historical Forward 12M P/E chart above, it seems obvious that a multiple of 14.8X is
achievable judging from the fact that PEP has traded above that level for the majority of the past 25 years.
Nonetheless, a P/E of 14.9X is near PepsiCo’s historic bottom, which still indicates PEP is currently overvalued by
close to 20%. Comparing the ZVM Market Implied P/E of 18.4X, which is also well within historical range, it is
worth noting that PepsiCo would need to achieve EPS growth of close to 9.6% to validate its current valuation.
This means that for price appreciation to be realized in the future, we need to find evidence of sustainable and
supportable EPS growth greater than 9.6%. Is that possible?
To further confirm the accuracy of the ZVM prediction, we need to put the valuation ratios into context.
Essentially, we need to examine how PEP multiples were affected by macroeconomic trends. We can do this by
creating a custom 1‐4 Panel chart within ZRS. The following four‐panel chart (from top to bottom) includes PE
F12M, Equity Risk Premium, Price Close and EPS BNRI.

As we can see from the four‐panel chart above, the equity risk premium (ERP) has steadily increased over the past
decade due to heightened risk aversion coupled with a decrease in interest rates. In addition, notice that the ERP
and P/E multiples have a strong inverse relationship, i.e. as ERP increases P/E decreases. By utilizing the time series
relationships in Interactive Charting, we see that 82% of the movement in the P/E F12M is explained by ERP over
the time period.
More importantly, it becomes apparent that PEP’s move upwards in 2013 has directly coincided with a
noteworthy decrease in the ERP, lifting all boats and giving way to P/E multiple expansion. Specifically, can we
deduce that the ERP has been the predominant factor in causing PEP stock to increase? Has the denominator
(i.e. future earnings) had any pronounced effect? To see, let’s look at F1 & F2 EPS Estimates history in ZRS.

Judging from the chart, F1 & F2 EPS estimates have been fairly stable over the past year (i.e. decrease of - 0.59%
and -0.44%). So, if you were not fully convinced of the decline in ERP lifting all boats, take look at Coke’s F1 & F2
EPS estimate history.

The KO charts shows that F1 & F2 EPS estimates are down -3.53% and -4.08%, respectively, while its P/E F12M
has risen by 12% in 2013 alone. So despite downward EPS revisions, there should be no doubt that the factor
leading the market upwards has been a decline in ERP.
Next, let’s drill down to more company-specific metrics to further examine whether the firms’ valuation and
forecasted earnings growth are justifiable and supportable by using the customized Margin View charts in ZRS.

Since margins tend to be cyclical over the long‐term, most analysis of these trends should be done by viewing at
least 20 years of data. In the four panel chart above, we have defined the period of analysis to be 20 years so
that we can take a look at what past and recent margin trends tell us about PEP and Coke.
From the images above, Coke’s margins are superior on an absolute basis; but it is the trends of these ratios that
are more informative and provide a better perspective of where a company is in its earnings cycle. Looking at
both EBIT and net income margins for PEP and KO, we see that these ratios have steadily decreased since the
economic downturn began in 2008. In addition to this, the beverage/snack markets were affected by a
confluence of negative factors — high commodity input prices (i.e. corn) and slowing demand in developed
markets due to the health concerns of sugary beverages. However, EBIT margin for PEP looks to have recently
stabilized from its slow lurch downwards while Coke’s EBIT margin leveled-off a couple years back but have gone
nowhere since. Though emerging markets have become a main engine of future revenue growth (dashed line
red line) for both firms, total revenue prospects look to be tempered. So until top line revenue begins to grow
sustainably, any increase in earnings/net margins is highly dependent on cost savings in the near-term future.
With the aforementioned facts stated previously, it begs the question: Is PEP or KO a better value in the long-
term? Let’s use the ZRS Growth & Margin Analysis feature to see if we can find evidence that will help us make
a decision.


Zacks Growth and Margin view allows one to focus in on short and long term diluted vs. aggregate growth in
earnings and revenues. Incorporated into this view are YoY quarterly growth rates as well as sequential quarter‐
to‐quarter growth rates in conjunction with EPS Surprise, Net Margins and YoY quarterly share changes.
This view allows the user to examine shorter term historical/forecast growth supportability issues; while at the
site time observe longer term historical growth sustainability issues.
Glancing at the year-over-year (YoY) growth estimates in the image above, we can see that the market implied
growth rates for PEP and KO (9.58% and 10.12%, respectively) look quite high relative to trailing twelve-month
revenue and earnings growth. In addition, KO growth figures in 2011 appear to be overstated due to the
acquisitions of bottlers, thus exaggerating more recent growth figures. Though PEP and KO have sustained
growth rates of 9-10% in earnings over the prior 10 years on a least squares growth basis, the question is
whether the current and near term environment can support the same type of company performance going into
the future. Ultimately, the heart of the analytical issue here is that companies like KO and PEP can only cut costs
for so long before revenue growth must at least equal the growth in earnings.
Nevertheless, we all know that current valuation should reflect projected future company prospects, and thus is
the true basis of comparison. As stated previously, both firms will be counting on cost containment to generate
earnings, which is clearly obvious in the case of KO (i.e. F4Q-2013 estimates of roughly 2% revenue and 7%
earnings growth). But PEP F4Q earnings growth estimate (5%) appears more substantiated by forecasted
revenue growth (4%). This is an interesting observation which we can investigate further using Zacks Consensus
Forecast models.

From our Consensus PEP & KO models, I am displaying its two largest segments (as % of revenue), recent YoY
change and the forecasted cumulative average growth over the next 3 years. As we can see, Q1-13 YoY growth
in Coke’s two largest segments — accounting for more than 60% of total revenue— were negative while 3-year
average growth estimates for its largest segments looks subdued when compared to PEP. So the fact emerges
that PepsiCo’s two largest-contributing revenue segments are set to grow more than Coke’s.
It has been well-documented that the Fed’s low interest policy has caused yield-starved investors to gravitate
towards dividend stocks, possibly providing an explanation for recent consumer staple leadership at the same
time. So by using the Growth & Margin view above and the ZRS Dividend Analysis feature below, we can analyze
a firm’s dividend policy.
Through a combination of a consistent stock buyback program (top right-hand corner of Margin Analysis) and
increasing dividend payouts/growth, both PEP and KO are keen to return cash to their stockholders. From a yield
perspective, both are relative equals; however, Coke’s long history of dividend increases in conjunction with
relative greater dividend growth may make it more attractive in this scenario. Nevertheless, keep an eye on
Coke’s Div/FCF: if this ratio extends its upward trend, stockholders may want to reconsider their position since
this would signal a possible lack of growth opportunities going forward.

In summary, let us recall some of the fundamental data and trends previously expounded on relative to PEP, KO
and the Consumer Staples sector:
1) Strength and leadership of the Consumer Staples sector since the beginning of the downturn can be
attributed many sources: yield-seeking investor demand, interest in low volatility equities, QE, etc.
2) Relative cumulative underperformance of PEP to KO, Consumer Staples and the S&P 500 since beginning
of downturn
3) Relative cumulative outperformance of PEP versus KO over the past 5 months
4) Significant multiple expansion due to steady decrease in Equity Risk Premium over the past 5 months
5) PEP F1 & F2 EPS estimate revisions fairly stable while KO estimates trending downwards
6) KO gross, operating and net margins dominate those of PEP on an absolute basis
7) Recent slowing growth in top line revenue for both companies
8) Consistent stock buyback policies and solid dividend growth for both companies
Now, these facts can be added to the other information that was found using ZVM and ZRS:
9) Analysts’ consensus estimate of the 3‐5 year earnings growth rate for PEP and KO is expected to be 8.5%
and 8.83%, respectively, which deviates slightly from their conservative default (sell side) estimates of
7.06% and 7.5% used in the valuation.
10) Currently, the market is pricing an implied earnings growth rate of 9.58% and 10.12% for PEP and KO,
respectively, which is higher than the analysts’ consensus growth estimates and ZVM’s default earnings
growth rates.
11) Market implied growth rates for PEP and KO (9.58% and 10.12%, respectively) look high relative to
recent revenue and earnings growth trends
12) PepsiCo’s FQ4 future earnings growth looks to better validated by stronger future revenue growth
relative to Coke
13) Improved recent and future revenue growth prospects for PEP’s two largest segments, relative to Coke
14) Cost containment strategies and decreases in raw material cost volatility should lead to margin growth
for both firms
15) PepsiCo’s more diversified product segments (i.e. snacks/food vs. beverage-only) and its increased focus
on health-conscious consumers should provide buoyancy and significant future growth for the firm
Given the evidence compiled above, PepsiCo and Coke’s current valuation may seem a bit rich and may not be the
ideal jumping-on point for an investment in either firm. Much of the recent movement upwards for both stocks can
be attributed myriad of different factors: decline in ERP, QE, low interest rates, lower volatility, etc. On the other
hand, investors should be most concerned with future earnings prospects of a firm and its ability to deliver long-
term value to its shareholders. Based on that point of view, PepsiCo looks to be better positioned than Coke to
deliver the long-term growth and value that its shareholders desire.
Tim Nyland, CFA
Managing Director
Zacks Investment Research