uttara kannada brochure-2012 - central ground water...
TRANSCRIPT
1
2
Foreword
Groundwater is an essential component of the environment and economy. It
sustains the flow in our rivers and plays an important role in maintaining the
fragile ecosystems. The groundwater dependence of agrarian states like
Karnataka is high. Recent studies indicate that 26 percent of the area of
Karnataka State is under over exploited category and number of blocks is
under critical category. In view of the growing concerns of sustainability of
ground water sources, immediate attention is required to augment groundwater
resources in stressed areas. Irrigated agriculture in the state is putting
additional stress on the groundwater system and needs proper management of
the resources.
Central Ground Water Board is providing all technical input for effective
management of ground water resources in the state. The groundwater scenario
compiled on administrative divisions gives a better perspective for planning
various ground water management measures by local administrative bodies.
With this objective, Central Ground Water Board is publishing the revised
groundwater information booklet for all the districts of the state.
I do appreciate the efforts of Dr. K.Md.Najeeb, Regional Director and his fleet of
dedicated Scientists of South Western Region, Bangalore for bringing out this
booklet. I am sure these brochures will provide a portrait of the groundwater
resources in each district for planning effective management measures by the
administrators, planners and the stake holders.
Dr. S. C. Dhiman

3
PREFACE
Ground water contributes to about eighty percent of the drinking water
requirements in the rural areas, fifty percent of the urban water requirements
and more than fifty percent of the irrigation requirements of the nation.
Central Ground Water Board has decided to bring out district level ground
water information booklets highlighting the ground water scenario, its
resource potential, quality aspects, recharge – discharge relationship,
vulnerability area etc., for all the districts of the country. As part of this,
Central Ground Water Board, South Western Region, Bangalore, is
preparing such booklets for all the 30 districts of Karnataka state,
incorporating the data up to the period 2011-12.
The Uttara Kannada district Ground Water Information Booklet has been
prepared based on the information available and data collected from various
state and central government organisations by several hydro-scientists of
Central Ground Water Board with utmost care and dedication. This booklet
has been prepared by Shri. B.V. Chinagudi, Scientist-B, Central Ground
Water Board, South Western Region, Bangalore. The figures were prepared by
Sri. J. Sivaramakrishnan, Assistant Hydrogeologist and the rainfall data provided by
Shri H.P.Jayaprakash Scientist-C. The efforts of Report processing section in
finalising and bringing out the report in this format are commendable.
I take this opportunity to congratulate them for the diligent and careful
compilation and observation in the form of this booklet, which will certainly
serve as a guiding document for further work and help the planners,
administrators, academicians, hydrogeologists and engineers to plan and
manage the water resources in a better way in the district.
(K.Md.Najeeb)
Regional Director

4
UTTARA KANNADA DISTRICT AT A GLANCE
Sl No
ITEMS STATISTICS
I GENERAL INFORMATION 1 Geographical Area : 10222 Sq. Km 2 Administrative Divisions i No. Of Taluks : 11 ii No. Towns : 6 iii No. of Villages : 1246 iv Average annual rainfall 1166.3 - 3672.5 3 Population (2011census) : a) Total Population : 14.37lakhs b) Rural Population : 9.66 lakhs c) Urban Population : 3.88 lakhs d) Density of Population : 140 Persons/Sq.km e) Literacy percentage : 76.60%
II GEOMORPHOLOGY Major physiographic divisions i) coastal plains,
ii) Western ghats iii) Eastern table land
Major Drainages Kali, Sharavathi, gangavali and Aganashini
III Land use (2005-2006) a) Area under forests (ha) 813695 b) Area not available for cultivation(ha) 50600 c) fallow and other land (ha) 47107 d) Net area sown(ha) 113277 e) Area sown more than once (ha) 11473 f) Gross area under cultivation (ha) 124750 g) Net irrigated area (ha) 25437 h) Area irrigated by ground water (ha) 9390 IV MAJOR SOIL TYPES Hilly soil, lateritic soil, loamy
soil and semi-black cotton soil.
V AREA UNDER PRINCIPAL CROPS (2002-03) figures in ha
Paddy – 80311 Maize -- 1542 Pulses – 2426 Spices – 15787 Oil seeds- 3452 Fruits -- 6924 Vegetables- 302 Sugarcane- 1008 Cotton – 6197 Coconut-- 7197
VI IRRIGATION BY DIFFERENT SOURCES
Source Area(ha) Dugwells –7302 Borewells-2090 Lift - 596 Tanks/Ponds-4754
5
Canals - 94 Other sources – 10601 Net irrigated area -25437
VII NUMBER OF GROUND WATER MONITORING STATIONS OF CGWB No of Dugwells No of piezometers
34 10
VIII PREDOMINANT GEOLOGICAL FORMATIONS
Recent Alluvium Lower Precambrian Dharwar
system Meta-sedimentary &Metavolcanics.
Archaean Formation Peninsular gneisses
Gneisses,mig-matites and granites
.
VII
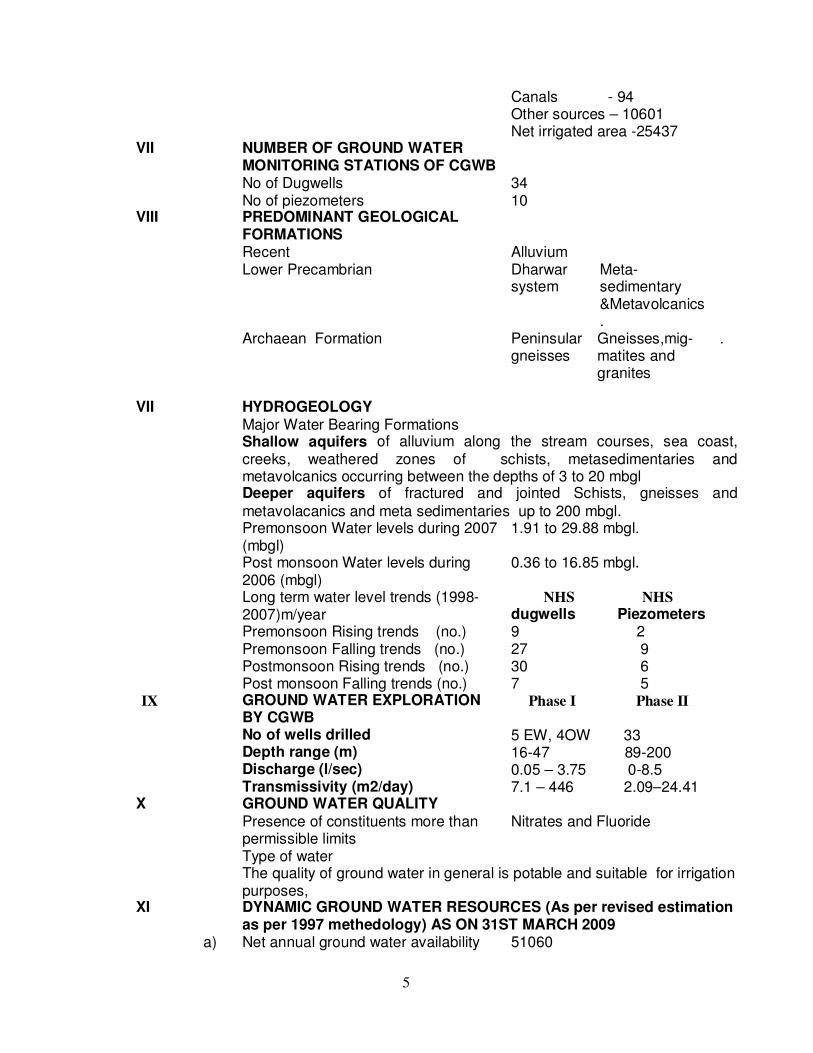
HYDROGEOLOGY
Major Water Bearing Formations Shallow aquifers of alluvium along the stream courses, sea coast,
creeks, weathered zones of schists, metasedimentaries and metavolcanics occurring between the depths of 3 to 20 mbgl
Deeper aquifers of fractured and jointed Schists, gneisses and
metavolacanics and meta sedimentaries up to 200 mbgl. Premonsoon Water levels during 2007
(mbgl) Post monsoon Water levels during 2006 (mbgl) Long term water level trends (1998-2007)m/year Premonsoon Rising trends (no.) Premonsoon Falling trends (no.) Postmonsoon Rising trends (no.) Post monsoon Falling trends (no.)
1.91 to 29.88 mbgl. 0.36 to 16.85 mbgl.
NHS NHS
dugwells Piezometers 9 2 27 9 30 6 7 5
IX GROUND WATER EXPLORATION BY CGWB No of wells drilled Depth range (m) Discharge (l/sec) Transmissivity (m2/day)
Phase I Phase II
5 EW, 4OW 33 16-47 89-200 0.05 – 3.75 0-8.5 7.1 – 446 2.09–24.41
X GROUND WATER QUALITY Presence of constituents more than permissible limits Type of water
Nitrates and Fluoride
The quality of ground water in general is potable and suitable for irrigation purposes,
XI DYNAMIC GROUND WATER RESOURCES (As per revised estimation as per 1997 methedology) AS ON 31ST MARCH 2009
a) Net annual ground water availability 51060

6
(ham) b) Existing gross ground water draft for
all uses (ham) 18351
c) Allocation for domestic and industrial use for next 25 years in (ham)
3363
d) Net ground water availability for future irrigation development (ham)
32222
e) Stage of development as on March 2009 (%)
37.5
XII AWARENESS AND TRAINING ACTIVITIES
Mass awareness programme arranged Water Management training programme arranged
Nil Nil
XIII GROUND WATER CONTROL AND REGULATION Number of OE blocks Number of Critical blocks Number of blocks notified
2 Nil Nil
7
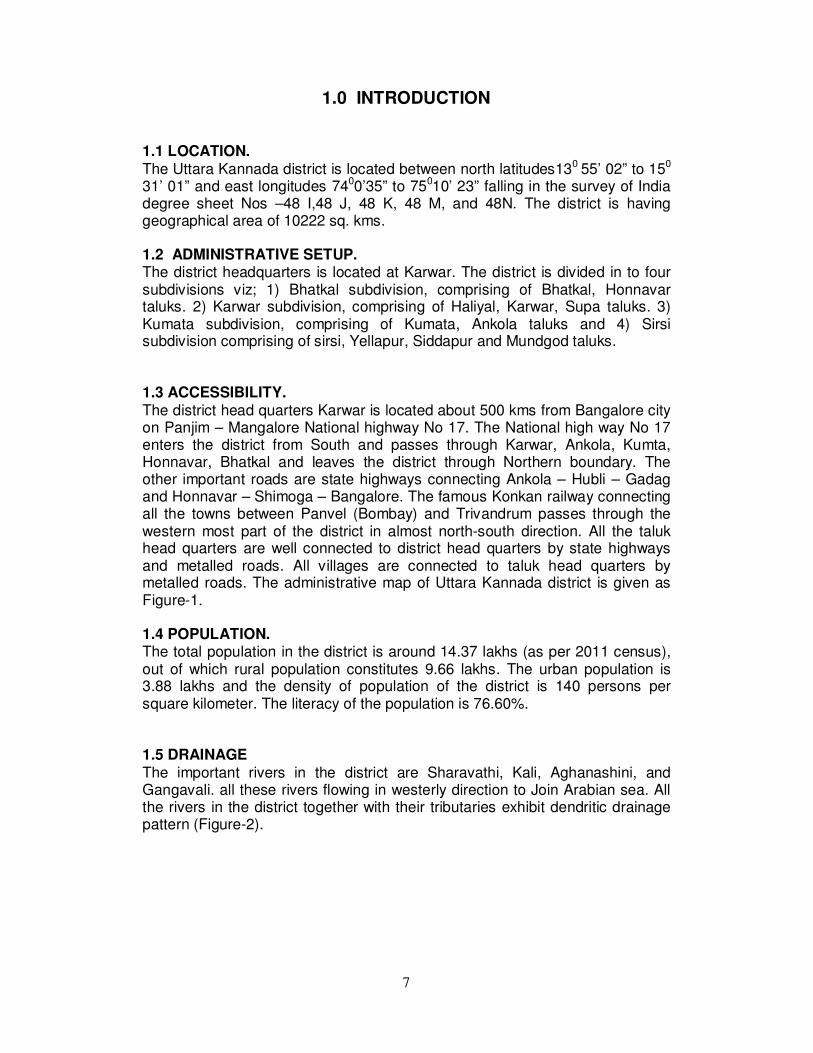
1.0 INTRODUCTION
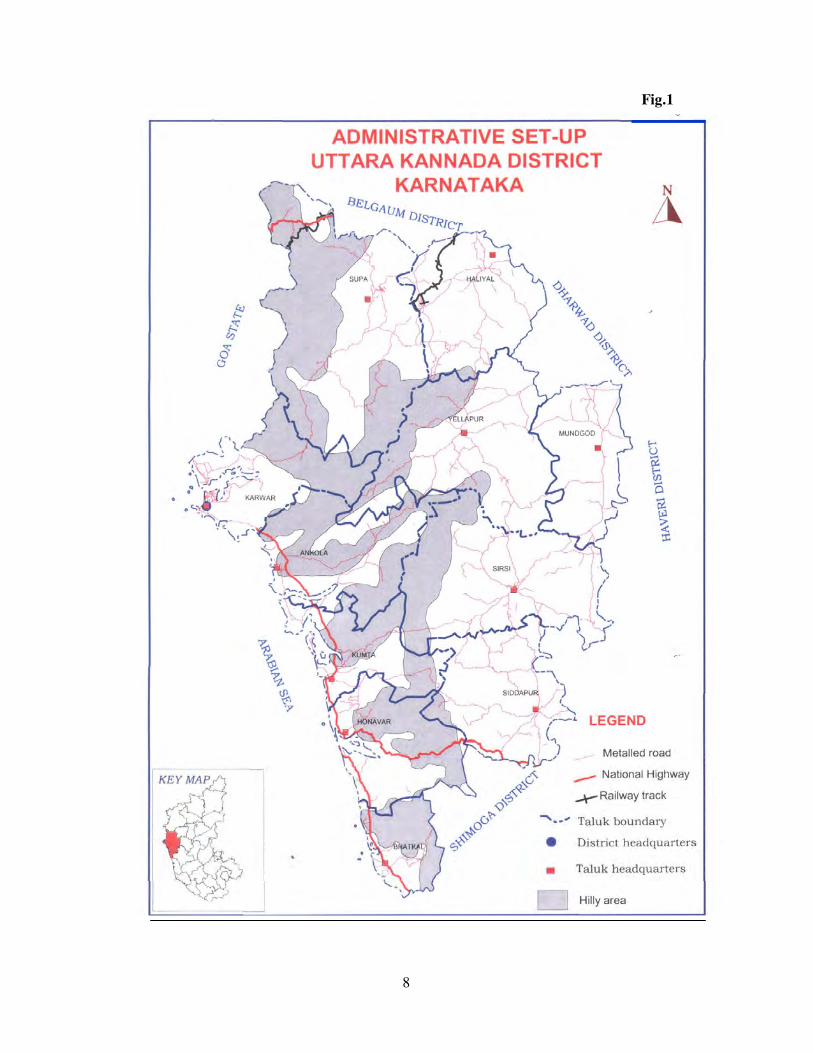
1.1 LOCATION. The Uttara Kannada district is located between north latitudes130 55’ 02” to 150 31’ 01” and east longitudes 7400’35” to 75010’ 23” falling in the survey of India degree sheet Nos –48 I,48 J, 48 K, 48 M, and 48N. The district is having geographical area of 10222 sq. kms. 1.2 ADMINISTRATIVE SETUP. The district headquarters is located at Karwar. The district is divided in to four subdivisions viz; 1) Bhatkal subdivision, comprising of Bhatkal, Honnavar taluks. 2) Karwar subdivision, comprising of Haliyal, Karwar, Supa taluks. 3) Kumata subdivision, comprising of Kumata, Ankola taluks and 4) Sirsi subdivision comprising of sirsi, Yellapur, Siddapur and Mundgod taluks.
1.3 ACCESSIBILITY. The district head quarters Karwar is located about 500 kms from Bangalore city on Panjim – Mangalore National highway No 17. The National high way No 17 enters the district from South and passes through Karwar, Ankola, Kumta, Honnavar, Bhatkal and leaves the district through Northern boundary. The other important roads are state highways connecting Ankola – Hubli – Gadag and Honnavar – Shimoga – Bangalore. The famous Konkan railway connecting all the towns between Panvel (Bombay) and Trivandrum passes through the western most part of the district in almost north-south direction. All the taluk head quarters are well connected to district head quarters by state highways and metalled roads. All villages are connected to taluk head quarters by metalled roads. The administrative map of Uttara Kannada district is given as Figure-1.
1.4 POPULATION. The total population in the district is around 14.37 lakhs (as per 2011 census), out of which rural population constitutes 9.66 lakhs. The urban population is 3.88 lakhs and the density of population of the district is 140 persons per square kilometer. The literacy of the population is 76.60%.
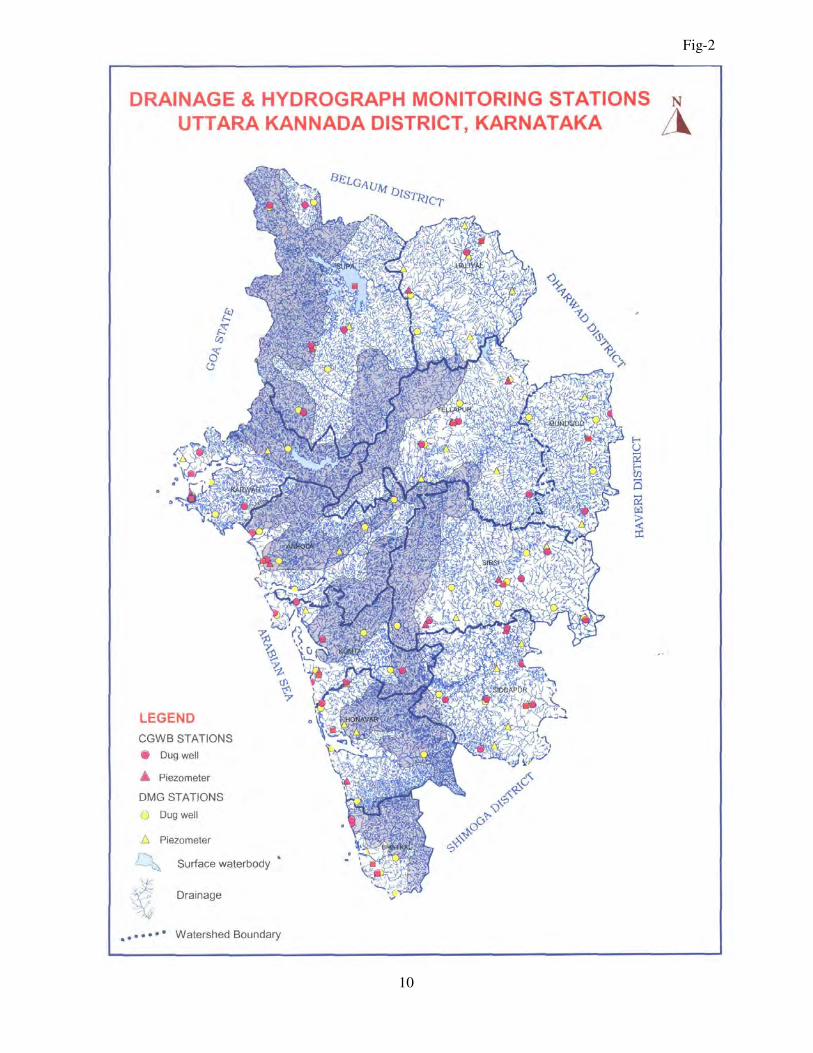
1.5 DRAINAGE The important rivers in the district are Sharavathi, Kali, Aghanashini, and Gangavali. all these rivers flowing in westerly direction to Join Arabian sea. All the rivers in the district together with their tributaries exhibit dendritic drainage pattern (Figure-2).
8
Fig.1

9
1.6 LAND USE AND CROPPING PATTERN. The district has 813695 ha. forest which constitutes 79 % of the total geographical area of the district. The land not available for cultivation is 50600 ha which is about 5 % of the total area. The fallow land in the district is around 16951 ha. The other uncultivated lands are 30156 ha. Net area sown during the year 2005-06 was around 113277 ha. out of which, 11473 ha. land was sown more than once.
1.7 CROPS
The main food crops grown in the district are paddy, Maize, pulses groundnut, and spices. Sugarcane, cotton and arecanut are the main commercial crops grown in the district.
1.8 IRRIGATION. Out of 113277 ha of cultivated land during 2005-06, 25437 ha was under irrigation (22% of total cultivated area), out of which 94 ha was irrigated under canals, 4754 ha was irrigated under tanks, 7302 ha was irrigated by dugwells, 2090 ha was irrigated by tube/bore wells. 1.9 INDUSTRIES In the district there are two big, two medium and 7736 small scale industries. The important minerals available in the district are Iron and Manganese ores, Lime shell and moulding sand.
1.12 STUDIES CARRIED OUT BY CGWB
Systematic hydrogeological surveys have been carried out by Shri. P. Nandakumaran, Scientist-B, Central Ground Water Board, SWR, Bangalore covering Halyal, Ankola, Kumta, Bhatkal, Honnavartaluks of Uttara Kannada district during the years 1984-87. Systematic hydrogeological surveys have been carried out by Shri. S.S.Hegde, Asstt. Hydrogeologist, Central Ground Water Board, SWR, Bangalore covering Sirsi and Yellapur taluks of Uttara Kannada district during the years 1986-87. Hydrogeological surveys were carried out by Shri. V.Saivasan, Asstt. Hydrogeologist, covering Siddapura and parts of Bhatkal taluks of Uttara Kannada district during the years 1985-86. Hydrogeological surveys were carried out by Shri.U.Joshi Asstt. Hydrogeologist, covering Mundgod taluk of Uttara Kannada district during the years 1985-86. Hydrogeological surveys were carried out by Shri. V.S.Prakash, Scientist-B, covering Karwar taluk of Uttara Kannada district during the years 1987-88. Hydrogeological surveys were carried out by Shri. K.Keerthiseelan, Scientist-C, covering Supa taluk of Uttara Kannada district during the years 1987-88. Another report was compiled by Shri. K. Keerthiseelan, Scientist-C, on “Hydrogeology and Ground Water Potential in Uttara Kannada district, Karnataka State” during the year 1990-91.
10
Fig-2
11
2.0. RAINFALL AND CLIMATE
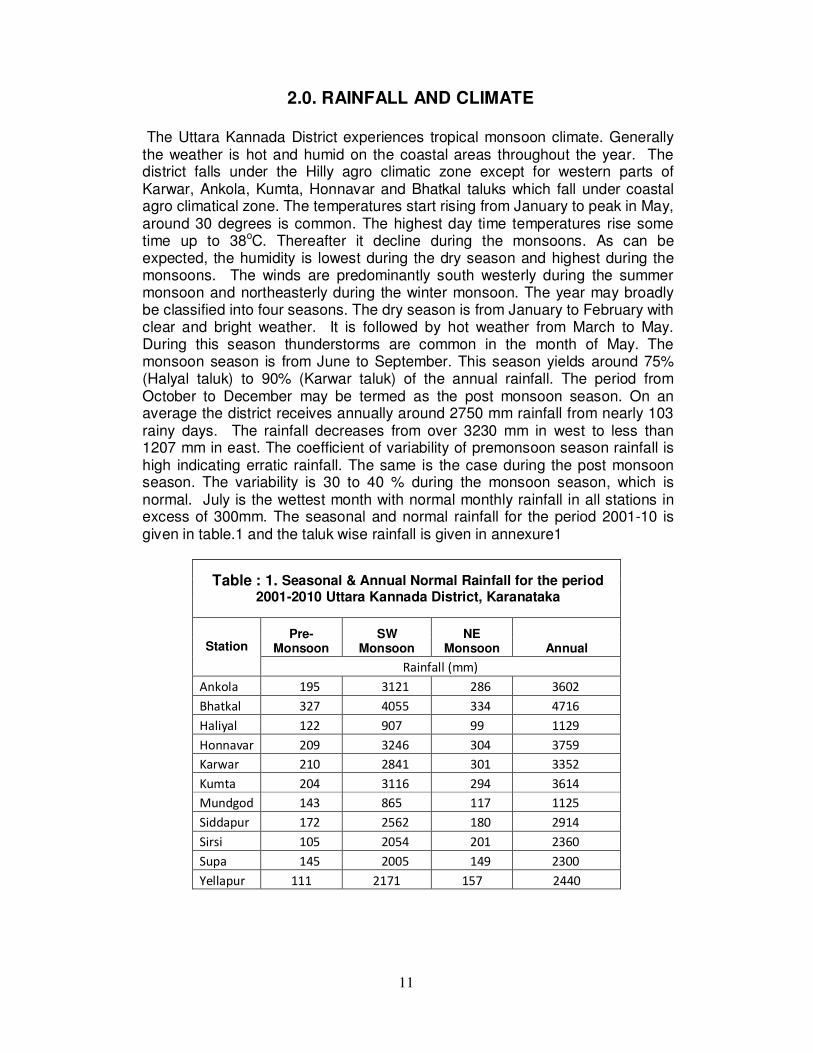
The Uttara Kannada District experiences tropical monsoon climate. Generally the weather is hot and humid on the coastal areas throughout the year. The district falls under the Hilly agro climatic zone except for western parts of Karwar, Ankola, Kumta, Honnavar and Bhatkal taluks which fall under coastal agro climatical zone. The temperatures start rising from January to peak in May, around 30 degrees is common. The highest day time temperatures rise some time up to 38oC. Thereafter it decline during the monsoons. As can be expected, the humidity is lowest during the dry season and highest during the monsoons. The winds are predominantly south westerly during the summer monsoon and northeasterly during the winter monsoon. The year may broadly be classified into four seasons. The dry season is from January to February with clear and bright weather. It is followed by hot weather from March to May. During this season thunderstorms are common in the month of May. The monsoon season is from June to September. This season yields around 75% (Halyal taluk) to 90% (Karwar taluk) of the annual rainfall. The period from October to December may be termed as the post monsoon season. On an average the district receives annually around 2750 mm rainfall from nearly 103 rainy days. The rainfall decreases from over 3230 mm in west to less than 1207 mm in east. The coefficient of variability of premonsoon season rainfall is high indicating erratic rainfall. The same is the case during the post monsoon season. The variability is 30 to 40 % during the monsoon season, which is normal. July is the wettest month with normal monthly rainfall in all stations in excess of 300mm. The seasonal and normal rainfall for the period 2001-10 is given in table.1 and the taluk wise rainfall is given in annexure1
Table : 1. Seasonal & Annual Normal Rainfall for the period 2001-2010 Uttara Kannada District, Karanataka
Pre-Monsoon
SW Monsoon
NE Monsoon Annual Station
Rainfall (mm)
Ankola 195 3121 286 3602
Bhatkal 327 4055 334 4716
Haliyal 122 907 99 1129
Honnavar 209 3246 304 3759
Karwar 210 2841 301 3352
Kumta 204 3116 294 3614
Mundgod 143 865 117 1125
Siddapur 172 2562 180 2914
Sirsi 105 2054 201 2360
Supa 145 2005 149 2300
Yellapur 111 2171 157 2440
12
3.0. GEOMORPHOLOGY AND SOIL TYPES
3.1 PHYSIOGRAPHY. The major part of the district is covered by hilly areas belonging to Sahyadri hill ranges, except for the narrow coastal strip on western side and plain table land areas on eastern most parts of the district occupying parts of Mundgod and Halyal taluks. The land mass of the district is situated between the elevations of 0 to 800 m above msl. The highest peak in the district is Darshangudda locateed 915 m.amsl near the border to Goa state. The District is having coast line of 122 kms. Main surface water resources are harnessed for generating electricity by Kalinadi hydroelectric project and Kadra hydroelectric project. There are no major or medium irrigation projects in the district. There are about 1048 minor irrigation tanks irrigating around 23984 ha.
3.2 SOIL TYPES Along the coast on the western most part of the district the costal alluvial soil is occurring. The most rugged hilly parts of the district are covered by hilly type soil and surrounded by the areas covered by lateritic soil. On eastern parts, the lateritic soils change to red loamy soils. Some area on eastern most parts of Mundgod taluk are covered by semi-black cotton soils.
4.0 GROUND WATER SCENARIO
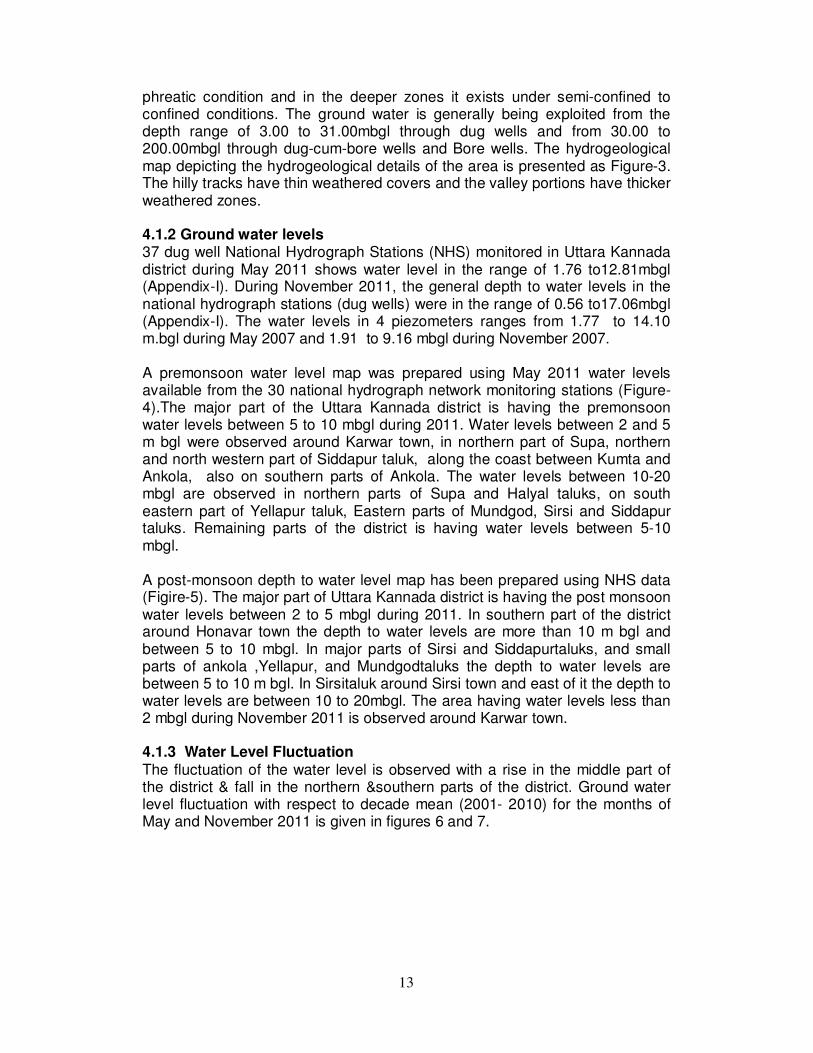
4.1.1 Occurence of Ground Water Uttara Kannada district consists of rock formations of Archaean complex characterised by a system of ridges and a plateau on the west. Laterites occur overlying the schist and granites, and alluvium along the rivers and lagoons of the coast. Main aquifers in the study area are the weathered and fractured zones of metavolcanics, meta-sedimentaries, granites, gneissesand laterites. The alluvial patches are found along the major stream courses. Since, the hard rocks in the area do not posses primary porosity, the secondary structures like joints, fissures and faults present in this formation act as porous media. It generally constitutes about 3% of the volume of formation to facilitate storage of ground water. The phreatic zone generally occurs within the depth range of 3.00 to 30.00 mbgl .The fracture zones occur at various depth zones within the depth of 185.00mbgl. It is found that the water bearing characteristics of schistose rocks are more or less similar to that of gneisses and granites. But the weathered zones of schists may not yield as granites and gneisses because of their compact and fine grained nature. Alluvium occurs along the river banks in a few to 14.00 metres thickness, holds the bank storage and along the sea coast and creeks occurs as narrow strip of sand bed having a depth up to 50m. Ground water in the above aquifer system generally occurs under unconfined, semi-confined and confined conditions. In the shallower zones it exists under
13
phreatic condition and in the deeper zones it exists under semi-confined to confined conditions. The ground water is generally being exploited from the depth range of 3.00 to 31.00mbgl through dug wells and from 30.00 to 200.00mbgl through dug-cum-bore wells and Bore wells. The hydrogeological map depicting the hydrogeological details of the area is presented as Figure-3. The hilly tracks have thin weathered covers and the valley portions have thicker weathered zones.
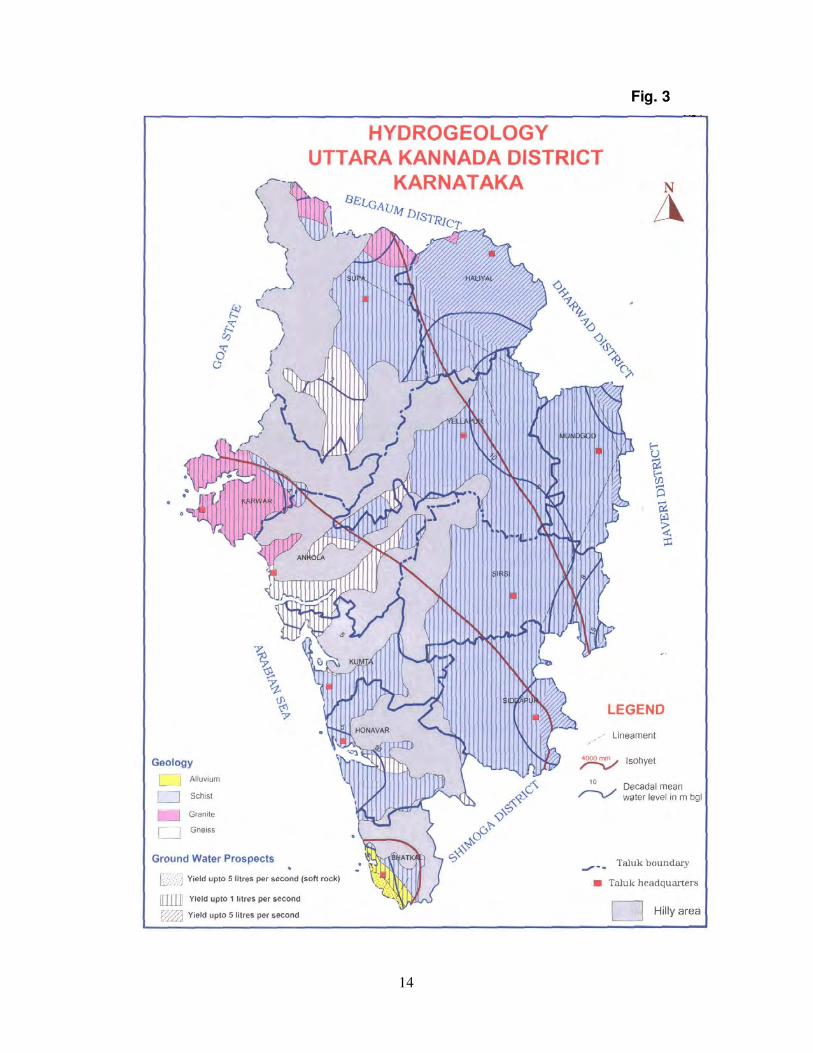
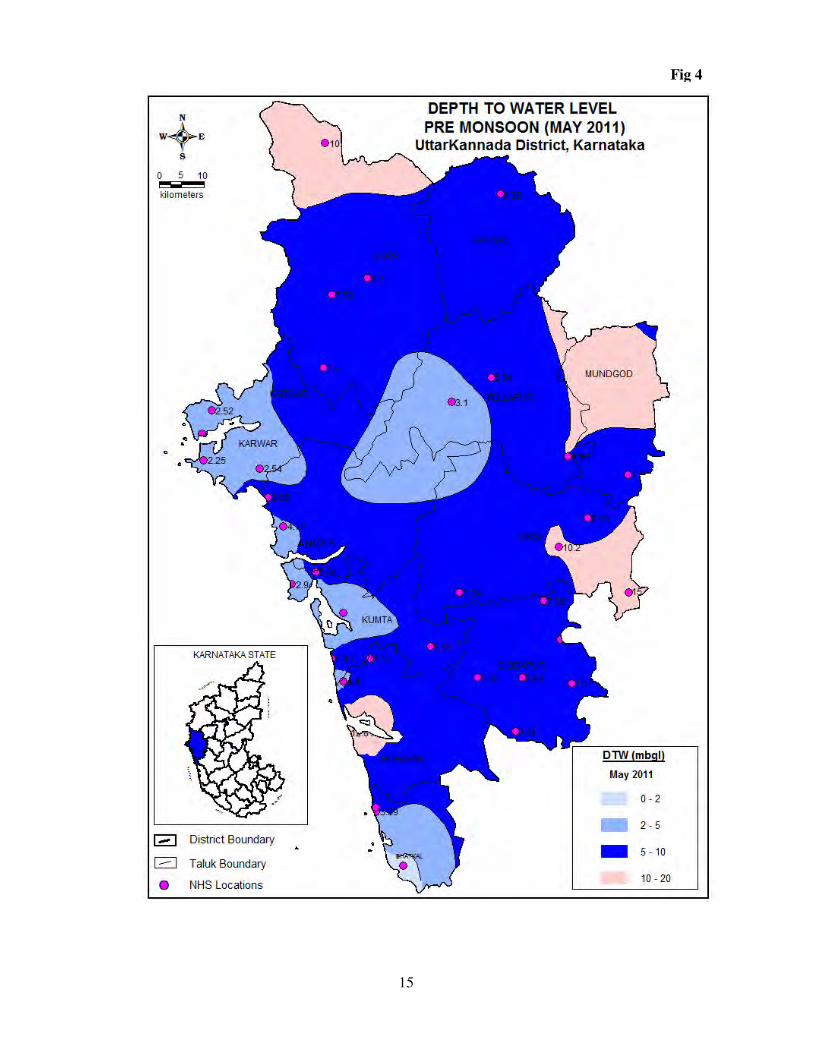
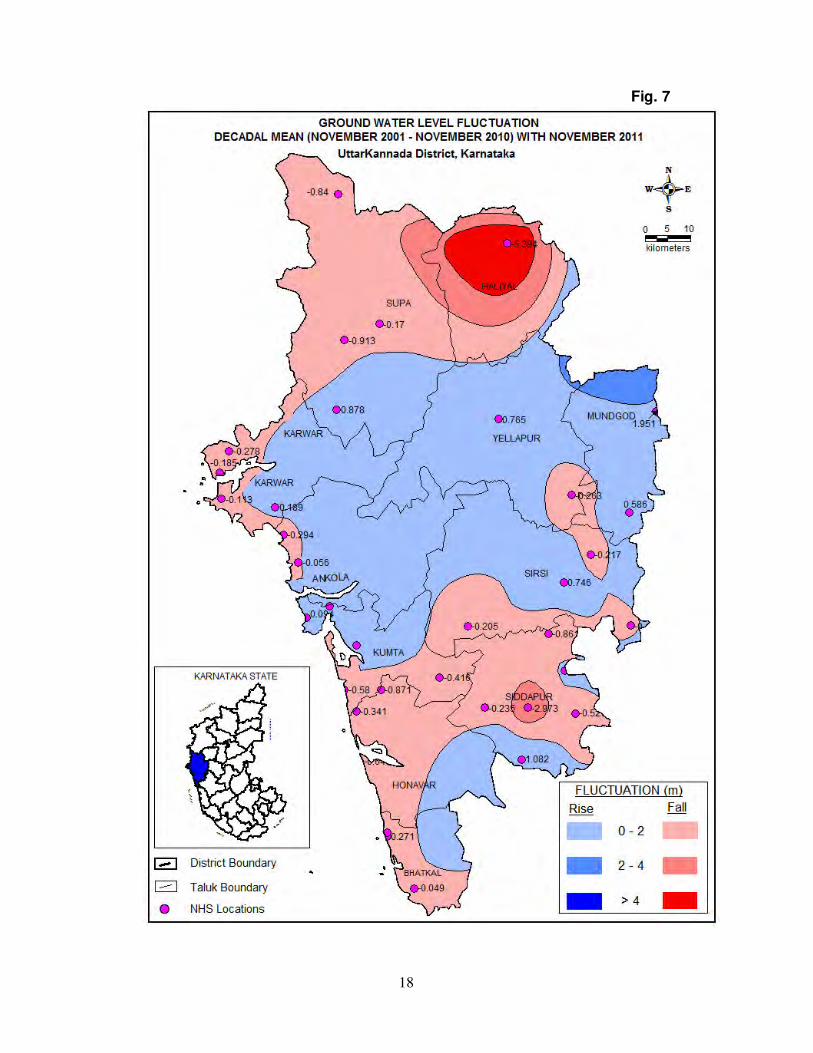
4.1.2 Ground water levels 37 dug well National Hydrograph Stations (NHS) monitored in Uttara Kannada district during May 2011 shows water level in the range of 1.76 to12.81mbgl (Appendix-I). During November 2011, the general depth to water levels in the national hydrograph stations (dug wells) were in the range of 0.56 to17.06mbgl (Appendix-I). The water levels in 4 piezometers ranges from 1.77 to 14.10 m.bgl during May 2007 and 1.91 to 9.16 mbgl during November 2007. A premonsoon water level map was prepared using May 2011 water levels available from the 30 national hydrograph network monitoring stations (Figure-4).The major part of the Uttara Kannada district is having the premonsoon water levels between 5 to 10 mbgl during 2011. Water levels between 2 and 5 m bgl were observed around Karwar town, in northern part of Supa, northern and north western part of Siddapur taluk, along the coast between Kumta and Ankola, also on southern parts of Ankola. The water levels between 10-20 mbgl are observed in northern parts of Supa and Halyal taluks, on south eastern part of Yellapur taluk, Eastern parts of Mundgod, Sirsi and Siddapur taluks. Remaining parts of the district is having water levels between 5-10 mbgl. A post-monsoon depth to water level map has been prepared using NHS data (Figire-5). The major part of Uttara Kannada district is having the post monsoon water levels between 2 to 5 mbgl during 2011. In southern part of the district around Honavar town the depth to water levels are more than 10 m bgl and between 5 to 10 mbgl. In major parts of Sirsi and Siddapurtaluks, and small parts of ankola ,Yellapur, and Mundgodtaluks the depth to water levels are between 5 to 10 m bgl. In Sirsitaluk around Sirsi town and east of it the depth to water levels are between 10 to 20mbgl. The area having water levels less than 2 mbgl during November 2011 is observed around Karwar town. 4.1.3 Water Level Fluctuation The fluctuation of the water level is observed with a rise in the middle part of the district & fall in the northern &southern parts of the district. Ground water level fluctuation with respect to decade mean (2001- 2010) for the months of May and November 2011 is given in figures 6 and 7.
14
Fig. 3
15
Fig 4

16
Fig. 5
17
Fig. 6
18
Fig. 7
19
4.1.4 Ground Water Level Trends. Though the ground water recharge in the area is a regular natural phenomenon, the groundwater recharge varies in proportion to the developmental activities. The premonsoon water levels for the last 10 years shows rising trends in 25% of the national hydrograph network stations and declining trends between 0.001 and 1.113 m/yrs. The postmonsoon water levels for the last 10 years shows rising trends in 81% of the national hydrograph network stations in the district. The declining postmonsoon water level trends range between 0.025 and 0.166 m/yrs. The premonsoon water levels in network piezometers (bore wells) for the last 10 years shows declining trends in 82 % of the stations and the postmonsoon water levels for the last 10 years shows declining trends in 45 % of the piezometers in the district. The premonsoon declining water level trends in these piezometers range between 0.005 and 0.80 m/year. The post monsoon declining water level trends in these piezometers range between 0.015 and 0.147 m/year. 4.1.5 RESULTS OF GROUND WATER EXPLORATION The study of aquifer geometry and Parameters have been attempted by Central Ground Water Board, South western Region, Bangalore, under its ground water exploration programme through drilling exploratory bore wells at selected places as depicted in Figure-8. The ground water exploration in the district was carried out in two phases. During the first phase in 1988-89, 5 exploratory wells and four observation wells were constructed in coastal alluvium of Honnavar and Karwar taluks (Appendix-VIA). The depth of the wells ranged between 16-47 m. wells constructed in the range of 15-16m depth. The discharge recorded were in the range of 1.88 to 225 lpm for a drawdown of 1.6 to 10.39 m. Aquifer material encountered was fine to medium sand with altternative layers of silt and clay. During the second phase of exploration which started during 2003-04 and continuing till date 33 wells were drilled with depth range of 89 to 200 m in hard rock areas of Ankola, Haliyal, Honnavar, Karwar, Kumta, Mundgod, Siddapur, Sirsi, Supa, and Yellapur taluks. The aquifers tested reveal an effective porosity of about 1-3% in these rocks(Appendix-VIB). The yield cum recuperation tests conducted on these wells show that the discharge of the wells ranges from negligible to 8.5 lps. The salient features of exploratory bore wells drilled and the aquifer tested are presented as appendix-I. The transmissivity of aquifer material in general range from 2.09 to 24.41 m2/day.

20
Fig. 8
21
5.0 GROUND WATER RESOURCES
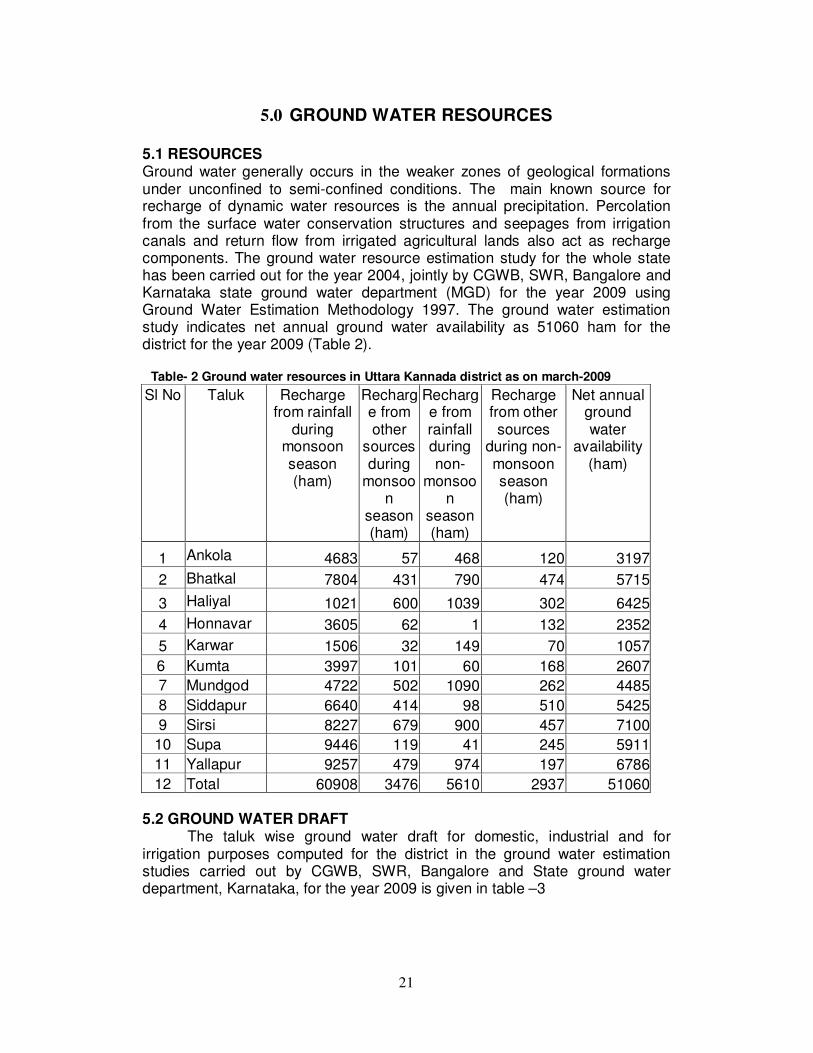
5.1 RESOURCES Ground water generally occurs in the weaker zones of geological formations under unconfined to semi-confined conditions. The main known source for recharge of dynamic water resources is the annual precipitation. Percolation from the surface water conservation structures and seepages from irrigation canals and return flow from irrigated agricultural lands also act as recharge components. The ground water resource estimation study for the whole state has been carried out for the year 2004, jointly by CGWB, SWR, Bangalore and Karnataka state ground water department (MGD) for the year 2009 using Ground Water Estimation Methodology 1997. The ground water estimation study indicates net annual ground water availability as 51060 ham for the district for the year 2009 (Table 2).
Table- 2 Ground water resources in Uttara Kannada district as on march-2009
Sl No Taluk Recharge from rainfall
during monsoon season (ham)
Recharge from other
sources during
monsoon
season (ham)
Recharge from rainfall during non-
monsoon
season (ham)
Recharge from other sources
during non-monsoon season (ham)
Net annual ground water
availability (ham)
1 Ankola 4683 57 468 120 3197
2 Bhatkal 7804 431 790 474 5715
3 Haliyal 1021 600 1039 302 6425
4 Honnavar 3605 62 1 132 2352
5 Karwar 1506 32 149 70 1057
6 Kumta 3997 101 60 168 2607
7 Mundgod 4722 502 1090 262 4485
8 Siddapur 6640 414 98 510 5425
9 Sirsi 8227 679 900 457 7100
10 Supa 9446 119 41 245 5911
11 Yallapur 9257 479 974 197 6786
12 Total 60908 3476 5610 2937 51060 5.2 GROUND WATER DRAFT
The taluk wise ground water draft for domestic, industrial and for irrigation purposes computed for the district in the ground water estimation studies carried out by CGWB, SWR, Bangalore and State ground water department, Karnataka, for the year 2009 is given in table –3

22
Table-3 Ground water draft for various purposes during the year 2008-09
Sl No
Taluk
Ground water draft for drinking and industries
(ham)
Irrigation Bore well &
Dug well draft (ham)
Existing gross ground water
draft for all uses (ham)
Name of taluk Monsoon (days 153)
NonMonsoon (212 days) Non-monsoon
& Monsoon For year (2008-09)
1 Ankola 213 672 885
2 Bhatkal 629 1804 2433
3 Haliyal 151 1698 1849
4 Honnavar 187 744 931
5 Karwar 123 391 514
6 Kumta 229 866 1095
7 Mundgod 178 1252 1430
8 Siddapur 374 3123 3497
9 Sirsi 379 2670 3049
10 Supa 141 1354 1496
11 Yallapur 219 953 1172
12 Total 2823 15527 18351
The perusal of the preceding table show the annual draft for domestic and industrial uses as 2823 ham and for irrigation purposes the draft computed was 15527 ham. Total draft during the year 2009 was 18351 ham. The maximum draft was observed in Siddapur taluk with 3497 ham and minimum annual draft of 514 ham was observed in Karwar taluk.
5.3 STAGE OF GROUND WATER DEVELOPMENT
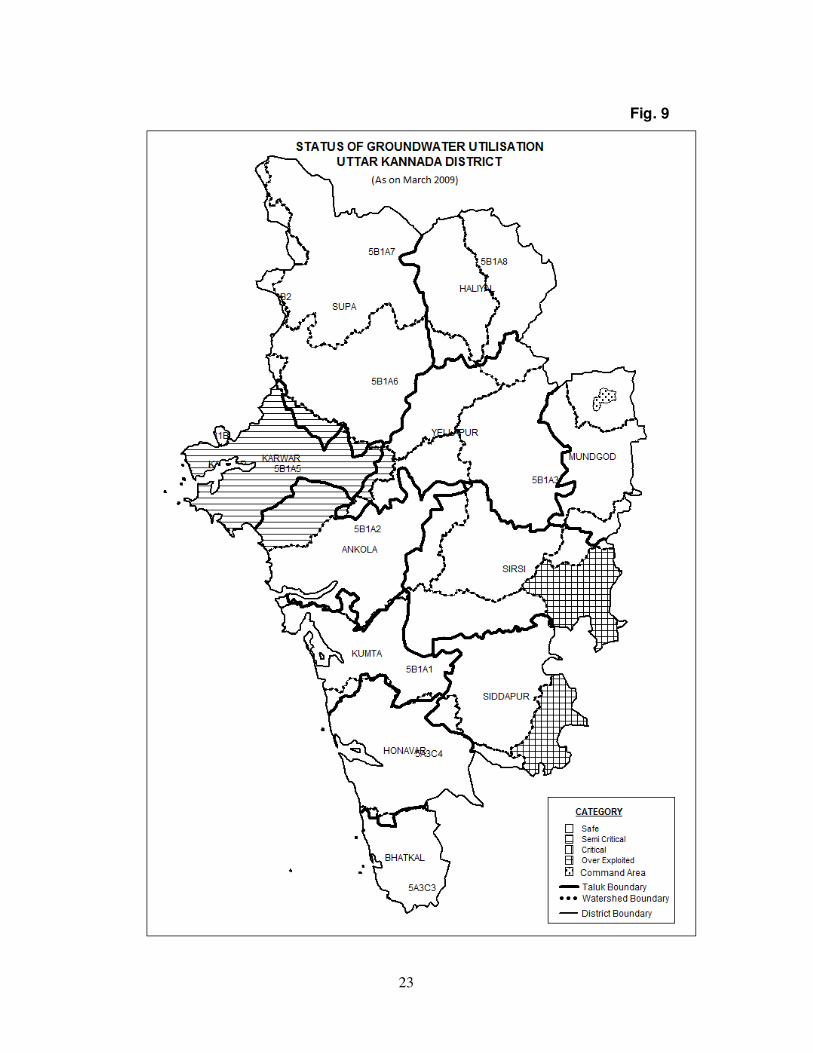
The taluk wise stage of ground water development details computed for the district in the ground water estimation studies carried out by CGWB, SWR, Bangalore and State ground water department, Karnataka, for the year 2009 is given in table 4, and map showing watershed wise stage of ground water development is presented as Figure-9.
Table-4 Taluk wise stage of ground water development studies in Uttara Kannada district for year 2009
Categorisation as on March 2004(%) Taluk Allocation for domestic and industrial use for next 25 years in (ham)
Net ground water availability for future irrigation development (ham)
Stage of development in %
Safe Semicritical Critical O.E area
Ankola 253 2272 28 100 - - - Bhatkal 777 3133 43 100 - - - Haliyal 181 4546 29 100 - - - Honnavar 223 1386 40 100 - - - Karwar 148 518 49 100 - - - Kumta 272 1468 42 100 - - - Mundgod 214 3019 32 100 - - - Siddapur 425 1909 64 60 - - 40 Sirsi 439 4011 43 70 - - 30 Supa 171 4386 25 100 - - - Yallapur 260 5574 17 100 - - -
Total 3363 32222 37.5 - - -
23
Fig. 9
24
A perusal of preceding table shows that the district is falling mainly in safe category except for part of two taluks. The stage of ground water development is highest in siddapur taluk with 64% development and lowest development is in Yellapur taluk with 17 %. The ground water development for the whole district as a whole is 37.5%. 4.3 Unit Area Annual Ground Water Recharge Sustainability of ground water resource depends mainly on two factors viz. Annual ground water recharge and annual ground water draft. The annual ground water recharge depends on the quantity and intensity of rain fall, the infiltration characteristics of the soil, the depth to ground water level, the slope of the area and the geomorphology. The ground water recharge is assessed separately for the monsoon and non monsoon period due to rainfall as well as due to other sources. The annual ground water recharge includes all the above. The recharge from other sources includes return seepage from irrigated area, seepage from canals, seepage from water bodies, seepage from influent rivers etc. The recharge can be expressed in metres. In the state of Karnataka, the unit area recharge is grouped into four categories viz. 0.025-0.10m, 0.10-0.15m, 0.15-0.25m and 0.25-0.50m. In Uttara Kannada district the unit area annual recharge is in the range of 0.025-0.10m in all the taluks and is shown in figure. 10.
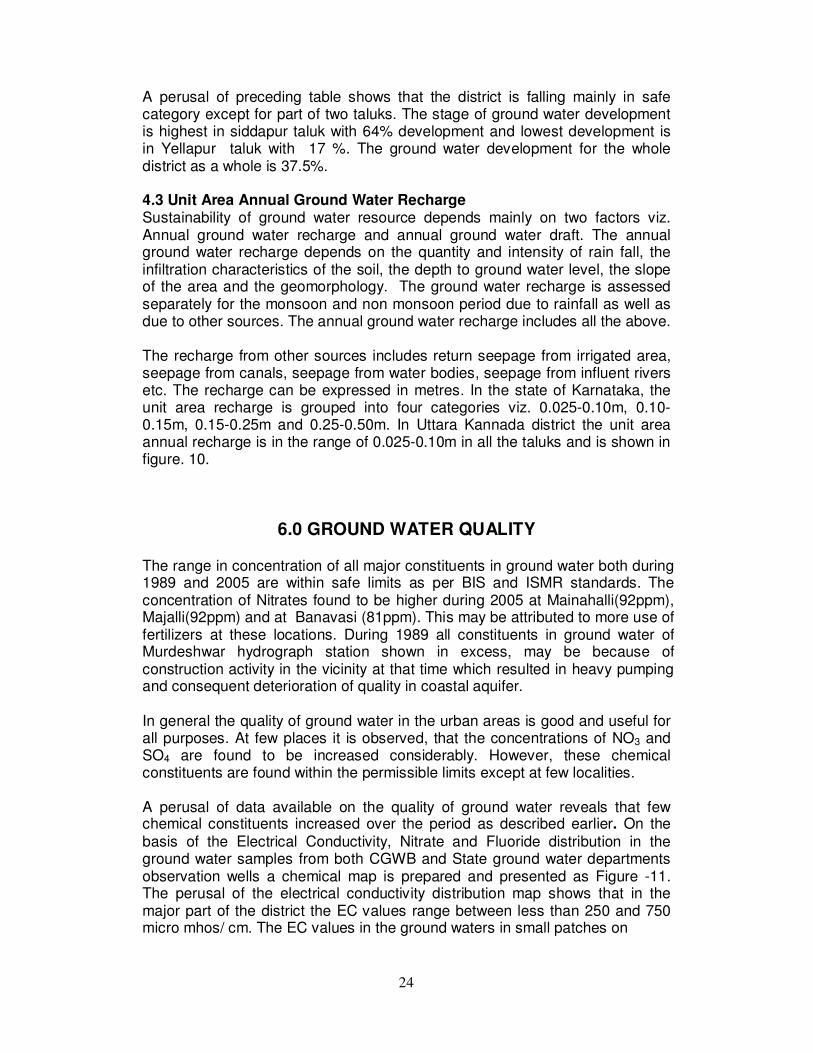
6.0 GROUND WATER QUALITY
The range in concentration of all major constituents in ground water both during 1989 and 2005 are within safe limits as per BIS and ISMR standards. The concentration of Nitrates found to be higher during 2005 at Mainahalli(92ppm), Majalli(92ppm) and at Banavasi (81ppm). This may be attributed to more use of fertilizers at these locations. During 1989 all constituents in ground water of Murdeshwar hydrograph station shown in excess, may be because of construction activity in the vicinity at that time which resulted in heavy pumping and consequent deterioration of quality in coastal aquifer. In general the quality of ground water in the urban areas is good and useful for all purposes. At few places it is observed, that the concentrations of NO3 and SO4 are found to be increased considerably. However, these chemical constituents are found within the permissible limits except at few localities. A perusal of data available on the quality of ground water reveals that few chemical constituents increased over the period as described earlier. On the basis of the Electrical Conductivity, Nitrate and Fluoride distribution in the ground water samples from both CGWB and State ground water departments observation wells a chemical map is prepared and presented as Figure -11. The perusal of the electrical conductivity distribution map shows that in the major part of the district the EC values range between less than 250 and 750 micro mhos/ cm. The EC values in the ground waters in small patches on

25
Fig.10

26
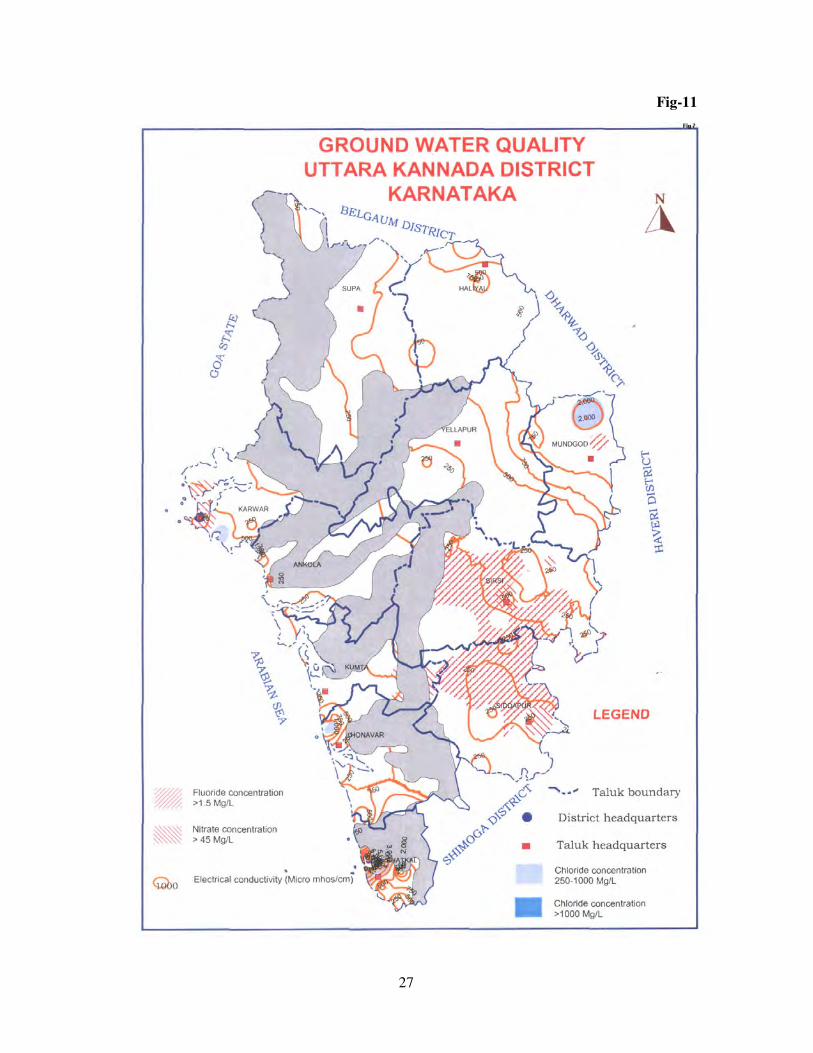
northern parts of Honavar town, around Bhatkal town and north of Mundgod town shows higher values of electrical conductivity. Even though none of the national hydrograph stations have shown excess fluoride (>1.5), the data collected from state departments show major parts of Sirsi and Siddapur taluks and small part of Mundgod taluk having fluoride above the safe limit of 1.5 mg/l. Small patches in Karwar, Sirsi, Siddapur and mundgod taluk are showing higher concentration of Nitrate in the ground water. The chemical data indicates the ground water is suitable for both drinking and irrigation in most part of the district. The vulnerable areas for groundwater contamination are presented in figure 12.
7.0 STATUS OF GROUND WATER DEVELOPMENT
7.1 DRINKING WATER SUPPLY FROM GROUND WATER : As on march 2006 in uttara Kannada district as many as 6607 boreholes were drilled for drinking water purpose, out of which 684 borewells are being used for piped water supply and another 786 borewells/dug wells are used for mini water supply. Taluk wise data of number of bore wells drilled, No of piped water supply scheme and number of mini water scheme is given in table No- 5
Table-5 Talukwise status of water supply. Sl No Taluk No of
borewells drilled
piped water supply schemes
Miniwater schemes
1 Ankola 543 45 46
2 Bhatkal 464 19 53
3 Haliyal 625 71 116
4 Honnavar 677 60 88
5 Karwar 473 27 47
6 Kumta 695 73 86
7 Mundgod 637 62 76
8 Siddapur 578 48 60
9 Sirsi 869 94 86
10 Supa 415 165 47
11 Yellapur 626 25 81
12 Total 6607 689 786
27
Fig-11
28
Fig. 12
29
7.2 IRRIGATION SCENARIO FROM GROUND WATER RESOURCES: In UttaraKannada district during 05-06 net area under irrigation from ground water resources was 9342 ha constituting 36.92 % of area irrigated from all sources. Of which 7302 hactares was under irrigation from dugwells (77.75%) and 2090 ha was under irrigation fromborewells (22.25%). Taluk wise net area irrigated from dugwell and borewell is already given in table-4. The perusal of the table shows Kumtataluk is having maximum of 1699 ha followed by Sirsi with 1560 ha and honnavar 1442 ha irrigated by dugwells. Mundgodtaluk has maximum of 964 ha followed by Halyaltaluk with 638 ha under borewell irrigation.
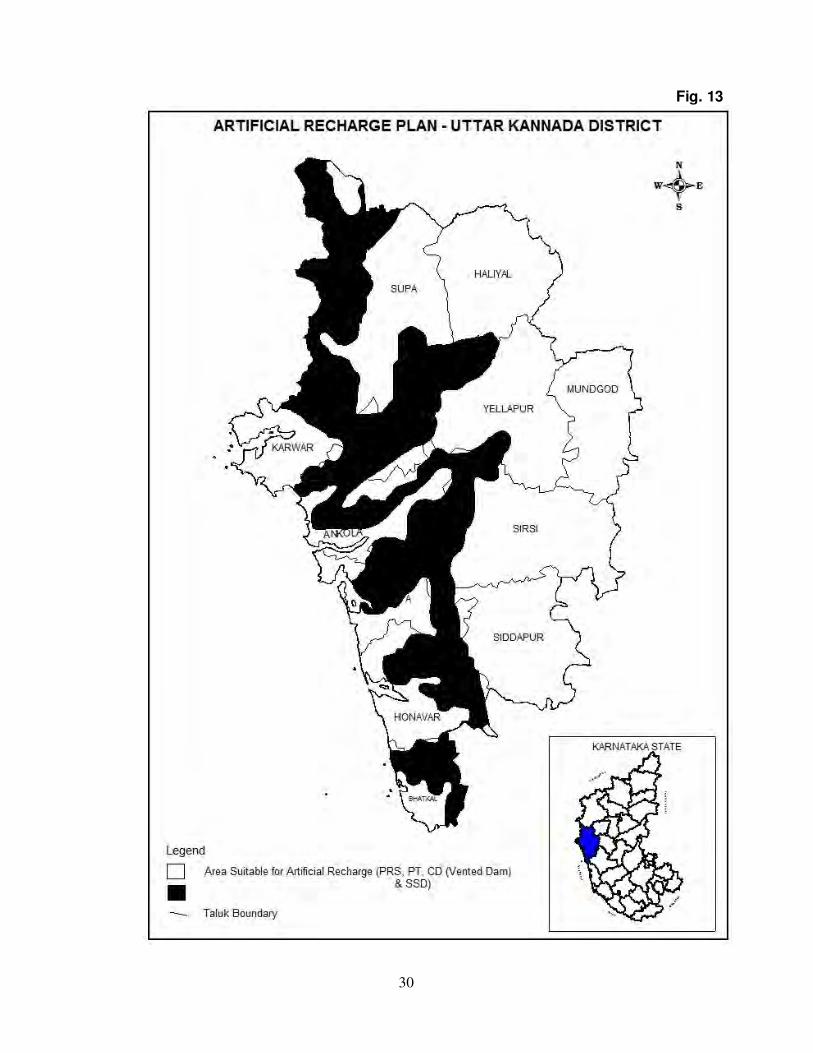
8.0 GROUND WATER MANAGEMENT STRATEGY Even though the district receives good rainfall, because of undulating topography and very permeable formation at the surface most of the rainwater escapes either as surface flow or base flow and in many parts of the district after march there is accute shortage of water even for drinking. So the water supply sources should be supported by suitable artificial recharge structures or ground water conservation structures in the vicinity to augment the present water supply. The areas suitable for artificial recharge and suitable structures are given in figure 13. The present ground water development is of low key and still plenty of scope is there for further development. Still dugwells are the more common abstraction structures for ground water irrigation. But in recent times bore wells are becoming more popular. But for irrigation as far as possible dug wells only should be suggested against bore wells because dugwells along with suitable artificial structures in the vicinity are more effective and chances of borewell failure are more. The dug wells as they are depending only on phreatic aquifers the cropping pattern will be as per the availability from the phreatic aquifer but borewells as they draw water from phreatic as well as deep seated aquifers the cropping pattern will not respond to the changes in shallow aquifers and in long run it may lead to over development of ground water.
The selection of sites for construction of artificial structures and ground water abstraction structures is site specific so after detailed hydrogeological investigation only sites may be selected.
30
Fig. 13
31
9.0. GROUND WATER PROBLEMS AND SPECIAL STUDIES
There are both quantity and quality related ground water problems exist in the district. Except Halyal and Mundgod taluks whole district receives high rainfall. The highly undulating topography and highly permeable shallow aquifers allow the ground water recharged during monsoon to escape as baseflow. Because of this most part of the district suffers scarcity of water during summer. Construction of gully plugs, contour bunds and contour trenches at higher reaches and percolation tanks, nalla bunds, check dams and vented dams at comparatively lower reaches along with subsurface dams will facilitate more recharge to ground water and less base flow. In urban and semi-urban areas rooftop rainwater harvesting coupled with point recharge structures will help in more recharge to the ground water as well as reduce load on surface water supply systems. But the depth to water in these areas must be more than 5 mbgl. The quality problems related to ground water are in the coastal aquifers where chances of sea ingress are there. High salinity is observed the areas around Bhatkal in coastal alluvium. So it is necessary to have more observation stations on the coastal line to keep a watch on the changes in ground water quality. In Dandeli and Supa areas mining and other industries are producing toxic wastes and untreated effluents, which may cause deterioration in chemical quality which will be very difficult to reverse. So a constant check on ground water quality in these areas is required. Fluoride contamination is reported from large areas in siddapur and sirsi taluks. So it is necessary to demarcate the affected areas and to develop the shallow aquifers in these affected areas.
10.0 RECOMMENDATIONS. Considering the prevailing scenario of the groundwater resources and development the following recommendations are made for the optimum drawl with sustainable development of resources in the area.
1) The dug wells, which penetrate partially the weathered, fractured zones of the aquifers, may be deepened further for better productivity.
2) Construction of check dams and sub surface dykes at appropriate places across nallahs and streams located in the water table depleting areas, and the areas where water quality problem exists may be taken on priority basis.
3) Sinking of the filter points and collector wells with the maximum depth of –4-6 m in the alluvial stretches of river banks and in coastal alluviums would be ideal ground water abstraction structures.
4) In the hard rock terrain, in the areas with shallow water table sinking of suitable dug well and dug-cum-bore well with a maximum depth of 8 and 30 m recommended respectively for the structures. As the whole district comes under safe category there is still scope for further ground water development. But all the ground water resources development should be incorporated with ground water conservation measures.
5) Even though the district receives good rainfall, considering the water scarcity in some pockets during peak summer, a comprehensive programme should be formulated to harvest the rain water through roof

32
top, check dams, surface tanks, and bunds to enhance the recharge to the ground water and also the subsurface dykes to arrest the sub surface flows and augment the groundwater resources.
6) The ground water worthy areas such as topographic lows, valley portions low fluctuations zones should be developed with an adequate soil conservation measures to prevent the soil erosions during rainy seasons.
7) Constant monitoring of ground water quality should be carried out in the fluoride contaminated areas and industrial and mining belts to prevent further deterioration and related problems. The determination of trace elements and organic compounds is to be done to help in categorizing the quality of water.
8) A detailed geophysical studies with the help of the state of the art technology should be conducted to demarcate the extent of potential aquifers and it’s geometry, especially in coastal areas to know the relationship between sea water and ground water.
9) As the shallow aquifer is free from fluoride, compared to deeper aquifer this has to be preserved by watershed approach. Desilting and maintaining of these tanks are utmost importance. So the natural recharge will take place without any hindrance and this will recharge the shallow aquifer mainly, which can be used for drinking use, which is free from fluoride in major part of the area.
10) The farming community in the valley and low lying regions should be encouraged with financial assistance and necessary technical guidance to sink appropriate abstraction structures, to install pump sets, to practice modern irrigation methods thereby to strengthen their economy. It is also recommended to bring an estimated 64161ha of land to irrigate through balance of ground water resources. For irrigation as far as possible dug wells may be preferred over bore wells to avoid failure of both dug and bore wells due to heavy abstraction from bore wells.
11) Conjunctive use of both Surface and Ground water may be practiced in the canal command area to improve the quality of ground water and to prevent the water logging conditions and to make available the canal water to the tail end areas.
33
Annexure 1
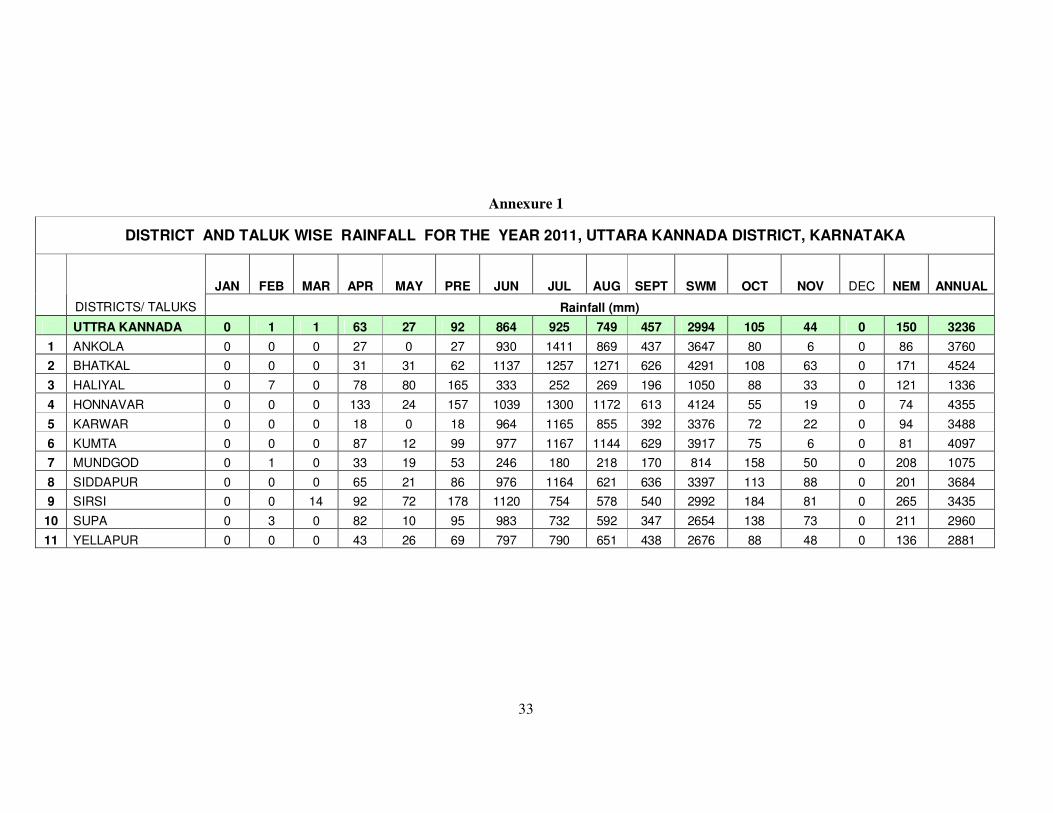
DISTRICT AND TALUK WISE RAINFALL FOR THE YEAR 2011, UTTARA KANNADA DISTRICT, KARNATAKA
JAN FEB MAR APR MAY PRE JUN JUL AUG SEPT SWM OCT NOV DEC NEM ANNUAL
DISTRICTS/ TALUKS Rainfall (mm)
UTTRA KANNADA 0 1 1 63 27 92 864 925 749 457 2994 105 44 0 150 3236
1 ANKOLA 0 0 0 27 0 27 930 1411 869 437 3647 80 6 0 86 3760
2 BHATKAL 0 0 0 31 31 62 1137 1257 1271 626 4291 108 63 0 171 4524
3 HALIYAL 0 7 0 78 80 165 333 252 269 196 1050 88 33 0 121 1336
4 HONNAVAR 0 0 0 133 24 157 1039 1300 1172 613 4124 55 19 0 74 4355
5 KARWAR 0 0 0 18 0 18 964 1165 855 392 3376 72 22 0 94 3488
6 KUMTA 0 0 0 87 12 99 977 1167 1144 629 3917 75 6 0 81 4097
7 MUNDGOD 0 1 0 33 19 53 246 180 218 170 814 158 50 0 208 1075
8 SIDDAPUR 0 0 0 65 21 86 976 1164 621 636 3397 113 88 0 201 3684
9 SIRSI 0 0 14 92 72 178 1120 754 578 540 2992 184 81 0 265 3435
10 SUPA 0 3 0 82 10 95 983 732 592 347 2654 138 73 0 211 2960
11 YELLAPUR 0 0 0 43 26 69 797 790 651 438 2676 88 48 0 136 2881

34