optimal design of hydroelectric projects in uttara kannada...
TRANSCRIPT
Hydrological Sciences-Journal-des Sciences Hydrologiques, 45(2) April 2000 299
Optimal design of hydroelectric projects in UttaraKannada, India
T. v. RAMACHANDRA, D. K. SUBRAMANIAN & N. V. JOSHICentre for Ecological Sciences, Indian Institute of Science, Bangalore 560 012, India
Abstract The planning of water resources depends on the type and size of projects,the ecological factors involved, etc. Emphasis is placed on presenting an overview ofwater resources through meteorological, hydrological, ecological and economic data.Economic data include all costs and benefits, specifically those hitherto underestimated, environmental social costs and benefits. This study was carried out on theBedthi and Aghnashini rivers in the Uttara Kannada district of the Western Ghatsregion, Karnataka State, India. It is estimated that 720 and 510 million kWh ofelectricity can be generated in Bedthi and Aghnashini River basins, respectively, if allthe streams are harnessed. Focusing on land submergence impact, a model is proposedto minimize submergence and maximize net energy in a region with seasonal powergeneration, reservoir storage capacity (to meet the region's demand during all seasons)and installed generation capacity as the decision variables. Net energy analysesincorporating biomass energy lost in submergence show that maximization in netenergy at a site is possible if the hydroelectric generation capacity is adjustedaccording to the seasonal variations in the river's water discharge. A Decision SupportSystem (DSS) used for optimal design of hydroelectric projects in Uttara Kannadadistrict is discussed.
Un systeme d'aide it la decision pour la conception optimale deprojets hydroelectriques en Uttara KannadaResume La planification des ressources en eau depend de la nature et de la taille desprojets, du cadre ecologique, etc. Nous avons surtout voulu presenter ici un panoramaconcernant les ressources en eau a travers des donnees mete orologiques, hydro-logiques, ecologiques et economiques. Les donnees economiques incluent tous lescouts etbenefices, enparticulier ceux qui ontjusqu'ici ete negliges, de meme que lescouts et benefices environnementaux et sociaux. Cette etude a ete entreprise sur lesrivieres Bedthi et Aghnashini du district Uttara Kannada de la region Ghatsoccidentaux (Etat de Karnataka, Inde). On estime a respectivement 720 et 510millions de kWh les quantites d'electricite pouvant etre produites par les rivieresBedthi et Aghnashini si el1es etaient totalement amenagees. En nous interessantparticulierement a la submersion des terres, nous proposons un modele minimis ant lessubmersions et maximisant la production energetique, les variables de decision etantla production saisonniere d'energie, la capacite de stockage des reservoirs (devantsatisfaire la demande en eau quelle que soit la saison) et la puissance installee. Unbilan energetique incluant les pertes de production de biomasse resultant dessubmersions montre que la maximisation de l'energie nette produite est possible si lapuissance installee est adaptee au regime des debits. On examinera enfin un systemed'aide a la decision utilise pour la conception optimale des projets hydroelectriques del'Uttara Kannada.
INTRODUCTION
Kamataka state has the unique distinction of having set up the first hydropower plantin India at Shivanasamudram in 1942. Since then, hydroelectric plants have con-tributed significantly to both the State's and national demand for electricity. Most ofKamataka's hydroelectric plants are located in Uttara Kannada district. Construction of
Openfor discussion until 1 October 2000
300 T V. Ramachandra et at.
large reservoirs is restricted due to environmental constraints, necessitating thedevelopment of ecologically sound alternatives.
Hydroelectric power development-present status and approaches in design
At present hydroelectric power development is undertaken on an ad hoc, project-by-project basis with capacity based on 90% availability of water annually, estimated onthe basis of a 10-day period. Since seasonal and yearly fluctuations of rainfall/streamflow are high, planners tend to opt for large reservoirs to achieve their goal.There is a need to consider integrated systems planning of supply and demand foroptimal development of the potential considering 90% reliability of the system in theregion. Demands of appropriate benefit-cost ratio (e.g. greater than 1.5), or least costof generation for clearance, ignore the energy/economic costs of submergence andalternative designs involving seasonal variation in generation. Optimization(programming) and descriptive (predictive) model approaches are usually adopted toaccomplish this complicated task (Falkenmark, 1989). Decision Support Systems(DSS) focus more on providing flexible tools for policy analysis than on providingmodels to answer structured problems (Parker & Ul-Ataibi, 1986). This paper focuseson the design of a hydroelectric project using DSS, emphasizing economic efficiencyand engineering soundness, subject to social, environmental, ecological, cultural,institutional and legal constraints.
OBJECTIVE
The objective is to design a hydroelectric plant utilizing optimal energy in the water,with minimum submergence and economic costs, considering seasonal variation inpower generation to meet the region's demand during all seasons.
STUDY AREA
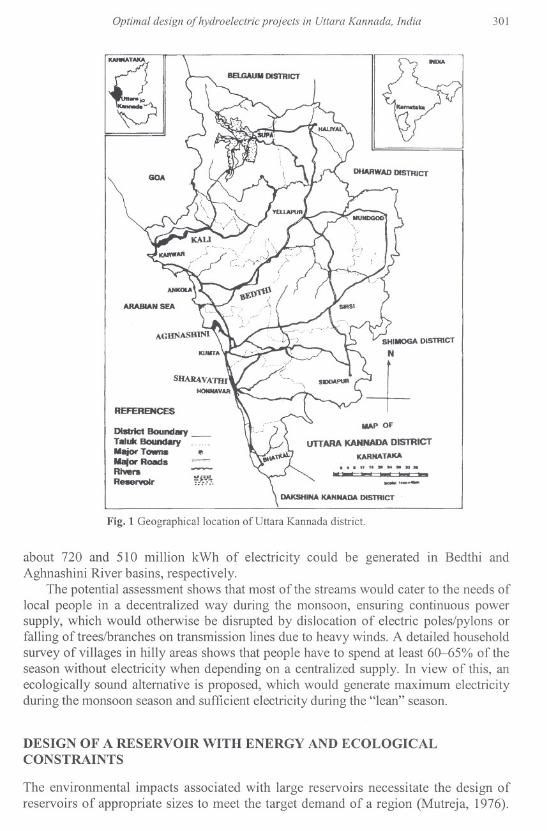
Uttara Kannada district lies between 74°9'-75°10'E longitude and 13°55'-15°31'Nlatitude with 67% of its area under forest, 27% under habitation and reservoirs, and therest under various cultivation covering 10291 km2 (Fig. 1). The large reservoirs forhydroelectricity generation of Kali and Sharavathi have submerged vast tracts ofnatural forest and dislocated a large number of people. Therefore, an attempt is madeto explore ecologically sound means of harnessing the hydro energy of the Bedthi andAghnashini rivers.
STREAMFLOW MEASUREMENT AND COMPUTATION OF POWER
Streamflow depends on drainage efficiency of hill slopes, moisture content of the soil,subsurface geology and vegetation cover (Gordon et al., 1992). Streamgauging using acurrent meter indicates that streams in these catchments are seasonal. The relationshipbetween runoff at gauged sites and rainfall was determined by regression analysis. Thisrelationship was used to assess the potential of ungauged streams. It was estimated that
Optimal design of hydroelectric projects in Uttara Kannada, India 301
~T}~
ARABIAN SEA
REFERENCES
DIstrIct Bound8y -Taluk Bound8ry -----MajorT- f>Major RoadsRhIersReservoir
MAP OF
UTTARA KANNADA DISTRICT
KARH.II.TAKA".......¥S~j.
-" ~ "- "--,---
Fig. 1 Geographical location of Uttar a Kannada district.
about 720 and 510 million kWh of electricity could be generated in Bedthi andAghnashini River basins, respectively.
The potential assessment shows that most of the streams would cater to the needs oflocal people in a decentralized way during the monsoon, ensuring continuous powersupply, which would otherwise be disrupted by dislocation of electric poles/pylons orfalling of trees/branches on transmission lines due to heavy winds. A detailed householdsurvey of villages in hilly areas shows that people have to spend at least 60-65% of theseason without electricity when depending on a centralized supply. In view of this, anecologically sound alternative is proposed, which would generate maximum electricityduring the monsoon season and sufficient electricity during the "lean" season.
DESIGN OF A RESERVOIR WITH ENERGY AND ECOLOGICALCONSTRAINTS
The environmental impacts associated with large reservoirs necessitate the design ofreservoirs of appropriate sizes to meet the target demand of a region (Mutreja, 1976).
302 T V Ramachandraet al.
Because of the negative aspects of hydroelectric projects in ecologically fragile hillyterrain; the submergence area should be minimized; the project should be subject toreasonable cost, minimum or no wastage of water and seasonal constraints (the regionreceives maximum rainfall during southwest monsoon). Based on 90 years' precipita-tion data and 18 months of river runoff data, a methodology is proposed to design astorage reservoir at Magod to meet the region's demand during all seasons.
Hydroelectric energy operation module
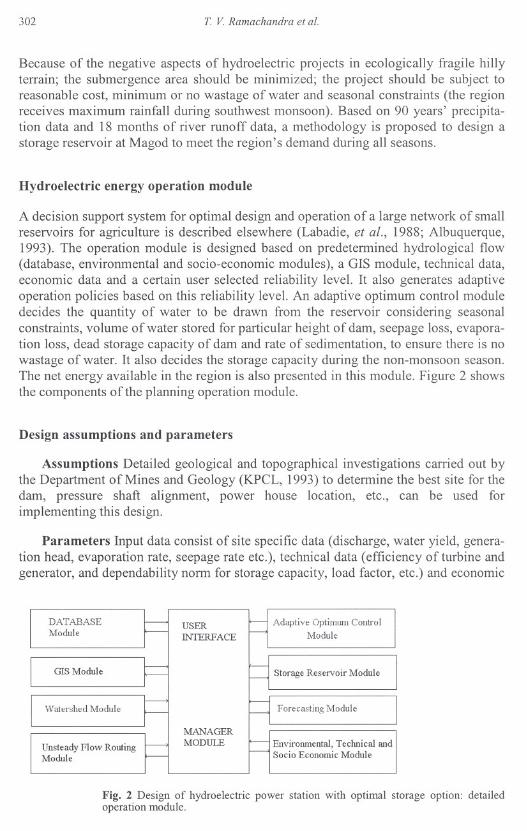
A decision support system for optimal design and operation of a large network of smallreservoirs for agriculture is described elsewhere (Labadie, et al., 1988; Albuquerque,1993). The operation module is designed based on predetermined hydrological flow(database, environmental and socio-economic modules), a GIS module, technical data,economic data and a certain user selected reliability level. It also generates adaptiveoperation policies based on this reliability level. An adaptive optimum control moduledecides the quantity of water to be drawn from the reservoir considering seasonalconstraints, volume of water stored for particular height of dam, seepage loss, evapora-tion loss, dead storage capacity of dam and rate of sedimentation, to ensure there is nowastage of water. It also decides the storage capacity during the non-monsoon season.The net energy available in the region is also presented in this module. Figure 2 showsthe components of the planning operation module.
Design assumptions and parameters
Assumptions Detailed geological and topographical investigations carried out bythe Department of Mines and Geology (KPCL, 1993) to determine the best site for thedam, pressure shaft alignment, power house location, etc., can be used forimplementing this design.
Parameters Input data consist of site specific data (discharge, water yield, genera-tion head, evaporation rate, seepage rate etc.), technical data (efficiency of turbine andgenerator, and dependability norm for storage capacity, load factor, etc.) and economic
DATABASEModule
USERINTERFACE
Adaptive Optimum Control]VIodule
GIS Module Storage Reservoir Module
Watershed Module Forecasting Module
Unsteady Flow RoutingModule
MANAGERMODULE Enviromnental, Technical and
Socio Economic Module
Fig. 2 Design of hydroelectric power station with optimal storage option: detailedoperation module.

Optimal design of hydroelectric projects in Uttara Kannada, India 303
data (civil construction costs for various types and heights of dam, cost of electricalmachinery of various capacities, environmental costs, rehabilitation costs, etc.).
Decision variables The decision variables determine the optimum storage capa-city, installed generation capacity and seasonal power drafts; net energy availability inthe region (objective function) needs to be maximized subject to seasonal hydrologicalconstraints, and costs and submergence area are to be minimized.
NET ENERGY MODEL-PARAMETRIC OPTIMIZATION
The broad outline of an optimization model for exploiting a river for hydropower andirrigation, incorporating energy cost and net increase in yield due to irrigation, withconstraints on arable area and crop water requirement and seasonal variation in pre-cipitation, has been formulated by Subramanian (1985). On the same lines, withdetailed engineering design and quantification of data, the parametric optimizationapproach is used with an objective to maximize the net energy subject to ecologicalconstraints, given by:
Enel = Eh - Ebio (1)
where Enelis net energy, Eh is hydroenergy and Ebiois bioenergy. This model is solvedfor various scenarios for optimal utilization of hydropower and thermal energy in theregion. This includes an equation which computes monthly hydropower production asa function of volume of water discharged (Q), gross head of this water (H) andefficiency of the couple turbine generator (Y],between 0.7 and 0.85).
Hydropower (kW) is given by:
P = 9.81.QH (2)
The corresponding approximate electricity produced Eh = p.t.Y], where Eh is electricity(kWh) and t is operating time. The monthly hydroelectricity generated in million kWhis given by:
Eht = L:9.81DrHy] (3)
where t = 1, ..., 12 and Dt is the power draft from the reservoir during a month (millioncubic meters, Mm3). Replacing 9.81.HY] as constant k]:
Eht = L:k\.Dt
This is decomposed for seasonal drafts:
Eht = L:k\.Dtm + L:k].Dtd (4)
where Dtm and Dtd are water drawn during monsoon (tm = 1, ...,4) and dry period(td = 5, ..., 12), respectively.
Energy loss due to submergence is given by:
Ebio = Asub.Gr.( CV)-Y]c (5)
where Asubis the submerged area classified on the basis of land use, Gr is the annual
304 T. V Ramachandra et al.
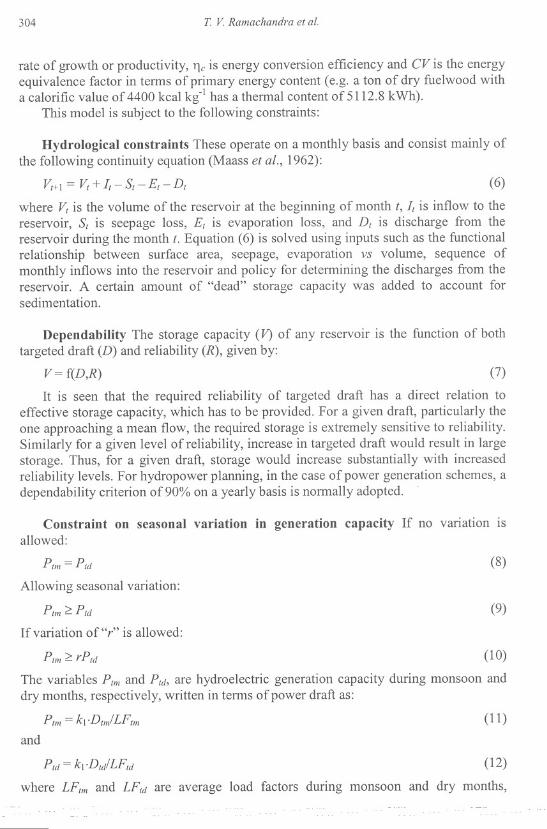
rate of growth or productivity, l1cis energy conversion efficiency and CV is the energyequivalence factor in terms of primary energy content (e.g. a ton of dry fuelwood witha calorific value of 4400 kcal kg-J has a thermal content of 5112.8 kWh).
This model is subject to the following constraints:
Hydrological constraints These operate on a monthly basis and consist mainly ofthe following continuity equation (Maass et al., 1962):
Vt+l = Vt + It-St-Et-Dt (6)
where Vt is the volume of the reservoir at the beginning of month t, It is inflow to thereservoir, St is seepage loss, Et is evaporation loss, and Dt is discharge from thereservoir during the month t. Equation (6) is solved using inputs such as the functionalrelationship between surface area, seepage, evaporation vs volume, sequence ofmonthly inflows into the reservoir and policy for determining the discharges from thereservoir. A certain amount of "dead" storage capacity was added to account forsedimentation.
Dependability The storage capacity (V) of any reservoir is the function of bothtargeted draft (D) and reliability (R), given by:
V= f(D,R) (7)
It is seen that the required reliability of targeted draft has a direct relation toeffective storage capacity, which has to be provided. For a given draft, particularly theone approaching a mean flow, the required storage is extremely sensitive to reliability.Similarly for a given level of reliability, increase in targeted draft would result in largestorage. Thus, for a given draft, storage would increase substantially with increasedreliability levels. For hydropower planning, in the case of power generation schemes, adependability criterion of 90% on a yearly basis is normally adopted.
Constraint on seasonal variation in generation capacity If no variation isallowed:
Ptm = Ptd
Allowing seasonal variation:
(8)
Ptm:2:Ptd
If variation of "r" is allowed:
(9)
Ptm:2:rPtd (10)
The variables Ptmand Ptd, are hydroelectric generation capacity during monsoon anddry months, respectively, written in terms of power draft as:
Ptm = kJ.DtmlLFtm
and
(11)
Ptd = kJ.Dtdl LFtd (12)
where LFtm and LFtd are average load factors during monsoon and dry months,

Optimal design of hydroelectric projects in Uttara Kannada, India 305
Dtm/LFtm = DtiLFtd (13)
(14)Dtm/LFtm 2':r.Dtd/LFtd
Assuming
LFtm = LFtd (as 0.5)
Equations (13) and (14) would become
(15)
Dtm = Dtd (16)
and
Dtm 2':r.Dtd r = 1,2, ..., 00 (17)
Constraint on minimum storage
Ka2':Vtfort=I,2,...,12 (18)
where Ka is the active storage capacity.
Operating policy of the reservoir The feasible operating policy, consideringseasonal variation in water inflow, would be: {(SI.Ptm + S2,Ptd).30.24.LF(amount ofwater/million kWh) = total quantity of water (in Mm3) available at site}. The loadfactor, LF is the ratio of average load to peak load.
From equations (12) and (15), with SI = 4 (monsoon) and S2 = 8 (lean season) thisconstraint reduces to:
4Dtm + 8D(([ = Vt+!
The regulation through storage could be shown as follows:
(19)
If Vt + It - St - Et - Dt ::;; Vs
then Dt = Vt + It - St - Et (20)
and
If Vt + It - St - Et - Dt 2': Vs
then Dt + d = Vt + It - St - Et (21)
where Vs is the storage volume of the reservoir and d the excess quantity available forgeneration.
Positivity constraints Decision variables are positive.
Dt 2':0 for all t = 1, 2,...,12 (22)
and
Vt2':0 for all t= 1,2,...,12
Therefore
(23)
Ka2':O (24)
306 T V Ramachandra et at.
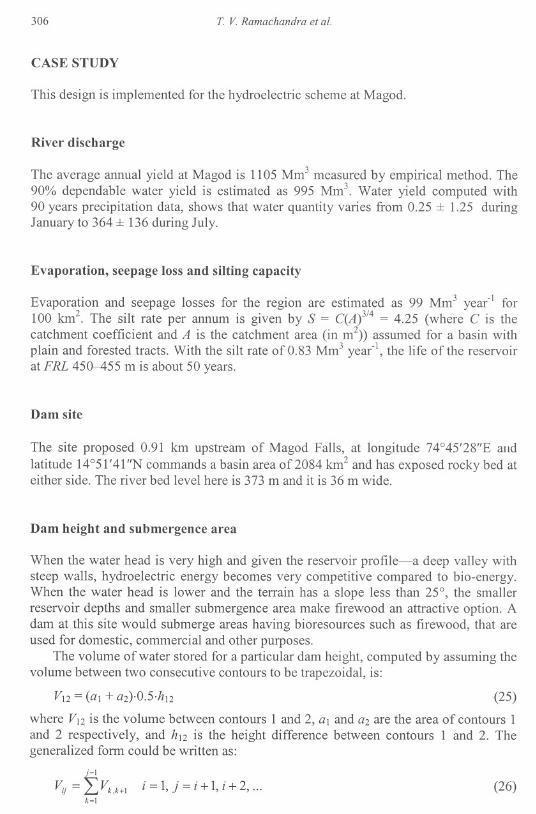
CASE STUDY
This design is implemented for the hydroelectric scheme at Magod.
River discharge
The average annual yield at Magod is 1105 Mm3 measured by empirical method. The90% dependable water yield is estimated as 995 Mm3. Water yield computed with90 years precipitationdata, shows that water quantity varies from 0.25 ::I::1.25 duringJanuary to 364::1::136 during July.
Evaporation, seepage loss and silting capacity
Evaporation and seepage losses for the region are estimated as 99 Mm3 year-l for100 km2. The silt rate per annum is given by S = C(A)3/4= 4.25 (where C is thecatchment coefficient and A is the catchment area (in m2)) assumed for a basin withplain and forested tracts. With the silt rate of 0.83 Mm3 year-I, the life of the reservoirat FRL 450--455 m is about 50 years.
Dam site
The site proposed 0.91 km upstream of Magod Falls, at longitude 74°45'28"E alldlatitude 14°51'41"N commands a basin area of2084 km2 and has exposed rocky bed ateither side. The river bed level here is 373 m and it is 36 m wide.
Dam height and submergence area
When the water head is very high and given the reservoir profile-a deep valley withsteep walls, hydroelectric energy becomes very competitive compared to bio-energy.When the water head is lower and the terrain has a slope less than 25°, the smallerreservoir depths and smaller submergence area make firewood an attractive option. Adam at this site would submerge areas having bioresources such as firewood, that areused for domestic, commercial and other purposes.
The volume of water stored for a particular dam height, computed by assuming thevolume between two consecutive contours to be trapezoidal, is:
Vl2 = (al + a2)-0.5.h12 (25)
where V12is the volume between contours 1 and 2, al and a2 are the area of contours 1and 2 respectively, and hl2 is the height difference between contours 1 and 2. Thegeneralized form could be written as:
i-I
Vij = IVk,k+!k~l
i=1,j=i+l,i+2,... (26)
Optimal design of hydroelectric projects in Uttara Kannada, India 307
180 Actual area
200
160-+- Yestimate=A*e ~ (B*X)
140
'" 120E'"0-'" 100.Sro~<{ 80
60
40
20
0~5 0.86 1.!34 2.860 ,0 ~ 40 00 00 100
Height in meters
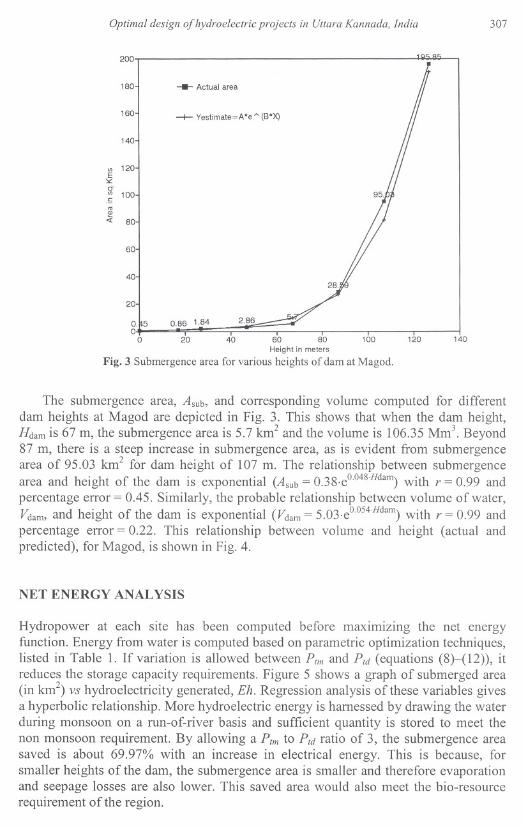
Fig. 3 Submergence area for various heights of dam at Magod.
120 140
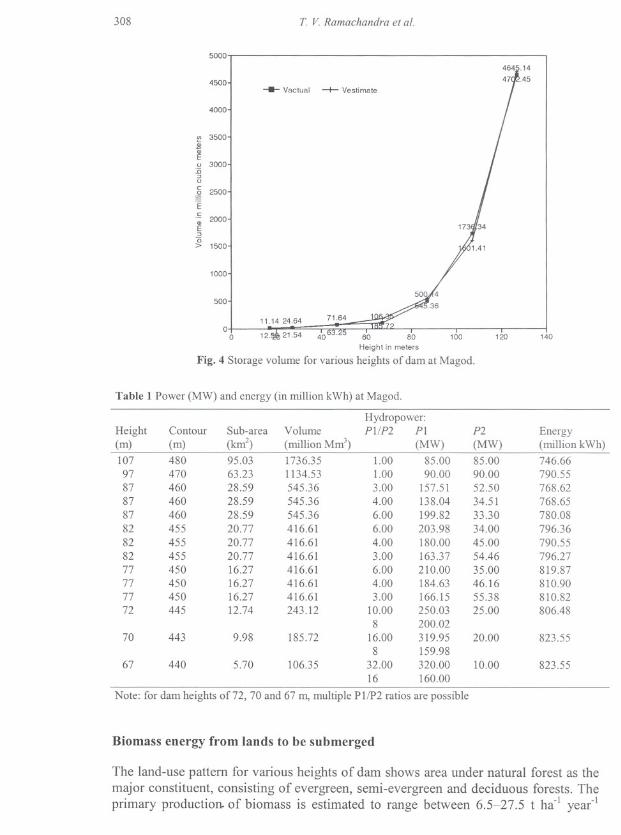
The submergence area, Asub, and corresponding volume computed for differentdam heights at Magod are depicted in Fig. 3. This shows that when the dam height,Hdamis 67 m, the submergence area is 5.7 km2 and the volume is 106.35 Mm3. Beyond87 m, there is a steep increase in submergence area, as is evident from submergencearea of 95.03 km2 for dam height of 107 m. The relationship between submergencearea and height of the dam is exponential (Asub= 0.38.eOO48Hdam)with r = 0.99 andpercentage error = 0.45. Similarly, the probable relationship between volume of water,Vdam,and height of the dam is exponential (Vdam= 5.03.eoo54Hdam)with r = 0.99 andpercentage error = 0.22. This relationship between volume and height (actual andpredicted), for Magod, is shown in Fig. 4.
NET ENERGY ANALYSIS
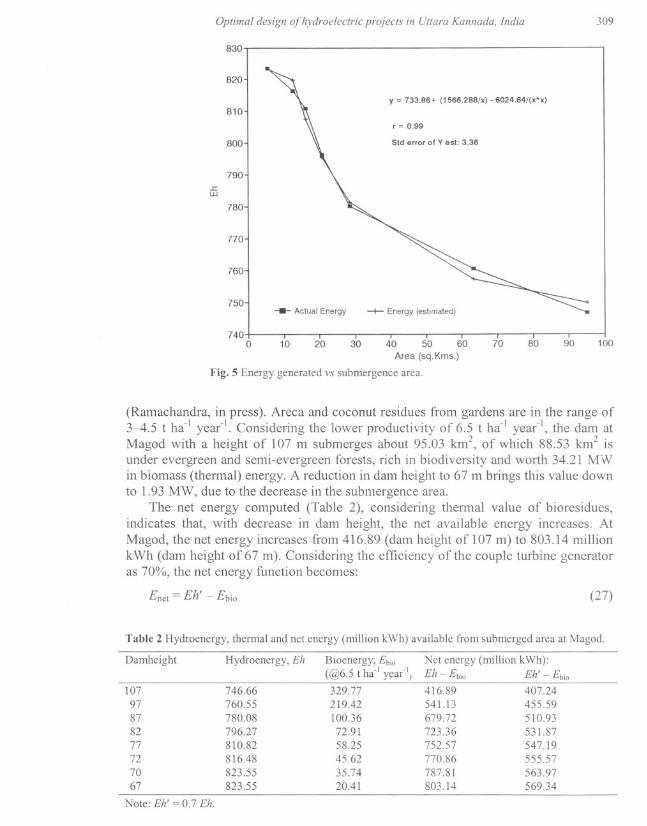
Hydropower at each site has been computed before maximizing the net energyfunction. Energy from water is computed based on parametric optimization techniques,listed in Table 1. If variation is allowed between Ptm and Ptd (equations (8)-(12)), itreduces the storage capacity requirements. Figure 5 shows a graph of submerged area(in km2) vs hydroelectricity generated, Eh. Regression analysis of these variables givesa hyperbolic relationship. More hydroelectric energy is harnessed by drawing the waterduring monsoon on a run-of-river basis and sufficient quantity is stored to meet thenon monsoon requirement. By allowing a Ptm to Ptd ratio of 3, the submergence areasaved is about 69.97% with an increase in electrical energy. This is because, forsmaller heights of the dam, the submergence area is smaller and therefore evaporationand seepage losses are also lower. This saved area would also meet the bio-resourcerequirement of the region.
308 T V. Ramachandra et al.
5000
4500--- Vaetua! -+- Vestimate
4000
"' 3500Q;1jjEt) 3000:a:>0
~ 2500-EO
c-0; 2000~(5> 1500
1000
500
11.1424.64 71.64
06 12.!i!021_54 40w."~ 60 80 100
Height in meters
Fig. 4 Storage volume for various heights of dam at Magod.
120 140
Note: for dam heights of 72, 70 and 67 m, multiple P 1/P2 ratios are possible
Biomass energy from lands to be submerged
The land-use pattern for various heights of dam shows area under natural forest as themajor constituent, consisting of evergreen, semi-evergreen and deciduous forests. Theprimary production- of biomass is estimated to range between 6.5-27.5 t ha-l year-l
Table 1 Power (MW) and energy (in million kWh) at Magod.
Hydropower:Height Contour Sub-area Volume Pl/P2 PI P2 Energy(m) (m) (km2) (million Mm3) (MW) (MW) (million kWh)107 480 95.03 1736.35 1.00 85.00 85.00 746.6697 470 63.23 1134.53 1.00 90.00 90.00 790.5587 460 28.59 545.36 3.00 157.51 52.50 768.6287 460 28.59 545.36 4.00 138.04 34.51 768.6587 460 28.59 545.36 6.00 199.82 33.30 780.0882 455 20.77 416.61 6.00 203.98 34.00 796.3682 455 20.77 416.61 4.00 180.00 45.00 790.5582 455 20.77 416.61 3.00 163.37 54.46 796.2777 450 16.27 416.61 6.00 210.00 35.00 819.8777 450 16.27 416.61 4.00 184.63 46.16 810.9077 450 16.27 416.61 3.00 166.15 55.38 810.8272 445 12.74 243.12 10.00 250.03 25.00 806.48
8 200.0270 443 9.98 185.72 16.00 319.95 20.00 823.55
8 159.9867 440 5.70 106.35 32.00 320.00 10.00 823.55
16 160.00
Optimal design of hydroelectric projects in Uttara Kannada, India 309
830
820
y= 733.86+ (1566.288/x) -6024.64/(x'x)
r = 0.99
SId error of Y est: 3.36
--- ActualEnergy -+- Energy (estimated)
7400 10 20 30 40 50 60
Area (sq.Kms.)
Fig. 5 Energy generated vs submergence area.
70 80 10090
(Ramachandra, in press). Areca and coconut residues from gardens are in the range of3--4.5 t ha-l year' 1. Considering the lower productivity of 6.5 t ha-l year-l, the dam atMagod with a height of 107 m submerges about 95.03 km2, of which 88.53 km2 isunder evergreen and semi-evergreen forests, rich in biodiversity and worth 34.21 MWin biomass (thermal) energy. A reduction in dam height to 67 m brings this value downto 1.93 MW, due to the decrease in the submergence area.
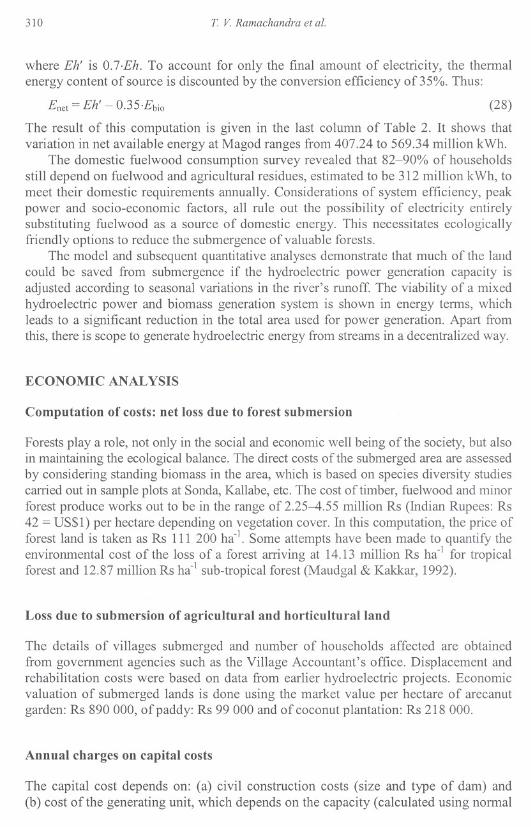
The net energy computed (Table 2), considering thermal value of bioresidues,indicates that, with decrease in dam height, the net available energy increases. AtMagod, the net energy increases from 416.89 (dam height of 107 m) to 803.14 millionkWh (dam height of 67 m). Considering the efficiency of the couple turbine generatoras 70%, the net energy function becomes:
Enel = Eh' - Ebio (27)
Table 2 Hydroenergy, thermal and net energy (million kWh) available from submerged area at Magod.
810
800
790
..c;w
780
770
760
750
Damheight Hydroenergy, Eh Bioenergy, Ebio Net energy (million kWh):(@6.5 t ha-' year"\ Eh - Ebio Eh' - Ebio
107 746.66 329.77 416.89 407.2497 760.55 219.42 541.13 455.5987 780.08 100.36 679.72 510.9382 796.27 72.91 723.36 531.8777 810.82 58.25 752.57 547.1972 816.48 45.62 770.86 555.5770 823.55 35.74 787.81 563.9767 823.55 20.41 803.14 569.34
Note: Eh' = 0.7 Eh.
310 T. V. Ramachandra et at.
where Eh' is 0.7.Eh. To account for only the final amount of electricity, the thermalenergy content of source is discounted by the conversion efficiency of 35%. Thus:
Enet = Eh' - 0.35.£bio (28)
The result of this computation is given in the last column of Table 2. It shows thatvariation in net available energy at Magod ranges from 407.24 to 569.34 million kWh.
The domestic fuelwood consumption survey revealed that 82-90% of householdsstill depend on fuelwood and agricultural residues, estimated to be 312 million kWh, tomeet their domestic requirements annually. Considerations of system efficiency, peakpower and socio-economic factors, all rule out the possibility of electricity entirelysubstituting fuelwood as a source of domestic energy. This necessitates ecologicallyfriendly options to reduce the submergence of valuable forests.
The model and subsequent quantitative analyses demonstrate that much of the laudcould be saved from submergence if the hydroelectric power generation capacity isadjusted according to seasonal variations in the river's runoff. The viability of a mixedhydroelectric power and biomass generation system is shown in energy terms, whichleads to a significant reduction in the total area used for power generation. Apart fromthis, there is scope to generate hydroelectric energy from streams in a decentralized way.
ECONOMIC ANALYSIS
Computation of costs: net loss due to forest submersion
Forests playa role, not only in the social and economic well being of the society, but alsoin maintaining the ecological balance. The direct costs of the submerged area are assessedby considering standing biomass in the area, which is based on species diversity studiescarried out in sample plots at Sonda, Kallabe, etc. The cost of timber, fuelwood and minorforest produce works out to be in the range of 2.25-4.55 million Rs (Indian Rupees: Rs42 = US$I) per hectare depending on vegetation cover. In this computation, the price offorest land is taken as Rs 111 200 ha-l. Some attempts have been made to quantify theenvironmental cost of the loss of a forest arriving at 14.13 million Rs ha-l for tropicalforest and 12.87 million Rs ha-l sub-tropical forest (Maudgal & Kakkar, 1992).
Loss due to submersion of agricultural and horticultural land
The details of villages submerged and number of households affected are obtainedfrom government agencies such as the Village Accountant's office. Displacement andrehabilitation costs were based on data from earlier hydroelectric projects. Economicvaluation of submerged lands is done using the market value per hectare of arecanutgarden: Rs 890 000, of paddy: Rs 99 000 and of coconut plantation: Rs 218 000.
Annual charges on capital costs
The capital cost depends on: (a) civil construction costs (size and type of dam) and(b) cost of the generating unit, which depends on the capacity (calculated using normal
Optimal design of hydroelectric projects in Uttara Kannada, India 311
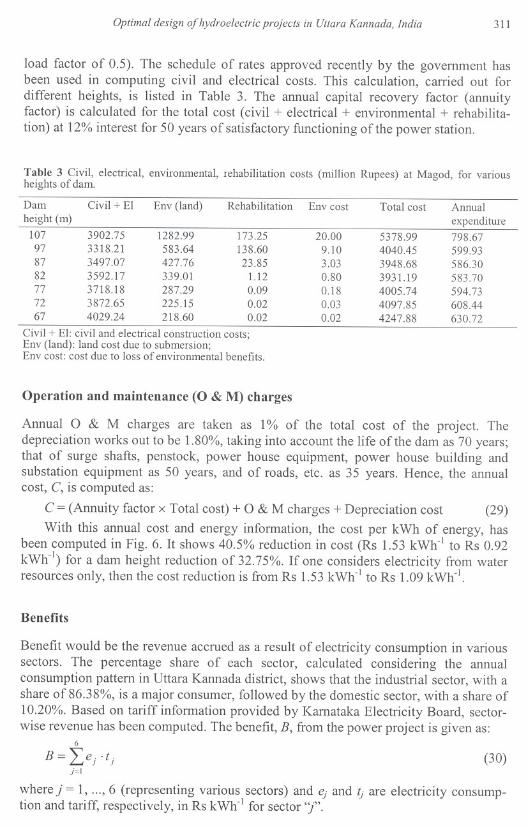
load factor of 0.5). The schedule of rates approved recently by the government hasbeen used in computing civil and electrical costs. This calculation, carried out fordifferent heights, is listed in Table 3. The annual capital recovery factor (annuityfactor) is calculated for the total cost (civil + electrical + environmental + rehabilita-tion) at 12% interest for 50 years of satisfactory functioning of the power station.
Table 3 Civil, electrical, environmental, rehabilitation costs (million Rupees) at Magod, for variousheights of dam.
Annual 0 & M charges are taken as 1% of the total cost of the project. Thedepreciation works out to be 1.80%, taking into account the life of the dam as 70 years;that of surge shafts, penstock, power house equipment, power house building andsubstation equipment as 50 years, and of roads, etc. as 35 years. Hence, the annualcost, C, is computed as:
C = (Annuity factor x Total cost) + 0 & M charges + Depreciation cost (29)
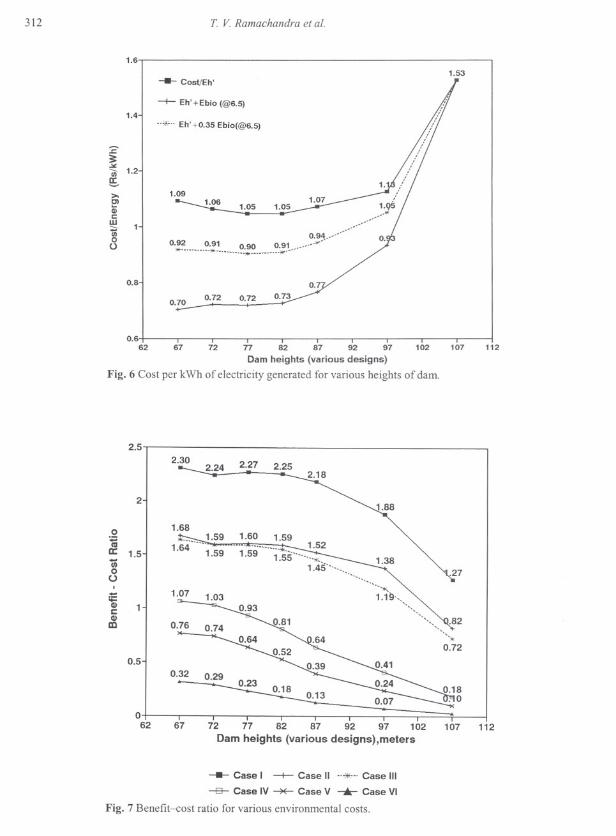
With this annual cost and energy information, the cost per kWh of energy, hasbeen computed in Fig. 6. It shows 40.5% reduction in cost (Rs 1.53 kWh-! to Rs 0.92kWh-I) for a dam height reduction of 32.75%. If one considers electricity from waterresources only, then the cost reduction is from Rs 1.53 kWh-1to Rs 1.09 kWh-].
Benefits
Benefit would be the revenue accrued as a result of electricity consumption in varioussectors. The percentage share of each sector, calculated considering the annualconsumption pattern in Uttara Kannada district, shows that the industrial sector, with ashare of 86.38%, is a major consumer, followed by the domestic sector, with a share of10.20%. Based on tariff information provided by Karnataka Electricity Board, sector-wise revenue has been computed. The benefit, B, from the power project is given as:
6
B="e.tL., J Jj~l
(30)
where j = 1, ..., 6 (representing various sectors) and ej and t; are electricity consump-tion and tariff, respectively, in Rs kWh-l for sector "j".
Dam Civil+EI Env (land) Rehabilitation Env cost Total cost Annualheight (m) expenditure
107 3902.75 1282.99 173.25 20.00 5378.99 798.6797 3318.21 583.64 138.60 9.10 4040.45 599.9387 3497.07 427.76 23.85 3.03 3948.68 586.3082 3592.17 339.01 1.12 0.80 3931.19 583.7077 3718.18 287.29 0.09 0.18 4005.74 594.7372 3872.65 225.15 0.02 0.03 4097.85 608.4467 4029.24 218.60 0.02 0.02 4247.88 630.72
Civil + EI: civil and electrical construction costs;Env (land): land cost due to submersion;Env cost: cost due to loss of environmental benefits.
Operation and maintenance (0 & M) charges
312 T. V Ramachandra et at.
1.6
Cosl/Eh'
1.4--+- Eh' +Ebio (@6.5)
..*.. Eh' +0.35 Ebio(@6.5)
0.662 67 72 17 82 87 92 97 102 107
Dam heights (various designs)
Fig. 6 Cost per kWh of electricity generated for various heights of dam.
.2iiia: 1.5iii0(),-;0::
IIICIII
IIJ
2.5
2.30 2.27 2.252.18
2.24
2
1.68
1~ 1.59.6-;C'~1.59
1.60 1.59 1.52~-
1.59 1.55 ""~:45"""""""'" .""'"1.19"',
"""
"'"
""""
1.07 1.03
0.76
0.5 0.39~
o.~062 67
Case I -+- Case II .."*...Case III-a- Case IV '"""'*-Case V Case VI
Fig. 7 Benefit-cost ratio for various environmental costs.
1.53
112
0.72
112
==..II: 1.2'ur
I1.09>-
1.05 1.05C1Qi'"W 1.'i0U
0.8I
0.72 0.720.70
Optimal design of hydroelectric projects in Uttara Kannada, India 313
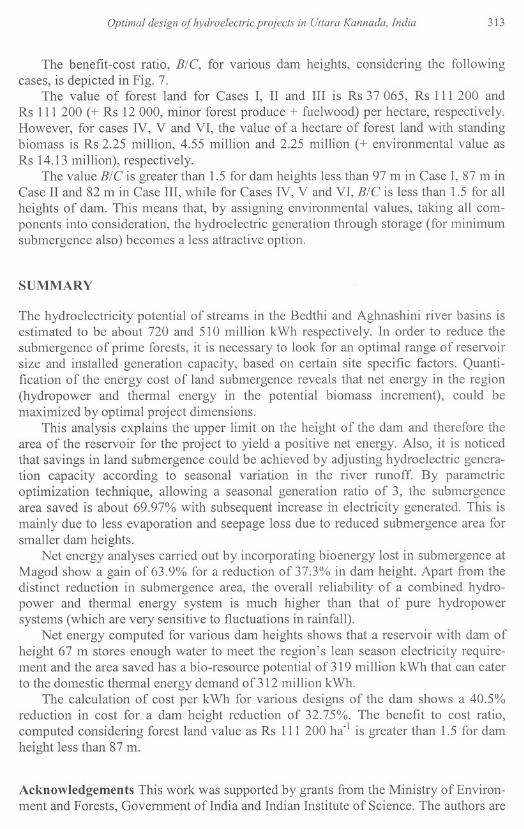
The benefit-cost ratio, B/C, for various dam heights, considering the followingcases, is depicted in Fig. 7.
The value of forest land for Cases I, II and III is Rs 37 065, Rs III 200 andRs III 200 (+ Rs 12000, minor forest produce + fuelwood) per hectare, respectively.However, for cases IV, V and VI, the value of a hectare of forest land with standingbiomass is Rs 2.25 million, 4.55 million and 2.25 million (+ environmental value asRs 14.13 million), respectively.
The value B/C is greater than 1.5 for dam heights less than 97 m in Case I, 87 m inCase II and 82 m in Case III, while for Cases IV, V and VI, B/C is less than 1.5 for allheights of dam. This means that, by assigning environmental values, taking all com-ponents into consideration, the hydroelectric generation through storage (for minimumsubmergence also) becomes a less attractive option.
SUMMARY
The hydroelectricity potential of streams in the Bedthi and Aghnashini river basins isestimated to be about 720 and 510 million kWh respectively. In order to reduce thesubmergence of prime forests, it is necessary to look for an optimal range of reservoirsize and installed generation capacity, based on certain site specific factors. Quanti-fication of the energy cost of land submergence reveals that net energy in the region(hydropower and thermal energy in the potential biomass increment), could bemaximized by optimal project dimensions.
This analysis explains the upper limit on the height of the dam and therefore thearea of the reservoir for the project to yield a positive net energy. Also, it is noticedthat savings in land submergence could be achieved by adjusting hydroelectric genera-tion capacity according to seasonal variation in the river runoff. By parametricoptimization technique, allowing a seasonal generation ratio of 3, the submergencearea saved is about 69.97% with subsequent increase in electricity generated. This ismainly due to less evaporation and seepage loss due to reduced submergence area forsmaller dam heights.
Net energy analyses carried out by incorporating bioenergy lost in submergence atMagod show a gain of 63.9% for a reduction of 37.3% in dam height. Apart from thedistinct reduction in submergence area, the overall reliability of a combined hydro-power and thermal energy system is much higher than that of pure hydropowersystems (which are very sensitive to fluctuations in rainfall).
Net energy computed for various dam heights shows that a reservoir with dam ofheight 67 m stores enough water to meet the region's lean season electricity require-ment and the area saved has a bio-resource potential of 319 million kWh that can caterto the domestic thermal energy demand of 312 million kWh.
The calculation of cost per kWh for various designs of the dam shows a 40.5%reduction in cost for a dam height reduction of 32.75%. The benefit to cost ratio,computed considering forest land value as Rs III 200 ha-\ is greater than 1.5 for damheight less than 87 m.
Acknowledgements This work was supported by grants from the Ministry of Environ-ment and Forests, Government ofIndia and Indian Institute of Science. The authors are
314 T V Ramachandraet at.
grateful to Mr Joshua David for assisting in editing the manuscript. Climatologicaldata were provided by the India Meteorological Department, Government ofIndia.
REFERENCES
Albuquerque, F. G. (1993) Optimum hydraulic control of irrigation canals. PhD Dissertation, Colorado State University,Fort Collins, Colorado, USA.
Falkenrnark, M. (1989) Hydrological Phenomena in Geosphere-Biosphere Interactions. IAHS Special Pub!. no. I.Gordon, N. D., McMahon, T. A. & Finlayson, B. L. (1992) Stream Hydrology: An Introduction for Ecologists. John Wiley
& Sons, Chichester, West Sussex, UK.
KPCL (Kamataka Power Corporation Ltd) (1993) Draft Policy Paper on Implementation of Power Projects by KPCL andPrivate Sector. Kamataka Power Corporation Ltd, Bangalore, India.
Labadie, J. W., Hiew, K., Vitasovic, Z., Swarner, R. & Speer, E. (1988) Optimal use of in-system storage for real-timeurban storrnwater contro!. In: Proc. US-Italy Bilateral System on Urban Storm Water Drainage (Cagliari, Italy, 25-28 July 1988) National Science Foundation and Consiglio Nazional Delle Richerche, Italy.
Maass, A., Hufschrnidt, M., Dorfman, R., Thomas, H. A., Marglin, S. A. & Fair, G. M. (1962) Design of Water ResourcesSystems-New Techniques for Relating Economic Objectives, Engineering Analysis and Government Planning.Harvard University Press, Boston, Massachusetts, USA.
Maudgal, S. & Kakkar, M. (1992) Evaluation of forests for impact assessment of development project. In: The Price ofForests (ed. by A. Agarwal), 56-60. Centre for Science and Environment, New Delhi, India.
Mutreja, K. M. (1976) Reservoir capacity for periodic-stochastic input and periodic output. Hydrology Paper no. 86,Colorado State University, Fort Collins, Colorado, USA.
Parker, B. J. & UI-Ataibi, G. A. (1986) Decision support systems: the reality that seems hard to accept. Int. J Manage. Sci.14(2),135-143.
Ramachandra, T. V. (in press) Bio energy potential and demand in Uttara Kannada district, Kamataka. Special Issue onBio Energy, IREDA News (India).
Subramanian, D. K. (1985) An optimal energy and water model for design and analysis of water resources of a river withconstraints on energy and ecology. Tech. Report no 8, Centre for Ecological Sciences, Indian Institute of Science,Bangalore, India.
Received 8 January 1997; accepted 2 November 1999