uva-dare (digital academic repository) exposing a complex ... filechapter 3 synchronized heat-flux...
TRANSCRIPT
UvA-DARE is a service provided by the library of the University of Amsterdam (http://dare.uva.nl)
UvA-DARE (Digital Academic Repository)
Exposing a complex metabolic system: glycolysis in Saccharomyces cerevisiaeTeusink, B.
Link to publication
Citation for published version (APA):Teusink, B. (1999). Exposing a complex metabolic system: glycolysis in Saccharomyces cerevisiae
General rightsIt is not permitted to download or to forward/distribute the text or part of it without the consent of the author(s) and/or copyright holder(s),other than for strictly personal, individual use, unless the work is under an open content license (like Creative Commons).
Disclaimer/Complaints regulationsIf you believe that digital publication of certain material infringes any of your rights or (privacy) interests, please let the Library know, statingyour reasons. In case of a legitimate complaint, the Library will make the material inaccessible and/or remove it from the website. Please Askthe Library: http://uba.uva.nl/en/contact, or a letter to: Library of the University of Amsterdam, Secretariat, Singel 425, 1012 WP Amsterdam,The Netherlands. You will be contacted as soon as possible.
Download date: 13 Mar 2019
CHAPTER 3
SYNCHRONIZED HEAT-FLUX OSCILLATIONS I N YEAST-CELL POPULATIONS1
3.1 Summary
Microcalorimetry was adapted to the study of glycolytic oscillations in suspensions of intact yeast cells. A correction procedure was developed for the distortion of the amplitude and phase of the heat signal, caused by the slow response of the calorimeter. This made it possible to observe oscillations in the heat production rate with a period of less than 1 min, and a relative amplitude of 5-10%. By simultaneously measuring the heat flux and concentrations of glycolytic metabolites, and by comparing acetaldehyde-induced phase shifts of the heat-flux oscillations with those of NADH oscillations, the heat flux was found to be 100° out of phase with glucose 6-phosphate, 80° out phase with fructose 1,6-bisphosphate and in phase with NADH. The flux measurement made possible by microcalorimetry allowed the recognition of (i) changes in metabolic capacity that may affect glycolytic dynamics, (ii) implications of glucose carrier kinetics for glycolytic dynamics and (iii) the continued requirement for an acetaldehyde trapping agent for the oscillations.
1 Published (in modified form) in collaboration with Christer Larsson, Jasper Diderich, Peter Richard, Karel van Dam, Lena Gustafsson and Hans V. Westerhoff, in J. Biol. Chem. 271, 24442-24448 (1996).
FLUX OSCILLATIONS IN INTACT YEAST CELLS 53

3.2 Introduction
Under certain expérimental conditions, suspensions of yeast cells exhibit sustained oscillations in the concentrations of several glycolytic intermediates [152, 283, 300]. Glycolytic oscillations in yeast have been discovered some thirty years ago (see for review [150]) and have subsequently been found in extracts of many organisms, including insects [72], mammals [365] and plants [204]. Also with respect to yeast, the study of glycolytic oscillations has been mainly carried out in cell-free extracts. In suspensions of intact yeast cells, most reported oscillations were damped (see, e.g., [31, 86, 151, 283]). Sustained oscillations have also been observed [151, 152]. More recently, the experimental conditions have been explicitly described that determine whether sustained or transient oscillations are obtained in suspensions of intact yeast cells [298, 300]. Sustained oscillations continue until the cells run out of substrate ([298], see also Fig. 4); damped oscillations disappear before the substrate is consumed. We use these sustained oscillations in suspensions of yeast cells as a model system to study the control of time-dependent, yet steady, metabolic systems.
The fact that sustained oscillations can be observed in a population of cells, implies that some synchronization mechanism prevents the cells from running out of phase [10, 116, 301, 404]. Recently, acetaldehyde was identified as the metabolite that couples the individual cells [297]. Consequently, not only control by internal parameters is of interest, but also the control via the extracellular acetaldehyde concentration. The latter control cannot be studied in cell-free extracts.
The metabolic oscillations are readily monitored through NAD(P)H fluorescence. To monitor other metabolites, samples have to be taken, quenched and extracted, either with trichloroacetic or perchloric acid [31], or with methanol and chloroform at -40 °C [82]. Crucial thermodynamic variables such as the redox potential and the phosphorylation potential oscillate significantly [299, 300]. From a thermodynamic point of view, it has been suggested that such oscillations may increase the efficiency of free-energy transduction [304], which may have been an evolutionary reason for the occurrence of glycolytic oscillations. On the other hand, it may be surprising, that cells can cope with significant oscillations in their energetics, which are generally believed to be homeostatically controlled. One of the tools that is often used in the study of energetics of metabolism [20, 396], most notably growth, is microcalorimetry: a method that allows non-invasive measurement of the enthalpy liberation of a system. Microcalorimetry gives quantitative information regarding the exchange of energy between the system and its environment. Such information has been helpful for the quantitative understanding of bioenergetics and efficiency of metabolism and growth [20, 137, 347, 379, 396].
In addition, microcalorimetry offers the opportunity to measure a total flux rather than the time dependence of the concentration of a metabolic intermediate. Although oscillating
54 CHAPTER 3

(local) rates have been calculated from stepwise increasing ethanol [118, 204] and decreasing glucose [27] or fructose [203] concentrations, direct measurement of an oscillating flux in intact yeast cells has not been accomplished yet. Indeed, the rate obtained by measuring the time course of, e.g., ethanol does only correspond to the (local) rate of alcohol dehydrogenase, and does not correspond to the overall flux, as such a flux is not defined under oscillating conditions [118]. Furthermore, the accuracy necessary for the measurement of such oscillating accumulation of the ethanol concentration severely constrains the conditions under which the oscillations are still experimentally detectable. The rate of heat production that is measured by calorimetry quantifies the overall enthalpy effects of all the metabolic activities in the cell. This overall heat flux is therefore a clearly defined (and accurately measurable) flux even in the oscillatory mode. Importantly, the average heat flax does relate to the average metabolic flux, and differences in specific heat production rates may point to differences in either the average metabolic flux or differences in the metabolic products. These properties make microcalorimetry a potentially powerful tool in the study of metabolic dynamics.
Microcalorimetry has been used for many decades to study the thermodynamics of, on the one hand, relatively simple systems such as (bio)chemical reactions [4] and, on the other hand, systems as complex as growing cells [137]. In the former systems, careful measurements and calculations have made it possible to correct for protonation, metal binding and ionic strength effects that are relevant for most biochemical reactions [5, 120]. In the latter systems, the cell is mainly considered as a black box, that consumes growth substrates such as glucose or succinate, and produces biomass and waste products like carbon dioxide, ethanol and glycerol [214, 379]. Glycolytic oscillations in resting yeast cells may be considered as an example of intermediate complexity, as they comprise a limited number of biochemical reactions of which the intermediates can be measured: the black box may be opened.
Microcalorimetric studies on glycolytic oscillations in yeast extracts have been carried out by the group of Lamprecht [87, 135, 275, 277]. Apart from the metabolic coupling in intact yeast cells, there are at least two other aspects that seem important for the control of glycolytic oscillations which are lacking in extracts: transport processes and endogenous ATP consuming processes such as the cell-membrane H -ATPase. Moreover, another important difference between extracts and intact cells is the much shorter period of the oscillations in the latter, which is about 1 min compared to 5-13 min for extracts [152, 277], In view of the limits of the time resolution of calorimeters, the first challenge was, whether modern calorimeters are at all able to resolve such rapid changes in metabolism. In this paper we will show that oscillations in the heat production rate of intact yeast cells with a period of less than one minute can be observed.
FLUX OSCILLATIONS IN INTACT YEAST CELLS 55

3.3 Materials and methods
Strain and growth conditions In all experiments the Saccharomyces cerevisiae diploid strain X2180 was used. Cells were
grown and prepared as described in [299].
Calorimetry set-up and calibration To measure oscillations in the calorimeter, 20-40 ml of cells in a 100 ml Erlenmeyer flask
were incubated in a water bath at 21 °C. The cells were stirred by a magnetic stirrer at 250 rpm. Using a peristaltic pump (perista pump Atto AC-2110), the cells were transported via Teflon tubings to the calorimeter and back to the Erlenmeyer flask. The calorimeter (Thermometric 2277 TAM, Thermometric AB, Järfälla, Sweden; [352]) was thermostated at 21 °C. The flow rate of the pump was 90 ml/h, resulting in a total transport time of 3-4 min. Care was taken to keep the water bath as well as the room temperature at 21°C, to avoid temperature-dependent frequency changes during the transport of the cells to the calorimeter and back.
Measurement of glycolytic intermediates and fluxes during oscillatory heat production To induce oscillations, glucose was added to a cell suspension, to a final concentration of
20 mM, 4 min later followed by potassium cyanide (KCN), to a final concentration of 4 mM. The cell density of the suspension was always around 5 mg protein/ml [224], unless specified otherwise. Due to a numerical error in the protein determination in the published version of this chapter, the numbers in this chapter differ from the published one. This does not alter the conclusions, as all data were normalized to the same erroneous standard. To measure glycolytic intermediates simultaneously with the heat flow, samples of 0.5 ml were taken every 5 seconds from the Erlenmeyer flask, quenched in 0.25 ml of 15% perchloric acid, vortexed at maximum speed and put at -20 °C. Subsequently the samples were thawed on ice, vortexed several times, and centrifuged in an Eppendorf centrifuge for 5 minutes at maximal speed, and neutralized with potassium hydroxide. After spinning down the precipitate, the supernatants were analyzed for glucose 6-phosphate and fructose 1,6-bisphosphate in an automatic analyzer (COBAS BIO, Roche) as described [82].
To measure glycolytic fluxes, samples were taken at 1 min intervals, 5-17 minutes after cyanide addition, quenched 1:1 in 10% trichloroacetic acid, vortexed and put on ice. The samples were analyzed for glucose, ethanol and glycerol by NADH-linked enzymatic analyses according to Bergmeyer [25].
Correction of the calorimetric signal The relatively slow response of the calorimeter to changes in the heat production necessitated correction of the data. This correction was based on the Tian equation [64, 212, 287]:
56 CHAPTER 3
C(t + l) = R(t)+(x+\) R(t + 2)-R(t) ( 3 1 )
where C(t) is the corrected, "true" signal, R(t) is the raw signal and x is the time constant of the calorimeter. The calorimeter stored a data point every 2 seconds. The response of the calorimeter in this calibration consisted of a single exponential function. Moreover, the oscillation of heat production was close a sine function. In such a case the Tian correction procedure is isomorphic with a more general correction procedure described by Müller et al. [246]. The calorimeter was calibrated by an electric current attached to the calorimeter flow cell. To measure the time constant x of the calorimeter, an electric power of 500 |iW was applied and shut off after some 30 min. The time constant was determined as the time difference tK between the moment the power was shut off and the time that the calorimetric signal was half the maximal value, divided by ln2: T = ty_ / ln2. The time constant was always around 60 s. The gain factor was determined as the ratio between the applied electric power and the maximal heat signal, and was always close to 1. Internal calibration was achieved by means of a chemical reaction as described by [69], which gave an effective volume of the flow cell of 0.52 ml.
Measurement ofNAD(P)H fluorescence Cells were prepared as described above. Fluorescence of the suspension was measured in
a thermostated and magnetically stirred cuvette of a Shimadzu RF 5 00 IPC spectrofluorophotometer (350 nm excitation; 460 nm emission) at 21° C.
Definition and calculation of phase and phase shift The phase was defined according to that of a sine. Thus, the phase of the heat flow
oscillation is 0° at the inflection point of rising heat flow. The phase of addition was calculated as 90° + 360° • t/T, t being the time passed between the last heat maximum and the addition of acetaldehyde, and T being the period of the oscillation. The phase shift was calculated by comparing the oscillation after the addition of acetaldehyde with an undisturbed oscillation: the phase shift was calculated as (AT - AT^/T^oO0, where AT, and AT2 are the time-difference between the corresponding extremes of the disturbed oscillation and the undisturbed oscillation before and after addition of acetaldehyde, respectively.
3.4 Results
Oscillations in heat-production rate When yeast cells harvested at the diauxic shift between glucose and ethanol, are starved
for two hours and are given glucose and cyanide, they exhibit sustained oscillations in NADH
FLUX OSCILLATIONS IN INTACT YEAST CELLS 57

fluorescence and in the concentration of a number of glycolytic intermediates [299, 300]. Fig. 1A shows that also the calorimetric signal oscillated under these conditions. When the cells entered the flow cell (at t = 3 min), an increase in the rate of heat production was observed, probably due to respiration of some endogenous substrates. Upon addition of glucose five minutes later, a sharp increase in the heat flow was observed. The heat flow reached a maximum after two minutes, and then decreased again. After some 20 minutes, the heat flux decreased to the low level before the addition of glucose, and remained low.
A
1000
800
600
400
200
uuu
800 A
I 4mM KCN
600 -
V^^ 400 A 200
n )
• 20mM glucose \
1 0 ™ 10 20 30
time (min)
40 50 10 20 30
time (min)
40 50
Figure 1. Oscillation in the heat production rate measured by the microcalorimeter without (A) and with
correction (B). Cells were prepared as described in Materials and Methods. At t = 3 min. the cells enter the
calorimeter; glucose and cyanide were added as indicated by the arrows. The insert in Fig. IB is an
enlargement of the uncorrected and the corrected data.
In Fig. IB the same experiment is shown, but now the calorimetric signal has been corrected for the slow response of the calorimeter. Upon entering the flow cell, this corrected heat production rate increased immediately and remained constant. Also the heat production rate upon glucose addition was high immediately and decreased continuously. This coincided
58 CHAPTER 3

with the culture becoming anaerobic due to high respiration at a high cell density. When cyanide was added subsequently, the oxygen level increased due to diffusion of oxygen into the vessel and inhibition of respiration (results not shown). The spikes accompanying the entering of the cells in the flow cell, are caused by some air in the tubing that separated the cells from the water. Similarly, the spikes accompanying the addition of glucose and cyanide are caused by air. Most notably, the amplitude of the oscillation was much larger, and the phase of the oscillation was shifted as compared to the oscillation in the uncorrected signal (Fig. 1A).
The amplitude of the oscillation in Fig. 1A was approximately 4 uW, which was about 8 times lower than the amplitude after correction (30 uW). Furthermore, the phase of the oscillatory calorimetric signal was 80 degrees behind that of the corrected one. These differences in the amplitude and phase of the oscillations were consistent with the equations
for correction of calorimetric data, based on the Tian equation and on the approximation of the oscillations by a harmonic function (see also Appendix I).
The phase relation of the heat flow with other oscillating variables Two methods were used to obtain the phase relation between the heat flux and oscillating
metabolite concentrations: measurement of glycolytic intermediates by perchloric acid extraction and acetaldehyde-induced phase shifts. Four minutes after induction of an oscillation, samples were taken, extracted with perchloric acid and analyzed for glycolytic intermediates as described in Materials and Methods. Figure 2 shows a typical result for the intracellular glucose 6-phosphate and fructose 1,6-bisphosphate concentrations, together with the measured heat flux. Glucose 6-phosphate and fructose 1,6-bisphosphate were approximately 180° out of phase. The phase difference between glucose 6-phosphate and the heat production rate was 100°.
We also made use of the ability of acetaldehyde to induce phase shifts. These phase shifts depend on the phase of addition [29, 297]. For the heat production rate, the same relation was found as for NADH: a maximal phase shift at 0° i.e., at the inflection point of rising heat flow
1.5 9 time (min)
Figure 2. Phase relation between heat flow and
metabolites. Cells were prepared and oscillations
induced as described in Materials and Methods. Four
min after cyanide addition, samples were taken every
5 s, quenched and extracted in perchloric acid and
analyzed for glucose 6-phosphate (solid symbols) and
fructose 1,6-bisphosphate (open symbols). The
uppermost solid line indicates the heat flux that was
measured simultaneously.
FLUX OSCILLATIONS IN INTACT YEAST CELLS 59
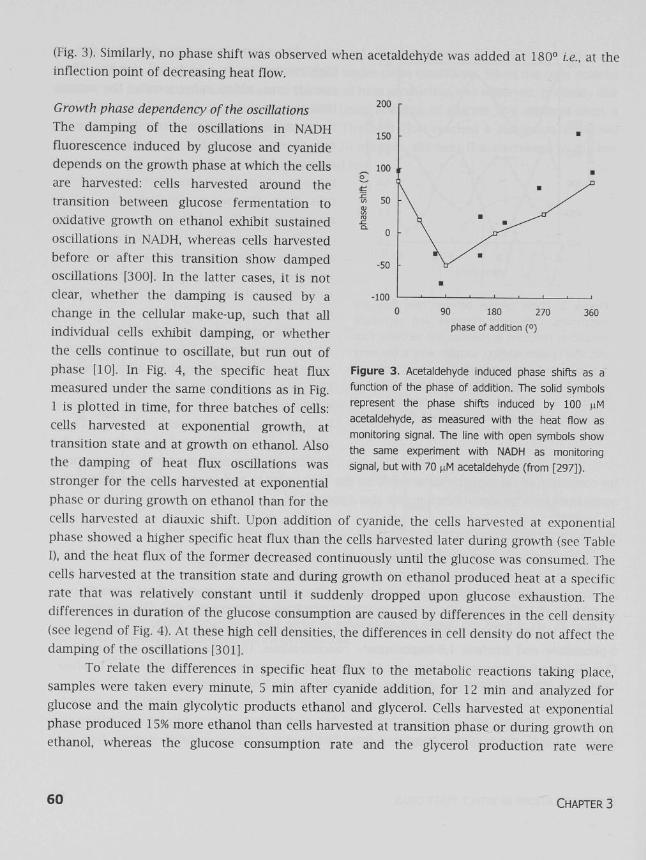
(Fig. 3). Similarly, no phase shift was observed when acetaldehyde was added at 180° i.e., at the inflection point of decreasing heat flow.
-100 90 180 270
phase of addition (°) 360
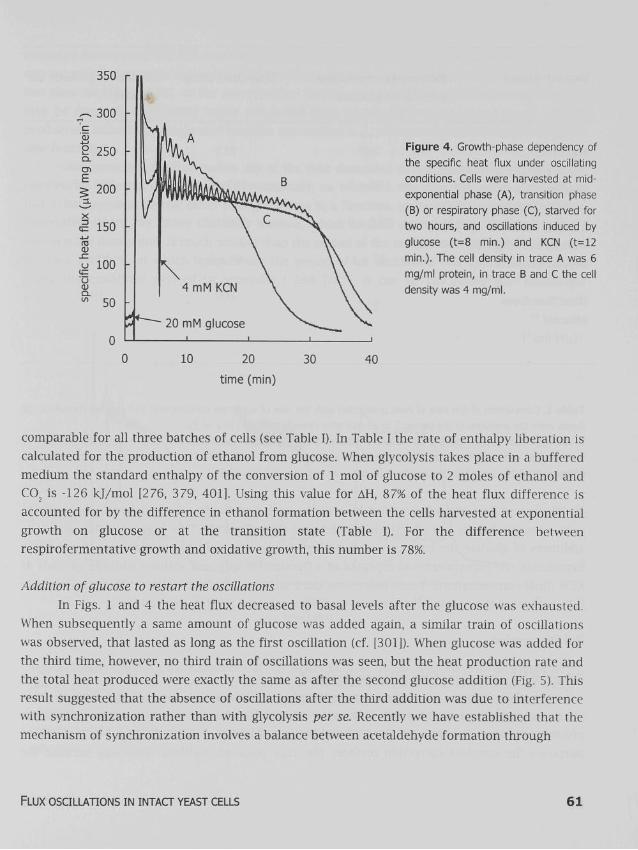
Growth phase dependency of the oscillations The damping of the oscillations in NADH fluorescence induced by glucose and cyanide depends on the growth phase at which the cells are harvested: cells harvested around the transition between glucose fermentation to oxidative growth on ethanol exhibit sustained oscillations in NADH, whereas cells harvested before or after this transition show damped oscillations [300]. In the latter cases, it is not clear, whether the damping is caused by a change in the cellular make-up, such that all individual cells exhibit damping, or whether the cells continue to oscillate, but run out of phase [10]. In Fig. 4, the specific heat flux measured under the same conditions as in Fig. 1 is plotted in time, for three batches of cells: cells harvested at exponential growth, at transition state and at growth on ethanol. Also the damping of heat flux oscillations was stronger for the cells harvested at exponential phase or during growth on ethanol than for the cells harvested at diauxic shift. Upon addition of cyanide, the cells harvested at exponential phase showed a higher specific heat flux than the cells harvested later during growth (see Table I), and the heat flux of the former decreased continuously until the glucose was consumed. The cells harvested at the transition state and during growth on ethanol produced heat at a specific rate that was relatively constant until it suddenly dropped upon glucose exhaustion. The differences in duration of the glucose consumption are caused by differences in the cell density (see legend of Fig. 4). At these high cell densities, the differences in cell density do not affect the damping of the oscillations [301].
To relate the differences in specific heat flux to the metabolic reactions taking place, samples were taken every minute, 5 min after cyanide addition, for 12 min and analyzed for glucose and the main glycolytic products ethanol and glycerol. Cells harvested at exponential phase produced 15% more ethanol than cells harvested at transition phase or during growth on ethanol, whereas the glucose consumption rate and the glycerol production rate were
Figure 3. Acetaldehyde induced phase shifts as a
function of the phase of addition. The solid symbols
represent the phase shifts induced by 100 nM
acetaldehyde, as measured with the heat flow as
monitoring signal. The line with open symbols show
the same experiment with NADH as monitoring
signal, but with 70 ^M acetaldehyde (from [297]).
60 CHAPTER 3
350
10 20 time (min)
30 40
Figure 4. Growth-phase dependency of
the specific heat flux under oscillating
conditions. Cells were harvested at mid-
exponential phase (A), transition phase
(B) or respiratory phase (C), starved for
two hours, and osculations induced by
glucose (t=8 min.) and KCN (t=12
min.). The cell density in trace A was 6
mg/ml protein, in trace B and C the cell
density was 4 mg/ml.
comparable for all three batches of cells (see Table I). In Table I the rate of enthalpy liberation is calculated for the production of ethanol from glucose. When glycolysis takes place in a buffered medium the standard enthalpy of the conversion of 1 mol of glucose to 2 moles of ethanol and C02 is -126 kj/mol [276, 379, 401]. Using this value for AH, 87% of the heat flux difference is accounted for by the difference in ethanol formation between the cells harvested at exponential growth on glucose or at the transition state (Table I). For the difference between respirofermentative growth and oxidative growth, this number is 78%.
Addition of glucose to restart the oscillations In Figs. 1 and 4 the heat flux decreased to basal levels after the glucose was exhausted.
When subsequently a same amount of glucose was added again, a similar train of oscillations was observed, that lasted as long as the first oscillation (cf. [301]). When glucose was added for the third time, however, no third train of oscillations was seen, but the heat production rate and the total heat produced were exactly the same as after the second glucose addition (Fig. 5). This result suggested that the absence of oscillations after the third addition was due to interference with synchronization rather than with glycolysis per se. Recently we have established that the mechanism of synchronization involves a balance between acetaldehyde formation through
FLUX OSCILLATIONS IN INTACT YEAST CELLS 61
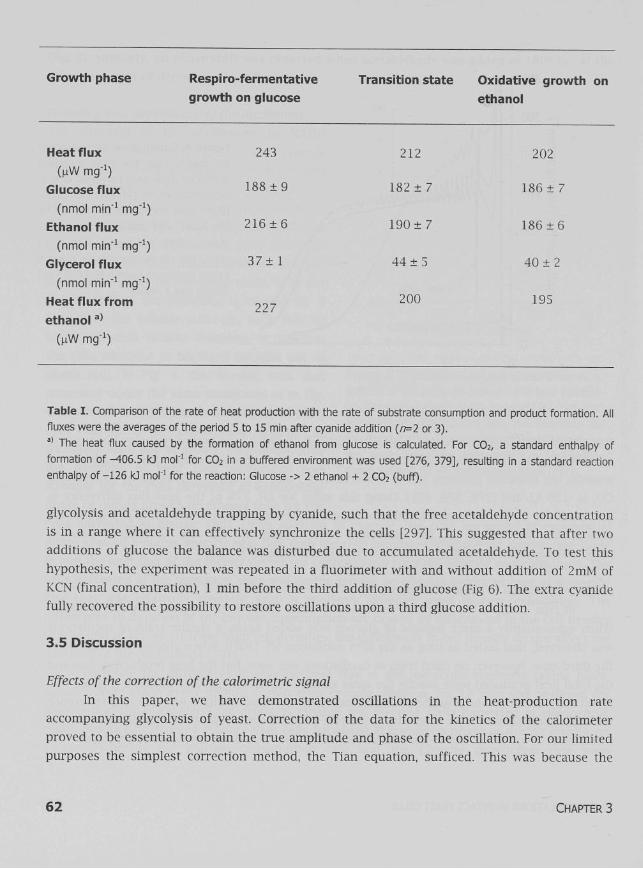
Growth phase Respiro-fermentative
growth on glucose
Heat flux 243
(uW mg"1)
Glucose flux 188 ± 9
(nmol min"1 mg"1)
Ethanol flux 2 1 6 ± 6
(nmol min"1 mg"1)
Glycerol flux 37± 1
(nmol min"1 mg"1)
Heat flux from 227 ethanol a)
(uW mg"1)
Transition state Oxidative growth on
ethanol
212
182 ± 7
190 ±7
44 ± 5
200
202
186 ± 7
186 ±6
40 ±2
195
Table I. Comparison of the rate of heat production with the rate of substrate consumption and product formation. All fluxes were the averages of the period 5 to 15 min after cyanide addition (/7=2 or 3). a) The heat flux caused by the formation of ethanol from glucose is calculated. For C02, a standard enthalpy of formation of -406.5 kJ mol"1 for C02 in a buffered environment was used [276, 379], resulting in a standard reaction enthalpy of-126 kJ mol"1 for the reaction: Glucose -> 2 ethanol + 2 C02 (buff).
glycolysis and acetaldehyde trapping by cyanide, such that the free acetaldehyde concentration is in a range where it can effectively synchronize the cells [297]. This suggested that after two additions of glucose the balance was disturbed due to accumulated acetaldehyde. To test this hypothesis, the experiment was repeated in a fluorimeter with and without addition of 2mM of KCN (final concentration), 1 min before the third addition of glucose (Fig 6). The extra cyanide fully recovered the possibility to restore oscillations upon a third glucose addition.
3.5 Discussion
Effects of the correction of the calorimetric signal In this paper, we have demonstrated oscillations in the heat-production rate
accompanying glycolysis of yeast. Correction of the data for the kinetics of the calorimeter proved to be essential to obtain the true amplitude and phase of the oscillation. For our limited purposes the simplest correction method, the Tian equation, sufficed. This was because the
62 CHAPTER 3

response function of the calorimeter in the time window around the period of the oscillation corresponded to a single exponential. Other methods, such as an extended Tian equation using two time constants [352], or the more general fast Fourier Transformation method [246, 276], may be required when more subtle properties than amplitude, frequency and phase of heat production following a single sine function are studied (e.g., when studying derivations from the sine function).
Our correction method makes use of the time derivative of the calorimeter signal. As the calorimeter collected data points discontinuously, i.e. every 2 s, the time derivative of the signal had to be approximated by either fitting the data to a function, or by using the tangent between successive points. We chose the latter method, which is valid provided that the time interval between the data points is much smaller than the period of the oscillation (Appendix I). This was the case at 21 °C, at which temperature the period of an oscillation was approximately 50 s. Using the equations derived in appendix I and [287], it can be calculated that under our
800 r
600
3 X 3
200
30 60
time (min)
90 120
Figure 5. Heat flux of a yeast suspension that was repeatedly given glucose, after the previous amount of
glucose had been consumed. Cells were prepared and oscillations induced as described in Materials and
Methods. The sudden decrease 3 min after cyanide addition was caused by some air accompanying the addition
of 70 nM acetaldehyde (which did not affect the oscillation in heat flux). After the first train of oscillations had
stopped, another 20 mM glucose was added. This was repeated after the second amount of glucose had been
consumed.
FLUX OSCILLATIONS IN INTACT YEAST CELLS 63

Figure 6. NAD(P)H fluorescence of a yeast suspension during oscillatory conditions (see Materials and Methods).
The first 50 min of traces A and B are identical, with addition made as indicated. In trace A, glucose was added
to a final concentration of 20 mM at t=50 min, in trace B cyanide was added to a final concentration of 2 mM, 1
min prior to the addition of the glucose (20 mM final concentration).
conditions, the phase correction should be fairly insensitive to changes in the frequency, whereas the amplitude correction should be sensitive.
Characterization of heat-flow oscillations The amplitude of the heat-flux oscillation was 5-10% of the average heat flux. The same
relative amplitude has been observed in yeast extracts [87, 276]. It is important to realize that the amplitude of the heat flux cannot be directly related to the amplitude of the glycolytic flux. The definition of a flux through a metabolic pathway requires that all rates of that pathway are equal. Accordingly, an oscillation in the glycolytic flux requires that the rates of all reactions oscillate in phase and with the same amplitude. As a consequence, the amplitudes of the oscillations in metabolite concentrations should be very small. This is clearly not the case (see, for instance [31, 299], and Fig. 2). Rather, the changes in the metabolite concentrations are caused by the differences in successive reaction rates and seem to be caused primarily by differences in amplitude [32, 118]. Although the amplitude of the oscillation in heat flux may not be related directly to a metabolic flux, the average heat flux does correspond to the average metabolic flux.
Two methods were used to establish the phase relation between heat flux and oscillating metabolites in intact cells. Samples were taken out of the Erlenmeyer flask from which the cells were transported to the calorimeter (see Materials and Methods), and the glycolytic intermediates were determined by perchloric acid extraction and subsequent enzymatic analyses. We took care that the temperature, and thus the frequency [30], was the same
64 CHAPTER 3
everywhere, so that the phase of the oscillation in the Erlenmeyer flask and that in the measuring unit were identical. The heat flow lagged 100° behind glucose 6-phosphate, and oscillated some 80° ahead of fructose 1,6-bisphosphate.
The phase relative to that of NADH oscillations was determined by the experiments with acetaldehyde. The dependence of the acetaldehyde-induced phase shifts on the phase of addition was the same for the NADH and for the heat-flux oscillation. This indicates that the phases of the NADH fluorescence and the heat-flux oscillations coincide. In some literature it was erroneously suggested that in extracts the heat flux was in phase with NAD rather than NADH [87, 212], due to confusion of NADH and NAD. The actual phase of the heat flux, however, is the same as that of NADH, both in intact cells (this study), and in cell-free extracts2 [87, 276]. That the heat-flux oscillations were in phase with NADH, 100° behind glucose 6-phosphate and 80° ahead of fructose 1,6-bisphosphate, is in line with the phase difference between NADH and those metabolites reported before (i.e., -100° and 70° respectively [299]). The concentrations of glucose 6-phosphate and fructose 1,6-bisphosphate are in line with those of earlier reports [31, 204, 299].
One might suggest that the heat-flux measurements are not necessary because they can be calculated from biochemical analysis of oscillating metabolite concentrations. Using the oscillating metabolite concentrations, together with the accurate measurement of (oscillating) end product formation, it is in principle possible to calculate the rates of all individual reactions [32, 118]. These rates, combined with the concomitant reaction enthalpies, should yield the contribution of each reaction to the net heat flux of the system [4, 379, 396]. However, in extensive attempts we were not able to account fully for the measured heat flux in terms of the individual reaction rates and their enthalpies (calculations not shown). It turned out that the accuracy necessary for such calculations is beyond experimental possibilities, especially were the glucose and end products are concerned, and accurate thermodynamic data for some glycolytic reactions, especially for those where the triose phosphates are involved, are not available (but see, e.g., [5, 55, 358, 359]). Clearly, although theoretically heat-flux oscillations can be calculated from oscillating metabolite concentrations, in practice the former must be determined experimentally in systems as complex as glycolytic oscillations in intact yeast cells.
Microcalorimetry as a tool to study the dynamics of metabolism
Glycolytic oscillations and metabolic dynamics can be studied by a variety of techniques, among which NADH fluorimetry and sampling of intracellular metabolites are most frequently used. Provided that sufficient time resolution can be achieved, microcalorimetry can add significantly to these techniques. Here we have shown how the time resolution can be made sufficient for the detection of metabolic dynamics at the sub-minute time scale. Oscillations of
2Lamprecht, I., personal communication
FLUX OSCILLATIONS IN INTACT YEAST CELLS 65

5% amplitude could still be detected at an accuracy exceeding that of sampling of intracellular metabolites, and comparable to that of NADH fluorescence. Accordingly, the provisions for the application of microcalorimetry to (this type of) metabolic dynamics have been met. What type of additional information does microcalorimetry provide, as compared to the other methods, or what type of information does it provide more readily or accurately?
A second asset of our calorimetric setup is that it primarily measures flux rather than the concentration of some metabolite or coenzyme. NADH fluorescence measurements do reveal glycolytic oscillations but the average NADH fluorescence does not relate to the average glycolytic flux. The average heat flow does relate to that flux. In this paper we have profited in three ways from this additional information of microcalorimetry: (i) it suggested differences in flux distribution between cells that exhibited different dynamic behavior, (ii) it led us to a possible link between glycolytic dynamics and glucose transport, (iii) it showed that failure of cell-to-cell signaling rather than impediment of glycolysis per se limited the duration of sustained glycolytic oscillations. In the following paragraphs we shall elaborate on these findings.
Previously we established that the tendency of populations of yeast cells to exhibit sustained oscillations depends on the growth phase in which they are harvested [300]. Cells grown on glucose and harvested at the diauxic shift oscillate until the added glucose is consumed; cells harvested before or after the diauxic shift stop oscillating before the glucose is depleted. However, we did not understand the metabolic reasons for this difference. The microcalorimetric flux measurements now suggested a possible explanation. We found differences in the specific average heat flux between cells harvested at exponential growth on glucose and cells harvested at the diauxic shift or later. These differences in the specific heat production rates could be caused by differences in average flux, by differences in the products formed, or by a combination of the two. The measurement of the rate of glucose consumption and that of ethanol and glycerol production suggested the latter: cells harvested during respiro-fermentative growth did not consume glucose any faster, but produced more ethanol per glucose consumed as compared to cells harvested later during growth. The glycerol production rates were comparable. Most of the heat flux difference was accounted for by the difference in ethanol formation between the cells harvested at exponential growth on glucose or later (Table I).
These results leave open the possibility that the difference in dynamic behavior, i.e. the higher damping of the cells harvested at exponential phase, is due to differences in metabolic capacity between the cells. The benefit of calorimetry resides in the fact that these differences in specific heat flux and thus in metabolic fluxes are immediately obvious, and prompted directions for further research. By contrast, the similar specific heat fluxes of cells harvested at transitions phase and those harvested during ethanol growth may be seen as an indication of a problem in communication between the individual cells. This is currently under investigation.
66 CHAPTER 3
Another interesting difference between cells harvested at exponential phase and cells harvested at transition phase or later during growth, is the gradual decrease with time of the heat flux in the former. The decrease in flux may be explained by the fact that under these conditions the glucose transport system has a low affinity component (Km » 28 mM [383], see also chapter 4). Consequently, the transport rate will be significantly affected by the decrease in extracellular glucose, and this then affects the glycolytic flux. Cells harvested at transition phase have a glucose transport system with only a high affinity for glucose (Km = 1.7 mM [383], chapter 4), and are therefore much less affected by a decrease in extracellular glucose. Indeed, only when the glucose concentration becomes very low, i.e., at the end of the experiment, does the heat flux drop. These subtle changes in flux, yield important suggestions about the control of the transport step on the overall flux through glycolysis, which have been investigated further in chapter 5. Conventional flux determinations by following glucose consumption or ethanol production such as done in this study, are not accurate enough to reveal such subtle changes in flux. Heat flux measurement by microcalorimetry is. The application of microcalorimetry as a method to measure flux with high precision, is thus very promising in the study of regulation and control of metabolic fluxes [97, 388].
An important aspect of our experimental system is that for the cells harvested at the diauxic shift the oscillations are essentially sustained. Here the word "essentially" serves to indicate that the conditions limiting the duration of the oscillations are understood. One of these was the presence of sufficient glucose [301]. Another was suggested by microcalorimetry in the case where readdition of glucose failed to restart the oscillations. In the case where glucose was added for the third time, after the second amount of glucose was consumed, the total amount of heat produced and the average heat flux were the same for the second and the third addition of glucose. Yet, the second glucose addition caused a train of oscillations, whereas the third addition did not. Our provisional explanation, that products accumulated during the first two glucose consumption phases inhibited glycolysis and hence its oscillations, was falsified by the calorimetric finding that the heat flux and the total amount of heat produced during consumption of the glucose was unchanged. This led us to speculate that the cells were still able to oscillate, but no longer able to do so in phase. The continuous production of acetaldehyde during consumption of glucose might have titrated the cyanide away [298, 413], such that at the third addition of glucose, too little cyanide was left to keep the acetaldehyde concentration within the range where it can act as a synchronizer [297]. This hypothesis was confirmed by adding more cyanide before the third addition of glucose (Fig. 6). With the extra cyanide oscillations could be observed after the third glucose addition; without the cyanide the third glucose addition did not trigger an oscillation.
In conclusion, we have shown the additional value of microcalorimetry as a tool to study metabolic dynamics. Hitherto poorly understood differences in dynamic behavior, as described in the literature, were re-examined with microcalorimetry, which led to further insight in the
FLUX OSCILLATIONS IN INTACT YEAST CELLS 67

metabolic basis of the observed differences, and prompted directions for further research. Furthermore, the most promising use of the microcalorimeter may be that as an accurate "fluxmeter", which hopefully will find more applications in the study of control and regulation of metabolic fluxes.
Acknowledgements
We wish to thank Ms. B.M. Bakker, Dr. M. C. Walsh and anonymous reviewers for critical reading of the manuscript and Prof. Dr. I. Lamprecht for valuable discussions.
3.6 Appendix I
We used the modified Tian equation to correct discrete data points with a time interval of 2s, rather than functions (see Materials and Methods). In the general case, with a sample interval of 28t, the modified Tian equation becomes:
C(t + 8t) = R(t)+(l+±y(t + 2f-m (A3.1)
Approximating R(t) by a complex harmonic function:
R(t) = pe'w ' (A3.2)
so that, combining (1) and (2):
C(/ + 50 = j p e ' ' ( 0 / [ f l - - l + f l + - \ 2 / C 0 Ô ' | (A3.3)
Important is the ratio between C(t+5t) and ß(t+8t):
=i(i_^V'œs'++fi+-V(o5/ C(t + 5Q
= cos(coS/) + i — sin(co5/)
(A3.4)
68 CHAPTER 3

The phase difference between C and R, A<j>, is:
A<j> = arg[ C(/ + 5/)] - arg[ R(t + of)]
= arg 'C(? + 50A
#(/ + 50
= arctan —tan(co8r
~ arctan( co/)
(A3.5)
where arg[C(t+5t)] is the argument (polar angle) of C(t+5t). Furthermore, the amplitude ratio, a, is:
C(t + 5t)
R(t + 5t)
cos2(co80+ — ] sin2(co.
1 + èt
- 1 sin (Cûô/)
(A3.6)
«V(1+(CûT)2
where |C(t+5t)/i?(t+5t)| is the modulus (radius) of C(t+St)/i?(t+St). The validity of the approximations in equations (A3.5) and (A3.6) depend on the time constant, the angular velocity and the sampling interval. Under our conditions, i.e., a time constant of T = 60 s, an angular velocity m * 0.13 rad s1 and a sample interval of 2 s, i.e., 5t = 1 s, the error in the approximation of Eq. (5) was <0.1% , and in Eq. (6) 2.1%.
FLUX OSCILLATIONS IN INTACT YEAST CELLS 69

70