v. development of fundamental technology
TRANSCRIPT

Comprehensive Report of Phase 2 & 3 Research Results
MH21 Research Consortium Ⅴ‐1
V. Development of Fundamental Technology
Ⅴ.1 Core Sampling Technology and Results
(1) Purpose
To understand the in-situ characteristics of the formation containing MH, core samples extracted while
maintaining the formation pressure (“pressure cores”) would provide valuable information. Continuous
improvement and testing of pressure core sampler (corer) were carried out to recover pressure cores more
reliably.
(2) Background
The pressure corer PTCS (Pressure Temperature Core Sampler) was developed in 1995-2000 by JNOC, the
predecessor of JOGMEC, and Aumann & Associates (AAI). Tool design has been modified since 2001
(Phase 1 of the project) in order to improve the core recovery rate and workability. By using this coring tool,
cores were recovered in the "Tokai-oki to Kumano-nada" exploratory test wells in 2003, and the recovery
rate of the pressure cores was 79%, and the pressure retention success rate was 90% of the coring runs [1].
This PTCS was designed on the premise of depressurizing cores on board for observation and analysis
purposes. However, since the Pressure Core Analysis and Transfer System (PCATS) was developed by
Geotek Ltd., it became possible to observe, analyze and store cores while maintaining pressure. Along with
this, Hybrid PCS (Hybrid Pressure Core Sampler) was jointly developed with AAI and the Japan Agency
for Marine-Earth Science and Technology (JAMSTEC) as a pressure corer compatible with PCATS.
In July 2012, JOGMEC performed coring using Hybrid PCS and PCATS for the sand-mud alternate layers
containing hydrates at the Daini-Atsumi Knoll [2-6]. As a result, the effectiveness of the systems in the
characterization of the formation including MH was demonstrated. However, a problem remained regarding
the reliability of the pressure holding operation of Hybrid PCS. Therefore, JOGMEC reviewed PTCS,
which had already been regarded as an older generation, and decided to make it compatible with PCATS
while maintaining the mechanism of the ball valve.
In 2014, PTCSs stored by JOGMEC were transported to AAI, then remodeling work was conducted using
some newly created parts compatible with PCATS. This improved tool, HPTC III (High Pressure
Temperature Corer III), was tested in a factory, and expected performance was confirmed in a field trial
using a land rig in Texas, USA in 2015. Then coring jobs using HPTC III and PCATS were performed in
offshore Japan in 2018 during the operation of the supplemental data acquisition campaign, which was
conducted after the second offshore production test.
(3) Implementation and results
① Outline and Features of Each Corer
Table 1 compares the specifications of PTCS, Hybrid PCS and HPTC III.

Comprehensive Report of Phase 2 & 3 Research Results
MH21 Research Consortium Ⅴ‐2
Table 1 Specification of Pressure Corers Used by JOGMEC
Item PTCS [1] Hybrid PCS [2] HPTC III
Drill pipe OD 6-5/8” 5” or 5-1/2” 6-5/8”
Max. pressure of Autoclave 24 MPa 35 MPa 35 MPa
Compatibility w/PCATS No Yes Yes
Core OD 66.7 mm 51 mm 54 mm
Core length 3 m 3.5 m 3.5 m
Core bit 10-5/8" PDC Bit 10-5/8" PDC Bit 10-5/8" PDC Bit
All these corers are rotary coring systems with a wireline-retrievable mechanism. The inner barrel consists
of an autoclave to contain the core, and a pressure regulator with accumulated nitrogen gas (Figure 1).
When pulling the inner barrel out using a wireline, the autoclave retracts and the ball valve at the bottom of
the inner barrel closes. Then the autoclave is pressurized to the set pressure that is ideally above the
predicted bottomhole pressure.
Fig.1 Conceptual diagram showing operation of PTCS and HPTC III
Hybrid PCS was designed for use with general 5 or 5.5 inch drill pipes, considering compatibility with
other coring systems used on the drilling vessel Chikyu, such as HPCS (Hydraulic Piston Coring System)
and ESCS (Extended Shoe Coring System). Due to this compatibility, the diameter of the inner barrel
became smaller than that of PTCS, therefore the design around the ball valve was changed.
On the other hand, the HPTC III is a modified version of PTCS that can be used with PCATS. Therefore,
the ball valve design of HPTC III is similar to that of PTCS. In addition, the tool uses the same outer barrel
assembly (with the exception of the core bit) and drill pipes. The pressure rating of the autoclave was
increased to 5,000 psi and the core diameter was reduced so that the autoclave can fit PCATS.

Comprehensive Report of Phase 2 & 3 Research Results
MH21 Research Consortium Ⅴ‐3
② Pressure Core Sampling
In July 2012, the year before the first production test, pressure cores were taken from the sand-mud
alternate layers containing MH in the Daini Atsumi Knoll area. In the coring well AT1-C, a total of 60m
was cored using ESCS and Hybrid PCS. For Hybrid PCS, 18 cores with a total length of 35m were
extracted from a 51m section. Among the cores recovered on the ship, eight had over 12MPa, four had over
5.5MPa, and six had less pressure retention [2]. As a result, the core recovery rate was 69%, and the
pressure holding success rate over 12 MPa was 44%.
In March-April 2018, coring with HPTC III was performed in Wells AT1-CW1 and AT1-CW2 in the
supplemental data acquisition operation of the second production test (Table 2). A total of 49 cores were
obtained by drilling a 127.9 m section in two wells, with a total core length of 96.4 m. The pressure of the
autoclave at the on-board check was higher than the expected bottomhole pressure (approximately 13 MPa)
for 46 cores, and for three cores it was low with pressure between 5-10 MPa. Fig. 2 shows an example of
the temperature and pressure history in the autoclave. These data confirmed that all 49 cores were
recovered onboard while the hydrate-stable condition was maintained. Summarizing the above, the average
core recovery rate was 77%, and the success rate for holding pressure over the bottomhole pressure was
94%.
Table 2 Summary of Results of Pressure Coring in 2018
CW-1 CW-2
Date 2018/4/7 - 4/12 2018/3/30 - 4/4
Depth interval
(below rotary table)
1,280.0m-1,330.9m
1,339.8m-1,350.9m
1,286.5m-1,343.7m
1,356.6m-1,362.7m
Number of cores 24 (20 + 4) 25 (23 + 2)
Number of successful pressure boost
(> bottom hole pressure)
23 23
Total depth interval 61.9m 63.3m
Total length of cores recovered 46.1m 50.3m

Comprehensive Report of Phase 2 & 3 Research Results
MH21 Research Consortium Ⅴ‐4
Fig.2 Example of temperature and pressure during coring

Comprehensive Report of Phase 2 & 3 Research Results
MH21 Research Consortium Ⅴ‐5
(4) Summary and Conclusions
Two different types of pressure corers, Hybrid PCS and HPTC III, were used respectively in the coring
campaigns conducted in 2012 and 2018 in combination with PCATS. In both operations, pressure cores
were taken, analyzed and preserved on board to characterize the in-situ condition of the formation. HPTC
III demonstrated better core recovery rate and successful results in terms of retaining pressure. Although
the inner barrel of HPTC III is not interchangeable with that of conventional non-pressure corers, this tool
may be the best choice at this time for the coring program where only pressure cores are taken.
References
[1] “Pressure Temperature Core Sampler (PTCS)”, Masayuki Kawasaki, Satoru Umezu, Masato Yasuda,
Journal of the Japanese Association for Petroleum Technology, 71 (2006), Issue 1, 139-147.
[2] “A new hybrid pressure-coring system for the drilling vessel Chikyu”, Y. Kubo, Y. Mizuguchi, F.
Inagaki, and K. Yamamoto, Scientific Drilling, Sci. Dril., 17, 37–43, 2014,
www.sci-dril.net/17/37/2014/, doi:10.5194/sd-17-37-2014.
[3] “Data report: Hybrid Pressure Coring System tool review and summary of recovery result from
gas-hydrate related coring in the Nankai Project”, Inada, N. and Yamamoto, K., Marine and Petroleum
Geology, 66 (2015) 323-345.
[4] Overview and introduction: Pressure core-sampling and analyses in the 2012–2013 MH21 offshore test
of gas production from methane hydrates in the Eastern Nankai Trough, Koji Yamamoto, Marine and
Petroleum Geology, 66 (2015), 296-309.
[5] Data report: Hybrid Pressure Coring System tool review and summary of recovery result from
gas-hydrate related coring in the Nankai Project, Norihito Inada, Koji Yamamoto, Marine and
Petroleum Geology, 66 (2015), 323-345.
[6] Physical properties and sedimentological features of hydrate-bearing samples recovered from the first
gas hydrate production test site on Daini-Atsumi Knoll around Eastern Nankai Trough, Kiyofumi
Suzuki, Peter Schultheiss, Yoshihiro Nakatsuka, Takuma Ito, Koji Yamamoto, Marine and Petroleum
Geology, 66 (2015), 346-357.
V.2 Pressure Coring and Analysis Technology (Pressure-core Nondestructive Analysis Tools PNATs)
V.2.1 Introduction
A total analysis system on the methane hydrate sediment cores could be developed to gain an understanding
of the geophysical and geo-mechanical properties of methane hydrate reservoirs. Analyses and studies on
the pressured cores will be carried at AIST Hokkaido Center in Japan. [1]-[4]

Comprehensive Report of Phase 2 & 3 Research Results
MH21 Research Consortium Ⅴ‐6
V.2.2 Pressure-core Nondestructive Analysis Tools (PNATs)
The AIST introduced the Pressure-core Nondestructive Analysis Tools (PNATs), in which the pressure core
is handled without depressurizing the pore pressure until core samples are set up in the tools. The PNATs
can provide essential reservoir parameters such as permeability, hydrate saturation, X-ray CT image,
p-wave response, mechanical properties, and so on, under fully pressurized operation. The following
advanced facility and testing tools can be conducted under fully pressurized operation and provide essential
reservoir parameters as shown in Table 1 and Fig. 1.
Table 1 Pressure-core Nondestructive Analysis Tools (PNATs) and Analysis Item
Under Pressurization Atmospheric
pressure
Analysis
item
Sediment Structure(PNATs-X)
Mechanical properties(PNATs-TACTT)
Permeability (PNATs-TACTT)
Multiple properties ; P-wave/S-wave/Sh
(PNATs-PG/PNATs-AIST IPTC)
MH existence(PNATs-PG)
Grain size
Particle density
Mineral
composition
Gas volume
Hydrate number
Hydrate saturation
Thermal
conductivity

Comprehensive Report of Phase 2 & 3 Research Results
MH21 Research Consortium Ⅴ‐7
Fig.1 Pressure-core nondestructive analysis tools: PNATs
V.2.3 Outline of PNAT’s
At first, we measured the sediment structure X-ray CT images of MH cores under pressurized conditions
using PNATs-X, and provided P-wave velocity and sediment bulk density by the PNATs-PG. Next, we cut
the core including MH, conduct and determine the permeability and geo-mechanical properties using
PNATs-TACTT and PNATs-AIST IPTC. After carrying out depressurization, we sample and measure the
gas and sand particles, etc. Also, short length cores by LN2 treatment are measured for hydration number,
thermal conductivity, etc. We developed the Pressure-Core Nondestructive Analysis Tools (PNATs) to
obtain information about many fundamental properties such as permeability, strength, stiffness,
compressibility, P and S wave velocities, and thermal conductivity from hydrate-bearing pressure core
marine sediments.

Comprehensive Report of Phase 2 & 3 Research Results
MH21 Research Consortium Ⅴ‐8
References
[1] Yoneda, J., Masui, A., Tenma, N., Nagao, J., 2013. Triaxial testing system for pressure core analysis
using image processing technique. Rev. Sci. Instrum. 84, 114503.
[2] Yoneda, J., Masui, A., Konno, Y., Jin, Y., Egawa, K., Kida, M., Ito, T., Nagao, J., Tenma, N., 2015,
Mechanical behavior of hydrate-bearing pressure core sediments visualized under tri-axial compression.
Marine and Petroleum Geology, 66, 451–459.
[3] Jin, Y., Konno, Y., Yoneda, J., Kida, M., Nagao, J., 2016, In situ methane hydrate morphology
investigation: natural gas hydrate-bearing sediment recovered from the Eastern Nankai Trough area.
Energy Fuels 30 (7), 5547–5554.
[4] Yoneda, J., Masui, A., Konno, Y., Jin, Y., Kida, M., Katagiri, J., Nagao, J., Tenma, N., 2017,
Pressure-core-based reservoir characterization for geomechanics: Insights from gas hydrate drilling
during 2012-2013 at the Eastern Nankai Trough, Marine and Petroleum Geology, 86, 1-16.
V.3 Modeling and Numerical Simulation Technology
V.3.1 MH21-HYDRES
(1) Introduction
In order to predict the MH dissociation and gas / water production when applying various production
methods such as depressurization and heating to MH reservoirs, a numerical simulator that can simulate
physical and chemical phenomena specific to MH dissociation / formation behavior is required. However,
no commercial simulator capable of simulating gas production from MH reservoirs has existed until now.
Hence, the Research Consortium for Methane Hydrate Resources in Japan has been developing Japan’s
own production simulator (MH21-HYDRES) designed especially for predicting gas production behaviors
in MH reservoirs.
(2) Outline of MH21-HYDRES
To produce methane from the MH reservoir, it is necessary to dissociate MH in the sediment by adding
external factors from the well and by pumping out the released methane gas from the well.
MH21-HYDRES can simulate various phenomena such as dissociation and formation of MH, fluid flow of
gas and water, and heat conduction in porous media so that the series of processes from MH dissociation to
gas production can be simulated. These phenomena are simulated by numerically solving the governing
equations (mass conservation equations of components and energy conservation equation) in which fluid
pressure, temperature, and the mass of each component are treated as primary unknowns. At this time, the
governing equation is discretized using the finite difference method, and an approximate solution is

Comprehensive Report of Phase 2 & 3 Research Results
MH21 Research Consortium Ⅴ‐9
obtained using the numerical method. The input data required for the simulation are the structure of the
reservoir, the reservoir characteristics at the discretization point, the initial condition, well control condition,
boundary condition, and so on.
Reservoir structure: Depth of each layer, grid system, etc.
Reservoir property: Porosity, absolute permeability, relative permeability, thermal conductivity, etc.
Initial condition: Formation water and MH saturation, salinity, fluid pressure, temperature, etc.
Boundary condition: Fluid and thermal flow and non-flow conditions at reservoir model boundaries
Well control condition: Bottom hole pressure, gas/water production rate, inhibitor injection rate, etc.
(3) Features of MH21-HYDRES
The characteristics of MH21-HYDRES are to be especially designed for use in the development of methane
hydrate resources. The main differences from ordinary reservoir simulators designed for the exploitation of
conventional oil and gas are as follows (Fig.1):
Target phases: Gas, water, methane hydrate, and ice
Target components: Methane, nitrogen, carbon dioxide, water, methanol, and salt
Able to simulate dissociation / formation of methane hydrate and dissolution / formation of ice
based on the equations of kinetics
Able to simulate the exothermic and endothermic behaviors associated with both dissociation /
formation of methane hydrate and dissolution / formation of ice
Able to shift the three-phase equilibration curve of methane hydrate- methane- water (ice)
depending on the concentrations of methanol or salt
Able to modify the solubility of methane into the water phase by taking into account the salinity
concentration
Possible calculations of the mixed hydrate phases of methane, nitrogen and carbon dioxide as well
as methane hydrate
Introducing the effective permeability and relative permeability as a function of methane hydrate
saturation / ice
Able to handle the analyses of the productivity and the production behavior in various basic
production methods and their combinations such as the depressurization, the thermal stimulation,
the thermal flooding, the inhibitor injection, the nitrogen injection, etc.

Comprehensive Report of Phase 2 & 3 Research Results
MH21 Research Consortium Ⅴ‐10
Fig.1 Outline of MH21-HYDRES
(4) Functions of MH21-HYDRES have been improved in Phase 2 and 3
Development of the MH21-HYDRES has progressed to the stage where it can withstand practical use in
Phase 1. Development was also continued in Phase 2 and 3 in response to requests for more advanced
simulations, such as more detailed test behavior prediction and analysis, and development and evaluation of
new production methods. The main functions that were improved in Phase 2 to 3 are as follows:
Model of carbon dioxide hydrate formation and methane production process with nitrogen / carbon
dioxide injection (equilibrium coating model and molecular diffusion model in hydrate)
Calculation routine for electrical heating method
Group control function of multiple wells
Able to handle the optimization method (automatic history matching)
Development of graphical user interface program for input data creation support
Result output corresponding to typical oil and gas reservoir viewer format (Fig. 2)

Comprehensive Report of Phase 2 & 3 Research Results
MH21 Research Consortium Ⅴ‐11
Fig.2 Temperature distribution of 3D model using typical oil and gas reservoir viewer
(5) Achievements of MH21-HYDRES
In the international code comparison project for methane hydrate simulators in Phase 1, MH21-HYDRES
has already exhibited superiority in terms of calculation accuracy and calculation stability.
In addition, MH21-HYDRES also has considerable records that have been used in behavioral prediction,
and test analysis for various actual fields [1-5]. The amount of gas / water production and the dissociation
area of MH predicted by MH-21-HYDRES were extensively utilized for the various objectives before the
first and second offshore production tests as follows,
Selection of production test area
Selection of the production / observation wells’ locations in the test area
Selection of perforation intervals
Design of downhole / onboard equipment
Creation of work guidelines
These simulation results contributed to the success of the first and second offshore production tests in
Japan.
Furthermore, MH21-HYDRES has been used in a wide range of applications such as production behavior
prediction for economic estimation, and examination of new production methods [6-7].

Comprehensive Report of Phase 2 & 3 Research Results
MH21 Research Consortium Ⅴ‐12
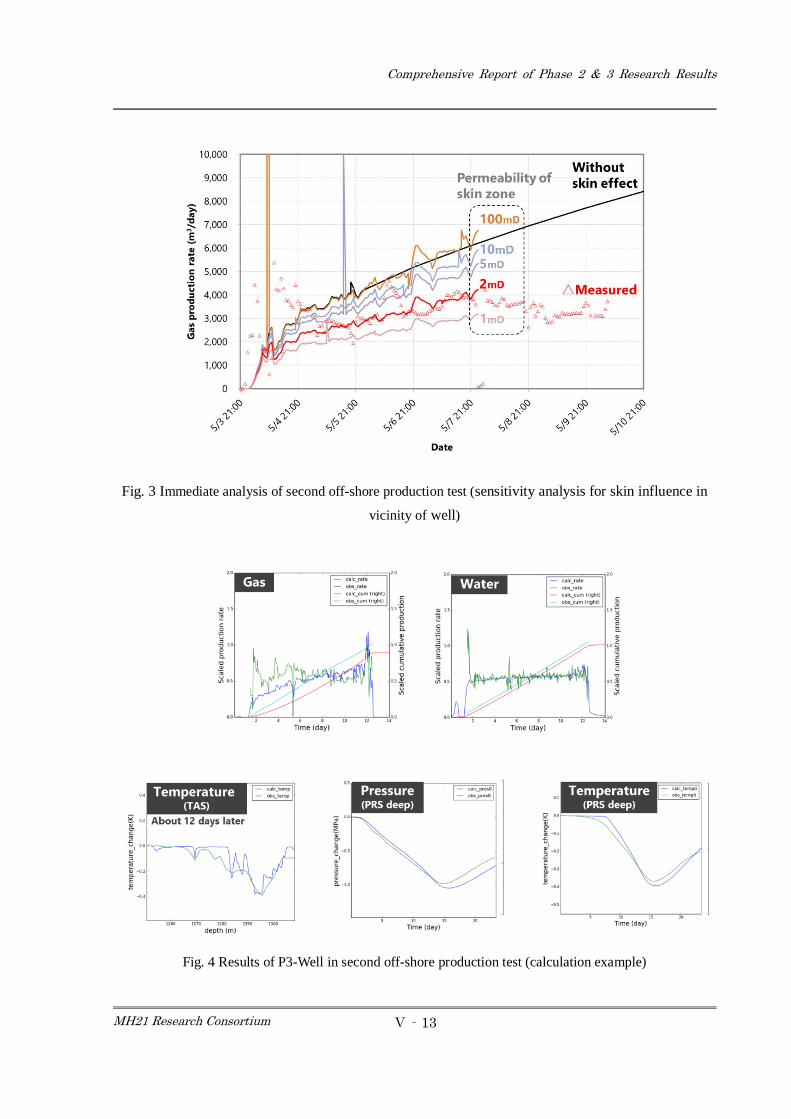
(6) Investigation of the first and second offshore production tests by MH21-HYDRES
In order to investigate the cause of the discrepancy between the prediction results and the actual production
behaviors in the second offshore production test, a quick simulation analysis was conducted assuming
various phenomena by immediately taking the test data during the test (Fig. 3). In addition, MH-HYDRES
was also used for post-analysis of the production test such as “history matching” in which reservoir
parameters are modified to reproduce gas/water production and thermal observation data. The results of the
post-analyses were extensively utilized in various situations such as the elucidation of MH dissociation
behavior and other phenomena in the reservoir when applying the depressurization method on a field scale,
and in a review of the reservoir model (Fig. 4). In addition, throughout the post-analysis of the production
test, it is suggested that the salinity of the formation water depends on formation depth. In order to take into
account the relationship between salinity and depth, a new function for defining tables (depth vs. salinity)
was added to MH21-HYDRES, which contributed to the improvement of the simulator (Fig. 5).
Various factors were understood through the post-analysis. Among those new findings, the following three
items in particular should be considered in detail in the future.
1. It is difficult to reproduce the high gas production rate at a low degree of depressurization observed in
the P2-Well only by considering the effect of the salinity concentration and the influence of the
chemical agent injected into the P2-Well before the production test. (We need to introduce other
assumptions to reproduce the production behavior in the P2-Well.)
2. There is a high possibility that the tendency of absolute permeability and initial effective permeability
in terms of water changes in between P2-Well and P3-Well, which are only about 60 m apart.
3. There is a possibility that the gas and water production behavior of P3-Well and the temperature and
pressure behavior of the monitoring well could be reproduced by assuming the skin formation in the
vicinity of the production well.
Comprehensive Report of Phase 2 & 3 Research Results
MH21 Research Consortium Ⅴ‐13
Fig. 3 Immediate analysis of second off-shore production test (sensitivity analysis for skin influence in
vicinity of well)
Fig. 4 Results of P3-Well in second off-shore production test (calculation example)

Comprehensive Report of Phase 2 & 3 Research Results
MH21 Research Consortium Ⅴ‐14
Fig. 5 Relationship with salinity concentration and depth
(7) Summary and future issues in this section (V.3.1: MH21-HYDRES), the overview of the functions of
MH21-HYDRES, the improvement / enhancement of the functions of the simulator in Phase 2 and Phase 3,
and the application of the simulator to various problems were introduced. In order to deal with complicated
analyses such as those mentioned in (6), further development of the simulator including speeding up of the
calculation and enhancement of the pre-existing functions, is necessary. For example, there is not enough
information to explain the reason why in the current post-analysis of the production test in the P2-Well, gas
production over 10,000 m3/D was observed. (It seems that the three-phase equilibrium curve of
MH-methane-water drastically shifted to the high-pressure region during the P2 production test for some
reason. However, the reason for the shift has not yet been fully clarified.) To explain the cause of the high
gas production rate in the P2 production test, we need to introduce a new reservoir model based on the new
assumption such that an area with extraordinarily high salinity exists adjacent to the P2-Well. However, this
kind of 3D reservoir simulation still requires several days for a single run. We need to keep improving the
calculation speed of MH21-HYDRES to address the complicated problems in the actual field.
In addition, several data obtained in the production tests suggests that the current model constitutive
equation regarding permeability change during MH dissociation may not represent the actual permeability
change in the actual field. It is also necessary to improve these kinds of constitutive equations in
MH21-HYDRES in order to further improve prediction accuracy.

Comprehensive Report of Phase 2 & 3 Research Results
MH21 Research Consortium Ⅴ‐15
References
[1] M. Kurihara, A. Sato, H. Ouchi, Y. Ohbuchi, Y. Masuda, H. Narita, T. Ebinuma, and T. Fujii, 2009:
“Examination on gas producibility from Eastern Nankai Trough methane hydrate resources”, 石油技術
協会誌, Vol. 74, No. 4, pp. 311-324
[2] H. Ouchi, M. Kurihara, A. Sato, Y. Masuda, H. Narita, T. Ebinuma, T. Saeki, T. Fujii, T. Kobayashi, and
N. Shimoda, 2010: “Construction of 3 dimensional methane hydrate reservoir model in Eastern Nankai
Trough and prediction of production test performance”, 石油技術協会誌, Vol. 75, No.1, pp. 72-83
[3] M. Kurihara, A. Sato, K. Funatsu, H. Ouchi, Y. Masuda, H. Narita, and T. Collett, 2011: “Analysis of
formation pressure test results in the Mount Elbert methane hydrate reservoir through numerical
simulation”, Marine and Petroleum Geology, Vol 28, Issue 2, Feb 2011, pp. 502-516
[4] M. Kurihara, A. Sato, K. Funatsu, H. Ouchi, K. Yamamoto, M. Numasawa, T. Ebinuma, H. Narita, Y.
Masuda, S. Dallimore, F. Wright, and D. Ashford, 2010: “Analysis of Production Data for 2007/2008
Mallik Gas Hydrate Production Tests in Canada”, SPE International Oil and Gas Conference and
Exhibition in China, 8-10 June, Beijing, China, SPE 132155
[5] Y. Konno, T. Fujii, A. Sato, K. Akamine, M. Naiki, Y. Masuda, K. Yamamoto, and J. Nagao, 2017: “Key
Findings of the World's First Offshore Methane Hydrate Production Test off the Coast of Japan: Toward
Future Commercial Production”, Energy & Fuels, Vol. 31, No.3, pp. 2607-2616
[6] Y. Konno, Y. Masuda, Y. Hariguchi, M. Kurihara, and H. Ouchi, 2010: “Key Factors for
Depressurization-Induced Gas Production from Oceanic Methane Hydrates”, Energy Fuels 24, pp.
1736-1744
[7] Y. Konno, Y. Masuda, K. Akamine, M. Naiki, and J. Nagao, 2016: “Sustainable gas production from
methane hydrate reservoirs by the cyclic depressurization method”, Energy Conversion and Management,
Vol. 108, pp. 439-445
V.3.2 COTHMA
(1) Summary
Depressurization is considered an effective method for producing methane gas from a methane hydrate
layer. Because of large pressure drops produced by depressurization in the earth’s sediment,
depressurization is estimated to have various effects including a change in consolidation of a well’s vicinity
when producing methane hydrate. In addition, the process of producing gas from methane hydrate layers
involves dissociating the solid methane hydrate in the sediment and transforming its state into water and
methane gas. This causes the strength of the layers to degrade, which in turn produces deformations in the
sediment. Therefore, we predict the deformations and stress states of the sediment during methane hydrate
production and developed a coupled thermo-hydro-mechanical analysis (COTHMA) sediment deformation
simulator that simulates dissociation and formation of methane hydrate in the deformation of multiphase

Comprehensive Report of Phase 2 & 3 Research Results
MH21 Research Consortium Ⅴ‐16
porous media [1]. COTHMA uses a finite element method complete with thermal conduction based on
changes in temperature derived from the dissociation and formation of methane hydrate (in addition to its
stress/deformation) and osmotic flow derived from the change in water pressure. The purpose is to evaluate
the impact on the soundness of a well.
The simulator allows one- to three-dimensional (3D) analysis including two-dimensional (2D) plane strains,
2D cylindrical coordinate systems, and 3D Cartesian coordinate systems. We also achieve high precision by
successively adding constitutive equations of a stress-strain relationship based on recent findings and
repeated tests through functional enhancements and results of in-house experiments.
(2) Functions and Features of Sediment Deformation Simulator
With COTHMA, we were able to handle methods of gas production using the methods of depressurization,
well-heating, and hot-water circulation, as well as heterogeneous gas injection methods. In addition,
through analysis, we could consider changes in the phase states and physical properties listed as follows.
Change of phase states through dissociation/regeneration of methane hydrate and generation/melting of
ice
Deformation in the sediment layer and change in strength characteristics due to phase changes
Change in the permeability of sediment layer due to phase changes and consolidation.
In addition, we could fix the displacement, pressure, and temperature or change it with time based on the
boundary value problem. We could assign the load, flow rates (of gas and liquid phases), and rate of heat
flow for the nodes and elements. The predicted deformation in the sediment was proposed in relation to
COTHMA’s simulator, which is necessary for evaluating the well’s soundness. Because the stress-strain
relationship of the methane hydrate layer and the well’s materials dominate the results of the evaluation, we
introduced various constitutive equations that reflect the mechanical test results in order to achieve a high
level of precision with the simulator. All constitutive equations of a methane hydrate layer allow effects to
be considered due to methane hydrate’s saturation factor, and they are compatible with the following
models: a linear model that considers the confining pressure dependence, a model that considers
post-breakage non-linear characteristics, a time-dependent non-linear model, and an elastoplastic model
that considers plastic deformation. In addition, we introduce an elastoplastic model that can predict the
necessary plastic strain after the soundness of the well’s metal and cement materials is evaluated. Table 1
shows the constitutive equations introduced in the simulator.

Comprehensive Report of Phase 2 & 3 Research Results
MH21 Research Consortium Ⅴ‐17
Table 1 Constitutive Equations Introduced in the simulator
Constitutive Equations Soil Material1) Cement Metal
Elastic Model Linear Model
Confining Pressure-Dependent Linear
Model
Linear Model
Linear Model
Elastoplastic Model
Modified Sekiguchi-Ota Model
Son-Matsuoka Model
Mohr-Coulomb Model
Drucker-Prager Model
Mohr-Coulomb
Model
Drucker-Prager
Model
Tresca Model
von Mises Model
Non-Linear Model
Duncan-Chang Model Modified Duncan-Chang Model
Composite Geomaterial Model
Viscoelasticity Variable-Compliance
Model
Non-Linear Model2) Bilinear Contact Surface Model
Variable-Compliance Contact Surface Model
1) We consider the dependency for the constitutive equations and methane hydrate’s saturation factor for soil material
2) Constitutive equation for the joint element
(3) Verification and Results of Simulator
Due to the development of a component in COTHMA used to verify the mechanical test results of core
specimens that include methane gas, the simulator could accurately represent the behaviors of methane
hydrate-inclusive sediment deformation (Fig. 1). In addition, we improved the simulator’s accuracy by
installing mechanical testing equipment capable of testing in a high-pressure-maintained state and that
achieved greater mechanical parameter precision and optimized constitutive equations based on the test
results.
Furthermore, to achieve a higher level of accuracy of the well’s model when evaluating its soundness, we
performed detailed modeling based on the on-site well as well as indoor model testing to obtain the strength
of the contact surface between the sediment (sand or mud layer) and casing or cement. For example,
regarding the strength of the contact surface between the casing and cement, we derived an empirical
formula that uses the effective confining pressure as a parameter [2].

Comprehensive Report of Phase 2 & 3 Research Results
MH21 Research Consortium Ⅴ‐18
Fig.1 Reproduction analysis of depressurized gas production tests using large indoor testing equipment.
These results were assessed through an analysis that uses a numerical ground model formulated based on
the ground information of offshore production testing sites. For example, Fig. 2 shows a sample analysis of
sediment deformation and the stress states of the well’s surroundings during the first offshore production
test. According to analytical results, sediment deformation, which is primarily caused by the consolidation
deformation in conjunction with methane hydrate dissociation and increased effective stress, occurs mainly
in the depressurized section.
(4) Simulator Acceleration
The simulator operates with Windows and Linux operating systems, where the Linux version features a
PETSc solver with parallel computing capabilities. When compared to the direct method and calculation
speed with a model of 20,000 nodes, the simulator achieves an acceleration of two times, and more than
100 times for 2D and 3D analyses, respectively.
(5) User Interface Development
We attempted to optimize the analysis processes by developing a postprocessor that postprocesses the
results of the analysis as well as a preprocessor that supports the creation of COTHMA’s input data. In
addition, we created a graphical user interface screen for these preprocessors, which makes the simulator
more user-friendly.
(6) Conclusion
We described the essential features and functions of the COTHMA sediment deformation simulator. In
addition, we produced enhancements such as a user interface, and we improved various functions while

Comprehensive Report of Phase 2 & 3 Research Results
MH21 Research Consortium Ⅴ‐19
attempting to achieve increased simulator reliability based on the results of on-site testing. Long-term
wide-area verification through an actual implementation as well as improved precision to the sediment
deformation simulator are needed.
【Analysis Conditions 】
Initial Conditions
- Pore pressure within sedimentary layer: Considering water
pressure and gas pressure
- Effective stress: Calculated based on effective load of sedimentary
layer
- Initial temperature: Measured value - Initial gas saturation
rate: 0.0
Boundary value problem
- Seabed: Constant pressure, constant temperature
- Underside boundary: Fixed vertical displacement, constant
pressure, constant temperature
- Axis of symmetry boundary (well wall surface portion):
Impermeable, insulation
- Axis of symmetry boundary (past the base of the well): Fixed
horizontal displacement, impermeable, insulation
- Depressurized boundary: Constant pressure
- Right-side boundary: Constant pressure, constant temperature,
fixed horizontal displacement
Constitutive equations
- Sediment: Modified methane hydrate-dependent Sekiguchi-Ota
elastoplastic model
Reservoir Model
- Case A: Reservoir Model 1222 - Case B: Reservoir Model 1122
【Vertical Displacement (Reservoir Case 1122)】
-1000m
-
1100m
-1200m
-1300m
-1400m
0.5day 2days
Displacement(m)
4days 6days
Stress(MPa)
+: Tension
【Analysis Model】
【 Vertical Displacement and BHP of Seabed Directly
Above Bottom hole】
【Direct Stress Distribution of Lead in Well’s Surrounding
Area (Reservoir Case 1122)】
Fig. 2 Analytical conditions and results (displacement, stress distribution) of first offshore production test

Comprehensive Report of Phase 2 & 3 Research Results
MH21 Research Consortium Ⅴ‐20
References
[1] J. Yoneda, A. Takiguchi, T. Ishibashi, A. Yasui, J. Mori, M. Kakumoto, K. Aoki, and N. Tenma、 2018
(accepted): "Mechanical Reaction of Reservoir and Well Completion of the First Offshore Methane
Hydrate Production Test at the Eastern Nankai Trough: A Coupled Thermo-Hydro-Mechanical Analysis,"
SPE J.
[2] M. Kakumoto, J. Yoneda, K. Miyazaki, N. Tenma, K. Aoki, and R. Itoi 2013: “Basic Study on the
Frictional Strength between the Casing and Cement in a Methane Hydrate Production Well,” Journal of
MMIJ, Vol. 129, No. 4, 116–123
Ⅴ.3.3 Geomechanics-related Studies
The in-situ MH dissociation that takes place through depressurization is an event involving large degrees
of pressure and effective stress, and may cause several types of mechanical phenomenon. Fig. 1 depicts
examples of drilling, gas production, and safety issues. To predict the phenomenon and reduce any kinds
of risks, gathering and analyses of data related to the mechanical conditions in formations should be
combined with modeling techniques.
In the case of an MH study, a specific point is that the formation is basically unconsolidated, and that
mechanical parameters depend on the state of MH in formation pores, and consequently, data acquisition
and modeling techniques should take these facts into account. In the MH21 consortium study, various
geomechanics-related studies have been conducted from many different viewpoints. In this section, a
number of examples are described.
(1) Information About Geomechanical Conditions and Their modeling
① Stress Evaluation
To determine six components of the stress tensor, it is necessary to combine several techniques, however,
the applicability of some technologies has not been proven in MH-bearing unconsolidated sediment.
During the first offshore production test, ASR (Anelastic Strain Recovery) method was applied with
Diametrical Core. Deformation Analysis (DCDA) to the extracted core samples (Nagano et al., 2015),
along with the image log-based borehole breakout method. The result revealed that the maximum
horizontal stress direction in the Daini Atsumi area varied among boreholes, however, the difference
between maximum and minimum horizontal stresses was small, and the stress regime was the normal
fault type. The obtained result matches the analysis result of log-derived analysis gathered during Phase
1 (Yamamoto et al., 2006) (Fig. 2).

Comprehensive Report of Phase 2 & 3 Research Results
MH21 Research Consortium Ⅴ‐21
② One Dimensional Mechanical Earth Model (1D MEM)
Log-core correlation-based 1D MEM modeling was performed based on the data of each drilled
borehole. In the studies conducted during phase 2 and 3, the procedure to determine the parameters for
Modified Cam-Clay (MCC) model (the pre-consolidation pressure, Pc0; the hardening parameter, ; the
slope of the swelling line, ; the slope of the critical state line, M) was developed in order to create an
appropriate model for unconsolidated sediments. To determine six components of the stress tensor, it is
necessary to combine several techniques, however, the applicability of some technologies have not been
proven in MH-bearing unconsolidated sediment.
Fig. 3 indicates the developed 1D MEM for AT1-P2 and P3 with results of break-out analysis using the
1D MEM in comparison with actual measurements of hole diameter. The analysis results have a
reasonable match with the real hole-enlargement situation in which a large degree of the enlargement
was measured in AT1-P2.
③ Three Dimensional Mechanical Earth Model (3D MEM)
Regarding information to evaluate the heterogeneity of physical parameters in three-dimensional spaces,
only seismic data is available and the resolution is 25 m. To create a numerical grid for the
geomechanical simulation that requires a few centimeters to meters of resolution from low resolution
seismic data, a downscaling technique is necessary. In this study, an application of Bayesian
optimization was attempted using the following steps.
The relationship between the mechanical properties and measurable logging parameters such as MH/gas
saturation, overburden stress, porosity, clay contents, etc. are determined by the equations in the
previous part.
A linear relationship between the seismic velocity (Vp) and log-derived parameters (values to be
calculated, such as hydrate fraction, stothyd; gas fraction, stot
gas; porosity ; effective stress, pe; clay
content vcl) is assumed with weights on each parameters cn., as follows:
Vp=co+c1stothyd+c2+c3pe+c4vcl+c5s
totgas
A relationship between the seismic velocity vector (a0, known value) on the seismic grid (resolution is
25m) and log-derived physical parameter vector on the numerical analysis grid (resolution of a few
meters) is written as an observation equation: 0Am e a
where e is an error vector to be minimized (Fig. 4).
In the model, the physical and seismic properties on the trajectory of the boreholes are also applied to
the known and unknown vectors. The Bayesian optimization procedure is used to minimize the error
vector e under the restriction of some prior information (Tarantola, 1987).
Some three-dimensional mechanical simulations have been conducted to analyze the possible

Comprehensive Report of Phase 2 & 3 Research Results
MH21 Research Consortium Ⅴ‐22
operational and environmental risks of the planned offshore production test. Figs. 5 and 6 show
analysis results of the MH dissociation effect on the fault activation at a test candidate site (not Daini
Atsumi) (Qiu et al., 2012) and estimated stress conditions in the vicinity of the wellbore in the Daini
Atsumi Knoll.
This work has been conducted in collaboration with Schlumberger.
(2) Constitutive Modeling of MH-bearing Soil and its Upscaling Procedure
A critical state soil mechanics model based on the modified Cam-Clay model was developed (Uchida et al.,
2012) with a team from the University of Cambridge to include the effects of MH in pore spaces on
mechanical behaviors.
To model the finely laminated turbidite sediments with large grid size, an upscaling procedure
incorporating a homogenization technique is applied using transverse isotropy of MCC (Wheeler, 2003;
Wongsaroj, 2006) and applied to the constitutive model. Furthermore, a homogenization procedure of
hydraulic and thermal properties were developed (Zhou et al., 2018a). During the homogenization
procedure, 10 parameters in the model are gradually optimized through the comparison of large grid mode
with fine grid models with different conditions (homogeneous/heterogeneous host material and
homogeneous/heterogeneous MH distribution, and different stress states, Fig. 7).
Fig. 8 shows how the stress passes in the formation during the depressurization and MH dissociation
processes around a borehole, and the horizontal contraction of the sediment and large shear strain in the
early stage, isotropic compression during the dissociation stage, and compaction of the reservoir in the post
dissociation stage were calculated (Zhou et al., 2018b).
(3) Effects of Drilling Operation
In many borehole stability studies, the stress condition changes that occur during drilling operations have
been ignored. However, the effects cannot be ignored in the case of MH in weak sediments. In particular,
the effects of cementing operations including water absorption/hydration processes and contraction of
cement as well as hydration heat effect should not be considered negligible. Such effects have been studied
using actual data of cement used for the offshore production tests (Sasaki, et al., 2018a). The detailed
drilling process was also modeled (Sasaki, et al., 2018b) and the occurrence of the plastic strain during the
drilling operation and significant stress alternation during the cement hydration process were calculated
(Fig. 9). This work was also carried out with collaboration from The University of Cambridge and the
University of California, Berkeley.
(4) Sand Production Modeling
Sand production is a relatively common obstacle involved in gas production from MH in unconsolidated
formations. The basic idea of sand production in the oil industry is based on the brittle failure of the rock
around borehole and perforation tunnels based on the theory of elasticity. However, sand production in the

Comprehensive Report of Phase 2 & 3 Research Results
MH21 Research Consortium Ⅴ‐23
MH reservoir must have a different mechanism due to the soft and weak nature of the host sediments.
Based on the developed MCC model, the occurrence of movable solids (detachment) and transport of solids
with fluid are modeled with Technion and the Rensselaer Polytechnic Institute (Uchida et al., 2016a). The
model assumes that the sand detachment can happen when hydraulic gradient exceed a defined critical
value (icrt) and the volume of the sand is related to the shear strain (d).
History matching was carried out as part of the sand production event of the first production test (Uchida et
al., 2016b) and the produced volume and occurring intervals closely matched the observation (Fig. 10).
(5) MICP (microbiologically induced calcite precipitation) Application For Sand Control
One possible method of mitigating the risk of sand production is soil solidification. However, industrially
available technologies have been developed for deep and high temperature conditions and are not
applicable to cold (< 15 deg C) shallow water sediments. If the biological techniques, MICP-using
indigenous species, is applicable, relatively cheap application may be possible. Another advantage is that
the extent of the solidified zone can be large due to relatively slow reaction time, and permeability can be
controllable. This is an important feature because the permeability of the production zone should be kept
high in the production zone, but it should be reduced to seal the water producing interval.
With the collaboration of the University of Cambridge and Toyama Prefectural University, a number of
studies including about the effectiveness of current technologies using aerobic species in anaerobic
conditions below deepwater (Jiang et al.,2016), evaluation of sand control effects using techniques based
on laboratory studies (Jiang et al., 2018) (Fig. 11) were carried out. Evaluation of the indigenous species
using core samples taken in the offshore production test site have been conducted using 2012 and 2018
pressure cores. Test results have shown positive results and some useful species have been discovered in
the taken samples (Fig. 12).
(6) Observation of Sand Production Processes by X-ray CT
How to visualize sand production behind the wellbore surface is an important research subject that will
support understanding of the mechanism of the phenomena. JOGMEC and Tohoku University have jointly
attempted real-time observation of the sand production process using an X-ray CT device and a carbon
fiber-reinforced pressure vessel (Ito, 2016).
The following studies have been carried out:
1) Establishment of the study procedure and devices
2) Observation of the formation structure change due to sand production
3) Analysis on the relationship between the screen opening and sand production
4) Evaluation of the shape memory polymer (GeoFORM™) for Nankai Sand
5) Evaluation of the effect of gas in fluid on the sand production
The test device used is shown in Fig. 13, and an example of a typical sand production process and sample
observed by X-ray CT are shown in Fig. 14. An important discovery was that a sand structure with high

Comprehensive Report of Phase 2 & 3 Research Results
MH21 Research Consortium Ⅴ‐24
permeability streaks (an onion-like structure) can be created around the perforation and stabilize the
sanding, perhaps due to the reduction of pressure gradient there. (Fig. 15)
(7) Risk Analysis of Seafloor Instability
Dissociation of MH in the subsea sediment leads to the reduction of formation strength. Pressure and
buoyancy generated by the generated gas may lead to effective stress reduction. Combining these effects
may increase the risk of seafloor instability and subsequent landslides.
The test site of the first and second offshore production tests in the Daini Atsumi Knoll located under the
mass transport materials. Relatively large landslide scars are observed in the west of the test site (Fig. 16).
In addition, the site is close to the epicenter of the anticipated Tonankai Earthquake (Mw > 8). Even though
the landslide is not an artificial cause, it may damage subsea devices and test platforms, thus a risk analysis
of both artificial and natural reasons was conducted with collaboration from Norwegian Geotechnics
Institute (NGI), an organization that participated in the risk analysis of the Storegga slide and Ormen Lange
gas field.
The study was carried out in three steps (Kvalstad, 2010):
1) Risk by natural causes by subsea topography and earthquakes (Fig. 17)
2) Effects of the MH dissociation (Fig. 18)
3) Tsunami analysis caused by the worst case scenario
The result suggested that the factor of safety (FoS) in some steep locations at the headwall of the slide scars
is less than 1, and the assumed combination of the Tokai, Tonankai, and Nankai earthquakes may have
caused large plastic strains to occur at shallow depths below the seafloor, however, the effects of MH
dissociation in the offshore production test scale is minor because the MH reservoir exists around 300 m
below the seafloor, which is far deeper than possible slide planes.
(8) Conclusions and Way Forward
During Phase 2 and 3 studies, data acquisition and analyses, and development of the 1/3D mechanical earth
model, and numerical simulation studies were carried out mainly for the offshore test site. Currently, few
real mechanical response data are available, and it is difficult to verify the results of modeling studies.
In the next stage, it will be necessary to combine the study with mechanical testing of core samples, and
data acquisition in the reservoir using strain measurement, etc. for more integrated studies to evaluate the
mechanical effects on gas production and safety.

Comprehensive Report of Phase 2 & 3 Research Results
MH21 Research Consortium Ⅴ‐25
Aquifer
MHCZ
Seafloor instability
Sea current force on
riser and borehole
Seafloor
subsidence
Sand productionCompaction around borehole
Seafloor deformation
monitoring devices
Monitoring well
Monitoringfrom surface
Downhole devices
Water inflow
Well/cementintegrity issues
Temperaturemeasurement
Fault/fracturereactivation
Fig. 1 Possible Geomechanics-related issues under MH dissociation conditions.
(MHCZ: methane hydrate concentrated-zone)

Comprehensive Report of Phase 2 & 3 Research Results
MH21 Research Consortium Ⅴ‐26
#X Stress and Pore Pressure Information
1
1.05
1.1
1.15
1.2
1.25
1.3
1.35
1.4
1050
Depth (m-BRT)
Equ
ival
ent
mud
weig
ht
(Spe
cific
Gra
vity
)
-25
-20
-15
-10
-5
0
5
10
15
Pp (SG)
Sv (SG)
Sh (SG) by Eaton Equation
Sh (SG) K0=0.7
Sh (SG) K0=0.5
EMW of CHDT ClosurePressure
EMW of CHDT PropagationPressure
EMW of CHDT FormationPressure
Critical Sh φ=30deg
Shmin by DSI Anisotropy
SHmax by DSI Anisotropy
Shmin by Borehole Break-out
Shmin by Borehole Break-out
Resistivity
Fig. 2 Log (breakout direction) -derived maximum stress orientation (Top, Yamamoto et al., 2006)
and stress gradient data in the Daini Atsumi borehole (middle) and ASR derived stress direction and
anisotropy by ASR from pressure core samples (bottom, Nagano et al., 2015)
海産試験試験地
海産試験試験地

Comprehensive Report of Phase 2 & 3 Research Results
MH21 Research Consortium Ⅴ‐27
Fig. 3 1D MEM of AT1-P2/P3 wells and breakout results with actual hole enlargement data.
Fig. 4 The process of Bayesian optimization-based downscaling. m is a vector of unknown values
(petro-physical parameters) and a0 is the seismic velocity vector. Covariant matrix CD is defined using
distribution of seismic velocity. Some prior knowledge and physical limitations of the petro-physical
parameters are considered in the prior probability of m.

Comprehensive Report of Phase 2 & 3 Research Results
MH21 Research Consortium Ⅴ‐28
Fig. 5 An example of 3D geomechanical simulation result. Distribution of cohesion c (top-left),
delineated faults (top-right) and of the effect of MH dissociation on fault (distribution of the volumetric
strain) in a test site candidate (not Daini Atsumi). MH dissociation region was calculated by using
a MH21-HYDRES simulator.
Fig. 6 Estimated effective stress distribution during the production test in the Daini Atsumi area (left)
and AT1-P3 well (right).

Comprehensive Report of Phase 2 & 3 Research Results
MH21 Research Consortium Ⅴ‐29
Fig. 7 Schematic flow of the process of homogenization (top) and yield surfaces of the homogeneous
(bottom left), MH-bearing (bottom center), and MH dissociated (bottom right) medium.

Comprehensive Report of Phase 2 & 3 Research Results
MH21 Research Consortium Ⅴ‐30
Fig. 8 Calculated stress state in the MHCZ and overburden/underburden zones (left) and stress and
strain changes at some locations (Zhou et al., 2018b).
Fig. 9 Left: Model of the drilling stages (a: drilling, b: run casing, c: cementing, d: cement hydration,
e: applying casing weight). Right: a: effective vertical stress, b: effective circumferential stress,
d: pore pressure, e: deviatoric plastic strain of each stage.

Comprehensive Report of Phase 2 & 3 Research Results
MH21 Research Consortium Ⅴ‐31
Fig. 10 History matching results of the gas, water and sand production volume of the first offshore
production test (2013) using property data gathered from testing in the Eastern Nankai Trough. In the
model, sand was produced continuously, however, during actual drilling, produced sand was trapped
behind the screen and did not flow into the hole. Estimated sand production zone matches
the observed sand produced interval (Yamamoto et al., 2017)
Gas saturation Change in intact solid volume
Actual sand product ion zone

Comprehensive Report of Phase 2 & 3 Research Results
MH21 Research Consortium Ⅴ‐32
(1) MICP test device
(2) Samples with different MICP treatment and hydraulic gradient distribution.
Fig. 11 MICP evaluation test device and test result that showed that the hydraulic condition change
was relatively small in MICP treated specimens (Jiang et al., 2018).

Comprehensive Report of Phase 2 & 3 Research Results
MH21 Research Consortium Ⅴ‐33
Fig. 12 Ammonium ion concentration (indication of urease active species) and calcite precipitation during
cultivation done for pressure core samples (2018). The results indicate the existence of useful species and
the effectiveness of MICP activities.
Cultivation time (day)
CaC
O3
pre
cip
itatio
n (%
)
mg/L
)
NH
4+ co
nce
ntra
tion
(mg/L
)
mg/L
)
Cultivation time (day)

Comprehensive Report of Phase 2 & 3 Research Results
MH21 Research Consortium Ⅴ‐34
Pressure for axial
compression
f200
Water inlet
X-ray path
150
Specimen
(move)
Stud bolts (CFRP)
Flange Flange
Cylindrical vessel (CFRP)
Flow distributor(fine & coarse screen)
Piston(POM)
Piston(POM)
Water & sandoutlet
X-ray path
Screen
Fig. 13 Sand production test device used in X-ray CT
T10
0
20
40
60
80
100
120
0
0.5
1
1.5
2
2.5
3
3.5
0 200 400 600 800 1000 1200 1400 1600 1800 2000
Wei
ght
[g]
Flo
w r
ate
[cc/
min
]
Pre
ssu
re [M
Pa]
Time [s]
0.13g/s
0.04g/s
Axial pressure
Injection flow rate
Weight of produced
sand
Injection pressure
T5
T8
T10T15
T22 T28
T7
Injection time
for previous test
The
ON
ION
stru
ctu
re g
rew
wit
h t
ime
an
d s
and
pro
du
ctio
n
T5
T8
T22 T28T15
T7
The ONION structure became stable, while sand production tended to cease
Screen of 460 m m opening
ONION structure
Flow
Fig. 14 A typical sand production test result (injection rate, pressure and sand weight and CT images of
each step

Comprehensive Report of Phase 2 & 3 Research Results
MH21 Research Consortium Ⅴ‐35
Screen
Large velocity → Large sand production
Sand density decreases nearby
screen with sand production
Fluid flow
A mass shifts to right and
a gap is formed
The same thing is
occurring repeatedly
(a) Assumed process of the “onion” structure formation
(b) Expected change in fluid flow velocity in sand matrix which will reduce sand production
Before After
Small velocity → Small sand production
a1 a2 a3 a4
b1 b2
Fig. 15 Interpreted mechanism of sand stabilization
Fig. 16 Seismic cross section and bathymetry image of land slide scar area in the west of
the offshore production test.

Comprehensive Report of Phase 2 & 3 Research Results
MH21 Research Consortium Ⅴ‐36
Fig. 17 Evaluation of the effect of the anticipated earthquake on the stability of shallow formation.
0
0.1
0.2
0.3
0.4
0.5
0 500 1000 1500 2000 2500 3000
Re
du
ctio
n in
Fo
S, %
Radius of circle, m
B/L = 0.5 15% 50
B/L = 1.0 15% 50
B/L = 2.0 15% 50
Spherical cap 50
0
2
4
6
8
10
12
0 500 1000 1500 2000 2500 3000
Fact
or
of
safe
ty
Radius of circle or sphere, m
B/L = 0.5
B/L = 1.0
B/L = 2.0
Spherical cap
Infinite slope
b
Change of Factor of safety by gas hydrate
dissociation (50% reduction of shear
strength). (FoS: 2.372→2.183)Relationship between slide types
(spherical and cylindrical), scales
of the slide and FoS reduction.
Fig. 18 Effect of MH dissociation (width=280m) on the factor of safety (FoS). Reduction of FoS is
small under the small scale dissociation scenario.

Comprehensive Report of Phase 2 & 3 Research Results
MH21 Research Consortium Ⅴ‐37
References
Nagano, Y., Lin, W., Yamamoto, K. (2015): In-situ stress analysis using the anelastic strain recovery (ASR) method at the
first offshore gas production test site in the eastern Nankai Trough, Japan, Marine and Petroleum Geology, 66, Part 2,
418-424.
Yamamoto, K., Murray, D., Khong C.-K., Yasuda, M. & Nakamizu, M. 2006. Geomechanics data acquisition techniques
used in the METI Tokai-oki to Kumano-nada drilling campaign, the 12 th Formation Evaluation Symposium of Japan.
Tarantola, A., Tarantola, A., 1987, Inverse problem theory; methods for data fitting and model parameter estimation, Elsevier
(1987)
Qiu, K., Yamamoto, K., Birchwood, R.A., Chen Y.-R., Wu, C., Tan, C.-P. & Singh, V. 2012. Evaluation of Fault
Re-activation Potential during Offshore Methane Hydrate Production in Nankai Trough, Japan, OTC-22890-MS,
Offshore Technology Conference, Houston, Texas, USA, 30 April-3 May, 2012.
Uchida, S., et al. (2012) J. Geophys. Res.: Solid Earth (1978–2012), 117(B3).
Wheeler, S. J., et al., (2003). Canadian Geotechnical Journal, 40(2):403–418.
Wongsaroj, J. (2006). PhD thesis, University of Cambridge.
Zhou M, Soga K., Yamamoto K. (2018a), Upscaled Anisotropic Methane Hydrate Critical State Model for Turbidite
Hydrate‐Bearing Sediments at East Nankai Trough, JGR Solid Earth, 30 July 2018,
https://doi.org/10.1029/2018JB015653
Zhou, M., Soga, K., Yamamoto,K. Huang, H. (2018b), Geomechanical responses during depressurization of hydrate-bearing
sediment formation over a long methane gas production period. Geomech. Energy Env. In press,
https://doi.org/10.1016/j.gete.2018.12.002.
Sasaki, T., Soga, K., Abuhaikal, M. 2018a: Simulation of wellbore construction in offshore unconsolidated methane
hydrate-bearing formation, J. Petrol.Sci. Eng., 169, 205–219.
Sasaki, T., Soga, K., Elshafie, M.Z.E.B 2018b: Water absorption and shrinkage behaviour of early-age cement in wellbore
annulus, J. Natural Gas Sci. Eng., 60 (2018) 312–326.
Uchida, S, Klar, A, Yamamoto, K (2016a): Sand production model in gas hydrate-bearing sediments,
International Journal of Rock Mechanics and Mining Sciences 86:303-316: DOI:
10.1016/j.ijrmms.2016.04.009
Uchida, S., Klar, A. and Yamamoto, K. (2016b): Sand production modeling of the 2013 Nankai offshore
gas production test. In: F. Wuttke, S. Bauer & M. Sanchez (eds.) 1st International Conference on
Energy Geotechnics, 29-31 August, Kiel, Germany. 451-458.
Jiang, N..-J., Soga, K., Yoshioka, H., Yamamoto, K. (2016): Ureolytic activities of a urease-producing
bacterium and purified urease enzyme in the anoxic condition: Implication for subseafloor sand
production control by microbially induced carbonate precipitation (MICP) , Ecological Engineering,
90, 96-104.
Jiang, N..-J., Soga, H., Yamamoto, K. (2018): A High-Pressure Plane-Strain Testing System to Evaluate
Microbially Induced Calcite Precipitation as a Sand Production Control Method, GeoShanghai 2018
International Conference: Geoenvironment and Geohazard, May 27-30, Shanghai, China.

Comprehensive Report of Phase 2 & 3 Research Results
MH21 Research Consortium Ⅴ‐38
Ito, T. and Nagano, Y., Laboratory Study of Sand Production in Unconsolidated Sands by Using X-ray CT
for Methane Hydrate Development, SPE Workshop“Sand Management Workshop”, Kuala Lumpur,
(2016.4.25-26).
Kvalstad, T.J. (2010): Seafloor stability, International Symposium on Methane Hydrate Resources, MH21
Research Consortium, Tokyo, Japan.