validation of a method for the quantification of cocoa
TRANSCRIPT

Validation of a Method for theQuantification of Cocoa Butter Equivalents in
Cocoa Butter and Plain Chocolate
Report on the Validation Study
Manuela Buchgraber, Elke Anklam
2003 EUR 20777 EN
EUROPEAN COMMISSIONJOINT RESEARCH CENTRE
Institute for Reference Materials and MeasurementsFood Safety and Quality UnitB-2440 Geel (Belgium)
- 2 -
Abstract
A European collaborative study has been conducted to validate an analytical procedure for
the quantification of cocoa butter equivalents in cocoa butter and plain chocolate. In
principle, the fat obtained from plain chocolate according to the Soxhlet principle is
separated by high-resolution gas chromatography into triglyceride fractions according to
their acyl-C-numbers, and within a given number, also according to unsaturation. The
amount of cocoa butter equivalents in cocoa butter is estimated by Partial Least Squares
regression analysis applied to the relative proportions of the five main triglycerides present
in cocoa butter. Fifteen laboratories participated in the validation study. For all test samples
the predicted cocoa butter equivalent amounts were in close agreement with the true
values. The results of the ring test clearly demonstrated that the applied method performs
well at the level of the statutory limit of 5% cocoa butter equivalent addition to chocolate
with a prediction error of 0.4% to 0.6%, assuming a chocolate fat content of 20% to 30%.
Keywords: Cocoa butter, Cocoa butter equivalents, HR-GC, Triglyceride profile, Multilinear
regression analysis, Quantification, Inter-laboratory validation study

- 3 -
CONTENTS
ABSTRACT 2CONTENTS 3LIST OF ABBREVIATIONS 41 RATIONALE – BACKGROUND 52 OBJECTIVE 63 METHOD DESCRIPTION 64 PARTICIPANTS 84.1 Co-ordination of the validation study 84.2 Preparation and distributing of the test samples 84.3 Homogeneity tests 84.4 Measurements 84.5 Collation and statistical evaluation of results 9
5 TEST SAMPLES 95.1 Homogeneity study 10
6 THE VALIDATION STUDY 106.1 Design of the validation study 106.2 Analysis of test samples 116.3 Technical evaluation of the results submitted 116.4 Statistical evaluation of the results submitted 11
7 RESULTS 138 CONCLUSIONS 159 LITERATURE 16ANNEX A 17

- 4 -
LIST OF ABBREVIATIONS
CB cocoa butter
CBE cocoa butter equivalent
CRM certified reference material
HR-GC high-resolution gas chromatography
PLS Partial Least Squares
PMF palm mid fraction
POO 1,2-dioleoyl-3-palmitoyl-rac-glycerol
POP 1,3-dipalmitoyl-2-oleoylglycerol
POS 1-palmitoyl-2-oleoyl-3-stearoylglycerol
r repeatability
R reproducibility
RSDr repeatability relative standard deviation
RSDR reproducibility relative standard deviation
RMSE root mean square error
SOO 1,2-dioleoyl-3-stearoyl-rac-glycerol
SOS 1,3-distearoyl-2-oleoylglycerol
sr repeatability standard deviation
sR reproducibility standard deviation
TG triglyceride

- 5 -
1 RATIONALE – BACKGROUND
The new European Chocolate Directive 2000/36/EC [1] allows the addition of up to 5% of
vegetable fats other than cocoa butter (CB), the so-called cocoa butter equivalents (CBEs),
to chocolate. Permitted fats derive from palm oil, illipé (borneo tallow or tengkawang), sal,
shea, kokum gurgi, and mango kernel.
Member States’ laws, regulations and administrative provisions need to comply with the
new Chocolate Directive before August 2003. The product label has to provide a correct,
neutral and objective indication of the presence of such substances, and must not mislead
the consumer. On the other hand, the Directive does not preclude the labelling of chocolate
products to indicate that CBEs have not been added (so called ‘negative labelling’).
Unfortunately, the Directive does not cover aspects regarding methods of analysis for law
enforcement. Due to their similarity to genuine CB, CBEs are difficult to detect. For
detection purpose the Institute of Reference Materials and Measurements (IRMM) of the
Joint Research Centre (JRC) has recently elaborated and validated a suitable method [2].
However, the monitoring of wrongful labelling and the protection against fraud requires not
only detection methods for the presence of added CBEs, but also methods that can
achieve a reliable quantification of these fats.
The JRC developed an analytical approach using chemometrics for the prediction of the
CBE amount in cocoa butter and plain chocolate [3]. To this end, the triglyceride
composition of a range of genuine cocoa butter samples as well as raw materials for CBE
production and formulated CBEs was determined by using a gas chromatography capillary
column coated with a medium polarity stationary phase. In order to ensure high accuracy a
reference material certified for its triglyceride composition (IRMM-801) was used for
calibration purpose. By using this standardised data base, CB/CBE blends with a known
composition were arithmetically prepared in order to model a relation between the
individual triglycerides measured and the amount of CBEs present in CB. Seven different
cocoa butters, representing the whole range of the biological variability of analysed cocoa
butter samples, were selected to compute mixtures containing 10%, 15% and 20% CBEs.
This would translate to levels of CBEs in chocolate of about 2% to 3%, 3% to 4.5% and 4%
to 6%, respectively, assuming a fat content of chocolate of 20% to 30%.
- 6 -
2 OBJECTIVE
� To conduct an international collaborative study in order to validate a gas
chromatography-based method combined with PLS regression analysis to quantify the
added amount of CBEs in cocoa butter and plain chocolate.
� To demonstrate high comparability of the results between laboratories and
commutability of the elaborated approach by using a matrix material of genuine cocoa
butter with a certified triglyceride profile.
3 METHOD DESCRIPTION
Cocoa butter, or the fat obtained from plain chocolate according to the Soxhlet principle, is
separated by high-resolution gas chromatography (HR-GC) into triglyceride fractions
according to their molecular weight and degree of unsaturation using a thermostable
polarizable capillary column. The content of the five main triglycerides is normalised so that
the sum of POP, POS, POO, SOS, SOO equals 100% (POP: 1,3-dipalmitoyl-2-
oleoylglycerol, POS: 1-palmitoyl-2-oleoyl-3-stearoylglycerol, POO: 1-palmitoyl-2,3-
dioleoylglycerol, SOS: 1,3-distearoyl-2-oleoylglycerol, SOO: 1-stearoyl-2,3-
dioleoylglycerol). PLS regression analysis applied to the relative proportions of the five
main triglycerides is used to estimate the CBE content on the basis of cocoa butter. The
regression model is given in Equation 1. The amount of CBE present in cocoa butter is
approximated by a linear combination of the predictors, i.e. the individual triglycerides.
Equation 1:%CBE in CB = 37.439 + 1.175 x POP – 1.939 x POS – 0.121 x POO + 0.982 x SOS –0.097 x SOO
PLS, a well-known method for multivariate statistical data evaluation proved to be the
method of choice to model a relation between the relative proportions of the five main
triglycerides measured and the amount of CBEs present in cocoa butter. The statistical
analysis was performed using the Unscrambler® 7.6 version (CAMO ASA, Oslo, Norway).
Arithmetic mixtures, prepared on the basis of a carefully elaborated data base of the
triglyceride profile of individual genuine cocoa butter and CBE samples, were used in order
set up a calibration set of 882 CB/CBE blends.
- 7 -
The effectiveness of the elaborated regression model for future predictions was checked by
means of various validation data sets and the resulting standard error for prediction, which
is given by the root mean square error (RMSE). This is a measurement of the average
difference between predicted and actual CBE content in cocoa butter. It is interpreted as
the average modelling error, expressed in the same units as the original values (g CBE/100
g CB). The computed RMSE for the determination of all possible CBE/CB blends was
1.1%. For ca 73% of the analysed CBE/CB blends the resulting prediction error was
covered by the computed average RMSE of 1.1%. Assuming a fat content of chocolate of
20% to 30% this figure translates to an average prediction error of 0.22% to 0.33% CBE.
Eighty-five % of all CBE proportions in CB were predicted with errors ranging from ±2%
corresponding to cocoa butter, or ±0.4% related to the final product chocolate (fat content
20%) or ±0.6% (fat content 30%). By restricting the model to commercially available CBEs,
85% of the blends were predicted with errors ranging from ±1% CBE in cocoa butter, or
±0.2% CBE related to the final product chocolate (fat content 20%) to ±0.3% (fat content
30%). For 99% of all analysed commercial CBEs in mixture with CB the resulting prediction
error was within ±2%. Assuming a fat content of chocolate of 20% to 30%, this figure
translates to an uncertainty of ±0.4% to ±0.6% CBE.
Furthermore, the efficiency of the regression models to assess compliance with the
statutory limit was scrutinised by checking the number of correctly, false positively and
false negatively classified samples for different action levels. For an action level of 5.4%
CBE (=statutory limit of 5% plus a safety margin of 0.4%) no false positive result, i.e. an
unjustified legal action, was observed. This indicates that samples with a predicted CBE
amount of 5.4% of any unknown CBE could be identified as non-compliant with the label
declaration.
The CBE content on the basis of the final product, expressed in grams of CBE per 100
grams of chocolate, is calculated by determining the fat content of the chocolate according
to the AOAC Official Method 963.15 [4].

- 8 -
4 PARTICIPANTS
4.1 Co-ordination of the validation study
European Commission, Joint Research Centre, Institute for Reference Materials and
Measurements, Geel (B)
4.2 Preparation and distributing of the test samples
European Commission, Joint Research Centre, Institute for Reference Materials and
Measurements, Geel (B)
4.3 Homogeneity tests
European Commission, Joint Research Centre, Institute for Reference Materials and
Measurements, Geel (B)
4.4 Measurements
ADM Noble & Thörl GmbH, Hamburg (D)
Barry Callebaut B.V., Bussum (B)
Britannia Food Ingredients Ltd., Goole (UK)
Department of Dairy Research and Bacteriology, University of Agricultural Sciences,
Vienna (A)
DGCCRF Laboratoire de Paris-Massy, Massy (F)
DGCCRF Laboratoire Interrégional Talence, Talence (F)
Dipartimento di Scienze degli Alimenti, Università degli Studi di Bologna, Bologna (I)
Eurofins Scientific Analytics, Nantes (F)
European Commission, Joint Research Centre, Institute for Health and Consumer
Protection, Ispra (I)
Fuji Oil Europe, Gent (B)
Gerkens Kakao B.V., Wormer (NL)
Karlshamns Sweden AB, Division Edible Oils, Karlshamn (S)
Laboratoire Chimie Analytique et Science de l’Aliment, Illkirch-Graffenstaden (F)

- 9 -
Lebensmittelchemisches Institut des Bundesverbandes der Deutschen Süßwarenindustrie,
Köln (D)
WEJ GmbH, Hamburg (DE)
4.5 Collation and statistical evaluation of results
European Commission, Joint Research Centre, Institute for Reference Materials and
Measurements, Geel (B)
5 TEST SAMPLES
Cocoa butter and CBE samples (Table 1) were obtained from the cocoa processing
industry and other vegetable fat producers. The chocolate sample was purchased in a retail
store in the UK. Nine mixtures containing 15%, 25% and 30% of CBE in pure cocoa butter
were gravimetrically prepared (Table 2), dissolved in iso-octane and sent to the
participating laboratories.
The CBEs included in the study consisted of a variety of commercially available fats. Illipé
fat, which resembles CB very closely and poses therefore the biggest problem regarding
detection and quantification, was used in combination with other CBEs.
Furthermore, one chocolate sample, which was labelled to contain vegetable, had to be
measured. In order to obtain the CBE amount on the basis of the final product, the fat
content of the chocolate sample was determined by the JRC according to the AOAC
Official Method 963.15 [4] by triplicate determination resulting in a fat content of 26.34%.
All samples were randomly coded (Table A 1, Annex A). One ampoule of the cocoa butter
CRM (IRMM 801) was provided for calibration purposes and system suitability check.
Table 1: Genuine CBs and CBEs used for the preparation of CB/CBE mixtures
CB No. Country Origin CBE No. Type [composition; %]I Grenada I PMF/Sal/Mango [50/25/25]II Ghana II PMF/Shea [50/50]III Ivory Coast/Nigeria/Cameroon III PMF/(Shea + Illipé) [35/65]

- 10 -
Table 2: Samples used for the study
Sample No. CB used CBE used CB [%] CBE [%]14 CB I CBE III 85.21 14.7915 CB I CBE III 75.08 24.9216 CB I CBE III 69.99 30.0117 CB II CBE II 84.91 15.0918 CB II CBE II 75.10 24.9019 CB II CBE II 69.99 30.0120 CB III CBE I 85.03 14.9721 CB III CBE I 75.03 24.9722 CB III CBE I 70.04 29.9612 Cadbury’s Bournville: The original plain chocolate [ingredients: vegetable fat]
5.1 Homogeneity study
The CB/CBE blends dissolved in iso-octane were considered to be homogeneous.
Homogeneity of the chocolate sample was mandatory in order to make matrix data from
various laboratories comparable too. The homogeneity test was carried out as described in
the preceding European report on the validation study for detection purpose [2]. All tests
confirmed that the between-units inhomogeneity was insignificant (P>0.05). Consequently,
homogeneity of the chocolate sample was considered to be sufficient and fit for purpose to
be used as test material for the validation study.
6 THE VALIDATION STUDY
6.1 Design of the validation study
Since the analytical part of the detection and quantification methods are based on the
same measuring principle, i.e. triglyceride profiling by HR-GC, the samples were analysed
within the same ring test that has been conducted to validate the analytical procedure for
the detection of CBEs in cocoa butter and plain chocolate [2]. Differences in the standard
operation procedure of the two methods exist in the number of individual triglycerides used
for data treatment and in the mathematical evaluation of the data. The participants were
requested to submit the raw data of the individual triglycerides. Using the submitted raw
data the mathematical calculations for the prediction of the present CBE amounts were
performed later on by the JRC.
- 11 -
6.2 Analysis of test samples
Before analysing the test samples the participants had to check the system suitability, i.e. a
sufficient resolution of the critical pairs POS/POO and SOS/SOO and the determination of
reliable response factors of the five main triglycerides. The test samples had to be
analysed in random order. Response factors for the five main triglycerides (POP, POO,
POS, SOS, SOO) had to be determined before analysing the first test sample and after
every 10th analyses by using the cocoa butter CRM (IRMM 801). The sample number,
retention time and the area counts of individual triglyceride fractions had to be reported
using an electronic spreadsheet provided by the JRC. In order to avoid any transcription
errors, the raw data were later on automatically applied to the proposed algorithm
(Equation 1) by using the electronic spreadsheet.
6.3 Technical evaluation of the results submitted
The results of the individual laboratories were examined along with the submitted raw data
and chromatograms. Based on the technical evaluation of the results, 13 data sets out of
the 15 submitted were accepted; laboratory 14 did not comply with the requirements of the
requested chromatographic system and laboratory 15 failed to determine proper and
repeatable response factors demonstrating a sound functioning of the chromatographic
system. Details on the employed chromatographic systems and the requested performance
criteria are given in the report on the validation study for the detection of CBEs in cocoa
butter and plain chocolate [2].
6.4 Statistical evaluation of the results submitted
The individual results accepted on technical grounds as submitted by the participants are
given in form of tables in Annex A (Tables A 2 to A 11). For each data set, identified by a
laboratory code, the five major triglycerides i.e. POP, POS, POO, SOS and SOO,
normalised to 100%, are listed. Furthermore, the estimated CBE amounts in the fat blends
determined by applying Equation 1, are given in the same Tables.
The resulting laboratory means of the quantified CBE amounts are plotted in increasing
order with the corresponding range (Figures A 1 to A 10, Annex A).

- 12 -
The data sets accepted on technical grounds were subjected to statistical tests as
described in ISO 5725:
- Cochran test to identify outlying variances
- Single Grubbs and double Grubbs test to detect outlying data set averages.
In Tables A 12 to A 14 all data accepted on technical grounds were included in the
computation of precision figures, while Tables A 15 to A 17 contain the results of the
statistical evaluation performed after removal of the detected outliers (Annex A). By
removing statistical outliers the relative standard deviation of reproducibility (RSDR) for the
quantification of the CBE amount was reduced from 2.8% to 2.4% for CB/CBE blends and
from 5.6% to 4.4% for the chocolate sample.
The calculated HORRAT values that can be used as a guide to determine the acceptability
of the precision of a method ranged from 0.5 to 1.6, demonstrating a good performance of
the method.

- 13 -
7 RESULTS
Table 3 gives a brief outline of the resulting range of laboratory mean values and the
respective standard deviation of reproducibility after removal of statistical outliers. The data
relate to the proportional CBE in CB/CBE blends. Tables 4 and 5 list the same results
based on the final product chocolate corresponding to fat contents of 20% and 30%,
respectively.
Table 3: Comparison of predicted and actual values including the range of laboratorymean values and respective standard deviation of reproducibility and RSDR (resultsreported in g CBE/100 g CB) obtained by the PLS model
SampleNumber actual value predicted value (range of means) bias sR RSDR
14 14.79 15.14 (14.57 - 15.61) -0.4 0.36 2.415 24.92 24.80 (24.01 - 25.41) 0.1 0.41 1.716 30.01 29.56 (28.58 - 30.03) 0.4 0.54 1.817 15.09 16.63 (16.31 - 16.88) -1.6 0.23 1.418 24.90 25.87 (25.14 - 26.44) -1.0 0.43 1.719 30.01 30.69 (30.03 - 31.39) -0.7 0.45 1.520 14.97 15.65 (15.18 - 16.12) -0.7 0.31 2.021 24.97 24.17 (23.46 - 24.62) 0.8 0.36 1.522 29.96 28.53 (27.75 - 28.94) 1.4 0.41 1.412 unknown 13.99 (12.70 - 15.04) - 0.61 4.4
The obtained over-all mean values were in close agreement with the known values. The
differences between the predicted and true values were well within the expected range of
±2%. Assuming a fat content of chocolate of 20% or 30% this translates to ±0.4% or ±0.6%,
respectively. The efficiency test of the method based on arithmetic mixtures has shown that
for 99% of the commercial CBEs when blended with CB and 85% of all CBEs in mixture
with CB the resulting error for predicting the CBE percentage in the blends was ±2%.
Hence, the results of the ring test clearly demonstrated conformity with the results obtained
by the elaborated model based on arithmetically simulated mixtures.
The predicted amount of vegetable fat of the real chocolate sample was 13.99 g/100 g on
fat basis. The determined fat content of the chocolate was 26.34%, resulting in 3.68 g
CBE/100 g chocolate. Therefore, this sample was considered to be compliant with the
statutory limit of 5%.
- 14 -
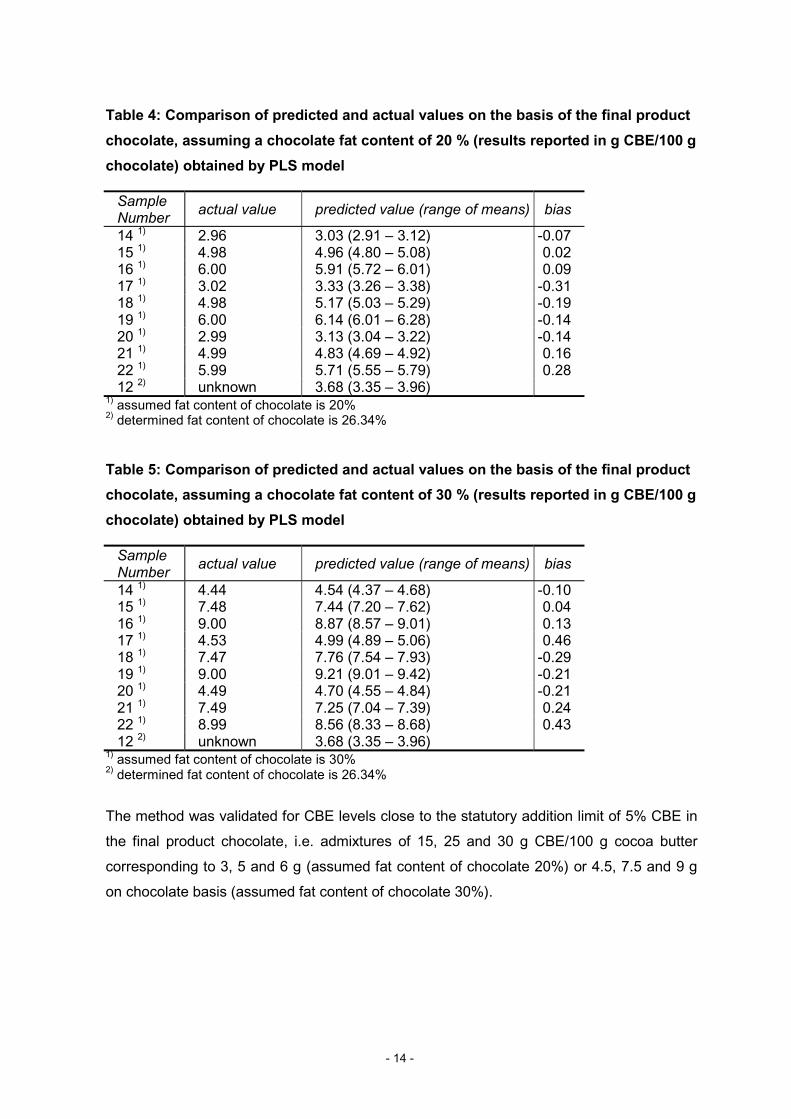
Table 4: Comparison of predicted and actual values on the basis of the final productchocolate, assuming a chocolate fat content of 20 % (results reported in g CBE/100 gchocolate) obtained by PLS model
SampleNumber actual value predicted value (range of means) bias
14 1) 2.96 3.03 (2.91 – 3.12) -0.0715 1) 4.98 4.96 (4.80 – 5.08) 0.0216 1) 6.00 5.91 (5.72 – 6.01) 0.0917 1) 3.02 3.33 (3.26 – 3.38) -0.3118 1) 4.98 5.17 (5.03 – 5.29) -0.1919 1) 6.00 6.14 (6.01 – 6.28) -0.1420 1) 2.99 3.13 (3.04 – 3.22) -0.1421 1) 4.99 4.83 (4.69 – 4.92) 0.1622 1) 5.99 5.71 (5.55 – 5.79) 0.2812 2) unknown 3.68 (3.35 – 3.96)
1) assumed fat content of chocolate is 20%2) determined fat content of chocolate is 26.34%
Table 5: Comparison of predicted and actual values on the basis of the final productchocolate, assuming a chocolate fat content of 30 % (results reported in g CBE/100 gchocolate) obtained by PLS model
SampleNumber actual value predicted value (range of means) bias
14 1) 4.44 4.54 (4.37 – 4.68) -0.1015 1) 7.48 7.44 (7.20 – 7.62) 0.0416 1) 9.00 8.87 (8.57 – 9.01) 0.1317 1) 4.53 4.99 (4.89 – 5.06) 0.4618 1) 7.47 7.76 (7.54 – 7.93) -0.2919 1) 9.00 9.21 (9.01 – 9.42) -0.2120 1) 4.49 4.70 (4.55 – 4.84) -0.2121 1) 7.49 7.25 (7.04 – 7.39) 0.2422 1) 8.99 8.56 (8.33 – 8.68) 0.4312 2) unknown 3.68 (3.35 – 3.96)
1) assumed fat content of chocolate is 30%2) determined fat content of chocolate is 26.34%
The method was validated for CBE levels close to the statutory addition limit of 5% CBE in
the final product chocolate, i.e. admixtures of 15, 25 and 30 g CBE/100 g cocoa butter
corresponding to 3, 5 and 6 g (assumed fat content of chocolate 20%) or 4.5, 7.5 and 9 g
on chocolate basis (assumed fat content of chocolate 30%).

- 15 -
8 CONCLUSIONS
The results of the collaborative study showed that the analytical approach (triglyceride
profiling by HR-GC and data treatment by PLS regression analysis) is a reliable method for
the quantification of CBEs in cocoa butter and plain chocolate. The outcome of the ring test
proved that the model elaborated in-house by the JRC on the basis of arithmetically
simulated mixtures can be successfully used by individual testing laboratories.
Comparability of the results between individual laboratories and commutability with the
elaborated model is maintained by using the cocoa butter CRM (IRMM 801).
The chocolate Directive allows the addition of up to 5% vegetable fats in chocolate. By
applying the validated method samples containing more than 5.4% of any unknown CBE
can be identified as being non-compliant with label declaration (fat content of chocolate
assumed to be 20%). By using an action level of 5.4%, no false positive result was
obtained. The set of samples used to derive the above mentioned figures represented the
whole range of CB samples (soft, hard and commercial mixtures thereof) and a large range
of various CBEs, including CBEs containing illipé fat. The only restriction to the sample set
was the exclusion of pure illipé fat, since it is irrelevant in practical terms as admixture to
chocolate.
The main advantage of the tested methodological approach is that the end user has just to
calibrate the gas chromatographic separation system using the certified reference material
(IRMM 801), separate the sample in question and use the mathematical equation for
subsequent data treatment in order to quantify the CBE amount present in cocoa butter or
plain chocolate. In combination with the preceding method for detection an important
measure to assess compliance with labelling provisions is offered.

- 16 -
9 LITERATURE
[1] Directive 2000/36/EC of the European Parliament and the Council of 23 June 2000
relating to cocoa and chocolate products intended for human consumption. OJ L197, 19-
25.
[2] Buchgraber, M., Anklam, E. (2003). Validation of a method for the detection of cocoa
butter equivalents in cocoa butter and plain chocolate. EUR 20685 EN, ISBN 92-894-
5510-1.
[3] Buchgraber, M., Anklam, E. (2003) publication in preparation.
[4] Official Methods of Analysis of AOAC International (1995) 16th Edition. Volume II.
Chapter 31. AOAC Official Method 963.15.

- 17 -
ANNEX A
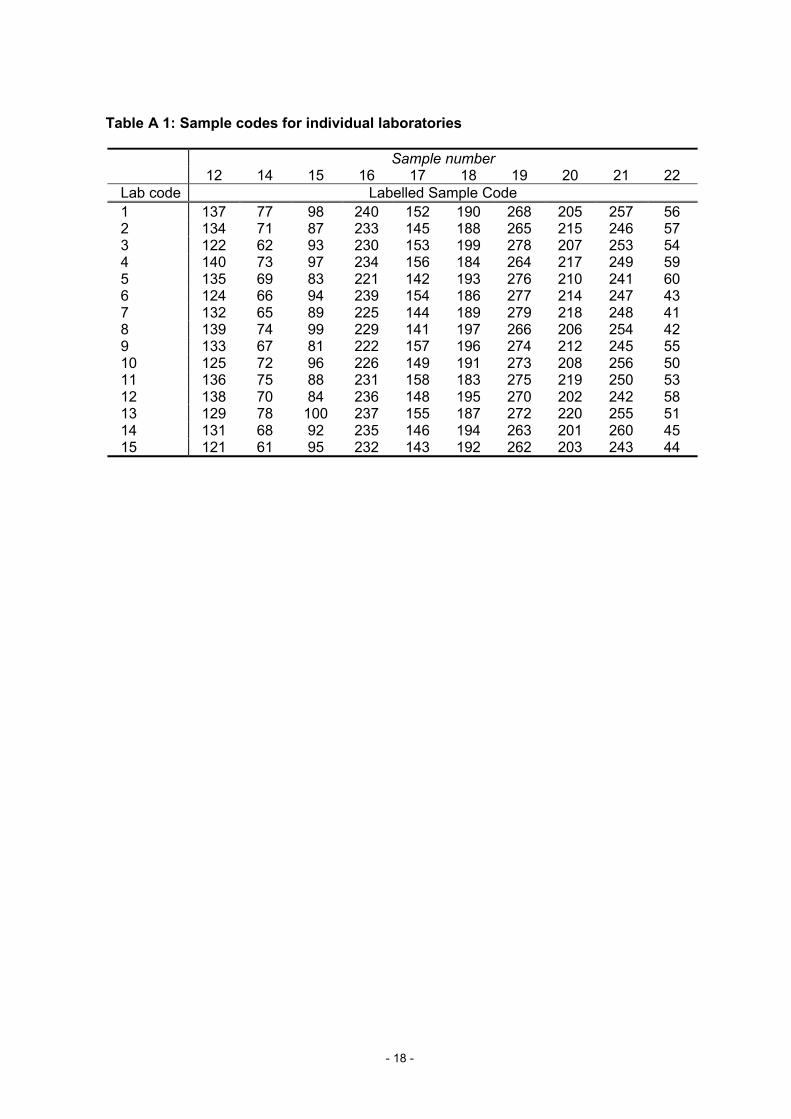
Table A 1: Sample codes for individual laboratories
Tables A 2 – A 11: Results accepted on technical grounds
Figures A 1 – A 10: Bar-charts of results accepted on technical grounds
Tables A 12 – A 14: Statistical evaluation of results accepted on technical grounds
Tables A 15 – A 17: Statistical evaluation of results accepted on technical andstatistical grounds
- 18 -
Table A 1: Sample codes for individual laboratories
Sample number12 14 15 16 17 18 19 20 21 22
Lab code Labelled Sample Code1 137 77 98 240 152 190 268 205 257 562 134 71 87 233 145 188 265 215 246 573 122 62 93 230 153 199 278 207 253 544 140 73 97 234 156 184 264 217 249 595 135 69 83 221 142 193 276 210 241 606 124 66 94 239 154 186 277 214 247 437 132 65 89 225 144 189 279 218 248 418 139 74 99 229 141 197 266 206 254 429 133 67 81 222 157 196 274 212 245 5510 125 72 96 226 149 191 273 208 256 5011 136 75 88 231 158 183 275 219 250 5312 138 70 84 236 148 195 270 202 242 5813 129 78 100 237 155 187 272 220 255 5114 131 68 92 235 146 194 263 201 260 4515 121 61 95 232 143 192 262 203 243 44

- 19 -
Table A 2: Results accepted on technical grounds for sample 14 (two replicates)POP 1 POS 1 POO 1 SOS 1 SOO 1 CBE addition 2
Lab A B A B A B A B A B A B1 21.18 21.15 41.06 41.07 1.76 1.77 33.30 33.27 2.70 2.74 14.93 14.842 21.08 21.04 41.09 41.10 1.86 1.86 33.16 33.20 2.81 2.81 14.59 14.553 20.93 20.76 40.90 40.85 1.65 1.68 33.69 33.81 2.83 2.90 15.32 15.344 20.77 20.67 40.74 40.79 1.74 1.75 33.92 33.93 2.83 2.85 15.66 15.465 21.06 21.01 41.30 41.16 1.60 1.59 33.52 33.54 2.52 2.70 14.57 14.796 20.70 20.45 41.14 41.33 1.66 1.84 34.00 33.71 2.50 2.67 14.92 13.957 20.45 20.56 41.21 41.25 1.54 1.54 34.33 34.17 2.47 2.48 14.84 14.728 20.83 21.14 40.84 40.93 1.73 1.71 33.81 33.47 2.80 2.75 15.43 15.299 20.82 20.82 40.85 40.90 1.64 1.63 33.61 33.64 2.47 2.66 15.25 15.1610 20.98 20.93 40.80 40.98 1.80 1.69 33.60 33.58 2.81 2.81 15.47 15.0511 20.96 20.78 40.59 40.83 2.05 1.82 33.69 33.74 2.71 2.82 15.91 15.3112 20.71 20.69 40.88 40.88 1.66 1.67 33.86 33.92 2.88 2.84 15.27 15.3013 20.85 21.00 40.86 40.88 1.79 1.82 33.60 33.46 2.90 2.83 15.19 15.19
Table A 3: Results accepted on technical grounds for sample 15 (two replicates)POP 1 POS 1 POO 1 SOS 1 SOO 1 CBE addition 2
Lab A B A B A B A B A B A B1 22.11 22.10 37.73 37.72 1.76 1.77 35.43 35.45 2.98 2.97 24.54 24.552 21.93 21.89 37.82 37.71 1.72 1.80 35.58 35.56 2.95 3.03 24.30 24.443 21.95 21.83 37.68 37.60 1.67 1.89 35.86 35.68 2.85 3.00 24.89 24.704 21.47 21.29 37.46 37.54 1.67 1.65 36.44 36.56 2.96 2.96 25.31 25.075 21.89 21.94 37.85 37.61 1.62 1.65 35.72 35.77 2.93 3.03 24.35 24.936 21.73 21.73 37.63 37.90 1.88 1.70 35.92 36.01 2.84 2.66 24.77 24.377 21.54 21.64 38.08 38.01 1.56 1.59 36.14 36.03 2.69 2.73 23.94 24.098 21.68 21.98 37.44 37.54 1.67 1.73 36.22 35.79 2.99 2.97 25.38 25.119 21.89 21.87 37.56 37.53 1.66 1.69 35.82 35.88 2.88 2.98 25.01 25.1110 21.72 21.82 37.67 37.77 1.57 1.67 35.99 35.81 3.05 2.93 24.77 24.5111 22.00 21.97 37.56 37.47 1.53 1.66 35.99 36.04 2.91 2.87 25.32 25.5012 21.84 21.83 37.55 37.63 1.73 1.68 35.81 35.88 3.07 2.97 24.93 24.8513 22.20 21.96 37.47 37.54 1.81 1.73 35.36 35.67 3.16 3.10 25.06 24.95
Table A 4: Results accepted on technical grounds for sample 16 (two replicates)POP 1 POS 1 POO 1 SOS 1 SOO 1 CBE addition 2
Lab A B A B A B A B A B A B1 22.35 22.33 35.94 35.94 1.73 1.74 36.90 36.92 3.08 3.07 29.72 29.732 22.45 22.51 36.12 36.21 1.98 1.96 36.14 35.99 3.31 3.33 28.71 28.453 22.20 22.25 35.86 35.89 1.73 1.69 37.12 37.05 3.09 3.12 29.92 29.864 21.98 22.10 35.80 35.81 1.72 1.65 37.18 37.36 3.32 3.08 29.81 30.165 22.51 22.32 35.96 35.92 1.70 1.64 36.72 36.91 3.11 3.21 29.71 29.756 22.22 22.09 35.92 36.17 1.53 1.57 37.34 37.23 2.98 2.94 30.08 29.357 22.34 22.42 36.38 36.40 1.66 1.66 36.72 36.61 2.90 2.91 28.70 28.668 22.65 22.50 35.84 35.82 1.72 1.70 36.64 36.83 3.15 3.15 30.01 30.069 22.35 22.33 35.89 35.88 1.71 1.65 36.82 37.01 3.11 3.21 29.76 29.9310 22.35 22.51 35.79 36.02 1.80 1.71 36.97 36.94 3.09 2.82 30.08 29.8411 22.42 22.41 35.99 35.88 1.52 1.70 37.13 36.99 2.94 3.02 29.99 30.0112 22.21 22.22 36.13 36.18 1.72 1.76 36.83 36.75 3.11 3.10 29.14 28.9613 22.25 22.43 36.17 36.31 1.60 1.82 37.14 36.56 2.84 2.89 29.45 28.79(1) g TG / 100 g total TGs (total TGs = POP+POS+POO+SOS+SOO = 100 %)
(2) g CBE / 100 g CB

- 20 -
Table A 5: Results accepted on technical grounds for sample 17 (two replicates)POP 1 POS 1 POO 1 SOS 1 SOO 1 CBE addition 2
Lab A B A B A B A B A B A B1 21.47 21.48 39.78 39.80 2.63 2.64 32.32 32.29 3.80 3.79 16.58 16.532 21.54 21.39 39.99 39.81 2.72 2.60 32.01 32.56 3.74 3.65 15.94 16.673 21.50 21.44 39.81 39.74 2.61 2.63 32.33 32.39 3.75 3.80 16.56 16.694 21.22 21.28 39.79 39.77 2.47 2.47 32.67 32.63 3.85 3.84 16.62 16.705 21.43 21.48 39.40 39.62 2.61 2.61 32.58 32.42 3.98 3.88 17.52 16.986 21.32 21.60 39.87 39.85 2.61 2.65 32.43 32.42 3.77 3.48 16.35 16.727 21.45 21.38 40.37 40.20 2.32 2.45 32.47 32.45 3.39 3.53 15.64 15.838 21.64 21.63 39.66 39.67 2.68 2.72 32.18 32.14 3.85 3.84 16.85 16.799 21.44 21.45 39.78 39.77 2.63 2.63 32.68 32.51 3.98 3.88 16.88 16.7410 21.58 21.58 39.89 39.71 2.62 2.69 32.25 32.43 3.67 3.59 16.44 16.9611 21.33 21.33 39.66 39.57 2.68 2.80 32.52 32.47 3.81 3.83 16.83 16.9312 21.42 21.34 39.89 39.84 2.51 2.49 32.43 32.52 3.75 3.80 16.43 16.5213 21.44 21.55 39.81 39.85 2.59 2.58 32.38 32.28 3.79 3.74 16.55 16.50
Table A 6: Results accepted on technical grounds for sample 18 (two replicates)POP 1 POS 1 POO 1 SOS 1 SOO 1 CBE addition 2
Lab A B A B A B A B A B A B1 23.62 23.62 36.70 36.71 2.72 2.71 33.17 33.16 3.80 3.80 25.89 25.872 23.61 23.65 36.90 36.82 2.68 2.65 33.12 33.27 3.68 3.60 25.47 25.823 23.59 23.72 36.75 36.70 2.70 2.67 33.14 33.19 3.82 3.72 25.72 26.044 23.42 23.48 36.70 36.87 2.51 2.36 33.57 33.61 3.80 3.68 26.09 25.905 23.91 23.53 36.60 36.69 2.66 2.64 33.06 33.17 3.77 3.97 26.34 25.816 23.36 23.69 37.48 36.80 2.66 2.68 32.98 33.16 3.52 3.67 23.93 25.797 23.70 23.70 37.19 37.18 2.45 2.46 33.20 33.18 3.46 3.48 25.15 25.138 23.86 23.66 36.58 36.53 2.76 2.76 32.93 33.21 3.87 3.85 26.16 26.309 23.53 23.59 36.70 36.66 2.69 2.66 33.15 33.26 3.77 3.98 25.78 26.0210 23.83 23.77 36.68 36.53 2.44 2.72 33.35 33.24 3.70 3.74 26.40 26.4811 23.49 23.60 36.72 36.66 2.64 2.60 33.35 33.50 3.79 3.63 25.89 26.3212 23.57 23.80 36.82 36.75 2.48 2.49 33.43 33.24 3.70 3.72 25.89 26.1113 23.59 23.68 37.20 36.92 2.65 2.54 32.98 33.20 3.58 3.66 24.75 25.60
Table A 7: Results accepted on technical grounds for sample 19 (two replicates)POP 1 POS 1 POO 1 SOS 1 SOO 1 CBE addition 2
Lab A B A B A B A B A B A B1 24.71 24.77 35.03 35.05 2.82 2.75 33.55 33.61 3.89 3.83 30.76 30.882 24.69 24.78 35.25 35.13 2.65 2.72 33.79 33.75 3.62 3.62 30.59 30.903 24.65 24.70 34.95 35.00 2.68 2.74 33.89 33.76 3.83 3.80 31.21 31.034 24.51 24.65 35.16 35.00 2.48 2.54 34.09 33.89 3.76 3.92 30.86 31.135 24.72 24.77 35.10 35.22 3.02 2.94 33.20 32.98 3.96 4.08 30.28 29.876 24.71 24.88 35.27 35.37 2.48 2.40 34.10 33.94 3.45 3.41 30.94 30.787 24.77 24.77 35.36 35.38 2.73 2.72 33.37 33.36 3.77 3.77 30.06 30.008 25.16 24.08 35.00 34.95 2.73 2.68 33.30 34.40 3.81 3.89 31.12 31.039 24.79 24.80 35.13 35.13 3.05 2.97 33.29 33.07 3.96 4.08 30.38 30.1710 24.69 24.72 34.73 34.94 3.05 2.91 33.76 33.85 3.77 3.58 31.53 31.2511 24.79 24.98 34.90 35.12 3.14 2.98 33.45 33.38 3.72 3.54 30.99 30.7612 24.68 24.73 35.12 35.16 2.74 2.74 33.49 33.46 3.97 3.90 30.49 30.4513 24.75 24.62 35.28 35.36 2.65 2.63 33.50 33.55 3.82 3.84 30.31 30.05(1) g TG / 100 g total TGs (total TGs = POP+POS+POO+SOS+SOO = 100 %)
(2) g CBE / 100 g CB

- 21 -
Table A 8: Results accepted on technical grounds for sample 20 (two replicates)POP 1 POS 1 POO 1 SOS 1 SOO 1 CBE addition 2
Lab A B A B A B A B A B A B1 22.75 22.75 40.12 40.12 2.70 2.71 30.58 30.58 3.85 3.84 15.71 15.692 22.75 22.85 40.17 40.24 2.64 2.60 30.69 30.54 3.76 3.76 15.72 15.563 22.64 22.62 40.33 40.24 2.63 2.66 30.62 30.66 3.78 3.83 15.23 15.414 22.40 22.40 40.22 39.98 2.43 2.94 31.21 30.75 3.75 3.94 15.76 15.685 22.60 22.81 40.05 40.02 2.67 2.64 30.81 30.61 3.86 3.91 15.89 15.996 22.47 22.48 40.21 40.68 2.77 2.48 30.93 31.01 3.62 3.36 15.56 14.797 22.86 22.80 40.31 40.28 2.71 2.71 30.36 30.43 3.76 3.78 15.24 15.308 22.82 22.19 40.06 39.83 2.70 2.70 30.57 31.34 3.85 3.94 15.89 16.349 22.74 22.77 40.16 40.21 2.69 2.67 30.90 30.70 3.87 3.91 15.92 15.6610 22.95 22.92 40.19 40.20 2.81 2.77 30.46 30.56 3.59 3.55 15.69 15.7511 22.70 22.61 40.04 40.12 2.66 2.65 30.78 30.67 3.81 3.94 16.00 15.6312 22.65 22.74 40.21 40.12 2.60 2.62 30.62 30.58 3.92 3.94 15.44 15.6913 21.88 22.16 41.07 40.93 1.67 1.73 33.06 32.86 2.31 2.32 15.55 15.95
Table A 9: Results accepted on technical grounds for sample 21 (two replicates)POP 1 POS 1 POO 1 SOS 1 SOO 1 CBE addition 2
Lab A B A B A B A B A B A B1 26.08 26.08 37.26 37.29 2.83 2.83 29.89 29.89 3.93 3.92 24.45 24.392 26.13 26.00 37.52 37.54 2.88 2.76 29.71 29.98 3.78 3.72 23.84 23.943 25.97 26.27 37.46 37.57 2.76 2.73 29.89 29.55 3.91 3.89 23.95 23.764 25.71 26.07 37.43 37.29 2.37 2.70 30.61 30.09 3.89 3.85 24.46 24.605 26.23 26.39 37.39 37.61 2.81 2.80 29.75 29.55 3.82 3.64 24.25 23.846 26.07 26.29 37.93 37.45 2.55 2.39 30.12 30.28 3.32 3.59 23.46 24.807 25.22 25.37 37.93 37.90 2.39 2.40 31.07 30.93 3.39 3.40 23.43 23.508 26.38 26.52 37.27 37.27 2.80 2.83 29.69 29.54 3.86 3.86 24.61 24.629 26.19 26.20 37.32 37.30 2.80 2.79 29.77 29.57 3.94 3.76 24.35 24.2410 26.33 26.47 37.41 37.45 2.82 2.87 29.94 29.67 3.50 3.54 24.55 24.3611 26.24 26.43 37.26 37.50 2.93 2.76 29.80 29.41 3.78 3.90 24.56 23.9312 26.04 25.99 37.50 37.42 2.61 2.66 29.90 30.01 3.95 3.91 23.98 24.1813 26.01 26.13 37.40 37.48 2.73 2.85 30.11 29.75 3.75 3.78 24.34 23.97
Table A 10: Results accepted on technical grounds for sample 22 (two replicates)POP 1 POS 1 POO 1 SOS 1 SOO 1 CBE addition 2
Lab A B A B A B A B A B A B1 27.85 27.86 35.85 35.85 2.93 2.92 29.39 29.37 3.99 3.99 28.76 28.762 27.74 27.86 36.04 36.07 3.09 3.02 29.16 29.07 3.97 3.98 28.02 28.013 27.46 27.80 36.15 36.05 2.78 2.81 29.69 29.50 3.92 3.84 28.04 28.434 27.70 27.78 35.77 35.90 2.86 2.75 29.74 29.58 3.93 3.99 29.09 28.785 28.27 28.12 36.10 36.21 2.78 2.92 29.51 29.32 3.34 3.42 28.98 28.366 27.76 28.04 36.21 36.22 2.51 2.78 29.80 29.32 3.72 3.64 28.43 28.247 27.79 27.81 36.48 36.43 2.65 2.63 29.53 29.56 3.56 3.57 27.68 27.828 28.01 28.39 35.87 35.89 2.88 2.88 29.32 29.01 3.92 3.83 28.86 28.969 27.93 27.92 35.96 35.94 2.85 3.00 29.62 29.42 3.28 3.37 28.95 28.7410 27.83 27.98 36.12 35.98 3.21 2.99 29.31 29.38 3.54 3.66 28.14 28.6811 27.82 27.84 35.82 36.01 3.21 2.98 29.70 29.58 3.44 3.59 29.11 28.6512 27.82 27.84 35.99 36.04 2.77 2.75 29.45 29.35 3.97 4.02 28.53 28.3513 27.63 27.95 35.85 35.90 2.79 2.78 29.65 29.39 4.09 3.98 28.76 28.79(1) g TG / 100 g total TGs (total TGs = POP+POS+POO+SOS+SOO = 100 %)
(2) g CBE / 100 g CB
- 22 -
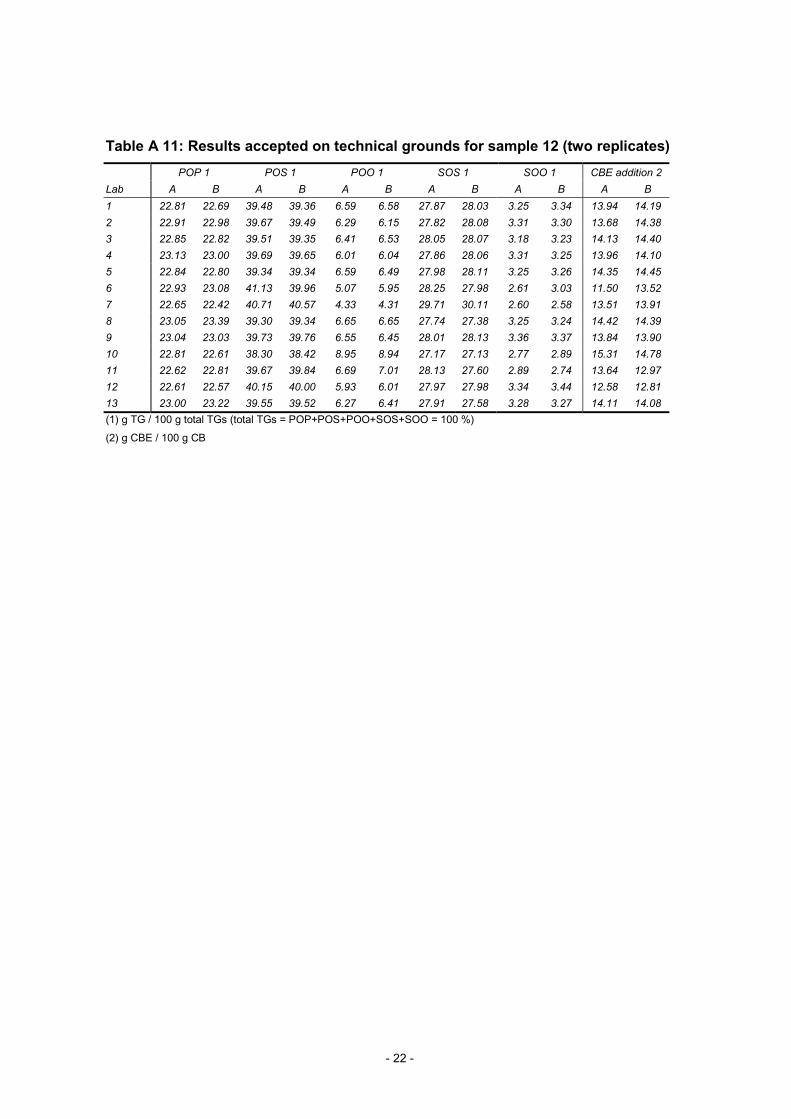
Table A 11: Results accepted on technical grounds for sample 12 (two replicates)POP 1 POS 1 POO 1 SOS 1 SOO 1 CBE addition 2
Lab A B A B A B A B A B A B1 22.81 22.69 39.48 39.36 6.59 6.58 27.87 28.03 3.25 3.34 13.94 14.192 22.91 22.98 39.67 39.49 6.29 6.15 27.82 28.08 3.31 3.30 13.68 14.383 22.85 22.82 39.51 39.35 6.41 6.53 28.05 28.07 3.18 3.23 14.13 14.404 23.13 23.00 39.69 39.65 6.01 6.04 27.86 28.06 3.31 3.25 13.96 14.105 22.84 22.80 39.34 39.34 6.59 6.49 27.98 28.11 3.25 3.26 14.35 14.456 22.93 23.08 41.13 39.96 5.07 5.95 28.25 27.98 2.61 3.03 11.50 13.527 22.65 22.42 40.71 40.57 4.33 4.31 29.71 30.11 2.60 2.58 13.51 13.918 23.05 23.39 39.30 39.34 6.65 6.65 27.74 27.38 3.25 3.24 14.42 14.399 23.04 23.03 39.73 39.76 6.55 6.45 28.01 28.13 3.36 3.37 13.84 13.9010 22.81 22.61 38.30 38.42 8.95 8.94 27.17 27.13 2.77 2.89 15.31 14.7811 22.62 22.81 39.67 39.84 6.69 7.01 28.13 27.60 2.89 2.74 13.64 12.9712 22.61 22.57 40.15 40.00 5.93 6.01 27.97 27.98 3.34 3.44 12.58 12.8113 23.00 23.22 39.55 39.52 6.27 6.41 27.91 27.58 3.28 3.27 14.11 14.08(1) g TG / 100 g total TGs (total TGs = POP+POS+POO+SOS+SOO = 100 %)
(2) g CBE / 100 g CB
- 23 -
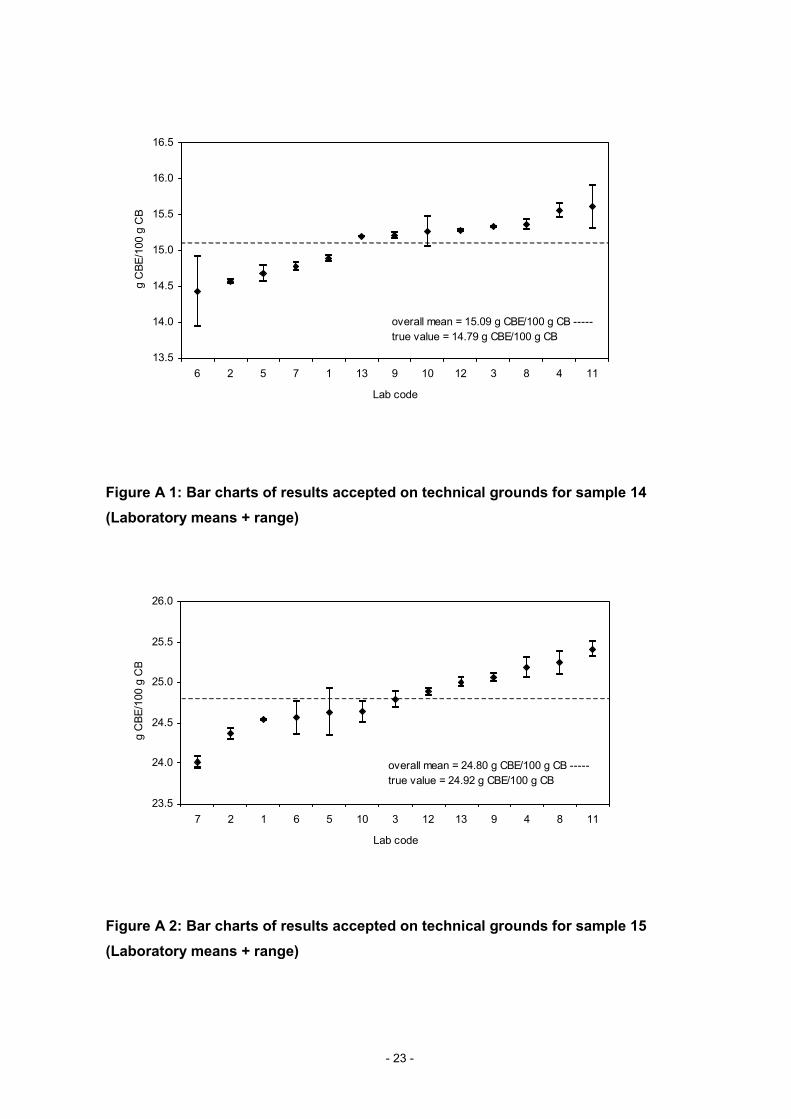
Figure A 1: Bar charts of results accepted on technical grounds for sample 14(Laboratory means + range)
Figure A 2: Bar charts of results accepted on technical grounds for sample 15(Laboratory means + range)
13.5
14.0
14.5
15.0
15.5
16.0
16.5
6 2 5 7 1 13 9 10 12 3 8 4 11
Lab code
g C
BE/1
00 g
CB
overall mean = 15.09 g CBE/100 g CB -----true value = 14.79 g CBE/100 g CB
23.5
24.0
24.5
25.0
25.5
26.0
7 2 1 6 5 10 3 12 13 9 4 8 11
Lab code
g C
BE/1
00 g
CB
overall mean = 24.80 g CBE/100 g CB -----true value = 24.92 g CBE/100 g CB

- 24 -
Figure A 3: Bar charts of results accepted on technical grounds for sample 16(Laboratory means + range)
Figure A 4: Bar charts of results accepted on technical grounds for sample 17(Laboratory means + range)
28.0
28.5
29.0
29.5
30.0
30.5
2 7 12 13 6 1 5 9 3 10 4 11 8
Lab code
g C
BE/1
00 g
CB
overall mean = 29.56 g CBE/100 g CB -----true value = 30.01 g CBE/100 g CB
15.5
16.0
16.5
17.0
17.5
18.0
7 2 12 13 6 1 3 4 10 9 8 11 5
Lab code
g C
BE/1
00 g
CB
overall mean = 16.61 g CBE/100 g CB -----true value = 15.09 g CBE/100 g CB

- 25 -
Figure A 5: Bar charts of results accepted on technical grounds for sample 18(Laboratory means + range)
Figure A 6: Bar charts of results accepted on technical grounds for sample 19(Laboratory means + range)
23.5
24.0
24.5
25.0
25.5
26.0
26.5
27.0
6 7 13 2 3 1 9 4 12 5 11 8 10
Lab code
g C
BE/1
00 g
CB
overall mean = 25.79 g CBE/100 g CB -----true value = 24.90 g CBE/100 g CB
29.5
30.0
30.5
31.0
31.5
32.0
7 5 13 9 12 2 1 6 11 4 8 3 10
Lab code
g C
BE/1
00 g
CB
overall mean = 30.69 g CBE/100 g CB -----true value = 30.01 g CBE/100 g CB
- 26 -
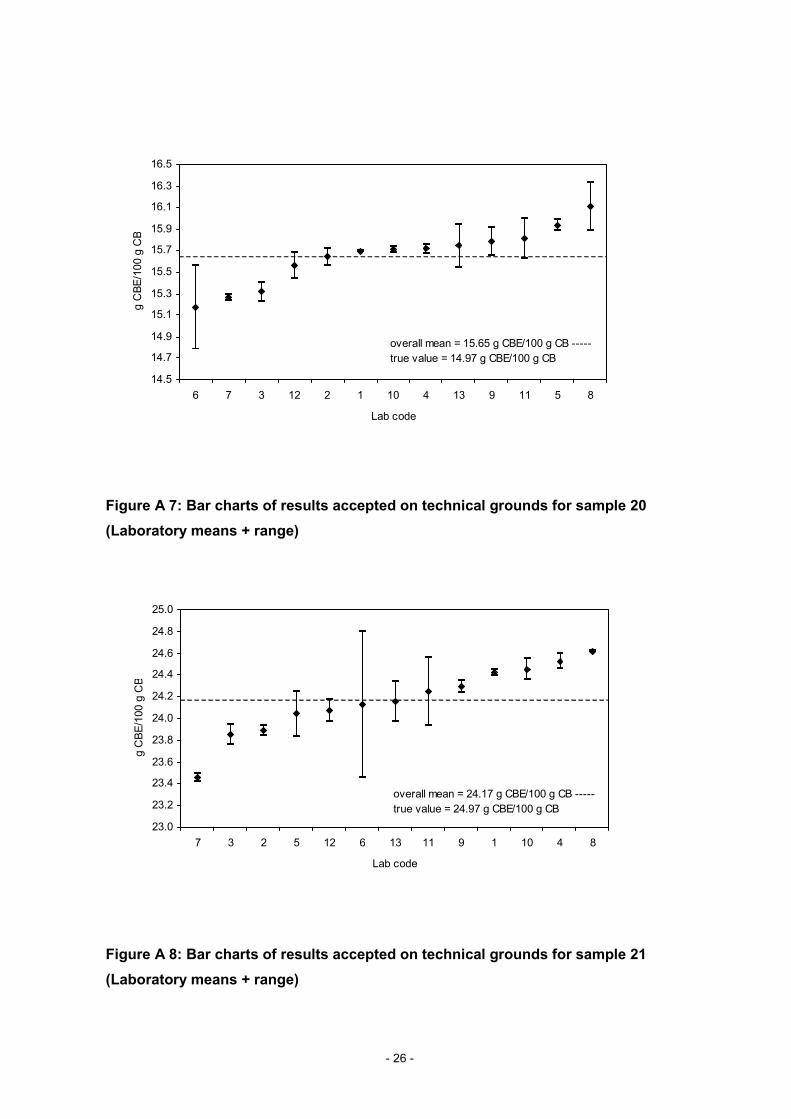
Figure A 7: Bar charts of results accepted on technical grounds for sample 20(Laboratory means + range)
Figure A 8: Bar charts of results accepted on technical grounds for sample 21(Laboratory means + range)
14.5
14.7
14.9
15.1
15.3
15.5
15.7
15.9
16.1
16.3
16.5
6 7 3 12 2 1 10 4 13 9 11 5 8
Lab code
g C
BE/1
00 g
CB
overall mean = 15.65 g CBE/100 g CB -----true value = 14.97 g CBE/100 g CB
23.0
23.2
23.4
23.6
23.8
24.0
24.2
24.4
24.6
24.8
25.0
7 3 2 5 12 6 13 11 9 1 10 4 8
Lab code
g C
BE/1
00 g
CB
overall mean = 24.17 g CBE/100 g CB -----true value = 24.97 g CBE/100 g CB

- 27 -
Figure A 9: Bar charts of results accepted on technical grounds for sample 22(Laboratory means + range)
Figure A 10: Bar charts of results accepted on technical grounds for sample 12(Laboratory means + range)
27.5
27.7
27.9
28.1
28.3
28.5
28.7
28.9
29.1
29.3
29.5
7 2 3 6 10 12 5 1 13 9 11 8 4
Lab code
g C
BE/1
00 g
CB
overall mean = 28.53 g CBE/100 g CB -----true value = 29.96 g CBE/100 g CB
11.0
11.5
12.0
12.5
13.0
13.5
14.0
14.5
15.0
15.5
6 12 11 7 9 4 2 1 13 3 5 8 10
Lab code
g C
BE/1
00 g
CB
overall mean = 13.88 g CBE/100 g CB -----true value = unknow n

- 28 -
Table A 12: Statistical evaluation of the results accepted on technical grounds
Sample number 12 14 15 16Year of collaborative study 2002Number of laboratories 13 13 13 13Mean value, g CBE/100 g CB 13.88 15.09 24.80 29.56True value, g CBE/100 g CB - 14.79 24.92 30.01Bias, g CBE/100 g CB - -0.3 0.12 0.45Repeatability limit r [r = 2.8 x sr], g/100 g 1.31 0.70 0.51 0.62Repeatability standard deviation sr, g/100 g 0.47 0.25 0.18 0.22Repeatability relative standard deviation RSDr, % 3.4 1.6 0.7 0.8Reproducibility limit R [R = 2.8 x sR], g/100 g 2.16 1.17 1.15 1.51Reproducibility standard deviation sR, g/100 g 0.77 0.42 0.41 0.54Reproducibility relative standard deviation RSDR, % 5.6 2.8 1.7 1.8HORRAT value = RSDR/predicted RSDR (1) 2.1 1.0 0.7 0.8
(1) predicted RSDR = 2C-0.1505; C = estimated mean concentration
Table A 13: Statistical evaluation of the results accepted on technical grounds
Sample number 17 18 19Year of collaborative study 2002Number of laboratories 13 13 13Mean value, g CBE/100 g CB 16.61 25.79 30.69True value, g CBE/100 g CB 15.07 24.90 30.01Bias, g CBE/100 g CB -1.54 -0.89 -0.68Repeatability limit r [r = 2.8 x sr], g/100 g 0.64 1.24 0.44Repeatability standard deviation sr, g/100 g 0.23 0.44 0.16Repeatability relative standard deviation RSDr, % 1.4 1.7 0.5Reproducibility limit R [R = 2.8 x sR], g/100 g 1.08 1.57 1.26Reproducibility standard deviation sR, g/100 g 0.39 0.56 0.45Reproducibility relative standard deviation RSDR, % 2.3 2.2 1.5HORRAT value = RSDR/predicted RSDR (1) 0.9 0.9 0.6
(1) predicted RSDR = 2C-0.1505; C = estimated mean concentration
Table A 14: Statistical evaluation of the results accepted on technical grounds
Sample number 20 21 22Year of collaborative study 2002Number of laboratories 13 13 13Mean value, g CBE/100 g CB 15.65 24.17 28.53True value, g CBE/100 g CB 14.97 24.97 29.96Bias, g CBE/100 g CB -0.68 0.8 1.03Repeatability limit r [r = 2.8 x sr], g/100 g 0.63 0.90 0.62Repeatability standard deviation sr, g/100 g 0.22 0.32 0.22Repeatability relative standard deviation RSDr, % 1.4 1.3 0.8Reproducibility limit R [R = 2.8 x sR], g/100 g 0.87 1.09 1.14Reproducibility standard deviation sR, g/100 g 0.31 0.39 0.41Reproducibility relative standard deviation RSDR, % 2.0 1.6 1.4HORRAT value = RSDR/predicted RSDR (1) 0.7 0.6 0.6
(1) predicted RSDR = 2C-0.1505; C = estimated mean concentration

- 29 -
Table A 15: Statistical evaluation of the results accepted on technical and statisticalgrounds
Sample number 12 14 15 16Year of collaborative study 2002Number of laboratories 13 13 13 13Number of outliers 1 1 0 0Identity of outlying laboratories 6 6 - -Reason for removal (C=Cochran; DG=Double Grubbs) C C - -Number of accepted results 12 12 13 13Mean value, g CBE/100 g CB 13.99 15.14 24.80 29.56True value, g CBE/100 g CB - 14.79 24.92 30.01Bias, g CBE/100 g CB - -0.35 0.12 0.45Repeatability limit r [r = 2.8 x sr], g/100 g 0.72 0.47 0.51 0.62Repeatability standard deviation sr, g/100 g 0.26 0.17 0.18 0.22Repeatability relative standard deviation RSDr, % 1.8 1.1 0.7 0.8Reproducibility limit R [R = 2.8 x sR], g/100 g 1.72 1.00 1.15 1.51Reproducibility standard deviation sR, g/100 g 0.61 0.36 0.41 0.54Reproducibility relative standard deviation RSDR, % 4.4 2.4 1.7 1.8HORRAT value = RSDR/predicted RSDR (1) 1.6 0.9 0.7 0.8
(1) predicted RSDR = 2C-0.1505; C = estimated mean concentration
Table A 16: Statistical evaluation of the results accepted on technical and statisticalgrounds
Sample number 17 18 19Year of collaborative study 2002Number of laboratories 13 13 13Number of outliers 2 1 0Identity of outlying laboratories 5, 7 6 -Reason for removal (C=Cochran; DG=Double Grubbs) DG C -Number of accepted results 11 12 13Mean value, g CBE/100 g CB 16.63 25.87 30.69True value, g CBE/100 g CB 15.07 24.90 30.01Bias, g CBE/100 g CB -1.56 -0.97 -0.68Repeatability limit r [r = 2.8 x sr], g/100 g 0.60 0.72 0.44Repeatability standard deviation sr, g/100 g 0.21 0.26 0.16Repeatability relative standard deviation RSDr, % 1.3 1.0 0.5Reproducibility limit R [R = 2.8 x sR], g/100 g 0.64 1.20 1.26Reproducibility standard deviation sR, g/100 g 0.23 0.43 0.45Reproducibility relative standard deviation RSDR, % 1.4 1.7 1.5HORRAT value = RSDR/predicted RSDR (1) 0.5 0.7 0.6
(1) predicted RSDR = 2C-0.1505; C = estimated mean concentration

- 30 -
Table A 17: Statistical evaluation of the results accepted on technical and statisticalgrounds
Sample number 20 21 22Year of collaborative study 2002Number of laboratories 13 13 13Number of outliers 0 1 0Identity of outlying laboratories - 6 -Reason for removal (C=Cochran; DG=Double Grubbs) - C -Number of accepted results 13 12 13Mean value, g CBE/100 g CB 15.65 24.17 28.53True value, g CBE/100 g CB 14.97 24.97 29.96Bias, g CBE/100 g CB -0.68 0.8 1.03Repeatability limit r [r = 2.8 x sr], g/100 g 0.63 0.53 0.62Repeatability standard deviation sr, g/100 g 0.22 0.19 0.22Repeatability relative standard deviation RSDr, % 1.4 0.8 0.8Reproducibility limit R [R = 2.8 x sR], g/100 g 0.87 1.00 1.14Reproducibility standard deviation sR, g/100 g 0.31 0.36 0.41Reproducibility relative standard deviation RSDR, % 2.0 1.5 1.4HORRAT value = RSDR/predicted RSDR (1) 0.7 0.6 0.6
(1) predicted RSDR = 2C-0.1505; C = estimated mean concentration