validation of nasa space radiation analysis tools with iss
TRANSCRIPT

SEP, Solar Modulation and Space Radiation: New Opportunities in the AMS-02 ERA October 18-23, 2015
Honolulu, Hawaii
Validation of NASA Space Radiation Analysis Tools with ISS Radiation Environment Monitor (REM) Data
Martha S. Clowdsley1, Steven A. Walker2, Xu Xiaojing3, H. Lee Abston1, Nicholas A. Vitullo4, Tony C. Slaba1, Steve R. Blattnig1,
Dustin R. Whitlow4, Charles J. Wittkopp1, Frank L. Boyer1, Francis F. Badavi2, Christopher J. Mertens1, John W. Norbury1
1NASA Langley Research Center, Hampton, VA
2Old Dominion University, Norfolk, VA 3Science Systems and Applications, Inc., Hampton, VA
4Analytical Mechanics Associates, Inc., Hampton, VA

Radiation Exposure Analysis Process
2
Dosimetric and/or Biological response
Shielding models
Environment models
Physics models
nasa.gov/sites/default/files/14-271.jpg
nasa.gov/centers/johnson/slsd/about/divisions/hacd/hrp/about-space-radiation.html

3
SUMMARY
Cross Sections �i , �ij PHYSICS (NUCFRG,QMSFRG)
Boltzmann TRANSPORT Eqn ) FLUENCE �i [#/cm2/MeV ] (HZETRN)
@
@x� @
@ESi(E) + �i(E)
�
�i(x ,E) =X
j
Z 1
EdE 0 �ij(E ,E 0) �j(x ,E 0)
Dose D(x) =X
i
Z 1
0dE Si(E) �i(x ,E) [Gy = J/kg]
Dose Equivalent H(x) =X
i
Z 1
0dE Q(Li(E)) Li(E) �i(x ,E) [Sv]
Effective Dose E =X
T
wT HT [Sv] ) Risk
BIOLOGY Q(Li),wT Li ⌘dEdx
⇡ Si(E)
JUNE 20, 2015 6 / 75

Overview
• Measurements made with the Radiation Environment Monitor (REM) units currently onboard the International Space Station (ISS) provide an opportunity to perform end-to-end validation of radiation analysis tools used by NASA to predict astronaut exposure.
• This validation effort is being performed under the NASA Advanced Exploration Systems (AES) RadWorks project.
• This work is on-going. The current status is reported in this presentation.
4
REM Unit in the Cupola1
ISS REM unit2
1NASA JSC Imagery Online website
2Kroupa, M., et al. A semiconductor radiation imaging pixel detector for space radiation dosimetry. Life Sci. Space Res. (2015)

Detector Locations Used for Validation • Dose in silicon and dose equivalent in tissue have been calculated for 3 ISS REM
locations: US Lab, Node 1, and Cupola • As an additional check, dose in tissue and dose equivalent in tissue have been
calculated for the Tissue Equivalent Proportional Counter (TEPC) location in the Service Module (SM)
5

Updates to ISS CAD models
ISS CAD models were updated to accurately reflect the shielding mass surrounding the detectors: • Overlapping parts and holes in the models fixed • Volumetric models created for parts represented
only as surfaces • Internal rack placement updated to match current
configuration • Part masses updated to agree with best available
information at the rack and large component level
6
US Lab CAD Model *This effort is ongoing – Updated modules shown
Module Final CAD Model Mass (lbm)
In Space Module Mass (lbm)
Source on In Space Mass
Airlock 22,604.37 22,594.00 B. BakerColumbus 36,158.75 38,138.36 ISS Mass Properties SpreadsheetJEM 88,128.28 87,610.94 ISS Mass Properties SpreadsheetNode 1 22,986.37 22,986.38 ISS Mass Properties SpreadsheetNode 2 30,646.38 35,933.72 ISS Mass Properties SpreadsheetNode 3 49,170.18 46,238.64 SPIDER database/ISS Mass Properties SpreadsheetPMA 1 2,494.82 2,494.59 B. Baker/ISS Mass Properties GroupPMA 2 2,494.47 2,494.59 B. Baker/ISS Mass Properties GroupPMA 3 2,492.76 2,494.59 B. Baker/ISS Mass Properties GroupSM 53,264.57 54,260.64 SPIDER database/ISS Mass Properties SpreadsheetUS Lab 55,676.12 55,676.00 B. Baker/ISS Mass Properties Group
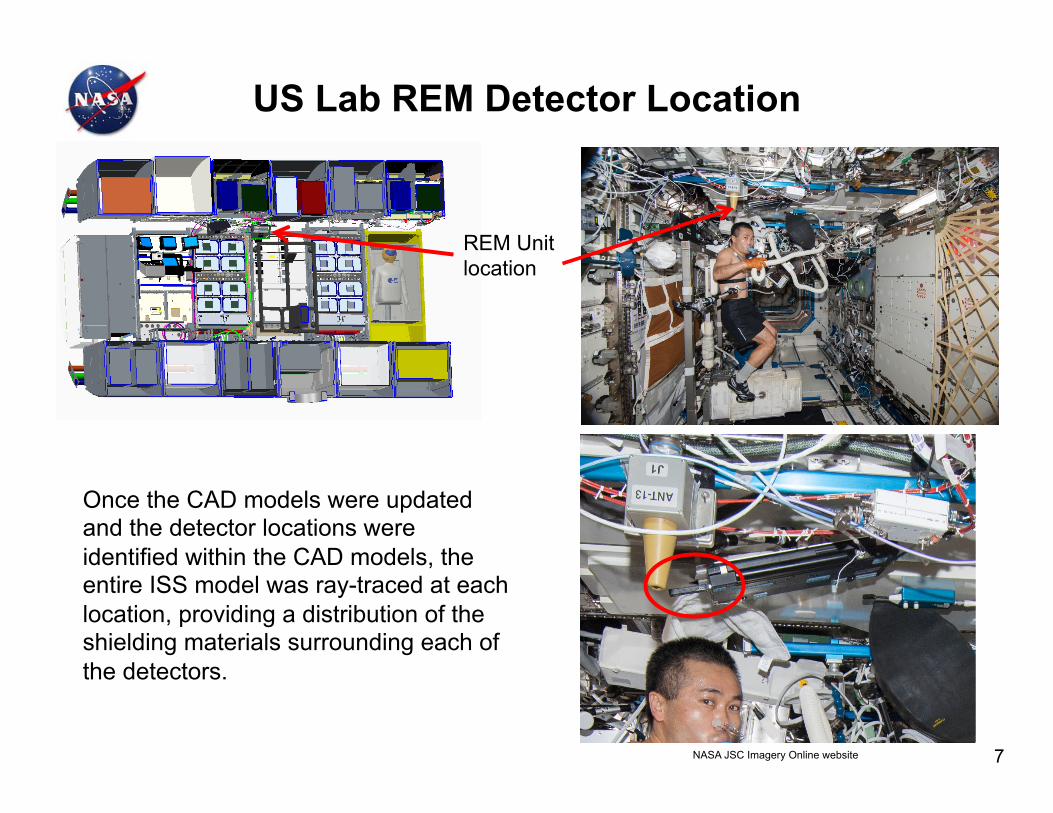
US Lab REM Detector Location
7
REM Unit location
Once the CAD models were updated and the detector locations were identified within the CAD models, the entire ISS model was ray-traced at each location, providing a distribution of the shielding materials surrounding each of the detectors.
NASA JSC Imagery Online website

Computational Procedure
8
• Environment boundary conditions computed for points at 2 minute intervals along the ISS trajectory
– GCR modulated by the Earth’s magnetic field – trapped protons – albedo neutrons
• Flux spectra versus shield thickness databases computed using HZETRN • Flux databases converted into dose in silicon, dose in tissue, and dose equivalent
in tissue versus thickness databases for each trajectory point • Dose and dose equivalent
computed for each trajectory point
– First, interpolated over the dose versus thickness database for each ray
– then integrating over all the rays in the ray-trace
Created by G. Qualls, NASA LaRC
ISS Ray-Trace

Baseline Analysis Assumptions
• External radiation environments are modelled as isotropic, except where the Earth’s shadow blocks the GCR environment
• All trapped protons energetic enough to penetrate the ISS pressure vessel occur within the South Atlantic Anomaly (SAA) Ø Removal of trajectory points between 2.5 and 47.5 degrees South and
12.5 – 77.5 degrees West will result in the removal of all penetrating trapped protons
• GCR environment model: Badhwar-O’Neill 2013 • Vertical cutoff rigidity model: Stormer’s model • Trapped proton environment model: AP8 (Badavi time dependence and
normalization) • Rays in the ray-trace: 9002 • ICRP 60 quality factor used to calculate dose equivalent
9

Calculation Results – Dose Rate
10
• Calculated results appear to accurately model the time dependence of the varying dose rate within ISS
• Similar trends for all 4 detectors
Dose Rate in Silicon, Nov. 16, 2013

Calculation Results – US Lab Dose Rate
11
Dose Rate in Silicon, Nov. 16, 2013
SAA Passes
Near the Equator
Closer to the Poles

Average Dose Rate (2 minute bins)
12
• Calculated results appear to under-predict measurements
• The under-prediction appears to be larger near the equator, where the magnetic field rigidity is largest
Dose Rate in Silicon, Nov. 16, 2013

Dose Rate vs. Rigidity
13
• Dose rate plotted against the rigidity of the Earth’s magnetic field
• Under-prediction of mean for US Lab detector: • ~18% at low rigidity
(most like free space) • ~60% at high rigidity
• Results were similar for the other detector locations
US Lab Dose Rate in Silicon, Nov. 16-25, 2013

Dose Equivalent Rate vs. Rigidity
14
• Dose equivalent was calculated, because it is more directly related to human risk than dose
• Better agreement between calculated and measured results than for dose
• Under-prediction of mean for the US Lab detector: • ~6% at low rigidity • ~49% at high rigidity
• Results were similar for the other detector locations
US Lab Dose Eq. Rate in Silicon, Nov. 16-25, 2013
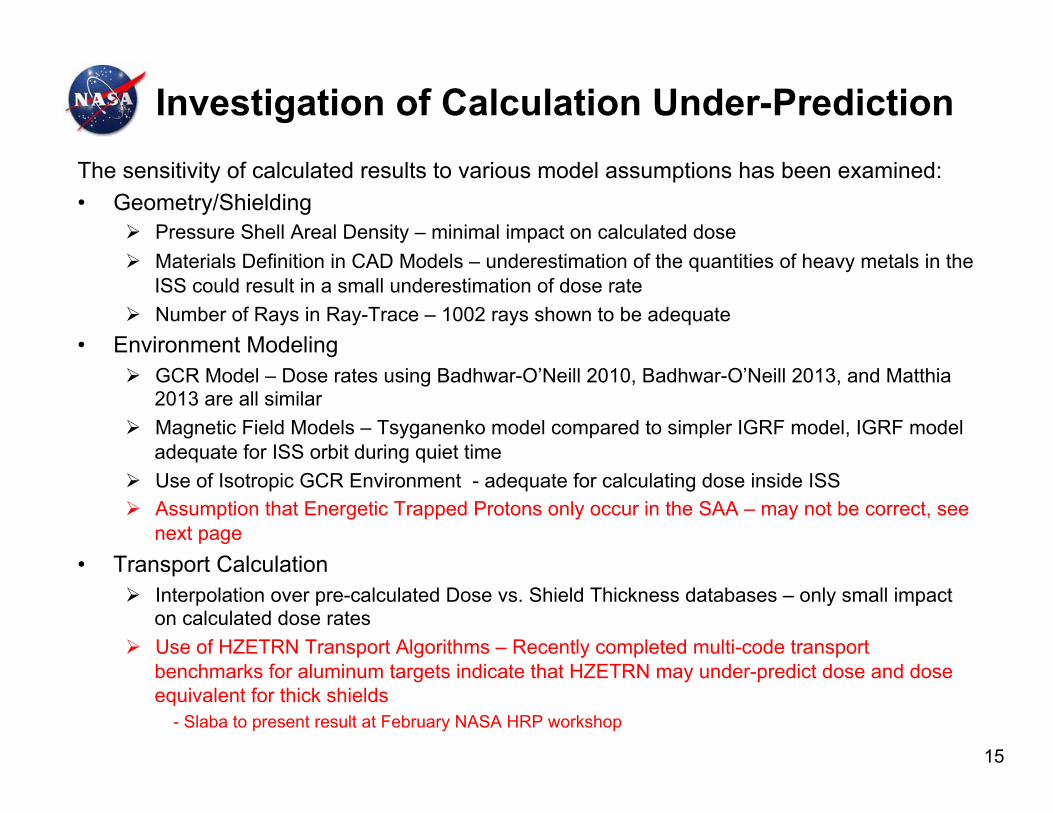
Investigation of Calculation Under-Prediction The sensitivity of calculated results to various model assumptions has been examined: • Geometry/Shielding
Ø Pressure Shell Areal Density – minimal impact on calculated dose Ø Materials Definition in CAD Models – underestimation of the quantities of heavy metals in the
ISS could result in a small underestimation of dose rate Ø Number of Rays in Ray-Trace – 1002 rays shown to be adequate
• Environment Modeling Ø GCR Model – Dose rates using Badhwar-O’Neill 2010, Badhwar-O’Neill 2013, and Matthia
2013 are all similar Ø Magnetic Field Models – Tsyganenko model compared to simpler IGRF model, IGRF model
adequate for ISS orbit during quiet time Ø Use of Isotropic GCR Environment - adequate for calculating dose inside ISS Ø Assumption that Energetic Trapped Protons only occur in the SAA – may not be correct, see
next page • Transport Calculation
Ø Interpolation over pre-calculated Dose vs. Shield Thickness databases – only small impact on calculated dose rates
Ø Use of HZETRN Transport Algorithms – Recently completed multi-code transport benchmarks for aluminum targets indicate that HZETRN may under-predict dose and dose equivalent for thick shields
- Slaba to present result at February NASA HRP workshop
15

PAMELA Measurements
16
• Recent PAMELA (Payload for Antimatter Exploration and Light-nuclei Astrophysics) measurements include a high energy proton component not represented in current trapped proton models
• Preliminary analysis shows that inclusion of these protons might correct part of the systematic under-estimate at high cutoff rigidities
• However, PAMELA is a directional measurement looking directly away from Earth
• More information about the angular distribution and time dependence of these protons is needed
• AMS-02 measurements may help

Summary
• An effort to validate radiation analysis tools with ISS REM measurements is underway.
• Dose and dose equivalent rates have been calculated and compared to ISS REM and TEPC measurements.
• Calculated results accurately model the time dependence, but under-predict the total dose and dose equivalent rates.
• This under-prediction varies from less than 20% for dose equivalent at high latitudes to more that 60% for dose near the equator.
• A number of model assumptions related to geometry, environments, and transport calculation have been investigated to better understand their impact on the calculation under-prediction. – Most of the model assumptions examined had minimal affect on results. – However, the possible under-prediction of the HZETRN transport code for
thick shields and high energy protons not represented in current trapped proton environment models are deemed worthy of future study.
17

Acknowledgements
• This work is funded under the NASA AES RadWorks project. • Thanks to the RadWorks leadership team, Bobbie Gail Swan, David
Moore, Edward Semones, and Catherine Mcleod, for their enthusiastic support.
• Thanks to Amir Bahadori, Nicholas Stoffle, Ryan Rios, Martin Kroupa, and Andrew Welton, past and present members of the NASA JSC Space Radiation Analysis Group, for their help obtaining ISS CAD models and REM detector data, and for their willingness to answer questions about both topics.
• Thanks to Bruce Baker of the ISS Mass Properties Group for his help gathering mass information for the various ISS modules.
18

Impact of AMS-02 Measurements on Reducing GCR Model Uncertainties
T.C. Slaba1, P.M. O’Neill2, S. Golge3, J.W. Norbury1
1NASA Langley Research Center, Hampton, VA 2NASA Johnson Space Center, Houston, TX
3University of Houston, Houston, TX
Solar Energetic Particles, Solar Modulation and Space Radiation: New Opportunities in the AMS-02 ERA
October 18-23, 2015 Honolulu, Hawaii, USA

2
Outline
• Radiation exposure analysis overview
• Initial sensitivity and uncertainty quantification results
• Galactic cosmic ray (GCR) models
• Impact of AMS-02 measurements on reducing uncertainties

3
Impact of GCR Model Uncertainty
• GCR protons account for >50% of the total exposure behind shielding(1)
• GCR alphas are the next largest contributor • Ions with Z > 2 and energy below 500 MeV/n (ACE) account for less than
5% of the exposure
Boundary energy interval (GeV/n) < 0.25 [0.25, 0.5] [0.5, 1.5] [1.5, 4] > 4 Total Z = 1 1.2 5.4 18.2 18.4 14.8 58.1 Z = 2 1.2 2.2 4.1 2.9 1.7 12.2 Z = 3-10 < 0.1 3.3 3.8 1.3 0.8 9.1 Z = 11-20 < 0.1 0.2 6.6 2.0 1.1 10.0 Z = 21-28 < 0.1 < 0.1 4.7 3.8 2.1 10.6 Totals 2.5 11.1 37.4 28.4 20.5 100.0
Relative contribution (%) of each boundary ion/energy group to effective dose behind 20 g/cm2 aluminum during solar minimum(1).
(1) Slaba, T.C., Blattnig, S.R., Space Weather 12: 217-224, 2014.

4
• GCR model uncertainty induces roughly +20% error on effective dose(2)
– Results below for Badhwar-O’Neill (BON) 2014 GCR model(3)
Effective dose versus shield thickness during solar minimum
• Error bars represent uncertainty associated with GCR model only
• For nominal vehicle shielding (>10 g/cm2), relative errors are roughly +20%
Impact of GCR Model Uncertainty
(2) Slaba, T.C., Xu, X., Blattnig, S.R., Norman, R.B., Space Weather 12: 233-245, 2014. (3) O’Neill, P.M., Golge, S., Slaba, T.C., NASA TP 2015-218569, 2015.

5
Badhwar-O’Neill Model Description
• The Badhwar O'Neill (BON) galactic cosmic ray model is used at NASA as input into radiation transport codes for – vehicle design, mission analysis, astronaut risk analysis – other models used as well (discussed in later slides)
• BON model revisions are based on the same fundamental framework – Model equations are solved to describe particle transport through solar
system – Solar activity is described by a single parameter related to observed sunspot
numbers

6
International Models and Comparisons
• Matthia et al. (DLR) recently developed a simplified form of Nymmik’s model(6)
– Shown to be reasonably accurate(2,6)
• Nymmik (MSU) has developed a semi-empirical model(4,5) (not shown)
– Used by Russian Space Agency & others (DLR, ESA)
– Official update has not been provided recently
• GCR models tend to agree reasonably well at highest energies(2)
– Effects of solar modulation are less pronounced – Significant contributor to exposure behind shielding
GCR proton & alpha flux compared to measurements
(2) Slaba, T.C., Xu, X., Blattnig, S.R., Norman, R.B., Space Weather 12: 233-245, 2014. (4) Nymmik, R.A., Panasyuk, M.I., Suslov, A.A., Adv. Space Res. 17: (2)19-(2)30, 1996. (5) International Standards Organization (ISO) 15390, 2004. (6) Matthia, D., Berger, T., Mrigakshi, A.I., Reitz, G., Adv. Space Res. 51: 329-338, 2013.

7
International Models and Comparisons • Exposures behind shielding are in good agreement if updated GCR
models are used – BON2014 and Matthia are within 10% of each other, on average, over past 40 years
Effective dose versus time behind 20 g/cm2 aluminum shielding

8
GCR Model Development
• GCR models are developed and validated using available measurements – Short duration, high energy, balloon and satellite measurements – Low energy, continuous measurements from ACE/CRIS (most of the available measurements) – Current gap in measurement database for continuous, high energy measurements
Name Flight Time Ions (Z) Energy (GeV/n) Data pts.
ACE/CRIS Satellite 1998-present 5-28 0.05 – 0.5 8288 AMS STS-91 1998 1, 2 0.1 – 200 58 ATIC-2 Balloon 2002 1, 2, 6, 8, 10,…,14, 26 4.6 – 103 55 BESS Balloon 1997-2000, 2002 1, 2 0.2 – 22 300 CAPRICE Balloon 1994, 1998 1, 2 0.15 – 350 93 CREAM-II Balloon 2005 6-8, 10, 12, 14, 26 18 – 103 42 HEAO-3 Satellite 1979 4-28 0.62 – 35 331 IMAX Balloon 1992 1, 2 0.18 – 208 56 IMP-8 Satellite 1974 6, 8, 10, 12, 14 0.05 – 1 53 LEAP Balloon 1987 1, 2 0.18 – 80 41 MASS Balloon 1991 1, 2 1.6 – 100 41 PAMELA Satellite 2006-2009 1, 2 0.08 – 103 472 TRACER Balloon 2003 8, 10, 12,…,20, 26 0.8 – 103 55 Lezniak Balloon 1974 4-14, 16, 20, 26 0.35 – 52 131 Minagawa Balloon 1975 26, 28 1.3 – 10 16 Muller STS-51 1985 6, 8, 10, 12, 14 50 – 103 16 Simon Balloon 1976 5-8 2.5 – 103 46
82% of available
data

9
• Recent work has significantly reduced model uncertainties(3) – More rigorous approach to model calibration and validation – resulted in BON2014
– Determined measurements (energies) most important for exposure quantities behind shielding
– Model parameters calibrated using optimization methods with an emphasis on higher energies
– Comprehensive validation metrics applied to quantify model uncertainty
– Process can include new measurements and is repeatable
Fraction of available measurements in each
energy bin
Galactic Cosmic Ray Model Development
(3) O’Neill, P.M., Golge, S., Slaba, T.C., NASA TP 2015-218569, 2015.

10
• Widely used GCR models are mainly semi-empirical – Data are needed to refine free parameters in models
• AMS-02 data will serve two important functions – Provide substantial data for independent validation
(i.e. data not used to tune model) – Fill important data gaps to enable improved parameter calibration
• Current schedule for using AMS-02 for GCR measurements is mainly driven by impact on exposure – Monthly GCR proton measurements for energies greater than 500 MeV – Next step is to analyze GCR alphas – Specific heavy ions will be emphasized later
Impact of AMS-02 Data

11
• If GCR proton and alpha uncertainty is cut in half – Uncertainty estimate drops from roughly +20% to +15%
Impact of AMS-02 Data
Effective dose versus shield thickness during solar minimum
• Error bars represent uncertainty associated with GCR model only
• Blue error bars represent current model uncertainties
• Red error bars represent assumed modified uncertainties with AMS-02 measurements

12
• If GCR proton and alpha uncertainty is entirely removed – Uncertainty estimate drops from roughly +20% to +5%
Impact of AMS-02 Data
Effective dose versus shield thickness during solar minimum
• Error bars represent uncertainty associated with GCR model only
• Blue error bars represent current model uncertainties
• Red error bars represent assumed modified uncertainties with AMS-02 measurements

13
Summary
• Widely used GCR models rely on available measurements – Measurements used directly for development and validation – Updated models are in reasonable agreement – GCR models induce roughly +20% uncertainty on effective dose behind
shielding
• AMS-02 will fill an important gap in the measurement database – Significant need for high energy, time-resolved proton and alpha
measurements – Current measurement database is dominated by ACE/CRIS – ACE/CRIS measurement domain induces less than 5% of exposure behind
shielding
• Proton and alpha measurements from AMS-02 will reduce model uncertainties – Possibility exists to have a significant impact on reducing overall exposure
uncertainties
GCR Simulator Development Status at the NASA Space Radiation Laboratory
T.C. Slaba, J.W. Norbury, S.R. Blattnig
NASA Langley Research Center, Hampton, VA Solar Energetic Particles, Solar Modulation and Space Radiation:
New Opportunities in the AMS-02 ERA October 18-23, 2015
Honolulu, Hawaii, USA

2
Note: Most of the content described in this presentation can be found in: Slaba, T., Blattnig, S., Norbury, J., Rusek, A., La Tessa, C., Walker, S., GCR Simulator Reference Field and a Spectral Approach for Laboratory Simulation. NASA Technical Paper 2015-218698 (2015).

3
Overview
• Long term exposure to GCR presents a serious health risk to astronauts - Large uncertainties connected to the biological response - Main goal of the NASA/HRP radiobiology experimental research program is to mitigate the risk
through uncertainty reduction and countermeasure development
• Radiobiology experiments are performed to reduce uncertainties and understand basic mechanisms for carcinogenesis, CNS and cardiovascular effects
- Most experiments have been performed with individual ion species and/or energies - Approach is guided in part by desire to understand basic mechanisms - Heavily influenced by facility constraints and cost
• GCR environment is a broad spectrum of particles and energies - Difficult to provide in a laboratory
• NSRL has matured to a point where simulating a “broad” spectrum of particles and energies in a single experiment is feasible from a facility and cost perspective
- Still can’t simulate full GCR spectrum in one experiment but can do better than a single particle and energy (e.g. 56Fe at 1 GeV/n)

4
Overview
• The “GCR simulator” is not intended to take the place of single beam studies - Single beam studies are needed to examine and improve understanding of basic mechanisms - Also needed to test, develop, and validate theoretical and computational models - Developing use-cases for GCR simulator through ongoing community discussions
• The GCR simulator should be viewed as a new and enabling technology that enhances current capabilities
- Provides opportunity to test models derived from single beam studies in more realistic scenario - Improves operational efficiency of NSRL, which in turn, improves efficiency for single beam studies
• The GCR simulator is intended to deliver deep space, shielded 7ssue environment to biological targets in a laboratory se;ng -‐ Used to study a range of space radiobiology ques7ons -‐ Provides a more realis7c scenario for countermeasure development and tes7ng

5
External and Internal Fields
• The external field is modified as it passes through shielding and tissue - Slowing down due to atomic processes - Attenuation and breakup of heavy ions due to nuclear collisions - Secondary particle production
Selected particle spectra in free space (left pane) and behind 5 g/cm2 of aluminum and 30 g/cm2 of water (right pane) during solar minimum

6
External and Internal Fields
• An important question is whether to design the simulator using the free space, external field or local tissue field
External field
Local tissue field

7
External and Internal Fields
• External field approach Aluminum
shield Biological target
Beam Beams selected to represent external,
free space field before shielding
• Local tissue field approach
Biological target
Beam Beams selected to directly represent
shielded tissue field
External field
Local tissue field

8
External and Internal Fields
• Facility constraints have a significant impact on simulator design - Current NSRL limits: protons (2.5 GeV) and heavier ions (1.0 GeV/n) - Upgrade: protons (4.0 GeV) and heavier ions (1.5 GeV/n)
Energy cutoff description Free space approach Local field approach
Current NSRL energy constraints 47% 88%
Upgrade NSRL energy constraints 63% 91%
Fraction of effective dose delivered by energies within NSRL energy constraints
- Results for female phantom behind 20 g/cm2 of aluminum shielding during solar minimum - Other scenarios and exposure quantities lead to qualitatively similar results

9
External and Internal Fields
• Results indicate that energy constraints at NSRL limit the feasibility of simulating the external, free space GCR field
- Missing ~half of the exposure
• Preliminary GCR simulator design will focus on reproducing the shielded tissue field
Local tissue field approach
Biological target
Beam Beams selected to directly represent
shielded tissue field

10
Reference Field Specification • Shielded tissue field in space depends on many factors
- Tissue location within body - Shielding material, thickness, and geometry - Solar activity
• Looked at variation associated with each of these factors - A single reference field for deep space can be defined
• Observed variation is likely within - GCR environmental model uncertainty (at least 20%) - Combined physics and transport modeling uncertainty - Experimental design uncertainty: representing broad GCR spectrum with relatively few
mono-energetic beams
• Varia7on in local 7ssue field was examined as a func7on of -‐ Tissue loca7on, shielding configura7on, shielding material, solar ac7vity
• Reference field specifica7on for GCR simulator -‐ Female BFO behind 20 g/cm2 spherical aluminum shielding during solar minimum condi7ons

11
Reference Field Specification
• Tissue exposure values vary by less than 20% behind a range of shielding configurations
- Variation is within even the GCR environmental model uncertainty (~+20%) - Increased variation in dose equivalent associated with HZE breakup - Blood forming organ (BFO), bladder, and breast appear as representative tissues - 20 g/cm2 aluminum appears as representative shielding
Tissue dose variation behind shielding Tissue dose equivalent variation behind shielding

12
Reference Field Specification
• LET spectra show little variation across tissue locations and shielding configurations
- Spectra appear as qualitatively similar - Variation below 200 keV/µm is likely within experimental design uncertainty - Variation above 200 keV/µm makes negligible contributions to exposure
Female BFO LET spectra behind shielding Tissue LET spectra behind shielding

13
Backup: Example Beam Info
• Proton beam information for example study
A Z Energy (MeV/n)
LET (kev/µm) (Z*/β)2 Intensity (#/
cm2-year) Dose (mGy/
year) 1 1 7.4 6.4 63.8 1.6 x 10⁵ 1.48 1 1 10.2 5.0 46.7 2.5 x 10⁵ 1.83 1 1 14.0 3.8 34.3 4.0 x 10⁵ 2.25 1 1 19.2 3.0 25.2 6.3 x 10⁵ 2.73 1 1 26.4 2.3 18.6 9.8 x 10⁵ 3.30 1 1 36.2 1.8 13.7 1.5 x 10⁶ 3.91 1 1 49.6 1.4 10.2 2.2 x 10⁶ 4.52 1 1 68.0 1.1 7.7 3.2 x 10⁶ 5.02 1 1 93.3 0.8 5.8 4.3 x 10⁶ 5.30 1 1 128.1 0.7 4.4 5.4 x 10⁶ 5.31 1 1 205.0 0.5 3.1 1.4 x 10⁷ 9.62 1 1 383.2 0.3 2.0 1.7 x 10⁷ 8.53 1 1 716.0 0.26 1.5 2.1 x 10⁷ 7.99 1 1 1337.9 0.23 1.2 2.1 x 10⁷ 6.04 1 1 2500.0 0.22 1.1 1.6 x 10⁷ 5.35

14
Backup: Example Beam Info
• Alpha beam information for example study
A Z Energy (MeV/n)
LET (kev/µm) (Z*/β)2 Intensity (#/
cm2-year) Dose (mGy/
year) 4 2 7.4 25.6 255.3 1.4 x 10⁴ 0.53 4 2 10.2 19.8 186.9 2.1 x 10⁴ 0.61 4 2 14.0 15.4 137.0 3.2 x 10⁴ 0.72 4 2 19.2 11.9 100.7 4.9 x 10⁴ 0.86 4 2 26.4 9.2 74.2 7.4 x 10⁴ 0.99 4 2 36.2 7.1 54.9 1.1 x 10⁵ 1.12 4 2 49.6 5.5 40.9 1.5 x 10⁵ 1.20 4 2 68.0 4.3 30.6 2.0 x 10⁵ 1.23 4 2 93.3 3.4 23.2 2.5 x 10⁵ 1.21 4 2 128.1 2.7 17.7 2.9 x 10⁵ 1.14 4 2 185.2 2.1 13.2 4.7 x 10⁵ 1.43 4 2 282.3 1.6 9.8 6.0 x 10⁵ 1.41 4 2 430.3 1.3 7.5 7.5 x 10⁵ 1.41 4 2 656.0 1.1 6.1 8.4 x 10⁵ 1.33 4 2 1000.0 1.0 5.2 8.2 x 10⁵ 1.16

15
Backup: Example Beam Info
• HZE beam information for example study
A Z Energy (MeV/n)
LET (kev/µm) (Z*/β)2 Intensity (#/
cm2-year) Dose (mGy/
year) 7 3 736 2.4 13.1 2.5 x 10⁴ 0.09 7 3 331 3.3 19.8 1.9 x 10⁴ 0.09 7 3 189 4.6 29.3 1.1 x 10⁴ 0.08 11 5 788 6.4 35.5 4.4 x 10⁴ 0.41 12 6 887 9.0 48.9 7.9 x 10⁴ 1.03 12 6 365 12.6 74.7 6.4 x 10⁴ 1.18 16 8 644 17.5 98.7 4.3 x 10⁴ 1.11 16 8 306 24.5 148.3 2.3 x 10⁴ 0.84 23 11 590 34.2 194.2 1.7 x 10⁴ 0.85 28 14 988 47.8 256.9 1.1 x 10⁴ 0.76 32 16 755 66.7 369.4 5.7 x 10³ 0.55 39 19 781 93.2 514.0 3.6 x 10³ 0.48 47 22 682 130.2 728.1 3.0 x 10³ 0.56 56 26 682 181.8 1016.8 2.8 x 10³ 0.74

16
• Beam induced spectral quantities are in good qualitative agreement with reference field
- Reasonable agreement across full range of LET values - (Z*/β)2 spectrum provides a somewhat independent check since beam selection was not guided by
this quantity
Example Beam Selection
Comparison of reference field spectra to beam induced quantities at center of phantom (isotropic irradiation)

17
Summary
• Facility constraints limit the ability to simulate the external, free space field directly - Proposed simulator design instead focuses on reproducing the local tissue field
• Variation in the induced tissue field was examined
- A single reference environment for deep space is reasonable at this time
• An approach for beam selection in the simulator was presented - The approach is tied directly to the reference environment flux - Allows systematic improvements to be made - Spectral quantities and integrated quantities are reasonably well represented - Optimization procedures could be developed to improve overall agreement
• Drawbacks of the proposed strategy include - Neutron and π/EM components - Lower energy constraints for HZE particles associated with animal models - These drawbacks could be addressed by augmenting the existing design if necessary