validation of the visual analog scale in the cervical spine
TRANSCRIPT

CLINICAL ARTICLEJ Neurosurg Spine 28:227–235, 2018
The visual analog scale (VAS) was first used in psy-chological research 100 years ago.7,13 During the last 30 years, the VAS has been developed and in-
vestigated in many medical fields. The 0- to 100-mm pain VAS is frequently used pre- and postsurgery as a tool to measure treatment outcome, even though changes in single pain assessments may not always accurately reflect treat-
ment outcome in any one individual. Inaccurate measure-ments can occur because of noise, changes due to the time of day when testing is done, or discrete environmental events that influence the patient during the assessment.17 Inaccuracy can also be due to lack of precision and an in-ability to discriminate between the numbers in a 100-point scale.11,15 The measurement noise has been approximated
ABBREVIATIONS CI = confidence interval; DDD = degenerative disc disease; HADS = Hospital Anxiety and Depression Scale; MCID = minimum clinically important dif-ference; MDC = minimum detectable change; PROM = patient-reported outcome measures; ROC = receiver operating characteristic; SD = standard deviation; SEM = stan-dard error of measurement; VAS = visual analog scale.SUBMITTED January 7, 2017. ACCEPTED May 30, 2017.INCLUDE WHEN CITING Published online December 15, 2017; DOI: 10.3171/2017.5.SPINE1732.
Validation of the visual analog scale in the cervical spineAnna MacDowall, MD,1 Martin Skeppholm, MD, PhD,2 Yohan Robinson, MD, PhD,1 and Claes Olerud, MD, PhD1
1Department of Surgical Sciences, Uppsala University Hospital, Uppsala; and 2Department for Learning, Informatics, Management and Ethics, Karolinska Institutet, Stockholm, Sweden
OBJECTIVE The visual analog scale (VAS) is frequently used to measure treatment outcome in patients with cervical spine disorders. The minimum clinically important difference (MCID) is the smallest change in a score that has clinical importance to the patient. Although it has been established for other medical fields, knowledge of the VAS MCID for the cervical spine is sparse, and it has rarely been considered in relation to measurement noise. The goals in this study were as follows: 1) to validate the VAS-neck and VAS-arm instruments for the cervical spine (e.g., repeatability); 2) to investigate the possible influence of predictive factors and the Hospital Anxiety and Depression Scale (HADS) score on repeatability; and 3) to compute the MCID with 5 different methods.METHODS A post hoc analysis of a prospective randomized controlled trial with 151 patients undergoing surgery for cervical radiculopathy due to degenerative disc disease was performed. Information on age, sex, smoking habits, ex-ercise, employment status, HADS score, and VAS-neck and VAS-arm scores was gathered before surgery and after 1 year. The VAS was applied twice on every occasion, with 15 minutes in between. Repeatability and the association with predictors and HADS score were analyzed using the 1-sample t-test, linear regression models, and Spearman correla-tion. The MCID was calculated with the following methods: average change, change difference, receiver operating char-acteristic curve, effect size, and minimum detectable change (MDC).RESULTS The repeatability in VAS-neck was 8.1 mm, and in VAS-arm it was 10.4 mm. Less consistent values on the VAS correlated to female sex and higher values on the HADS. For VAS-neck the MCID ranged from 4.6 to 21.4, and for VAS-arm it ranged from 1.1 to 29.1. The highest MCID came from the MDC method, which was the only method that gave values above the measurement noise in both VAS-neck and VAS-arm.CONCLUSIONS Measurement noise in VAS-neck and VAS-arm for the cervical spine was influenced by female sex and HADS score. The only method to compute MCID that consistently gave results above the measurement noise in VAS-neck and VAS-arm was the MDC.Clinical trial registration no.: 44347115 (www.isrctn.com).https://thejns.org/doi/abs/10.3171/2017.5.SPINE1732KEY WORDS visual analog scale; minimum clinically important difference; cervical degenerative disc disease; surgical treatment; Hospital Anxiety and Depression Scale
J Neurosurg Spine Volume 28 • March 2018 227©AANS 2018, except where prohibited by US copyright law
Unauthenticated | Downloaded 11/27/21 12:25 PM UTC
A. MacDowall et al.
J Neurosurg Spine Volume 28 • March 2018228
to be 20 mm on the 0- to 100-mm pain VAS.5 Presumably there are different factors that may influence the patient to be more or less consistent when it comes to filling out the VAS; hence, measurement noise might differ between patients. What these factors might be has not yet been in-vestigated in patients with neck pain.
To validate the use of VAS as a scale to measure treat-ment outcome, the minimum clinically important differ-ence (MCID) has been calculated in different ways by sev-eral authors.4 The MCID has been defined as “the smallest difference in a score of a domain of interest that patients perceive to be beneficial and that would mandate, in the absence of troublesome side effects and excessive costs, a change in the patient’s management.”16 The MCID differs between diagnoses, if the baseline pain score is high or low,28 and if one is measuring improvement or deteriora-tion.10,27 There is also no consensus on how to calculate the MCID, i.e., with anchor-based or distribution-based methods, and the different methods used give various re-sults.9,22 No MCID calculations are made on the 0- to 100-mm pain VAS questionnaire completed by patients with cervical spine disorders, but studies from other medical fields indicate an MCID between 13 and 19.9 mm.8,10, 27,28 If a patient cannot be more precise than 20 mm on a 100-mm scale, how can we then presume that a 13- to 20-mm change on that same scale can be an MCID?1
The aims of this study were as follows: 1) to compute the repeatability of VAS-neck and VAS-arm for the cervi-cal spine and to investigate associations between repeat-ability and age, sex, smoking habits, exercise, employment status, and psychological impairment; and 2) to compute the MCID of VAS-neck and VAS-arm, with 5 different methods.
MethodsThis study was a post hoc analysis of a prospective
randomized controlled trial of 151 patients treated at 3 hospitals in Sweden during 2007 through 2010. The pa-tients suffered from radiculopathy due to degenerative disc disease (DDD). After exposure and decompression, they were randomized to either artificial disc replacement (Discover; DePuy Spine/Johnson & Johnson) or plated fu-
sion performed using autologous iliac crest graft.26 Hence, the primary goal of the randomized controlled trial was not to validate the VAS for the cervical spine, and so the data were retrospectively analyzed. Inclusion and exclu-sion criteria are listed in Table 1. Patient demographic data at baseline are presented in Table 2.
The study was approved by the regional ethical re-view committee in Stockholm (Dnr: 2006/1266–31/3). Informed consent was obtained from patients before ran-domization. The study was registered at ISRCTN (www.isrctn.com) as “Total disc replacement versus fusion in cervical radiculopathy,” registration number 44347115.
Data CollectionPatient-reported outcome measures (PROM) question-
naires were distributed to the patients before surgery and 1 year after. The questionnaire started with baseline data (e.g., age, sex, smoking habits, exercise, and employment status), and a VAS for neck pain (VAS-neck) and arm pain (VAS-arm). It continued with the EQ-5D (EuroQol Group), European Myelopathy Scale, Neck Disability In-dex, and Hospital Anxiety and Depression Scale (HADS). The questionnaire ended with a pain-drawing test (an out-line of the body with painful areas shaded in) that also contained a second VAS-neck and VAS-arm. After the patient had completed the first VAS-neck and VAS-arm (VAS1) questionnaire, it took approximately 15 minutes to work through the other scales until the patient reached the last VAS-neck and VAS-arm (VAS2) questionnaire.
The VAS consisted of a 100-mm horizontal line with the description “no pain” on the far left and “worst pos-sible pain” on the far right.24 The patients were asked to make a vertical mark on the line to show the location that best represented the pain they had experienced during the last week. At the 1-year follow-up, the patients were also asked to contrast current pain with the pain they had ex-perienced before surgery, using 1 of the following 6 cat-egorical descriptors: 0, I had no pain before surgery; 1, all the pain is gone; 2, much improved; 3, little improved; 4, no change; and 5, worse. This “satisfaction index” was used as the anchor in the anchor-based methods to calcu-late MCID.
The HADS32 is a 14-item instrument in which 7 ques-
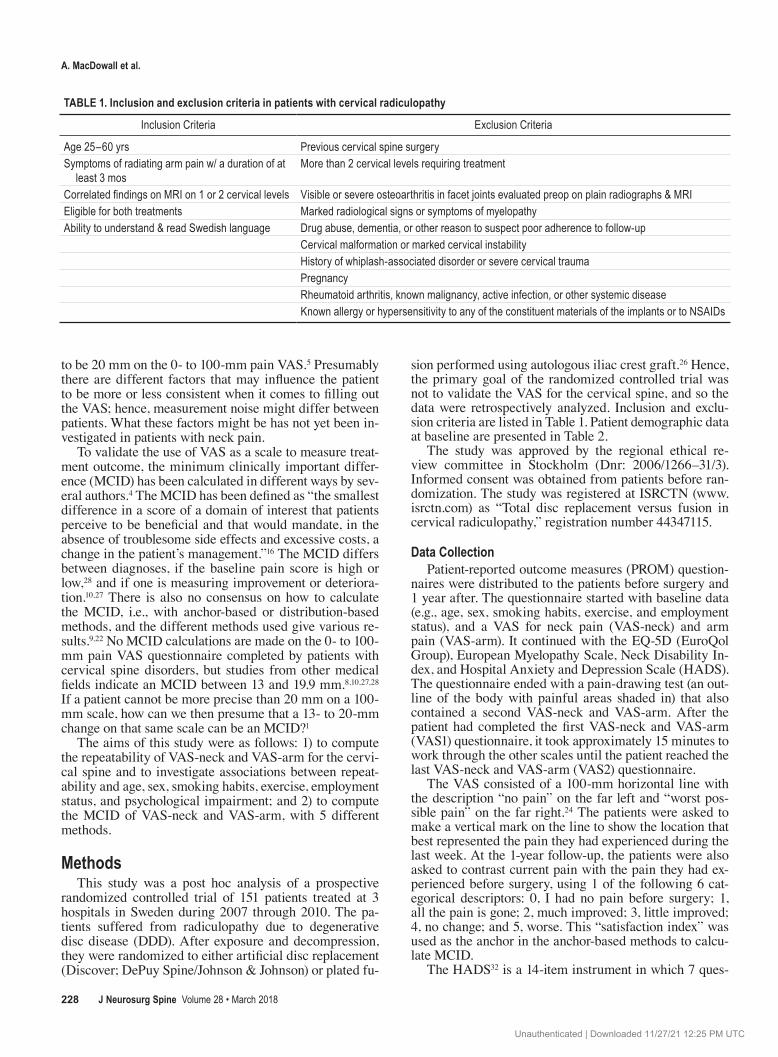
TABLE 1. Inclusion and exclusion criteria in patients with cervical radiculopathy
Inclusion Criteria Exclusion Criteria
Age 25–60 yrs Previous cervical spine surgerySymptoms of radiating arm pain w/ a duration of at
least 3 mosMore than 2 cervical levels requiring treatment
Correlated findings on MRI on 1 or 2 cervical levels Visible or severe osteoarthritis in facet joints evaluated preop on plain radiographs & MRIEligible for both treatments Marked radiological signs or symptoms of myelopathyAbility to understand & read Swedish language Drug abuse, dementia, or other reason to suspect poor adherence to follow-up
Cervical malformation or marked cervical instabilityHistory of whiplash-associated disorder or severe cervical traumaPregnancyRheumatoid arthritis, known malignancy, active infection, or other systemic diseaseKnown allergy or hypersensitivity to any of the constituent materials of the implants or to NSAIDs
Unauthenticated | Downloaded 11/27/21 12:25 PM UTC

Validation of the visual analog scale in the cervical spine
J Neurosurg Spine Volume 28 • March 2018 229
tions concern anxiety (HADS-a section) and 7 concern depression (HADS-d section). Every item is scored on a 4-point scale from 0 to 3, resulting in a maximum score of 42, 21 points maximum each for anxiety and depres-sion. The HADS is a validated tool in medical practice for screening psychological distress in nonpsychiatric patient populations.13,21 Falavigna et al.6 present a cutoff for the HADS-d score at ≥ 10 points, with a sensitivity of 71.1% and a specificity of 95.4% for patients undergoing spine surgery.
Statistical Analysis Study Population
The raw database consisted of 151 patients. Not all of these could be included, however, due to missing data. The guiding principle in selecting patients was that methods estimating comparable things should be based on the same database, taken to be the largest possible for the analyses performed. For simplicity, we used the same databases for VAS-neck and VAS-arm.
We identified 2 sets of similar analyses, with corre-sponding necessary variables. The first set consisted of methods comparing simultaneous preoperative VAS val-ues. Together, these methods need VAS1 preoperative val-ues, VAS2 preoperative values, predictors (e.g., age), and HADS. The second set comprised methods for determin-ing MCID. Together, these methods need VAS1 preopera-tive values, VAS2 preoperative values, DVAS (DVAS = VAS1 at 1 year postoperatively - VAS1 preoperatively), and the anchor (satisfaction index). In these analyses, we also removed patients with no reported preoperative pain (anchor = 0), which were 9 patients for VAS-neck and 2 patients for VAS-arm.
Because both sets of analyses need VAS1 and VAS2 preoperative values, we first formed the analysis database by requiring all these variables (4 in total; both VAS-neck and VAS-arm) to exist. This database is called the fully analyzed database and consists of 140 patients. From this, the databases used in the analyses were formed by also requiring the following variables to exist: set 1, fully ana-lyzed database plus predictors and HADS, 130 patients; and set 2, fully analyzed database plus DVAS, anchor (not equal to 0), 115 patients.
All statistical analyses were performed in R, version 3.1.0 (2014-04-10), x86_64-w64-mingw32.
Differences in VAS ValuesThe difference between the 2 preoperative VAS values
(VAS1 and VAS2) was studied in 2 ways. In the first, the magnitude (absolute value) of the difference was exam-ined, ignoring the minus sign, if any. This means that we do not care whether VAS1 or VAS2 is larger. In the sec-ond, the difference itself was examined, retaining any mi-nus signs. In this case, cancellations will occur, whereby negative differences (VAS2 larger) will cancel out positive ones (VAS1 larger). The most important feature of this analysis is that one can see which value is largest on aver-age. In both cases, the difference was analyzed using the 1-sample t-test, computing a confidence interval (CI) for the mean difference. The p value was calculated for the
null hypothesis of no difference (i.e., VAS2 equals VAS1 on average).
In addition, we created Bland-Altman plots. These plot the difference of VAS2 - VAS1 against the mean, (VAS2 + VAS1)/2, facilitating the detection of patterns like system-atic trends and correlation between location and spread.
Predictors for the Magnitude of VAS DifferencesAnalyses were performed to determine predictors for
large differences between the 2 preoperative VAS values. The outcome was the absolute difference of VAS2 - VAS1 (i.e., the minus sign, if any, was discarded).
Patients were dichotomized into 2 groups on the ba-
TABLE 2. Demographic data at baseline in patients with cervical radiculopathy
Patient Characteristics Value
Age in yrs, median (range) 46 (31–60)Sex Female 68 (48.6%) Male 72 (51.4%)Smoker No 94 (67.1%) Yes 46 (32.9%)Exercise No 92 (65.7%) Yes 48 (34.3%)Working No 19 (13.7%) Yes 120 (86.3%)Retired No 138 (99.3%) Yes 1 (0.7%)Unemployed No 124 (88.6%) Yes 16 (11.4%)Sick leave No 52 (37.7%) Yes 86 (62.3%)Disability pension No 65 (48 5%) Yes 69 (51.5%)Low-HADS group 94 (67.6%)High-HADS group 45 (32.4%)VAS1-neck, median (range) 62 (0–100)VAS2-neck, median (range) 61 (0–100)VAS1-arm, median (range) 61 (0–100)VAS2-arm, median (range) 58 (0–100)ΔVAS-neck, median (range) −28 (−93 to 27)ΔVAS-arm, median (range) −41 (−96 to 30)
ΔVAS = VAS at 1-year follow-up minus VAS at baseline.Values are expressed as the number of patients (%) unless otherwise indicated. The low-HADS group had scores of < 10 points and the high-HADS group had scores of ≥ 10 points.
Unauthenticated | Downloaded 11/27/21 12:25 PM UTC
A. MacDowall et al.
J Neurosurg Spine Volume 28 • March 2018230
sis of the HADS, 1 group with high values (high-HADS group) if either the anxiety or depression score was ≥ 10 points, and 1 group with low values (low-HADS group) if the anxiety or depression score was < 10 points, based on Falavigna et al.6,25 In the analysis with the dichotomized HADS, the HADS-total score was not accounted for.
Both univariate (only 1 predictor at a time) and mul-tivariate (all predictors in the same model) linear regres-sion models were fitted with the absolute difference in VAS, along with a number of predictors and dichotomized HADS. Regression coefficients (b), together with CIs and p values for the null hypothesis (b = 0), were calculated.
We used the results from the regression analysis above and singled out 2 predictors for further study—sex and di-chotomized HADS. The intention was to discover if there was a sex aspect to the high-HADS group. The correlation between these 2 was studied using the Fisher exact test. An OR < 1 means that men are less likely to be in the high-HADS group than women.
Analysis of the MCIDAnchor-Based Methods. Average Change (Within-Pa-
tients Score Change). This subsection defines the MCID as the average of -DVAS at a certain level of the anchor. The minus sign is there to avoid negative values (typically, DVAS < 0, corresponding to an improvement). The anchor value 3 (little improvement) was tried for MCID. The an-chor value 2 (much improved) was used to look at medium improvement, and the anchor value 1 (all the pain is gone) for great improvement. For each such value, the data were analyzed using the 1-sample t-test.
Change Difference (Between-Patients Score Change). This subsection defines MCID as the difference in DVAS between 2 adjacent levels of the anchor. Again, we largely avoided negative values by subtracting DVAS of the lower level from that of the higher. For MCID we used the dif-ference between anchor 4 (no change) and anchor 3 (little improvement). As a comparison, we also calculated dif-ferences for the patients who deteriorated (difference be-tween anchor 4 [no change] and anchor 5 [worse]). The values were compared using the 2-sample t-test.
Receiver Operating Characteristic Curve Analysis. This subsection defines MCID as the best cutoff point in -DVAS, discriminating improvements (anchor 1–3) from no change or deterioration (anchor 4–5). As usual, the mi-nus sign avoids negative values. A receiver operating char-acteristic (ROC) curve was produced for the correspond-ing diagnostic test, and the point closest to the ideal top left-hand corner was selected as the “optimal” cutoff. The MCID is defined as the value of -DVAS that corresponds to this point.
Distribution-Based Methods. Effect-Size–Derived MCID. This subsection defines MCID as a constant: the effect size times the standard deviation (SD) of baseline values. We have only used VAS1 preoperative values, not VAS2 preoperative values. Cohen’s effect sizes have gen-erally accepted benchmarks, so we use the “small” effect size (0.20) as the constant to calculate MCID.3 As a com-parison, we also calculated moderate improvement using the “moderate” effect size (0.50), and great improvement using the “large” effect size (0.80).
Minimum Detectable Change. The standard error of measurement (SEM) is an alternative way of calculat-ing the reliability or measurement noise for a scale when there is only one set of measurement values from each pa-tient in a study group. It is an estimation of how repeated measures would be distributed around the true score. The SEM is then calculated from the SD at baseline (s) and the test-retest reliability coefficient (r): SD × (1 - r)1/2. The test-retest reliability coefficient has previously been reported to be 0.95 for neck and arm pain scales.18 Although we had 2 VAS values on each patient, we decided to compute the test-retest reliability with our own study group, as follows: 1) the SEM, which is the SD that would be observed if a patient were to fill in a VAS questionnaire many times, and 2) the SD of the “true” values (1 per patient) s, VAS1, and VAS2 at baseline.
In addition, the test-retest reliability coefficient r (i.e., the intraclass correlation coefficient) was computed as r = s/(s2 + SEM2). The SDs were estimated using random-effects linear regression with the 2 preoperative VAS val-ues (VAS1 and VAS2) as outcome, and patient as random effect. Then, s is the random-effects SD, and SEM is the residual SD.
If the SEM with a 95% CI represents the measurement noise, then a value above or below the 95% CI around the mean reflects a value above or below the measurement noise, and hence the minimum detectable change (MDC). Based on SEM and a 95% CI, the MDC is computed as follows: MDC = 1.96 × √2 × SEM.
ResultsThe repeatability (e.g., measurement noise) in VAS-
neck was 8.1 mm (95% CI 6.7–9.4), and in VAS-arm it was 10.4 mm (95% CI 8.3–12.5). There were no tendencies to-ward the VAS1 being consistently higher or lower than the VAS2, for either VAS-neck (mean -0.1; 95% CI -2.0 to 1.9) or VAS-arm (mean -1.3; 95% CI -4.0 to 1.5) (Fig. 1).
In VAS-neck, there were no predictors of less consis-tent values between VAS1 and VAS2. In the multivariate analysis, there was a tendency toward more consistent VAS-neck values in patients who exercised regularly (b = -2.9; 95% CI -5.9 to -0.1). Less consistent values in VAS-arm were associated with female sex, in both the univari-ate (b = -5.3; 95% CI -9.3 to -1.2) and the multivariate (b = -4.8; 95% CI -9.0 to -0.7) analysis, and with the high-HADS group in the multivariate analysis (b = 4.7; 95% CI 0.1–9.3). Disability pension was associated with more consistent values in the multivariate analysis (b = -5.4; 95% CI -10.8 to -0.1) (Table 3). There were no asso-ciations between sex and the high-HADS group (OR 0.68; 95% CI 0.31–1.46); hence, the women and patients in the high-HADS group were not the same individuals.
The MCID for VAS-neck was 20.0 for average change, 14.4 for change difference, 20.5 for ROC, 4.6 for effect size, and 21.4 for MDC. The MCID for VAS-arm was 9.9 for average change, 1.1 for change difference, 7.0 for ROC, 5.0 for effect size, and 29.1 for MDC. The MCID values from all methods, and also medium improvement, great improvement, and deterioration, are summarized in Table 4.
Unauthenticated | Downloaded 11/27/21 12:25 PM UTC

Validation of the visual analog scale in the cervical spine
J Neurosurg Spine Volume 28 • March 2018 231
The values of -DVAS are illustrated in a dot plot with the MCID values from the ROC curve analysis super-posed as dashed lines (Fig. 2). The ROC curve with the optimal cutoff point marked is presented in Fig. 3. The area under the ROC curve was 0.883 for VAS-neck and 0.913 for VAS-arm.
The SD (VAS1) at baseline in the effect-size MCID cal-culation was 22.9 for VAS-neck and 25.0 for VAS-arm. The MDC was calculated with SEM (VAS-neck 7.7, VAS-arm 10.5), the SD (VAS1, VAS2) at baseline (s: VAS-neck 20.3, VAS-arm 21.6), and the test-retest reliability coef-ficient (r: VAS-neck 0.874, VAS-arm 0.810).
FIG. 1. Bland-Altman plot. The VAS2 - VAS1 difference is plotted against the mean, (VAS2 + VAS1)/2.
TABLE 3. Association between predictors and the difference of VAS2 minus VAS1 in patients with cervical radiculopathy
Predictor
Regression Coefficient (95% CI)VAS-Neck VAS-Arm
Univariate Multivariate Univariate Multivariate
Age in yrs 0.04 (−0.16 to 0.24) −0.01 (0.23 to 0.20) 0.20 (−0.11 to 0.52) 0.31 (−0.01 to 0.63)Sex, M vs F −1.9 (−4.6 to 0.7) −1.9 (−4.7 to 0.8) −5.3 (−9.3 to −1.2) −4.8 (−9.0 to −0.7)Smoker 0.7 (−2.1 to 3.6) −0.7 (−3.8 to 2.4) −0.4 (−4.8 to 4.1) 0.3 (−4.3 to 5.0)Exercise −2.2 (−5.0 to 0.6) −2.9 (−5.9 to −0.1) 3.4 (−0.9 to 7.8) 4.4 (−0.2 to 8.9)Employment −1.8 (−5.6 to 2.1) −0.0 (−5.2 to 5.2) −1.8 (−7.9 to 4.2) −3.1 (−11.0 to 4.7)Retired 17.1 (2.0 to 32.1) 18.4 (2.2 to 34.7) 2.6 (−21.3 to 26.5) −10.3 (−34.9 to 14.2)Unemployed 0.6 (−3.7 to 4.9) 0.1 (−5.1 to 5.4) −2.5 (−9.2 to 4.3) −4.7 (−12.6 to 3.2)Sick leave 0.1 (−2.7 to 2.8) −1.0 (−4.5 to 2.4) 0.3 (−4.0 to 4.6) 2.9 (−2.4 to 8.1)Disability pension 0.7 (−1.9 to 3.4) 1.1 (−2.4 to 4.6) −1.6 (−5.7 to 2.6) −5.4 (−10.8 to −0.1)HADS (high-HADS vs low-HADS scores) 1.2 (−1.6 to 4.0) 0.2 (−2.9 to 3.2) 3.3 (−1.1 to 7.7) 4.7 (0.1 to 9.3)
Positive regression coefficients (b > 0) correspond to less consistent VAS values.
Unauthenticated | Downloaded 11/27/21 12:25 PM UTC

A. MacDowall et al.
J Neurosurg Spine Volume 28 • March 2018232
DiscussionThis validation study considers, for the first time, the
MCID derived from 5 different methods in perspectives of measurement noise for the 0- to 100-mm pain VAS in patients with cervical radiculopathy due to DDD. In our study, the test-retest repeatability results for the 0- to 100-mm pain VAS were lower than previously reported. The low repeatability may be due to the large homoge-neous study group with specified inclusion and exclusion criteria. DeLoach et al.5 report that the repeatability on the 0- to 100-mm pain VAS was 13.5–23.0 in a diverse group
of patients 18–86 years of age, who underwent various sur-gical procedures for different diagnoses.
It is likely that the measurement noise is influenced by several factors. Until now, these factors have not been in-vestigated. Jensen and McFarland17 report that it is prefer-able to have 12 ratings across 4 days to get a valid mea-sure of average pain in patients with chronic pain. Several measurements give a more precise value of the patients’ pain and reduce the importance of measurement noise. Unfortunately, such a study design is hard to accomplish, and most studies measure pain only once on every occa-sion. In this study, we found female sex and anxiety and/
TABLE 4. The MCID (the absolute value) for all 5 methods of measurement
Method
VAS-Neck VAS-Arm
MCIDMedium
ImprovementGreat
Improvement Deterioration MCIDMedium
ImprovementGreat
Improvement Deterioration
Average change 20.0 41.4 45.5 NA 9.9 47.3 54.4 NAChange difference 14.4 NA NA 14.4 1.1 NA NA 26.1ROC 20.5 NA NA NA 7.0 NA NA NAEffect size 4.6 11.5 18.3 NA 5.0 12.5 20.0 NAMDC 21.4 NA NA NA 29.1 NA NA NA
NA = not applicable.
FIG. 2. Dot plot illustrating the values of –DVAS. The MCID values from the ROC curve are superposed as dashed lines.
Unauthenticated | Downloaded 11/27/21 12:25 PM UTC

Validation of the visual analog scale in the cervical spine
J Neurosurg Spine Volume 28 • March 2018 233
or depression to be positive predictors of higher measure-ment noise, as well as exercise a positive predictor of lower noise. There might be other factors associated with noise, and we look forward to future studies in this field.
There are many methods to calculate the MCID, and there is no consistency in the literature regarding which method to use. Anchor-based and distribution-based meth-ods all have arbitrary components.4 Limitations with the anchor-based methods include the fact that there are mul-tiple potential anchors to use with different numbers of grades. Some prefer a 7-grade satisfaction index, with the argument that people’s ability to discriminate over a wide range of tasks is approximately 1 part in 7.19,20 Others ar-gue that people have the ability to discriminate between 1 part in 20.11,15 Of course, different anchors produce various results. Limitations with the methods depending on DVAS may manifest as low baseline values. Low baseline values have less room for improvement, resulting in a low DVAS and subsequently a low MCID.
There are also limitations with the MDC method. If you do not have repeated measurements, the random-effects linear regression is used. The random-effects model as-sumes that the sample is a small part of the population and that the variance in VAS is not the same across individuals. The method also assumes that the sample mean does not deviate too much from the population mean. Thus, a poten-
tial error might occur if the sample is not representative. If the test-retest reliability coefficient from a reference sam-ple is used,2 there might be an error if the reference sample deviates from the actual studied sample. A commonly used reference is McDowell and Newell,18 with a test-retest reli-ability coefficient of 0.95. To avoid this potential limita-tion, we calculated our own test-retest coefficient.
There have been some attempts to find simple and stan-dardized methods that can be used as benchmarks to all PROM. Samsa et al.23 argue that a standardized effect size, such as Cohen’s suggestion of 0.20,3 is the best method to calculate MCID, and that it can be used as a benchmark to all PROM. In our study, the effect-size–derived MCID was 5, which was lower than the measurement noise for both VAS-neck and VAS-arm. An MCID of 5 in a 100-point scale is also not reasonable compared with the previously described MCID of 2.5 and 2.6 in a 10-point scale.2,22 Nor-man et al.20 came to the conclusion that half of an SD can be applicable to all PROM in retrieving the MCID. In our study, 0.5 SD was 11.5 for VAS-neck and 12.5 for VAS-arm, and hence just above the measurement error.
It makes no sense to have an MCID value that is lower than the patient’s imprecision when filling in the scale. Therefore, the test-retest repeatability of the scale should be accounted for when calculating MCID. If repeatability is not available, an assessment of internal consistency, such
FIG. 3. The ROC curve. The optimal cutoff point closest to the ideal top left-hand corner is marked, and corresponds to the MCID.
Unauthenticated | Downloaded 11/27/21 12:25 PM UTC
A. MacDowall et al.
J Neurosurg Spine Volume 28 • March 2018234
as the SEM, can be used.4,29 The SEM is the SD that would be observed if a patient were to fill in a VAS scale several times. In our study, the repeatability and SEM for VAS-neck were 8.1 and 7.7, respectively, and in VAS-arm these were 10.4 and 10.5, respectively, which we conclude to be the same results. Hence, to compute the measurement error on a scale, either method can be used. Wyrwich and col-leagues29–31 argue that a 1 – SEM criterion corresponds to MCID and has an advantage over the effect size, because it is independent of the variability and is expressed in ac-tual score units. By definition, the SEM is the measurement noise; consequently, SEM cannot correspond to the MCID. The MDC is the only method that is dependent on SEM, relying on being above the 95% CI to reflect the MCID.1,2
The MDC was the only method that consistently gave results above the measurement noise. Was it then that the measurement noise was too high, or were the 4 other MCID calculation methods flawed? The measurement noise is the repeatability of the VAS findings in this study population, and it describes the patients in this trial. Com-pared with other studies, we found the noise in this study to be lower than otherwise described.5 The MCID calcula-tions are statistical constructions invented by researchers to describe an idea about a hypothetical value that will help us interpret our research results. The fact that there are so many methods to calculate the MCID and, until now, no consistency exists regarding which method to use indicates that these methods have weaknesses and still need to be improved.
Perhaps it is not possible to find a fixed value that can represent the MCID on the VAS or any PROM,12 but we can still have an approximation that is above the measure-ment noise and the MDC for that scale. The perspectives of cost-benefit were not possible to investigate in this study due to a lack of economic data. Whether the improvement is big enough to justify the costs and risks that follow cer-tain treatments needs to be investigated further.
Limitations of the StudyWhat is the optimum time range between 2 measure-
ments made to survey the same pain but still with enough of an interval so that the patients do not remember exactly what they said when they filled in the last VAS question-naire? Jensen and McFarland17 reported 20 minutes be-tween measurements, whereas DeLoach et al.5 reported only 3 minutes. We had approximately 15 minutes be-tween measurements in our study. Another time range be-tween the 2 measurements VAS1 and VAS2 could have influenced the result. We also did not time the patients when they filled in the VAS. There were a few other ques-tionnaires to fill in between the first and second VAS, and some patients were quicker or slower than others, so the time range was not exactly the same for everyone.
It would have been desirable to investigate whether the MCID differs according to high or low baseline scores.10 Unfortunately, that was not possible because the patient group was too homogeneous. All the patients in the study group were selected for surgery due to symptoms and signs of cervical radiculopathy with corresponding MRI find-ings. Hence, the majority of the patients were in the middle or somewhat higher range of the VAS scores, and few were
in the extreme low or extreme high range to make a com-parison that would hold statistically. A less homogeneous group may have given different results. Therefore, one should be cautious in generalizing these results to other diagnoses. For patients with cervical radiculopathy due to DDD who are chosen for decompression surgery, however, we appraise this MCID to be useful.
As for all statistical calculations, the MCID is appli-cable only to a group. An individual patient can experi-ence improvement that is noteworthy even though it falls outside the range of the MCID determination.
ConclusionsThe measurement noise on the VAS was set to one-
tenth on the 100-point scale in patients with cervical ra-diculopathy. Less consistent values were associated with female sex and psychological impairment. The MDC was a valid method to calculate MCID and consistently gave values above the measurement noise.
AcknowledgmentsWe thank Lars Lindhagen, Uppsala Clinical Research Center
(UCR), for statistical assistance; Eva Gulle and Anna Arvidsson, Stockholm Spine Center, for collecting and handling data and assisting at all times; and Håkan Löfgren and Ludek Vavruch, Hospital of Jönköping, for helping with patients and collecting data.
References 1. Beaton DE: Simple as possible? Or too simple? Possible lim-
its to the universality of the one half standard deviation. Med Care 41:593–596, 2003
2. Carreon LY, Glassman SD, Campbell MJ, Anderson PA: Neck Disability Index, Short Form-36 physical component summary, and pain scales for neck and arm pain: the mini-mum clinically important difference and substantial clinical benefit after cervical spine fusion. Spine J 10:469–474, 2010
3. Cohen J: Statistical Power Analysis for the Behavioral Sci-ences, ed 2. Hillsdale, NJ: Lawrence Erlbaum, 1988
4. Copay AG, Subach BR, Glassman SD, Polly DW Jr, Schuler TC: Understanding the minimum clinically important differ-ence: a review of concepts and methods. Spine J 7:541–546, 2007
5. DeLoach LJ, Higgins MS, Caplan AB, Stiff JL: The visual analog scale in the immediate postoperative period: intrasu-bject variability and correlation with a numeric scale. Anesth Analg 86:102–106, 1998
6. Falavigna A, Righesso O, Teles AR, Baseggio N, Velho MC, Ruschel LG, et al: Depression Subscale of the Hospital Anxi-ety and Depression Scale applied preoperatively in spinal surgery. Arq Neuropsiquiatr 70:352–356, 2012
7. Freud M: The graphic rating scale. J Educ Psychol 14:83–102, 1923
8. Gallagher EJ, Liebman M, Bijur PE: Prospective validation of clinically important changes in pain severity measured on a visual analog scale. Ann Emerg Med 38:633–638, 2001
9. Guyatt GH, Osoba D, Wu AW, Wyrwich KW, Norman GR: Methods to explain the clinical significance of health status measures. Mayo Clin Proc 77:371–383, 2002
10. Hägg O, Fritzell P, Nordwall A: The clinical importance of changes in outcome scores after treatment for chronic low back pain. Eur Spine J 12:12–20, 2003
11. Hardy JD, Wolff HG, Goodell H: Pain Sensation and Reac-tions. Baltimore: Williams & Watkins, 1952
12. Hays RD, Woolley JM: The concept of clinically meaning-
Unauthenticated | Downloaded 11/27/21 12:25 PM UTC

Validation of the visual analog scale in the cervical spine
J Neurosurg Spine Volume 28 • March 2018 235
ful difference in health-related quality-of-life research. How meaningful is it? Pharmacoeconomics 18:419–423, 2000
13. Herrmann C: International experiences with the Hospital Anxiety and Depression Scale—a review of validation data and clinical results. J Psychosom Res 42:17–41, 1997
14. Heys M, Patterson DG: Experimental development of the graphic rating method. Psychol Bull 18:98–99, 1921
15. Huskisson EC: Measurement of pain. Lancet 2:1127–1131, 1974
16. Jaeschke R, Singer J, Guyatt GH: Measurement of health status. Ascertaining the minimal clinically important differ-ence. Control Clin Trials 10:407–415, 1989
17. Jensen MP, McFarland CA: Increasing the reliability and va-lidity of pain intensity measurement in chronic pain patients. Pain 55:195–203, 1993
18. McDowell I, Newell C: Measuring Health. A Guide to Rating Scales and Questionnaires. New York: NY: Oxford University Press, 1996
19. Miller GA: The magical number seven plus or minus two: some limits on our capacity for processing information. Psy-chol Rev 63:81–97, 1956
20. Norman GR, Sloan JA, Wyrwich KW: Interpretation of changes in health-related quality of life: the remarkable uni-versality of half a standard deviation. Med Care 41:582–592, 2003
21. Norton S, Cosco T, Doyle F, Done J, Sacker A: The Hospital Anxiety and Depression Scale: a meta confirmatory factor analysis. J Psychosom Res 74:74–81, 2013
22. Parker SL, Godil SS, Shau DN, Mendenhall SK, McGirt MJ: Assessment of the minimum clinically important difference in pain, disability, and quality of life after anterior cervical discectomy and fusion. J Neurosurg Spine 18:154–160, 2013
23. Samsa G, Edelman D, Rothman ML, Williams GR, Lip-scomb J, Matchar D: Determining clinically important dif-ferences in health status measures: a general approach with illustration to the Health Utilities Index Mark II. Pharmaco-economics 15:141–155, 1999
24. Scott J, Huskisson EC: Graphic representation of pain. Pain 2:175–184, 1976
25. Skeppholm M, Fransson R, Hammar M, Olerud C: The as-sociation between preoperative mental distress and patient reported outcome measures in patients treated surgically for cervical radiculopathy. Spine J 17:790–798, 2017
26. Skeppholm M, Lindgren L, Henriques T, Vavruch L, Löfgren H, Olerud C: The Discover artificial disc replacement versus fusion in cervical radiculopathy—a randomized controlled outcome trial with 2-year follow-up. Spine J 15:1284–1294, 2015
27. Stauffer ME, Taylor SD, Watson DJ, Peloso PM, Morrison A: Definition of nonresponse to analgesic treatment of arthritic pain: an analytical literature review of the smallest detectable difference, the minimal detectable change, and the minimal clinically important difference on the pain visual analog scale. Int J Inflamm 2011:231926, 2011
28. Tubach F, Ravaud P, Baron G, Falissard B, Logeart I, Bel-lamy N, et al: Evaluation of clinically relevant changes in patient reported outcomes in knee and hip osteoarthritis: the
minimal clinically important improvement. Ann Rheum Dis 64:29–33, 2005
29. Wyrwich KW, Nienaber NA, Tierney WM, Wolinsky FD: Linking clinical relevance and statistical significance in evaluating intra-individual changes in health-related quality of life. Med Care 37:469–478, 1999
30. Wyrwich KW, Tierney WM, Wolinsky FD: Further evidence supporting an SEM-based criterion for identifying meaning-ful intra-individual changes in health-related quality of life. J Clin Epidemiol 52:861–873, 1999
31. Wyrwich KW, Tierney WM, Wolinsky FD: Using the stand-ard error of measurement to identify important changes on the Asthma Quality of Life Questionnaire. Qual Life Res 11:1–7, 2002
32. Zigmond AS, Snaith RP: The hospital anxiety and depression scale. Acta Psychiatr Scand 67:361–370, 1983
DisclosuresInstitutional research grants: DePuy Synthes, Stockholm County Council, Uppsala County Council, and Swedish Society of Spinal Surgeons. The authors report the following. Dr. Mac-Dowall—Board member: Swedish Society of Spinal Surgeons. Dr. Skeppholm—Speaker’s bureau: DePuy Synthes. Dr. Rob-inson—Speaker’s bureau/paid presentations: AOSpine, DePuy Synthes/Johnson & Johnson, Medtronic; Board member: Cervical Spine Research Society, European Section (CSRS-ES), AOSpine. Dr. Olerud—Clinical or research support for study described (includes equipment or material) from DePuy Synthes; Speaker’s bureau: Anatomica, AOSpine, DePuy Synthes, Medtronic; Board member: CSRS-ES.
Author ContributionsConception and design: MacDowall, Olerud. Acquisition of data: MacDowall, Skeppholm. Analysis and interpretation of data: MacDowall. Drafting the article: MacDowall. Critically revising the article: all authors. Reviewed submitted version of manuscript: all authors. Approved the final version of the manuscript on behalf of all authors: MacDowall. Statistical analysis: MacDowall. Administrative/technical/material support: Skeppholm, Olerud. Study supervision: Robinson, Olerud.
Supplemental InformationPrevious PresentationsPortions of this work were presented in poster form at the CSRS Asia-Pacific Section 7th Annual Meeting, Seoul, Korea, April 21–23, 2016; and at the CSRS-ES 32nd Annual Meeting, Prague, Czech Republic, May 11–13, 2016.
CorrespondenceAnna MacDowall, Department of Surgical Sciences, Uppsala University Hospital, Entrence 61, 6th Fl., Uppsala 75185, Sweden. email: [email protected].
Unauthenticated | Downloaded 11/27/21 12:25 PM UTC