validity and comparability of out-of- pocket health ... · 1 validity and comparability of...
TRANSCRIPT
1
Validity and Comparability of Out-of-
pocket Health Expenditure from
Household Surveys: A review of the
literature and current survey
instruments
DISCUSSION PAPER
NUMBER 1 - 2011
Department "Health Systems Financing" (HSF)
Cluster "Health Systems and Services" (HSS)
HSS/HSF/DP.E.11.1

World Health Organization 2010 ©
This document was prepared by Richard Heijink, Ke Xu, Priyanka Saksena and, David Evans. The authors alone are
responsible for the views expressed in this publication. Richard Heijink works for the National Institute for Public
Health and the Environment in The Netherlands. Ke Xu, Priyanka Saksena and David Evans work with the
Department of Health Systems Financing of the World Health Organization in Geneva, Switzerland. This research
was partially funded by The Ministry of Health Welfare and Sports in The Netherlands.
1
Validity and Comparability of Out-of-pocket Health
Expenditure from Household Surveys: A review of the
literature and current survey instruments
by
Richard Heijink, Ke Xu, Priyanka Saksena, David Evans
GENEVA
2011
2
Abstract
Objective: Measurement errors have been a persistent concern in survey research. In this
study we investigate the current evidence on measurement errors in self-reported household
expenditure and health expenditure.
Methodology: We performed a review of the literature on measurement error in healthcare-
related surveys. A Pubmed-search was performed and in addition reference tracking was used.
In the second part of the study we examined current survey instruments. We collected 90
household surveys, such as household budget surveys, from the International Household
Survey Network. We included surveys that were conducted after 1990, with a focus on low-
income countries and studied differences in survey design features.
Results: The literature review demonstrated that the probability of misreporting increases
when the time between interview and event increases. Also, longer and shorter recall periods
have generated different outcomes, although the magnitude of this difference varied across
populations. Furthermore, respondents reported higher aggregate household spending when
more items were used. Respondents may also lose motivation in long-term diaries. Some
studies found a relationship between measurement error and respondent characteristics,
although results were inconsistent. The review of current household surveys showed a non-
negligible variation in design features such as the recall period, the number of disaggregation
items and the wording of questions.
Conclusion: From reviewing the existing studies and literature we did not find evidence of the
optimal survey design features in collecting data on health spending. However, some practical
suggestions emerge from the study in terms of question design, recall period and methods of
data collection. The study strongly suggests the need for validation studies in order to improve
survey instruments and data quality. In the meantime, standardization could improve the
comparability across countries and surveys, yet this may discourage the efforts on further
exploring the best survey instruments and compromise within-country, over-time comparison
efforts.
3
Introduction
In many health systems out-of-pocket payments (OOP), which refer to payments made by the
patients to both public and private providers at the point of receiving health services, comprise
a considerable part of total health spending. Across health systems out-of-pocket payments
range from less than 10% to more than 80% of total national health spending. The level of
OOP and their distribution have great impact on overall health system performance (WHO
2008). When a system relies heavily on OOP, the payments required to access health care in
relation to income can be high enough to result in financial catastrophe for individuals or
households. Moreover, the impact of these out-of-pocket payments for health care go beyond
catastrophic spending and many people, particularly the poor, may decide not to use services,
simply because they cannot afford the direct costs (Xu et al. 2003).
This leads to a persistent interest in the impact of out-of-pocket spending on the affordability
and equity of health systems. As a result, the level and distribution of out-of-pocket payments
have been widely used as key indicators in the monitoring and evaluation of health system
reforms (e.g. Murray et al. 2003). National Health Accounts (NHA), which have been
established in many countries, report out-of-pocket payments at the national level. In 55
countries these NHA estimates are routinely reported. At the same time, there are an
increasing number of studies addressing the distribution of out-of-pocket payments and its
impact on financial wellbeing and poverty across households (Wagstaff et al. 1999; Murray et
al. 2003; Xu et al. 2003(2); Knaul and Frenk 2005; Dooslaer et al. 2006). These types of
studies have triggered health system reform in many contexts (Knaul and Frenk 2005; Frenk
et al. 2006).
In most countries the main (most complete) data source for measuring out-of-pocket
payments is the household survey, such as Household Budget Surveys (HBS), Living
Standard Measurement Surveys (LSMS), Socio-Economic Surveys (SES) and Income and
Expenditure Surveys (IES). However, the instruments vary across different types of surveys
and, even within the same type of survey questions may vary from country to country. The
value of any such survey depends crucially on the validity and comparability of the data.
Measurement error in the context of expenditure data derived from surveys is a well-known
problem (Visaria 1980; Branch 1994; Anand and Harris 1994), and could be introduced at any
stage of the survey; design of the survey instrument, data collection, or data entry. Well-

4
known causes of measurement error during the survey are for example incorrect
formulation/interpretation, the respondent forgetting past (health-related) events, or socially
desirable answering (Bradburn et al. 1987; Bradburn 2004).
This paper aims to contribute to the ongoing efforts in improving the quality of out-of-pocket
expenditure data, and in improving the comparability of data across surveys and overtime. We
summarize the characteristics of existing survey questionnaires in collecting information on
household general expenditure and health expenditures and review literature which addresses
data validity of household expenditure, in particular, the health expenditures.
Scope of the study
Understanding measurement error in household surveys is important for appropriately
interpreting the results from existing surveys and to improve data quality in future household
surveys. Biemer et al. (1991) identified four primary sources of measurement error:
questionnaires (topics, wording, questionnaire length), data collection methods (mail, diary,
in-person), interviewers (incorrect reading or interpretation of answers) and respondents
(interpretation of questions, memory loss). The focus of this review is on the questionnaire
design and data collection methods (both also reflect respondent behaviour issues),
specifically: the wording/phrasing of questions, the recall period used in collecting different
expenditure items; the number of breakdown items for goods and services in the survey;
whether the data is collected using a diary or an interview; whether health expenditure is
collected in a general budget survey or in a health survey; in the case of a multiple purpose
survey, whether the OOP data is collected in the health module or expenditure module. These
issues will be addressed through the review of the literature and of existing survey
instruments. Errors resulting from the sample selection process (selection bias) are not within
the scope of this study.
Study materials
Literature
For the literature review, we searched in Pubmed and other digital sources for validation
studies of out-of-pocket health expenditure questions combining "survey" with terms such as
“out-of-pocket” “health expenditures”, and “measurement error”. Because of an apparent
5
scarcity we searched for more literature through reference-tracking. Different types of
validation studies were included: individual level record check studies1 that compare survey-
data with other sources such as a hospital registers; studies that compare aggregate outcomes
of a survey with other sources and studies that compare the outcomes of a single survey but
with varying survey characteristics. Book chapters and additional reports were included too.
Where relevant, results from studies on health care utilization and other types of consumption
were included.
Existing surveys
The second part of the study was to review the survey instruments that have been used in
different type of household surveys which collect information on household expenditure
including health expenditure. The review includes 90 surveys from 64 mostly low-income
and middle-income countries from 1990 to present. Surveys on living standards and
household consumption and spending were included such as Living Standard Measurement
Surveys (LSMS), Income and Expenditure Surveys (IES), and Household Budget Surveys
(HBS). The questionnaires were collected from the International Household Survey Network
(IHSN - www.ihsn.org). For each country we included different types of surveys if
documentation about them was available in English or French (for example a questionnaire).
When the dataset provided examples from multiple years for a specific country-survey type
combination, the latest year was taken.
Furthermore, the characteristics of surveys from developed countries were studied, in
particular the Household Budget Surveys in European countries. The European Statistical
Office coordinates these HBS surveys and strives for comparability in the results. Data was
collected from 24 European countries using HBS methodology, including recall period,
number of breakdown items, method of data collection, question wording, and classification
system of health care sectors (Table 1).
In summary, the final set consisted of 114 country-survey type combinations, including 49
LSMS-type surveys, 35 HBS surveys and 30 other surveys (e.g. income and expenditure
surveys).
1 Four types of record-check studies can be distinguished: retrospective, prospective & full/ideal design.
6
Results
Recall period
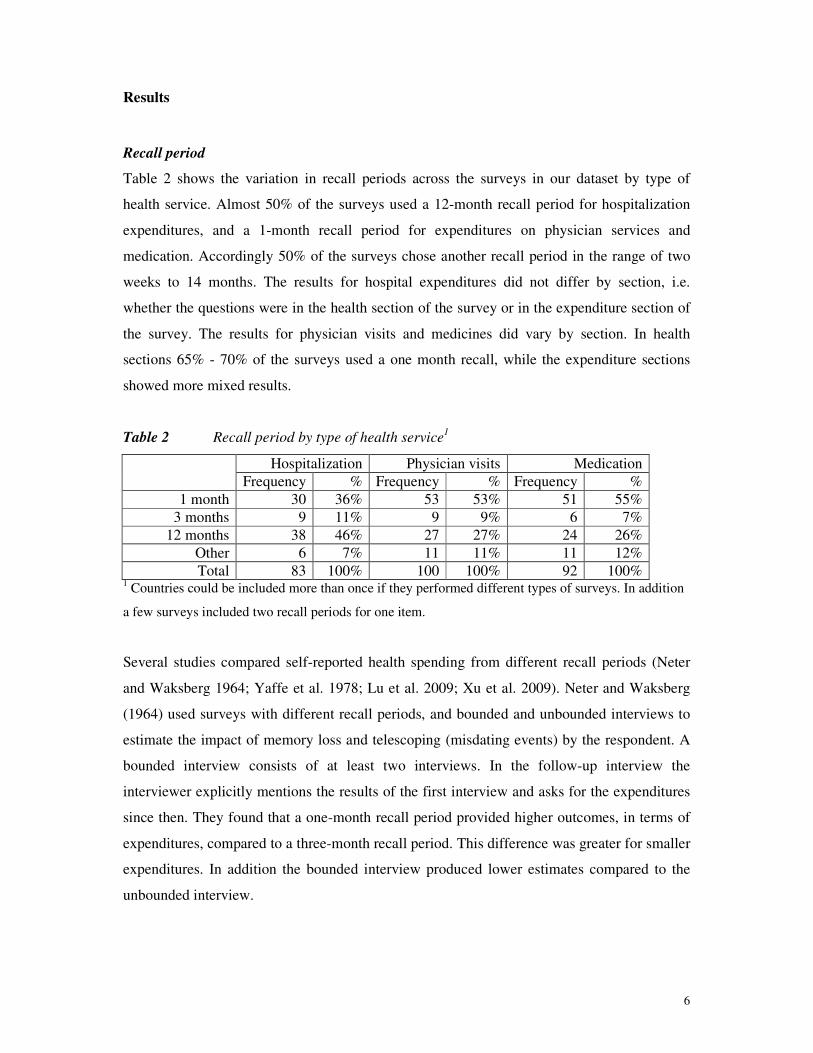
Table 2 shows the variation in recall periods across the surveys in our dataset by type of
health service. Almost 50% of the surveys used a 12-month recall period for hospitalization
expenditures, and a 1-month recall period for expenditures on physician services and
medication. Accordingly 50% of the surveys chose another recall period in the range of two
weeks to 14 months. The results for hospital expenditures did not differ by section, i.e.
whether the questions were in the health section of the survey or in the expenditure section of
the survey. The results for physician visits and medicines did vary by section. In health
sections 65% - 70% of the surveys used a one month recall, while the expenditure sections
showed more mixed results.
Table 2 Recall period by type of health service1
Hospitalization Physician visits Medication
Frequency % Frequency % Frequency %
1 month 30 36% 53 53% 51 55%
3 months 9 11% 9 9% 6 7%
12 months 38 46% 27 27% 24 26%
Other 6 7% 11 11% 11 12%
Total 83 100% 100 100% 92 100% 1 Countries could be included more than once if they performed different types of surveys. In addition
a few surveys included two recall periods for one item.
Several studies compared self-reported health spending from different recall periods (Neter
and Waksberg 1964; Yaffe et al. 1978; Lu et al. 2009; Xu et al. 2009). Neter and Waksberg
(1964) used surveys with different recall periods, and bounded and unbounded interviews to
estimate the impact of memory loss and telescoping (misdating events) by the respondent. A
bounded interview consists of at least two interviews. In the follow-up interview the
interviewer explicitly mentions the results of the first interview and asks for the expenditures
since then. They found that a one-month recall period provided higher outcomes, in terms of
expenditures, compared to a three-month recall period. This difference was greater for smaller
expenditures. In addition the bounded interview produced lower estimates compared to the
unbounded interview.
7
Yaffe et al. (1978) compared self-reported health spending and utilization between a survey
with one-month recall and a survey with two-month recall. They found no difference in mean
utilization and expenditures between the two surveys. The authors argued that they found no
difference because both surveys used extensive support and summary feedback.
More recently Lu et al. (2009) examined the difference between one month recall and twelve
month recall for self-reported hospital expenditures using the World Health Survey. A one-
month recall period produced higher average out-of-pocket spending compared to a twelve-
month recall period, in 38 out of the 40 countries included in the study. The ratio of the
estimates from the short recall period and the long recall period differed by a factor of 10
across countries.
Examining measurement error in utilization specific studies can also be useful for better
understanding expenditure related errors. For example, it is logical to assume that there may
be linkages between recollections of utilization and the expenditure related to this use. Indeed,
others have compared surveys with medical records (individual-level data) and studied the
difference in relation to the date of events. The US National Center for Health Statistics
(NCHS) studied hospital care utilization in several studies (NCHS) and found that on average
10% of the admissions in hospital records had not been reported by respondents (NCHS
1965(3)). Hospitalizations further in the past and shorter (possibly less salient) hospital stays
were left unreported more often. Similar findings have been found in other studies (NCHS
1965(2), NCHS 1977). One of these showed that the reporting accuracy of hospitalizations
decreased significantly after eight months. In contrast to Neter and Waksberg, the authors did
not find evidence for telescoping.
Haffner et al. (1987) studied a small sample of depressive patients and found that errors in
defining the month of the event increased as the time between the event and the interview
became longer. The authors questioned the validity of self-reported outpatient care use with a
recall period longer than six months. Clark et al. (1996) examined the difference between a
survey, (six months recall period), outpatient mental health center records and hospital
records. They found that the accuracy of recall was associated with the length of the
hospitalization and elapsed time between the interview and date of the event. The reporting
rate was twice as high when the interview was conducted within ten weeks after the event.
8
The NCHS (1996) studied self-reported ambulatory care utilization in the weeks before the
interview using the National Health Interview Survey. They also included cases that were
reported in the household survey but not in the medical records. Survey respondents reported
77% of all visits in medical records in the first week before the interview, and 63% in the
second week. At the same time respondents reported visits that were not included in the
medical records. It was estimated that 25% - 50% of this difference was caused by forward
telescoping, i.e. reporting visits that actually occurred before the reference period of the
survey.
The impact of the recall period has also been studied for other types of consumption. Scott
(1990) described the results of fifteen studies of which most showed lower reporting rates in
surveys with longer recall periods (up to 50%). Some of them found that the reporting of less-
frequently purchased items was affected more by measurement error. Using a small-scale
bounded survey in Ghana they showed a decrease in reported expenditure for a longer recall
(up to 14 days). The error was largest for the more frequently purchased goods. Deaton and
Grosh (2000) reviewed a number of validation studies which showed that estimated food
expenditures were similar using two different recall periods (two weeks / 'expenditure since
last-visit' and a four-weeks / 'usual monthly expenditures') while differences were greater for
less-frequent non-food expenditures.
Clarke et al. (2008) demonstrated the trade-off with regard to the recall period: shorter recall
periods decrease the amount of information provided by the survey. Although a shorter recall
period may generate more valid information at the individual level (less memory loss),
aggregate estimates and distributions of both expenditure and utilization data may become
less accurate due to irregular high or low expenditures. The recall period should be matched
with the frequency of health services utilization over time in order to get reliable estimates of
the expenditure distribution. This frequency may differ across populations and health systems.
Number of items
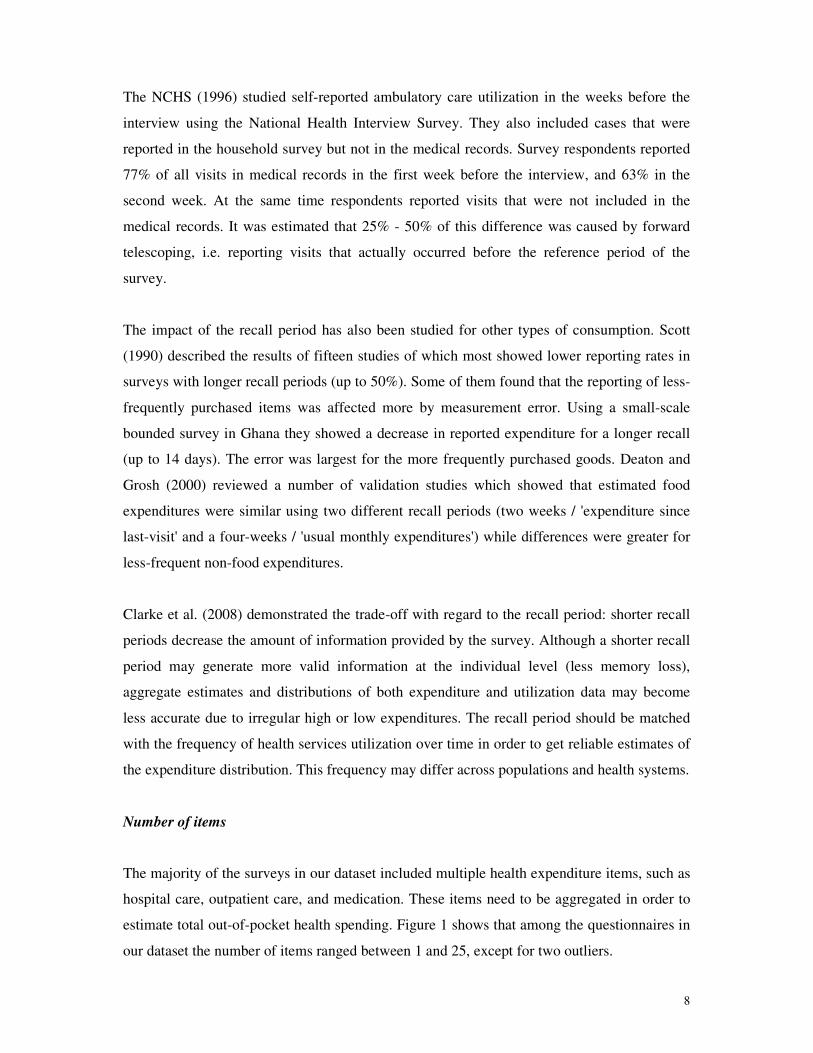
The majority of the surveys in our dataset included multiple health expenditure items, such as
hospital care, outpatient care, and medication. These items need to be aggregated in order to
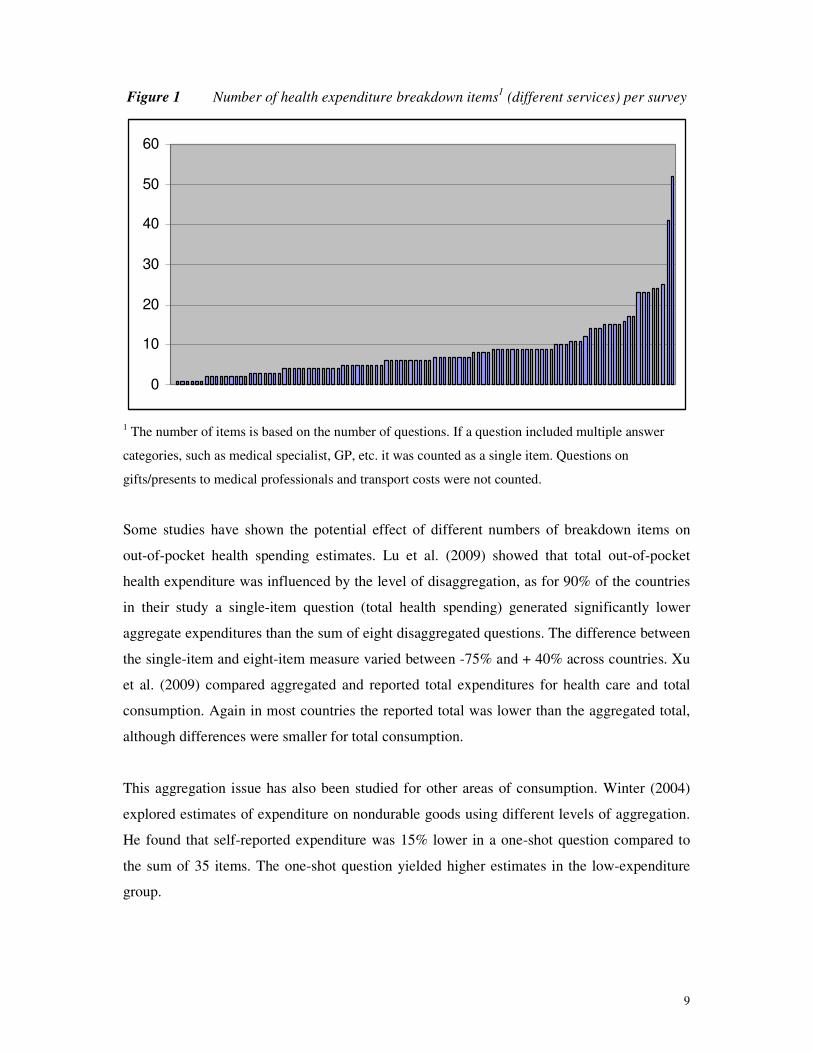
estimate total out-of-pocket health spending. Figure 1 shows that among the questionnaires in
our dataset the number of items ranged between 1 and 25, except for two outliers.
9
Figure 1 Number of health expenditure breakdown items1 (different services) per survey
0
10
20
30
40
50
60
1 The number of items is based on the number of questions. If a question included multiple answer
categories, such as medical specialist, GP, etc. it was counted as a single item. Questions on
gifts/presents to medical professionals and transport costs were not counted.
Some studies have shown the potential effect of different numbers of breakdown items on
out-of-pocket health spending estimates. Lu et al. (2009) showed that total out-of-pocket
health expenditure was influenced by the level of disaggregation, as for 90% of the countries
in their study a single-item question (total health spending) generated significantly lower
aggregate expenditures than the sum of eight disaggregated questions. The difference between
the single-item and eight-item measure varied between -75% and + 40% across countries. Xu
et al. (2009) compared aggregated and reported total expenditures for health care and total
consumption. Again in most countries the reported total was lower than the aggregated total,
although differences were smaller for total consumption.
This aggregation issue has also been studied for other areas of consumption. Winter (2004)
explored estimates of expenditure on nondurable goods using different levels of aggregation.
He found that self-reported expenditure was 15% lower in a one-shot question compared to
the sum of 35 items. The one-shot question yielded higher estimates in the low-expenditure
group.

10
Deaton and Grosh (2000) reviewed a number of studies on different types of consumption
and showed that more breakdown items usually raised estimates of total expenditure, in a
range of 10% - 67% (for details: Reagan et al. 1954; Bhattacharya et al. 1963; Joliffe and
Scott 1995; Steele 1998; Deaton and Grosh 2000). Some suggested that the level of
aggregation of items had no large effect for food expenditures, yet this has not been replicated
in all studies.
Question structure and phrasing
We found substantial variation in terms of the structure and wording of questions across the
surveys in our dataset. Around 40% of the surveys included health expenditure questions in a
health section. In that case expenditure questions are preceded by questions on illness and
health care use which may help respondents to remember health expenditures. In the other
60% of the surveys out-of-pocket health expenditures were surrounded by questions on other
services and goods.
Marquis et al. (1976) showed that this can make a difference. They analyzed expenditure
questions with and without preceding questions on health or health care use, i.e. indirect and
direct health spending questions. In contrast to the direct method, the indirect method
produced total (gross) health expenditures similar to estimates based on administrative data
sources. However estimates of out-of-pocket health expenditure were higher than non-survey
estimates both in the direct and indirect method.
The NCHS (1974) performed an experiment in which the effect of different interviewing
techniques was tested. For example the effect of reinforcement was tested, i.e. each time the
respondent reported a disease or a health care visit the interviewer responded positively. It
was shown that reinforcement generated a decrease in disagreement between self-report and
physician reports for the low-educated. Yet for higher-educated respondents the results were
opposite.
We found several differences in question phrasing across existing surveys. Various surveys
did not explicitly ask to report out-of-pocket payments and to exclude (partly) reimbursed
payments. Furthermore the names and classifications of health care services also varied across
surveys and countries. Health expenditures were classified by location (hospital, home),
11
health care provider (hospital, physician), or by type of service (overnight stay, treatment, lab-
test). The European HBS surveys all used the COICOP classification of health care services
(main groups: hospital, outpatient, medical products). In some cases the terminology was
rather vague, with categories as ‘health and care’, ‘modern medicine and health services’,
‘treatments’, ‘diagnosing and treating illness’, ‘chronic disease care’. Furthermore, some
surveys asked respondents to include the cost of transportation and/or gifts to doctors
(informal payments) while others did not. In several LSMS-surveys the question on health
expenditures only referred to the first or last visit to a physician (mostly in a Health section).
In addition, the wording of the question on health spending differed from for example “what
did you usually pay” to “what did you pay in the last month”.
Data collection mode
Data collection mode figures were available for the European HBS surveys and showed that
most surveys had used diaries and/or face-to-face interviewing. A small number used other
methods, such as telephone, postal survey, or computer assisted personal interviewing
(CAPI). The exact data collection mode was unknown for most other surveys.
Several validation studies compared the results of diaries with face-to-face interviews.
Silberstein (1991) used the US Consumer Expenditure Diary Survey and demonstrated that
about a quarter of the diaries were filled out at the moment of pickup and were consequently
based on recall. These diaries also produced lower expenditure estimates compared to face-to-
face interviews. Furthermore, the results showed a decrease in reporting during the week and
lower mean expenditure in the second week of the diary compared to the first week.
Deaton and Grosh (2000) reported results from a couple of data collection mode studies. Two
experiments in Latvia and Armenia reported higher expenditure estimates in a diary compared
to a survey (of a third to 50%). One study found systematic differences for food-expenditures
only. Another study in the Ukraine on the other hand found food expenditures to be 10
percent lower in the diary compared to the interview. Outcomes varied by type of food
expenditure. Problematically in the latter study, there was a difference in recall period
between the diary and the survey.

12
Battistin et al. (2003) found mean non-durable expenditure to be 20-25% higher in a 20-day
diary compared to a one-month recall question in an Italian sample. At the same time mean
food expenditures were around 10% lower in the diary. The variance was higher in the diary
for both types of consumption. Battistin (2002) had found contrasting results using an
interview and diary from the US. The retrospective interview generated higher estimates
across all age cohorts for nondurable expenditures. Similar to the Italian study, the variance
and inequality of expenditures was greater in the diary.
Ahmed et al. (2006) compared a diary and face-to-face survey on food expenditure in a
Canadian sample. The two-week diary generated consistently lower estimates of food
expenditure than the four week retrospective interview (transforming both into monthly
estimates). In addition there was more variability in the results of the diary. In particular,
around 10% of the diary-sample had zero expenditure.
Comparisons of other data collection methods were performed by NCHS (1965(2)) and Yaffe
et al. (1978). The NCHS compared the results of self-administered interviews and face-to-face
interviews with hospital records, but found no difference in the quality of reporting between
the two types of interviewing. Yaffe et al. compared provider records with an in-person
interview and a self-administrated interview. In one of the two regions in-person interviewing
generated (5-10%) higher expenditure while in another region no differences were found.
Gieseman (1987) found that total food expenditure was underestimated to a similar extent in
an interview and a diary, yet the subgroups food at home and food away from home showed
opposite patterns. Marquis et al. (1976) found a face-to-face interview to provide similar total
health expenditures as validation data while a self-administered direct approach (without
questions on health episodes or providers used before the expenditure question) generated
higher total expenditures. It was unclear whether this difference was caused by the collection
mode or the type of question. Out-of-pocket health expenditures were overestimated in both
collection modes.
It has been argued that the decline in diary outcomes over time is an indication of loss of
motivation (Silberstein 1991; Silberstein and Scott 2004). Studies have shown lower diary
outcomes already in the second or following weeks of a diary, although these did not include
health care questions (Silberstein 1991; Silberstein and Scott 2004). In some studies it was
found that respondents fill-out the diary on the last day on the basis of recall. Similar
13
motivation effects may be present when long or panel (repeated) interviews are being
conducted. Turner (1961) and Silberstein (1991) reported on the effect of repeated
measurements and argued that loss of interest during repeated measurement results in
underreporting over time. Again no studies on health care items were found. Cohen and
Carlson (1994) demonstrated that the quality of health expenditure reporting was higher
among respondents with a smaller household size and less interview time.
Other factors
Apart form the survey design, the respondent characteristics may also be associated with
measurement errors. This is of particular importance for studies that estimate a relationship
between OOP payments and respondent characteristics such as age or income, see for
example Hernan (2009) and Shahar (2009). However, results on how respondent
characteristics may affect expenditure data are not consistent with regard to age, sex,
education level and income level (NCHS 1977; Andersen et al. 1976; Cohen and Carlson
1994; NCHS 1996). For example, Andersen et al. (1976) reported a relationship between
measurement error in hospital expenditures and age and income; Cohen and Carlson (1994)
reported a relationship between measurement error in health expenditures and age and disease
status; and the NCHS found measurement errors not to be associated with age and education,
yet only with gender. The only consistent finding is that ‘proxy respondents’ report less
accurately than respondents who answer for themselves (Simmons and Bryant 1962; NCHS
1977; NCHS 1996; Kasprzyk 2005). Cohen and Carlson (1994) found that higher levels of
agreement were associated with the percentage of expenditures paid by the family, lower self-
reported interview burden, smaller expenditures and shorter length of stay (at least for
hospitalizations).
Furthermore, it has been found that respondents round and heap their answers, particularly in
consumption and expenditure questionnaires (e.g. Battistin et al. 2003; Pudney 2007; Winter
2004). Pudney (2007) found that response patterns of those who rounded answers showed
much more volatility over time compared to respondents that did not use rounding methods.
Some studies compared the outcomes of a survey with other sources without focusing on a
particular questionnaire characteristics as those discussed above. Simmons and Bryant (1962)
compared a survey with hospital records and found that around 10% of the recorded hospital

14
stays were not reported by respondents. At the same time 2% of the self-reported visits could
not be traced in hospital records.
Andersen et al. (1976) found that within their sample 50% of the respondents reported higher
health expenditures while 50% reported lower expenditures, compared to the validation data.
The NCHS (1996) showed a similar finding: in 17-35% of the cases the survey produced
lower results while in 20-40% of the cases self-reported utilization was higher.
In some cases total aggregate health expenditures were comparable with validation data
(Marquis et al. 1976; Branch 1987). At the same time the results differed by the type of health
service. Surveys provided comparable/slightly lower (Yaffe et al. 1978) and higher (Marquis
et al. 1976) estimates for dental care and higher estimates for hospital care (Cohen and
Carlson) compared to validation data. Lower (Yaffe et al. 1978; Cohen and Carlson 1994) and
higher (Marquis et al. 1976) estimates were found for medicines and physician visits.
Aggregate out-of-pocket health spending was similar for dental care expenditures, and higher
for outpatient services in surveys (20% - 30%) (Marquis et al. 1976). Differences between
regions were found too: total out-of-pocket health spending was higher in the survey for one
region, but lower in another region. In one region out-of-pocket expenditures were
substantially overestimated for dental care, inpatient hospital care and emergency care, while
expenditures on other services were underestimated.
We also compared health (expenditure) surveys with other surveys for Armenia, Jordan,
Georgia and Turkey.2 The difference in out-of-pocket expenditure as a percentage of total
consumption between survey types ranged between 3 and 15 percentage point.
Discussion
There is persistent interest in the impact of out-of-pocket financing on the affordability and
equity of health systems. In order to better understand this impact, valid measurements and
comparisons are needed. While the reliability and comparability of household survey data
depends on many factors during the full course in conducting the survey, this review focuses
2 Source: author’s calculations. Armenia: Integrated Living Conditions Survey (2007) vs. NHA Survey (2006);
Jordan: Household Expenditure and Income Survey (2006) vs. Household Health Care Utilization and
Expenditure Survey (2000); Georgia: HBS (2007) vs. Department of Statistics of the Ministry of Economic
Development (2007); Turkey: HBS (2003) vs. Household Health Expenditure Survey (2003).
15
on certain design features which were found to have an impact on the quality of survey
expenditure data.
One of the great challenges is that the validity of expenditure data from household surveys is
difficult to judge. This review could not find enough validation studies to conclude on the best
survey instrument. Few validation studies exist, particularly on out-of-pocket health
expenditures. The published validation studies have their limitations, e.g. regarding sample
sizes, potentially limited comparability of different data sources (regarding definitions and
populations covered), or generalizability. Validation studies require special design and extra
effort in data collection. More validation studies should be encouraged in order to identify
better survey design and data collection methods to improve data quality. However, there are
some practical suggestions from this review.
In terms of recall period the results indicated a preference for longer recall periods in hospital
spending and for shorter recall periods in outpatient and medication spending (50% of the
surveys used these recall periods). Some validation studies showed that the probability of
misreporting (possibly due to forgetting) increases when the time between interview and
event increases. But the choice of recall period cannot be made in isolation and needs to
correspond with the choice of survey technique, the outcome of interest, and any policy
relevant time frame. More frequent and smaller expenditure items are better captured in a
shorter recall period while infrequent larger expenditure items are better captured in a longer
recall period. Additionally the more salient events may be better remembered. The trade-off
between accuracy and information loss is important in this respect (Clarke et al. 2008).
Different numbers of items may cause differences in the estimation of total expenditure. Is
one question on total health expenditures better or worse than a set of questions on hospital
care, medicines, and outpatient care (or other classifications)? We found a large variation in
the number of sub-questions in existing surveys. In general, more detailed items yields higher
aggregate expenditure estimates but there is no conclusion on the optimal number of
breakdown items. The number of breakdown items is usually decided based on the purpose of
the survey. For example, a health focused survey may contain more than 10 items of health
expenditure if the purpose is to know how much households pay for different services in
different facilities; while in a general purpose survey, health expenditure may only be
presented as one or two questions. Attention needs to be drawn when calculating household
16
budget shares, such as health, food and education. For example, if a survey contains 10
questions on health expenditure and only two on all other expenditure, OOP budget share can
be expected to be much higher compared to a survey with 10 health items and 100 other
expenditure items.
The argument for more questions is that they have a prompting effect (less memory loss), may
suffer less from interpretation error (disaggregated questions more precisely describe the type
of health care) and also enable more detailed analyses. On the other hand, an increase in the
number of items must be balanced with the size of the overall questionnaire. Respondents
may lose interest or motivation with longer questionnaires. Other factors seem important too.
Longer hospital stays and greater health expenditures were in some (but not all) cases better
reported. This may reflect that more salient events are better reported.
With regard to the data collection mode, the most common practice is to combine diary and
interview in the same survey. These modes may generate different results, but findings were
not consistent. Diaries did show a larger variance in expenditures. In order to avoid fatiguing
the interviewees, diaries should not be longer than a couple of weeks (two to four weeks has
been suggested). Therefore, diaries are more suitable for small purchases (due to their
frequency), whereas interviews should be used to capture less frequent or salient expenses. In
addition several aids may be applied to prevent measurement errors on beforehand. For
example, the bounded recall method has been proposed as a solution to the problem of
telescoping or misdating of events (Neter and Waksberg 1964). Bounded recall involves at
least two repeated interviews where the second interview explicitly asks for expenditures
since the last interview.
The variation in survey design poses a great challenge for comparison over time and across
surveys. The variability across surveys in terms of e.g. classification, question
wording/terminology and recall periods probably reflects the lack of evidence on health
spending questions and indicates that more standardization would be useful. The latter would
improve comparisons across surveys and countries. However, in a given country changes in
methods may hamper the comparability over time and cannot be introduced at the expense of
specific national requirements. Health systems may differ in a way that justifies differences in
terms of classification or terminology (for example including a question on traditional
healers). Therefore the evidence in itself needs to be more robust in order to convince
17
countries to change their surveys. Future research could address the following issues, among
other things, to improve the understanding of response errors. To what extent does the
interpretation of health care terminology and wording vary across populations? Does health
insurance coverage affect the accuracy of self-reported health spending, as has been
hypothesized (Marquis et al. 1976)? Is measurement error in self-reported health spending
more prominent in certain (sub)populations such as the lower-educated (this would affect
comparisons across such population groups)? Moreover it would be valuable to find studies
that compare different designs, such as two recall periods, and additionally compare these
with validation data.
In the end more robust evidence will make the consistency-argument less relevant as
consistently biased estimates are not very useful, especially when the bias changes over time.
A practical way would be only to make minor changes in subsequent surveys making it
possible to monitor the impact of each adjustment.
Better evidence will also facilitate the correction for measurement error. Econometric
techniques are available to perform adjustments e.g. using the relationship between the
accurately measured data, the survey data and a set of conditioning variables (see for example
Bound et al. 2001; Browning et al. 2002; Battistin et al. 2003; Tarozzi 2007). Again this
requires validation studies. Whether these strategies improve estimates depends on the
validity of e.g. model assumptions, model fit, the accuracy of the validation data, and the
similarity of the samples in the survey and the validation data.
Acknowledgements
We would like to thank Peter-Paul Borg from Eurostat for distributing our questionnaire
among experts in European Statistical Offices.

18
Table 1. EUROSTAT Household Budget Survey details
Latest Freq Collection mode
Sample
Size RR¹
Drop-
out²
Used
for
oop?
Class.
System³
#
items
Ref.
period
inpatient4
Ref.
period
outpatient
Ref.
period
medicines
Ref.
period
other Prompt?5
AUT 2004
5
diary & face-to-
face 8400 42 NA No 1 - (½), 12 (½), 12 (½) - Yes
BEL 2009
1
diary & face-to-
face 36000 12 NA No 1 7 (1) (1) (1) (1) Yes
BGR 2008
1
diary & face-to-
face 3000 - 1 DK 1 9 (12) (12) (12) (12) Yes
CYP 2003
5
diary & face-to-
face 2990 89 NA Yes 1 41 12 1,12 (½), 1,12 - Yes
CZE 2008
1
diary & face-to-
face 2839 - NA DK 1 9 (1) (1) (1) - No
DNK 2006
1
diary & face-to-
face 2000 54 3 No 1 15 (½), 12 (½), 12 (½) (½) Yes
ESP 2007
1
diary & face-to-
face 24700 87 1 & 3 Yes 1 9 (½), 2.5 (½), 2.5 (½) (½), 2.5 Yes
EST 2007
1
diary & face-to-
face 7130 48 3 Yes 1 23 (¼) (¼) (¼) (¼) Yes
FIN 2006
5
diary & face-to-
face 4007 53 3 Yes 1 52 12 3 (½) - Yes
GER 2008 5 diary & postal 55000 - 1 DK 1 6 (3) (3) (3) (3) No
GRE 2008 1 face-to-face 3500 60 1 Yes 1 14 12 6 (½), 12 3, 12 Yes
HUN 2009
1
diary & face-to-
face 9000 53 2 Yes 1 7 (1), 12 (1), 12 (1), 12 (1), 12 Yes
ITA 2009
1
diary & face-to-
face 28000 85 NA Yes 1 15 1 1 (¼), 1 (¼), 1 Yes
LVA 2008
1
diary & face-to-
face 4002 41 3 Yes 1 - (½), 12 (½) (½), 12 (½), 12 Yes
LUX 2006
1
diary & face-to-
face 3202 25 NA No 1 9 6 6 6 - No

19
MKD 2008 1 diary 5040 85 3 No 1 7 (½) (½) (½) - No
NLD 2009
1
diary, telephone
& face-to-face 20232 26 4 Yes 3 - (½), 12 (½), 12 (½), 12 - No
NOR 2008
1
diary & face-to-
face 2166 55 3 Yes 1 9 (½) (½) (½) (½) Yes
POL 2008
1
diary & face-to-
face 37358 53 1 Yes 1 11 (½) (½) (½) (½) Yes
PRT 2006 5 diary & CAPI* 16700 62 NA Yes 1 9 12 1 (¼) - Yes
SVK 2008
1
diary & face-to-
face 4718 75 3 No 1 3 1 1 1 - No
SVN 2008 1 diary & CAPI* 5528 70 NA Yes 1 9 6 6 6 - Yes
SWE 2008 1 diary & telephone 4000 53 2 No 1 - (½) (½) (½) - No
UK 2007
1
diary & face-to-
face 11484 53 NA DK 1 10 (½) (½) (½) - Yes
¹ RR = Response Rate
² How are drop-outs being dealt with: 1) Replacement, 2) Imputation, 3) Reweighting, 4) No action
³ Class. System = Classification system for health expenditures: 1) COICOP, 2) System of Health Accounts, 3) Other
4 Ref. period = reference period in the survey in # months. The recall period of the interview is shown in terms of months. The time span of the diary is
included between brackets, in terms of weeks.
5 Prompt? = Do the surveys explicitly prompt for out-of-pocket expenditures (excluding reimbursement)?
*CAPI = Computer Assisted Personal Interview
Country level notes: German survey does not differentiate between inpatient and outpatient care. Dutch diary for out-of-pocket expenditures has two
modules, one for larger expenditures for the larger sample (20232) and one for all expenditures for the smaller sample (3819). The smaller sample
consists of two separate samples with response rates of 22.9% and 66.5%.
20
References
Ahmed N, Brzozowski M, Crossley TF. Measurement Errors in Recall Food Consumption
Data: The Institute for Fiscal Studies; 2006.
Anand S, Harris CJ. Choosing A Welfare Indicator. American Economic Review
1994;84(2):226-31.
Andersen R, Kasper J, Frankel M. The effect of measurement error on differences in hospital
expenditures. Med Care 1976;14(11):932-49.
Battistin E. Errors in Survey Reports of Consumption Expenditures. London: Institute for
Fiscal Studies; 2002.
Battistin E, Miniaci R, Weber G. What do we learn from recall consumption data? Banca
d'Italia; 2003.
Bhattacharyya N. On the effects of Itemization in the Family Budget Schedule. Calcutta:
Indian Statistical Institute, 1963.
Biemer PP, Groves RM, Lyberg LE, Mathiowetz NA, Sudman S. Measurement Errors in
Surveys. New York: John Wiley & Sons Inc., 1991.
Bound J, Brown C, Mathiowetz NA. Measurement error in survey data. In: Heckman JJ,
Leamer EE, editors. Handbook of Econometrics: North-Holland; 2001.
Bradburn NM, Rips LJ, Shevell SK. Answering autobiographical questions: the impact of
memory and inference on surveys. Science 1987;236(4798):157-61.
Bradburn NM. Understanding the Question-Answer Process. Survey Methodology
2004;30(1):5-15.
Branch ER. Comparing medical care expenditures of two diverse U.S. data sources. Monthly
Labor Review 1987;110(3):15-18.
Branch ER. The Consumer Expenditure Survey: A Comparative Analysis. Monthly Labour
Review 1994;117(12):47-55.
Browning M, Crossley TF, Weber G. Asking Consumption Questions in General Purpose
Surveys. Copenhagen: Centre for Applied Microeconometrics; 2002.
Clark RE, Ricketts SK, McHugo GJ. Measuring hospital use without claims: a comparison of
patient and provider reports. Health Serv Res 1996;31(2):153-69.
Clarke PM, Fiebig DG, Gerdtham UG. Optimal recall length in survey design. Journal of
Health Economics 2008; 27:1275-1284.
Cohen SB, Carlson BL. A Comparison of Household and Medical Provider Reported
Expenditures in the 1987 NMES. Journal of Official Statistics 1994;10(1):3-29.
21
Deaton A, Grosh M. Consumption. In: Grosh M, Glewwe P, editors. Designing Household
Survey Questionnaires for Developing Countries. Washington: The World Bank; 2000.
Doorslaer E van, O’Donnell O, et al. Effect of payments for health care on poverty estimates
in 11 countries in Asia: an analysis of household survey data. Lancet 2006; 368:1357-64.
Frenk J, Gonzalez-Pier E, Gomez-Dantes O, Lezana MA, Knaul FM. Comprehensive reform
to improve health system performance in Mexico 2006:368(9546);1524-1534.
Gieseman R. The Consumer Expenditure Survey: quality control by comparative analysis.
Monthly Labor Review 1987;110(3):8-14.
Haffner J, Moschel G, ten Horn GH. Determination of the optimum period of interview for
retrospective collection of data. An empirical study based on reported and documented
outpatient contacts of depressive patients. Eur Arch Psychiatry Neurol Sci 1987;236(5):288-
93.
Hernan MA, Cole SR. Invited Commentary: Causal Diagrams and Measurement Bias.
American Journal of Epidemiology 2009:170(8);959-962.
Jolliffe D, Scott K. The Sensitivity of Measures Household Consumption to Survey Design:
Results from an Experiment in El Salvador. Washington DC: World Bank, Policy Research
Department; 1995.
Kasprzyk D. Measurement error in household surveys: sources and measurement. In:
Household Sample Surveys in Developing and Transition Countries. New York: United
Nations; 2005.
Knaul FM, Frenk J. Health Insurance In Mexico: Achieving Universal Coverage Through
Structural Reform. Health Affairs 2005; 24(6): 1467-1476.
Lanjouw JO, Lanjouw P. How to compare apples and oranges: poverty measurement based on
different definitions of consumption. Review of Income and Wealth 2001:47(1);25-42.
Lu C, Chin B, Li G, Murray CJ. Limitations of methods for measuring out-of-pocket and
catastrophic private health expenditures. Bull World Health Organ 2009;87(3):238-44, 244A-
244D.
Marquis KH, Marquis MS, Newhouse JP. The measurement of expenditures for outpatient
physician and dental services: methodological findings from the health insurance study. Med
Care 1976;14(11):913-31.
Murray CJL, Xu K, Klavus J, Kawabata K, Hanvoravongchai P, Zeramdini R, et al. Assessing
the Distribution of Household Financial Contributions to the Health System: Concepts and
Empirical Application. In: Murray CJL, Evans DB, editors. Health Systems Performance
Assessment; Debates, Methods and Empiricism. Geneva: World Health Organization; 2003.
National Center for Health Statistics (NCHS). A Study of the Reporting of Visits to Doctors
in the National Health Survey. Washington: Public Health Service; 1963.

22
National Center for Health Statistics (NCHS). Health Interview Responses Compared with
Medical Records. Washington: Public Health Service; 1965(1).
National Center for Health Statistics (NCHS). Comparison of Hospitalization Reporting in
three survey procedures. Washington: Public Health Service; 1965(2).
National Center for Health Statistics (NCHS). Reporting of Hospitalization in the Health
Interview Survey. Washington: Public Health Service; 1965(3).
National Center for Health Statistics (NCHS). Reporting Health Events in Household
Interviews: Effects of Reinforcement, Question Length, and Reinterviews. Washington:
Public Health Service; 1974.
National Center for Health Statistics (NCHS). A Summary of Studies of Interviewing
Methodology. Washington: Public Health Service; 1977.
National Center for Health Statistics (NCHS). Evaluation of 2-week Doctor Visit Reporting in
the National Health Interview Survey. Washington: Public Health Service; 1996.
Neter J, Waksberg J. A Study of Response Errors in Expenditures Data from Household
Interviews. Journal of the American Statistical Association 1964;59(305):18-55.
Pudney S. Heaping and leaping: Survey response behavior and the dynamics of self-reported
consumption expenditure. Colchester: Institute for social and economic research; 2007.
Reagan BB. Condensed versus Detailed Schedule for Collection of Family Expenditure Data.
Washington: US Department of Agriculture, Agricultural Research Service; 1954.
Scott C, Amenuvegbe B. Effect of Recall Duration on Reporting of Household Expenditures;
An experimental Study in Ghana. Washington: The World Bank; 1990.
Shahar E. Causal diagrams for encoding and evaluation of information bias. Journal of
Evaluation in Clinical Practice 2009:15;436-440.
Silberstein AR. Selected first-interview effects in the consumer expenditure interview survey.
Washington: Bureau of Labor Statistics; 1988.
Silberstein AR. Response performance in the consumer expenditure diary survey.
Washington: Bureau of Labor Statistics; 1991.
Silberstein AR, Scott S. Expenditure Diary Surveys and Their Associated Errors. In:
Measurement Errors in Surveys. Biemer PP et al. (eds.). New Jersey: John Wiley & Sons,
Inc.; 2004.
Simmons WR, Bryant EE. An evaluation of hospitalization data from the health interview
survey. American Journal of Public Health and the Nation’s Health 1962;52(10):1638-1647.
Steele D. Ecuador Consumption Items. Washington DC: World Bank Development Research
Group; 1998

23
Tarozzi A. Calculating Comparable Statistics From Incomparable Surveys, With an
Application to Poverty in India. Journal of Business & Economic Statistics 2007;58(3):314-
336.
Turner R. Inter-Week Variations in Expenditure Recorded During a Two-Week Survey of
Family Expenditure. Journal of the Royal Statistical Society. Series C (Applied Statistics)
1961;10(3):136-146.
Visaria P. Poverty and Living Standards in Asia. Population and Development Review
1980;6(2):189-223.
Wagstaff A, van Doorslaer E, van der Burg H, Calonge S, Christiansen T, Citoni G, et al.
Equity in the finance of health care: some further international comparisons. J Health Econ
1999;18(3):263-90.
Winter J. Response bias in survey-based measures of household consumption. Economics
Bulletin 2004;3(9):1-12.
World Health Organization. The World Health Report 2008. Geneva: WHO; 2008.
Xu K, Evans DB, Kawabata K, Zeramdini R, Klavus J, Murray CJL. Understanding
Household Catastrophic Health Expenditures: a Multi-country Analysis. In: Murray CJL,
Evans DB, editors. Health Systems Performance Assessment; Debates, Methods and
Empiricism. Geneva: WHO; 2003.
Xu K, Evans DB, Kawabata K, Zeramdini R, Klavus J, Murray CJL. Household catastrophic
health expenditure: a multicountry analysis. The Lancet 2003(2);362:111-117.
Xu K, Ravndal F, Evans DB, Carrin G. Assessing the reliability of household expenditure
data: results of the World Health Survey. Health Policy 2009;91(3):297-305.
Yaffe R, Shapiro S, Fuchseberg RR, Rohde CA, Corpeno HC. Medical economics survey-
methods study: cost-effectiveness of alternative survey strategies. Med Care 1978;16(8):641-
59
24
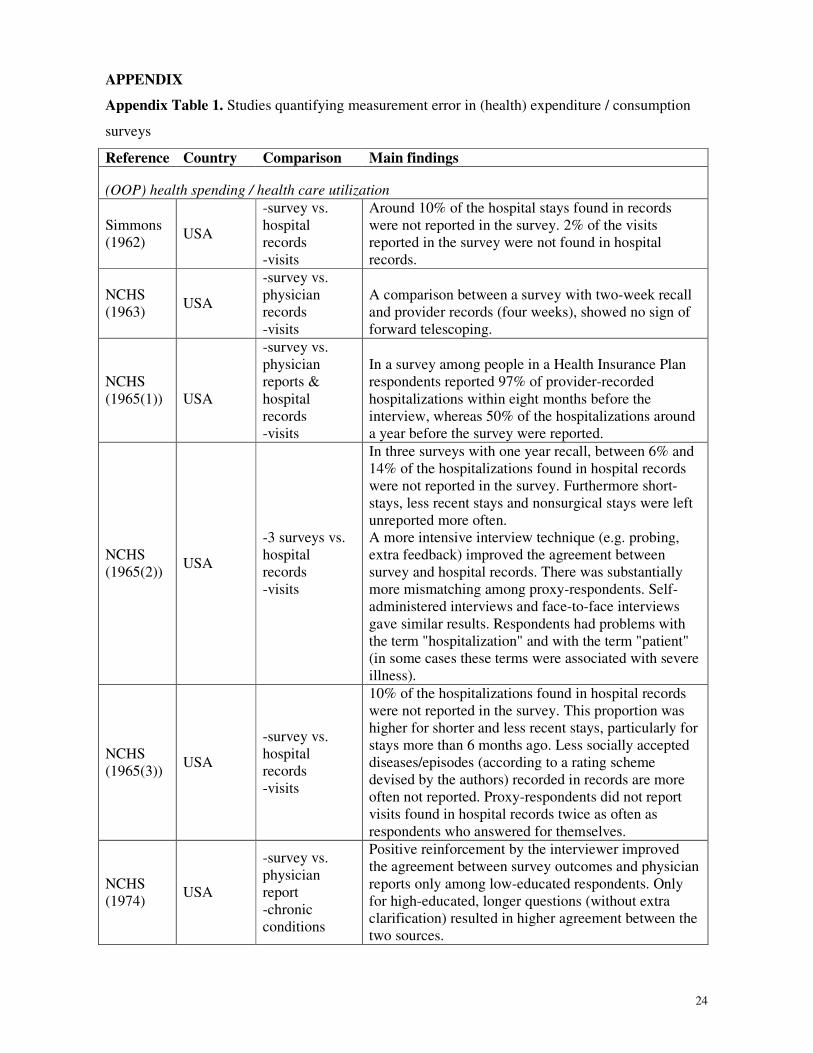
APPENDIX
Appendix Table 1. Studies quantifying measurement error in (health) expenditure / consumption
surveys
Reference Country Comparison Main findings
(OOP) health spending / health care utilization
Simmons
(1962) USA
-survey vs.
hospital
records
-visits
Around 10% of the hospital stays found in records
were not reported in the survey. 2% of the visits
reported in the survey were not found in hospital
records.
NCHS
(1963) USA
-survey vs.
physician
records
-visits
A comparison between a survey with two-week recall
and provider records (four weeks), showed no sign of
forward telescoping.
NCHS
(1965(1))
USA
-survey vs.
physician
reports &
hospital
records
-visits
In a survey among people in a Health Insurance Plan
respondents reported 97% of provider-recorded
hospitalizations within eight months before the
interview, whereas 50% of the hospitalizations around
a year before the survey were reported.
NCHS
(1965(2)) USA
-3 surveys vs.
hospital
records
-visits
In three surveys with one year recall, between 6% and
14% of the hospitalizations found in hospital records
were not reported in the survey. Furthermore short-
stays, less recent stays and nonsurgical stays were left
unreported more often.
A more intensive interview technique (e.g. probing,
extra feedback) improved the agreement between
survey and hospital records. There was substantially
more mismatching among proxy-respondents. Self-
administered interviews and face-to-face interviews
gave similar results. Respondents had problems with
the term "hospitalization" and with the term "patient"
(in some cases these terms were associated with severe
illness).
NCHS
(1965(3)) USA
-survey vs.
hospital
records
-visits
10% of the hospitalizations found in hospital records
were not reported in the survey. This proportion was
higher for shorter and less recent stays, particularly for
stays more than 6 months ago. Less socially accepted
diseases/episodes (according to a rating scheme
devised by the authors) recorded in records are more
often not reported. Proxy-respondents did not report
visits found in hospital records twice as often as
respondents who answered for themselves.
NCHS
(1974) USA
-survey vs.
physician
report
-chronic
conditions
Positive reinforcement by the interviewer improved
the agreement between survey outcomes and physician
reports only among low-educated respondents. Only
for high-educated, longer questions (without extra
clarification) resulted in higher agreement between the
two sources.
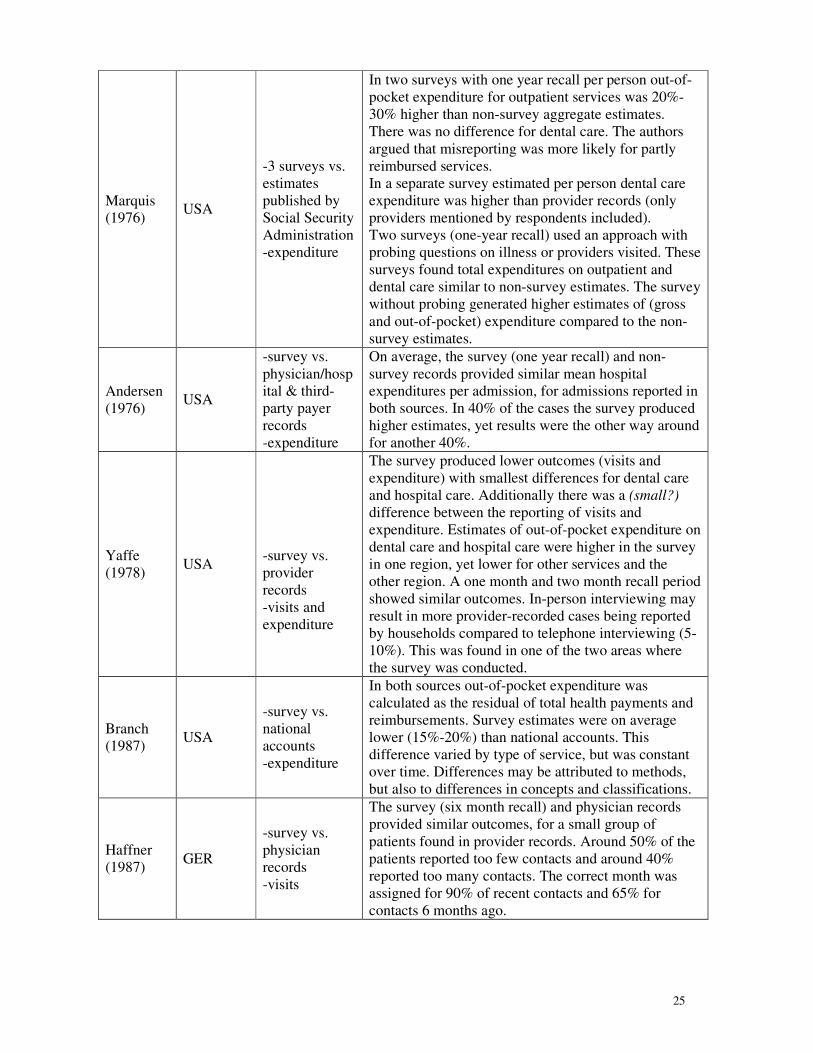
25
Marquis
(1976) USA
-3 surveys vs.
estimates
published by
Social Security
Administration
-expenditure
In two surveys with one year recall per person out-of-
pocket expenditure for outpatient services was 20%-
30% higher than non-survey aggregate estimates.
There was no difference for dental care. The authors
argued that misreporting was more likely for partly
reimbursed services.
In a separate survey estimated per person dental care
expenditure was higher than provider records (only
providers mentioned by respondents included).
Two surveys (one-year recall) used an approach with
probing questions on illness or providers visited. These
surveys found total expenditures on outpatient and
dental care similar to non-survey estimates. The survey
without probing generated higher estimates of (gross
and out-of-pocket) expenditure compared to the non-
survey estimates.
Andersen
(1976) USA
-survey vs.
physician/hosp
ital & third-
party payer
records
-expenditure
On average, the survey (one year recall) and non-
survey records provided similar mean hospital
expenditures per admission, for admissions reported in
both sources. In 40% of the cases the survey produced
higher estimates, yet results were the other way around
for another 40%.
Yaffe
(1978) USA
-survey vs.
provider
records
-visits and
expenditure
The survey produced lower outcomes (visits and
expenditure) with smallest differences for dental care
and hospital care. Additionally there was a (small?)
difference between the reporting of visits and
expenditure. Estimates of out-of-pocket expenditure on
dental care and hospital care were higher in the survey
in one region, yet lower for other services and the
other region. A one month and two month recall period
showed similar outcomes. In-person interviewing may
result in more provider-recorded cases being reported
by households compared to telephone interviewing (5-
10%). This was found in one of the two areas where
the survey was conducted.
Branch
(1987) USA
-survey vs.
national
accounts
-expenditure
In both sources out-of-pocket expenditure was
calculated as the residual of total health payments and
reimbursements. Survey estimates were on average
lower (15%-20%) than national accounts. This
difference varied by type of service, but was constant
over time. Differences may be attributed to methods,
but also to differences in concepts and classifications.
Haffner
(1987) GER
-survey vs.
physician
records
-visits
The survey (six month recall) and physician records
provided similar outcomes, for a small group of
patients found in provider records. Around 50% of the
patients reported too few contacts and around 40%
reported too many contacts. The correct month was
assigned for 90% of recent contacts and 65% for
contacts 6 months ago.
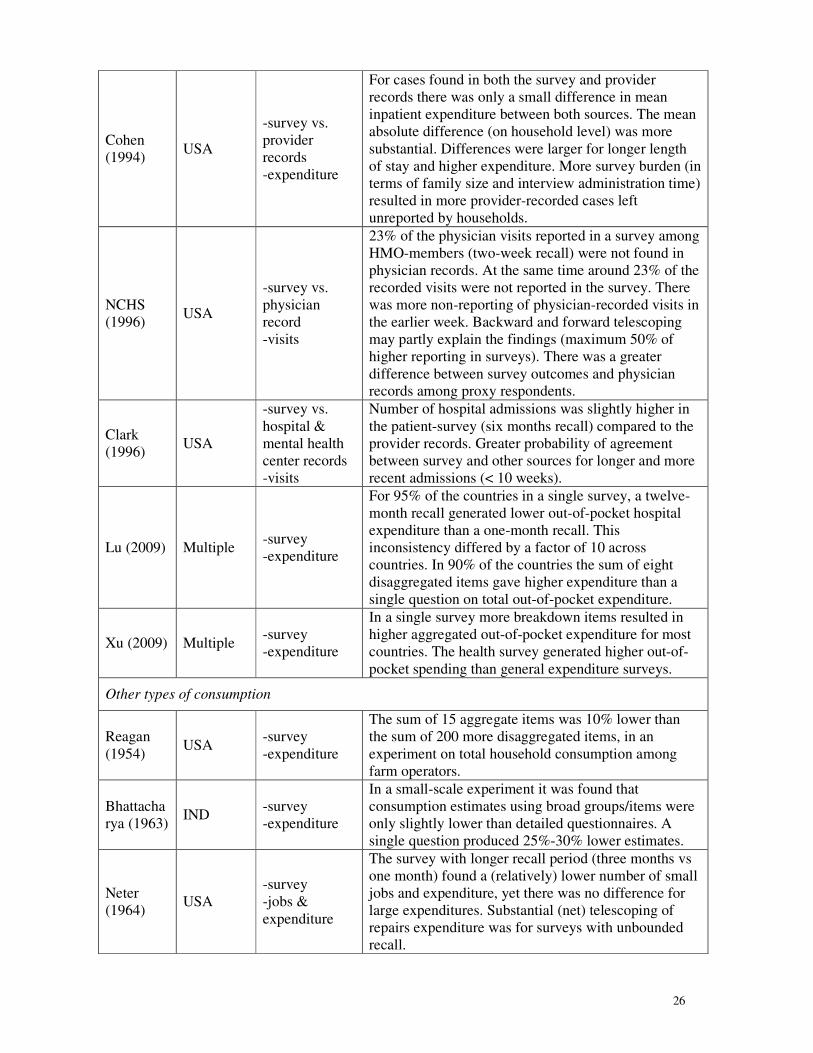
26
Cohen
(1994) USA
-survey vs.
provider
records
-expenditure
For cases found in both the survey and provider
records there was only a small difference in mean
inpatient expenditure between both sources. The mean
absolute difference (on household level) was more
substantial. Differences were larger for longer length
of stay and higher expenditure. More survey burden (in
terms of family size and interview administration time)
resulted in more provider-recorded cases left
unreported by households.
NCHS
(1996) USA
-survey vs.
physician
record
-visits
23% of the physician visits reported in a survey among
HMO-members (two-week recall) were not found in
physician records. At the same time around 23% of the
recorded visits were not reported in the survey. There
was more non-reporting of physician-recorded visits in
the earlier week. Backward and forward telescoping
may partly explain the findings (maximum 50% of
higher reporting in surveys). There was a greater
difference between survey outcomes and physician
records among proxy respondents.
Clark
(1996) USA
-survey vs.
hospital &
mental health
center records
-visits
Number of hospital admissions was slightly higher in
the patient-survey (six months recall) compared to the
provider records. Greater probability of agreement
between survey and other sources for longer and more
recent admissions (< 10 weeks).
Lu (2009) Multiple -survey
-expenditure
For 95% of the countries in a single survey, a twelve-
month recall generated lower out-of-pocket hospital
expenditure than a one-month recall. This
inconsistency differed by a factor of 10 across
countries. In 90% of the countries the sum of eight
disaggregated items gave higher expenditure than a
single question on total out-of-pocket expenditure.
Xu (2009) Multiple -survey
-expenditure
In a single survey more breakdown items resulted in
higher aggregated out-of-pocket expenditure for most
countries. The health survey generated higher out-of-
pocket spending than general expenditure surveys.
Other types of consumption
Reagan
(1954) USA
-survey
-expenditure
The sum of 15 aggregate items was 10% lower than
the sum of 200 more disaggregated items, in an
experiment on total household consumption among
farm operators.
Bhattacha
rya (1963) IND
-survey
-expenditure
In a small-scale experiment it was found that
consumption estimates using broad groups/items were
only slightly lower than detailed questionnaires. A
single question produced 25%-30% lower estimates.
Neter
(1964) USA
-survey
-jobs &
expenditure
The survey with longer recall period (three months vs
one month) found a (relatively) lower number of small
jobs and expenditure, yet there was no difference for
large expenditures. Substantial (net) telescoping of
repairs expenditure was for surveys with unbounded
recall.
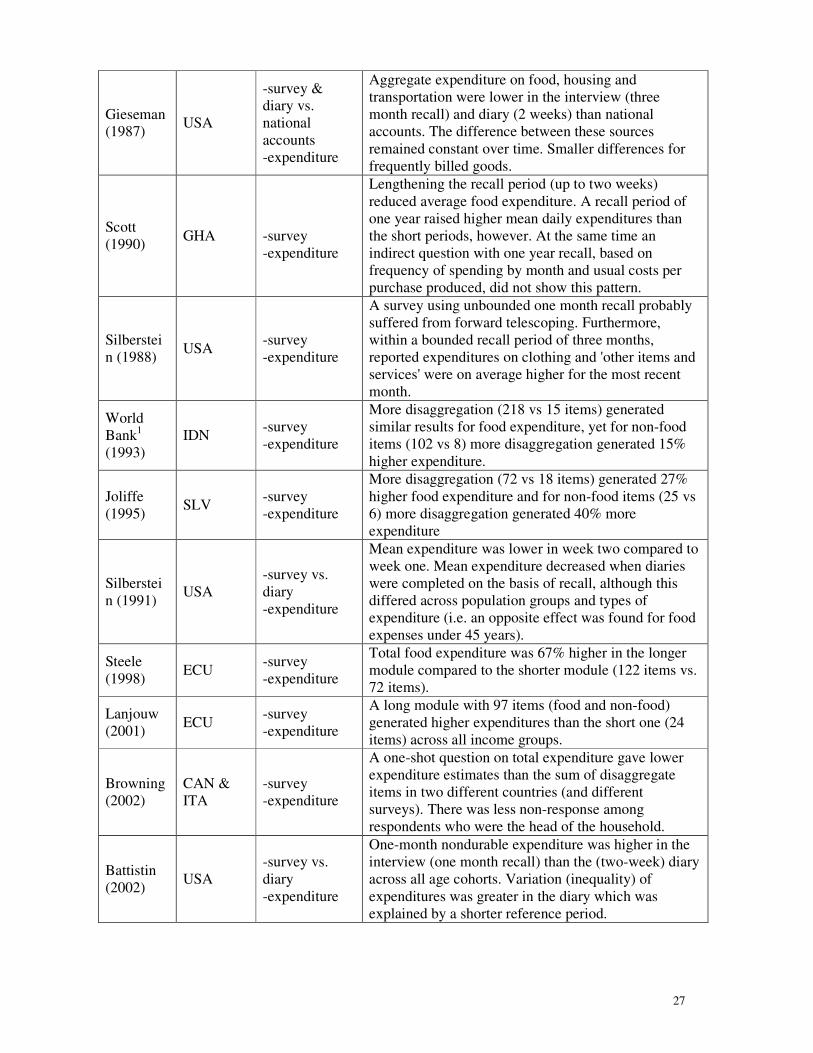
27
Gieseman
(1987) USA
-survey &
diary vs.
national
accounts
-expenditure
Aggregate expenditure on food, housing and
transportation were lower in the interview (three
month recall) and diary (2 weeks) than national
accounts. The difference between these sources
remained constant over time. Smaller differences for
frequently billed goods.
Scott
(1990) GHA
-survey
-expenditure
Lengthening the recall period (up to two weeks)
reduced average food expenditure. A recall period of
one year raised higher mean daily expenditures than
the short periods, however. At the same time an
indirect question with one year recall, based on
frequency of spending by month and usual costs per
purchase produced, did not show this pattern.
Silberstei
n (1988) USA
-survey
-expenditure
A survey using unbounded one month recall probably
suffered from forward telescoping. Furthermore,
within a bounded recall period of three months,
reported expenditures on clothing and 'other items and
services' were on average higher for the most recent
month.
World
Bank1
(1993)
IDN -survey
-expenditure
More disaggregation (218 vs 15 items) generated
similar results for food expenditure, yet for non-food
items (102 vs 8) more disaggregation generated 15%
higher expenditure.
Joliffe
(1995) SLV
-survey
-expenditure
More disaggregation (72 vs 18 items) generated 27%
higher food expenditure and for non-food items (25 vs
6) more disaggregation generated 40% more
expenditure
Silberstei
n (1991) USA
-survey vs.
diary
-expenditure
Mean expenditure was lower in week two compared to
week one. Mean expenditure decreased when diaries
were completed on the basis of recall, although this
differed across population groups and types of
expenditure (i.e. an opposite effect was found for food
expenses under 45 years).
Steele
(1998) ECU
-survey
-expenditure
Total food expenditure was 67% higher in the longer
module compared to the shorter module (122 items vs.
72 items).
Lanjouw
(2001) ECU
-survey
-expenditure
A long module with 97 items (food and non-food)
generated higher expenditures than the short one (24
items) across all income groups.
Browning
(2002)
CAN &
ITA
-survey
-expenditure
A one-shot question on total expenditure gave lower
expenditure estimates than the sum of disaggregate
items in two different countries (and different
surveys). There was less non-response among
respondents who were the head of the household.
Battistin
(2002) USA
-survey vs.
diary
-expenditure
One-month nondurable expenditure was higher in the
interview (one month recall) than the (two-week) diary
across all age cohorts. Variation (inequality) of
expenditures was greater in the diary which was
explained by a shorter reference period.
28
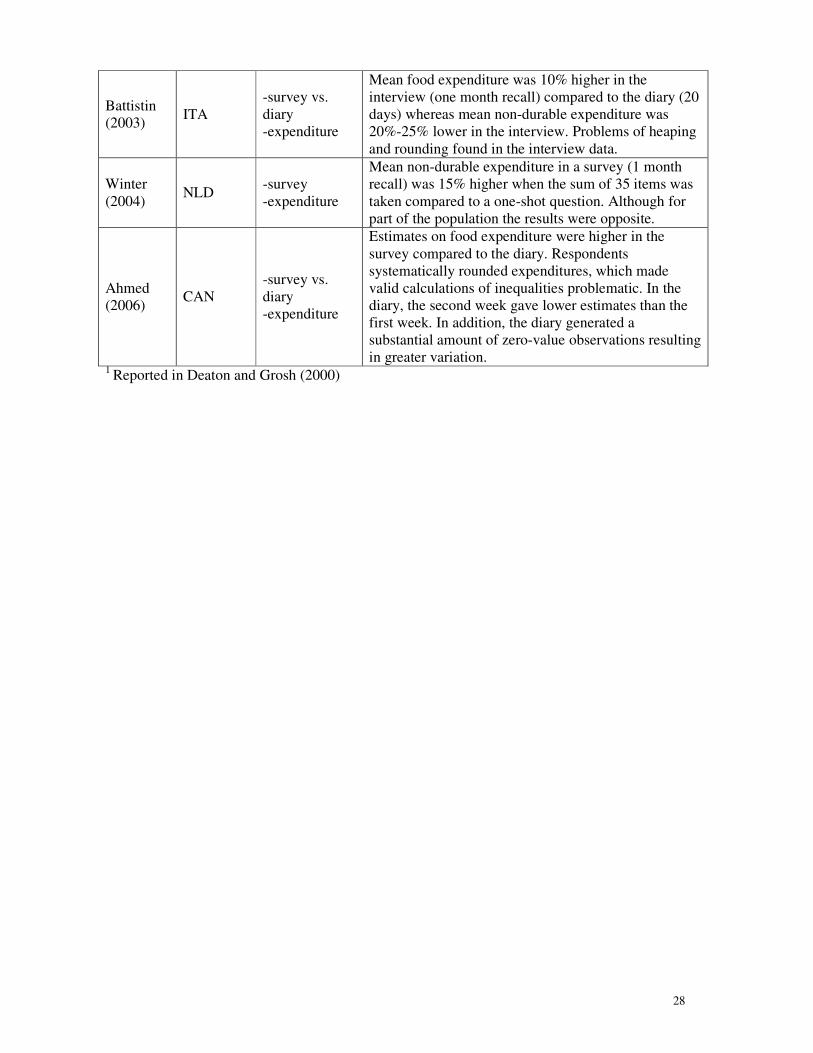
Battistin
(2003) ITA
-survey vs.
diary
-expenditure
Mean food expenditure was 10% higher in the
interview (one month recall) compared to the diary (20
days) whereas mean non-durable expenditure was
20%-25% lower in the interview. Problems of heaping
and rounding found in the interview data.
Winter
(2004) NLD
-survey
-expenditure
Mean non-durable expenditure in a survey (1 month
recall) was 15% higher when the sum of 35 items was
taken compared to a one-shot question. Although for
part of the population the results were opposite.
Ahmed
(2006) CAN
-survey vs.
diary
-expenditure
Estimates on food expenditure were higher in the
survey compared to the diary. Respondents
systematically rounded expenditures, which made
valid calculations of inequalities problematic. In the
diary, the second week gave lower estimates than the
first week. In addition, the diary generated a
substantial amount of zero-value observations resulting
in greater variation. 1
Reported in Deaton and Grosh (2000)