valmet unique offering with process technology, automation
TRANSCRIPT

Valmet – unique offering with process technology, automation and services
Roadshow presentation
August 2021

Important notice
August 2021 © Valmet | Roadshow presentation2
The following applies to this presentation, the oral presentation of the information in this presentation by Valmet Oyj (“Valmet” or the “Company”) or any person on
behalf of Valmet, and any question-and-answer session that follows the oral presentation (collectively, the “Information”). In accessing the Information, you agree to
be bound by the following terms and conditions.
Securities laws in the United States and in other jurisdictions restrict Valmet from discussing or disclosing information with respect to the contemplated merger with
Neles Corporation (“Neles”). Information regarding the contemplated merger can be found at www.valmet.com/merger. Until the completion of the merger Valmet and
Neles will carry out their respective businesses as separate and independent companies. The information contained in this presentation concerns only Valmet.
The merger of Valmet and Neles and the merger consideration securities have not been and will not be registered under the U.S. Securities Act of 1933 (the “U.S.
Securities Act”), and may not be offered, sold or delivered within or into the United States, except pursuant to an applicable exemption of, or in a transaction not
subject to, the U.S. Securities Act.
The Information in this presentation is not directed to, or intended for distribution to or use by, any person or entity that is a citizen or resident of, or located in, any
locality, state, country or other jurisdiction where such distribution or use would be contrary to law or regulation or which would require any registration or licensing
within such jurisdiction and it does not constitute an offer of or an invitation by or on behalf of, Valmet, or any other person, to purchase any securities.
The Information contains forward-looking statements. All statements other than statements of historical fact included in the Information are forward-looking statements.
Forward-looking statements give Valmet’s current expectations and projections relating to its financial condition, results of operations, plans, objectives, future
performance and business. These statements may include, without limitation, any statements preceded by, followed by or including words such as “target,” “believe,”
“expect,” “aim,” “intend,” “may,” “anticipate,” “estimate,” “plan,” “project,” “will,” “can have,” “likely,” “should,” “would,” “could” and other words and terms of similar
meaning or the negative thereof. Such forward-looking statements involve known and unknown risks, uncertainties and other important factors beyond Valmet’s control
that could cause Valmet’s actual results, performance or achievements to be materially different from the expected results, performance or achievements expressed or
implied by such forward-looking statements. Such forward-looking statements are based on numerous assumptions regarding Valmet’s present and future business
strategies and the environment in which it will operate in the future.
The Information, including but not limited to forward-looking statements, applies only as of the date of this presentation and is not intended to give any assurances as
to future results. Market data used in the Information not attributed to a specific source are estimates of the Company and have not been independently verified.
Prospective investors are required to make their own independent investigations and appraisals of the business and financial condition of the Company before taking
any investment decision with respect to securities of the Company.

Valmet roadshow presentation
Agenda
© Valmet | Roadshow presentation3
1 Valmet in brief
2
Financials 3
Investment highlights
4 Conclusion
August 2021

Valmet in brief

We have strong market shares, unique offering and over 220 years of history
© Valmet | Roadshow presentation5 August 2021
Services
Market position
#1–2
Automation
Market position
#1–3
Pulp and
Energy
Market position
#1–3
Market share
~20–45%Market share
~25%Market share
~17–18%
Paper
Market position
#1
Market share
~50%
Valmet’s road to becoming a global market leader
1951
Valmet
1797 onwards
Tamfelt, Beloit, KMW,
Sunds Defibrator
Acquisitions
Automation (2015)
GL&V (2019)
J&L (2019)
PMP (2020)
1968–1996
Several M&As, e.g.
KMW (1986),
Wärtsilä paper finishing machinery (1987),
Tampella Papertech (1992)
1999
Metso created
through the merger of
Valmet and Rauma
Key acquisitions
Beloit Technology (2000),
Kvaerner Pulping &
Kvaerner Power (2006),
Tamfelt (2009)
End of 2013
Demerger to create
Valmet and Metso

Pulp, Energy and Paper
Services and Automation
Pulp, Energy and Paper
Services and Automation
0
50
100
150
200
250
300
350
400
450
2013 2014 2015 2016 2017 2018 2019 2020 LTM0%
1%
2%
3%
4%
5%
6%
7%
8%
9%
10%
11%
20132014201520162017201820192020 LTM
0.0
0.5
1.0
1.5
2.0
2.5
3.0
3.5
4.0
4.5
2013 2014 2015 2016 2017 2018 2019 2020 LTM0.0
0.5
1.0
1.5
2.0
2.5
3.0
3.5
4.0
4.5
2013 2014 2015 2016 2017 2018 2019 2020 LTM
August 2021 © Valmet | Roadshow presentation6
Valmet’s development since 2013
2013 figures on carve-out basis
Orders received
(EUR billion)
Net sales
(EUR billion)
Comparable EBITA
(EUR million)
Comparable EBITA margin
(%)
Business lines Business lines
Comparable
EBITA
Comparable
EBITA margin

Last twelve months ending Q2/2021
Key figures
August 2021 © Valmet | Roadshow presentation7
Net sales by area Net sales by business lineOrders received
EUR 4,180 million
Net sales
EUR 3,801 million
Comparable EBITA
EUR 412 million
Comparable EBITA margin
10.8%
Order backlog
EUR 4,019 million
Employees
14,362
35%
8%25%
31%
Services
Automation
Pulp and Energy
Paper
19%
13%
40%
17%
10%
North America
South America
EMEA
China
Asia-Pacific
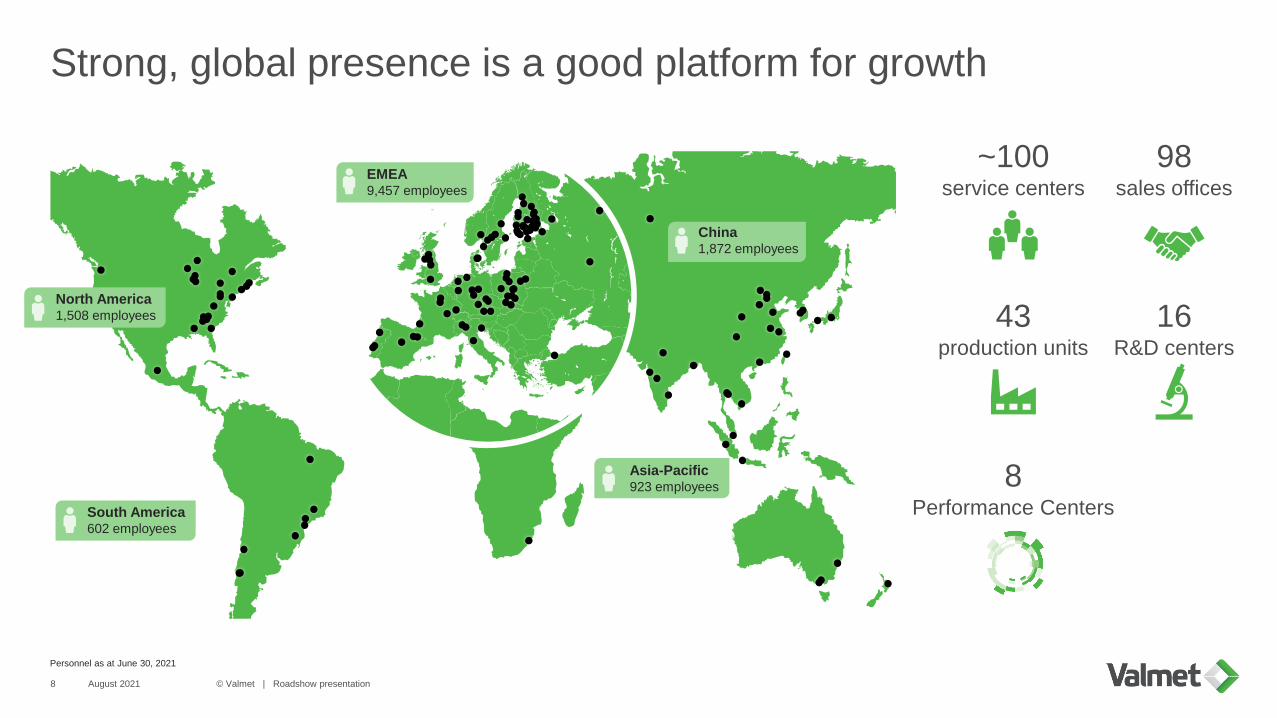
Strong, global presence is a good platform for growth
© Valmet | Roadshow presentation8 August 2021
Personnel as at June 30, 2021
98 sales offices
43production units
16R&D centers
~100 service centers
South America602 employees
North America1,508 employees
China1,872 employees
EMEA9,457 employees
Asia-Pacific923 employees 8
Performance Centers

Valmet’s unique offering differentiates the company from its competitors
Process technology, services and automation
© Valmet | Roadshow presentation9 August 2021
Customer
Processtechnology
AutomationServices

Significant, customer focused research and development work
© Valmet | Roadshow presentation10 August 2021
R&D focus areas
• Advanced and competitive technologies and services
• Raw material, water and energy efficiency
• Promotion of renewable materials
EUR 75million
R&D spending
in 2020
16research and
development
centers
~1,300protected
inventions

Corporate
citizenship
We are a trusted
partner and respected
corporate citizen
Sustainable
supply chain
We develop sustainable
supply chain practices
Good sustainability ratings
In Dow Jones Sustainability
Index for the seventh
consecutive year
Achieved A- rating in CDP’s
climate program and reached
the leadership level for the
fifth consecutive year
AAA rating in the MSCI ESG
Ratings assessment 2021
Bronze Class 2021
Sustainability Award
In Ethibel Sustainability Index
Excellence Europe
11
Acknowledged leader in sustainability360° approach to sustainability
360°
People and
performance
Sustainable
solutions
We are a responsible
employer and promote
diversity
We develop and provide
solutions that support
sustainability
We protect the safety
of our people and
partners and minimize
our environmental
impact
Health, safety
and environment
© Valmet | Roadshow presentationAugust 2021

Valmet´s Climate Program: Forward to a carbon neutral future
12
SUPPLY CHAIN
-20%CO2 emission reduction
Targets by 2030 for the entire value chain
OWN OPERATIONS
-80%CO2 emission reduction
USE PHASE OF VALMET’S TECHNOLOGIES
-20%Further reduced energy use
of Valmet’s current technologies
100%Carbon neutral production
August 2021 © Valmet | Roadshow presentation
Valmet´s new Climate Program sets credible targets and concrete actions for 2030 for the entire value chain
Program is aligned with the Paris Climate Agreement´s 1.5-degree pathway and UN Sustainable Development Goals and Valmet is
in process to send its climate targets for the Science Based Targets Initiative for validation
Main actions to reach targets by 2030
Target CO2 emission reductions from supply chain
Reduce energy usage and use renewable fuels and CO2 free electricity and district heating in own locations
Improve energy efficiency of our existing process technology offering by 20%
Develop existing and new technologies to enable carbon neutral production for our customers

Financial targets
August 2021 © Valmet | Roadshow presentation13
Growth
Net sales for stable
business to grow over
two times the market
growth
Net sales for capital
business to exceed
market growth
Profitability
Comparable EBITA:
10–12%
ROCE
Comparable return on
capital employed (ROCE)
before taxes1: >20%
Dividend policy
Dividend payout at least
50% of net profit
1) Comparable ROCE before taxes = (profit before taxes + interests and other financial expenses +/- items affecting comparability) / (balance sheet total - non-interest-bearing liabilities (average for the period))

Investment highlights

Investment highlights
August 2021 © Valmet | Roadshow presentation15
1 Strong position in the growing market of converting renewables
2 Widest technology and services offering combined with automation excellence
3 Services: The widest offering and strong geographical presence
4 Automation: Maximizing efficiency and safety of our customers
5 Paper: World-class technology for packaging and hygiene needs
6Pulp and Energy: Strong business with high market share and flexible cost structure
7 Systematically building the future

Increasing pulp, tissue, board and energy production
Customer demand for resource efficiency, productivity, end-product quality, industrial internet services and reduced environmental impact
Customer focus on core, decreasing own resources and outsourcing of non-core operations
Size and gradual aging of installed base and capacity increases
Closures and conversions of non-competitive production lines
August 2021 © Valmet | Roadshow presentation16
Strong position in the growing market of converting renewables
World trade, e-commerce and emerging markets growth drive packaging
Demand for light weight board
Shift from plastic packaging to renewable materials
Conversions from paper to board
Increasing role of digital media decreases demand for print papers
Demand for technology driven efficiency improvements
Need for specialty papers
Rise in purchasing power and living standards
Urbanization and improved hygiene
Fast economic growth in emerging markets
Demand for higher quality
Consumers’ higher hygiene habits
Paper TissueBoard Pulp
Growing demand for sustainable packaging, tissue, hygiene products and textiles
Increasing environmental awareness and stricter regulations
Fiber-based plastic replacement
Demand for second generation bioethanol
Energy
Decarbonization in energy production
Biomass and residual waste used in heat and process steam production
Tightening air emissions legislation and stricter directives
Automation Services
Aging machines and installed automation systems
Investments in new pulp and paper production lines and industrial decarbonization
Demand for raw material savings, process efficiencies and sustainability
Demand for Industrial Internet based solutions driven by customer digitalization
For paper, board and tissue market position and estimated market size calculated as average during 2018-2020.
For pulp, energy and automation the market position and estimated market size calculated based on 2020 figures.
For services, the market position calculated from 2020 and estimated market size once the market recovers from the
temporary negative impact of COVID on customer operations and services demand
#1 0.4EUR bn
~ -2%p.a.
3% of net sales
#1 1.0EUR bn
~ 2-3%p.a.
20% of net sales
#1 0.7EUR bn
~ 3-4%p.a.
6% of net sales
#1-2 1.5EUR bn
~ 1%p.a.
18% of net sales
#1-3 2.0EUR bn
~ 1%p.a.
9% of net sales
#1-3 2.1EUR bn
~ 1%p.a.
9% of net sales
#1-2 8.0EUR bn
~ 1-2%p.a.
35% of net sales
# Market positon | Estimated market size for current offering (EUR) | Anticipated long-term market growth
1
Pulp

Widest technology and services offering combined with automation excellence
August 2021 © Valmet | Roadshow presentation17
Services
• Spare parts and components
• Maintenance and shutdown services
• Outsourcing services
• Production consumables
• Process support and optimization
Paper
• Board, paper and tissue production lines
• Rebuilds
• Stand-alone products
Pulp
• Wood and pulp handling
• Fiber processing
• Recovery
Automation
• Distributed Control Systems (DCS)
• Quality Management Systems (QMS)
• Analyzers and measurements
• Industrial Internet solutions
Energy
• Heat and power generation
• Air emission control
• Biofuels
2
Customer
Processtechnology
Services Automation

1,0551,119
1,1821,242
1,315
1,4591,356 1,387
2014 2015 2016 2017 2018 2019 2020 LTM
Services business line
Widest offering to support customers’ all service needs
Benefits from growing installed base
Strong geographical presence close to customers
Steady increase in market share from 13% in 2014 to
17-18% in 2020
Targeting to grow with the market and by winning further
market share
Opportunities to win new customers and increase share
of wallet with existing customers
Services business line
Orders received (EUR million)
August 2021 © Valmet | Roadshow presentation18
Services: The widest offering and strong geographical presence 3
Organic
growth
~4%CAGR in
2014-2019

299 317 330359 334 355
3851
5657 81
85
2016 2017 2018 2019 2020 LTM
Automation business line
Solutions range from single measurements to plant-wide
process automation systems
Designed to maximize safety, sustainability and efficiency
of customers’ businesses
Securing future competitiveness with R&D
Strong track record since acquired to Valmet in 2015
Several drivers for future growth
– Increasing direct sales to customers
– Package sales with Valmet’s capital equipment
– Replacing competitors’ installed base and entering new industries
– Growing in automation services
Automation business line
Orders received (EUR million)
August 2021 © Valmet | Roadshow presentation19
Automation: Maximizing efficiency and safety of our customers 4
Organic
growth
~5%CAGR
337
368386
416 415440

Paper business line
Offering includes world-leading technology and products
for board, tissue and paper making
Long-term growth supported by favorable
megatrends
– Growing e-commerce and packaging needs
– Increasing demand for hygiene products
High market share
Technological advantage and excellent
references
R&D targeted to introduce new products and improve the
existing offering
Flexible organization and low capacity cost
provides resilience to market fluctuations
Paper business line
671 673 718
1,0351,0771,0431,029
1,310
2014 2015 2016 2017 2018 2019 2020 LTM
August 2021 © Valmet | Roadshow presentation20
Paper: World-class technology for packaging and hygiene needs 5
528
659 647
784
937 9131,076
1,178
2014 2015 2016 2017 2018 2019 2020 LTM
Orders received (EUR million) Net sales (EUR million)
Capacity
costs2015 2020
Market
share
Market
position
EUR million 270 301 Board ~50% #1
% of net sales 41% 28% Tissue ~35% #1
Paper ~50% #1

Pulp and Energy business line
Offering includes full pulp mills and energy solutions for
biomass and emission control
Long-term growth supported by favorable
megatrends
– Growing demand for sustainable packaging and hygiene products and
textiles
– Replacing plastic with fiber-based materials
High market share
Technological advantage by focusing on R&D
Flexible organization and low capacity cost provides
resilience to market fluctuations
Yearly variations in orders received are typical due to
timing of large orders
Pulp and Energy business line
1,344
864939
678
1,000
1,125
934
1,130
2014 2015 2016 2017 2018 2019 2020 LTM
August 2021 © Valmet | Roadshow presentation21
Pulp and Energy: Strong business with high market share and flexible cost structure
6
956 913826 800
863919
1,003 966
2014 2015 2016 2017 2018 2019 2020 LTM
Orders received (EUR million) Net sales (EUR million)
Capacity
costs2015 2020
Market
share
Market
position
EUR million 218 196 Pulp ~45% #1-2
% of net sales 24% 20% Energy ~20% #1-3

August 2021 © Valmet | Roadshow presentation22 LTIF = Lost time incident frequency
Systematically building the future
Customer
Valmet’s way to serve:
Lifecycle collaboration
between the customer
and Valmet
Add value to customers
through Industrial
Internet solutions
Ensure strong market
position in capital
business
Continue to increase
market share in the
stable business
Technology
Develop new products
and technologies
Improve product cost
competitiveness
Increase material and
energy efficiency and
further develop solutions
to reduce carbon
footprint
Process
Continue to improve
project management
and project execution
Valmet’s climate
program targeting to
reduce emissions in the
whole value chain
People
Continuous development
of employees through
training programs
Building capabilities
globally
Continue to improve
safety and lower LTIF
7

Financials

August 2021 © Valmet | Roadshow presentation24
Key figures
EUR million Q2/2021 Q2/2020 Change Q1–Q2/2021 Q1–Q2/2020 Change
Orders received 1,228 826 49% 2,540 2,013 26%
Order backlog1 4,019 3,492 15% 4,019 3,492 15%
Net sales 943 919 3% 1,801 1,740 3%
Comparable EBITA 95 76 24% 175 128 37%
% of net sales 10.1% 8.3% 9.7% 7.4%
EBITA 97 70 39% 186 121 54%
Operating profit (EBIT) 85 62 36% 161 104 54%
% of net sales 9.0% 6.8% 8.9% 6.0%
Earnings per share, EUR 0.43 0.29 44% 0.81 0.49 64%
Return on capital employed (ROCE) before taxes2 20% 16%
Cash flow provided by operating activities 180 151 19% 328 324 1%
Gearing1 -1% -23%
Items affecting comparability: EUR 2 million in Q2/2021 (EUR -6 million in Q2/2020), EUR 11 million in Q1–Q2/2021 (EUR -7 million in Q1–Q2/2020)
Valmet’s investment in Neles had a positive impact on EBITA of EUR 2.9 million in Q2/2021 and EUR 6.6 million in Q1–Q2/2021
Valmet’s investment in Neles had a negative impact on operating profit of EUR -0.6 million in Q2/2021 and EUR -0.5 million in Q1–Q2/2021
1) At end of period
2) Annualized

Target 10–12%
33
Comparable EBITA margin1 at target level
August 2021 © Valmet | Roadshow presentation25
Net sales and Comparable EBITA, rolling 12 months (EUR million and %)1
• In Q2/2021, net sales remained at the previous year's level and Comparable EBITA increased compared with
Q2/2020
Comparable EBITA,
rolling 12 months
(EUR million)
121 153 167 182 19432 33 106 197 202 196 199 190 194 218 206 219 225 257
1) Rolling 12 months. Carve-out figures for 2013 have been used in the calculation of Q1–Q3/2014 figures. Valmet implemented IFRS 15 – Revenue from Contracts with Customers as of
January 1, 2018 by applying full retrospective method. Thus, figures presented are not fully comparable.
282 291 311 316 320 327 336 365 393 412
1,010 1,005 984 989 1,0071,127
1,2261,357
1,429 1,434 1,451 1,453 1,450 1,447 1,441 1,474 1,469 1,496 1,497 1,525 1,559 1,601 1,666 1,715 1,739 1,695 1,663 1,661 1,636 1,657
1,490 1,369 1,378 1,484 1,5081,579
1,6251,572
1,591 1,610 1,544 1,473 1,469 1,399 1,435 1,584 1,676 1,762 1,811 1,799 1,720 1,736 1,762 1,832 1,942 2,005 2,013 2,079 2,141 2,144
2,5002,374 2,363
2,473 2,5152,707
2,851 2,9283,019 3,044 2,995 2,926 2,919 2,846 2,876
3,0583,145
3,257 3,308 3,325 3,279 3,3373,429
3,5473,682 3,700 3,676 3,740 3,777 3,801
1.3% 1.3% 1.4%
4.3%4.8%
5.6% 5.9%6.2% 6.4% 6.5%
6.8% 6.7% 6.8% 6.7% 6.7%7.1%
6.6% 6.7% 6.8%
7.7%
8.6% 8.7%9.1% 8.9% 8.7% 8.8%
9.1%
9.8% 10.4%10.8%
Q1/14 Q2/14 Q3/14 Q4/14 Q1/15 Q2/15 Q3/15 Q4/15 Q1/16 Q2/16 Q3/16 Q4/16 Q1/17 Q2/17 Q3/17 Q4/17 Q1/18 Q2/18 Q3/18 Q4/18 Q1/19 Q2/19 Q3/19 Q4/19 Q1/20 Q2/20 Q3/20 Q4/20 Q1/21 Q2/21
Capital business, rolling12 months
Stable business, rolling12 months
Comparable EBITA %,rolling 12 months

Guidance and short-term market outlook
August 2021 © Valmet | Roadshow presentation26
GoodPulp and Energy
Paper
Pulp
Energy
Board and Paper
Tissue
Guidance
Services
Short-term market outlook
Guidance for 2021 (as announced on April 16, 2021)
Good
Satisfactory
Good
Satisfactory
Satisfactory / Weak
Good
Weak
Good
Good
Q3/2020 Q4/2020
Satisfactory
Good
Weak
Good
Good
Q1/2021
Good / Satisfactory
Weak
Good
Good
Q2/2021
Valmet estimates that net sales in 2021 will increase in comparison with 2020 (EUR 3,740 million)
and Comparable EBITA in 2021 will increase in comparison with 2020 (EUR 365 million).
Good / Satisfactory Good Good GoodAutomation
The short-term market outlook is based on customer activity (50%) and Valmet’s capacity utilization (50%) and is given for the next six months from the end of the respective quarter. The scale is ‘weak–satisfactory–good’.
Satisfactory / Weak

Conclusion

Conclusion
August 2021 © Valmet | Roadshow presentation28
1 Strong position in the growing market of converting renewables
2 Widest technology and services offering combined with automation excellence
3 Services: The widest offering and strong geographical presence
4 Automation: Maximizing efficiency and safety of our customers
5 Paper: World-class technology for packaging and hygiene needs
6Pulp and Energy: Strong business with high market share and flexible cost structure
7 Systematically building the future

It should be noted that certain statements herein which are not historical facts, including, without limitation, those regarding
expectations for general economic development and the market situation, expectations for growth, profitability and investment
willingness, expectations for company development, growth and profitability and the realization of synergy benefits and cost
savings, and statements preceded by “anticipates”, “believes”, ”estimates”, “expects”, ”foresees” or similar expressions, are
forward-looking statements. Since these statements are based on current decisions and plans, estimates and projections, they
involve risks and uncertainties which may cause the actual results to materially differ from the results currently expressed. Such
factors include, but are not limited to:
1) general economic conditions, including fluctuations in exchange rates and interest levels which influence the operating
environment and profitability of customers of the company or economic growth in the company’s principal geographic markets.
2) industry conditions, intensity of competition situation, especially potential introduction of significant technological solutions
developed by competitors, financial condition of the customers and the competitors of the company,
3) the company’s own operating factors, such as the success of production, product development and project management and
the efficiencies therein including continuous development and improvement
4) the success of pending and future acquisitions and restructuring.
Important notice
© Valmet | Roadshow presentation29 August 2021

Appendix
© Valmet | Roadshow presentation30
1 Financials
2
Shareholders and share price development3
Strategy and offering4
Management and remuneration
August 2021
5
Growth and profitability improvement

Appendix
Financials

224 251 235278
242
371334
409
314377 351
411
311374 345
444
306
401346
472
340
443 412
521
364399 380
519
339
419295 337 354
498319
408400
445
338427 334
375
333357 370
523
426
442419
512
346
458 445
583
457520 453
649
519
523
519588 590
777
561
779734
854
652
804
685
785
645
732 715
967
732
844
765
984
686
901857
1,103
821
919
832
1,167
858
0.7%
3.7%5.5%
6.1%
3.5%
6.9%6.4%
7.3%
4.8%
7.1%
7.5%
7.2%5.3%
6.5%
7.8%
8.4%
3.0%
7.2%
8.0%
11.5%
6.9%
7.7%
9.5%
10.7%
6.3%
8.3%
10.9%
12.5%
9.4%10.1%
Q1/14 Q2/14 Q3/14 Q4/14 Q1/15 Q2/15 Q3/15 Q4/15 Q1/16 Q2/16 Q3/16 Q4/16 Q1/17 Q2/17 Q3/17 Q4/17 Q1/18 Q2/18 Q3/18 Q4/18 Q1/19 Q2/19 Q3/19 Q4/19 Q1/20 Q2/20 Q3/20 Q4/20 Q1/21 Q2/21
Capital business
Stable business
Comparable EBITA %
Quarterly Comparable EBITA margin development
August 2021 © Valmet | Roadshow presentation32
Target 10–12%
Net sales and Comparable EBITA (EUR million and %)
Comparable EBITA
(EUR million)
19 54 47 63 314 22 32 48 57 52 56 34 48 56 81 22 61 61 113 47 69 81 118 52 76 91 146 80 95

Services: Orders received increased to EUR 372 million in Q2/2021
August 2021 © Valmet | Roadshow presentation33
Net sales (EUR million)Orders received (EUR million)
• Orders received increased compared with Q2/2020
- Orders received increased in South America and North America, and remained at the previous year's level in China, EMEA and Asia-Pacific
- Orders received increased in Board, Paper and Tissue Solutions, Pulp and Energy Solutions, Fabrics and Performance Parts, and remained at
the previous year’s level in Rolls
• Net sales increased compared with Q2/2020
• COVID-19 related travel restrictions and lower capacity utilization in graphical paper mills impacted Services’ business environment in
Q2/2021
Q1–Q2/2021:
EUR 756 million
Q1–Q2/2021 :
EUR 628 million
Q1–Q2/2020:
EUR 726 million
Q1–Q2/2020 :
EUR 617 million
224
251235
278
242
304
268
314
257
304286
316
252
302284
340
247
325
282
366
276
361336
400
295
322307
402
290
338
0
200
400
600
800
1,000
1,200
1,400
1,600
1,800
0
50
100
150
200
250
300
350
400
450
Q1
/14
Q2
/14
Q3
/14
Q4
/14
Q1
/15
Q2
/15
Q3
/15
Q4
/15
Q1
/16
Q2
/16
Q3
/16
Q4
/16
Q1
/17
Q2
/17
Q3
/17
Q4
/17
Q1
/18
Q2
/18
Q3
/18
Q4
/18
Q1
/19
Q2
/19
Q3
/19
Q4
/19
Q1
/20
Q2
/20
Q3
/20
Q4
/20
Q1
/21
Q2
/21
Net sales (LHS) Net sales, last 4 quarters (RHS)
267273
242
273293
307
252267
313321
264284
355
321
284282
346344
300
325
358371
335
395398
328
288
342
385372
0
200
400
600
800
1,000
1,200
1,400
1,600
0
50
100
150
200
250
300
350
400
Q1
/14
Q2
/14
Q3
/14
Q4
/14
Q1
/15
Q2
/15
Q3
/15
Q4
/15
Q1
/16
Q2
/16
Q3
/16
Q4
/16
Q1
/17
Q2
/17
Q3
/17
Q4
/17
Q1
/18
Q2
/18
Q3
/18
Q4
/18
Q1
/19
Q2
/19
Q3
/19
Q4
/19
Q1
/20
Q2
/20
Q3
/20
Q4
/20
Q1
/21
Q2
/21
Orders received (LHS) Orders received, last 4 quarters (RHS)

Automation1: Orders received increased to EUR 116 million in Q2/2021
August 2021 © Valmet | Roadshow presentation34
1) Comments refer to orders received and net sales including also internal orders received and internal net sales.
Net sales (EUR million)Orders received (EUR million)
Q1–Q2/2021:
EUR 239 million
Q1–Q2/2021:
EUR 161 million
Q1–Q2/2020:
EUR 214 million
Q1–Q2/2020:
EUR 174 million
• Orders received increased compared with Q2/2020
- Orders received increased in all geographical areas
- Orders received increased in Pulp and Paper and decreased in Energy and Process
• Net sales remained at the previous year’s level compared with Q2/2020
• COVID-19 caused access restrictions to some customer sites, which impacted Automation’s business environment in
Q2/2021
8570 67 66
82 72 78 7291
62
91 82 8470
94 9582 86 96 92 81
65
96 10391
10
8 8 156
79 16
12
13
911 18
11
15 821 12
17 24
16
16
24 2025
95
78 7581
8880
87 88
103
75
10193
102
81
109103104
97
112116
98
81
120123116
0
60
120
180
240
300
360
420
480
0
20
40
60
80
100
120
140
160
Q2/1
5
Q3/1
5
Q4/1
5
Q1/1
6
Q2/1
6
Q3/1
6
Q4/1
6
Q1/1
7
Q2/1
7
Q3/1
7
Q4/1
7
Q1/1
8
Q2/1
8
Q3/1
8
Q4/1
8
Q1/1
9
Q2/1
9
Q3/1
9
Q4/1
9
Q1/2
0
Q2/2
0
Q3/2
0
Q4/2
0
Q1/2
1
Q2/2
1
Orders received, internal (from other business lines)Orders received, externalOrders received, total (including internal)Orders received, last 4 quarters (RHS)
68 66
95
5873 65
94
5973
60
104
5976
64
106
6482 75
120
69 77 72
117
49
81
11 6
6
9
84
5
128
8
11
10
14
9
18
9
1312
17
1117
15
24
18
1279
72
101
66
8169
99
7280
68
115
69
90
73
124
73
9588
137
8094
87
141
67
94
0
60
120
180
240
300
360
420
480
0
20
40
60
80
100
120
140
160
Q2/1
5
Q3/1
5
Q4/1
5
Q1/1
6
Q2/1
6
Q3/1
6
Q4/1
6
Q1/1
7
Q2/1
7
Q3/1
7
Q4/1
7
Q1/1
8
Q2/1
8
Q3/1
8
Q4/1
8
Q1/1
9
Q2/1
9
Q3/1
9
Q4/1
9
Q1/2
0
Q2/2
0
Q3/2
0
Q4/2
0
Q1/2
1
Q2/2
1
Net sales, internal (from other business lines)Net sales, externalNet sales, total (including internal)Net sales, last 4 quarters (RHS)

• Orders received increased compared with Q2/2020
- Orders received increased in all other areas except EMEA, where orders received decreased
- Orders received increased in Pulp and decreased in Energy
• Net sales decreased compared with Q2/2020
• Pulp and Energy business line has managed challenges caused by COVID-19 well, and therefore the pandemic did not
cause major impacts on its operations in Q2/2021
Pulp and Energy: Orders received increased to EUR 326 million in Q2/2021
August 2021 © Valmet | Roadshow presentation35
Net sales (EUR million)Orders received (EUR million)
Q1–Q2/2021:
EUR 787 million
Q1–Q2/2021:
EUR 469 million
Q1–Q2/2020:
EUR 591 million
Q1–Q2/2020:
EUR 506 million
622
560
9666
138
259
206
261238
180
275247
265
141122
151192
85
272
451
201210
395
320
376
215
52
291
461
326
0
200
400
600
800
1,000
1,200
1,400
0
100
200
300
400
500
600
700
Q1/1
4
Q2/1
4
Q3/1
4
Q4/1
4
Q1/1
5
Q2/1
5
Q3/1
5
Q4/1
5
Q1/1
6
Q2/1
6
Q3/1
6
Q4/1
6
Q1/1
7
Q2/1
7
Q3/1
7
Q4/1
7
Q1/1
8
Q2/1
8
Q3/1
8
Q4/1
8
Q1/1
9
Q2/1
9
Q3/1
9
Q4/1
9
Q1/2
0
Q2/2
0
Q3/2
0
Q4/2
0
Q1/2
1
Q2/2
1
Orders received (LHS) Orders received, last 4 quarters (RHS)
181
229234
312
222231215245
181
262
196187189192200219203205
223232
160
212231
315
240265
211
286
230238
0
200
400
600
800
1,000
1,200
1,400
0
100
200
300
400
500
600
700
Q1/1
4
Q2/1
4
Q3/1
4
Q4/1
4
Q1/1
5
Q2/1
5
Q3/1
5
Q4/1
5
Q1/1
6
Q2/1
6
Q3/1
6
Q4/1
6
Q1/1
7
Q2/1
7
Q3/1
7
Q4/1
7
Q1/1
8
Q2/1
8
Q3/1
8
Q4/1
8
Q1/1
9
Q2/1
9
Q3/1
9
Q4/1
9
Q1/2
0
Q2/2
0
Q3/2
0
Q4/2
0
Q1/2
1
Q2/2
1
Net sales (LHS) Net sales, last 4 quarters (RHS)

• Orders received increased compared with Q2/2020
- Orders received increased in Asia-Pacific, South America and EMEA, and decreased in North America and China
- Orders received increased in Stock Preparation and Recycled Fiber, as well as in Board and Paper, and decreased in Tissue
- Small and Medium size Machines (the acquired PMP Group) contributed EUR 15 million to orders received
• Net sales increased compared with Q2/2020
- Small and Medium size Machines (the acquired PMP Group) contributed EUR 17 million to net sales
• Paper business line has managed challenges caused by COVID-19 well, and therefore the pandemic did not cause major impacts on its
operations in Q2/2021
Paper: Orders received increased to EUR 440 million in Q2/2021
August 2021 © Valmet | Roadshow presentation36
Net sales (EUR million)Orders received (EUR million)
Q1–Q2/2021:
EUR 803 million
Q1–Q2/2021:
EUR 574 million
Q1–Q2/2020:
EUR 522 million
Q1–Q2/2020:
EUR 472 million
212190
128142149129
197199186
109
176
246
314
243275
203
270
353
299
156182
419
243
199
321
201
295
211
363
440
0
200
400
600
800
1,000
1,200
1,400
0
100
200
300
400
500
600
700
Q1/1
4
Q2/1
4
Q3/1
4
Q4/1
4
Q1/1
5
Q2/1
5
Q3/1
5
Q4/1
5
Q1/1
6
Q2/1
6
Q3/1
6
Q4/1
6
Q1/1
7
Q2/1
7
Q3/1
7
Q4/1
7
Q1/1
8
Q2/1
8
Q3/1
8
Q4/1
8
Q1/1
9
Q2/1
9
Q3/1
9
Q4/1
9
Q1/2
0
Q2/2
0
Q3/2
0
Q4/2
0
Q1/2
1
Q2/2
1
Orders received (LHS) Orders received, last 4 quarters (RHS)
114108120
186
97
177185200
157165138
188
144165170
304
223237196
280
186
246214
267
217255242
362
289285
0
200
400
600
800
1,000
1,200
1,400
0
100
200
300
400
500
600
700
Q1/1
4
Q2/1
4
Q3/1
4
Q4/1
4
Q1/1
5
Q2/1
5
Q3/1
5
Q4/1
5
Q1/1
6
Q2/1
6
Q3/1
6
Q4/1
6
Q1/1
7
Q2/1
7
Q3/1
7
Q4/1
7
Q1/1
8
Q2/1
8
Q3/1
8
Q4/1
8
Q1/1
9
Q2/1
9
Q3/1
9
Q4/1
9
Q1/2
0
Q2/2
0
Q3/2
0
Q4/2
0
Q1/2
1
Q2/2
1
Net sales (LHS) Net sales, last 4 quarters (RHS)

Orders received and net sales split in 2020
August 2021 © Valmet | Roadshow presentation37
Orders received (EUR million and % of total) Net sales (EUR million and % of total)
1,35637%
3349%
93426%
1,02928%
Services
Automation
Pulp and Energy
Paper
62117%
37810%
1,42039%
88524%
34910%
North America
South America
EMEA
China
Asia-Pacific
1,32735%
3359%
1,00327%
1,07629%
Services
Automation
Pulp and Energy
Paper
67618%
59516%
1,54041%
48913%
44012%
North America
South America
EMEA
China
Asia-Pacific

Split to Pulp and Paper / Energy and Process includes internal orders received and net sales.
Business lines in 2020: Stable business
August 2021 © Valmet | Roadshow presentation38
Services business line
17%
25%
35%
13%
11%
RollsMill ImprovementsPerformance PartsFabricsEnergy and Environment
28%
9%
43%
10%
10%
North AmericaSouth AmericaEMEAChinaAsia-Pacific
Ord
ers
re
ce
ive
dN
et sa
les
17%
25%
36%
12%
10%
RollsMill ImprovementsPerformance PartsFabricsEnergy and Environment
29%
8%
44%
9%
11%
North AmericaSouth AmericaEMEAChinaAsia-Pacific
71%
29%
Pulp and Paper
Energy and Process
18%
7%
61%
6%8%
North AmericaSouth AmericaEMEAChinaAsia-Pacific
Ord
ers
re
ce
ive
dN
et sa
les
72%
28%
Pulp and Paper
Energy and Process
21%
5%
60%
7%8%
North AmericaSouth AmericaEMEAChinaAsia-Pacific
Automation business line

Business lines in 2020: Capital business
August 2021 © Valmet | Roadshow presentation39
72%
28%
Pulp
Energy
1%
24%
41%
23%
12%
North AmericaSouth AmericaEMEAChinaAsia-Pacific
Ord
ers
re
ce
ive
dN
et sa
les
66%
34%
Pulp
Energy
3%
35%
39%
9%
14%
North AmericaSouth AmericaEMEAChinaAsia-Pacific
26%
52%
21%
TissueBoardPaper
17%
1%
24%50%
7%
North AmericaSouth AmericaEMEAChinaAsia-Pacific
Ord
ers
re
ce
ive
dN
et sa
les
22%
69%
9%
Tissue
Board
Paper
18%
11%
35%
24%
12%
North AmericaSouth AmericaEMEAChinaAsia-Pacific
Pulp and Energy business line Paper business line

Areas: Orders received and net sales development
August 2021 © Valmet | Roadshow presentation40
414490
717588
686 730
880
621
19% 16%
25%19% 21% 20% 22%
17%
2013
2014
2015
2016
2017
2018
2019
2020
533
281166
235 183
480
670
37824%
9% 6% 7% 6%13%
17%10%
2013
2014
2015
2016
2017
2018
2019
2020
804
1,470
1,320
1,5941,508
1,6061,690
1,420
37%
48% 46%51%
46% 43% 42% 39%
2013
2014
2015
2016
2017
2018
2019
2020
244 244
428342
572 523
267
885
11% 8%15%
11%17% 14%
7%
24%
2013
2014
2015
2016
2017
2018
2019
2020
187
586
247381
323383
479349
9%
19%
9% 12% 10% 10% 12% 10%
2013
2014
2015
2016
2017
2018
2019
2020
422 449
615 644 603679
774676
16% 18% 21% 22% 20% 20% 22%18%
2013
2014
2015
2016
2017
2018
2019
2020
421325 335
205 247169
368
595
16% 13% 11%7% 8% 5%
10%16%
2013
2014
2015
2016
2017
2018
2019
2020
1,0961,053
1,3041,369
1,5071,5451,5661,540
42% 43% 45% 47% 49% 46% 44% 41%
2013
2014
2015
2016
2017
2018
2019
2020
392268 303
362 402535
465 489
15%11% 10% 12% 13% 16% 13% 13%
2013
2014
2015
2016
2017
2018
2019
2020
282378 372 346 299
396 375440
11%15% 13% 12% 10% 12% 11% 12%
2013
2014
2015
2016
2017
2018
2019
2020
Ord
ers
re
ce
ive
d(E
UR
mill
ion
an
d %
of to
tal)
North America
Ne
t sa
les
(EU
R m
illio
n a
nd
% o
f to
tal)
South America EMEA China Asia-Pacific
2013 figures on a carve-out basis. Automation business line figures included as of Q2/2015.

60%
10%1%
29%
Services Automation
Pulp and Energy Paper
Areas: Business line split in 2020
August 2021 © Valmet | Roadshow presentation41
Ord
ers
re
ce
ive
d
North America
Ne
t sa
les
South America EMEA China Asia-Pacific
32%
6%
58%
4%
Services Automation
Pulp and Energy Paper
41%
14%
27%
18%
Services Automation
Pulp and Energy Paper
16%
2%
24%58%
Services Automation
Pulp and Energy Paper
38%
8%33%
22%
Services Automation
Pulp and Energy Paper
56%
10%5%
29%
Services Automation
Pulp and Energy Paper
18%
3%
59%
20%
Services Automation
Pulp and Energy Paper
37%
13%
25%
24%
Services Automation
Pulp and Energy Paper
24%
4%
19%
52%
Services Automation
Pulp and Energy Paper
33%
6%
31%
30%
Services Automation
Pulp and Energy Paper

Announced orders booked in H2/2021
© Valmet | Roadshow presentation42
Booked
quarter
Date Description Business line Country Value
Q3 Jul 7 Turnkey biopower plant for the city of Salzburg Pulp and Energy Austria Not disclosed.
August 2021

Announced orders booked in H1/2021
© Valmet | Roadshow presentation43
Booked
quarter
Date Description Business line Country Value
Q1 Jan 15 Extensive tissue machine rebuild for Metsä Tissue Paper Finland Not disclosed
Q1 Jan 29 Textile recycling plant's main equipment for Renewcell Pulp and Energy Sweden Around EUR 25 million
Q1 Feb 19 All main process islands and automation for a bioproduct mill for
Metsä Fibre
Pulp and Energy Finland About EUR 350-400 million
Q1
Q1
Mar 2
Mar 25
A coated board line and a fine paper making line for Fujian
Liansheng
Tissue line for Aktül Kagit
Paper
Paper
China
Turkey
Not disclosed. An order of this scope typically adds up to around EUR 190–220 million
Not disclosed
Q1 Apr 29 Multifuel boiler plant for Veolia Energie Pulp and Energy Czech Republic Typically, the value of this kind of order is EUR 35-40 million.
Q1 May 11 Two tissue lines for Zhejiang Jingxing Paper China Not disclosed. Typically, the value of this kind of order is around EUR 20-30 million
Q1 May 12 Tissue making line for C&S Paper China Not disclosed. A project of this size and scope is typically valued at around EUR 5-10 million.
Q2
Q2
Q2
Q2
Q2
Apr 14
May 17
Jun 11
Jun 23
Jul 8
Evaporation plant for Södra Cell
Drying technology for Spinnova-Suzano joint venture
Major pulp and board technology delivery for Klabin
Two container board making lines for Zhejiang Shanying Paper
Tissue line for Hayat Kimya
Pulp and Energy
Paper
Paper, Pulp and
Energy
Paper
Paper
Sweden
Finland
Brazil
China
Russia
Not disclosed. A project of this size and scope is typically valued at around EUR 30 million
Not disclosed.
Not disclosed. The total value of order of this type and delivery scope is typically around EUR
320-360 million.
Not disclosed.
Not disclosed.
Q2
Q2
Q2
Q2
Jul 13
Jul 14
Jul 15
Jul 19
Conversion from paper machine to fluff pulp drying machine for
Daio Paper
Boiler upgrade and a flue gas cleaning system for Stora Enso
Semi-chemical pulp line for Lee & Man Paper
Tissue production line for Eczacibasi Consumer Products
Pulp and Energy
Pulp and Energy
Pulp and Energy
Paper
Japan
Finland
China
Turkey
Not disclosed.
Typically, the value of this kind of order is EUR 15-20 million.
Typically, the value of this kind of order is EUR 10-20 million.
Not disclosed.
August 2021

Announced orders booked in H2/2020
© Valmet | Roadshow presentation44
Booked
quarter
Date Description Business line Country Value
Q3 Aug 27 New bleach plant and upgrade of batch cooking
and fiberline
Pulp and Energy India Not disclosed. An order of this scope is typically around EUR 20-30 million.
Q3
Q3
Q3
Q3
Q4
Q4
Q4
Q4
Q4
Q4
Oct 14
Oct 19
Oct 21
Oct 22
Dec 14
Dec 15
Jan 18
Jan 21
Mar 2
Mar 9
Extensive paper machine grade conversion rebuild
OptiConcept M container board making line
Tissue line
Fine paper making line
Extensive paper machine grade conversion rebuild
New flash drying and baling line and CTMP rebuild
OptiConcept M container board making line
Boiler plant for district heat production
A line for chemi thermo mechanical pulp production
Key pulp technology
Paper
Paper
Paper
Paper
Paper
Pulp and Energy
Paper
Pulp and Energy
Pulp and Energy
Pulp and Energy
Turkey
China
United Kingdom
China
United States
Sweden
China
Finland
China
China
Not disclosed. An order of this scope is typically around EUR 40-50 million.
Not disclosed.
Not disclosed.
Not disclosed. An order of this scope is typically around EUR 80-100 million.
Not disclosed.
Not disclosed. An order of this scope is typically around EUR 40-50 million.
Not disclosed.
Not disclosed.
Not disclosed. An order similar to the delivery scope is typically around EUR 10-20 million.
Not disclosed. A project of this size and scope is typically valued at around EUR 100 million.
August 2021

Announced orders booked in H1/2020
© Valmet | Roadshow presentation45
Booked
quarter
Date Description Business line Country Value
Q1
Q1
Jan 23
Feb 18
Key pulp mill technology and automation (Lenzing &
Duratex)
Flue gas condensing plant
Pulp and Energy
Pulp and Energy
Brazil
Finland
Not disclosed. The value of a delivery of this size and scope is typically around EUR 200-250
million.
Not disclosed. The value of these types of orders is approximately between EUR 20–30 million.
Q1 Feb 26 Final stage of forming section rebuild Paper Sweden Not disclosed.
Q1
Q1
Feb 27
Mar 16
Waste-to-energy boiler
Coated board making line
Pulp and Energy
Paper
Sweden
China
Typically above EUR 10 million.
Not disclosed. The value of an order of this type and scope is typically around EUR 150-200
million.
Q1 Mar 24 Key containerboard machine technologies Paper India Not disclosed. The value of a project of this type and scope is typically around EUR 12-15 million.
Mar 25 Mill Maintenance Outsourcing agreement Services Australia Not disclosed.
Q1 Mar 26 Hard nip sizer Paper Rep. of Korea Not disclosed. The total value of an order of this type is typically around EUR 5-10 million.
Q1,Q2 Apr 27 Fine paper making line with an extensive scope and a
recovery boiler
Paper (Q2), Pulp and
Energy (Q1)
China Not disclosed. The total value of orders of this type and scope is typically around EUR 130-150
million.
Q1
Q1
Q1
May 7
May 12
Jun 8
Tissue line including an extensive automation package
Ash treatment system
Complete steam boiler plant
Paper
Pulp and Energy
Pulp and Energy
Turkey
Brazil
Austria
Not disclosed.
Not disclosed. The total value of an order of this type is typically around EUR 10-15 million.
The value of the order is approximately EUR 40 million.
Q2
Q2
Apr 16
Apr 24
Reel and winding technology
Biomass-fired boiler plant
Paper
Pulp and Energy
Finland
Finland
Not disclosed. The total value of an order of this type is typically around EUR 10-20 million.
The value of the order is approximately EUR 70 million.
Q2 Apr 29 Converting boiler plant into biomass combustion Pulp and Energy Poland The value of the order is approximately EUR 20 million.
Q2
Q2
Q2
Jun 10
Jun 25
Jun 29
Cooking and fiberline
Off-machine coater
Hot water plant
Pulp and Energy
Paper
Pulp and Energy
China
Brazil
Sweden
Not disclosed.
Not disclosed. The value of an order of this type is typically around EUR 25-35 million.
The value of an order of this size and delivery scope is typically above EUR 40 million.
Q2 Jul 9 Pulp production upgrade technology Pulp and Energy Indonesia Not disclosed. An order with this scope of supply is usually in the range of EUR 10-12 million.
Q2 Jul 20 Bleached chemi thermo mechanical pulp line Pulp and Energy China Not disclosed.
Q2 Jul 22 Tissue line Paper Russia Not disclosed.
August 2021

Orders received increased to EUR 1,228 million in Q2/2021
August 2021 © Valmet | Roadshow presentation46
• In stable business1, orders received increased to EUR 487 million in Q2/2021
• In capital business, orders received increased to EUR 765 million in Q2/2021
• Orders received remained at the previous year’s level in developed markets and increased in emerging markets
during Q2/2021
• South America, China and Asia-Pacific together accounted for 61% of orders received
Orders received (EUR million)
1) Including internal orders received for the Automation business line.
North America
13%
South America
16%
EMEA41%
China24%
Asia-Pacific
7%
Orders received in Q1–Q2/2021
by area
1,101
1,023
466 480580
781 725793 803
692788
8571,005
796 743 727890 865
9401,026
835
1,083
1,058
1,009
1,187
826700
940
1,312
1,228
0
500
1,000
1,500
2,000
2,500
3,000
3,500
4,000
4,500
0
200
400
600
800
1,000
1,200
1,400
1,600
1,800
Q1/1
4
Q2/1
4
Q3/1
4
Q4/1
4
Q1/1
5
Q2/1
5
Q3/1
5
Q4/1
5
Q1/1
6
Q2/1
6
Q3/1
6
Q4/1
6
Q1/1
7
Q2/1
7
Q3/1
7
Q4/1
7
Q1/1
8
Q2/1
8
Q3/1
8
Q4/1
8
Q1/1
9
Q2/1
9
Q3/1
9
Q4/1
9
Q1/2
0
Q2/2
0
Q3/2
0
Q4/2
0
Q1/2
1
Q2/2
1
Orders received (LHS) Last 4 quarters (RHS)

Stable business orders received totaled EUR 1,827 million during the last four quarters
August 2021 © Valmet | Roadshow presentation47
• Total orders received in stable business were EUR 62 million higher compared with Q2/2020
1) Including internal orders received for the Automation business line.
Orders received (EUR million) in stable business1
267 273 242 273 293 307252 267
313 321264 284
355 321 284 282346 344
300 325 358 371 335395 398
328288
342385 372
95
78 75
81 88
8087
88103
75 101
93 102
81109
103 10497
112 116
98
81
120123 116
267 273242
273293
402
330 342
394 409
344372
443 424
359383
439 445
381
435461 474
433
507 514
426
369
463508
487
0
300
600
900
1,200
1,500
1,800
2,100
0
100
200
300
400
500
600
700
Q1/14 Q2/14 Q3/14 Q4/14 Q1/15 Q2/15 Q3/15 Q4/15 Q1/16 Q2/16 Q3/16 Q4/16 Q1/17 Q2/17 Q3/17 Q4/17 Q1/18 Q2/18 Q3/18 Q4/18 Q1/19 Q2/19 Q3/19 Q4/19 Q1/20 Q2/20 Q3/20 Q4/20 Q1/21 Q2/21
Services (LHS) Automation, total (including internal) (LHS) Last 4 quarters (RHS)

Order backlog EUR 4,019 million at the end of Q2/2021
August 2021 © Valmet | Roadshow presentation48
• Order backlog was EUR 310 million higher than at the end of Q1/2021
• Approximately 45% of the order backlog is currently expected to be realized as net sales during 2021 (at the end of
Q2/2020, ~45% during 2020)
• Approximately 25% of the order backlog relates to stable business (~30% at the end of Q2/2020)
Order backlog (EUR million)
Stable business
Capital business
~75%
~25%
Structure of order backlog
1,972
2,4062,312
1,998 2,0642,208
2,117 2,0742,207
2,1062,192
2,283
2,704 2,714 2,720
2,4582,583 2,621
2,791 2,8293,001
3,216
3,4253,333
3,557 3,4923,311 3,257
3,709
4,019
0
500
1,000
1,500
2,000
2,500
3,000
3,500
4,000
4,500
Q1/1
4
Q2/1
4
Q3/1
4
Q4/1
4
Q1/1
5
Q2/1
5
Q3/1
5
Q4/1
5
Q1/1
6
Q2/1
6
Q3/1
6
Q4/1
6
Q1/1
7
Q2/1
7
Q3/1
7
Q4/1
7
Q1/1
8
Q2/1
8
Q3/1
8
Q4/1
8
Q1/1
9
Q2/1
9
Q3/1
9
Q4/1
9
Q1/2
0
Q2/2
0
Q3/2
0
Q4/2
0
Q1/2
1
Q2/2
1

Gross profit and SG&A development
August 2021 © Valmet | Roadshow presentation49
Gross profit (EUR million and % of net sales)
• Gross profit was 26% of net sales (23% in Q2/2020)
− Stable business represented 44% of net sales (43% in Q2/2020)
• Selling, general & administrative (SG&A) expenses remained at the previous year’s level
− SG&A was 16% of net sales (16% in Q2/2020)
SG&A (EUR million and % of net sales)
26%
0%
5%
10%
15%
20%
25%
30%
0
50
100
150
200
250
300
Q1/2
014
Q2/2
014
Q3/2
014
Q4/2
014
Q1/2
015
Q2/2
015
Q3/2
015
Q4/2
015
Q1/2
016
Q2/2
016
Q3/2
016
Q4/2
016
Q1/2
017
Q2/2
017
Q3/2
017
Q4/2
017
Q1/2
018
Q2/2
018
Q3/2
018
Q4/2
018
Q1/2
019
Q2/2
019
Q3/2
019
Q4/2
019
Q1/2
020
Q2/2
020
Q3/2
020
Q4/2
020
Q1/2
021
Q2/2
021
EUR million (LHS) % of net sales (RHS)
16%
0%
5%
10%
15%
20%
25%
30%
0
50
100
150
200
250
300
Q1/2
014
Q2/2
014
Q3/2
014
Q4/2
014
Q1/2
015
Q2/2
015
Q3/2
015
Q4/2
015
Q1/2
016
Q2/2
016
Q3/2
016
Q4/2
016
Q1/2
017
Q2/2
017
Q3/2
017
Q4/2
017
Q1/2
018
Q2/2
018
Q3/2
018
Q4/2
018
Q1/2
019
Q2/2
019
Q3/2
019
Q4/2
019
Q1/2
020
Q2/2
020
Q3/2
020
Q4/2
020
Q1/2
021
Q2/2
021
EUR million (LHS) % of net sales (RHS)

43 46
117
30
-20
17 1664
3 33
122
88 94
31
7889
19 3
119143
30
-44
126
182 173151
94114
148
180
-100
-50
0
50
100
150
200
Q1/2
01
4
Q2/2
01
4
Q3/2
01
4
Q4/2
01
4
Q1/2
01
5
Q2/2
01
5
Q3/2
01
5
Q4/2
01
5
Q1/2
01
6
Q2/2
01
6
Q3/2
01
6
Q4/2
01
6
Q1/2
01
7
Q2/2
01
7
Q3/2
01
7
Q4/2
01
7
Q1/2
01
8
Q2/2
01
8
Q3/2
01
8
Q4/2
01
8
Q1/2
01
9
Q2/2
01
9
Q3/2
01
9
Q4/2
01
9
Q1/2
02
0
Q2/2
02
0
Q3/2
02
0
Q4/2
02
0
Q1/2
02
1
Q2/2
02
1
Cash flow provided by operating activities and CAPEX
August 2021 © Valmet | Roadshow presentation50
• Change in net working capital1 EUR 80 million in Q2/2021
• Cash flow provided by operating activities EUR 180 million in Q2/2021
• CAPEX2 EUR 23 million in Q2/2021
Cash flow provided by operating activities (EUR million)
Valmet implemented IFRS 16 – Leases as of January 1, 2019 by applying the simplified transition method and therefore 2018 figures are not restated.
1) Change in net working capital in the consolidated statement of cash flows.
2) Excluding leased assets.
2014:
EUR 236 million
2016:
EUR 246 million
2015:
EUR 78 million
2017:
EUR 291 million
2018:
EUR 284 million
2019:
EUR 295 million
2020:
EUR 532 million
Q1–Q2/2021:
EUR 328 million

Net working capital at -18% of rolling 12 months orders received
August 2021 © Valmet | Roadshow presentation51
• Net working capital EUR -764 million, which equals -18% of rolling 12 months orders received
Net working capital1 and orders received (EUR million)
1) Net working capital excluding non-cash net working capital impact from dividend liability.
-235 -249 -345 -353 -317 -265 -244 -238 -194 -181 -265 -294 -378 -335 -370 -387 -384 -362 -427 -474 -459 -342 -421 -426-614 -644 -629 -588 -662 -764
1,1011,023
466 480580
781 725793 803
692788
8571,005
796 743 727890 865
9401,026
835
1,083 1,058 1,009
1,187
826700
940
1,3121,228
-20%
-10%
0%
10%
20%
30%
-1,000
-500
0
500
1,000
1,500
Q1/2
01
4
Q2/2
01
4
Q3/2
01
4
Q4/2
01
4
Q1/2
01
5
Q2/2
01
5
Q3/2
01
5
Q4/2
01
5
Q1/2
01
6
Q2/2
01
6
Q3/2
01
6
Q4/2
01
6
Q1/2
01
7
Q2/2
01
7
Q3/2
01
7
Q4/2
01
7
Q1/2
01
8
Q2/2
01
8
Q3/2
01
8
Q4/2
01
8
Q1/2
01
9
Q2/2
01
9
Q3/2
01
9
Q4/2
01
9
Q1/2
02
0
Q2/2
02
0
Q3/2
02
0
Q4/2
02
0
Q1/2
02
1
Q2/2
02
1
Net working capital (LHS) Orders received (LHS)
Average net working capital/rolling 12 months orders received (RHS) Net working capital/rolling 12 months orders received (RHS)

985 967902 877
1,239 1,240 1,214 1,2311,184 1,194 1,167 1,195
1,112 1,138 1,141 1,137
1,0331,049 1,079
1,150
1,2371,195
1,2391,314
1,2561,327
1,541
1,639
1,5571,619
1%2% 2%
10% 10%
12%
14% 14%13%
12%
14%13%
14%13%
14%
16% 16%17%
18%
20%
22%
23%24%
23% 23% 23%
22%22%
25% 25%
Q1/14Q2/14Q3/14 Q4/14Q1/15Q2/15Q3/15Q4/15Q1/16Q2/16Q3/16Q4/16Q1/17Q2/17Q3/17Q4/17Q1/18Q2/18Q3/18 Q4/18Q1/19Q2/19Q3/19Q4/19Q1/20Q2/20Q3/20Q4/20Q1/21Q2/21
Capital employed Comparable ROCE (before taxes), rolling 12 months
Capital employed and Comparable ROCE
August 2021 © Valmet | Roadshow presentation52
Capital employed (EUR million) and Comparable return on capital employed (ROCE), before taxes1 (%)
Valmet implemented IFRS 16 – Leases as of January 1, 2019 by applying the simplified transition method, and IFRS 15 – Revenue from Contracts with Customers as of January 1, 2018 by applying full retrospective method.
Thus, figures presented are not fully comparable.
1) Rolling 12 months. Carve-out figures for 2013 have been used in the calculation of Q1–Q3/2014 figures.

August 2021 © Valmet | Roadshow presentation53
Dividend and balance sheetDividend payout at least 50% of net profit
Track record
Dividend per share (EUR) and payout ratio (%)
Balance sheet and cash flow
-166
178
52
-100
-219
-90
149
-1.1
0.8
0.2 -0.4
-0.8
-0.2
0.4
-2.5
-2
-1.5
-1
-0.5
0
0.5
1
1.5
2
-250
-200
-150
-100
-50
0
50
100
150
200
2014 2015 2016 2017 2018 2019 2020
Net debt Net debt / EBITDA
0.15
0.25
0.350.42
0.55
0.65
0.80
0.9081%
68%
76%
68%64%
59% 58%
2013 2014 2015 2016 2017 2018 2019 2020
Target
>50%of net
profit
Cash flow provided by operating activities
Net working capital
Net debt (EUR million)
Net debt / EBITDA ratio
23678
246 291 284 295
532
-353-238 -294
-387-474 -426
-588
-800
-600
-400
-200
0
200
400
600
2014 2015 2016 2017 2018 2019 2020
Cash flow Net working capital

Orders received and profitability development, annual
August 2021 © Valmet | Roadshow presentation54
Orders received (EUR million)1 Net sales and Comparable EBITA (EUR million)1
1) Carve-out figures for 2010-2013; as reported for Metso’s Pulp, Paper and Power segment for 2006-2009. Automation has been consolidated into Valmet’s financials since April 1, 2015, when the acquisition of Automation was completed.
637999 1,1451,0551,0351,055
1,3411,4811,5581,6451,8181,691
1,362
1,585
2,080
1,3901,147
2,0161,5371,6581,713
2,0772,168
1,962
1,999
2,584
3,225
2,4452,182
3,0712,878
3,1393,272
3,7223,986
3,653
2009 2010 2011 2012 2013 2014 2015 2016 2017 2018 2019 2020
Pulp and Energy, and Paper business lines
Services and Automation business lines
715877 974 1,011 1,032 989
1,357 1,453 1,474 1,5251,715 1,661
1,3461,576 1,729 2,003 1,581 1,484
1,572 1,473 1,584 1,7991,832 2,079
2,061
2,4532,703
3,014
2,6132,473
2,928 2,9263,058
3,3253,547
3,740
5.6%
6.5%
7.6%6.4%
2.1%
4.3%
6.2% 6.7% 7.1% 7.7%8.9%
9.8%
2009 2010 2011 2012 2013 2014 2015 2016 2017 2018 2019 2020
Pulp andEnergy, andPaper businesslines
Services andAutomationbusiness lines
ComparableEBITA-%
316 365116 159 205 192 54 106 182 196 218 257Comparable EBITA
(EUR million)

Appendix
Growth and profitability improvement

August 2021 © Valmet | Roadshow presentation56 LTIF = Lost time incident frequency rate
Recent development at Valmet
Customer
Valmet acquired
PMP Group
Valmet’s way to serve
concept launched for
globally-unified services
approach
Stronger utilization of
Valmet’s local presence
in areas in sales and
projects
Technology
Collaboration project with
Metsä Spring to produce
fossil free 3D fiber
products
Valmet DNA User
Interface received well:
dozens of projects sold
and delivered with new
technology
Wider utilization of
Industrial Internet
applications and remote
connections
Process
Good development in
project management
Capacity cost reductions
Remote commissioning
and start-up of new
tissue and board
machine installations
ERP renewal
proceeding
People
Staying safe, operational
and efficient during
challenging times in 2020
Record-low LTIF for own
employees (1.4) reached
in Q2/2021
Several internal training
programs established and
continuing

August 2021 © Valmet | Roadshow presentation57
Actions to keep growing faster than the marketNet sales growth
Stable business
• Win new customers and increase share of
wallet with existing customers
• Grow service sales and multi-year service
agreements with project sales
• Add customer value with on-site and
remote services
• Continue to develop Field services as a
differentiator
• Competitor replacements in Automation
• Grow through new industries in Automation
• Leverage the new Valmet DNA User
Interface to win new business in Automation
Capital business
• Benefit from strong favorable megatrends in
Board, Tissue, Pulp and Energy
• Continue to bring advanced
technology to the market
• Leverage strong R&D for new product
innovations
• Continued focus on product cost
competitiveness
• Create customer value with digitalization
and Industrial Internet

August 2021 © Valmet | Roadshow presentation58 Including internal net sales for the Automation business line.
Actions to reach Comparable EBITA target of 10–12%Comparable EBITA: 10–12%
Track record
Stable business net sales (EUR million)
Comparable EBITA margin (%)
Actions to reach Comparable EBITA target:
• Grow the stable business
• Focus on improving project management
and execution
• Positive margin deviation in capital projects
• Continue to identify savings opportunities in
procurement through design-to-cost and
supplier relationship management
• Increase flexibility in operations through
global footprint development
• R&D and new product launches
• Internal efficiencies through digitalization
• ERP project (from 2023 onwards)
1,032989
1,3801,479 1,514
1,577
1,767 1,728
2.1%
4.3%
6.2%6.7%
7.1%
7.7%
8.9%
9.8%
2013 2014 2015 2016 2017 2018 2019 2020
Target
10–12%

August 2021 © Valmet | Roadshow presentation59
Actions to maintain ROCE at target levelComparable return on capital employed (pre-tax): >20%
Track record
Capital employed (EUR million)
Comparable ROCE (%, before taxes)
Main drivers for ROCE:
• Improvement in Comparable EBITA is
the biggest driver for ROCE
• Capital employed has increased due
to acquisitions
ROCE at target level in 2020
• Valmet’s ROCE of 22% is clearly
higher than 2020 peer average of 11%
• Strong balance sheet needed for big
projects and swings in market activity
809 860 886 918 949 1,046 1,142
68
371 310219 201
268
497
10%
14%13%
16% 20%23%
22%
877
1,231 1,1951,137 1,150
1,314
1,639
2014 2015 2016 2017 2018 2019 2020
Equity Interest-bearing liabilities ROCE
Target
>20%

August 2021 © Valmet | Roadshow presentation60
Systematically building the futureContinuous renewal and improvement of operational capability
ERP renewal
• ERP renewal was started in 2016 and
will be completed in 2023
• Project proceeding well
• Benefits are based on digitalization,
process efficiency and IT platform
simplification
• Enabler for several other platform
renewals
• Savings expected from 2023 onwards
Operational development
• Procurement transformation towards
world-class performance continues
• Adding focus on global processes to
decrease quality costs
• IT continues modernizing the core platforms
to drive business transformation and to
accelerate digitalization
• Continue the work on project management
culture and effective processes & practices
• New project portfolio management tool for
R&D implemented Valmet wide

Implemented procurement savings of annual direct spend
Procurement and quality cost development
© Valmet | Roadshow presentation61
Targeting >3% of procurement savings annually
• Increasing design-to-cost (DTC) to create new sources for savings
• More supplier involvement through supplier relationship
management
• Continuing sustainable supply chain implementation
Long-term quality costs goal <1.3% of net sales
• Adding focus on global processes and Global Management System
• Focused quality development projects related to supplier quality,
quality assurance and quality control, continuous improvement, audit
and risk management
3.8%4.3% 4.4% 4.3%
3.9% 3.7%2.9%
3.8%3.0%
2013 2014 2015 2016 2017 2018 2019 2020 Annualgoal
August 2021
Quality costs (% of net sales)
3.6%3.1%
2.6%
4.0%
2.8%2.4% 2.2% 2.2%
1.3%
2013 2014 2015 2016 2017 2018 2019 2020 Long-term goal
<

Track record of successful acquisitions
August 2021 © Valmet | Roadshow presentation62
Acquisitions
2015
Automation
2019
GL&V
2019
J&L Fiber
Services
2020
PMP Group
2015
Tissue rewinder
business
2018
Enertechnix
2020
29.5% share
in Neles
• Valmet’s acquisition strategy is to make
selective acquisitions with a clear industrial
logic to support organic growth
‒ Focus on strengthening services and
automation and expanding business in the
pulp, paper and energy value chain
• Approximately 50 cases evaluated annually
• Seven acquisitions made since becoming
independent company in 2014
• Total investment in acquisitions about
EUR 1 billion

Focus on small and medium-sized tissue machines and board and paper machine rebuilds
Valmet strengthened its business by acquiring PMP Group
August 2021 © Valmet | Roadshow presentation63
• PMP Group supplies process technologies and services for tissue,
board and paper machines globally- New tissue machines
- Rebuilds and machine sections for paper and board machines
- Spare parts and services
• Focus on small and medium-sized tissue machines and board and
paper machine rebuilds
• The acquisition complements Valmet’s offering and builds further our
local presence especially in Central Europe and China
• Widens Valmet’s portfolio to small and medium-sized tissue machines
• Access to new customer and product segments
• Operations in four countries: Poland, China, USA and Italy
• The acquisition was announced on September 11, 2020 and was
completed on October 1, 2020
Operations in Poland, China, USA and Italy
Key information about the acquisition
Net sales in 2019 EUR ~70 million
Number of employees ~650
Value of acquisition EUR ~64 million1
1) plus a conditional and capped earn-out component

Valmet completed the acquisitions of GL&V and J&L Fiber Services in Q2/2019
Valmet strengthened its stable business through acquisitions
August 2021 © Valmet | Roadshow presentation64
• GL&V is a supplier of technologies, upgrade and process
optimization services, rebuilds and spare parts for the pulp
and paper industry globally
- Focus in chemical pulping, stock preparation, papermaking and
finishing
- Key locations in the US and Canada, operations also in Europe,
India and South America
• Majority of the business is reported in the Services business
line
Approximate split of net salesKey information
Net sales in 2018 EUR ~160 million
EBITA margin in 2018 ~11%
Number of employees ~630
Value of acquisition1 EUR ~113 million
1) Value on a cash and debt free basis subject to ordinary post-closing adjustments
71%
21%
4%3%1%
North America
EMEA
Asia-Pacific
South America
China
• J&L Fiber Services is a manufacturer and provider of refiner
segments to the pulp, paper and fiberboard industry
- Most of the employees are located in Wisconsin, U.S, with global
operations through a sales representative and distribution network.
• The acquired business became a part of Valmet's Services
business line
Approximate split of net salesKey information
Net sales in 2018 EUR ~30 million
EBITA margin in 2018 ~15%
Number of employees ~100
Value of acquisition1 EUR ~51 million77%
8%
8%4% 3%
North America
EMEA
Asia-Pacific
South America
China
1) Value on a cash and debt free basis subject to ordinary post-closing adjustments

Appendix
Shareholders and share price development

Based on indicative data collected by Modular Finance
Largest shareholders on July 31, 2021
August 2021 © Valmet | Roadshow presentation66
Date of transaction Shareholder Number of shares % of shares and votes
Aug 9, 2019 The Goldman Sachs Group, Inc. 7,523,217 5.02%
Aug 12, 2019 The Goldman Sachs Group, Inc 7,275,810 4.85%
Aug 28, 2019 BlackRock, Inc. Below 5% Below 5%
Aug 29, 2019 BlackRock, Inc. 7,740,836 5.16%
Aug 30, 2019 BlackRock, Inc. Below 5% Below 5%
Solidium is a holding company that is wholly owned by the Finnish State
Five latest flagging notifications
# Shareholder name Number of shares % of shares and votes
1 Solidium Oy 16,695,287 11.1 %
2 Handelsbanken Funds 4,623,353 3.1 %
3 Vanguard 4,357,115 2.9 %
4 Swedbank Robur Funds 4,126,811 2.8 %
5 Ilmarinen Mutual Pension Insurance Company 4,110,000 2.7 %
6 Norges Bank 3,913,666 2.6 %
7 BlackRock 3,415,737 2.3 %
8 ODDO BHF Asset Management 2,504,716 1.7 %
9 SEB Funds 2,488,536 1.7 %
10 Elo Mutual Pension Insurance Company 2,386,044 1.6 %
10 largest shareholders, total 48,621,265 32.4%
Other shareholders 101,243,354 67.6%
Total 149,864,619 100.0%

Based on Euroclear data. The classification of sectors determined by Statistics Finland.
Shareholder structure on July 31, 2021
© Valmet | Roadshow presentation67
* Solidium is a holding company that is wholly owned by the Finnish State
Sector Number of shareholders % of total shareholders Number of shares % of shares
Nominee registered and non-Finnish holders 391 0.67 83,267,880 55.56
Finnish institutions, companies and foundations 2,932 5.00 29,234,840 19.51
Solidium Oy* 0 0.00 16,695,287 11.14
Finnish private investors 55,321 94.33 20,658,632 13.78
On issuer account 0 0.00 7,980 0.01
Total 58,644 100.00 149,864,619 100.00
August 2021

Share of non-Finnish holders and number of shareholdersValmet has 58,644 shareholders and 55.6% of the shares are held by investors outside Finland
© Valmet | IR Monthly, June 202168
46%
47%
48%
49%
50%
51%
52%
53%
54%
55%
56%
57%
58%
40,000
42,000
44,000
46,000
48,000
50,000
52,000
54,000
56,000
58,000
60,000
12/2
01
3
03/2
01
4
06/2
01
4
09/2
01
4
12/2
01
4
03/2
01
5
06/2
01
5
09/2
01
5
12/2
01
5
03/2
01
6
06/2
01
6
09/2
01
6
12/2
01
6
03/2
01
7
06/2
01
7
09/2
01
7
12/2
01
7
03/2
01
8
06/2
01
8
09/2
01
8
12/2
01
8
03/2
01
9
06/2
01
9
09/2
01
9
12/2
01
9
03/2
02
0
06/2
02
0
09/2
02
0
12/2
02
0
03/2
02
1
06/2
02
1
Total number of shareholders (LHS) Non-Finnish holders (RHS)

Appendix
Strategy and offering

Valmet’s way forward
August 2021 © Valmet | Roadshow presentation70
Our Strategy
Valmet develops and supplies
competitive process technology,
services and automation to the
pulp, paper and energy industries.
We are committed to moving our
customers’ performance forward
with our unique offering and way
to serve.
Our Must-Wins
Customer excellence
Leader in technology and
innovation
Excellence in processes
Winning team
Growth accelerators
Field services
Industrial Internet and
digitalization
Our Vision
To become the global champion
in serving our customers
Our Mission
Converting renewable resources
into sustainable results
Our Values
Customers
We move our customers’ performance
forward
Renewal
We promote new ideas
to create the future
Excellence
We improve every day
to deliver results
People
We work together
to make a difference
• Resource efficient and clean world
• Digitalization and new technologies
• Urban, responsible and global consumer
Megatrends

August 2021 © Valmet | Roadshow presentation71
Services business units
Performance PartsRolls and Workshop Services
FabricsBoard, Paper and Tissue Solutions
Pulp and Energy
Solutions
Spare parts and
consumables
Rolls, roll covers and
maintenance, workshop
services
Paper machine clothing
and filter fabricsImprovement Projects,
Field Services, Life
Cycle Agreements,
Outsourcing
Improvement Projects, Field
Services, Life Cycle
Agreements, Outsourcing

Our way to serve - Right combination of services for every stage in the lifecycle
August 2021 © Valmet | Roadshow presentation
Spare and process parts
Workshop and roll services
Fabrics Maintenance
development & outsourcing
Field services Process
upgrades
Industrial Internet solutions
Setting foundation for optimized operational costs
Planning
Start-up curve acceleration
Start-up
Maximized reliability and optimized performance
Operation phase
Service products Service agreements Projects
Lifecycle approach
Continuous collaboration
over the lifecycle for key
benefits.
Our services offering
Delivery models
Core commitments Safety comes first Close to you People you can trust Solutions to your needs
72

August 2021 © Valmet | Roadshow presentation73
Automation business line offeringDelivered as products and technology, projects and service agreements
• Highly integrated
automation system
for process control
and condition
monitoring.
Distributed control systems
Quality management
Analyzers and measurements
Industrial Internet solutions
Automation services
• Quality control
system, quality
management
applications.
• For measuring and
optimizing different
variables in
industrial
processes.
• Advanced controls and
data-driven applications
for assisted decision
making and mill-wide
optimization.
• Remote expert support
from Valmet
Performance Center.
• Valmet Customer portal
for relevant information
and collaboration.
• Services for high
availability,
intelligent
maintenance,
process
performance and
risk control.

Future-proof automation solutions and services
© Valmet | Roadshow presentation
Value-adding automation solutions to maximize
competitiveness
Planning
Fast and reliable start-up by dedicated experts
Delivery and Start-up
Continuous optimization and care to increase productivity
Operation phase
Automation products and technology Automation projects Service agreements
Lifecycle approach
Our automation
offering
Delivery models
Core commitments Safety comes first Close to you People you can trust Solutions to your needs
Distributed control systems
Industrial applications
Quality management
Analyzers and measurements
Industrial Internet solutions
Automation services
Guaranteed automation
technology support and
upgrade paths for your
evolving needs
74 August 2021

Automation business line offering and market overview
© Valmet | Roadshow presentation75
• DCS for process and plant controls
• Condition monitoring
• Information management
• APC (advanced process control)
• Industrial Internet applications
• Paper analyzers
• Pulp analyzers
• Pulp consistency measurements
• Conductivity measurements
• Power analyzers
• QCS (Quality Control Systems)
• Profilers
• Web inspection and web break
analysis systems
Scope/product
Pulp and paper DCS market:• EUR 900 million
Power DCS market:
• EUR 700 million
Estimated market size:
• <EUR 200 million
Estimated market size:
• >EUR 200 million
Market size
• ABB
• Honeywell
• Emerson
• Siemens
• Yokogawa
• ABB
• BTG
• ABB• Honeywell• Voith• Paperchine• Procemex
Main competitors
Distributed
Control
System (DCS)
#3
Quality
Management
System#1-2
Analyzers and
measurements
#1
Pulp and paper
Oil and gas
Marine
Energy
Distributed Control System (DCS) – Valmet DNA
Performance solutions
Quality Control System (QCS)
Profilers
Analyzers and measurements
Industrial internet solutions
Automation services
Process simulators
Safety systems and solutions
Advanced automation and process monitoring solutions and services:Over 4,500
automation systems
and over 40,000analyzers and
measurements
delivered
August 2021
• Cognex• Isra Vision

August 2021 © Valmet | Roadshow presentation76
Pulp and Energy business line offeringLeading global technology supplier
Pulp
• Chemical pulp mill
Woodhandling
Cooking and fiberline
Pulp drying and baling
Chemical recovery
• Mechanical pulping
• Fiberboard defibrator systems
• Industrial Internet and remote
support
Biomass conversion
• Pretreatment for bioethanol
production
• Black pellets
• Lignin extraction
Energy
Technology for biomass and municipal
and industrial residual waste
• Fluidized bed boilers
• Modular power plants
• Gasification
• Pyrolysis process
• Industrial Internet and remote
support
Emission control
• Power plant flue gas cleaning
• Flue gas heat recovery
• NOx control
• Marine scrubbers
Pulp Energy

August 202177
Paper business line offering
Board and paper production lines
– Technologies for all board and paper grades
– Technologies for all size of machinery
– Tailor-made board and paper machines
– Modularized board and paper machines
Tissue production lines
– Technologies for all tissue grades and products
– Technologies for all size of machinery
– Conventional, textured and structured tissue
production
Stock preparation and recycled fiber
• Stock preparation lines
– Recycled fiber lines
– Stock preparation systems
– Approach flow systems
– Broke collection and handling
TissueBoard and paper
• Rebuilds
– Modernization and upgrades for
performance improvements
Rebuilds
– Modernizations and grade conversions
Stand-alone products– E.g., headboxes, sizers, winders
Rebuilds
– Upgrades for energy, product quality, safety
and efficiency improvements
Stand-alone products– E.g., headboxes, Yankee cylinders,
rewinders
• Stand-alone products – E.g., refiners, screens, pulpers
© Valmet | Roadshow presentation

Full scope offering for the pulp and paper industry
© Valmet | Roadshow presentation78
1
6
7
2
8
3
4
9
5
10
1 Wood handling
2 Heat and power
production
3 Chemical pulping
4 Chemical recovery
5 Pulp drying
6 Recycled fiber
7 Mechanical fiber
8 Stock preparation
9 Board and
paper making
10 Tissue making
Automation
• Distributed Control System
(DCS)
• Performance solutions
• Quality Control System (QCS)
• Profilers
• Analyzers and measurements
• Industrial internet solutions
• Automation services
• Process simulators
• Safety systems and solutions
Services
• Mill and plant improvements
• Spare and wear parts
• Paper machine clothing
and filter fabrics
• Roll services
• Services for evaporation
plants, power and recovery
boilers
• Services for environmental
equipment
Technologies
August 2021

Our offering for energy industry and biotechnologies
© Valmet | Roadshow presentation79
Automation
• Distributed Control System
(DCS)
• Performance solutions
• Analyzers and
measurements
• Industrial internet solutions
• Automation services
Services
• Plant improvements
• Rebuilds
• Performance services
• Services for environmental
equipment
• Components and spare parts
• Training
1
2
3
46
5
1 Fuel handling
2 Gasification
3 Boiler and flue
gas cleaning
4 Bio-oil production
5 Modularized
power plants
6 Prehydrolysis
For biofuels,
biomaterials and
biochemicals, and
bio coal production
Technologies
August 2021

Continuous investment in research and development to improve customers’ processes
© Valmet | Roadshow presentation80
Customers’ needs
• Increase production
efficiency
• Improve competitiveness
• Maximize value of raw
materials
• Widen raw material base
• Provide high-value end
products
• Develop new innovations
and technologies
Valmet’s R&D focus
• Modularized and
standardized products
• Energy, water and raw
material efficiency
• Automation technology
• Biomass conversion
technologies
Valmet’s R&D resources
• Own R&D centers and
pilot facilities
• Annual R&D spend EUR
75 million (2020)
• Around 1,300 protected
inventions
• Cooperation with
universities and research
institutions
August 2021
Example of our R&D work –
OptiConcept M board and paper
machine
• Cost-efficient, high-quality, safe and
flexible board making concept
• Significant savings in energy, water and
raw material use
– Energy efficiency improvement up to 30%
• Modular and compact size
– Short delivery times, quick start-ups, and
less production space
• Functional design brings increased safety
and accessibility

August 2021 © Valmet | Roadshow presentation81
Growth accelerator: Valmet Industrial Internet - VIIDialogue with data to move our customers performance forward
Valmet Performance Center delivering remote supportRecent development
VII solutions launched for all customer segments
Development of Mill Wide Optimization application
Asset Performance Manager for installed base
monitoring and fleet management
Next steps and development actions
• Augment competence of people in control room
through VII applications and Valmet DNA user
interface
• Move towards more autonomous mills leveraging
automation and process technology
380Advanced
Process
Controls
800Remote
connections
80Customers
connected
to Valmet
cloud
1,500Remote
support
cases solved
in 2020

Typical dimensions of pulp mills, and paper, board and tissue machines
© Valmet | Roadshow presentation82
• Mill site area:
500,000 – 5,000,000 m2, equivalent to ~70–700 football fields
• Built area:
40,000 – 100,000 m2, equivalent to ~6–14 football fields
Paper and board machine
Tissue machine Length 40 m,
equivalent to a line of ~9 cars
Pulp mill Length 140 m,
equivalent to a line of ~30 cars
Width 7 m
Width 5.6 mAugust 2021
Speed: 72 km/h
Production: 400,000 t/a
Speed: 120 km/h
Production: 65,000 t/a

Appendix
Management and remuneration

Board of Directors
© Valmet | Roadshow presentation84
• M.Sc. (Tech.)
• Selected experience:
- CoB of Normet Group Oy
- Vice-Chairman of the BoD of Solidium Oy
• Share ownership: 7,407
• Independent of company: Yes
• Independent of owners: No
Aaro Cantell
(b. 1964)
Vice-Chairman of
the Board
Finnish citizen
• M.Sc. (Eng.)
• Selected experience:
- Member of the BoD of Finnlines Oyj
- President, Marine at Rolls-Royce Plc
• Share ownership: 4,990
• Independent of company: Yes
• Independent of owners: Yes
Mikael Mäkinen(b. 1956)
Chairman of
the Board
Finnish citizen
• LL.M.
• Selected experience:
- CoB of Mandatum Life Investment
Services Ltd
- SVP, Corporates and Private Wealth
Management at Mandatum Life
• Share ownership: 6,509
• Independent of company: Yes
• Independent of owners: Yes
Tarja Tyni(b. 1964)
Board member
Finnish citizen
• B.Sc. in Business Management, MBA
• Selected experience:
- Member of the BoD of Innovatech
Negócios Florestais
• Share ownership: 10, 696
• Independent of company: Yes
• Independent of owners: Yes
Rogério Ziviani(b. 1956)
Board member
Brazilian citizen
• M.Sc. (Econ.)
• Selected experience:
- CFO of F-Secure Corporation
- Member of the BoD of Bekaert
• Share ownership: 4,713
• Independent of company: Yes
• Independent of owners: Yes
Eriikka Söderström
(b. 1968)
Board member
Finnish citizen
• Diploma in Physics and Chemistry,
Diploma in Pedagogy
• Selected experience:
- Vice Chairman of the BoD of Nokia
Shanghai Bell, Co. Ltd.
- CEO of Radio Frequency Systems
• Share ownership: 3,583
• Independent of company: Yes
• Independent of owners: Yes
Monika Maurer
(b. 1956)
Board member
German citizen
• Lic.Sc. (Tech.)
• Selected experience:
- Member of the BoD of Bittium Oyj,
Junttan Oy, Nestor Cables Oy
- Several positions within KONE
• Share ownership: 3,583
• Independent of company: Yes
• Independent of owners: Yes
Pekka Kemppainen
(b. 1954)
Board member
Finnish citizen
August 2021 Board of Directors’ ownership in total 41,481 shares, which equals to 0.03% of outstanding shares
• M.Sc. Mechanical Engineering
• PhD, Industrial Management and Economics
• Selected experience:
- Senior Advisor at Peymar Holding AB
- Chairman of the BoD of Premium Svensk
Lax AB and Permascand AB
• Share ownership: -
• Independent of company: Yes
• Independent of owners: Yes
Per Lindberg(b. 1959)
Board member
Swedish citizen

Executive Team
© Valmet | Roadshow presentation85
Business lines
Corporate
Pasi LainePresident and CEO
Share ownership: 157,581
Kari SaarinenCFO
Share ownership: 47,655
Julia MachareySVP, Human Resources and
Operational Development
Share ownership: 32,709
Aki NiemiBusiness Line President,
Services
Share ownership: 57,754
Bertel KarlstedtBusiness Line President,
Pulp and Energy
Share ownership: 37,825
Jari VähäpesolaBusiness Line President,
Paper
Share ownership: 55,305
Jukka TiitinenArea President,
North America
Share ownership: 87,704
Celso TaclaArea President,
South America
Share ownership: 85,784
Vesa SimolaArea President,
EMEA
Share ownership: 46,755
Xiangdong ZhuArea President,
China
Share ownership: 24,606
Petri PaukkunenArea President,
Asia Pacific
Share ownership: 3,431
Sami RiekkolaBusiness Line President,
Automation
Share ownership: 11,624
Business areas
Anu Salonsaari-PostiSVP, Marketing, Communications,
Sustainability and Corporate Relations
Share ownership: 27,053
August 2021Executive Team’s ownership in total: 675,786 shares, which equals to 0.45% of outstanding shares.

Remuneration of the President and CEO
The remuneration of the President and CEO is
comprised of
– the total salary (monthly base salary and customary fringe
benefits*),
– short-term and long-term incentives, and
– pension benefits and customary insurances.
The total annual base salary and customary fringe
benefits* of the President and CEO in 2020 was
EUR 680,104
The relative proportion of the variable pay
elements at maximum level is 2–3 times the fixed
pay
Additional pension benefit in the form of a defined
contribution pension plan, 20% of base salary
2021 2021–2023
Incentive based on Comparable EBITA as % of
net sales, and orders received
growth in the stable business
(Services and Automation
business lines)
Predefined strategic
targets for a three-year
performance period
Reward payment In spring 2022 In spring 2024
Restriction period 2 years
August 2021 © Valmet | Roadshow presentation86
Performance share plan
* Such as a car and a mobile phone, according to the local legislation and market practice.

Remuneration of the Executive Team
The remuneration of the Executive Team members
comprises
– a monthly total salary (including monthly salary and
customary fringe benefits1),
– a supplementary pension plan, and
– short-term and long-term incentives
Additional pension benefit in the form of a defined
contribution pension plan equaling
15–20% of base salary depending on role
Notice period is six months for both parties. If the
company terminates the agreement, there is an
additional severance pay equaling six times the
last total monthly salary
August 2021 © Valmet | Roadshow presentation87
1 Such as a car and a mobile phone.2 Calculated in the beginning of the performance period.
Performance share plan
2021 2021–2023
Incentive based on Comparable EBITA as % of
net sales, and orders received
growth in the stable business
(Services and Automation
business lines)
Predefined strategic
targets for a three-year
performance period
Reward payment In spring 2022 In spring 2024
Restriction period 2 years
