valuation the big picture - new york university stern …adamodar/pdfiles/country/brazilju… ·...
TRANSCRIPT

Aswath Damodaran 1
ValuationThe Big Picture
Aswath Damodaranhttp://www.damodaran.com

Aswath Damodaran 2
Valuing a Firm
The value of the firm is obtained by discounting expected cashflowsto the firm, i.e., the residual cashflows after meeting all operatingexpenses and taxes, but prior to debt payments, at the weightedaverage cost of capital, which is the cost of the different componentsof financing used by the firm, weighted by their market valueproportions.
where,CF to Firmt = Expected Cashflow to Firm in period tWACC = Weighted Average Cost of Capital
Value of Firm = CF to Firmt
(1+ WACC)t
t =1
t= n
!

Aswath Damodaran 3
Cashflow to FirmEBIT (1-t)- (Cap Ex - Depr)- Change in WC= FCFF
Expected GrowthReinvestment Rate* Return on Capital
FCFF1 FCFF2 FCFF3 FCFF4 FCFF5
Forever
Firm is in stable growth:Grows at constant rateforever
Terminal Value= FCFF n+1/(r-gn)
FCFFn.........
Cost of Equity Cost of Debt(Riskfree Rate+ Default Spread) (1-t)
WeightsBased on Market Value
Discount at WACC= Cost of Equity (Equity/(Debt + Equity)) + Cost of Debt (Debt/(Debt+ Equity))
Value of Operating Assets+ Cash & Non-op Assets= Value of Firm- Value of Debt= Value of Equity
Riskfree Rate :- No default risk- No reinvestment risk- In same currency andin same terms (real or nominal as cash flows
+Beta- Measures market risk X
Risk Premium- Premium for averagerisk investment
Type of Business
Operating Leverage
FinancialLeverage
Base EquityPremium
Country RiskPremium
DISCOUNTED CASHFLOW VALUATION

Aswath Damodaran 4
Current Cashflow to FirmEBIT(1-t) : $ 404- Nt CpX 23 - Chg WC 9= FCFF $ 372Reinvestment Rate = 32/404= 7.9%
Expected Growth in EBIT (1-t).2185*.2508=.05485.48%
Stable Growthg = 4.17%; Beta = 1.00;Country Premium= 5%Cost of capital = 8.76% ROC= 8.76%; Tax rate=34%Reinvestment Rate=g/ROC
=4.17/8.76= 47.62%
Terminal Value5= 288/(.0876-.0417) = 6272
Cost of Equity10.52%
Cost of Debt(4.17%+1%+4%)(1-.34)= 6.05%
WeightsE = 84% D = 16%
Discount at $ Cost of Capital (WACC) = 10.52% (.84) + 6.05% (0.16) = 9.81%
Op. Assets $ 5,272+ Cash: 795- Debt 717- Minor. Int. 12=Equity 5,349-Options 28Value/Share $7.47
R$ 21.75
Riskfree Rate:$ Riskfree Rate= 4.17%
+Beta 1.07 X
Mature market premium 4 %
Unlevered Beta for Sectors: 0.95
Firm’s D/ERatio: 19%
Embraer: Status Quo ($) Reinvestment Rate 25.08%
Return on Capital21.85%
Term Yr 549 - 261= 288
Avg Reinvestment rate = 25.08%
Year 1 2 3 4 5EBIT(1-t) 426 449 474 500 527 - Reinvestment 107 113 119 126 132 = FCFF 319 336 355 374 395
+ Lambda0.27
XCountry Equity RiskPremium7.67%
Country Default Spread6.01%
X
Rel Equity Mkt Vol
1.28
On October 6, 2003Embraer Price = R$15.51
$ Cashflows

Aswath Damodaran 5
Current Cashflow to FirmEBIT(1-t) : 504- Nt CpX 146 - Chg WC 124= FCFF $ 233Reinvestment Rate = 270/504= 53.7%
Expected Growth in EBIT (1-t).537*.1624=.08728.72%
Stable Growthg = 4.70%; Beta = 1.00;Country Premium= 5%Cost of capital = 9.94% ROC= 9.94%; Tax rate=34%Reinvestment Rate=g/ROC
=4.70/9.94= 47.31%
Terminal Value5= 641/(.0994-.047) = 12,249
Cost of Equity11.41%
Cost of Debt(4.70%+2%+4%)(1-.34)= 7.06%
WeightsE = 84% D = 16%
Discount at $ Cost of Capital (WACC) = 11.41% (.84) + 7.06% (0.16) = 10.70%
Op. Assets $ 6546+ Cash: 743- Debt 1848- Minor. Int. 137=Equity 5304-Options 0Value/Sh $137.62
R$ 433/sh
Riskfree Rate:$ Riskfree Rate= 4.70%
+Beta 0.87 X
Mature market premium 4 %
Unlevered Beta for Sectors: 0.77
Firm’s D/ERatio: 19.4%
Ambev: Status Quo ($) Reinvestment Rate 53.7%
Return on Capital16.24%
Term Yr 1217 - 576= 641
+ Lambda0.41
XCountry Equity RiskPremium7.87%
Country Default Spread6.50%
X
Rel Equity Mkt Vol
1.21
On May 24, 2004Ambev Common = R$1140Ambev Pref = 500
$ Cashflows
Year 1 2 3 4 5 6 7 8 9 10EBIT (1-t) $548 $595 $647 $704 $765 $832 $904 $983 $1069 $1162 - Reinvestment $294 $320 $348 $378 $411 $447 $486 $528 $574 $624 FCFF $253 $276 $300 $326 $354 $385 $419 $455 $495 $538
Aswath Damodaran 6
I. The Cost of Capital
Aswath Damodaran 7
The Cost of Capital is central to both corporatefinance and valuation
In corporate finance, the cost of capital is important because• It operates as the hurdle rate when considering new investments• It is the metric that allows firms to choose their optimal capital structure
In valuation, it is the discount rate that we use to value the operatingassets of the firm.

Aswath Damodaran 8
I. The Cost of Equity
Cost of Equity = Riskfree Rate + Beta * (Risk Premium)
Has to be in the samecurrency as cash flows, and defined in same terms(real or nominal) as thecash flows
Preferably, a bottom-up beta,based upon other firms in thebusiness, and firm’s own financialleverage
Historical Premium1. Mature Equity Market Premium:Average premium earned bystocks over T.Bonds in U.S.2. Country risk premium =
Country Default Spread* ( !Equity/!Country bond)
Implied PremiumBased on how equitymarket is priced todayand a simple valuationmodel
or

Aswath Damodaran 9
A Simple Test
You are valuing Ambev in U.S. dollars and are attempting to estimatea risk free rate to use in the analysis. The risk free rate that you shoulduse is
The interest rate on a nominal real denominated Brazilian governmentbond
The interest rate on an inflation-indexed Brazilian government bond The interest rate on a dollar denominated Brazilian government bond
(11.20%) The interest rate on a U.S. treasury bond (4.70%)

Aswath Damodaran 10
Everyone uses historical premiums, but..
The historical premium is the premium that stocks have historically earnedover riskless securities.
Practitioners never seem to agree on the premium; it is sensitive to• How far back you go in history…• Whether you use T.bill rates or T.Bond rates• Whether you use geometric or arithmetic averages.
For instance, looking at the US:Arithmetic average Geometric AverageStocks - Stocks - Stocks - Stocks -
Historical Period T.Bills T.Bonds T.Bills T.Bonds1928-2003 7.92% 6.54% 5.99% 4.82%1963-2003 6.09% 4.70% 4.85% 3.82%1993-2003 8.43% 4.87% 6.68% 3.57%

Aswath Damodaran 11
Two Ways of Estimating Country RiskPremiums…
Default spread on Country Bond: In this approach, the country risk premiumis based upon the default spread of the bond issued by the country (but only ifit is denominated in a currency where a default free entity exists.
• Brazil was rated B2 by Moody’s and the default spread on the Brazilian dollardenominated C.Bond at the end of May 2004 was 6.50%. (11.2%-4.7%)
Relative Equity Market approach: The country risk premium is based uponthe volatility of the market in question relative to U.S market.
Country risk premium = Risk PremiumUS* σCountry Equity / σUS EquityUsing a 4.82% premium for the US, this approach would yield:Total risk premium for Brazil = 4.82% (29.24%/18.59%) = 7.58%Country risk premium for Brazil = 7.58% - 4.82% = 2.76%(The standard deviation in weekly returns from 2001 to 2003 for the Bovespa was
29.24% whereas the standard deviation in the S&P 500 was 18.59%)

Aswath Damodaran 12
And a third approach
Country ratings measure default risk. While default risk premiumsand equity risk premiums are highly correlated, one would expectequity spreads to be higher than debt spreads.
Another is to multiply the bond default spread by the relativevolatility of stock and bond prices in that market. In this approach:• Country risk premium = Default spread on country bond* σCountry Equity / σ
Country Bond– Standard Deviation in Bovespa (Equity) = 29.24%– Standard Deviation in Brazil C-Bond = 24.15%– Default spread on C-Bond = 6.50%
• Country Risk Premium for Brazil = 6.50% (29.24%/24.15%) = 7.87%

Aswath Damodaran 13
From Country Spreads to Corporate Riskpremiums
Approach 1: Assume that every company in the country is equallyexposed to country risk. In this case,E(Return) = Riskfree Rate + Country Spread + Beta (US premium)Implicitly, this is what you are assuming when you use the local
Government’s dollar borrowing rate as your riskfree rate. Approach 2: Assume that a company’s exposure to country risk is
similar to its exposure to other market risk.E(Return) = Riskfree Rate + Beta (US premium + Country Spread)
Approach 3: Treat country risk as a separate risk factor and allowfirms to have different exposures to country risk (perhaps based uponthe proportion of their revenues come from non-domestic sales)E(Return)=Riskfree Rate+ β (US premium) + λ (Country Spread)
Aswath Damodaran 14
Estimating Company Exposure to CountryRisk: Determinants
Source of revenues: Other things remaining equal, a company shouldbe more exposed to risk in a country if it generates more of itsrevenues from that country. A Brazilian firm that generates the bulkof its revenues in Brazil should be more exposed to country risk thanone that generates a smaller percent of its business within Brazil.
Manufacturing facilities: Other things remaining equal, a firm that hasall of its production facilities in Brazil should be more exposed tocountry risk than one which has production facilities spread overmultiple countries. The problem will be accented for companies thatcannot move their production facilities (mining and petroleumcompanies, for instance).
Use of risk management products: Companies can use bothoptions/futures markets and insurance to hedge some or a significantportion of country risk.
Aswath Damodaran 15
Estimating Lambdas: The Revenue Approach
The easiest and most accessible data is on revenues. Most companies breaktheir revenues down by region. One simplistic solution would be to do thefollowing:λ = % of revenues domesticallyfirm/ % of revenues domesticallyavg firm
Consider, for instance, Embraer, Embratel and Ambev, all of which areincorporated and traded in Brazil. Embraer gets 3% of its revenues fromBrazil, Embratel gets almost all of its revenues in Brazil and Ambev getsabout 92% of its revenues in Brazil. The average Brazilian company getsabout 77% of its revenues in Brazil:
• LambdaEmbraer = 3%/ 77% = .04• LambdaEmbratel = 100%/77% = 1.30• LambdaAmbev = 92%/77% = 1.19
There are two implications• A company’s risk exposure is determined by where it does business and not by
where it is located• Firms might be able to actively manage their country risk exposures

Aswath Damodaran 16
Estimating Lambdas: Earnings Approach
Figure 2: EPS changes versus Country Risk: Embraer and Embratel
-2
-1.5
-1
-0.5
0
0.5
1
1.5
Q1
1998
Q2
1998
Q3
1998
Q4
1998
Q1
1999
Q2
1999
Q3
1999
Q4
1999
Q1
2000
Q2
2000
Q3
2000
Q4
2000
Q1
2001
Q2
2001
Q3
2001
Q4
2001
Q1
2002
Q2
2002
Q3
2002
Q4
2002
Q1
2003
Q2
2003
Q3
2003
Quarter
Qu
arte
rly
EP
S
-30.00%
-20.00%
-10.00%
0.00%
10.00%
20.00%
30.00%
40.00%
% c
han
ge
in C
Bo
nd
Pri
ce
Embraer Embratel C Bond
Aswath Damodaran 17
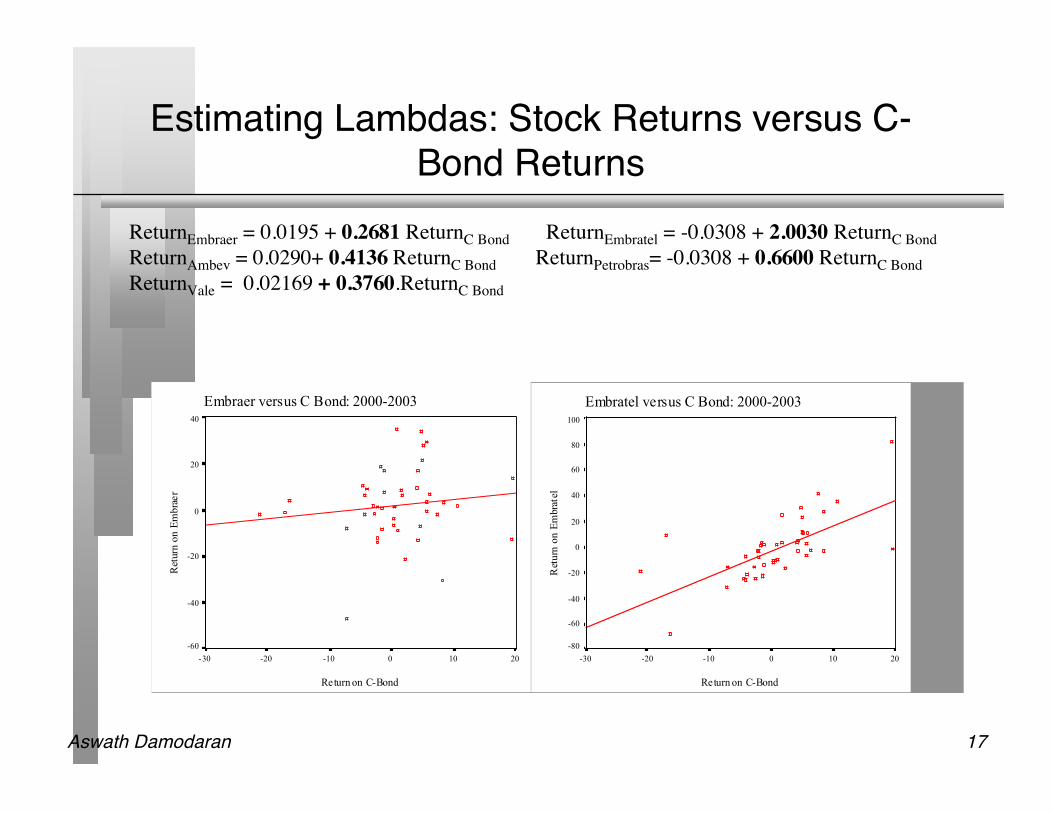
Estimating Lambdas: Stock Returns versus C-Bond Returns
Embraer versus C Bond: 2000-2003
Return on C-Bond
20100-10-20-30
Retu
rn o
n E
mb
rae
r
40
20
0
-20
-40
-60
Embratel versus C Bond: 2000-2003
Return on C-Bond
20100-10-20-30
Retu
rn o
n E
mbr a
tel
100
80
60
40
20
0
-20
-40
-60
-80
ReturnEmbraer = 0.0195 + 0.2681 ReturnC Bond ReturnEmbratel = -0.0308 + 2.0030 ReturnC BondReturnAmbev = 0.0290+ 0.4136 ReturnC Bond ReturnPetrobras= -0.0308 + 0.6600 ReturnC BondReturnVale = 0.02169 + 0.3760.ReturnC Bond
Aswath Damodaran 18
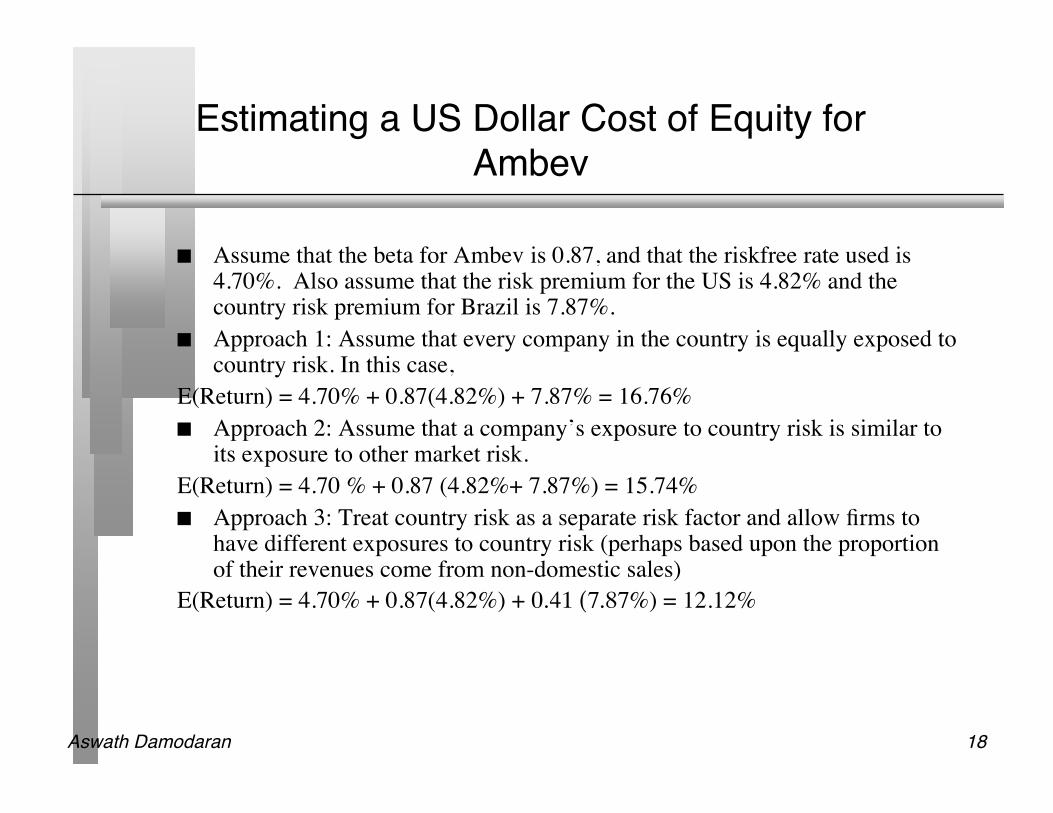
Estimating a US Dollar Cost of Equity forAmbev
Assume that the beta for Ambev is 0.87, and that the riskfree rate used is4.70%. Also assume that the risk premium for the US is 4.82% and thecountry risk premium for Brazil is 7.87%.
Approach 1: Assume that every company in the country is equally exposed tocountry risk. In this case,
E(Return) = 4.70% + 0.87(4.82%) + 7.87% = 16.76% Approach 2: Assume that a company’s exposure to country risk is similar to
its exposure to other market risk.E(Return) = 4.70 % + 0.87 (4.82%+ 7.87%) = 15.74% Approach 3: Treat country risk as a separate risk factor and allow firms to
have different exposures to country risk (perhaps based upon the proportionof their revenues come from non-domestic sales)
E(Return) = 4.70% + 0.87(4.82%) + 0.41 (7.87%) = 12.12%

Aswath Damodaran 19
Implied Equity Premium for the S&P 500:January 1, 2004
We can use the information in stock prices to back out how risk averse the market is and how muchof a risk premium it is demanding.
If you pay the current level of the index, you can expect to make a return of 7.94% on stocks (whichis obtained by solving for r in the following equation)
Implied Equity risk premium = Expected return on stocks - Treasury bond rate = 7.94% - 4.25% =3.69%
January 1, 2004S&P 500 is at 1111.91
In 2003, dividends & stock buybacks were 2.81% of the index, generating 31.29 in cashflows
Analysts expect earnings to grow 9.5% a year for the next 5 years as the economy comes out of a recession.
After year 5, we will assume that earnings on the index will grow at 4.25%, the same rate as the entire economy
34.26 37.52 41.08 44.98 49.26
!
1111.91=34.26
(1+ r)+37.52
(1+ r)2
+41.08
(1+ r)3
+44.98
(1+ r)4
+49.26
(1+ r)5
+49.26(1.0425)
(r " .0425)(1+ r)5

Aswath Damodaran 20
Implied Premiums in the US

Aswath Damodaran 21
Implied Premiums: From Bubble to BearMarket… January 2000 to December 2002

Aswath Damodaran 22
An Intermediate Solution
The historical risk premium of 4.82% for the United States is too higha premium to use in valuation. It is much higher than the actualimplied equity risk premium in the market
The current implied equity risk premium requires us to assume thatthe market is correctly priced today. (If I were required to be marketneutral, this is the premium I would use)
The average implied equity risk premium between 1960-2003 in theUnited States is about 4%. We will use this as the premium for amature equity market.

Aswath Damodaran 23
Implied Premium for Brazil: May 2004
Level of the Index = 22236 Dividends on the Index = 5.17% of 22236 Other parameters (all in US dollars)
• Riskfree Rate = 4.70%• Expected Growth (in dollars)
– Next 5 years = 14% (Used expected growth rate in Earnings for ADRs)– After year 5 = 5.20% (Slightly higher than riskfree rate because of higher
expected real growth) Solving for the expected return:
• Expected return on Equity = 12.96%• Implied Equity premium = 12.96% - 4.70% = 8.26%• Implied Equity premium for US on same day = 3.95%• Implied country premium for Brazil = 4.31%

Aswath Damodaran 24
Estimating Beta
The standard procedure for estimating betas is to regress stock returns(Rj) against market returns (Rm) -
Rj = a + b Rm
• where a is the intercept and b is the slope of the regression. The slope of the regression corresponds to the beta of the stock, and
measures the riskiness of the stock. This beta has three problems:
• It has high standard error• It reflects the firm’s business mix over the period of the regression, not
the current mix• It reflects the firm’s average financial leverage over the period rather than
the current leverage.

Aswath Damodaran 25
Beta Estimation : The Index Effect

Aswath Damodaran 26
Determinants of Betas
Beta of Firm (Unlevered Beta)
Beta of Equity (Levered Beta)
Nature of product or service offered by company:Other things remaining equal, the more discretionary the product or service, the higher the beta.
Operating Leverage (Fixed Costs as percent of total costs):Other things remaining equal the greater the proportion of the costs that are fixed, the higher the beta of the company.
Financial Leverage:Other things remaining equal, the greater the proportion of capital that a firm raises from debt,the higher its equity beta will be
Implications1. Cyclical companies should have higher betas than non-cyclical companies.2. Luxury goods firms should have higher betas than basic goods.3. High priced goods/service firms should have higher betas than low prices goods/services firms.4. Growth firms should have higher betas.
Implications1. Firms with high infrastructure needs and rigid cost structures should have higher betas than firms with flexible cost structures.2. Smaller firms should have higher betas than larger firms.3. Young firms should have higher betas than more mature firms.
ImplciationsHighly levered firms should have highe betas than firms with less debt.Equity Beta (Levered beta) = Unlev Beta (1 + (1- t) (Debt/Equity Ratio))

Aswath Damodaran 27
The Solution: Bottom-up Betas
The bottom up beta can be estimated by :• Taking a weighted (by sales or operating income) average of the
unlevered betas of the different businesses a firm is in.
(The unlevered beta of a business can be estimated by looking at other firms inthe same business)
• Lever up using the firm’s debt/equity ratio
The bottom up beta will give you a better estimate of the true betawhen• It has lower standard error (SEaverage = SEfirm / √n (n = number of firms)• It reflects the firm’s current business mix and financial leverage• It can be estimated for divisions and private firms.
!jj=1
j=k
" Operating Income j
Operating Income Firm
#
$ %
&
' (
!levered = !unlevered 1+ (1" tax rate) (Current Debt/Equity Ratio)[ ]

Aswath Damodaran 28
Bottom-up Betas: Embraer, Ambev, Vale andPetrobras
Company Business Unlevered beta D/E Ratio Weights Levered Beta
Embraer Aerospace 0.95 18.95% 100% 1.07
Ambev Alcoholic beverages 0.75 19.43% 80% 0.85
Soft Drinks 0.85 19.43% 20% 0.96
Company 0.77 19.43% 0.87
Vale Mining 0.98 25.66% 71% 1.15
Aluminum 0.72 25.66% 9% 0.84
Steel 0.63 25.66% 14% 0.74
Transportation 0.73 25.66% 5% 0.85
Other 0.74 25.66% 1% 0.87
Company 0.89 25.66% 100% 1.04
Petrobras Integrated Oil 0.56 49.58% 100% 0.74

Aswath Damodaran 29
Gross Debt versus Net Debt Approaches:Embraer in October 2003
Net Debt Ratio for Embraer = (Debt - Cash)/ Market value of Equity= (1953-2320)/ 11,042 = -3.32%
Levered Beta for Embraer = 0.95 (1 + (1-.34) (-.0332)) = 0.93 The cost of Equity using net debt levered beta for Embraer will be
much lower than with the gross debt approach. The cost of capital forEmbraer, though, will even out since the debt ratio used in the cost ofcapital equation will now be a net debt ratio rather than a gross debtratio.

Aswath Damodaran 30
From Cost of Equity to Cost of Capital
Cost of Capital = Cost of Equity (Equity/(Debt + Equity)) + Cost of Borrowing (1-t) (Debt/(Debt + Equity))
Cost of borrowing should be based upon(1) synthetic or actual bond rating(2) default spreadCost of Borrowing = Riskfree rate + Default spread
Marginal tax rate, reflectingtax benefits of debt
Weights should be market value weightsCost of equitybased upon bottom-upbeta
Aswath Damodaran 31
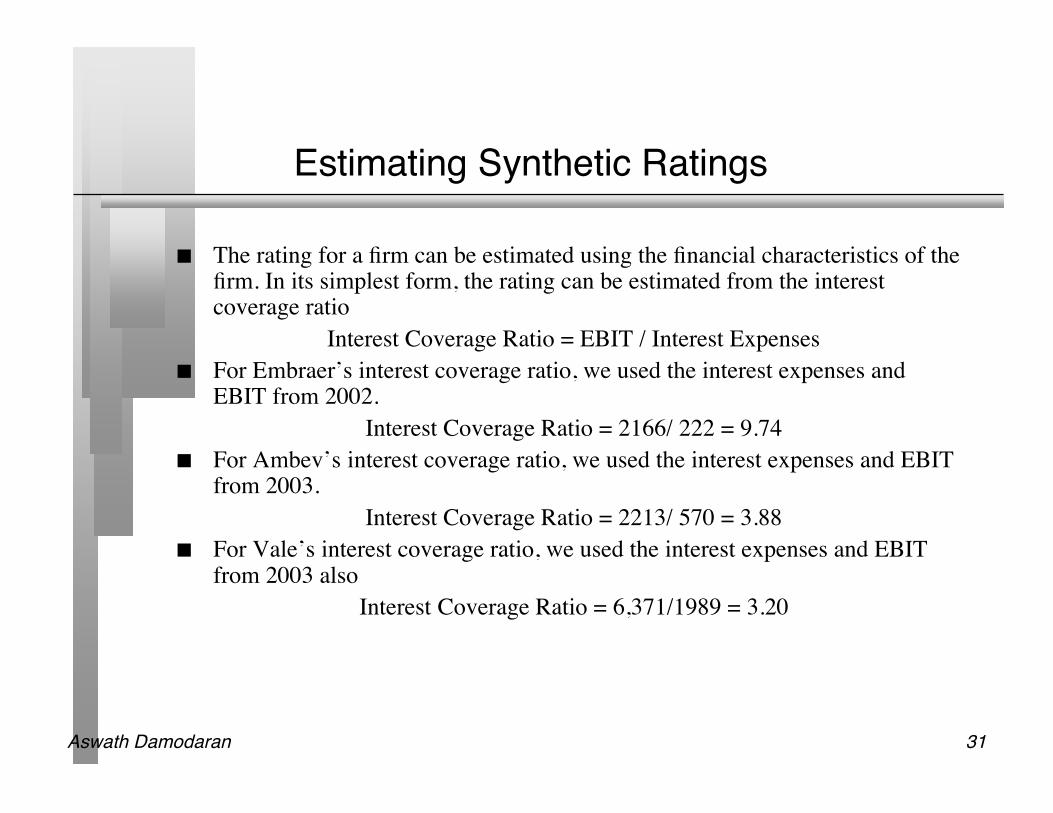
Estimating Synthetic Ratings
The rating for a firm can be estimated using the financial characteristics of thefirm. In its simplest form, the rating can be estimated from the interestcoverage ratio
Interest Coverage Ratio = EBIT / Interest Expenses For Embraer’s interest coverage ratio, we used the interest expenses and
EBIT from 2002.Interest Coverage Ratio = 2166/ 222 = 9.74
For Ambev’s interest coverage ratio, we used the interest expenses and EBITfrom 2003.
Interest Coverage Ratio = 2213/ 570 = 3.88 For Vale’s interest coverage ratio, we used the interest expenses and EBIT
from 2003 alsoInterest Coverage Ratio = 6,371/1989 = 3.20

Aswath Damodaran 32
Interest Coverage Ratios, Ratings and DefaultSpreads
If Interest Coverage Ratio is Estimated Bond Rating Default Spread(2003) Default Spread(2004)> 8.50 (>12.50) AAA 0.75% 0.35%6.50 - 8.50 (9.5-12.5) AA 1.00% 0.50%5.50 - 6.50 (7.5-9.5) A+ 1.50% 0.70%4.25 - 5.50 (6-7.5) A 1.80% 0.85%3.00 - 4.25 (4.5-6) A– 2.00% 1.00%2.50 - 3.00 (4-4.5) BBB 2.25% 1.50%2.25- 2.50 (3.5-4) BB+ 2.75% 2.00%2.00 - 2.25 ((3-3.5) BB 3.50% 2.50%1.75 - 2.00 (2.5-3) B+ 4.75% 3.25%1.50 - 1.75 (2-2.5) B 6.50% 4.00%1.25 - 1.50 (1.5-2) B – 8.00% 6.00%0.80 - 1.25 (1.25-1.5) CCC 10.00% 8.00%0.65 - 0.80 (0.8-1.25) CC 11.50% 10.00%0.20 - 0.65 (0.5-0.8) C 12.70% 12.00%< 0.20 (<0.5) D 15.00% 20.00%The first number under interest coverage ratios is for larger market cap companies and the second in brackets is for smaller
market cap companies. For Embraer and Ambev , I used the interest coverage ratio table for smaller/riskier firms (thenumbers in brackets) which yields a lower rating for the same interest coverage ratio.

Aswath Damodaran 33
Estimating the cost of debt
Company EBIT Interest Interest Rating Company Country Cost of
Expense Coverage Spread Spread Debt($)
Embraer (2003) 2166 222 9.76 AA 1.00% 4% 9.17%
Ambev 2213 570 3.88 BB+ 2.00% 4% 10.70%
Vale 6371 1989 3.20 BB 2.50% 4% 11.20%
Petrobras 14974 3195 4.69 A- 1% 4% 9.70%
Riskfree Rate = 4.17% for Embraer in 2003, 4.70% for all other firms
Cost of debt ($) = Riskfree Rate + Company Spread + Country Spread
(I have assumed that all of these companies will have to bear only a portion of the totalcountry default spread of Brazil which is 4.50%)

Aswath Damodaran 34
Weights for the Cost of Capital Computation
The weights used to compute the cost of capital should be the marketvalue weights for debt and equity.
There is an element of circularity that is introduced into everyvaluation by doing this, since the values that we attach to the firm andequity at the end of the analysis are different from the values we gavethem at the beginning.
As a general rule, the debt that you should subtract from firm value toarrive at the value of equity should be the same debt that you used tocompute the cost of capital.

Aswath Damodaran 35
Estimating Cost of Capital: Embraer
Equity• Cost of Equity = 4.17% + 1.07 (4%) + 0.27 (7.67%) = 10.52%• Market Value of Equity =11,042 million BR ($ 3,781 million)
Debt• Cost of debt = 4.17% + 4.00% +1.00%= 9.17%• Market Value of Debt = 2,093 million BR ($717 million)
Cost of CapitalCost of Capital = 10.52 % (.84) + 9.17% (1- .34) (0.16)) = 9.81%
The book value of equity at Embraer is 3,350 million BR.The book value of debt at Embraer is 1,953 million BR; Interest expense is 222
mil; Average maturity of debt = 4 yearsEstimated market value of debt = 222 million (PV of annuity, 4 years, 9.17%) +
$1,953 million/1.09174 = 2,093 million BR

Aswath Damodaran 36
Estimating Cost of Capital: Ambev
Equity• Cost of Equity = 4.7% + 0.87 (4%) + 0.41 (7.87%) = 11.41%• Market Value of Equity = 29,886 million BR ($ 9,508 million)
Debt• Cost of debt = 4.7% + 4.00% +2.00%= 10.70%• Market Value of Debt = 5,808 million BR ($1,848 million)
Cost of CapitalCost of Capital = 11.41 % (.837) + 10.7% (1- .34) (0.163)) = 10.70%
The book value of equity at Ambev is 4,209 million BR.The book value of debt at Ambev is 5,980 million BR; Interest expense is 570
mil; Average maturity of debt = 3 yearsEstimated market value of debt = 570 million (PV of annuity, 3 years, 10.7%) +
$5,980 million/1.1073 = 5,808 million BR

Aswath Damodaran 37
Estimating Cost of Capital: Vale
Equity• Cost of Equity = 4.7% + 1.04 (4%) + 0.37 (7.87%) = 11.77%• Market Value of Equity = 56,442 million BR ($ 17,958 million)
Debt• Cost of debt = 4.7% + 4.00% +2.50%= 11.20%• Market Value of Debt = 14,484 million BR ($ 4,612 million)
Cost of CapitalCost of Capital = 11.77 % (.796) + 11.2% (1- .34) (0.204)) = 10.88%The book value of equity at Vale is 15,937 million BR.The book value of debt at Vale is 13,709 million BR; Interest expense is 1,989
mil; Average maturity of debt = 2 yearsEstimated market value of debt = 1,989 million (PV of annuity, 2 years, 11.2%) +
13,709 million/1.1122 = 14,484 million BR

Aswath Damodaran 38
Estimating Cost of Capital: Petrobras
Equity• Cost of Equity = 4.70% + 0.79 (4%) + 0.66(7.87%) = 12.58%• Market Value of Equity = 85,218 million BR ($ 27,114 million)
Debt• Cost of debt = 4.7% + 4.00% + 1.00%= 9.70%• Market Value of Debt = 39,367 million BR ($ 12,537 million)
Cost of CapitalCost of Capital = 12.58 % (.684) + 9.7% (1- .34) (0.316)) = 10.63%The book value of equity at Petrobras is 50.987 million BR.The book value of debt at Petrobras is 42,248 million BR; Interest expense is
1,989 mil; Average maturity of debt = 4 yearsEstimated market value of debt = 3,195 million (PV of annuity, 4 years, 9.7%) +
42,248 million/1.0974 = 39,367 million BR
Aswath Damodaran 39
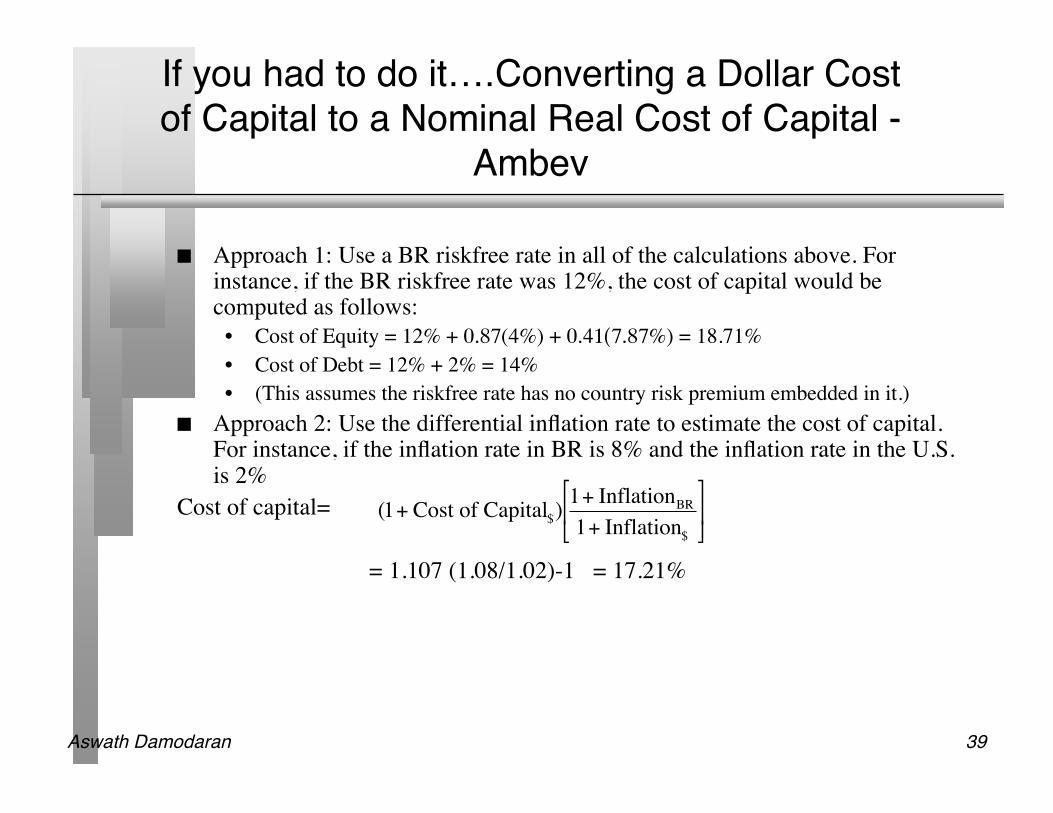
If you had to do it….Converting a Dollar Costof Capital to a Nominal Real Cost of Capital -
Ambev
Approach 1: Use a BR riskfree rate in all of the calculations above. Forinstance, if the BR riskfree rate was 12%, the cost of capital would becomputed as follows:
• Cost of Equity = 12% + 0.87(4%) + 0.41(7.87%) = 18.71%• Cost of Debt = 12% + 2% = 14%• (This assumes the riskfree rate has no country risk premium embedded in it.)
Approach 2: Use the differential inflation rate to estimate the cost of capital.For instance, if the inflation rate in BR is 8% and the inflation rate in the U.S.is 2%
Cost of capital=
= 1.107 (1.08/1.02)-1 = 17.21%
!
(1+ Cost of Capital$)1+ InflationBR
1+ Inflation$
"
# $
%
& '

Aswath Damodaran 40
II. Valuing Control and SynergyAcquisition Valuation
It is not what you buy but what you pay for it….

Aswath Damodaran 41
Issues in Acquisition Valuation
Acquisition valuations are complex, because the valuation ofteninvolved issues like synergy and control, which go beyond justvaluing a target firm. It is important on the right sequence, including• When should you consider synergy?• Where does the method of payment enter the process.
Can synergy be valued, and if so, how? What is the value of control? How can you estimate the value?
Aswath Damodaran 42
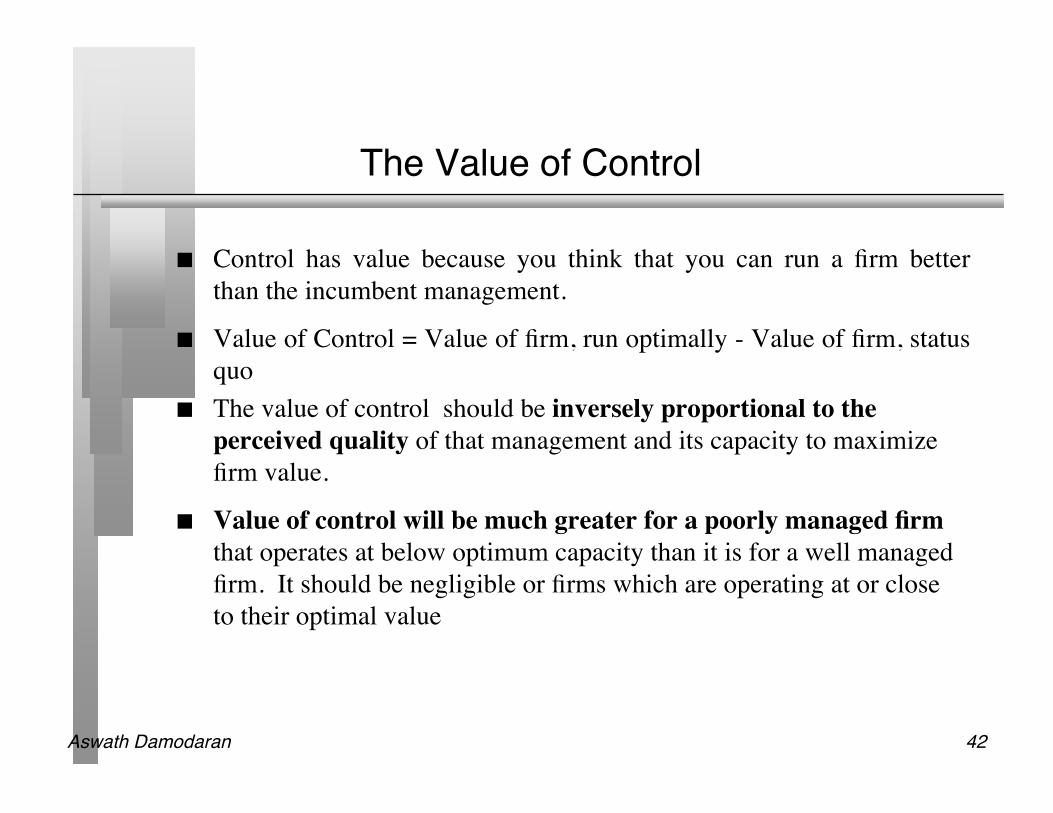
The Value of Control
Control has value because you think that you can run a firm betterthan the incumbent management.
Value of Control = Value of firm, run optimally - Value of firm, statusquo
The value of control should be inversely proportional to theperceived quality of that management and its capacity to maximizefirm value.
Value of control will be much greater for a poorly managed firmthat operates at below optimum capacity than it is for a well managedfirm. It should be negligible or firms which are operating at or closeto their optimal value

Aswath Damodaran 43
Price Enhancement versus ValueEnhancement

Aswath Damodaran 44
Current Cashflow to FirmEBIT(1-t) : 504- Nt CpX 146 - Chg WC 124= FCFF $ 233Reinvestment Rate = 270/504= 53.7%
Expected Growth in EBIT (1-t).537*.1624=.08728.72%
Stable Growthg = 4.70%; Beta = 1.00;Country Premium= 5%Cost of capital = 9.94% ROC= 9.94%; Tax rate=34%Reinvestment Rate=g/ROC
=4.70/9.94= 47.31%
Terminal Value5= 641/(.0994-.047) = 12,249
Cost of Equity11.41%
Cost of Debt(4.70%+2%+4%)(1-.34)= 7.06%
WeightsE = 84% D = 16%
Discount at $ Cost of Capital (WACC) = 11.41% (.84) + 7.06% (0.16) = 10.70%
Op. Assets $ 6546+ Cash: 743- Debt 1848- Minor. Int. 137=Equity 5304-Options 0Value/Sh $137.62
R$ 433/sh
Riskfree Rate:$ Riskfree Rate= 4.70%
+Beta 0.87 X
Mature market premium 4 %
Unlevered Beta for Sectors: 0.77
Firm’s D/ERatio: 19.4%
Ambev: Status Quo ($) Reinvestment Rate 53.7%
Return on Capital16.24%
Term Yr 1217 - 576= 641
+ Lambda0.41
XCountry Equity RiskPremium7.87%
Country Default Spread6.50%
X
Rel Equity Mkt Vol
1.21
On May 24, 2004Ambev Common = R$1140Ambev Pref = 500
$ Cashflows
Year 1 2 3 4 5 6 7 8 9 10EBIT (1-t) $548 $595 $647 $704 $765 $832 $904 $983 $1069 $1162 - Reinvestment $294 $320 $348 $378 $411 $447 $486 $528 $574 $624 FCFF $253 $276 $300 $326 $354 $385 $419 $455 $495 $538
Aswath Damodaran 45
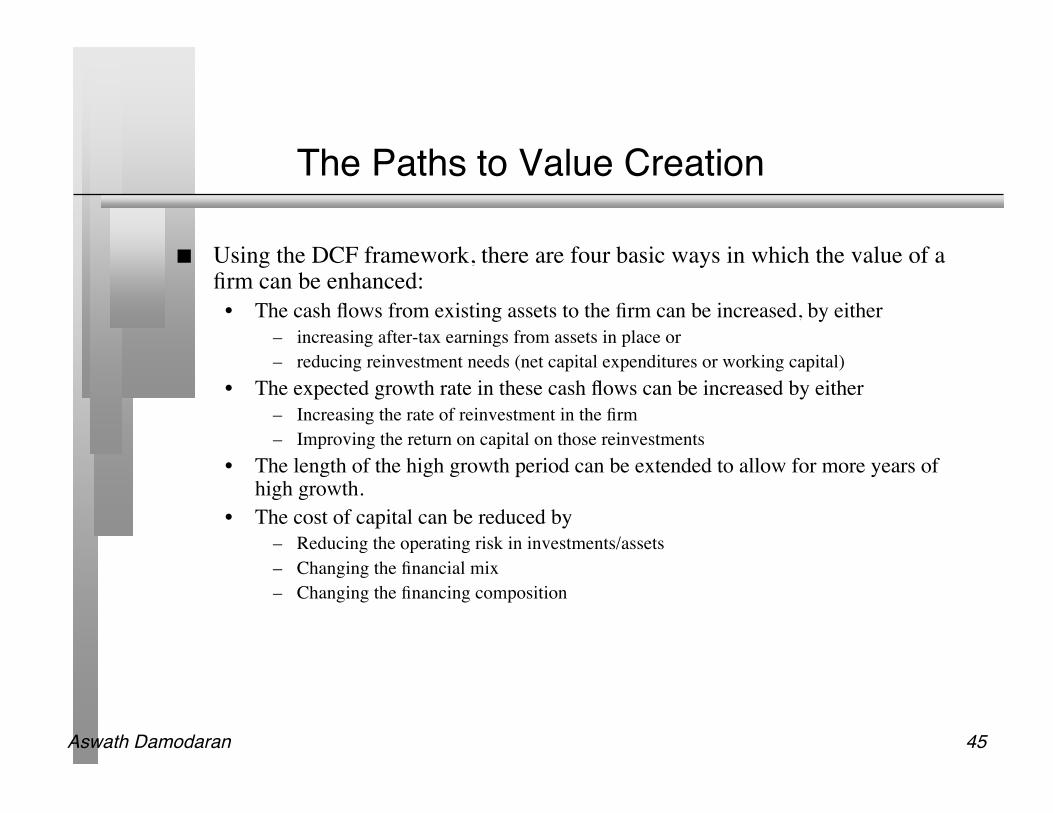
The Paths to Value Creation
Using the DCF framework, there are four basic ways in which the value of afirm can be enhanced:
• The cash flows from existing assets to the firm can be increased, by either– increasing after-tax earnings from assets in place or– reducing reinvestment needs (net capital expenditures or working capital)
• The expected growth rate in these cash flows can be increased by either– Increasing the rate of reinvestment in the firm– Improving the return on capital on those reinvestments
• The length of the high growth period can be extended to allow for more years ofhigh growth.
• The cost of capital can be reduced by– Reducing the operating risk in investments/assets– Changing the financial mix– Changing the financing composition

Aswath Damodaran 46
I. Ways of Increasing Cash Flows from Assetsin Place
Revenues
* Operating Margin
= EBIT
- Tax Rate * EBIT
= EBIT (1-t)
+ Depreciation- Capital Expenditures- Chg in Working Capital= FCFF
Divest assets thathave negative EBIT
More efficient operations and cost cuttting: Higher Margins
Reduce tax rate- moving income to lower tax locales- transfer pricing- risk management
Live off past over- investment
Better inventory management and tighter credit policies
Aswath Damodaran 47
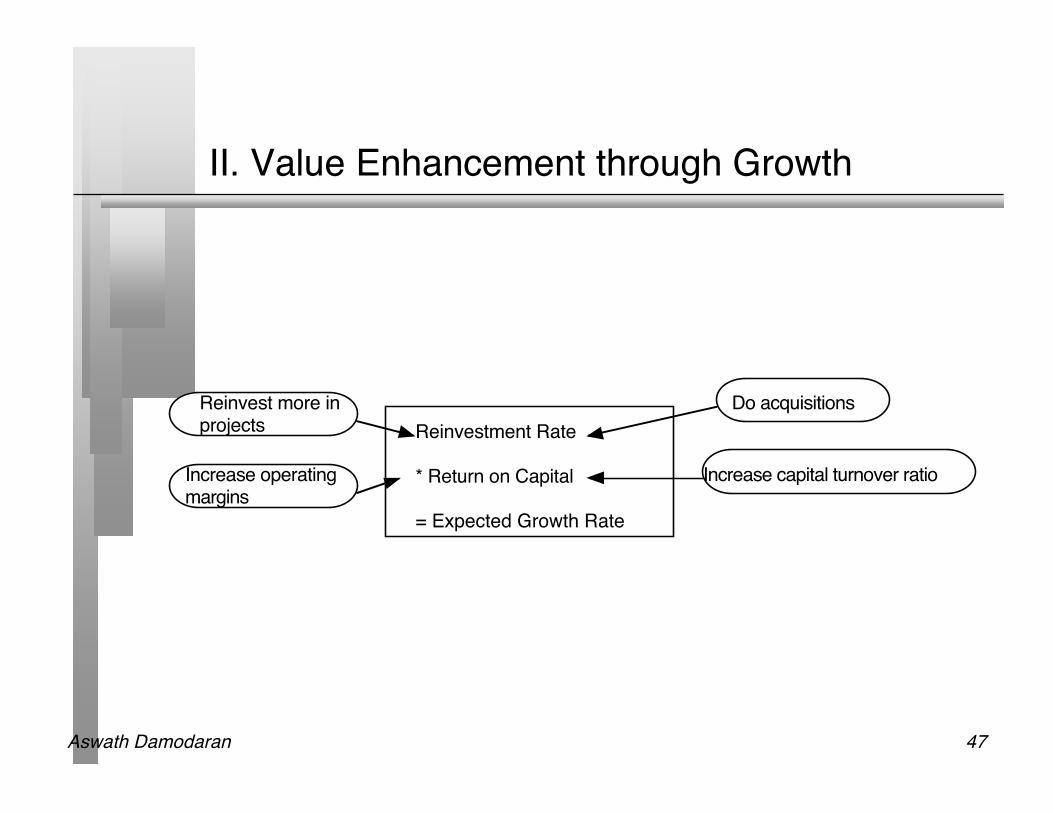
II. Value Enhancement through Growth
Reinvestment Rate
* Return on Capital
= Expected Growth Rate
Reinvest more inprojects
Do acquisitions
Increase operatingmargins
Increase capital turnover ratio

Aswath Damodaran 48
III. Building Competitive Advantages: Increaselength of the growth period
Increase length of growth period
Build on existing competitive advantages
Find new competitive advantages
Brand name
Legal Protection
Switching Costs
Cost advantages

Aswath Damodaran 49
Illustration: Valuing a brand name: Coca Cola
Coca Cola Generic Cola CompanyAT Operating Margin 18.56% 7.50%Sales/BV of Capital 1.67 1.67ROC 31.02% 12.53%Reinvestment Rate 65.00% (19.35%) 65.00% (47.90%)Expected Growth 20.16% 8.15%Length 10 years 10 yeaCost of Equity 12.33% 12.33%E/(D+E) 97.65% 97.65%AT Cost of Debt 4.16% 4.16%D/(D+E) 2.35% 2.35%Cost of Capital 12.13% 12.13%Value $115 $13

Aswath Damodaran 50
Gauging Barriers to Entry
Which of the following barriers to entry are most likely to work forEmbraer?
Brand Name Patents and Legal Protection Switching Costs Cost Advantages What about for Ambev? Brand Name Patents and Legal Protection Switching Costs Cost Advantages

Aswath Damodaran 51
Reducing Cost of Capital
Cost of Equity (E/(D+E) + Pre-tax Cost of Debt (D./(D+E)) = Cost of Capital
Change financing mix
Make product or service less discretionary to customers
Reduce operating leverage
Match debt to assets, reducing default risk
Changing product characteristics
More effective advertising
Outsourcing Flexible wage contracts &cost structure
Swaps Derivatives Hybrids

Aswath Damodaran 52
Embraer : Optimal Capital Structure
Debt Ratio Beta Cost of Equity Bond Rating Interest rate on debt Tax Rate Cost of Debt (after-tax) WACC Firm Value (G)
0% 0.95 10.05% AAA 8.92% 34.00% 5.89% 10.05% $3,577
10% 1.02 10.32% AAA 8.92% 34.00% 5.89% 9.88% $3,639
20% 1.11 10.67% AA 9.17% 34.00% 6.05% 9.75% $3,690
30% 1.22 11.12% A 9.97% 34.00% 6.58% 9.76% $3,686
40% 1.37 11.72% A- 10.17% 34.00% 6.71% 9.72% $3,703
50% 1.58 12.56% B 14.67% 34.00% 9.68% 11.12% $3,218
60% 1.89 13.81% CCC 18.17% 34.00% 11.99% 12.72% $2,799
70% 2.42 15.90% CC 19.67% 34.00% 12.98% 13.86% $2,562
80% 3.48 20.14% CC 19.67% 33.63% 13.05% 14.47% $2,450
90% 6.95 34.05% CC 19.67% 29.90% 13.79% 15.81% $2,236

Aswath Damodaran 53
Ambev: Optimal Capital Structure
Debt Ratio Beta Cost of Equity Bond Rating Interest rate on debt Tax Rate Cost of Debt (after-tax) WACC Firm Value (G)
0% 0.85 11.33% AAA 9.20% 34.00% 6.07% 11.33% $33,840
10% 0.91 11.58% AA 9.20% 34.00% 6.07% 11.03% $35,530
20% 0.99 11.89% A- 9.70% 34.00% 6.40% 10.79% $36,966
30% 1.09 12.29% B- 14.70% 34.00% 9.70% 11.52% $32,873
40% 1.23 12.83% CC 18.70% 34.00% 12.34% 12.63% $28,005
50% 1.49 13.87% C 20.70% 25.24% 15.48% 14.67% $21,930
60% 1.95 15.71% D 28.70% 14.22% 24.62% 21.05% $12,721
70% 2.59 18.30% D 28.70% 12.19% 25.20% 23.13% $11,098
80% 3.89 23.49% D 28.70% 10.67% 25.64% 25.21% $9,804
90% 7.78 39.06% D 28.70% 9.48% 25.98% 27.29% $8,748

Aswath Damodaran 54
Vale: Optimal Capital Structure
Debt Ratio Beta Cost of Equity Bond Rating Interest rate on debt Tax Rate Cost of Debt (after-tax) WACC Firm Value (G)
0% 0.89 11.17% AAA 9.20% 34.00% 6.07% 11.17% $67,576
10% 0.95 11.43% AA 9.20% 34.00% 6.07% 10.89% $70,723
20% 1.04 11.76% A+ 9.40% 34.00% 6.20% 10.65% $73,819
30% 1.14 12.18% A- 9.70% 34.00% 6.40% 10.44% $76,537
40% 1.28 12.73% BB 11.20% 34.00% 7.39% 10.60% $74,451
50% 1.48 13.52% B- 14.70% 34.00% 9.70% 11.61% $63,058
60% 1.77 14.69% CC 18.70% 34.00% 12.34% 13.28% $50,122
70% 2.35 17.01% CC 18.70% 29.68% 13.15% 14.31% $44,418
80% 3.90 23.20% D 28.70% 15.46% 24.26% 24.05% $20,372
90% 7.79 38.79% D 28.70% 13.74% 24.76% 26.16% $18,043

Aswath Damodaran 55
Current Cashflow to FirmEBIT(1-t) : 504- Nt CpX 146 - Chg WC 124= FCFF $ 233Reinvestment Rate = 270/504= 53.7%
Expected Growth in EBIT (1-t).60*.18=.10810.80%
Stable Growthg = 4.70%; Beta = 1.00;Country Premium= 5%Cost of capital = 9.94% ROC= 9.94%; Tax rate=34%Reinvestment Rate=g/ROC
=4.70/9.94= 47.31%
Terminal Value5= 766/(.0994-.047) = 14.990
Cost of Equity11.53%
Cost of Debt(4.70%+1%+4%)(1-.34)= 6.40%
WeightsE = 80% D = 20%
Discount at $ Cost of Capital (WACC) = 11.53% (.80) + 6.40% (0.20) = 10.50%
Op. Assets $ 7567+ Cash: 743- Debt 1848- Minor. Int. 137=Equity 6277-Options 0Value/Sh $162.89
R$ 512/sh
Riskfree Rate:$ Riskfree Rate= 4.70%
+Beta 0.90 X
Mature market premium 4 %
Unlevered Beta for Sectors: 0.77
Firm’s D/ERatio: 25%
Ambev: Restructured ($) Reinvestment Rate60%
Return on Capital18%
Term Yr 1470 - 704= 766
+ Lambda0.41
XCountry Equity RiskPremium7.87%
Country Default Spread6.50%
X
Rel Equity Mkt Vol
1.21
On May 24, 2004Ambev Common = R$1140Ambev Pref = 500
$ Cashflows
Year 1 2 3 4 5 6 7 8 9 10EBIT (1-t) $558 $618 $685 $759 $841 $932 $1,032 $1144 $1,267 $1,404 - Reinvestment$335 $371 $411 $455 $505 $559 $619 $686 $760 $843 FCFF $223 $247 $274 $304 $336 $373 $413 $458 $507 $562

Aswath Damodaran 56
Value of stock in a publicly traded firm
When a firm is badly managed, the market still assesses theprobability that it will be run better in the future and attaches a valueof control to the stock price today:
With voting shares and non-voting shares, a disproportionate share ofthe value of control will go to the voting shares. In the extremescenario where non-voting shares are completely unprotected:!
Value per share =Status Quo Value + Probability of control change (Optimal - Status Quo Value)
Number of shares outstanding
!
Value per non - voting share =Status Quo Value
# Voting Shares + # Non - voting shares
!
Value per voting share = Value of non - voting share + Probability of control change (Optimal - Status Quo Value)
# Voting Shares
Aswath Damodaran 57
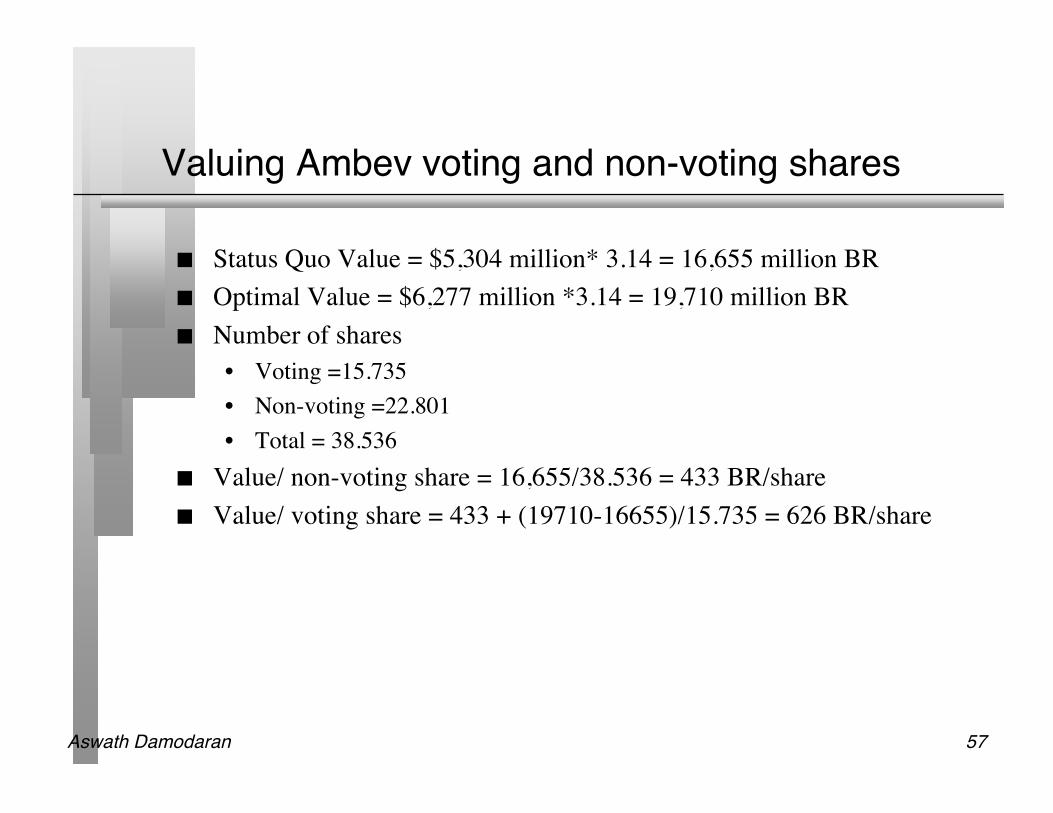
Valuing Ambev voting and non-voting shares
Status Quo Value = $5,304 million* 3.14 = 16,655 million BR Optimal Value = $6,277 million *3.14 = 19,710 million BR Number of shares
• Voting =15.735• Non-voting =22.801• Total = 38.536
Value/ non-voting share = 16,655/38.536 = 433 BR/share Value/ voting share = 433 + (19710-16655)/15.735 = 626 BR/share
Aswath Damodaran 58
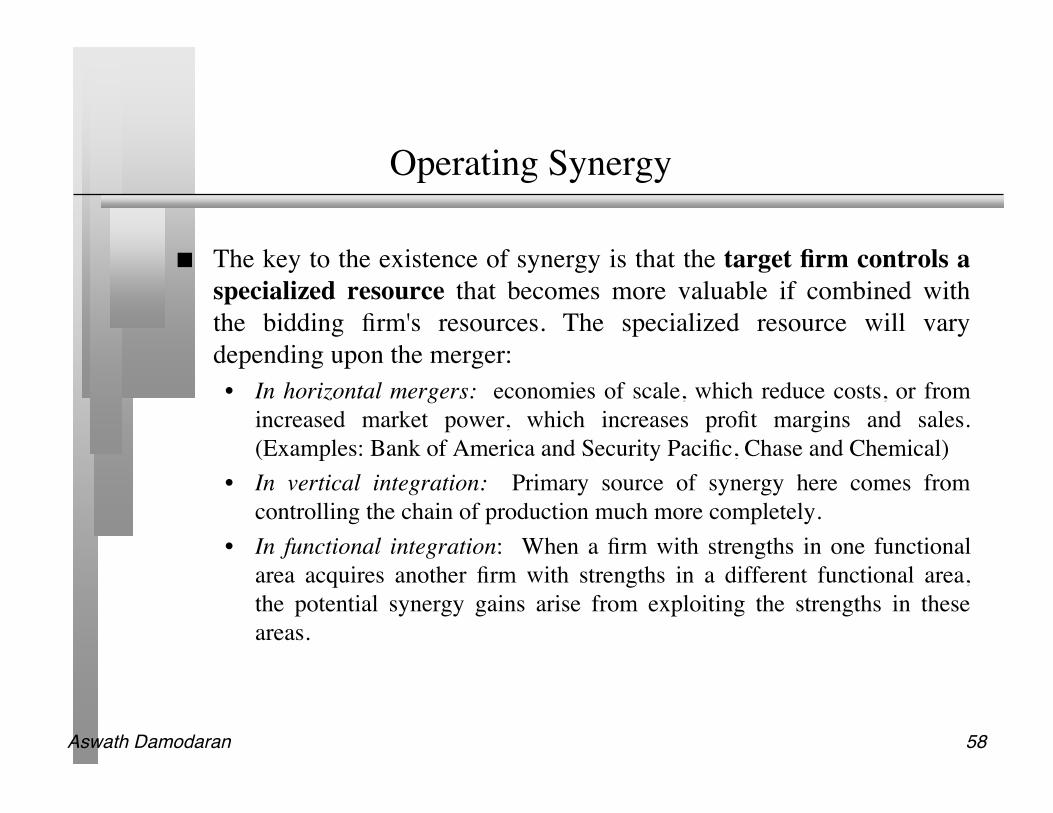
Operating Synergy
The key to the existence of synergy is that the target firm controls aspecialized resource that becomes more valuable if combined withthe bidding firm's resources. The specialized resource will varydepending upon the merger:• In horizontal mergers: economies of scale, which reduce costs, or from
increased market power, which increases profit margins and sales.(Examples: Bank of America and Security Pacific, Chase and Chemical)
• In vertical integration: Primary source of synergy here comes fromcontrolling the chain of production much more completely.
• In functional integration: When a firm with strengths in one functionalarea acquires another firm with strengths in a different functional area,the potential synergy gains arise from exploiting the strengths in theseareas.

Aswath Damodaran 59
Valuing operating synergy
(a) What form is the synergy expected to take? Will it reduce costs as apercentage of sales and increase profit margins (as is the case whenthere are economies of scale)? Will it increase future growth (as isthe case when there is increased market power)? )
(b) When can the synergy be reasonably expected to start affectingcashflows? (Will the gains from synergy show up instantaneouslyafter the takeover? If it will take time, when can the gains be expectedto start showing up? )

Aswath Damodaran 60
A procedure for valuing synergy
(1) the firms involved in the merger are valued independently, bydiscounting expected cash flows to each firm at the weighted averagecost of capital for that firm.
(2) the value of the combined firm, with no synergy, is obtained byadding the values obtained for each firm in the first step.
(3) The effects of synergy are built into expected growth rates andcashflows, and the combined firm is re-valued with synergy.
Value of Synergy = Value of the combined firm, with synergy - Value ofthe combined firm, without synergy

Aswath Damodaran 61
Synergy Effects in Valuation Inputs
If synergy is Valuation Inputs that will be affected areCost Savings Operating Margin of combined firm will be greater
than the revenue-weighted operating margin of individual firms.
Growth Synergy More projects:Higher Reinvestment Rate (Retention)Better projects: Higher Return on Capital (ROC)Longer Growth PeriodAgain, these inputs will be estimated for the combined firm.

Aswath Damodaran 62
Financial Synergy
Sources of Financial Synergy• Diversification: Acquiring another firm as a way of reducing risk cannot
create wealth for two publicly traded firms, with diversified stockholders,but it could create wealth for private firms or closely held publicly tradedfirms.
• Cash Slack: When a firm with significant excess cash acquires a firm,with great projects but insufficient capital, the combination can createvalue.
• Tax Benefits: The tax paid by two firms combined together may be lowerthan the taxes paid by them as individual firms. This can arise eitherbecause of an increase in depreciation, use of tax-loss carryforwards or(as in Brazil) an increase in tax-deductible interest on capital.
• Debt Capacity: It is possible that a combined firm can have higher debtcapacity and/or a lower cost of debt that two firms standing alone. This,in turn, will increase firm value.

Aswath Damodaran 63

Aswath Damodaran 64
J.P. Morgan’s estimate of annual operatingsynergies in Ambev/Labatt Merger

Aswath Damodaran 65
J.P. Morgan’s estimate of total synergies inLabatt/Ambev Merger
Aswath Damodaran 66
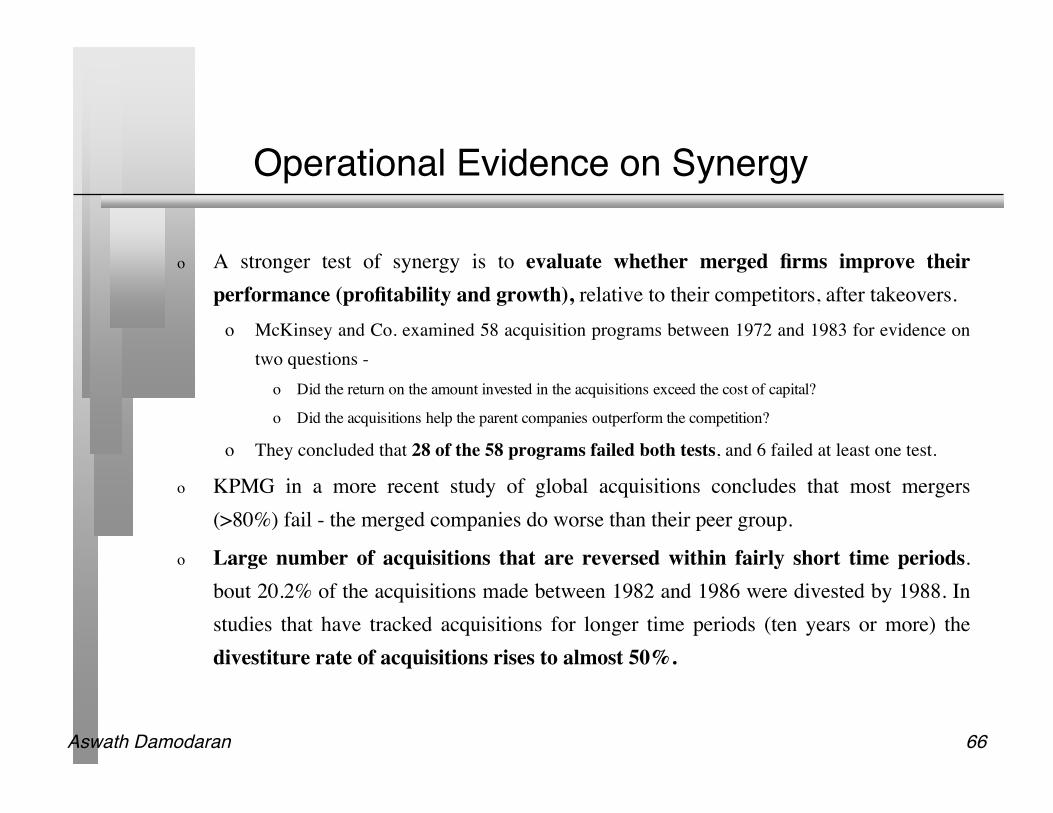
Operational Evidence on Synergy
o A stronger test of synergy is to evaluate whether merged firms improve theirperformance (profitability and growth), relative to their competitors, after takeovers.
o McKinsey and Co. examined 58 acquisition programs between 1972 and 1983 for evidence ontwo questions -
o Did the return on the amount invested in the acquisitions exceed the cost of capital?
o Did the acquisitions help the parent companies outperform the competition?
o They concluded that 28 of the 58 programs failed both tests, and 6 failed at least one test.
o KPMG in a more recent study of global acquisitions concludes that most mergers(>80%) fail - the merged companies do worse than their peer group.
o Large number of acquisitions that are reversed within fairly short time periods.bout 20.2% of the acquisitions made between 1982 and 1986 were divested by 1988. Instudies that have tracked acquisitions for longer time periods (ten years or more) thedivestiture rate of acquisitions rises to almost 50%.
Aswath Damodaran 67
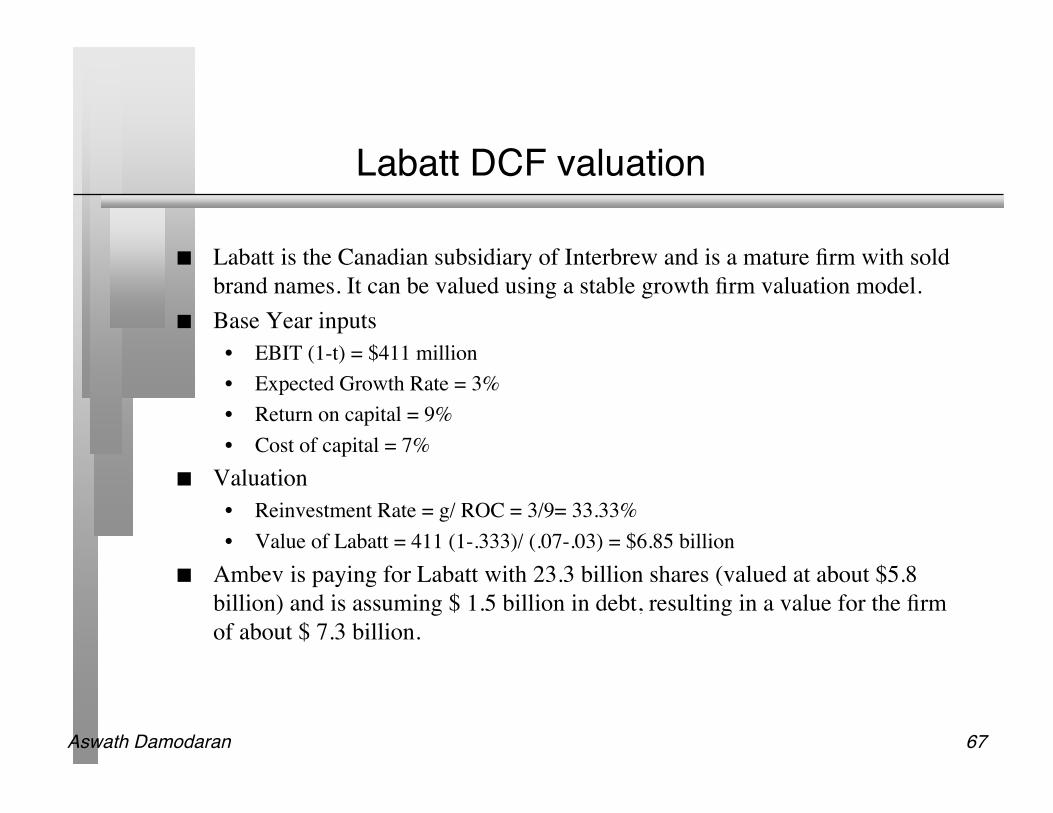
Labatt DCF valuation
Labatt is the Canadian subsidiary of Interbrew and is a mature firm with soldbrand names. It can be valued using a stable growth firm valuation model.
Base Year inputs• EBIT (1-t) = $411 million• Expected Growth Rate = 3%• Return on capital = 9%• Cost of capital = 7%
Valuation• Reinvestment Rate = g/ ROC = 3/9= 33.33%• Value of Labatt = 411 (1-.333)/ (.07-.03) = $6.85 billion
Ambev is paying for Labatt with 23.3 billion shares (valued at about $5.8billion) and is assuming $ 1.5 billion in debt, resulting in a value for the firmof about $ 7.3 billion.

Aswath Damodaran 68
Who gets the benefits of synergy?
Total Synergy = $ 2 billion
Premium paid to Labatt Stockholders = $7.3 billion - $6.85 billion = $ 450 million
Voting Shares in Ambev
Non-voting Shares in Ambev
$1.55 billion to be shared?

Aswath Damodaran 69
III. Valuing Equity in Cyclical firmsand firms with negative earnings :
The Search for Normalcy
Aswath Damodaranhttp://www.damodaran.com

Aswath Damodaran 70
Begin by analyzing why the earnings are notnot normal
A Framework for Analyzing Companies with Negative or Abnormally Low Earnings
Why are the earnings negative or abnormally low?
TemporaryProblems
Cyclicality:Eg. Auto firmin recession
Life Cycle related reasons: Young firms and firms with infrastructure problems
LeverageProblems: Eg. An otherwise healthy firm with too much debt.
Long-termOperatingProblems: Eg. A firm with significant production or cost problems.
Normalize Earnings
Value the firm by doing detailed cash flow forecasts starting with revenues and reduce or eliminate the problem over time.:(a) If problem is structural: Target for operating margins of stable firms in the sector.(b) If problem is leverage: Target for a debt ratio that the firm will be comfortable with by end of period, which could be its own optimal or the industry average.(c) If problem is operating: Target for an industry-average operating margin.
If firm’s size has notchanged significantlyover time
Average DollarEarnings (Net Income if Equity and EBIT if Firm made bythe firm over time
If firm’s size has changedover time
Use firm’s average ROE (if valuing equity) or average ROC (if valuing firm) on current BV of equity (if ROE) or current BV of capital (if ROC)

Aswath Damodaran 71
1. If the earnings decline or increase istemporary and will be quickly reversed…
Normalize
You can normalize earnings in three ways:• Company’s history: Averaging earnings or operating margins over time
and estimating a normalized earning for the base year• Industry average: You can apply the average operating margin for the
industry to the company’s revenues this year to get a normalized earnings.• Normalized prices: If your company is a commodity company, you can
normalize the price of the commodity across a cycle and apply it to theproduction in the current year.

Aswath Damodaran 72
Aracruz in 2001: The Effect of CommodityPrices

Aswath Damodaran 73
Normalizing Earnings
Revenues Operating Income Operating Margin Price of pulp
1991 $131.19 $19.54 14.89% 100
1992 $447.84 $125.45 28.01% 113.18
1993 $301.93 -$34.86 -11.55% 102.89
1994 $614.05 $131.34 21.39% 112.54
1995 $703.00 $271.00 38.55% 98.71
1996 $493.00 $15.00 3.04% 94.86
1997 $536.83 $39.12 7.29% 92.93
1998 $535.98 -$4.93 -0.92% 99.20
1999 $989.75 $403.35 40.75% 102.09
2000 $1,342.35 $665.85 49.60% 109.39
Normalized 2000 $1,342.35 $324.59 24.18%
Normalized 2000 $1,258.78 $582.28 102.58
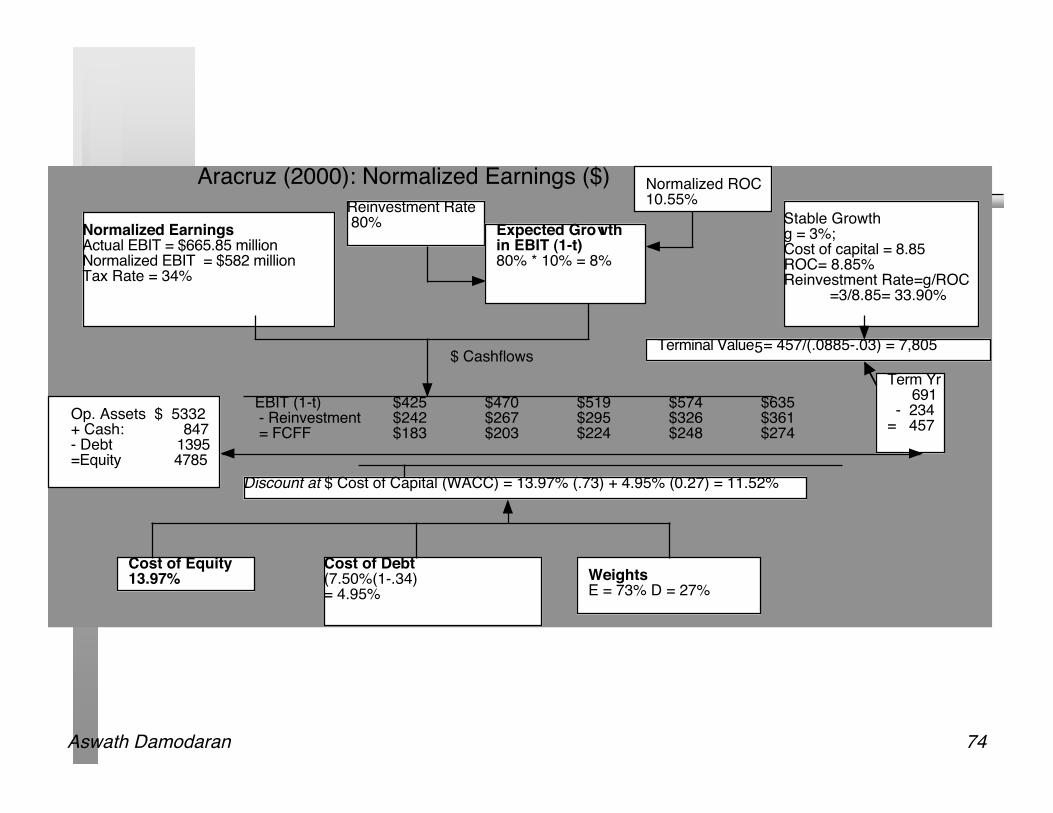
Aswath Damodaran 74
Normalized Earnings Actual EBIT = $665.85 millionNormalized EBIT = $582 millionTax Rate = 34%
Expected Growth in EBIT (1-t)80% * 10% = 8%
Stable Growthg = 3%; Cost of capital = 8.85 ROC= 8.85%Reinvestment Rate=g/ROC
=3/8.85= 33.90%
Terminal Value5= 457/(.0885-.03) = 7,805
Cost of Equity13.97%
Cost of Debt(7.50%(1-.34)= 4.95%
WeightsE = 73% D = 27%
Discount at $ Cost of Capital (WACC) = 13.97% (.73) + 4.95% (0.27) = 11.52%
Op. Assets $ 5332+ Cash: 847- Debt 1395=Equity 4785
Aracruz (2000): Normalized Earnings ($) Reinvestment Rate 80%
Normalized ROC10.55%
Term Yr 691 - 234= 457
$ Cashflows
EBIT (1-t) $425 $470 $519 $574 $635 - Reinvestment $242 $267 $295 $326 $361 = FCFF $183 $203 $224 $248 $274

Aswath Damodaran 75
2. If the earnings are negative because thefirm is early in its life cycle…
When operating income is negative or margins are expected to changeover time, we use a three step process to estimate growth:• Estimate growth rates in revenues over time
– Use historical revenue growth to get estimates of revenue growth in the nearfuture
– Decrease the growth rate as the firm becomes larger– Keep track of absolute revenues to make sure that the growth is feasible
• Estimate expected operating margins each year– Set a target margin that the firm will move towards– Adjust the current margin towards the target margin
• Estimate the capital that needs to be invested to generate revenue growthand expected margins
– Estimate a sales to capital ratio that you will use to generate reinvestmentneeds each year.
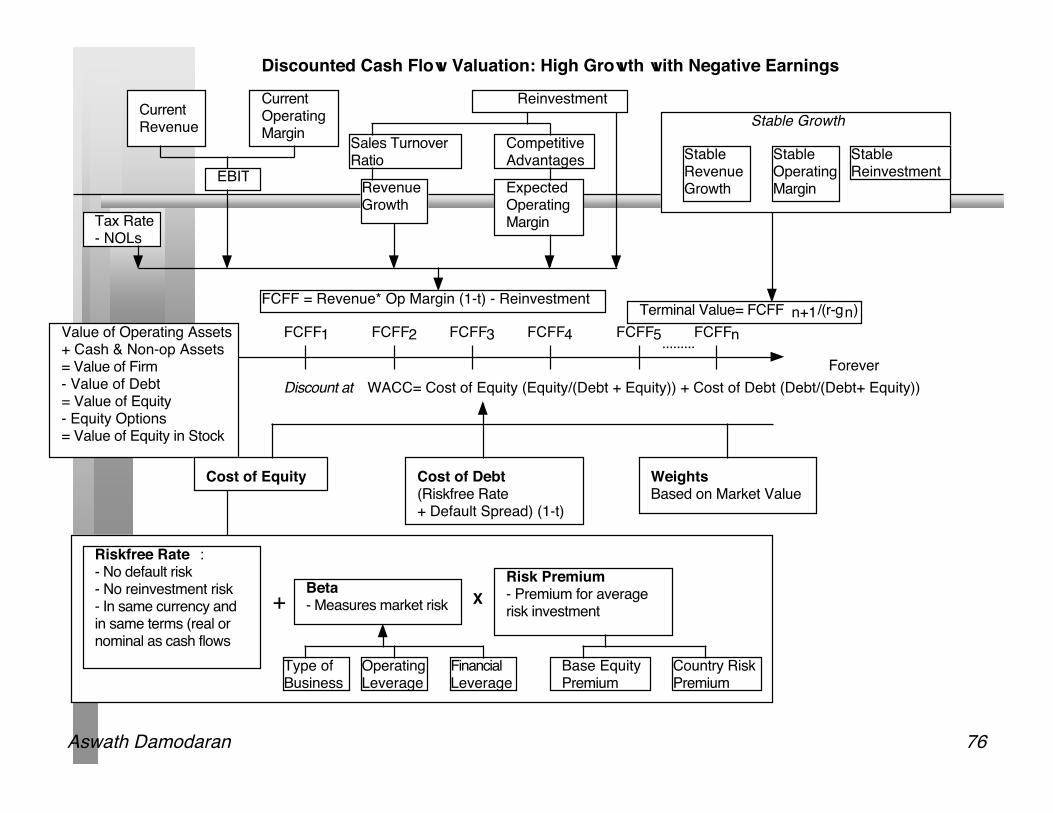
Aswath Damodaran 76
FCFF1 FCFF2 FCFF3 FCFF4 FCFF5
Forever
Terminal Value= FCFF n+1/(r-gn)
FCFFn.........
Cost of Equity Cost of Debt(Riskfree Rate+ Default Spread) (1-t)
WeightsBased on Market Value
Discount at WACC= Cost of Equity (Equity/(Debt + Equity)) + Cost of Debt (Debt/(Debt+ Equity))
Value of Operating Assets+ Cash & Non-op Assets= Value of Firm- Value of Debt= Value of Equity- Equity Options= Value of Equity in Stock
Riskfree Rate :- No default risk- No reinvestment risk- In same currency andin same terms (real or nominal as cash flows
+Beta- Measures market risk X
Risk Premium- Premium for averagerisk investment
Type of Business
Operating Leverage
FinancialLeverage
Base EquityPremium
Country RiskPremium
CurrentRevenue
CurrentOperatingMargin
Reinvestment
Sales TurnoverRatio
CompetitiveAdvantages
Revenue Growth
Expected Operating Margin
Stable Growth
StableRevenueGrowth
StableOperatingMargin
StableReinvestment
Discounted Cash Flow Valuation: High Growth with Negative Earnings
EBIT
Tax Rate- NOLs
FCFF = Revenue* Op Margin (1-t) - Reinvestment

Aswath Damodaran 77
Forever
Terminal Value= 1881/(.0961-.06)=52,148
Cost of Equity12.90%
Cost of Debt6.5%+1.5%=8.0%Tax rate = 0% -> 35%
WeightsDebt= 1.2% -> 15%
Value of Op Assets $ 14,910+ Cash $ 26= Value of Firm $14,936- Value of Debt $ 349= Value of Equity $14,587- Equity Options $ 2,892Value per share $ 34.32
Riskfree Rate :T. Bond rate = 6.5%
+Beta1.60 -> 1.00 X
Risk Premium4%
Internet/Retail
Operating Leverage
Current D/E: 1.21%
Base EquityPremium
Country RiskPremium
CurrentRevenue$ 1,117
CurrentMargin:-36.71%
Reinvestment:Cap ex includes acquisitionsWorking capital is 3% of revenues
Sales TurnoverRatio: 3.00
CompetitiveAdvantages
Revenue Growth:42%
Expected Margin: -> 10.00%
Stable Growth
StableRevenueGrowth: 6%
StableOperatingMargin: 10.00%
Stable ROC=20%Reinvest 30% of EBIT(1-t)
EBIT-410m
NOL:500 m
$41,346
10.00%
35.00%
$2,688
$ 807
$1,881
Term. Year
2 431 5 6 8 9 107
Cost of Equity 12.90% 12.90% 12.90% 12.90% 12.90% 12.42% 12.30% 12.10% 11.70% 10.50%
Cost of Debt 8.00% 8.00% 8.00% 8.00% 8.00% 7.80% 7.75% 7.67% 7.50% 7.00%
AT cost of debt 8.00% 8.00% 8.00% 6.71% 5.20% 5.07% 5.04% 4.98% 4.88% 4.55%
Cost of Capital 12.84% 12.84% 12.84% 12.83% 12.81% 12.13% 11.96% 11.69% 11.15% 9.61%
Revenues $2,793 5,585 9,774 14,661 19,059 23,862 28,729 33,211 36,798 39,006
EBIT -$373 -$94 $407 $1,038 $1,628 $2,212 $2,768 $3,261 $3,646 $3,883
EBIT (1-t) -$373 -$94 $407 $871 $1,058 $1,438 $1,799 $2,119 $2,370 $2,524
- Reinvestment $559 $931 $1,396 $1,629 $1,466 $1,601 $1,623 $1,494 $1,196 $736
FCFF -$931 -$1,024 -$989 -$758 -$408 -$163 $177 $625 $1,174 $1,788
Amazon.comJanuary 2000Stock Price = $ 84

Aswath Damodaran 78
3. If earnings are negative because the firmhas structural/ leverage problems…
Survival Scenario: The firm survives and solves its structural problem(brings down its financial leverage). In this scenario, margins improveand the debt ratio returns to a sustainable level.
Failure Scenario: The firm does not solve its structural problems orfails to make debt payments, leading to default and liquidation.
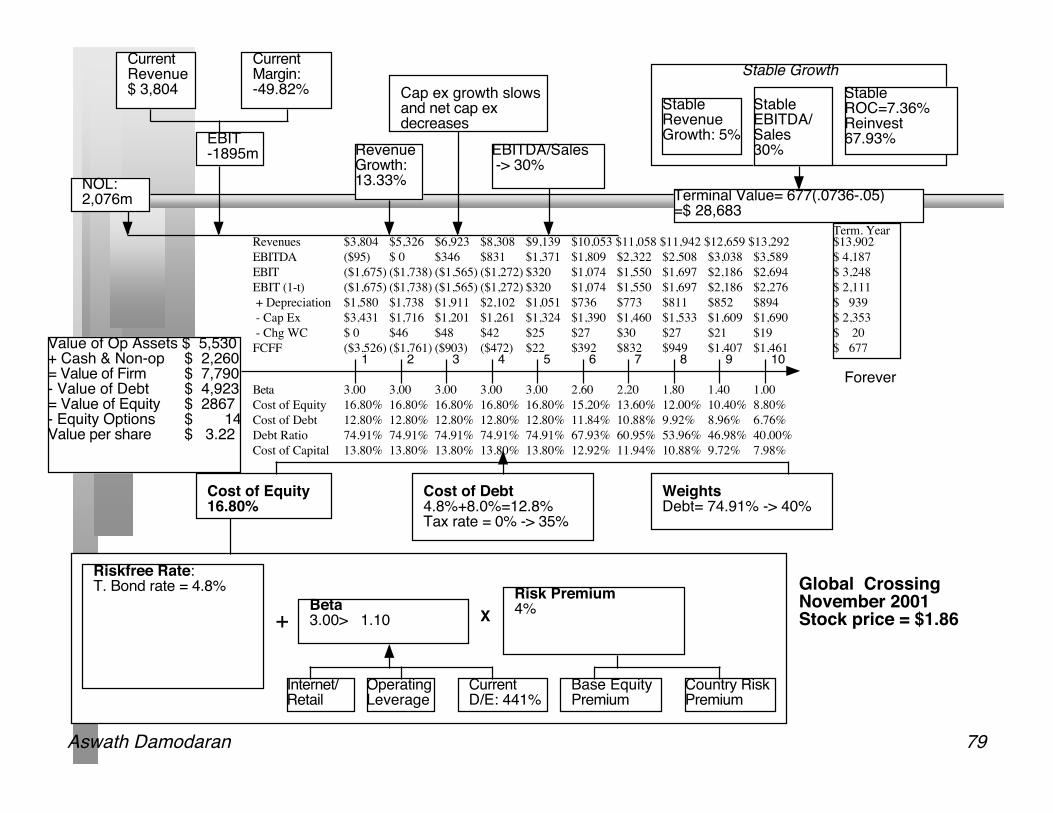
Aswath Damodaran 79
Forever
Terminal Value= 677(.0736-.05)=$ 28,683
Cost of Equity16.80%
Cost of Debt4.8%+8.0%=12.8%Tax rate = 0% -> 35%
WeightsDebt= 74.91% -> 40%
Value of Op Assets $ 5,530+ Cash & Non-op $ 2,260= Value of Firm $ 7,790- Value of Debt $ 4,923= Value of Equity $ 2867- Equity Options $ 14Value per share $ 3.22
Riskfree Rate:T. Bond rate = 4.8%
+Beta3.00> 1.10 X
Risk Premium4%
Internet/Retail
Operating Leverage
Current D/E: 441%
Base EquityPremium
Country RiskPremium
CurrentRevenue$ 3,804
CurrentMargin:-49.82%
Revenue Growth:13.33%
EBITDA/Sales -> 30%
Stable Growth
StableRevenueGrowth: 5%
StableEBITDA/Sales 30%
Stable ROC=7.36%Reinvest 67.93% EBIT
-1895m
NOL:2,076m
$13,902
$ 4,187
$ 3,248
$ 2,111
$ 939
$ 2,353
$ 20
$ 677
Term. Year
2 431 5 6 8 9 107
Global CrossingNovember 2001Stock price = $1.86
Cap ex growth slows and net cap ex decreases
Beta 3.00 3.00 3.00 3.00 3.00 2.60 2.20 1.80 1.40 1.00
Cost of Equity 16.80% 16.80% 16.80% 16.80% 16.80% 15.20% 13.60% 12.00% 10.40% 8.80%
Cost of Debt 12.80% 12.80% 12.80% 12.80% 12.80% 11.84% 10.88% 9.92% 8.96% 6.76%
Debt Ratio 74.91% 74.91% 74.91% 74.91% 74.91% 67.93% 60.95% 53.96% 46.98% 40.00%
Cost of Capital 13.80% 13.80% 13.80% 13.80% 13.80% 12.92% 11.94% 10.88% 9.72% 7.98%
Revenues $3,804 $5,326 $6,923 $8,308 $9,139 $10,053 $11,058 $11,942 $12,659 $13,292
EBITDA ($95) $ 0 $346 $831 $1,371 $1,809 $2,322 $2,508 $3,038 $3,589
EBIT ($1,675) ($1,738) ($1,565) ($1,272) $320 $1,074 $1,550 $1,697 $2,186 $2,694
EBIT (1-t) ($1,675) ($1,738) ($1,565) ($1,272) $320 $1,074 $1,550 $1,697 $2,186 $2,276
+ Depreciation $1,580 $1,738 $1,911 $2,102 $1,051 $736 $773 $811 $852 $894
- Cap Ex $3,431 $1,716 $1,201 $1,261 $1,324 $1,390 $1,460 $1,533 $1,609 $1,690
- Chg WC $ 0 $46 $48 $42 $25 $27 $30 $27 $21 $19
FCFF ($3,526) ($1,761) ($903) ($472) $22 $392 $832 $949 $1,407 $1,461
Aswath Damodaran 80
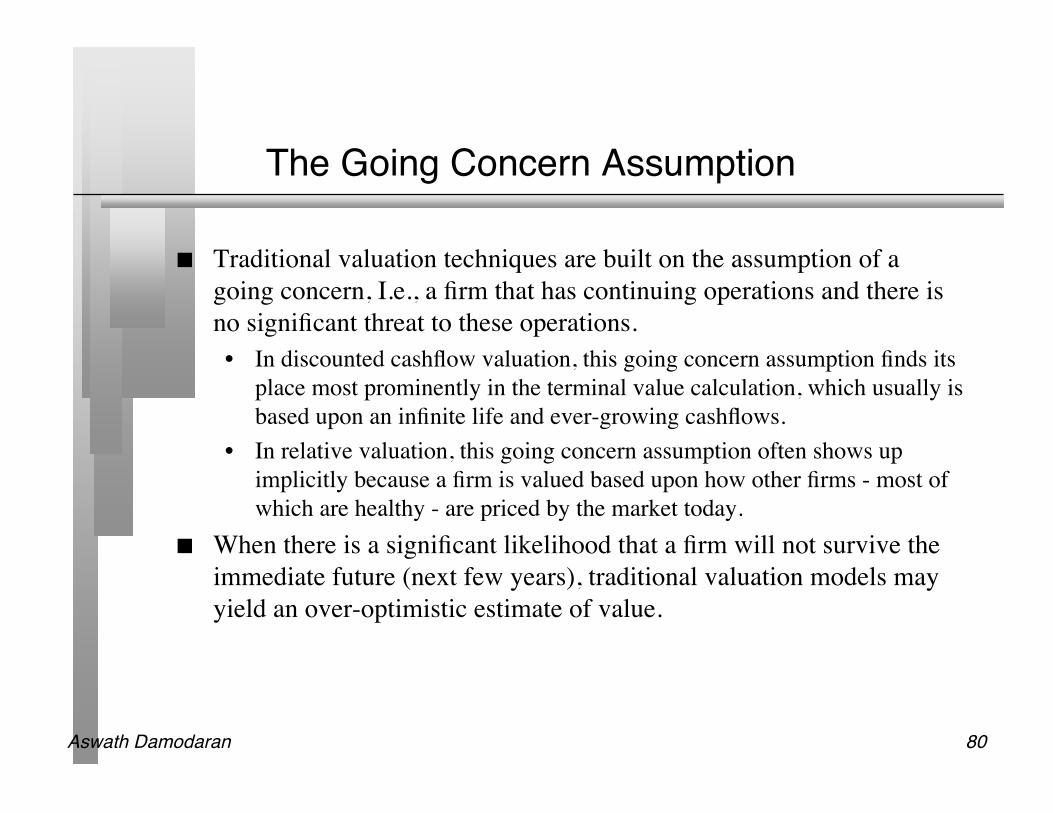
The Going Concern Assumption
Traditional valuation techniques are built on the assumption of agoing concern, I.e., a firm that has continuing operations and there isno significant threat to these operations.• In discounted cashflow valuation, this going concern assumption finds its
place most prominently in the terminal value calculation, which usually isbased upon an infinite life and ever-growing cashflows.
• In relative valuation, this going concern assumption often shows upimplicitly because a firm is valued based upon how other firms - most ofwhich are healthy - are priced by the market today.
When there is a significant likelihood that a firm will not survive theimmediate future (next few years), traditional valuation models mayyield an over-optimistic estimate of value.

Aswath Damodaran 81
DCF Valuation + Distress Value
A DCF valuation values a firm as a going concern. If there is asignificant likelihood of the firm failing before it reaches stablegrowth and if the assets will then be sold for a value less than thepresent value of the expected cashflows (a distress sale value), DCFvaluations will understate the value of the firm.
Value of Equity= DCF value of equity (1 - Probability of distress) +Distress sale value of equity (Probability of distress)

Aswath Damodaran 82
Bond Price to estimate probability of distress
Global Crossing has a 12% coupon bond with 8 years to maturity trading at $ 653. Toestimate the probability of default (with a treasury bond rate of 5% used as the riskfreerate):
Solving for the probability of bankruptcy, we get• With a 10-year bond, it is a process of trial and error to estimate this value. The solver
function in excel accomplishes the same in far less time.πDistress = Annual probability of default = 13.53%
To estimate the cumulative probability of distress over 10 years: Cumulative probability of surviving 10 years = (1 - .1353)10 = 23.37% Cumulative probability of distress over 10 years = 1 - .2337 = .7663 or 76.63%
!
653 =120(1"#
Distress)t
(1.05)t
t=1
t= 8
$ +1000(1"#
Distress)8
(1.05)N

Aswath Damodaran 83
Valuing Global Crossing with Distress
Probability of distress• Cumulative probability of distress = 76.63%
Distress sale value of equity• Book value of capital = $14,531 million• Distress sale value = 25% of book value = .25*14531 = $3,633 million• Book value of debt = $7,647 million• Distress sale value of equity = $ 0
Distress adjusted value of equity• Value of Global Crossing = $3.22 (1-.7663) + $0.00 (.7663) = $ 0.75

Aswath Damodaran 84
Real Options: Fact and Fantasy
Aswath Damodaran

Aswath Damodaran 85
Underlying Theme: Searching for an ElusivePremium
Traditional discounted cashflow models under estimate the value ofinvestments, where there are options embedded in the investments to• Delay or defer making the investment (delay)• Adjust or alter production schedules as price changes (flexibility)• Expand into new markets or products at later stages in the process, based
upon observing favorable outcomes at the early stages (expansion)• Stop production or abandon investments if the outcomes are unfavorable
at early stages (abandonment) Put another way, real option advocates believe that you should be
paying a premium on discounted cashflow value estimates.

Aswath Damodaran 86
Three Basic Questions
When is there a real option embedded in a decision or an asset? When does that real option have significant economic value? Can that value be estimated using an option pricing model?

Aswath Damodaran 87
When is there an option embedded in anaction?
An option provides the holder with the right to buy or sell a specifiedquantity of an underlying asset at a fixed price (called a strike price oran exercise price) at or before the expiration date of the option.
There has to be a clearly defined underlying asset whose valuechanges over time in unpredictable ways.
The payoffs on this asset (real option) have to be contingent on anspecified event occurring within a finite period.

Aswath Damodaran 88
Payoff Diagram on a Call
Price of underlying asset
StrikePrice
Net Payoff on Call

Aswath Damodaran 89
Example 1: Product Patent as an Option
Present Value of Expected Cash Flows on Product
PV of Cash Flows from Project
Initial Investment in Project
Project has negativeNPV in this section
Project's NPV turns positive in this section

Aswath Damodaran 90
Example 2: Undeveloped Oil Reserve as anoption
Value of estimated reserveof natural resource
Net Payoff onExtraction
Cost of Developing Reserve

Aswath Damodaran 91
Example 3: Expansion of existing project as anoption
Present Value of Expected Cash Flows on Expansion
PV of Cash Flows from Expansion
Additional Investment to Expand
Firm will not expand inthis section
Expansion becomes attractive in this section

Aswath Damodaran 92
When does the option have significanteconomic value?
For an option to have significant economic value, there has to be arestriction on competition in the event of the contingency. In aperfectly competitive product market, no contingency, no matter howpositive, will generate positive net present value.
At the limit, real options are most valuable when you have exclusivity- you and only you can take advantage of the contingency. Theybecome less valuable as the barriers to competition become less steep.

Aswath Damodaran 93
Exclusivity: Putting Real Options to the Test
Product Options: Patent on a drug• Patents restrict competitors from developing similar products• Patents do not restrict competitors from developing other products to treat
the same disease. Natural Resource options: An undeveloped oil reserve or gold mine.
• Natural resource reserves are limited.• It takes time and resources to develop new reserves
Growth Options: Expansion into a new product or market• Barriers may range from strong (exclusive licenses granted by the
government - as in telecom businesses) to weaker (brand name,knowledge of the market) to weakest (first mover).

Aswath Damodaran 94
Determinants of option value
Variables Relating to Underlying Asset• Value of Underlying Asset; as this value increases, the right to buy at a fixed price
(calls) will become more valuable and the right to sell at a fixed price (puts) willbecome less valuable.
• Variance in that value; as the variance increases, both calls and puts will becomemore valuable because all options have limited downside and depend upon pricevolatility for upside.
• Expected dividends on the asset, which are likely to reduce the price appreciationcomponent of the asset, reducing the value of calls and increasing the value of puts.
Variables Relating to Option• Strike Price of Options; the right to buy (sell) at a fixed price becomes more (less)
valuable at a lower price.• Life of the Option; both calls and puts benefit from a longer life.
Level of Interest Rates; as rates increase, the right to buy (sell) at a fixed pricein the future becomes more (less) valuable.

Aswath Damodaran 95
When can you use option pricing models tovalue real options?
All option pricing models rest on two foundations.• The first is the notion of a replicating portfolio where you combine the underlying
asset and borrowing/lending to create a portfolio that has the same cashflows as theoption.
• The second is arbitrage. Since both the option and the replicating portfolio havethe same cashflows, they should trade at the same value.
As a result, option pricing models work best when• The underlying asset is traded - this yield not only observable prices and volatility
as inputs to option pricing models but allows for the possibility of creatingreplicating portfolios
• An active marketplace exists for the option itself. When option pricing models are used to value real assets where neither
replication nor arbitrage are usually feasible, we have to accept the fact that• The value estimates that emerge will be far more imprecise.• The value can deviate much more dramatically from market price because of the
difficulty of arbitrage.

Aswath Damodaran 96
Illustrating Replication: The Binomial OptionPricing Model
50
70
35
100
50
25
K = $ 40t = 2r = 11%
Option Details
StockPrice Call
60
10
0
50 D - 1.11 B = 1025 D - 1.11 B = 0D = 0.4, B = 9.01Call = 0.4 * 35 - 9.01 = 4.99
Call = 4.99
100 D - 1.11 B = 6050 D - 1.11 B = 10D = 1, B = 36.04Call = 1 * 70 - 36.04 = 33.96
Call = 33.9670 D - 1.11 B = 33.9635 D - 1.11 B = 4.99D = 0.8278, B = 21.61Call = 0.8278 * 50 - 21.61 = 19.42
Call = 19.42
Aswath Damodaran 97
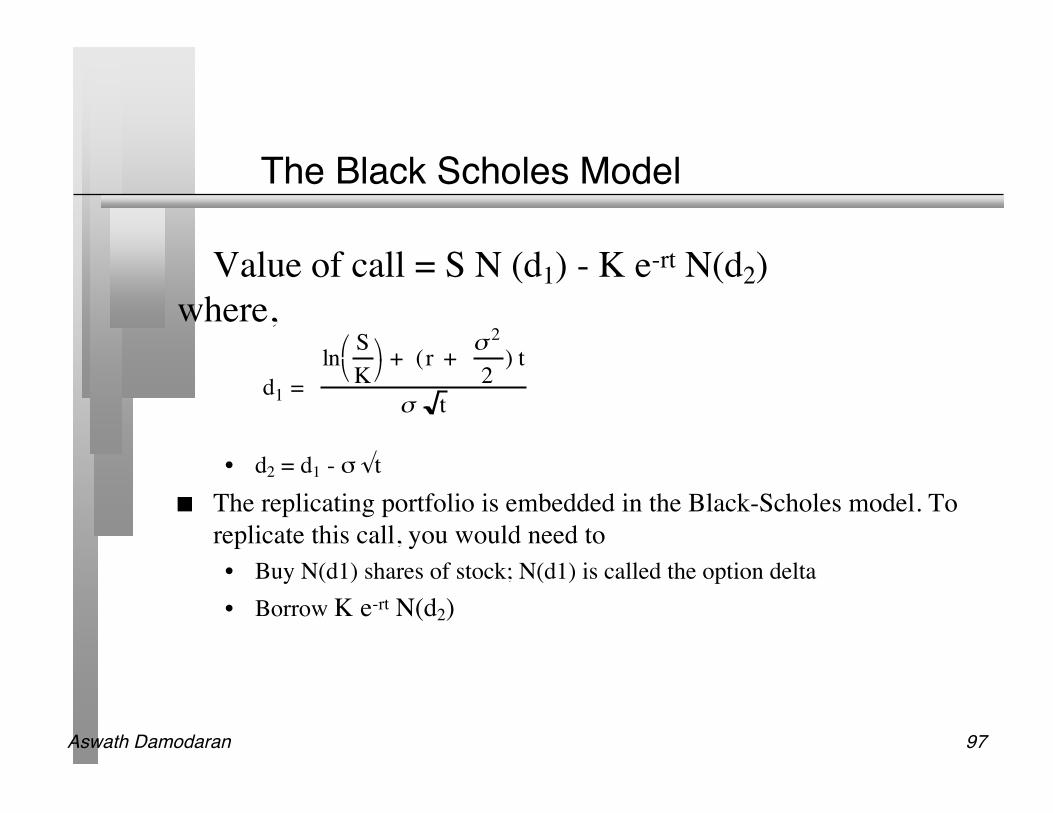
The Black Scholes Model
Value of call = S N (d1) - K e-rt N(d2)where,
• d2 = d1 - σ √t The replicating portfolio is embedded in the Black-Scholes model. To
replicate this call, you would need to• Buy N(d1) shares of stock; N(d1) is called the option delta• Borrow K e-rt N(d2)
d1 =
lnS
K
! "
# $ + (r +
% 2
2) t
% t

Aswath Damodaran 98
The Normal Distributiond N(d) d N(d) d N(d)
-3.00 0.0013 -1.00 0.1587 1.05 0.8531
-2.95 0.0016 -0.95 0.1711 1.10 0.8643
-2.90 0.0019 -0.90 0.1841 1.15 0.8749
-2.85 0.0022 -0.85 0.1977 1.20 0.8849
-2.80 0.0026 -0.80 0.2119 1.25 0.8944
-2.75 0.0030 -0.75 0.2266 1.30 0.9032
-2.70 0.0035 -0.70 0.2420 1.35 0.9115
-2.65 0.0040 -0.65 0.2578 1.40 0.9192
-2.60 0.0047 -0.60 0.2743 1.45 0.9265
-2.55 0.0054 -0.55 0.2912 1.50 0.9332
-2.50 0.0062 -0.50 0.3085 1.55 0.9394
-2.45 0.0071 -0.45 0.3264 1.60 0.9452
-2.40 0.0082 -0.40 0.3446 1.65 0.9505
-2.35 0.0094 -0.35 0.3632 1.70 0.9554
-2.30 0.0107 -0.30 0.3821 1.75 0.9599
-2.25 0.0122 -0.25 0.4013 1.80 0.9641
-2.20 0.0139 -0.20 0.4207 1.85 0.9678
-2.15 0.0158 -0.15 0.4404 1.90 0.9713
-2.10 0.0179 -0.10 0.4602 1.95 0.9744
-2.05 0.0202 -0.05 0.4801 2.00 0.9772
-2.00 0.0228 0.00 0.5000 2.05 0.9798
-1.95 0.0256 0.05 0.5199 2.10 0.9821
-1.90 0.0287 0.10 0.5398 2.15 0.9842
-1.85 0.0322 0.15 0.5596 2.20 0.9861
-1.80 0.0359 0.20 0.5793 2.25 0.9878
-1.75 0.0401 0.25 0.5987 2.30 0.9893
-1.70 0.0446 0.30 0.6179 2.35 0.9906
-1.65 0.0495 0.35 0.6368 2.40 0.9918
-1.60 0.0548 0.40 0.6554 2.45 0.9929
-1.55 0.0606 0.45 0.6736 2.50 0.9938
-1.50 0.0668 0.50 0.6915 2.55 0.9946
-1.45 0.0735 0.55 0.7088 2.60 0.9953
-1.40 0.0808 0.60 0.7257 2.65 0.9960
-1.35 0.0885 0.65 0.7422 2.70 0.9965
-1.30 0.0968 0.70 0.7580 2.75 0.9970
-1.25 0.1056 0.75 0.7734 2.80 0.9974
-1.20 0.1151 0.80 0.7881 2.85 0.9978
-1.15 0.1251 0.85 0.8023 2.90 0.9981
-1.10 0.1357 0.90 0.8159 2.95 0.9984
-1.05 0.1469 0.95 0.8289 3.00 0.9987
-1.00 0.1587 1.00 0.8413
d1
N(d1)

Aswath Damodaran 99
1. Obtaining Inputs for Patent Valuation
Input Estimation Process
1. Value of the Underlying Asset • Present Value of Cash Inflows from taking projectnow
• This will be noisy, but that adds value.
2. Variance in value of underlying asset • Variance in cash flows of similar assets or firms• Variance in present value from capital budgeting
simulation.
3. Exercise Price on Option • Option is exercised when investment is made.• Cost of making investment on the project ; assumed
to be constant in present value dollars.
4. Expiration of the Option • Life of the patent
5. Dividend Yield • Cost of delay• Each year of delay translates into one less year of
value-creating cashflows
Annual cost of delay = 1
n
Aswath Damodaran 100
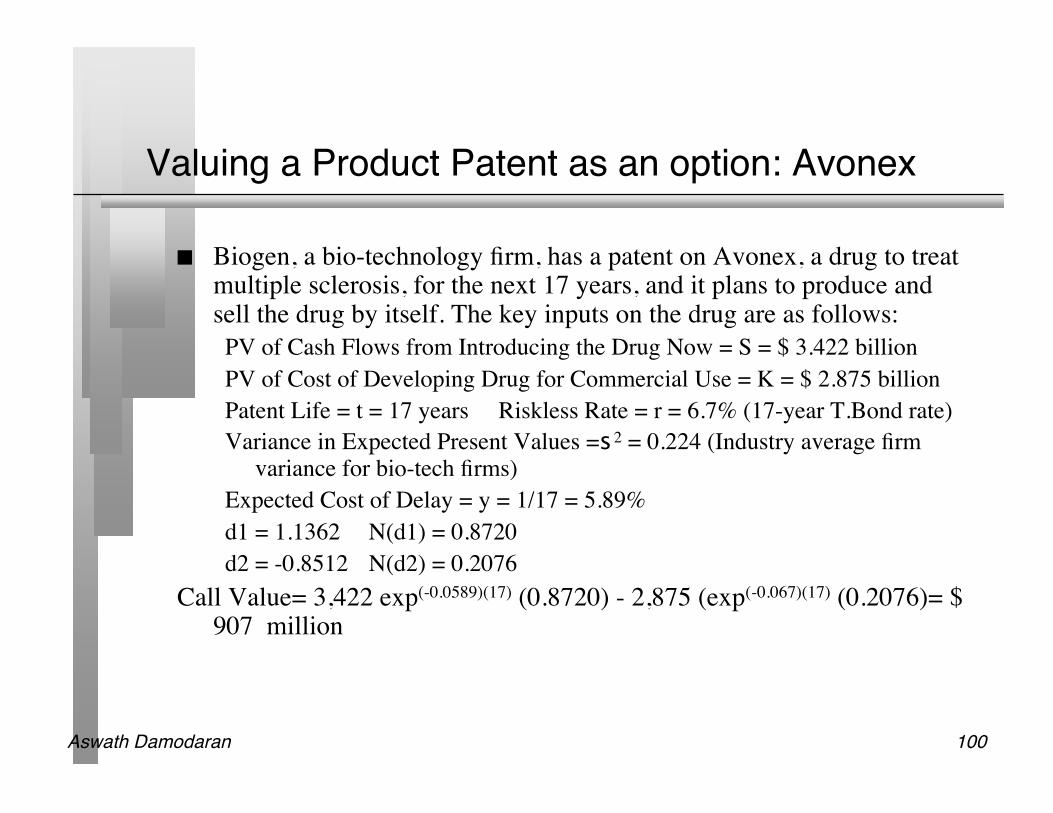
Valuing a Product Patent as an option: Avonex
Biogen, a bio-technology firm, has a patent on Avonex, a drug to treatmultiple sclerosis, for the next 17 years, and it plans to produce andsell the drug by itself. The key inputs on the drug are as follows:PV of Cash Flows from Introducing the Drug Now = S = $ 3.422 billionPV of Cost of Developing Drug for Commercial Use = K = $ 2.875 billionPatent Life = t = 17 years Riskless Rate = r = 6.7% (17-year T.Bond rate)Variance in Expected Present Values =s2 = 0.224 (Industry average firm
variance for bio-tech firms)Expected Cost of Delay = y = 1/17 = 5.89%d1 = 1.1362 N(d1) = 0.8720d2 = -0.8512 N(d2) = 0.2076
Call Value= 3,422 exp(-0.0589)(17) (0.8720) - 2,875 (exp(-0.067)(17) (0.2076)= $907 million

Aswath Damodaran 101
2. Valuing an Oil Reserve
Consider an offshore oil property with an estimated oil reserve of 50million barrels of oil, where the present value of the development costis $12 per barrel and the development lag is two years.
The firm has the rights to exploit this reserve for the next twenty yearsand the marginal value per barrel of oil is $12 per barrel currently(Price per barrel - marginal cost per barrel).
Once developed, the net production revenue each year will be 5% ofthe value of the reserves.
The riskless rate is 8% and the variance in ln(oil prices) is 0.03.

Aswath Damodaran 102
Valuing an oil reserve as a real option
Current Value of the asset = S = Value of the developed reservediscounted back the length of the development lag at the dividendyield = $12 * 50 /(1.05)2 = $ 544.22
(If development is started today, the oil will not be available for saleuntil two years from now. The estimated opportunity cost of thisdelay is the lost production revenue over the delay period. Hence, thediscounting of the reserve back at the dividend yield)
Exercise Price = Present Value of development cost = $12 * 50 =$600 million
Time to expiration on the option = 20 years Variance in the value of the underlying asset = 0.03 Riskless rate =8% Dividend Yield = Net production revenue / Value of reserve = 5%
Aswath Damodaran 103
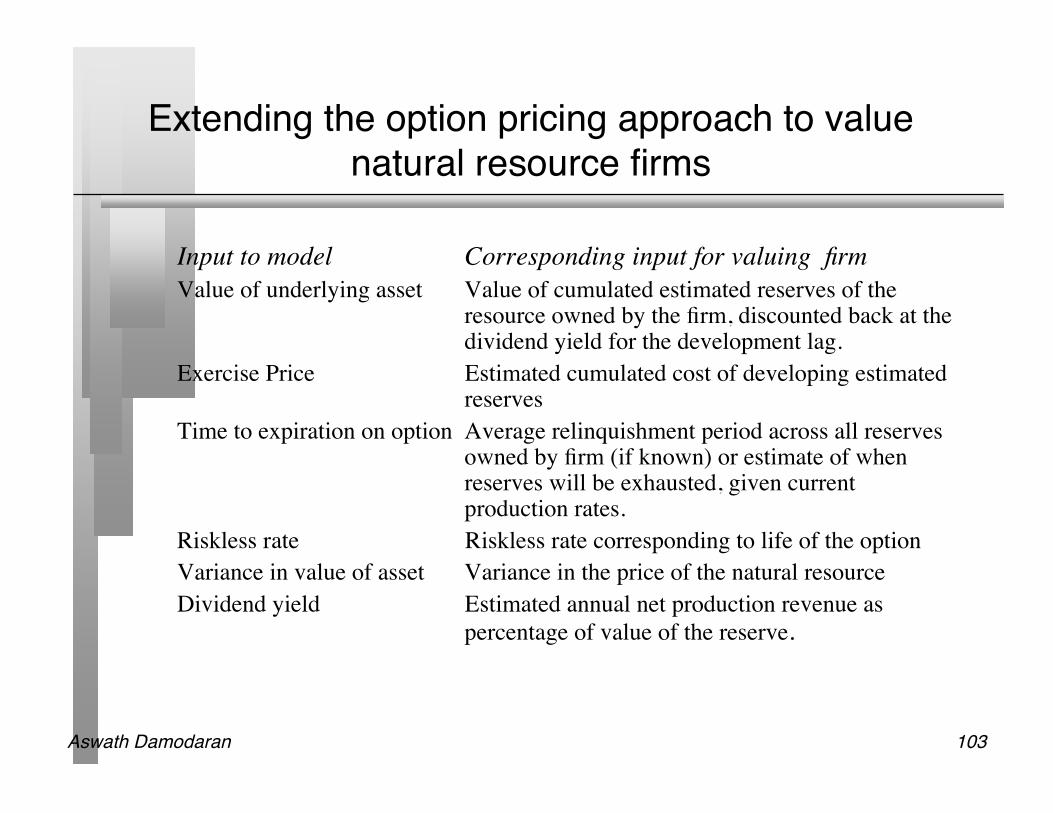
Extending the option pricing approach to valuenatural resource firms
Input to model Corresponding input for valuing firmValue of underlying asset Value of cumulated estimated reserves of the
resource owned by the firm, discounted back at thedividend yield for the development lag.
Exercise Price Estimated cumulated cost of developing estimatedreserves
Time to expiration on option Average relinquishment period across all reservesowned by firm (if known) or estimate of when reserves will be exhausted, given current production rates.
Riskless rate Riskless rate corresponding to life of the optionVariance in value of asset Variance in the price of the natural resourceDividend yield Estimated annual net production revenue as
percentage of value of the reserve.

Aswath Damodaran 104
Valuing Gulf Oil
Gulf Oil was the target of a takeover in early 1984 at $70 per share (Ithad 165.30 million shares outstanding, and total debt of $9.9 billion).• It had estimated reserves of 3038 million barrels of oil and the average
cost of developing these reserves was estimated to be $10 a barrel inpresent value dollars (The development lag is approximately two years).
• The average relinquishment life of the reserves is 12 years.• The price of oil was $22.38 per barrel, and the production cost, taxes and
royalties were estimated at $7 per barrel.• The bond rate at the time of the analysis was 9.00%.• Gulf was expected to have net production revenues each year of
approximately 5% of the value of the developed reserves. The variance inoil prices is 0.03.

Aswath Damodaran 105
Valuing Undeveloped Reserves
Inputs for valuing undeveloped reserves• Value of underlying asset = Value of estimated reserves discounted back for period
of development lag= 3038 * ($ 22.38 - $7) / 1.052 = $42,380.44• Exercise price = Estimated development cost of reserves = 3038 * $10 = $30,380
million• Time to expiration = Average length of relinquishment option = 12 years• Variance in value of asset = Variance in oil prices = 0.03• Riskless interest rate = 9%• Dividend yield = Net production revenue/ Value of developed reserves = 5%
Based upon these inputs, the Black-Scholes model provides the followingvalue for the call:
d1 = 1.6548 N(d1) = 0.9510d2 = 1.0548 N(d2) = 0.8542
Call Value= 42,380.44 exp(-0.05)(12) (0.9510) -30,380 (exp(-0.09)(12) (0.8542)= $13,306 million

Aswath Damodaran 106
Valuing Gulf Oil
In addition, Gulf Oil had free cashflows to the firm from its oil and gas production of$915 million from already developed reserves and these cashflows are likely to continuefor ten years (the remaining lifetime of developed reserves).
The present value of these developed reserves, discounted at the weighted average costof capital of 12.5%, yields:
• Value of already developed reserves = 915 (1 - 1.125-10)/.125 = $5065.83 Adding the value of the developed and undeveloped reserves
Value of undeveloped reserves = $ 13,306 millionValue of production in place = $ 5,066 millionTotal value of firm = $ 18,372 millionLess Outstanding Debt = $ 9,900 millionValue of Equity = $ 8,472 millionValue per share = $ 8,472/165.3 = $51.25

Aswath Damodaran 107
3. An Example of an Expansion Option
Ambev is considering introducing a soft drink to the U.S. market. Thedrink will initially be introduced only in the metropolitan areas of theU.S. and the cost of this “limited introduction” is $ 500 million.
A financial analysis of the cash flows from this investment suggeststhat the present value of the cash flows from this investment toAmbev will be only $ 400 million. Thus, by itself, the new investmenthas a negative NPV of $ 100 million.
If the initial introduction works out well, Ambev could go aheadwith a full-scale introduction to the entire market with anadditional investment of $ 1 billion any time over the next 5 years.While the current expectation is that the cash flows from having thisinvestment is only $ 750 million, there is considerable uncertaintyabout both the potential for the drink, leading to significant variancein this estimate.

Aswath Damodaran 108
Valuing the Expansion Option
Value of the Underlying Asset (S) = PV of Cash Flows fromExpansion to entire U.S. market, if done now =$ 750 Million
Strike Price (K) = Cost of Expansion into entire U.S market = $ 1000Million
We estimate the standard deviation in the estimate of the project valueby using the annualized standard deviation in firm value of publiclytraded firms in the beverage markets, which is approximately 34.25%.• Standard Deviation in Underlying Asset’s Value = 34.25%
Time to expiration = Period for which expansion option applies = 5years
Call Value= $ 234 Million

Aswath Damodaran 109
Opportunities and not Options…

Aswath Damodaran 110
Key Tests for Real Options
Is there an option embedded in this asset/ decision?• Can you identify the underlying asset?• Can you specify the contigency under which you will get payoff?
Is there exclusivity?• If yes, there is option value.• If no, there is none.• If in between, you have to scale value.
Can you use an option pricing model to value the real option?• Is the underlying asset traded?• Can the option be bought and sold?• Is the cost of exercising the option known and clear?