value focused management (vfm): capitalizing on the potential of
TRANSCRIPT
Value Focused Management (VFM):
Capitalizing on the Potential of Managerial
Value Drivers
Boaz RONEN1,a
, Zvi LIEBERb
and Nitza GERIc
a
Faculty of Management, Tel Aviv University, Ramat Aviv, Tel Aviv 69978, Israel
Phone: +972-3-6441181, Fax: +972-3-6441267, Email: [email protected]
b
Faculty of Management, Tel Aviv University, Ramat Aviv, Tel Aviv 69978, Israel
Phone: +972-3-6441181, Fax: +972-3-6441267, Email: [email protected]
c
The Department of Management and Economics, The Open University of Israel,
108 Ravutski Street, P. O. Box 808, Raanana 43107, Israel
Phone: +972-9-7781911, Fax: +972-9-7780668, Email: [email protected]
Abstract. The goal of the firm is to maximize shareholder value. While most firms
devote their main efforts to exploit financial value drivers such as mergers and ac-
quisitions, not enough attention is being paid to managerial value drivers like re-
ducing time to market, increasing throughput, or improving logistics, operations
and supply chain management, although these managerial drivers have a much
greater potential for value creation. This paper focuses on managerial value drivers
and presents Value Focused Management (VFM), which is a methodology for en-
hancing the organization value by identifying its value drivers, quantifying their
estimated contribution, and prioritizing them according to their relative value crea-
tion potential and difficulty of implementation. VFM combines Value Based Man-
agement (VBM) with the Theory of Constraints (TOC) along with practices such
as the focusing matrix, and provides managers with a structured process that in-
cludes a focused diagnosis of the organization, followed by a comprehensive im-
plementation plan which helps them direct their efforts towards the most promis-
ing value drivers. VFM has been successfully implemented in dozens of organiza-
tions worldwide. This paper analyzes a case study of a supermarket chain which
demonstrates VFM’s potential as an effective practical methodology to guide
companies in their ongoing quest to increase shareholder value.
Keywords. Value Focused Management (VFM), Value Based Management
(VBM), Theory of Constraints (TOC), Shareholder Value, Performance Measure-
ment
1. Introduction
The goal of the firm is to maximize shareholder value (Copeland et al., 1996; Pitman,
2003; Sundaram & Inkpen, 2004). Therefore, management should focus on value crea-
tion by exploiting the firm’s value drivers. A value driver is any important factor that
significantly affects the value of the firm (Amit & Zott, 2001). There are two main
sorts of value drivers: financial and non-financial which are also termed managerial
1
Corresponding author.
Advances in Multiple Criteria Decision Making and Human Systems ManagementY. Shi et al. (Eds.)IOS Press, 2007© 2007 The authors. All rights reserved.
149

value drivers. Financial value drivers include actions such as capital structure changes,
mergers and acquisitions, public offering or dividend distribution. These financial ac-
tivities are performed by top management, and usually their impact on shareholder
value can be evaluated ex-ante as well as ex-post. Managerial value drivers include
actions like strategic changes, reducing time to market, increasing throughput, or im-
proving logistics, operations and supply chain management. While most firms devote
their main efforts to exploit financial value drivers, not enough attention is being paid
to managerial value drivers, although they have a much greater potential for value crea-
tion.
This paper focuses on managerial value drivers since they are generally disre-
garded in both research and practice, and presents an effective methodology for capital-
izing on the considerable potential of these underutilized value drivers. While the goal
of the firm seems clear, the challenges that organizations face are: how to measure
value creation, and how to ensure that all the decisions are made according to their im-
pact on value? In this aspect, managerial value drivers are much harder to manage and
measure than the financial ones. The financial management and operations manage-
ment fields provide organizations with various approaches to cope with these chal-
lenges. The financial approach which is most identified with value creation is value
based management (VBM) (Copeland et al., 1996). Another performance measurement
approach that attracted much interest in recent years is Economic Value Added
(EVA®) (Stewart, 1992), which is sometimes used together with VBM. Whereas these
two approaches answer the issue of value creation measurement, they do not provide
organizations with a satisfactory practical mechanism to ensure that all the decisions
are made according to their impact on value (Malmi & Ikaheimo, 2003).
From the operations management perspective, the Theory of Constraints (TOC) as-
serts that the goal of the firm is “to make more money now and in the future” (Goldratt
& Cox, 1986). TOC offers a process that leads organizations towards fulfilling this goal
and provides a set of performance measures to support decision making. Although
TOC enhances value creating actions, it is not explicitly connected to financial per-
formance measures such as EVA® and other VBM measures. Hence, it may be hard to
evaluate the impact of these actions on value creation. Moreover, if management has to
choose between several alternatives, TOC lacks a tool to evaluate the relative potential
long-term impact of each action.
In light of the advantages and drawbacks of the abovementioned approaches, man-
agers need a focused methodology that will integrate the advantages of VBM and TOC,
provide a common language across all functional areas and align all the organizational
decision making with the goal.
This paper suggests value focused management (VFM), as a methodology for en-
hancing the organization value by identifying its value drivers, quantifying their esti-
mated contribution, and prioritizing them according to their relative value creation po-
tential and difficulty of implementation. The next section presents the theoretical basis
of VFM which combines VBM with TOC along with practices such as the focusing
matrix, and reviews the relevant literature.
The third section introduces the VFM methodology. The fourth section analyzes a
case study of a supermarket chain which demonstrates VFM’s potential as an effective
practical value creation methodology. The managerial value drivers which are exam-
ined in the case study are highly relevant to many organizations in the retail industry.
The last sections discuss VFM’s contribution to value creation in light of the case study
analysis, provide implications for implementation and conclude the article.
B. Ronen et al. / Value Focused Management (VFM)150

2. Theoretical Background
2.1. Value Creation from a Financial Management Perspective
Value Based Management is a management approach for measuring and managing
businesses with the explicit objective of creating superior long-term value for share-
holders (Ittner and Larcker, 2001). VBM’s leading principle is that all the decisions at
all organizational levels should be made according to their impact on value (Copeland
et al., 1996). VBM provides managers with two principal tools: the first is discounted
cash flow (DCF) valuation and the second is value driver analysis which helps manag-
ers focus on the key drivers of corporate value.
In the DCF approach, the value of a firm is defined as its future expected cash flow
discounted at a rate which reflects the cash flow risk. Another framework for valuation
is Economic Value Added (Stewart, 1992), which is a version of the residual income
periodic performance measure (Otley, 1999). EVA® is defined as the net operating
profit after tax (NOPAT) less the opportunity cost of the capital used by the business
(Stern and Shiely, 2001). Conceptually, DCF and EVA® are equivalent formulas for
estimating the continuing value of a firm (Copeland et al., 1996). However, EVA® is
useful for evaluating the company’s performance in a single period, such as a year.
Ittner and Larcker (2001) define six basic steps which are usually included in
VBM frameworks:
1. Choosing specific internal objectives that lead to shareholder value enhance-
ment.
2. Selecting strategies and organizational designs consistent with the chosen ob-
jectives.
3. Identifying the specific value drivers.
4. Developing corresponding action plans, selecting performance measures, and
setting targets.
5. Evaluating organizational and managerial performance.
6. Assessing and modifying the organization’s VBM process in light of current
results.
Nevertheless, both DCF and EVA® do not sufficiently support organizational de-
cision making (Malmi & Ikaheimo, 2003). EVA® has two additional drawbacks which
probably hinder its use as a dominant performance measure: its reliance on accounting
data that can be manipulated and its short term focus (O’Hanlon & Peasnell, 1998).
Ittner & Larcker (2001) regard VBM broadly and include the Balanced Scorecard
(BSC) approach (Kaplan & Norton, 1992, 1996) as an integral part of the VBM per-
spective. Since the BSC incorporates non-financial measures, such as customer satis-
faction, it might have been used to identify and evaluate managerial value drivers.
However, the BSC relies on multiple objectives (Otley, 1999), which compete for peo-
ple’s attention and send confusing signals regarding the goal. Hence, the BSC is not
considered as a useful performance measurement framework (Pitman, 2003).
Malmi and Ikaheimo (2003) who studied VBM utilization in six Finnish-based or-
ganizations, observe that VBM does not provide enough practical guidance for decision
making and suggest the following guidelines for improving VBM as a practical man-
agement approach:
• Aim to create shareholder value.
• Identify the value drivers.
B. Ronen et al. / Value Focused Management (VFM) 151

• Connect performance measurement, target setting and rewards to value crea-
tion or value drivers.
• Connect decision making and action planning, both strategic and operational,
to value creation or value drivers.
These Guidelines will be used in Section 5 to evaluate the contribution of value fo-
cused management.
2.2. Value Creation from an Operations Management Perspective
The Theory of Constraints (TOC) (Goldratt and Cox 1986; Goldratt 1994) claims that
the attention of management should be focused on the few constraints which prevent
the organization from achieving its goal. TOC is gaining increasing acceptance among
practitioners as well as academics (Rahman, 1998; Gupta, 2003), and its application
provided thousands of organizations worldwide with significant performance im-
provements, such as increased throughput, reduced inventory levels and shorter lead
time (Mabin & Balderstone, 2000). While reports of successful TOC implementation
are mainly from manufacturing organizations especially aerospace, apparel, automotive,
electronics, furniture, semiconductor, steel and heavy engineering (Mabin & Balder-
stone, 2003), TOC has also been implemented in diverse non-manufacturing industries
including financial institutions (Smith, 2004), enterprise software (Ioannou & Papadoy-
iannis 2004) health services (Ronen et al., 2006) and also in the public sector (Shoe-
maker & Reid, 2005).
Goldratt (1991) initially defined the five focusing steps of TOC for maximizing the
performance of a system (see steps 3–7 below). Ronen and Spector (1992) enhanced
the process by adding two preliminary steps (see steps 1–2 below). These two steps are
particularly important regarding sub-systems such as business units that each one of
them is considered a separate profit center, or in situations of dynamic constraints when
the binding constraint changes over time. Therefore, the seven focusing steps are
(Ronen et al. 2001):
1. Define the system’s goal.
2. Determine global performance measures.
3. Identify the system’s constraints.
4. Decide how to exploit the system’s constraint.
5. Subordinate the system to the constraint.
6. Elevate the system’s constraint.
7. If, in the previous steps, a constraint has been broken, go back to step 3. Do
not let inertia become the system’s constraint.
Value Focused Management (VFM), which is presented in the next section, draws
on TOC in two aspects, first the seven focusing steps serve as a conceptual framework
for VFM and second, the TOC performance measures are used to identify managerial
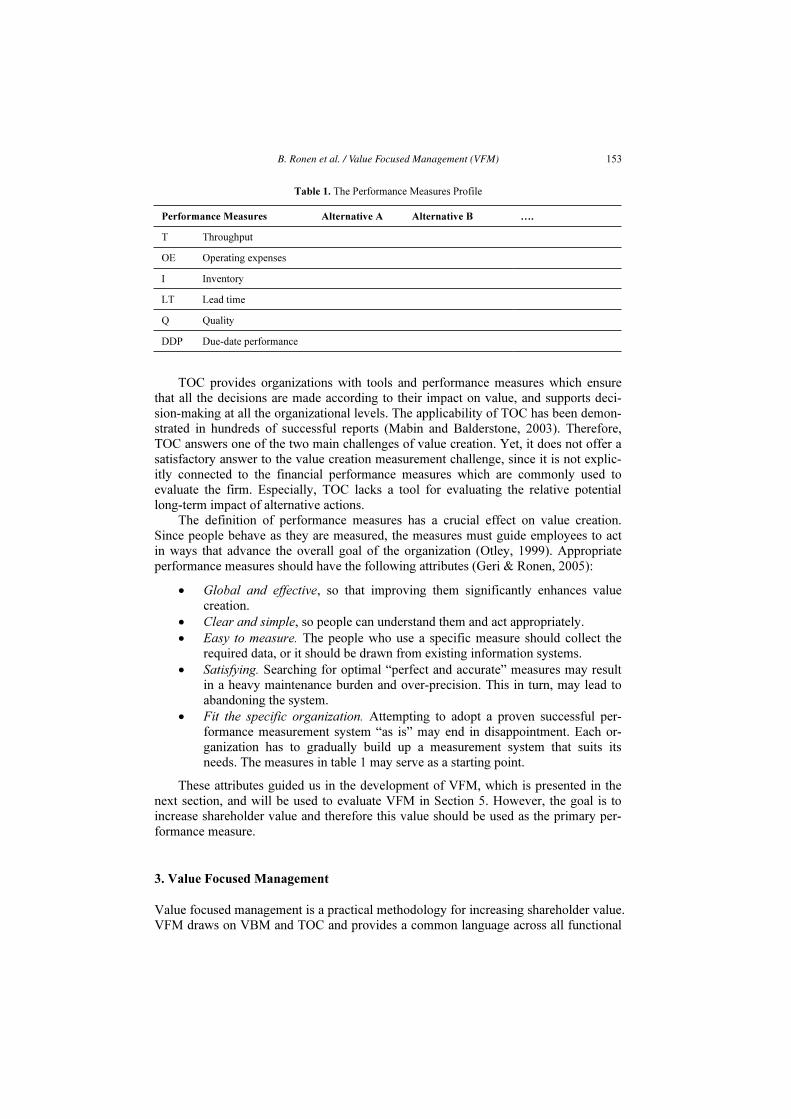
value drivers. The performance measures profile is a tool to support global decision-
making that examines alternative courses of action through the organization’s global
performance measures. It is a two-dimensional matrix of which the columns represent
the alternative actions and the rows represent the performance measures, as shown in
Table 1. The first three measures were defined by Goldratt & Cox (1986) and the other
three were suggested by Eden et al. (1993). Each organization should modify the per-
formance measures profile to its special needs by dropping or changing the suggested
measures or adding new ones.
B. Ronen et al. / Value Focused Management (VFM)152
TOC provides organizations with tools and performance measures which ensure
that all the decisions are made according to their impact on value, and supports deci-
sion-making at all the organizational levels. The applicability of TOC has been demon-
strated in hundreds of successful reports (Mabin and Balderstone, 2003). Therefore,
TOC answers one of the two main challenges of value creation. Yet, it does not offer a
satisfactory answer to the value creation measurement challenge, since it is not explic-
itly connected to the financial performance measures which are commonly used to
evaluate the firm. Especially, TOC lacks a tool for evaluating the relative potential
long-term impact of alternative actions.
The definition of performance measures has a crucial effect on value creation.
Since people behave as they are measured, the measures must guide employees to act
in ways that advance the overall goal of the organization (Otley, 1999). Appropriate
performance measures should have the following attributes (Geri & Ronen, 2005):
• Global and effective, so that improving them significantly enhances value
creation.
• Clear and simple, so people can understand them and act appropriately.
• Easy to measure. The people who use a specific measure should collect the
required data, or it should be drawn from existing information systems.
• Satisfying. Searching for optimal “perfect and accurate” measures may result
in a heavy maintenance burden and over-precision. This in turn, may lead to
abandoning the system.
• Fit the specific organization. Attempting to adopt a proven successful per-
formance measurement system “as is” may end in disappointment. Each or-
ganization has to gradually build up a measurement system that suits its
needs. The measures in table 1 may serve as a starting point.
These attributes guided us in the development of VFM, which is presented in the
next section, and will be used to evaluate VFM in Section 5. However, the goal is to
increase shareholder value and therefore this value should be used as the primary per-
formance measure.
3. Value Focused Management
Value focused management is a practical methodology for increasing shareholder value.
VFM draws on VBM and TOC and provides a common language across all functional
Table 1. The Performance Measures Profile
Performance Measures Alternative A Alternative B ….
T Throughput
OE Operating expenses
I Inventory
LT Lead time
Q Quality
DDP Due-date performance
B. Ronen et al. / Value Focused Management (VFM) 153

areas, thus it enables aligning all the organizational decision making with the goal and
creates a clear link between management actions and shareholder value. VFM adds the
difficulty of implementation dimension to the decision making process, through the
focusing matrix which is detailed below. Hence, VFM considers the load on manage-
ment attention, which according to Davenport and Beck (2000) is the scarcest resource
in modern organizations, and focuses management attention on the most promising
value drivers. VFM identifies the value drivers, quantifies their estimated contribution,
and prioritizes them, according to their relative value creation potential and difficulty
of implementation. The stages of VFM are:
1. Define the goal.
2. Determine the performance measures.
3. Identify the value drivers and evaluate their potential impact.
4. Decide how to improve the value drivers.
5. Implement and control.
We now elaborate on each of these stages.
3.1. Stage 1: Define the Goal
The goal of the firm is to maximize shareholder value, and it should be clear to all
managers and employees of the organization. The debate whether a firm should maxi-
mize shareholder value or stakeholder value, has been going on since the nineteenth
century. However, legal as well as theoretic arguments stress that the objective function
of the corporation is to maximize shareholder value (Copeland et al. 1996; Sundaram &
Inkpen, 2004). Nevertheless, considering the interests of stakeholders such as employ-
ees, customers, suppliers and the community will advance the goal of the firm in the
long term.
3.2. Stage 2: Determine the Performance Measures
VFM combines several financial and operational performance measures, but the firm
value is the primary performance measure. We use the DCF approach (Copeland et al.,
1996) and define shareholder value as the discounted cash flow available to sharehold-
ers. The financial statements provide the necessary data for valuation. Shareholder
value is calculated as follows: the value of operations less net financial liabilities plus
excess assets (such as real estate not necessary for ongoing operations). The value of
operations is the discounted value of expected future free cash flow (Copeland et al.,
1996), and is separated into two time periods: an explicit forecast period (usually the
first five years) and the value after the explicit period, which is referred to as the resid-
ual value (also termed the continuing value).
The performance measures also include the global TOC measures: throughput, op-
erating expenses, inventory, lead time, quality, and due-date performance, as well as
specific relevant global measures. Finally, EVA® is used to measure the change in
shareholder value during the period.
3.3. Stage 3: Identify and Evaluate the Value Drivers
This is the main stage of VFM which differentiates it from other value creation meth-
odologies, and it includes seven activities, which are detailed below.
B. Ronen et al. / Value Focused Management (VFM)154

3.3.1. Identify the Value Drivers
As already mentioned, a value driver is any important factor that significantly affects
the value of the firm (Amit & Zott, 2001). The potential value drivers are identified by
a focused review and analysis of the organization from four different approaches,
which are detailed below. The review is carried out by interviewing the management
team, key personnel, customers, suppliers, or other business partners; reviewing finan-
cial and management reports; visiting the premises; and benchmarking against similar
organizations.
The financial statements approach. The financial statements are reviewed and
benchmarked in order to identify potential value drivers such as high inventory levels
or a decrease in revenues.
The functional review approach (bottom-up). All the organizational functions are
systematically examined to find relevant value drivers. These functions include: the
business strategy; marketing, sales and business development; human resources man-
agement; information systems; finance; research and development; quality; operations,
logistics and procurement; cost accounting, organizational structure; risk management;
customer service and support; project management.
The performance measures approach. The value creation potential of improving
each one of the current and prospective performance measures of the organization is
evaluated. These include the global TOC measures: throughput, operating expenses,
inventory, lead time, quality, and due-date performance, as well as other specific rele-
vant global measures. Sometimes, the use of inappropriate performance measures such
as traditional cost accounting measures distorts decision making and reduces share-
holder value. Hence, in these cases, modifying the performance measures can be a ma-
jor value driver.
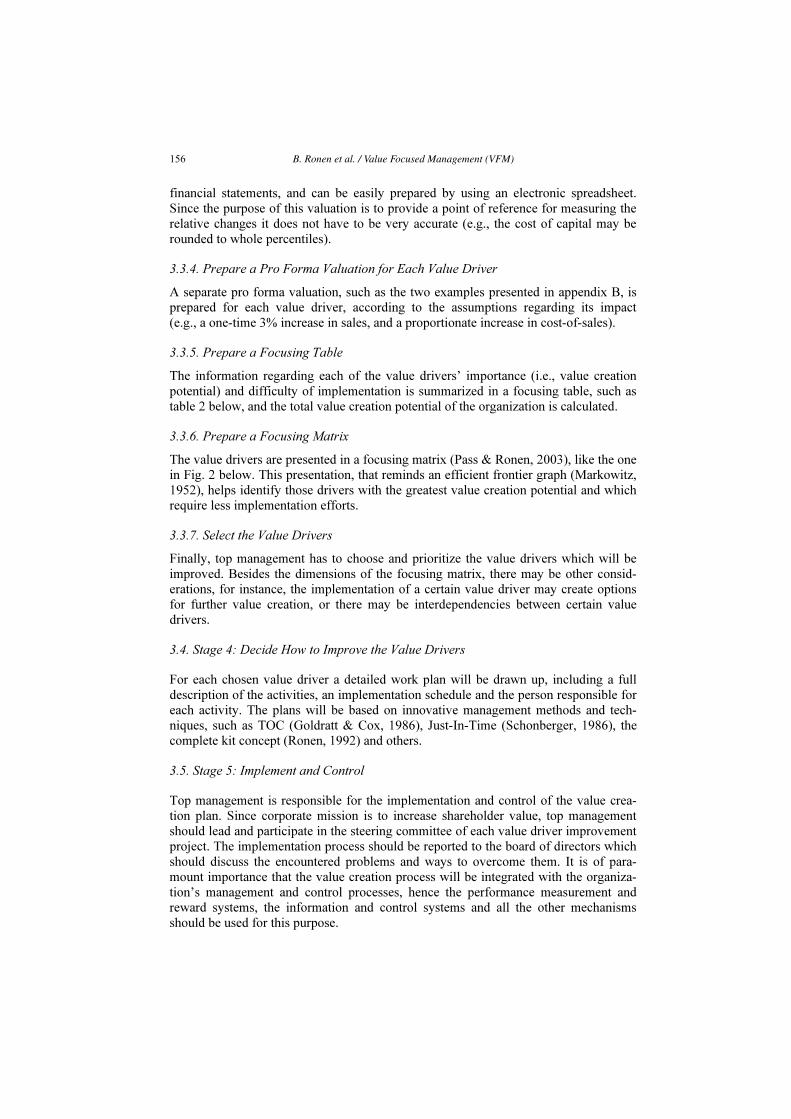
The core problem identification approach (top-down). A current reality tree
(Goldratt, 1994) is used to analyze the undesirable effects (UDEs) and identify the root
problems of the organization. A UDE is any major issue that prevents the organization
from achieving its goal. The UDEs may include problems and symptoms which were
revealed by the other approaches, as well as new UDEs. Figure 1 presents an example
of a current reality tree. The distinction between problems and symptoms is crucial,
since the real value creation potential lies in solving the core problems.
3.3.2. Evaluate the Potential Impact and Difficulty of Implementation
About ten of the identified value drivers, which are perceived as the most important
ones are selected. The potential impact of each value driver is estimated, as well as
additional required investments. For instance, insourcing the customer service call cen-
ter will cost two million dollars during the first year, and will result in a one-time 2%
increase in sales in the second year, due to improved customer retention. In the follow-
ing years, sales will remain in this higher level. The cost of sales changes proportion-
ately. The difficulty of implementation is evaluated on a scale from 1 (very hard) to 5
(easy). In this example, it is estimated as medium, 3. Additional examples are provided
in Section 4.
3.3.3. Prepare a Base Valuation
The base valuation is the starting point of the value creation potential calculation. An
example of a base valuation is presented in appendix A. It is based on the company’s
B. Ronen et al. / Value Focused Management (VFM) 155
financial statements, and can be easily prepared by using an electronic spreadsheet.
Since the purpose of this valuation is to provide a point of reference for measuring the
relative changes it does not have to be very accurate (e.g., the cost of capital may be
rounded to whole percentiles).
3.3.4. Prepare a Pro Forma Valuation for Each Value Driver
A separate pro forma valuation, such as the two examples presented in appendix B, is
prepared for each value driver, according to the assumptions regarding its impact
(e.g., a one-time 3% increase in sales, and a proportionate increase in cost-of-sales).
3.3.5. Prepare a Focusing Table
The information regarding each of the value drivers’ importance (i.e., value creation
potential) and difficulty of implementation is summarized in a focusing table, such as
table 2 below, and the total value creation potential of the organization is calculated.
3.3.6. Prepare a Focusing Matrix
The value drivers are presented in a focusing matrix (Pass & Ronen, 2003), like the one
in Fig. 2 below. This presentation, that reminds an efficient frontier graph (Markowitz,
1952), helps identify those drivers with the greatest value creation potential and which
require less implementation efforts.
3.3.7. Select the Value Drivers
Finally, top management has to choose and prioritize the value drivers which will be
improved. Besides the dimensions of the focusing matrix, there may be other consid-
erations, for instance, the implementation of a certain value driver may create options
for further value creation, or there may be interdependencies between certain value
drivers.
3.4. Stage 4: Decide How to Improve the Value Drivers
For each chosen value driver a detailed work plan will be drawn up, including a full
description of the activities, an implementation schedule and the person responsible for
each activity. The plans will be based on innovative management methods and tech-
niques, such as TOC (Goldratt & Cox, 1986), Just-In-Time (Schonberger, 1986), the
complete kit concept (Ronen, 1992) and others.
3.5. Stage 5: Implement and Control
Top management is responsible for the implementation and control of the value crea-
tion plan. Since corporate mission is to increase shareholder value, top management
should lead and participate in the steering committee of each value driver improvement
project. The implementation process should be reported to the board of directors which
should discuss the encountered problems and ways to overcome them. It is of para-
mount importance that the value creation process will be integrated with the organiza-
tion’s management and control processes, hence the performance measurement and
reward systems, the information and control systems and all the other mechanisms
should be used for this purpose.
B. Ronen et al. / Value Focused Management (VFM)156

4. Example: The Supermarket Chain
This section analyzes an example of a supermarket chain and demonstrates the effec-
tiveness of VFM as a practical value creation methodology. The managerial value driv-
ers examined below are highly relevant to many organizations in the retail industry.
The following example is a modified abridged version of the supermarket chain exam-
ple which was analyzed by Eden and Ronen (2002). The example elaborates on the
third stage of VFM: identifying the value drivers and evaluating their potential impact.
The other stages are as described in the previous section. That is, the goal of the su-
permarket chain is to maximize shareholder value (stage 1). The performance measures
(stage 2) are those indicated in Section 3.2: the DCF approach is used to measure
shareholder value and the required data are taken from the financial statements (see
appendix A), TOC global measures are used for performance measurement, and EVA®
measures shareholder value change during each period. The activities of the third stage
are detailed in the subsections below. The two final stages: deciding how to improve
the value drivers (Stage 4), and implementation and control (Stage 5), were carried out
as described in Sections 3.4 and 3.5 respectively.
Appendix A presents the financial statements and the base valuation of the super-
market chain. Shareholder value is estimated at $154 million. The shareholders require
a return of 10% per year, and the cost of debt is 3.2% (that is, 5% less 36% corporate
tax rate). The equity is $182 million, and the debt is $63 million. Hence, the weighted
average cost of capital (WACC) is 8.25%, and was calculated as follows:
WACC= 10% * 182/245 + 3.2% * 63/245 = 8.2514% ≈ 8.25%
EVA® is defined as:
EVA® = net operating profit after tax (NOPAT) – WACC * invested capital.
Thus, the EVA® at the base year is negative:
EVA® = 17.92 – 8.25% * 245 = –2.296
Although the chain has an annual net income of $15.9 million at the base year, the
EVA® is negative, and shareholder value is being eroded by approximately $2.3 mil-
lion per year. Therefore, management must find ways to create value.
4.1. Identifying the Value Drivers
The four approaches described in Section 3.3.1 were used to identify the chain’s value
drivers.
4.1.1. The Financial Statements Approach
The chain’s financial statements were analyzed and compared with the two leading
competitors and sector average data. Three potential value drivers were identified:
• Low profit rate compared to the sector average.
• High inventory levels.
• Relatively short supplier credit terms compared to the competition.
B. Ronen et al. / Value Focused Management (VFM) 157

4.1.2. The Functional Review Approach (Bottom-Up)
All the organizational functions were reviewed in a focused process which included
several visits to selected supermarket branches and to the chain’s headquarters, on-site
interviews and management workshops. The main findings were as follows:
The organization’s strategy. The chain’s strategy is outdated and not well defined.
The branches are located mainly in the suburbs and there are no branches in prime lo-
cations. The chain does not have a private label. Furthermore, it lacks a logistics center
which would enable better operations and control.
Marketing, sales and business development. A comparative study showed that the
average customer purchase is 8% lower than that of the competitors.
Human resources management. There is a large turnover of low and middle man-
agement personnel, especially among key branch employees. However, there is a
strong sense of identification and loyalty of the branch staff members, who have been
with the chain for many years, and labor relations are good.
Information systems. Branch managers complain that the information systems are
inadequate, and do not provide them with managerial information. For instance, some-
times they reveal shortages by physically checking the shelves.
Operations, logistics and procurement. The supermarket chain does not have a lo-
gistics center. On a typical day, more than 30 different suppliers arrive at a branch, and
it interferes with the branches’ smooth operation.
Organizational structure. The organizational structure is centralized and the
branch managers are allowed little freedom of action. All financial expenditures for
branch maintenance, for sales promotion or hiring temporary or permanent personnel
have to be authorized by the main office.
4.1.3. The Performance Measures Approach
The chain’s performance measures were reviewed and the identified potential value
drivers are:
Inventory. There are about 11.9 inventory turns per year, meaning that the inven-
tory level is enough for one month.
Lead time. The average time from a branch request until its fulfillment is four
working days.
Lost sales. This is an important measure, which is commonly used by retailers. The
average lost sales rate of the supermarket chain is estimated at 4.6%. It was calculated
based on the assumption that in half of the cases when the required item is out of stock,
the customer will buy a similar item on the same purchase occasion, or will postpone
the purchase at the chain to a later occasion. In the remaining cases, the customer will
buy the product elsewhere or not at all (particularly in cases of spontaneous buying).
4.1.4. The Core Problem Identification Approach (Top-Down)
A current reality tree (Goldratt, 1994) was built in order to identify the company’s core
problems and is presented in Fig. 1. The UDE’s were elicited from interviews with
managers and employees, and they also include problems and symptoms which were
revealed by the previous three approaches. As shown in Fig. 1, the chain’s core prob-
lems are: outdated strategy, ineffective operations and over-centralized management.
B. Ronen et al. / Value Focused Management (VFM)158
4.2. Evaluating the Potential Impact and Difficulty of Implementation
Following the identification process, seven potential value drivers were chosen for fur-
ther consideration, and the expected impact and implementation difficulty of each one
of them is detailed below.
4.2.1. Value Driver 1: Increasing the Average Customer Purchase
Since the functional review revealed that the average customer purchase is 8% lower
than that of the competitors, increasing it seems to be a promising value driver. It is
assumed that increasing the average purchase by 5% will lead to a parallel increase in
sales of 5% in the first year, after which the sales will remain at the same level. It will
be accomplished by seasonal sales promotions, cashier training, sampling and tasting
promotions, advertising, lotteries, and so on. Service improvement has also a major
impact on increasing customer average purchase. Attention should be paid to enhanc-
ing the shopping experience, by trying to give the customers more than they expected
with regard to service and courtesy. The checkout counters are a bottleneck during
peak hours. The cashier’s “complete kit” (Ronen, 1992, Ronen et al., 2006) at the start
of the shift can greatly help in reducing the non-effective time at the checkout counter.
The cashier’s kit includes coins and small bills for change, additional cash register rolls,
up-to-date price lists for certain items, information on special offers, coupons, and so
on. This will reduce the cashiers’ wasted time, and enable them to devote more time for
special promotions and interaction with customers.
These actions will require additional costs, estimated at 0.5% of sales, every year.
The difficulty of implementation is considered relatively easy, 4 on a scale of 1 (diffi-
cult) to 5 (very easy).
Over-centralized
management
Ineffective
operations
Outdated
Strategy
Core
problems
No autonomy for
branch managersNo logistics
center
High rate of
lost sales
No private
label
No shelf space
management
Shareholder value is not
sufficiently improved
Profit after tax is
too low
Average purchase
is too small
Inventories are
too high
Inadequate
information systems
Figure 1. Current Reality Tree.
B. Ronen et al. / Value Focused Management (VFM) 159

4.2.2. Value Driver 2: Establishing a Logistics Center
Establishing a logistics center is in line with contemporary management philosophies,
especially Just-in-time and TOC. Setting up a single logistics center which centrally
distributes goods to the branches has the following advantages:
• Reducing the number of daily deliveries to the branch will relieve branch
managers of handling deliveries and supervising unloading, therefore leaving
them more time for improving service and promoting sales.
• Reducing unloading time and waiting time of the delivery vehicle.
• Optimizing deliveries since a single aggregate delivery is cheaper and more
efficient than 10 or 20 deliveries of different suppliers. As both the suppliers
and the chain benefit from the change, the suppliers may be charged for the
additional service provided by the logistics center.
• Managing inventories from a global perspective together with improved su-
pervision and control will result in cost savings, fewer shortages and reduced
lost sales.
It is estimated that lost sales will fall by 50% (from 4.6% to 2.3%), and the extra
time that branch managers will be able to devote for service improvement and sales
promotion will lead to a 1% increase in sales, resulting in a total sales increase of 3.3%,
starting from the second year. The estimated cost of constructing a logistics center is
$10 million in the first year, with another $4 million per year for maintenance and op-
erations, beginning from the second year. Aggregated delivery to the branches will
allow an annual saving of $500,000, starting form the second year. That is, the net costs
will increase by $3.5 million. Moreover, it will be possible to charge the suppliers 1%
of the sales, starting from the second year, for transportation and handling. Furthermore,
total inventories will decrease by 10%, as of the second year. In the opinion of the
chain’s managers, implementation will be difficult – 2 on the 1–5 scale, since it re-
quires establishing new business processes and fundamental changes in working with
many suppliers.
4.2.3. Value Driver 3: Introducing a Private Label
The chain considers launching its own private label and plans that in the first year pri-
vate label sales of coffee, soft drinks, and washing detergents will reach 5% of the
revenues. This percentage will increase in the second year to 7%, in the third year to
10%, and in the fourth and fifth years to 15%. The chain’s economists calculated that it
is possible to procure private label products at 80% of the brand names price. This will
also enhance the chain’s bargaining power over the leading brand names suppliers,
though due to conservative practices we will not include this benefit in the calculation.
The cost of introducing a private label is estimated as follows: $2 million in the first
year; $1.5 million in the second year; $1 million in each of the third, fourth and fifth
years. The difficulty of implementation is 3 (moderate).
4.2.4. Value Driver 4: Shelf Space Management
Not enough attention is paid to shelf space management and product display. It is esti-
mated that the implementation of a supportive software package can increase the aver-
age consumer purchase by 3%, resulting in a similar 3% growth in revenues each year.
An additional 1% increase is sales can be obtained by applying specific throughput
B. Ronen et al. / Value Focused Management (VFM)160
concept (Pass and Ronen, 2003) which is further explained below, and removing items
with poor specific throughput from the shelves. Altogether, sales will increase by 4%.
In a large branch, some 10,000 different items (stock keeping units – SKUs) are
displayed on the shelves, while there are more than 100,000 potential SKUs that the
suppliers would like to offer. Thus, there must be a system of strategic gating of the
products (Pass and Ronen, 2003). Although choices are limited, management still has
some flexibility over 20% of the shelf space.
Since the system constraint is the shelf space, one of the considerations in display-
ing goods on the shelves or removing them is the throughput per unit of shelf space,
i.e., the specific throughput.
The costs of purchasing shelf space management software, applying the specific
throughput concept, and additional advertising and sales promotion expenses are esti-
mated as follows:
A one-time expenditure of $500,000 will be required in the first year. In this year,
the increase in sales will not be realized, due to the need to implement the system in the
branches. Starting from the second year, there will be a variable cost increase of about
0.2% of sales while sales will grow by 4% compared to the base year, and will remain
at this level in subsequent years. The implementation difficulty is 5 (relatively easy).
4.2.5. Value Driver 5: Improving the Quality of the Administrative and Operations
Personnel
One of the main challenges of the chain is the need to replace some of its mid-
managers. At the same time, the turnover of those managers the chain wishes to retain
has to be reduced. Management recruiting, training and development programs, and
plans to retain competent employees are likely to induce the following results:
• In the first year, there will be no change in revenues.
• From the second to the fifth year, sales will be 3% higher relative to the base
year due to better management and a further increase in the average customer
purchase, as well as a 10% decrease in lost sales. These improvements are in
addition to those described in the previous options.
• Due to increased efficiency, the inventories will remain at the base year levels,
despite the increase in sales.
The expenses involved are about $1,000,000 for the first year, and include recruit-
ing, managers training, and a program to retain competent employees. From the second
to the fifth year the expenses will amount to $700,000 per year. The implementation
difficulty is considered 3 (moderate).
4.2.6. Value Driver 6: Expanding the Product Display Area
The suggested improvement is to expand the product display area in the branches by
reducing storerooms area and increasing the frequency of deliveries. Currently, deliver-
ies to the branches are mostly made once a week (except for fresh produce, which ar-
rives daily) and about 25% of the branch area serves as internal storage space. It is pro-
posed to double the delivery rate in order to halve the required storage area, so the re-
dundant space can be transformed into additional display area. However, this plan is
contingent on the establishment of a logistics center which was described above (see
Section 4.2.2).
B. Ronen et al. / Value Focused Management (VFM) 161
Pilot studies carried out by the chain showed that expanding the display area and
displaying new product categories in the additional space resulted in a proportional
sales increase. As of the second year, the display area will be expanded by 8%, hence
sales will increase by 8% compared to the base year and will remain at this level from
that year on. The additional expenses (beyond the cost of moving to the logistics center
which is accounted for in Section 4.2.2) will amount to $2 million per year, apart from
the first year when they will be $1 million. The implementation difficulty is 4 (rela-
tively easy).
4.2.7. Value Driver 7: Increasing Supplier Credit Days
The chain’s supplier credit terms are worse compared to its competitors. The intention
is to increase credit days by 10%. Even then, it will still be lower than the terms of the
competing chains. This will be carried out by negotiating with the suppliers, and there-
fore it does not involve any additional expenses. However, the implementation diffi-
culty is estimated as 1 (very difficult), due to strong opposition mainly from the leading
suppliers.
4.3. Preparing a Base Valuation
The base valuation is presented in appendix A. Shareholder value is estimated at $154
million.
4.4. Preparing a Pro Forma Valuation for Each Value Driver
Two examples of pro forma valuations are presented in appendix B. All the valuations
are based on the following general Assumptions:
• Any change in sales volume results in a proportional change in the cost of
sales, in the accounts receivable and the accounts payable, and in the invento-
ries.
• The operating expenses are fixed.
• The supplier credit (i.e., accounts payable) is sufficient to finance the invento-
ries and the customer credit (i.e., accounts receivable).
• Depreciation expense is $18 million per year. The annual capital expenditures
are equal to the amount of depreciation.
• At the end of each year, all available cash flow is distributed to shareholders
as dividends.
• The weighted average cost of capital (WACC) is 8.25% (as calculated above).
The assumption that the cost of sales changes proportionally to the change in sales
implies that all these costs are considered as variable costs. This may not be the case,
so it can be regarded as a conservative valuation. Alternatively, one may assume that a
certain portion of the cost of sales is fixed, and change the calculations accordingly.
4.5. Preparing a Focusing Table
The total potential additional value creation calculated in Table 2 is $382 million. As
the base valuation is $154 million, obviously the chain is up for a considerable im-
provement.
B. Ronen et al. / Value Focused Management (VFM)162

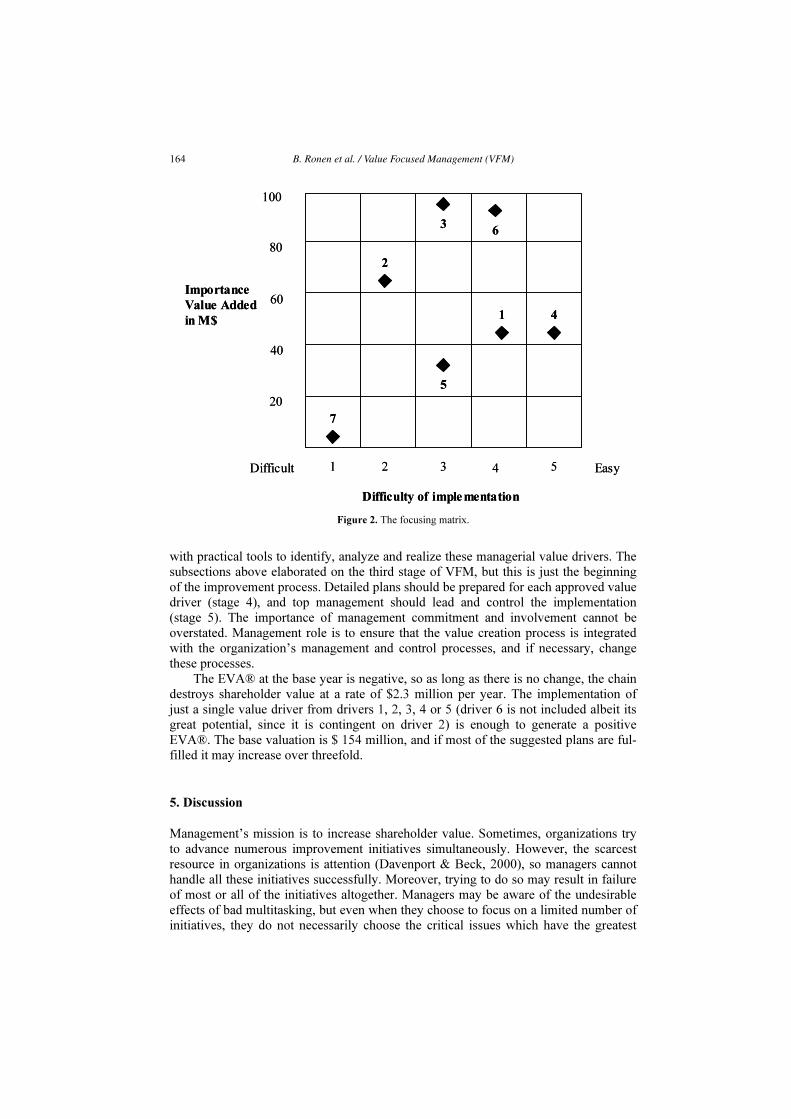
4.6. Preparing a Focusing Matrix
The focusing matrix presented in Fig. 2, maps the value drivers according to their rela-
tive importance and difficulty of implementation. The preferred value drivers are those
nearest the right top of the matrix, since they have the greatest value creation potential
and they are the easiest to implement. However, the selection is not straightforward; for
instance, value driver #4 is easier to implement, compared to value driver #2, but the
latter has more value creation potential.
4.7. Selecting the Value Drivers
At a meeting of the board of directors, it was decided to implement the first six poten-
tial value drivers. The seventh proposal, to increase supplier credit days, was rejected
since its expected contribution is relatively low, it would require considerable man-
agement attention and efforts, and moreover, it may jeopardize the full cooperation
with suppliers which is required for the successful operation of the new logistics center.
At the first stage, management will start working on value drivers 1, 2, 4, 5 and 6. The
implementation of the third value driver, introducing a private label, was postponed
due to the large amount of management time it requires, and in order to avoid dispute
with leading suppliers.
It should be mentioned that the board of directors instructed management before-
hand to focus the efforts on utilizing existing resources. Therefore, value drivers which
involved further expansion, such as opening new branches, were not considered.
4.8. Summary
Supermarkets usually have low profit margins. However, as the above example demon-
strated, managerial value drivers, which involve a relatively low investment, have a
great potential to improve the chain’s shareholder value. VFM provides management
Table 2. The Focusing table: Calculating the total value creation potential
# Value driver Importance:
Additional value ($M)
Difficulty of
implementation
(1 – very difficult,
5 – relatively easy)
1 Increasing the average customer purchase 44 4
2 Establishing a logistics center 66 2
3 Introducing a private label 97 3
4 Shelf space management 43 5
5 Improving the quality of administrative and
operations personnel
35 3
6 Expanding the product display area 93 4* Contingent on
the establishment
of a logistics center
7 increasing supplier credit days 4 1
Total value creation potential 382
B. Ronen et al. / Value Focused Management (VFM) 163
with practical tools to identify, analyze and realize these managerial value drivers. The
subsections above elaborated on the third stage of VFM, but this is just the beginning
of the improvement process. Detailed plans should be prepared for each approved value
driver (stage 4), and top management should lead and control the implementation
(stage 5). The importance of management commitment and involvement cannot be
overstated. Management role is to ensure that the value creation process is integrated
with the organization’s management and control processes, and if necessary, change
these processes.
The EVA® at the base year is negative, so as long as there is no change, the chain
destroys shareholder value at a rate of $2.3 million per year. The implementation of
just a single value driver from drivers 1, 2, 3, 4 or 5 (driver 6 is not included albeit its
great potential, since it is contingent on driver 2) is enough to generate a positive
EVA®. The base valuation is $ 154 million, and if most of the suggested plans are ful-
filled it may increase over threefold.
5. Discussion
Management’s mission is to increase shareholder value. Sometimes, organizations try
to advance numerous improvement initiatives simultaneously. However, the scarcest
resource in organizations is attention (Davenport & Beck, 2000), so managers cannot
handle all these initiatives successfully. Moreover, trying to do so may result in failure
of most or all of the initiatives altogether. Managers may be aware of the undesirable
effects of bad multitasking, but even when they choose to focus on a limited number of
initiatives, they do not necessarily choose the critical issues which have the greatest
Importance
Value Added
in M$
100
80
60
40
20
Difficulty of implementation
EasyDifficult 1 2 3 4 5
7
2
4
5
3
1
6
Importance
Value Added
in M$
100
80
60
40
20
Difficulty of implementation
EasyDifficult 1 2 3 4 5
7
2
4
5
3
1
6
Figure 2. The focusing matrix.
B. Ronen et al. / Value Focused Management (VFM)164

potential to increase shareholder value. VFM provides managers with a structured
methodology that helps them identify the relevant value drivers. A further unique con-
tribution of VFM is that it considers the load on management attention by adding the
difficulty of implementation dimension to the decision making process, and through the
focusing matrix, it helps choosing the most promising value drivers.
Malmi and Ikaheimo (2003) suggested four guidelines which ate detailed in Sec-
tion 2.1, for improving VBM so it can become a more practical management approach.
VFM fulfills all these guidelines: First, VFM aims to create shareholder value; however,
this is not unique to VFM. Second, VFM provides a structured methodology for identi-
fying the value drivers. But, VFM’s main contribution is that it connects decision mak-
ing and action planning, both strategic and operational, to value creation or value driv-
ers. The fifth stage of VFM emphasizes the importance of integrating VFM with the
organization’s management and control processes. Hence, VFM connects performance
measurement, target setting and rewards to value creation or value drivers.
As measures should guide management and employees alike to act in ways that
advance the overall goal of the organization (Otley, 1999), the attributes of appropriate
performance measures (Geri and Ronen, 2005) detailed in Section 2.2, are used to
evaluate VFM.
VFM’s measures are global and effective since the primary measure is shareholder
value, which directly relates to the goal. Moreover, the measures are clear and simple,
and their most important attribute is that they provide a common language, understand-
able by all. The implications of alternative operational improvements are translated to
financial terms, and compared through the focusing matrix, which also considers their
difficulty of implementation.
The necessary financial data are based on the firm’s financial statements and do
not require additional measuring or data collection efforts. The base valuation, as well
as the pro forma valuations of the value drivers’ impact, are satisfying, and do not en-
tail major efforts to find the most “perfect and accurate data”. The valuations are used
to estimate the relative importance of the proposed improvements and are meant for
internal purposes. Hence the valuations need not be accurate and can be prepared by
the organization’s internal staff, without consulting external valuation experts.
Stage 2 of VFM, determining the performance measures, allows fitting the meas-
ures to the organization’s special needs, while at the same time it provides the main
general global measures which should guide all business organizations in their deci-
sions.
6. Conclusions
In most organizations, managerial value drivers are underutilized due to lack of a clear
connection between managerial improvements and value creation. Moreover, manage-
ment attention is limited, and sometimes this scare resource is wasted on less worthy
improvement initiatives, while other important ones are overlooked or neglected.
This paper presented value focused management, which is a practical methodology
for increasing shareholder value. VFM provides managers with a structured process
that includes a focused diagnosis of the organization followed by a comprehensive im-
plementation plan, which helps them direct their efforts towards the most promising
value drivers.
B. Ronen et al. / Value Focused Management (VFM) 165
VFM draws on VBM and TOC and provides a common language across all func-
tional areas, thus it creates a clear link between management actions and shareholder
value. VFM considers the load on management attention by adding the difficulty of
implementation dimension to the decision making process, through the focusing matrix.
VFM has been successfully implemented in dozens of organizations worldwide.
The paper analyzed a case study of a supermarket chain which demonstrated VFM’s
potential as an effective practical methodology to guide companies in their ongoing
quest to increase shareholder value.
References
[1] Amit, R., & Zott, C. (2001). Value Creation in E-business. Strategic Management Journal, 22 (6/7),
493–520.
[2] Copeland, T., Koller, T., & Murrin, J. (1996). Valuation – Measuring and Managing the Value of
Companies. 2nd
Ed., New York, NY: McKinsey & Company, Inc., John Wiley & Sons.
[3] Davenport, T. H., & beck, J. C. (2000). Getting the Attention You Need. Harvard Business Review,
78(5): 118–126.
[4] Eden, Y., & Ronen, B. (2002). It Costs Me More: Decision Making, Cost Accounting and Value Crea-
tion. Herzelia, Israel: Hod-Ami (Hebrew).
[5] Eden, Y., Ronen, B., & Spector, Y. (1993). Developing Decision-Support Tools for Costing and Pric-
ing, Faculty of Management, Tel Aviv University, The Joseph Kasierer Institute for Research in Ac-
counting, 53 (3) (Hebrew).
[6] Geri, N., & Ronen, B. (2005). Relevance Lost: The Rise and Fall of Activity-Based Costing. Human
Systems Management, 24(2), 133–144.
[7] Goldratt, E. M. (1991). The Haystack Syndrome. Great Barrington, MA: North River Press.
[8] Goldratt, E. M. (1994). It’s Not Luck. Great Barrington, MA: North River Press.
[9] Goldratt, E. M., & Cox, J. F. (1986). The Goal (2nd
revised edition). Croton-on-Hudson, NY: North
River Press.
[10] Gupta, M. (2003). Constraints Management: Recent Advances and Practices. International Journal of
Production Research, 41 (4), 647–659.
[11] Ioannou, G., & Papadoyiannis, C. (2004). Theory of Constraints-Based Methodology for Effective ERP
Implementations. International Journal of Production Research, 42 (23), 4927–4954.
[12] Ittner, C. D., & Larcker D. F. (2001). Assessing Empirical Research in Managerial Accounting: A
Value Based Management Perspective. Journal of Accounting and Economics. 32 (1–3), 349–410.
[13] Kaplan, R. S., & Norton, D. P. (1992). The Balanced Scorecard – Measures that Drive Performance.
Harvard Business Review, 70(1): 71–79.
[14] Kaplan, R. S., & Norton, D. P. (1996). Using the Balanced Scorecard as a Strategic Management Sys-
tem. Harvard Business Review, 74(1): 75–85.
[15] Mabin, V. J., & Balderstone, S. J. (2000). The World of the Theory of Constraints: A Review of the In-
ternational Literature. Boca Raton, FL: St. Lucie Press/APICS Series on Constraints Management.
[16] Mabin, V. J., & Balderstone, S. J. (2003). The Performance of the Theory of Constraints Methodology:
Analysis and Discussion of Successful TOC Applications. International Journal of Operations and
Production Management, 23 (6), 568–595.
[17] Malmi, T., & Ikaheimo, S. (2003). Value Based Management Practices – Some Evidence from the
Field. Management Accounting Research, 14 (3), 235–254.
[18] Markowitz, H. M. (1952). Portfolio Selection, Journal of Finance, 7 (1), 77–91.
[19] O’Hanlon, J. & Peasnell, K. (1998). Wall Street’s Contribution to Management Accounting: The Stern
Stewart EVA® Financial Management System. Management Accounting Research, 9 (4), 421–444.
[20] Otley, D. (1999). Performance Management: A Framework for Management Control System Design.
Management Accounting Research, 10 (4), 363–382.
[21] Pass, S., & Ronen, B. (2003). Management by the Market Constraint in the Hi Tech Industry. Interna-
tional Journal of Production Research, 41 (4), 713–724.
[22] Pitman, B. (2003). Leading for Value. Harvard Business Review, 81 (4), 41–46.
[23] Rahman, S. (1998). Theory of Constraints: A Review of the Philosophy and its Applications. Interna-
tional Journal of Operations and Production Management, 18 (4), 336–355.
[24] Ronen, B. (1992). The Complete Kit Concept. International Journal of Production Research, 30 (10),
2457–2466.
B. Ronen et al. / Value Focused Management (VFM)166

[25] Ronen, B., Coman, A., & Schragenheim, E. (2001). Peak Management. International Journal of Pro-
duction Research, 39 (14), 3183–3193.
[26] Ronen, B., Pliskin, J. S., & Pass S. (2006). Focused Operations Management for Health Services Or-
ganizations. San-Francisco, CA: Jossey-Bass, John Wiley and Sons.
[27] Ronen, B., & Spector. Y. (1992). Managing System Constraints: A Cost/Utilization Approach. Interna-
tional Journal of Production Research, 30 (9), 2045–2061.
[28] Schonberger, R. J. (1986). World Class Manufacturing: The Lessons of Simplicity Applied. New York,
NY: Free Press.
[29] Shoemaker, T. E., & Reid, R. A. (2005). Applying the TOC Thinking Process: A Case Study in the
Government Sector. Human Systems Management, 24 (1), 21–37.
[30] Smith, K. (2004). Eastern Financial Florida Credit Union: Creating a Competitive Advantage in the
Mortgage Lending Business. Presented at TOC World 2004 Conference, Uncasville, Connecticut,
April, 13–16.
[31] Stern, J. M., & Shiely, J. S. (2001). The EVA® Challenge, New York, NY: John Wiley & Sons.
[32] Stewart, G. B., III (1992). The Quest for Value, New York, NY: Harper Collins.
[33] Sundaram, A. K., & Inkpen, A. C. (2004). The Corporate Objective Revisited. Organization Science,
15 (3), 350–363.
Appendix A: Base Valuation of the Supermarket Chain
The valuation was prepared under the assumption of “business as usual”.
Table 3. Base valuation – financial statements summary
Base year Year 1 Year 2 Year 3 Year 4 Year 5
Thousands $
Income statement
summary
Sales 700,000 700,000 700,000 700,000 700,000 700,000
Cost of goods sold 512,000 512,000 512,000 512,000 512,000 512,000
Gross profit 188,000 188,000 188,000 188,000 188,000 188,000
Sales, General and
Administrative 160,000 160,000 160,000 160,000 160,000 160,000
Earnings before
interest and taxes 28,000 28,000 28,000 28,000 28,000 28,000
Interest expense 3,150 3,150 3,150 3,150 3,150 3,150
Earnings before
income taxes 24,850 24,850 24,850 24,850 24,850 24,850
Income taxes (36%) 8,946 8,946 8,946 8,946 8,946 8,946
Net income 15,904 15,904 15,904 15,904 15,904 15,904
B. Ronen et al. / Value Focused Management (VFM) 167

Table 3. (Continued.)
Base year Year 1 Year 2 Year 3 Year 4 Year 5
Thousands $
balance sheet
summary
Current assets
Accounts receivable 65,000 65,000 65,000 65,000 65,000 65,000
Inventories 43,000 43,000 43,000 43,000 43,000 43,000
108,000 108,000 108,000 108,000 108,000 108,000
Short-term non-
interest liabilities
Accounts payable 105,000 105,000 105,000 105,000 105,000 105,000
Other current
payables 32,000 32,000 32,000 32,000 32,000 32,000
137,000 137,000 137,000 137,000 137,000 137,000
Net working capital –29,000 –29,000 –29,000 –29,000 –29,000 –29,000
Net property plant and
equipment 274,000 274,000 274,000 274,000 274,000 274,000
Total capital required 245,000 245,000 245,000 245,000 245,000 245,000
Short-term bank credit 11,000 11,000 11,000 11,000 11,000 11,000
Long-term debt 52,000 52,000 52,000 52,000 52,000 52,000
Total debt 63,000 63,000 63,000 63,000 63,000 63,000
Shareholders’ equity 182,000 182,000 182,000 182,000 182,000 182,000
Total capital
resources 245,000 245,000 245,000 245,000 245,000 245,000
Table 4. Base valuation
Base year Year 1 Year 2 Year 3 Year 4 Year 5
Thousands $
Cash flow available
to investors
EBIT (Earnings before
interest and taxes) 28,000 28,000 28,000 28,000 28,000 28,000
Taxes on EBIT 10,080 10,080 10,080 10,080 10,080 10,080
NOPAT (Net
operating profit after
tax) 17,920 17,920 17,920 17,920 17,920 17,920
Depreciation
expense 18,000 18,000 18,000 18,000 18,000 18,000
Gross cash flow 35,920 35,920 35,920 35,920 35,920 35,920
B. Ronen et al. / Value Focused Management (VFM)168

Table 4. (Continued.)
Base year Year 1 Year 2 Year 3 Year 4 Year 5
Thousands $
Increase (decrease)
in Working capital 0 0 0 0 0 0
Capital expenditures 18,000 18,000 18,000 18,000 18,000 18,000
Total gross
investment 18,000 18,000 18,000 18,000 18,000 18,000
Cash flow available
to investors 17,920 17,920 17,920 17,920 17,920 17,920
Economic value
added calculation
NOPAT (Net
operating profit after
tax) 17,920 17,920 17,920 17,920 17,920 17,920
WACC (Weighted
average cost of
capital) 8.25% 8.25% 8.25% 8.25% 8.25% 8.25%
Debt/equity ratio 0.35 0.35 0.35 0.35 0.35 0.35
Invested equity
(beginning of year) 182,000 182,000 182,000 182,000 182,000 182,000
Financial liabilities
(beginning of year) 63,000 63,000 63,000 63,000 63,000 63,000
Total invested
capital 245,000 245,000 245,000 245,000 245,000 245,000
Capital charge 20,216 20,216 20,216 20,216 20,216 20,216
EVA ® (Economic
Value Added) –2,296 –2,296 –2,296 –2,296 –2,296 –2,296
Valuation at the
base year
Discounted cash
flow
First five years 71,078
Residual value 146,097
Total valuation of
invested capital 217,175
Net financial
liabilities 63,000
Excess assets 0
Value of the company
to its shareholders 154,175
B. Ronen et al. / Value Focused Management (VFM) 169

Appendix B: Pro Forma Valuations of the Value Driver’s Impact
Value Driver 1: Increasing the Average Customer Purchase
The value driver is described in Section 4.2.1. The valuation assumes a one-time 5%
increase in sales, after which the sales will remain at the same level. The additional
costs are estimated at 0.5% of sales, every year. The general assumptions are detailed
in Section 4.4.
Table 5. Value driver 1 – financial statements summary
Base year Year 1 Year 2 Year 3 Year 4 Year 5
Thousands $
Income statement
summary
Sales 700,000 735,000 735,000 735,000 735,000 735,000
Cost of goods sold 512,000 537,600 537,600 537,600 537,600 537,600
Gross profit 188,000 197,400 197,400 197,400 197,400 197,400
Additional costs 3,675 3,675 3,675 3,675 3,675
Sales, General and
Administrative 160,000 160,000 160,000 160,000 160,000 160,000
Earnings before
interest and taxes 28,000 33,725 33,725 33,725 33,725 33,725
Interest expense 3,150 3,158 3,158 3,158 3,158 3,158
Earnings before
income taxes 24,850 30,568 30,568 30,568 30,568 30,568
Income taxes (36%) 8,946 11,004 11,004 11,004 11,004 11,004
Net income 15,904 19,563 19,563 19,563 19,563 19,563
balance sheet
summary
Current assets
Accounts receivable 65,000 68,250 68,250 68,250 68,250 68,250
Inventories 43,000 45,150 45,150 45,150 45,150 45,150
108,000 113,400 113,400 113,400 113,400 113,400
Short-term non-
interest liabilities
Accounts payable 105,000 110,250 110,250 110,250 110,250 110,250
Other current payables 32,000 32,000 32,000 32,000 32,000 32,000
137,000 142,250 142,250 142,250 142,250 142,250
B. Ronen et al. / Value Focused Management (VFM)170

Table 5. (Continued.)
Base year Year 1 Year 2 Year 3 Year 4 Year 5
Thousands $
Net working capital –29,000 –28,850 –28,850 –28,850 –28,850 –28,850
Net property plant and
equipment 274,000 274,000 274,000 274,000 274,000 274,000
Total capital required 245,000 245,150 245,150 245,150 245,150 245,150
Short-term bank credit 11,000 11,150 11,150 11,150 11,150 11,150
Long-term debt 52,000 52,000 52,000 52,000 52,000 52,000
Total debt 63,000 63,150 63,150 63,150 63,150 63,150
Shareholders’ equity 182,000 182,000 182,000 182,000 182,000 182,000
Total capital
resources 245,000 245,150 245,150 245,150 245,150 245,150
Table 6. Value driver 1 – pro forma valuation
Base year Year 1 Year 2 Year 3 Year 4 Year 5
Thousands $
Cash flow available
to investors
EBIT (Earnings before
interest and taxes) 28,000 33,725 33,725 33,725 33,725 33,725
Taxes on EBIT 10,080 12,141 12,141 12,141 12,141 12,141
NOPAT (Net operating
profit after tax) 17,920 21,584 21,584 21,584 21,584 21,584
Depreciation
expense 18,000 18,000 18,000 18,000 18,000 18,000
Gross cash flow 35,920 39,584 39,584 39,584 39,584 39,584
Increase (decrease)
in Working capital 0 150 0 0 0 0
Capital
expenditures 18,000 18,000 18,000 18,000 18,000 18,000
Total gross
investment 18,000 18,150 18,000 18,000 18,000 18,000
Cash flow available
to investors 17,920 21,434 21,584 21,584 21,584 21,584
B. Ronen et al. / Value Focused Management (VFM) 171

Table 6. (Continued.)
Base year Year 1 Year 2 Year 3 Year 4 Year 5
Thousands $
Economic value added
calculation
NOPAT (Net operating
profit after tax) 17,920 21,584 21,584 21,584 21,584 21,584
WACC (Weighted
average cost of capital) 8.25% 8.25% 8.25% 8.25% 8.25% 8.25%
Debt/equity ratio 0.35 0.35 0.35 0.35 0.35 0.35
Invested equity
(beginning of year) 182,000 182,000 182,000 182,000 182,000 182,000
Financial liabilities
(beginning of year) 63,000 63,000 63,150 63,150 63,150 63,150
Total invested capital 245,000 245,000 245,150 245,150 245,150 245,150
Capital charge 20,216 20,216 20,221 20,221 20,221 20,221
EVA ® (Economic
Value Added) –2,296 1,368 1,363 1,363 1,363 1,363
Valuation at the
base year
Discounted cash
flow
First five years 85,479
Residual value 176,059
Total valuation of
invested capital 261,538
Net financial
liabilities 63,000
Excess assets 0 Value increase relative to the base year
Value of the company
to its shareholders 198,538 44,364 29%
Value Driver 4: Shelf Space Management
The value driver is described in Section 4.2.4. The valuation assumes a one-time 4%
increase in sales in the second year, after which the sales will remain at the same level.
$500,000 cost in the first year and additional costs estimated at 0.2% of sales as of the
second year. The general assumptions are detailed in Section 4.4.
B. Ronen et al. / Value Focused Management (VFM)172
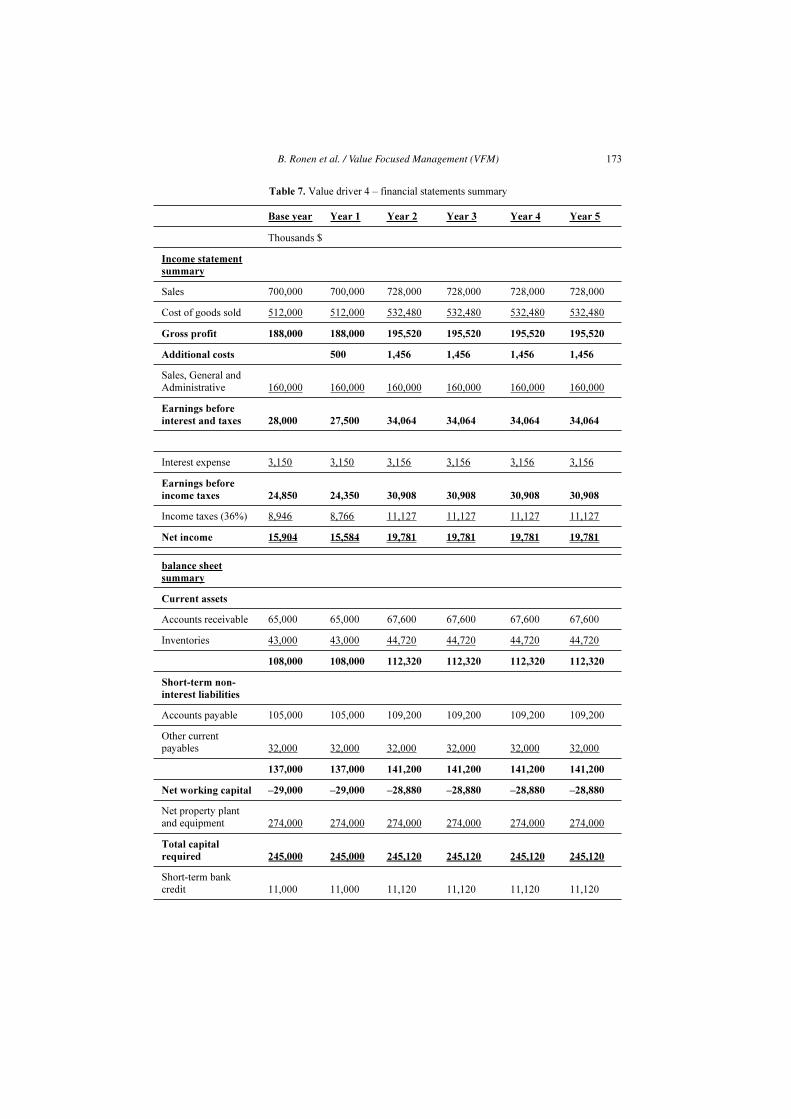
Table 7. Value driver 4 – financial statements summary
Base year Year 1 Year 2 Year 3 Year 4 Year 5
Thousands $
Income statement
summary
Sales 700,000 700,000 728,000 728,000 728,000 728,000
Cost of goods sold 512,000 512,000 532,480 532,480 532,480 532,480
Gross profit 188,000 188,000 195,520 195,520 195,520 195,520
Additional costs 500 1,456 1,456 1,456 1,456
Sales, General and
Administrative 160,000 160,000 160,000 160,000 160,000 160,000
Earnings before
interest and taxes 28,000 27,500 34,064 34,064 34,064 34,064
Interest expense 3,150 3,150 3,156 3,156 3,156 3,156
Earnings before
income taxes 24,850 24,350 30,908 30,908 30,908 30,908
Income taxes (36%) 8,946 8,766 11,127 11,127 11,127 11,127
Net income 15,904 15,584 19,781 19,781 19,781 19,781
balance sheet
summary
Current assets
Accounts receivable 65,000 65,000 67,600 67,600 67,600 67,600
Inventories 43,000 43,000 44,720 44,720 44,720 44,720
108,000 108,000 112,320 112,320 112,320 112,320
Short-term non-
interest liabilities
Accounts payable 105,000 105,000 109,200 109,200 109,200 109,200
Other current
payables 32,000 32,000 32,000 32,000 32,000 32,000
137,000 137,000 141,200 141,200 141,200 141,200
Net working capital –29,000 –29,000 –28,880 –28,880 –28,880 –28,880
Net property plant
and equipment 274,000 274,000 274,000 274,000 274,000 274,000
Total capital
required 245,000 245,000 245,120 245,120 245,120 245,120
Short-term bank
credit 11,000 11,000 11,120 11,120 11,120 11,120
B. Ronen et al. / Value Focused Management (VFM) 173

Table 7. (Continued.)
Base year Year 1 Year 2 Year 3 Year 4 Year 5
Thousands $
Long-term debt 52,000 52,000 52,000 52,000 52,000 52,000
Total debt 63,000 63,000 63,120 63,120 63,120 63,120
Shareholders’ equity 182,000 182,000 182,000 182,000 182,000 182,000
Total capital
resources 245,000 245,000 245,120 245,120 245,120 245,120
Table 8. Value driver 4 – pro forma valuation
Base year Year 1 Year 2 Year 3 Year 4 Year 5
Thousands $
Cash flow available
to investors
EBIT (Earnings before
interest and taxes) 28,000 27,500 34,064 34,064 34,064 34,064
Taxes on EBIT 10,080 9,900 12,263 12,263 12,263 12,263
NOPAT (Net
operating profit after
tax) 17,920 17,600 21,801 21,801 21,801 21,801
Depreciation
expense 18,000 18,000 18,000 18,000 18,000 18,000
Gross cash flow 35,920 35,600 39,801 39,801 39,801 39,801
Increase (decrease)
in Working capital 0 0 120 0 0 0
Capital expenditures 18,000 18,000 18,000 18,000 18,000 18,000
Total gross
investment 18,000 18,000 18,120 18,000 18,000 18,000
Cash flow available
to investors 17,920 17,600 21,681 21,801 21,801 21,801
B. Ronen et al. / Value Focused Management (VFM)174

Table 8. (Continued.)
Base year Year 1 Year 2 Year 3 Year 4 Year 5
Thousands $
Economic value
added calculation
NOPAT (Net operating
profit after tax) 17,920 17,600 21,801 21,801 21,801 21,801
WACC (Weighted
average cost of capital) 8.25% 8.25% 8.25% 8.25% 8.25% 8.25%
Debt/equity ratio 0.35 0.35 0.35 0.35 0.35 0.35
Invested equity
(beginning of year) 182,000 182,000 182,000 182,000 182,000 182,000
Financial liabilities
(beginning of year) 63,000 63,000 63,000 63,120 63,120 63,120
Total invested capital 245,000 245,000 245,000 245,120 245,120 245,120
Capital charge 20,216 20,216 20,216 20,220 20,220 20,220
EVA ® (Economic
Value Added) –2,296 –2,616 1,585 1,581 1,581 1,581
Valuation at the
base year
Discounted cash flow
First five years 82,494
Residual value 177,811
Total valuation of
invested capital 260,304
Net financial
liabilities 63,000
Excess assets Value increase relative to the base year
Value of the company
to its shareholders 197,304 43,130 28%
B. Ronen et al. / Value Focused Management (VFM) 175