valueguide dec2015 ins - sharekhan · please refer the risk disclosure document issued by sebi and...
TRANSCRIPT


December 2015 Sharekhan ValueGuide2
REGULAR FEATURESReport Card 3Earnings Guide 33
Two thousandand fifteen beganon a high note.After winning themajority mandatein the generalelection of May2014, theNarendra Modi-led National Democratic Alliance bagged the key states ofHaryana and Maharashtra in the assembly elections in late2014 and also garnered enough seats in the Jammu & Kashmirelection to become part of the ruling alliance in the state. Nowonder, a lot was expected from the government on the policyfront, given its strong position and political capital gained in2014.
TECHNICALSNifty 21
Stock Updates 11
Sharekhan Special 18
Viewpoints 19
From Sharekhan’s Desk EQUITY
05
2015: Win some; lose some FUNDAMENTALS
DERIVATIVESView 22
TECHNICALS
Crude Oil 23Gold 24Silver 24Copper 24Lead 24
FUNDAMENTALSZinc 24Nickel 25Castor seed 26Chana 26Soya bean 26
Gold 27Silver 27Crude Oil 27
Copper 28Jeera 28Soya bean 28
TECHNICALS
FUNDAMENTALS
USD-INR 30EUR-INR 30
GBP-INR 30JPY-INR 30
disclaimerDISCLAIMER: “This document has been prepared by Sharekhan Ltd. (SHAREKHAN) and is intended for use only by the person or entity to which it is addressed to. This document may contain confidential and/or privileged material and is not forany type of circulation and any review, retransmission, or any other use is strictly prohibited. This document is subject to changes without prior notice. This document does not constitute an offer to sell or solicitation for the purchase or sale ofany financial instrument or as an official confirmation of any transaction. Though disseminated to all customers who are due to receive the same, not all customers may receive this report at the same time. SHAREKHAN will not treat recipientsas customers by virtue of their receiving this report. The information contained herein is obtained from publicly available data or other sources believed to be reliable and SHAREKHAN has not independently verified the accuracy andcompleteness of the said data and hence it should not be relied upon as such. While we would endeavour to update the information herein on a reasonable basis, SHAREKHAN, its subsidiaries and associated companies, their directors andemployees (“SHAREKHAN and affiliates”) are under no obligation to update or keep the information current. Also, there may be regulatory, compliance, or other reasons that may prevent SHAREKHAN and affiliates from doing so. This documentis prepared for assistance only and is not intended to be and must not alone be taken as the basis for an investment decision. Recipients of this report should also be aware that past performance is not necessarily a guide to future performanceand value of investments can go down as well. The user assumes the entire risk of any use made of this information. Each recipient of this document should make such investigations as he deems necessary to arrive at an independent evaluationof an investment in the securities of companies referred to in this document (including the merits and risks involved), and should consult his own advisors to determine the merits and risks of such an investment. The investment discussed orviews expressed may not be suitable for all investors. We do not undertake to advise you as to any change of our views. Affiliates of SHAREKHAN may have issued other reports that are inconsistent with and reach different conclusion from theinformation presented in this report. This report is not directed or intended for distribution to, or use by, any person or entity who is a citizen or resident of or located in any locality, state, country or other jurisdiction, where such distribution,publication, availability or use would be contrary to law, regulation or which would subject SHAREKHAN and affiliates to any registration or licencing requirement within such jurisdiction. The securities described herein may or may not be eligiblefor sale in all jurisdictions or to certain category of investors. Persons in whose possession this document may come are required to inform themselves of and to observe such restriction. Either SHAREKHAN or its affiliates or its directors oremployees/representatives/clients or their relatives may have position(s), make market, act as principal or engage in transactions of purchase or sell of securities, from time to time or may be materially interested in any of the securities or relatedsecurities referred to in this report and they may have used the information set forth herein before publication. SHAREKHAN may from time to time solicit from, or perform investment banking, or other services for, any company mentioned herein.Without limiting any of the foregoing, in no event shall SHAREKHAN, any of its affiliates or any third party involved in, or related to, computing or compiling the information have any liability for any damages of any kind. The analyst certifies thatall of the views expressed in this document accurately reflect his or her personal views about the subject company or companies and its or their securities and do not necessarily reflect those of SHAREKHAN. Further, no part of the analyst’scompensation was, is or will be, directly or indirectly related to specific recommendations or views expressed in this document.”Please refer the Risk Disclosure Document issued by SEBI and go through the Rights and Obligations and Do’s and Dont’s issued by Stock Exchanges and Depositories before trading on the Stock Exchanges. Please refer disclaimer for Terms of Use.
Compliance Officer: Ms. Namita Amod Godbole; Tel: 022-6115000; e-mail: [email protected] • Contact: [email protected]
COMMODITY
CURRENCY
MUTUAL FUNDS DESK
Top MF Picks (equity) 31
Top SIP Fund Picks 32
RESEARCH BASED EQUITY PRODUCTS
Top Picks Basket 06Wealth Creator Portfolio 10
GBP-INR 29JPY-INR 29
USD-INR 29EUR-INR 29
REGISTRATION DETAILS Regd Add: Sharekhan Limited, 10th Floor, Beta Building, Lodha iThink Techno Campus, Off. JVLR, Opp. Kanjurmarg Railway Station,Kanjurmarg (East), Mumbai – 400042, Maharashtra. Tel: 022 - 61150000. Fax: 67481899; E-mail: [email protected]; Website: www.sharekhan.com;CIN: U99999MH1995PLC087498. Sharekhan Ltd.: SEBI Regn. Nos. BSE- INB/INF011073351 ; CD-INE011073351; NSE– INB/INF231073330; CD-INE231073330; MSEI-INB/INF261073333 ; CD-INE261073330; DP-NSDL-IN-DP-NSDL-233-2003 ; CDSL-IN-DP-CDSL-271-2004 ; PMS-INP000000662; Mutual Fund-ARN 20669 ; Commoditytrading through Sharekhan Commodities Pvt. Ltd.: MCX-10080 ; (MCX/TCM/CORP/0425) ; NCDEX-00132 ; (NCDEX/TCM/CORP/0142) ; NCDEX SPOT-NCDEXSPOT/116/CO/11/20626; For any complaints email at [email protected] ; Disclaimer: Client should read the Risk Disclosure Document issued by SEBI & relevantexchanges and Do’s & Don’ts by MCX & NCDEX and the T & C on www.sharekhan.com before investing.
CONTENTS
Sharekhan ValueGuide December 20153
REPORT CARD EQUITY FUNDAMENTALS
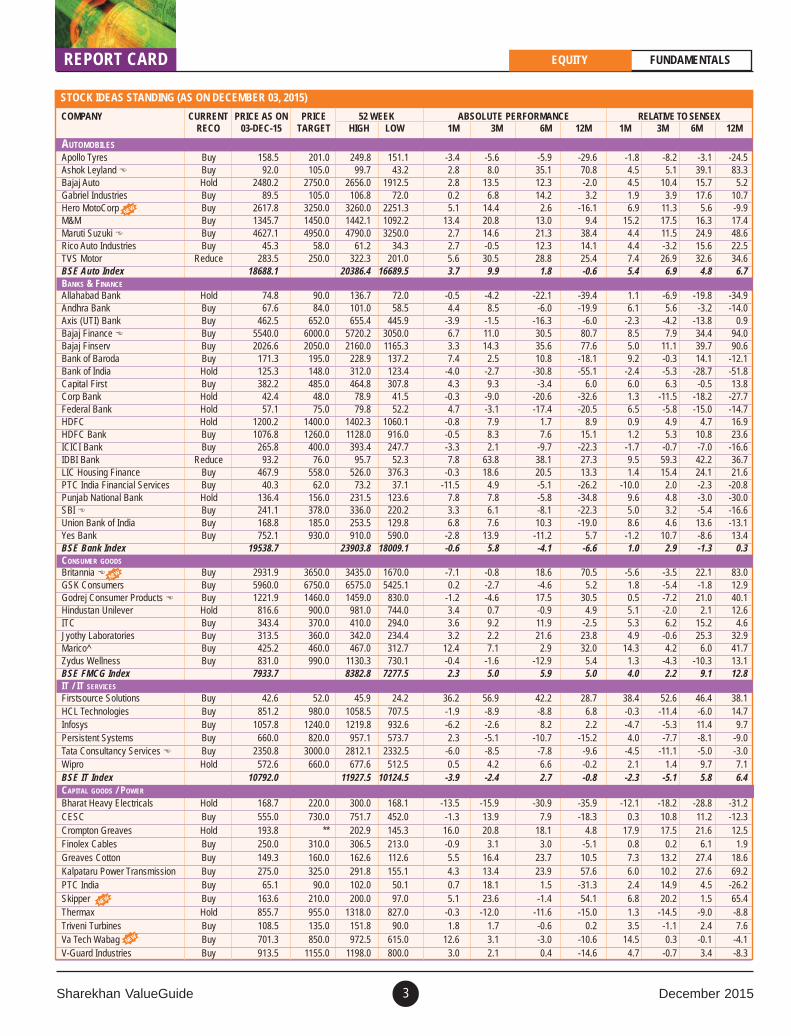
STOCK IDEAS STANDING (AS ON DECEMBER 03, 2015)
COMPANY CURRENT PRICE AS ON PRICE 52 WEEK ABSOLUTE PERFORMANCE RELATIVE TO SENSEXRECO 03-DEC-15 TARGET HIGH LOW 1M 3M 6M 12M 1M 3M 6M 12M
AUTOMOBILES
Apollo Tyres Buy 158.5 201.0 249.8 151.1 -3.4 -5.6 -5.9 -29.6 -1.8 -8.2 -3.1 -24.5Ashok Leyland Buy 92.0 105.0 99.7 43.2 2.8 8.0 35.1 70.8 4.5 5.1 39.1 83.3Bajaj Auto Hold 2480.2 2750.0 2656.0 1912.5 2.8 13.5 12.3 -2.0 4.5 10.4 15.7 5.2Gabriel Industries Buy 89.5 105.0 106.8 72.0 0.2 6.8 14.2 3.2 1.9 3.9 17.6 10.7Hero MotoCorp Buy 2617.8 3250.0 3260.0 2251.3 5.1 14.4 2.6 -16.1 6.9 11.3 5.6 -9.9M&M Buy 1345.7 1450.0 1442.1 1092.2 13.4 20.8 13.0 9.4 15.2 17.5 16.3 17.4Maruti Suzuki Buy 4627.1 4950.0 4790.0 3250.0 2.7 14.6 21.3 38.4 4.4 11.5 24.9 48.6Rico Auto Industries Buy 45.3 58.0 61.2 34.3 2.7 -0.5 12.3 14.1 4.4 -3.2 15.6 22.5TVS Motor Reduce 283.5 250.0 322.3 201.0 5.6 30.5 28.8 25.4 7.4 26.9 32.6 34.6BSE Auto Index 18688.1 20386.4 16689.5 3.7 9.9 1.8 -0.6 5.4 6.9 4.8 6.7BANKS & FINANCE
Allahabad Bank Hold 74.8 90.0 136.7 72.0 -0.5 -4.2 -22.1 -39.4 1.1 -6.9 -19.8 -34.9Andhra Bank Buy 67.6 84.0 101.0 58.5 4.4 8.5 -6.0 -19.9 6.1 5.6 -3.2 -14.0Axis (UTI) Bank Buy 462.5 652.0 655.4 445.9 -3.9 -1.5 -16.3 -6.0 -2.3 -4.2 -13.8 0.9Bajaj Finance Buy 5540.0 6000.0 5720.2 3050.0 6.7 11.0 30.5 80.7 8.5 7.9 34.4 94.0Bajaj Finserv Buy 2026.6 2050.0 2160.0 1165.3 3.3 14.3 35.6 77.6 5.0 11.1 39.7 90.6Bank of Baroda Buy 171.3 195.0 228.9 137.2 7.4 2.5 10.8 -18.1 9.2 -0.3 14.1 -12.1Bank of India Hold 125.3 148.0 312.0 123.4 -4.0 -2.7 -30.8 -55.1 -2.4 -5.3 -28.7 -51.8Capital First Buy 382.2 485.0 464.8 307.8 4.3 9.3 -3.4 6.0 6.0 6.3 -0.5 13.8Corp Bank Hold 42.4 48.0 78.9 41.5 -0.3 -9.0 -20.6 -32.6 1.3 -11.5 -18.2 -27.7Federal Bank Hold 57.1 75.0 79.8 52.2 4.7 -3.1 -17.4 -20.5 6.5 -5.8 -15.0 -14.7HDFC Hold 1200.2 1400.0 1402.3 1060.1 -0.8 7.9 1.7 8.9 0.9 4.9 4.7 16.9HDFC Bank Buy 1076.8 1260.0 1128.0 916.0 -0.5 8.3 7.6 15.1 1.2 5.3 10.8 23.6ICICI Bank Buy 265.8 400.0 393.4 247.7 -3.3 2.1 -9.7 -22.3 -1.7 -0.7 -7.0 -16.6IDBI Bank Reduce 93.2 76.0 95.7 52.3 7.8 63.8 38.1 27.3 9.5 59.3 42.2 36.7LIC Housing Finance Buy 467.9 558.0 526.0 376.3 -0.3 18.6 20.5 13.3 1.4 15.4 24.1 21.6PTC India Financial Services Buy 40.3 62.0 73.2 37.1 -11.5 4.9 -5.1 -26.2 -10.0 2.0 -2.3 -20.8Punjab National Bank Hold 136.4 156.0 231.5 123.6 7.8 7.8 -5.8 -34.8 9.6 4.8 -3.0 -30.0SBI Buy 241.1 378.0 336.0 220.2 3.3 6.1 -8.1 -22.3 5.0 3.2 -5.4 -16.6Union Bank of India Buy 168.8 185.0 253.5 129.8 6.8 7.6 10.3 -19.0 8.6 4.6 13.6 -13.1Yes Bank Buy 752.1 930.0 910.0 590.0 -2.8 13.9 -11.2 5.7 -1.2 10.7 -8.6 13.4BSE Bank Index 19538.7 23903.8 18009.1 -0.6 5.8 -4.1 -6.6 1.0 2.9 -1.3 0.3CONSUMER GOODS
Britannia Buy 2931.9 3650.0 3435.0 1670.0 -7.1 -0.8 18.6 70.5 -5.6 -3.5 22.1 83.0GSK Consumers Buy 5960.0 6750.0 6575.0 5425.1 0.2 -2.7 -4.6 5.2 1.8 -5.4 -1.8 12.9Godrej Consumer Products Buy 1221.9 1460.0 1459.0 830.0 -1.2 -4.6 17.5 30.5 0.5 -7.2 21.0 40.1Hindustan Unilever Hold 816.6 900.0 981.0 744.0 3.4 0.7 -0.9 4.9 5.1 -2.0 2.1 12.6ITC Buy 343.4 370.0 410.0 294.0 3.6 9.2 11.9 -2.5 5.3 6.2 15.2 4.6Jyothy Laboratories Buy 313.5 360.0 342.0 234.4 3.2 2.2 21.6 23.8 4.9 -0.6 25.3 32.9Marico^ Buy 425.2 460.0 467.0 312.7 12.4 7.1 2.9 32.0 14.3 4.2 6.0 41.7Zydus Wellness Buy 831.0 990.0 1130.3 730.1 -0.4 -1.6 -12.9 5.4 1.3 -4.3 -10.3 13.1BSE FMCG Index 7933.7 8382.8 7277.5 2.3 5.0 5.9 5.0 4.0 2.2 9.1 12.8IT / IT SERVICES
Firstsource Solutions Buy 42.6 52.0 45.9 24.2 36.2 56.9 42.2 28.7 38.4 52.6 46.4 38.1HCL Technologies Buy 851.2 980.0 1058.5 707.5 -1.9 -8.9 -8.8 6.8 -0.3 -11.4 -6.0 14.7Infosys Buy 1057.8 1240.0 1219.8 932.6 -6.2 -2.6 8.2 2.2 -4.7 -5.3 11.4 9.7Persistent Systems Buy 660.0 820.0 957.1 573.7 2.3 -5.1 -10.7 -15.2 4.0 -7.7 -8.1 -9.0Tata Consultancy Services Buy 2350.8 3000.0 2812.1 2332.5 -6.0 -8.5 -7.8 -9.6 -4.5 -11.1 -5.0 -3.0Wipro Hold 572.6 660.0 677.6 512.5 0.5 4.2 6.6 -0.2 2.1 1.4 9.7 7.1BSE IT Index 10792.0 11927.5 10124.5 -3.9 -2.4 2.7 -0.8 -2.3 -5.1 5.8 6.4CAPITAL GOODS / POWER
Bharat Heavy Electricals Hold 168.7 220.0 300.0 168.1 -13.5 -15.9 -30.9 -35.9 -12.1 -18.2 -28.8 -31.2CESC Buy 555.0 730.0 751.7 452.0 -1.3 13.9 7.9 -18.3 0.3 10.8 11.2 -12.3Crompton Greaves Hold 193.8 ** 202.9 145.3 16.0 20.8 18.1 4.8 17.9 17.5 21.6 12.5Finolex Cables Buy 250.0 310.0 306.5 213.0 -0.9 3.1 3.0 -5.1 0.8 0.2 6.1 1.9Greaves Cotton Buy 149.3 160.0 162.6 112.6 5.5 16.4 23.7 10.5 7.3 13.2 27.4 18.6Kalpataru Power Transmission Buy 275.0 325.0 291.8 155.1 4.3 13.4 23.9 57.6 6.0 10.2 27.6 69.2PTC India Buy 65.1 90.0 102.0 50.1 0.7 18.1 1.5 -31.3 2.4 14.9 4.5 -26.2Skipper Buy 163.6 210.0 200.0 97.0 5.1 23.6 -1.4 54.1 6.8 20.2 1.5 65.4Thermax Hold 855.7 955.0 1318.0 827.0 -0.3 -12.0 -11.6 -15.0 1.3 -14.5 -9.0 -8.8Triveni Turbines Buy 108.5 135.0 151.8 90.0 1.8 1.7 -0.6 0.2 3.5 -1.1 2.4 7.6Va Tech Wabag Buy 701.3 850.0 972.5 615.0 12.6 3.1 -3.0 -10.6 14.5 0.3 -0.1 -4.1V-Guard Industries Buy 913.5 1155.0 1198.0 800.0 3.0 2.1 0.4 -14.6 4.7 -0.7 3.4 -8.3
NEW
NEW
NEW
NEW
December 2015 Sharekhan ValueGuide4
REPORT CARDEQUITY FUNDAMENTALS
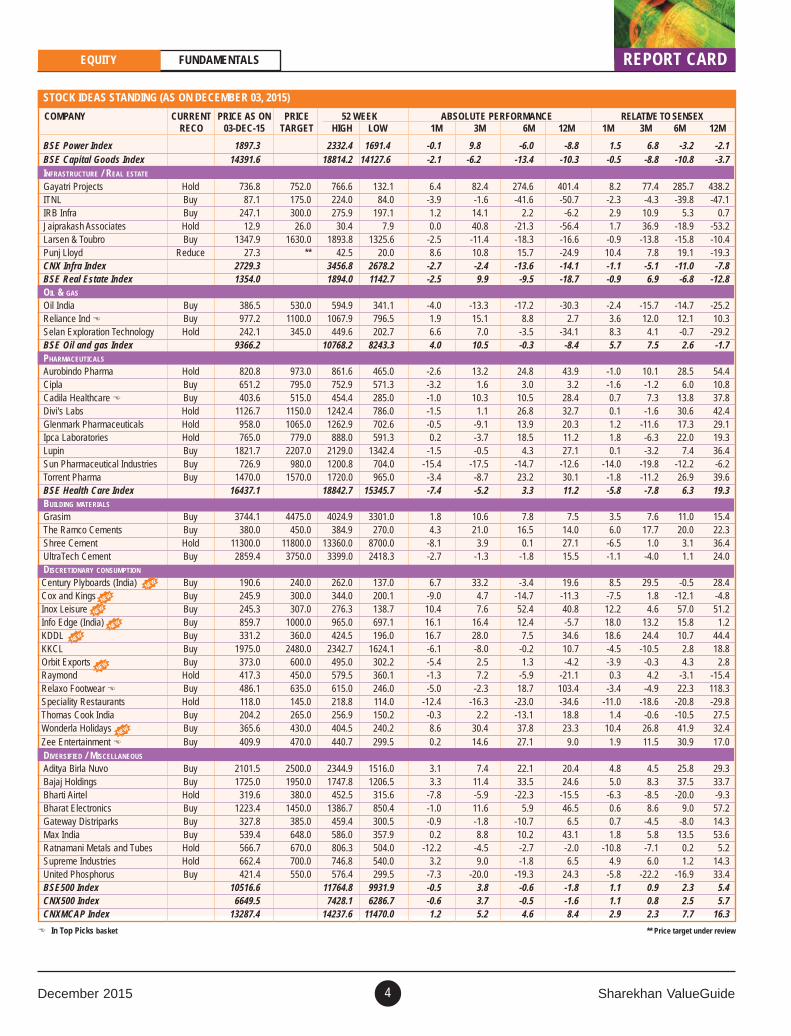
STOCK IDEAS STANDING (AS ON DECEMBER 03, 2015)
COMPANY CURRENT PRICE AS ON PRICE 52 WEEK ABSOLUTE PERFORMANCE RELATIVE TO SENSEXRECO 03-DEC-15 TARGET HIGH LOW 1M 3M 6M 12M 1M 3M 6M 12M
In Top Picks basket ** Price target under review
NEW
NEW
NEW
NEW
NEW
NEW
NEW
BSE Power Index 1897.3 2332.4 1691.4 -0.1 9.8 -6.0 -8.8 1.5 6.8 -3.2 -2.1BSE Capital Goods Index 14391.6 18814.2 14127.6 -2.1 -6.2 -13.4 -10.3 -0.5 -8.8 -10.8 -3.7INFRASTRUCTURE / REAL ESTATE
Gayatri Projects Hold 736.8 752.0 766.6 132.1 6.4 82.4 274.6 401.4 8.2 77.4 285.7 438.2ITNL Buy 87.1 175.0 224.0 84.0 -3.9 -1.6 -41.6 -50.7 -2.3 -4.3 -39.8 -47.1IRB Infra Buy 247.1 300.0 275.9 197.1 1.2 14.1 2.2 -6.2 2.9 10.9 5.3 0.7Jaiprakash Associates Hold 12.9 26.0 30.4 7.9 0.0 40.8 -21.3 -56.4 1.7 36.9 -18.9 -53.2Larsen & Toubro Buy 1347.9 1630.0 1893.8 1325.6 -2.5 -11.4 -18.3 -16.6 -0.9 -13.8 -15.8 -10.4Punj Lloyd Reduce 27.3 ** 42.5 20.0 8.6 10.8 15.7 -24.9 10.4 7.8 19.1 -19.3CNX Infra Index 2729.3 3456.8 2678.2 -2.7 -2.4 -13.6 -14.1 -1.1 -5.1 -11.0 -7.8BSE Real Estate Index 1354.0 1894.0 1142.7 -2.5 9.9 -9.5 -18.7 -0.9 6.9 -6.8 -12.8OIL & GAS
Oil India Buy 386.5 530.0 594.9 341.1 -4.0 -13.3 -17.2 -30.3 -2.4 -15.7 -14.7 -25.2Reliance Ind Buy 977.2 1100.0 1067.9 796.5 1.9 15.1 8.8 2.7 3.6 12.0 12.1 10.3Selan Exploration Technology Hold 242.1 345.0 449.6 202.7 6.6 7.0 -3.5 -34.1 8.3 4.1 -0.7 -29.2BSE Oil and gas Index 9366.2 10768.2 8243.3 4.0 10.5 -0.3 -8.4 5.7 7.5 2.6 -1.7PHARMACEUTICALS
Aurobindo Pharma Hold 820.8 973.0 861.6 465.0 -2.6 13.2 24.8 43.9 -1.0 10.1 28.5 54.4Cipla Buy 651.2 795.0 752.9 571.3 -3.2 1.6 3.0 3.2 -1.6 -1.2 6.0 10.8Cadila Healthcare Buy 403.6 515.0 454.4 285.0 -1.0 10.3 10.5 28.4 0.7 7.3 13.8 37.8Divi's Labs Hold 1126.7 1150.0 1242.4 786.0 -1.5 1.1 26.8 32.7 0.1 -1.6 30.6 42.4Glenmark Pharmaceuticals Hold 958.0 1065.0 1262.9 702.6 -0.5 -9.1 13.9 20.3 1.2 -11.6 17.3 29.1Ipca Laboratories Hold 765.0 779.0 888.0 591.3 0.2 -3.7 18.5 11.2 1.8 -6.3 22.0 19.3Lupin Buy 1821.7 2207.0 2129.0 1342.4 -1.5 -0.5 4.3 27.1 0.1 -3.2 7.4 36.4Sun Pharmaceutical Industries Buy 726.9 980.0 1200.8 704.0 -15.4 -17.5 -14.7 -12.6 -14.0 -19.8 -12.2 -6.2Torrent Pharma Buy 1470.0 1570.0 1720.0 965.0 -3.4 -8.7 23.2 30.1 -1.8 -11.2 26.9 39.6BSE Health Care Index 16437.1 18842.7 15345.7 -7.4 -5.2 3.3 11.2 -5.8 -7.8 6.3 19.3BUILDING MATERIALS
Grasim Buy 3744.1 4475.0 4024.9 3301.0 1.8 10.6 7.8 7.5 3.5 7.6 11.0 15.4The Ramco Cements Buy 380.0 450.0 384.9 270.0 4.3 21.0 16.5 14.0 6.0 17.7 20.0 22.3Shree Cement Hold 11300.0 11800.0 13360.0 8700.0 -8.1 3.9 0.1 27.1 -6.5 1.0 3.1 36.4UltraTech Cement Buy 2859.4 3750.0 3399.0 2418.3 -2.7 -1.3 -1.8 15.5 -1.1 -4.0 1.1 24.0DISCRETIONARY CONSUMPTION
Century Plyboards (India) Buy 190.6 240.0 262.0 137.0 6.7 33.2 -3.4 19.6 8.5 29.5 -0.5 28.4Cox and Kings Buy 245.9 300.0 344.0 200.1 -9.0 4.7 -14.7 -11.3 -7.5 1.8 -12.1 -4.8Inox Leisure Buy 245.3 307.0 276.3 138.7 10.4 7.6 52.4 40.8 12.2 4.6 57.0 51.2Info Edge (India) Buy 859.7 1000.0 965.0 697.1 16.1 16.4 12.4 -5.7 18.0 13.2 15.8 1.2KDDL Buy 331.2 360.0 424.5 196.0 16.7 28.0 7.5 34.6 18.6 24.4 10.7 44.4KKCL Buy 1975.0 2480.0 2342.7 1624.1 -6.1 -8.0 -0.2 10.7 -4.5 -10.5 2.8 18.8Orbit Exports Buy 373.0 600.0 495.0 302.2 -5.4 2.5 1.3 -4.2 -3.9 -0.3 4.3 2.8Raymond Hold 417.3 450.0 579.5 360.1 -1.3 7.2 -5.9 -21.1 0.3 4.2 -3.1 -15.4Relaxo Footwear Buy 486.1 635.0 615.0 246.0 -5.0 -2.3 18.7 103.4 -3.4 -4.9 22.3 118.3Speciality Restaurants Hold 118.0 145.0 218.8 114.0 -12.4 -16.3 -23.0 -34.6 -11.0 -18.6 -20.8 -29.8Thomas Cook India Buy 204.2 265.0 256.9 150.2 -0.3 2.2 -13.1 18.8 1.4 -0.6 -10.5 27.5Wonderla Holidays Buy 365.6 430.0 404.5 240.2 8.6 30.4 37.8 23.3 10.4 26.8 41.9 32.4Zee Entertainment Buy 409.9 470.0 440.7 299.5 0.2 14.6 27.1 9.0 1.9 11.5 30.9 17.0DIVERSIFIED / MISCELLANEOUS
Aditya Birla Nuvo Buy 2101.5 2500.0 2344.9 1516.0 3.1 7.4 22.1 20.4 4.8 4.5 25.8 29.3Bajaj Holdings Buy 1725.0 1950.0 1747.8 1206.5 3.3 11.4 33.5 24.6 5.0 8.3 37.5 33.7Bharti Airtel Hold 319.6 380.0 452.5 315.6 -7.8 -5.9 -22.3 -15.5 -6.3 -8.5 -20.0 -9.3Bharat Electronics Buy 1223.4 1450.0 1386.7 850.4 -1.0 11.6 5.9 46.5 0.6 8.6 9.0 57.2Gateway Distriparks Buy 327.8 385.0 459.4 300.5 -0.9 -1.8 -10.7 6.5 0.7 -4.5 -8.0 14.3Max India Buy 539.4 648.0 586.0 357.9 0.2 8.8 10.2 43.1 1.8 5.8 13.5 53.6Ratnamani Metals and Tubes Hold 566.7 670.0 806.3 504.0 -12.2 -4.5 -2.7 -2.0 -10.8 -7.1 0.2 5.2Supreme Industries Hold 662.4 700.0 746.8 540.0 3.2 9.0 -1.8 6.5 4.9 6.0 1.2 14.3United Phosphorus Buy 421.4 550.0 576.4 299.5 -7.3 -20.0 -19.3 24.3 -5.8 -22.2 -16.9 33.4BSE500 Index 10516.6 11764.8 9931.9 -0.5 3.8 -0.6 -1.8 1.1 0.9 2.3 5.4CNX500 Index 6649.5 7428.1 6286.7 -0.6 3.7 -0.5 -1.6 1.1 0.8 2.5 5.7CNXMCAP Index 13287.4 14237.6 11470.0 1.2 5.2 4.6 8.4 2.9 2.3 7.7 16.3

Sharekhan ValueGuide December 20155
2015: Win some; lose some
FROM SHAREKHAN’S DESK
from
sha
rekh
an’s
des
k Two thousand and fifteen began on a high note. After winning the majority mandate in thegeneral election of May 2014, the Narendra Modi-led National Democratic Alliance baggedthe key states of Haryana and Maharashtra in the assembly elections in late 2014 and alsogarnered enough seats in the Jammu & Kashmir election to become part of the ruling alliancein the state.
No wonder, a lot was expected from the government on the policy front, given its strongposition and political capital gained in 2014. Backed by policy activism and improving macroconditions, the economy was expected to revive sooner than later and start reflecting on corporateearnings from FY2016 itself.
However, the hopes were belied in 2015. Key policy bills are stuck in the upper house of theParliament where the new government lacks a brute majority and has been unable to form apolitical consensus to push through the reforms. Perhaps the government also underestimatedthe extent of the economic damage and the complexity of repairing the economy. On the otherhand, market participants are guilty of building unrealistic hopes of a quick recovery in theeconomy.
But all is not lost yet. The government on its part has taken several executive decisions that arereviving and revitalising certain pockets of the economy, like the road, power transmission anddistribution, and mining sectors, and addressing the ills of the power sector (including therestructuring of the state electricity boards). Additionally, the government has made efforts tostreamline the delivery of subsidies and other rural schemes (thereby reducing the leakage) andmoderated the hike in the support prices for the procurement of agricultural produce to controlstructurally high inflationary trends. This has not only resulted in a better fiscal health but alsoprovided enough room to the Reserve Bank of India to reduce the policy rates by 125 basispoints in the last one year.
Consequently, the macro conditions have distinctly improved in 2015 and built the right basefor the economy. At the same time, the expectations have mellowed significantly now. It isclearly visible in the 12-14% cut in the consensus estimate of the Sensex earnings over FY2016and FY2017. On the policy front, the government has turned more flexible and receptive to thedemand of the opposition parties in a bid to make progress on the key reforms including theGoods and Services Tax (GST) Bill. The rationalisation of the indirect tax regime under theGST could potentially add 1.0-1.5% to India’s gross domestic product (GDP) growth in thecoming years.
Globally, the dynamics are set to change after a status quo for the past seven years. Within thedeveloped economies, the USA would begin tightening its monetary policy with a rate hike inthe forthcoming policy meet. On the other hand, Europe, China and Japan are likely to pursuea very accommodative policy stance in the foreseeable future. The move could cause gyrationsin the financial markets especially the foreign exchange and emerging equity markets.
However, past experience (including the recent event of the withdrawal of quantitative easingto the tune of $85 billion per month by the USA) shows that the markets quickly adjust tochanges and volatility is seen more during the run-up to an event rather than after it. Moreover,India is much better placed now to face any global upheaval. As compared to being part of the“Fragile Five” group of stressed economies India is seen as one of the few bright spots globallytoday, thanks to the good work done by the new government and a very capable economist atthe helm of the RBI.
Importantly for investors, the macro situation is better than the last year’s. The government isreaching out to the opposition parties to build a political consensus to push through reforms.Corporate earnings would look up on a low base effect and a gradual reflection of the improvedmacros in the business momentum. Plus, valuations are comfortable. An ideal set-up for stockpickers and long-term investors!

December 2015 Sharekhan ValueGuide6
EQUITY FUNDAMENTALSSHAREKHAN TOP PICKS
Sharekhan Top PicksSHAREKHAN TOP PICKS
Benchmark indices continued to move in a narrow range with anegative bias in November of 2015. The unfavourable results of Biharstate elections and lacklustre Q2FY2016 performance of corporateswere the key concerning factors locally. The rising probability of arate hike in the USA and the surge in volatility in the Chinese marketadded to the weakness in market sentiment.
The benchmark indices, Nifty and Sensex, ended the month with aloss of 1.6% and 1.9% respectively since our last revision of the TopPicks basket on October 31, 2015. The Top Picks basket performedin line with the benchmark indices with a decline of 1.9% in thesame period. However, it should be noted that this was despite adent of close to 15% taken in Dr Reddy’s Laboratories (DRL) afterthe unexpected warning letter for three of its manufacturing plants
*CMP as on November 30, 2015 # Price target for next 6-12 months ** Under review
NAME CMP* PER ROE (%) PRICE UPSIDE(RS) FY15 FY16E FY17E FY15 FY16E FY17E TARGET (RS)# (%)
Ashok Leyland 95 115.1 27 17.3 4.9 18.3 24.8 105 11
Bajaj Finance 5,505 30.8 25 19.5 20.3 19.5 19.2 6,000 9
Britannia Industries 2,917 64.5 41 33.8 53.3 55.9 47.5 3,650 25
Cadila Healthcare 398 35.5 26.3 19.3 27.3 28.4 29.3 515 30
GCPL 1,245 45.9 37.2 30.2 24.6 25.7 25.8 1,460 17
IndusInd Bank 932 27.6 22.2 17.5 19.2 20.5 21.5 1,108 19
Maruti Suzuki 4,559 37.1 25.5 20.1 16.6 20.8 22.2 4,950 9
Relaxo Footwear 510 59.3 45.9 34.0 22.1 22.3 24.9 635 25
Reliance Industries 969 12.1 12.4 10.4 10.8 9.7 10.5 1,100 14
SBI 249 14.2 10.4 7.8 10.6 13.2 15.7 378 52
TCS 2,371 87.5 70.8 57.5 33.7 32.7 29.7 3,000 27
Zee Entertainment 410 4.1 3.3 3.0 19.0 18.8 20.6 470 15
ABSOLUTE RETURNS (TOP PICKS VS BENCHMARK INDICES) % CONSTANTLY BEATING NIFTY AND SENSEX (CUMULATIVE RETURNS) SINCEAPRIL 2009Sharekhan Sensex Nifty CNX
(Top Picks) MIDCAP
YTD CY2015 13.8 -5.0 -4.2 5.3
CY2014 63.6 29.9 30.9 55.1
CY2013 12.4 8.5 6.4 -5.6
CY2012 35.1 26.2 29.0 36.0
CY2011 -20.5 -21.2 -21.7 -25.0
CY2010 16.8 11.5 12.9 11.5
CY2009 116.1 76.1 72.0 114.0
Since inception 422.7 160.5 160.3 265.7(Jan 2009)
CONSISTENT OUTPERFORMANCE (ABSOLUTE RETURNS; NOT ANNUALISED) (%)1 month 3 months 6 months 1 year 3 years 5 years
Top Picks -1.9 2.4 0.7 16.3 114.9 120.0
Sensex -1.9 -0.5 -6.1 -8.6 35.5 31.0
Nifty -1.6 -0.4 -6.0 -7.2 35.2 32.6
CNX Mid-cap 0.1 1.4 0.5 7.2 62.9 48.2
Please note the returns are based on the assumption that at the beginning of each month an equal amount was invested in each stock of the Top Picks basket
earlier in the month. Consequently, we had replaced DRL with GodrejConsumer Products on an intra-month basis. Excluding the impactof DRL the Top Picks basket declined by 0.7% during the last month.
We are not making any change in the Top Picks basket for the eventfulmonth of December. In the next month, central bankers would be infocus with the scheduled review meeting of the Reserve Bank of Indiain India and that of the US Federal Reserve and European CentralBank in the two developed regions of the world. Expectations arealso building up from the ongoing winter session of the Parliamentsince the government has reached out to the opposition parties forthe passage of the Goods and Services Tax Bill and other criticalpending reforms.
Sharekhan ValueGuide December 20157
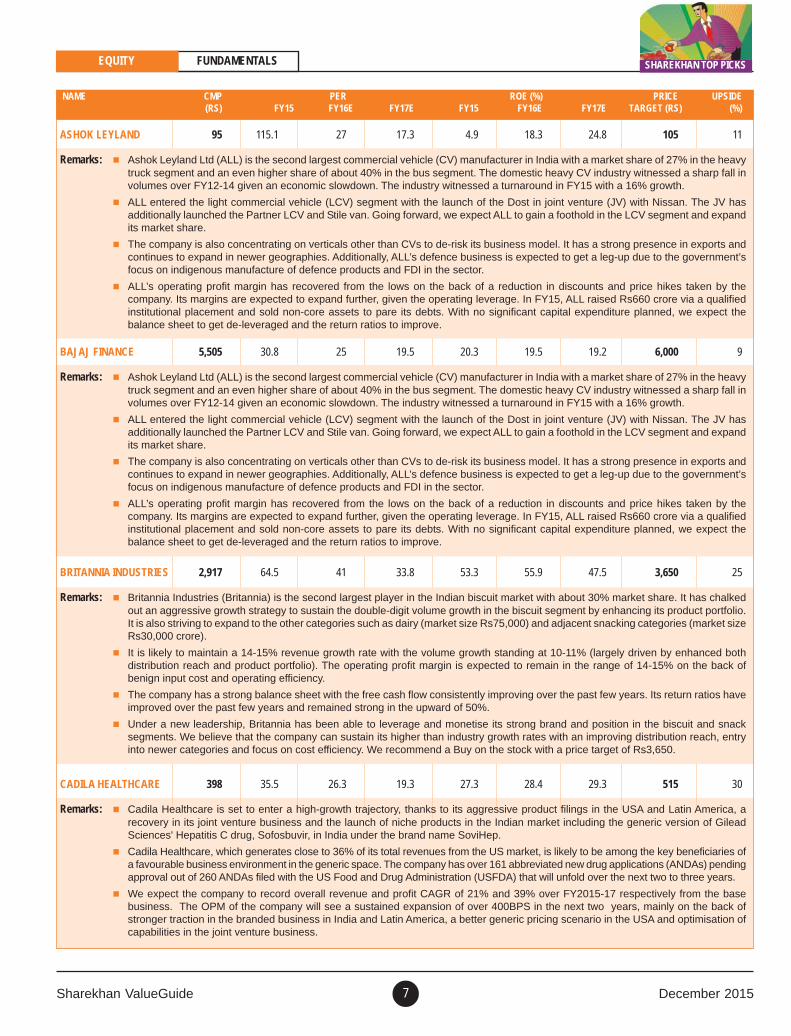
NAME CMP PER ROE (%) PRICE UPSIDE(RS) FY15 FY16E FY17E FY15 FY16E FY17E TARGET (RS) (%)
ASHOK LEYLAND 95 115.1 27 17.3 4.9 18.3 24.8 105 11
Remarks: Ashok Leyland Ltd (ALL) is the second largest commercial vehicle (CV) manufacturer in India with a market share of 27% in the heavytruck segment and an even higher share of about 40% in the bus segment. The domestic heavy CV industry witnessed a sharp fall involumes over FY12-14 given an economic slowdown. The industry witnessed a turnaround in FY15 with a 16% growth.
ALL entered the light commercial vehicle (LCV) segment with the launch of the Dost in joint venture (JV) with Nissan. The JV hasadditionally launched the Partner LCV and Stile van. Going forward, we expect ALL to gain a foothold in the LCV segment and expandits market share.
The company is also concentrating on verticals other than CVs to de-risk its business model. It has a strong presence in exports andcontinues to expand in newer geographies. Additionally, ALL’s defence business is expected to get a leg-up due to the government’sfocus on indigenous manufacture of defence products and FDI in the sector.
ALL’s operating profit margin has recovered from the lows on the back of a reduction in discounts and price hikes taken by thecompany. Its margins are expected to expand further, given the operating leverage. In FY15, ALL raised Rs660 crore via a qualifiedinstitutional placement and sold non-core assets to pare its debts. With no significant capital expenditure planned, we expect thebalance sheet to get de-leveraged and the return ratios to improve.
EQUITY FUNDAMENTALS SHAREKHAN TOP PICKS
BAJAJ FINANCE 5,505 30.8 25 19.5 20.3 19.5 19.2 6,000 9
Remarks: Ashok Leyland Ltd (ALL) is the second largest commercial vehicle (CV) manufacturer in India with a market share of 27% in the heavytruck segment and an even higher share of about 40% in the bus segment. The domestic heavy CV industry witnessed a sharp fall involumes over FY12-14 given an economic slowdown. The industry witnessed a turnaround in FY15 with a 16% growth.
ALL entered the light commercial vehicle (LCV) segment with the launch of the Dost in joint venture (JV) with Nissan. The JV hasadditionally launched the Partner LCV and Stile van. Going forward, we expect ALL to gain a foothold in the LCV segment and expandits market share.
The company is also concentrating on verticals other than CVs to de-risk its business model. It has a strong presence in exports andcontinues to expand in newer geographies. Additionally, ALL’s defence business is expected to get a leg-up due to the government’sfocus on indigenous manufacture of defence products and FDI in the sector.
ALL’s operating profit margin has recovered from the lows on the back of a reduction in discounts and price hikes taken by thecompany. Its margins are expected to expand further, given the operating leverage. In FY15, ALL raised Rs660 crore via a qualifiedinstitutional placement and sold non-core assets to pare its debts. With no significant capital expenditure planned, we expect thebalance sheet to get de-leveraged and the return ratios to improve.
BRITANNIA INDUSTRIES 2,917 64.5 41 33.8 53.3 55.9 47.5 3,650 25
Remarks: Britannia Industries (Britannia) is the second largest player in the Indian biscuit market with about 30% market share. It has chalkedout an aggressive growth strategy to sustain the double-digit volume growth in the biscuit segment by enhancing its product portfolio.It is also striving to expand to the other categories such as dairy (market size Rs75,000) and adjacent snacking categories (market sizeRs30,000 crore).
It is likely to maintain a 14-15% revenue growth rate with the volume growth standing at 10-11% (largely driven by enhanced bothdistribution reach and product portfolio). The operating profit margin is expected to remain in the range of 14-15% on the back ofbenign input cost and operating efficiency.
The company has a strong balance sheet with the free cash flow consistently improving over the past few years. Its return ratios haveimproved over the past few years and remained strong in the upward of 50%.
Under a new leadership, Britannia has been able to leverage and monetise its strong brand and position in the biscuit and snacksegments. We believe that the company can sustain its higher than industry growth rates with an improving distribution reach, entryinto newer categories and focus on cost efficiency. We recommend a Buy on the stock with a price target of Rs3,650.
CADILA HEALTHCARE 398 35.5 26.3 19.3 27.3 28.4 29.3 515 30
Remarks: Cadila Healthcare is set to enter a high-growth trajectory, thanks to its aggressive product filings in the USA and Latin America, arecovery in its joint venture business and the launch of niche products in the Indian market including the generic version of GileadSciences' Hepatitis C drug, Sofosbuvir, in India under the brand name SoviHep.
Cadila Healthcare, which generates close to 36% of its total revenues from the US market, is likely to be among the key beneficiaries ofa favourable business environment in the generic space. The company has over 161 abbreviated new drug applications (ANDAs) pendingapproval out of 260 ANDAs filed with the US Food and Drug Administration (USFDA) that will unfold over the next two to three years.
We expect the company to record overall revenue and profit CAGR of 21% and 39% over FY2015-17 respectively from the basebusiness. The OPM of the company will see a sustained expansion of over 400BPS in the next two years, mainly on the back ofstronger traction in the branded business in India and Latin America, a better generic pricing scenario in the USA and optimisation ofcapabilities in the joint venture business.

December 2015 Sharekhan ValueGuide8
NAME CMP PER ROE (%) PRICE UPSIDE(RS) FY15 FY16E FY17E FY15 FY16E FY17E TARGET (RS) (%)
GODREJ CONSUMERS 1,245 45.9 37.2 30.2 24.6 25.7 25.8 1,460 17
Remarks: Godrej Consumer Products Ltd (GCPL) is one of the largest FMCG companies in India with a strong portfolio of brands catering to thematured and fast growing categories in the domestic market. With a slew of acquisitions in markets such as Africa, Latin America andIndonesia, it has expanded its base globally (about 40% of its revenues come from the international market.
GCPL's domestic business is performing well in a weak demand environment (grew by 9% in Q2FY2016). The key reason for a betterperformance is a presence in the under-penetrated categories such as hair color and mosquito repellent, sustained innovation in theportfolio and expansion in distribution reach. On the other hand, the business in Africa is in a consolidation phase while the Indonesianbusiness is standing tall in a favourable demand environment.
Benign input prices would continue to boost its profitability and help GCPL to take adequate promotional actions and do higher brandinvestment in a weak demand environment.
GCPL's long-term growth prospects remain intact and we expect its earnings to grow at a CAGR of above 20% over the next two tothree years. Thus, better growth prospects and strong earning visibility make it one of the better picks in the mid-cap FMCG space. Wemaintain our Buy recommendation on the stock.
INDUSIND BANK 932 27.6 22.2 17.5 19.2 20.5 21.5 1,108 19
Remarks: IndusInd Bank is among the fastest growing banks (a 27% CAGR growth over FY10-15) having a loan book of Rs68,700 crore and 811branches across the country. About 25% of the bank’s book pertains to vehicle finance, which is a high-yielding category and isshowing signs of recovery.
Given the aggressive measures taken by the management, the deposit profile has improved considerably (a CASA ratio of 34%).Going ahead, the bank would follow a differentiated branch expansion strategy (a 5% branch market share in identified centers) thatwould help ensure healthy savings accounts and retail deposit growth.
Despite a weak economic growth and a higher proportion of vehicle finance book the bank has maintained its asset quality. With totalstressed loans (restructured loans + gross NPAs) forming just 1.4% of the book, the bank’s asset quality is among the best in the system.
A likely revival in the economy will further fuel growth in the consumer finance division and strong capital ratios will support the growthplans. The stock is trading at 3.3x its FY17E book value (not factoring in the QIP issue). Given the strong loan growth, high RoAs andhealthy asset quality, the stock should continue to trade at premium valuation. We have a positive outlook on the stock.
MARUTI SUZUKI 4,559 37.1 25.5 20.1 16.6 20.8 22.2 4,950 9
Remarks: Maruti Suzuki India Ltd (MSIL) is the market leader in the domestic passenger vehicle (PV) industry. In FY2015, as against an industrygrowth of a modest 3.9% MSIL has grown its volumes by 11.1% and in the process expanded its market share by 441BPS to 45%.
The company further strengthened its sales and service network, and added 309 outlets in FY15. Additionally, the drive undertaken byits management to tap the potential in rural areas paid rich dividends in difficult times for the industry and in the face of rising competitiveintensity; this reaffirms the resilience of MSIL’s positioning and business model.
MSIL’s new sedan, Ciaz, has received a positive response from the market and helped MSIL establish a presence in the segment.Also, with the new premium cross-over, ie S-Cross (to be retailed at exclusive Nexa outlets) the company is looking to move up theladder. Further, the recent launch of the new premium hatchback, ie Baleno, which has been priced aggressively as compared withpeers, is expected to help further gain market share. MSIL has a pipeline of new launches over the next few years, with the mostimportant being the entry into the compact utility vehicle and light commercial vehicle segments.
We expect customer sentiment to improve on the back of a strong government at the centre. Additionally the PV segment is expectedto benefit from the pent-up demand over the past two years; this will benefit MSIL the most due to its high market share in the entrylevel segment.
RELAXO FOOTWEAR 510 59.3 45.9 34.0 22.1 22.3 24.9 635 25
Remarks: Relaxo Footwear is present in the fast-growing footwear category, wherein it caters to customers with its four top-of-the-mind-recallbrands, viz, Hawaii, Sparx, Flite and Schoolmate. In the last quarter it also added another brand, Bahamas, to its product portfolio.
Relaxo has a proactive approach towards both brand building and creating capacities. To build its brand and create pull, like FMCGplayers it continues to rope Bollywood celebrities and this creates an aspirational quotient for its brands. On the one hand, thecompany is creating strong consumer centric aspiration for the consumers; on the other hand, it is keeping its eye on quality and thusdoes not believe in outsourcing. It is in the process of building capacity for future. Despite the current capacity (180 million pieces perannuam) that would take care of growth in the next three years, the company has bought a 15-acre land at Bhiwadi to built additionalcapacity to serve the future requirements.
Relaxo’s strong presence in the lucrative mid priced footwear segment (through its top-of-the-mind-recall brands like Hawaii, Flite andSparx) along with its integrated manufacturing set-up, lean working capital requirement and vigilant management puts it in a sweetspot to cash in on the strong growth opportunity unfolding in the footwear category due to a shift from unbranded to branded products.We thus maintain our Buy rating on the stock. We also roll over our multiple from FY2017 estimate to FY2018 estimate (valuing thestock at 33x FY2018E) with a price target of Rs635.
EQUITY FUNDAMENTALSSHAREKHAN TOP PICKS

Sharekhan ValueGuide December 20159
NAME CMP PER ROE (%) PRICE UPSIDE(RS) FY15 FY16E FY17E FY15 FY16E FY17E TARGET (RS) (%)
RELIANCE INDUSTRIES 969 12.1 12.4 10.4 10.8 9.7 10.5 1,100 14
Remarks: Reliance Industries Ltd (RIL) has a strong presence in the refining, petrochemical and upstream exploration businesses. The refiningdivision of the company is the highest contributor to its earnings and is operating efficiently with a better gross refining margin (GRM)compared with its peers in the domestic market due to the ability of its plant to refine more of heavier crude. The exploration businessremains weak due to low production in the Krishna-Godavari-D6 (KG-D6) field and weak pricing of global fuel prices. However, capitalemployed and profit contribution from the exploration business is low.
Moreover, the upcoming incremental capacities in the petrochemical and refinery businesses are going to drive the future earnings growthsubstantially as the downstream businesses are on the driving seat and contributing the lion’s share of the profitability and cash flow.
After a strong GRM in H1FY2016, we expect the GRM to remain healthy for the whole year. The stock is available at an attractivevaluation considering the size, strong balance sheet and cash flow generating ability of the company.
SBI 249 14.2 10.4 7.8 10.6 13.2 15.7 378 52
Remarks: SBI is India's largest bank in terms of most comparable parameters such as assets size, branch network (18,000 branches) andcustomer base. The bank has a market share of ~18% and along with its associate banks it commands a market share of over 25% inthe banking system. Therefore, with a revival in the investment cycle and pick-up in consumption the bank is likely to benefit significantlyin terms of loan growth and profitability.
SBI’s asset quality is relatively better compared with the other public sector banks (PSBs; its stressed loans stand at ~8.5% vs ~13.5%of the other PSBs) and has been showing improving trends in the past few quarters. While the pressure on the asset quality maycontinue in the near term, a higher tier-1 CAR (9.6%) and an improving operating performance remain comforting factors.
Going ahead, SBI will look to merge its associate banks which will give an unmatched hold in the domestic banking sector and boosteconomies of scale. In addition, the likely monetisation of the insurance and other subsidiaries will strengthen the capital position ofthe bank. The bank may also benefit from the government’s plans to infuse capital into the PSBs. SBI is a better pick among thegovernment-owned banks and is reasonably valued at the current levels.
TCS 2,371 87.5 70.8 57.5 33.7 32.7 29.7 3,000 27
Remarks: TCS pioneered the IT services outsourcing business from India and is the largest IT service firm in the country. It is a leader in mostservice offerings and has further consolidated its position as a full-service provider by delivering a robust financial and operationalperformance consistently over the years.
The consistency and predictability of its earnings performance has put the company at the top of its league. TCS’s managementremains positive on the digital technologies space, which grew by 10.7% QoQ, forms 13.3% of the revenues as compared with 12.5%in Q1FY2016. The management remains confident about the growth trajectory of the digital space for the coming years. Given theusual seasonal weakness in H2, it expects a soft revenue growth in the next two quarters. Further, it expects weakness in Diligenta(insurance) and Japan (integration issues related to the Mitsubishi acquisition) to continue for few more quarters.
We remain positive on TCS, given its strong positioning, scale advantage and head start in the digital technologies space (the highestamong the top Indian IT companies), which justify the valuation premium for TCS over the others.
ZEE ENTERTAINMENT 410 4.1 3.3 3.0 19.0 18.8 20.6 470 15
Remarks: Among the key stakeholders of the domestic TV industry, we expect the broadcasters to be the prime beneficiary of the mandatorydigitisation process initiated by the government. The broadcasters would benefit from higher subscription revenues at the least incrementalcapex as the subscriber declaration improves in the cable industry.
The management maintains that the advertisement spending will continue to grow in double digits going ahead and ZEEL will be ableto outperform the same. The growth in the advertisement spending will be driven by an improvement in the macro-economic factorsand the fact the ZEEL is well placed to capture the emerging opportunities being a leader in terms of market share.
ZEEL continues to outperform the broadcasting advertising market. We expect the momentum to continue with an improvement in themacro economy. The management indicated the strong momentum in the advertisement revenue growth would continue led by marketshare gains and improvement in spending from segments like FMCG, e-commerce, consumer durables and telecom companies.Subscription revenues are also expected to benefit from the run-up phases III and IV of the digitisation process (to be more visible inFY2017 and FY2018). We continue to see ZEEL as the prime beneficiary of the macro revival and digitisation.
EQUITY FUNDAMENTALS SHAREKHAN TOP PICKS

December 2015 Sharekhan ValueGuide10
WEALTH CREATOR PORTFOLIO EQUITY FUNDAMENTALS
Wealth Creator portfolioWEALTH CREATOR PORTFOLIO NOVEMBER 30, 2015
COMPARATIVE RETURNSParticulars Returns (as on on November 30, 2015)
Since inception (August 21, 2014)
Wealth Creator folio (weighted average returns) 9.0
- Large-cap (64%) 9.3
- Mid-cap (36%) 8.3
Sensex -0.8
Nifty 2.1
CNX Mid-cap 18.5
UPDATE ON WEALTH CREATOR PORTFOLIOSr No Scrip Weights Reco price (Rs) Price target (Rs) Potential upside 30-Oct-2015 March-18
Large-caps (64% weightage; 8% each))
1 Axis Bank 8% 469 1210 158.1%
2 Larsen & Toubro 8% 1374 3800 176.6%
3 Maruti Suzuki 8% 4577 8750 91.2%
4 Cummins 8% 990 1708 72.6%
5 State Bank of India 8% 250 580 131.6%
6 Sun Pharmaceutical 8% 731 1650 125.8%
7 Tata Consultancy Services 8% 2365 5100 115.6%
8 Tata Motors DVR 8% 297 675 127.0%
Mid-caps (36% weightage; 4% each)
9 PTC India Financials 4% 41 112 175.9%
10 V-Guard 4% 925 2100 127.1%
11 Gateway Distripark 4% 342 810 137.1%
12 IRB Infra 4% 255 650 155.2%
13 Network 18 Media 4% 52 135 161.9%
14 Gabriel India 4% 89 200 124.0%
15 Century Plyboard 4% 192 440 129.1%
16 Triveni Turbines 4% 109 265 142.2%
17 Dhanuka Agritech 4% 491 1150 134.4%
Objective: To build a balanced and actively managed portfolio ofquality companies that will help create meaningful wealth forinvestors in the multi-year rally expected in the Indian equity market.
In addition to some bottom-up picks, the portfolio contains stocksidentified based on three key themes:
Policy push: Stocks from sectors benefiting from improvementin the policy environment
Early gainers: Beneficiaries of an economic recovery (stocks fromauto, banking & financial services, logistic sectors)
Evergreen: Steady performers that provide stable and consistentreturns including urban consumption plays
Portfolio performance review Wealth Creator folio has appreciated by 9% (weighted average
returns) since its inception comprehensively beating the returnsfrom the benchmark indices.
No changes/revisions suggested in the folio in the Month ofNovember 2015. Price as on on November 30, 2015.
* Please note we see scope for upward revision in target price (3-year) of some of the stocks depending on the extent of economic recovery and will keep updating on the same
Sharekhan ValueGuide December 201511
STOCK UPDATE EQUITY FUNDAMENTALS
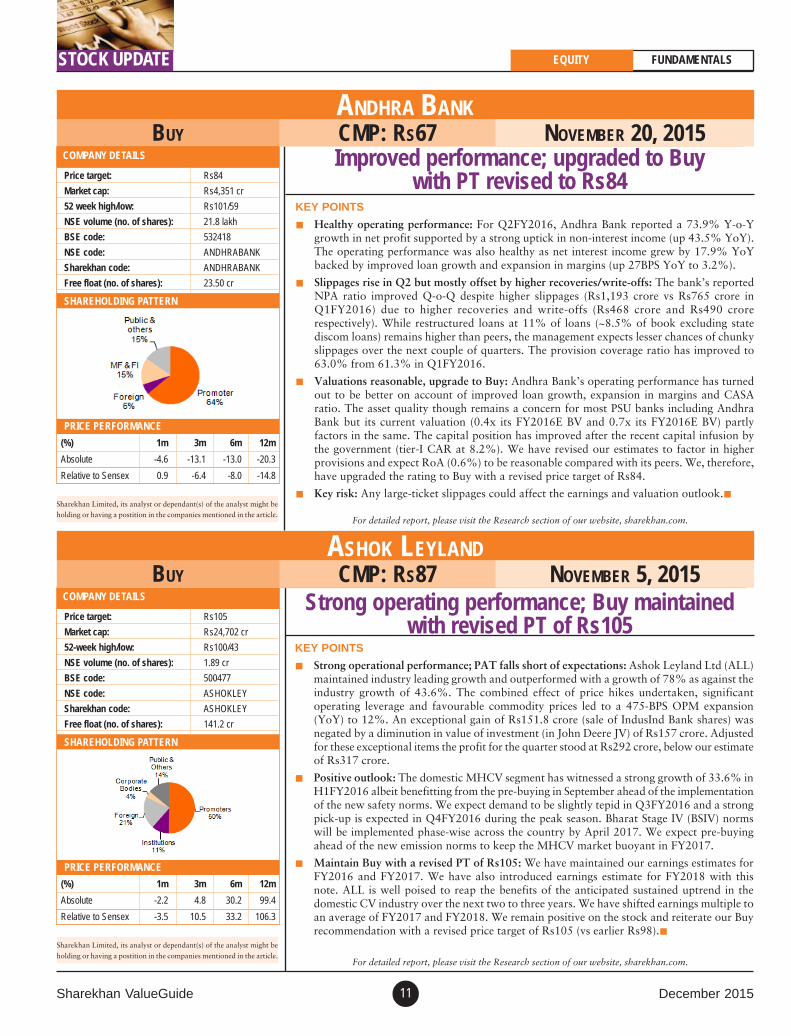
Improved performance; upgraded to Buywith PT revised to Rs84
COMPANY DETAILS
Price target: Rs84
Market cap: Rs4,351 cr
52 week high/low: Rs101/59
NSE volume (no. of shares): 21.8 lakh
BSE code: 532418
NSE code: ANDHRABANK
Sharekhan code: ANDHRABANK
Free float (no. of shares): 23.50 cr
(%) 1m 3m 6m 12m
Absolute -4.6 -13.1 -13.0 -20.3
Relative to Sensex 0.9 -6.4 -8.0 -14.8
PRICE PERFORMANCE
BUY CMP: RS67 NOVEMBER 20, 2015ANDHRA BANK
KEY POINTS
Healthy operating performance: For Q2FY2016, Andhra Bank reported a 73.9% Y-o-Ygrowth in net profit supported by a strong uptick in non-interest income (up 43.5% YoY).The operating performance was also healthy as net interest income grew by 17.9% YoYbacked by improved loan growth and expansion in margins (up 27BPS YoY to 3.2%).
Slippages rise in Q2 but mostly offset by higher recoveries/write-offs: The bank’s reportedNPA ratio improved Q-o-Q despite higher slippages (Rs1,193 crore vs Rs765 crore inQ1FY2016) due to higher recoveries and write-offs (Rs468 crore and Rs490 crorerespectively). While restructured loans at 11% of loans (~8.5% of book excluding statediscom loans) remains higher than peers, the management expects lesser chances of chunkyslippages over the next couple of quarters. The provision coverage ratio has improved to63.0% from 61.3% in Q1FY2016.
Valuations reasonable, upgrade to Buy: Andhra Bank’s operating performance has turnedout to be better on account of improved loan growth, expansion in margins and CASAratio. The asset quality though remains a concern for most PSU banks including AndhraBank but its current valuation (0.4x its FY2016E BV and 0.7x its FY2016E BV) partlyfactors in the same. The capital position has improved after the recent capital infusion bythe government (tier-I CAR at 8.2%). We have revised our estimates to factor in higherprovisions and expect RoA (0.6%) to be reasonable compared with its peers. We, therefore,have upgraded the rating to Buy with a revised price target of Rs84.
Key risk: Any large-ticket slippages could affect the earnings and valuation outlook.
SHAREHOLDING PATTERN
Sharekhan Limited, its analyst or dependant(s) of the analyst might beholding or having a postition in the companies mentioned in the article.
For detailed report, please visit the Research section of our website, sharekhan.com.
Strong operating performance; Buy maintainedwith revised PT of Rs105
COMPANY DETAILS
Price target: Rs105
Market cap: Rs24,702 cr
52-week high/low: Rs100/43
NSE volume (no. of shares): 1.89 cr
BSE code: 500477
NSE code: ASHOKLEY
Sharekhan code: ASHOKLEY
Free float (no. of shares): 141.2 cr
(%) 1m 3m 6m 12m
Absolute -2.2 4.8 30.2 99.4
Relative to Sensex -3.5 10.5 33.2 106.3
PRICE PERFORMANCE
BUY CMP: RS87 NOVEMBER 5, 2015ASHOK LEYLAND
KEY POINTS
Strong operational performance; PAT falls short of expectations: Ashok Leyland Ltd (ALL)maintained industry leading growth and outperformed with a growth of 78% as against theindustry growth of 43.6%. The combined effect of price hikes undertaken, significantoperating leverage and favourable commodity prices led to a 475-BPS OPM expansion(YoY) to 12%. An exceptional gain of Rs151.8 crore (sale of IndusInd Bank shares) wasnegated by a diminution in value of investment (in John Deere JV) of Rs157 crore. Adjustedfor these exceptional items the profit for the quarter stood at Rs292 crore, below our estimateof Rs317 crore.
Positive outlook: The domestic MHCV segment has witnessed a strong growth of 33.6% inH1FY2016 albeit benefitting from the pre-buying in September ahead of the implementationof the new safety norms. We expect demand to be slightly tepid in Q3FY2016 and a strongpick-up is expected in Q4FY2016 during the peak season. Bharat Stage IV (BSIV) normswill be implemented phase-wise across the country by April 2017. We expect pre-buyingahead of the new emission norms to keep the MHCV market buoyant in FY2017.
Maintain Buy with a revised PT of Rs105: We have maintained our earnings estimates forFY2016 and FY2017. We have also introduced earnings estimate for FY2018 with thisnote. ALL is well poised to reap the benefits of the anticipated sustained uptrend in thedomestic CV industry over the next two to three years. We have shifted earnings multiple toan average of FY2017 and FY2018. We remain positive on the stock and reiterate our Buyrecommendation with a revised price target of Rs105 (vs earlier Rs98).
SHAREHOLDING PATTERN
Sharekhan Limited, its analyst or dependant(s) of the analyst might beholding or having a postition in the companies mentioned in the article.
For detailed report, please visit the Research section of our website, sharekhan.com.
December 2015 Sharekhan ValueGuide12
Strong performance continued; Buy maintainedCOMPANY DETAILS
Price target: Rs3,650
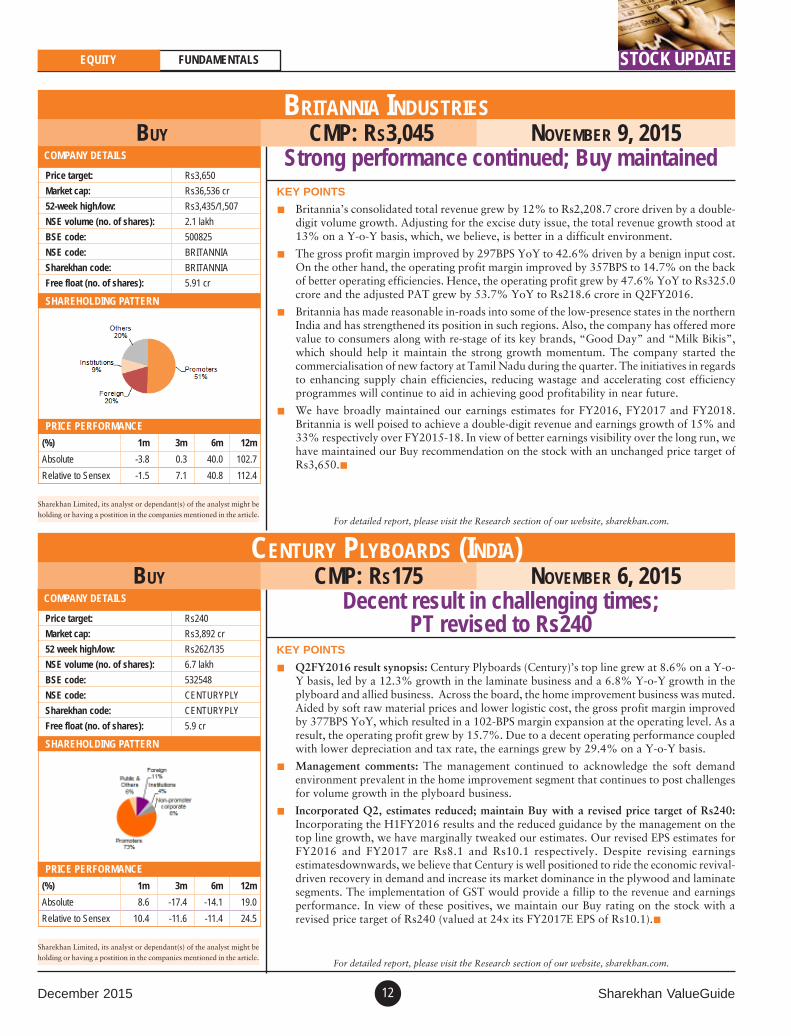
Market cap: Rs36,536 cr
52-week high/low: Rs3,435/1,507
NSE volume (no. of shares): 2.1 lakh
BSE code: 500825
NSE code: BRITANNIA
Sharekhan code: BRITANNIA
Free float (no. of shares): 5.91 cr
(%) 1m 3m 6m 12m
Absolute -3.8 0.3 40.0 102.7
Relative to Sensex -1.5 7.1 40.8 112.4
PRICE PERFORMANCE
BUY CMP: RS3,045 NOVEMBER 9, 2015BRITANNIA INDUSTRIES
KEY POINTS
Britannia’s consolidated total revenue grew by 12% to Rs2,208.7 crore driven by a double-digit volume growth. Adjusting for the excise duty issue, the total revenue growth stood at13% on a Y-o-Y basis, which, we believe, is better in a difficult environment.
The gross profit margin improved by 297BPS YoY to 42.6% driven by a benign input cost.On the other hand, the operating profit margin improved by 357BPS to 14.7% on the backof better operating efficiencies. Hence, the operating profit grew by 47.6% YoY to Rs325.0crore and the adjusted PAT grew by 53.7% YoY to Rs218.6 crore in Q2FY2016.
Britannia has made reasonable in-roads into some of the low-presence states in the northernIndia and has strengthened its position in such regions. Also, the company has offered morevalue to consumers along with re-stage of its key brands, “Good Day” and “Milk Bikis”,which should help it maintain the strong growth momentum. The company started thecommercialisation of new factory at Tamil Nadu during the quarter. The initiatives in regardsto enhancing supply chain efficiencies, reducing wastage and accelerating cost efficiencyprogrammes will continue to aid in achieving good profitability in near future.
We have broadly maintained our earnings estimates for FY2016, FY2017 and FY2018.Britannia is well poised to achieve a double-digit revenue and earnings growth of 15% and33% respectively over FY2015-18. In view of better earnings visibility over the long run, wehave maintained our Buy recommendation on the stock with an unchanged price target ofRs3,650.
SHAREHOLDING PATTERN
Sharekhan Limited, its analyst or dependant(s) of the analyst might beholding or having a postition in the companies mentioned in the article.
For detailed report, please visit the Research section of our website, sharekhan.com.
STOCK UPDATEEQUITY FUNDAMENTALS
Decent result in challenging times;PT revised to Rs240
COMPANY DETAILS
Price target: Rs240
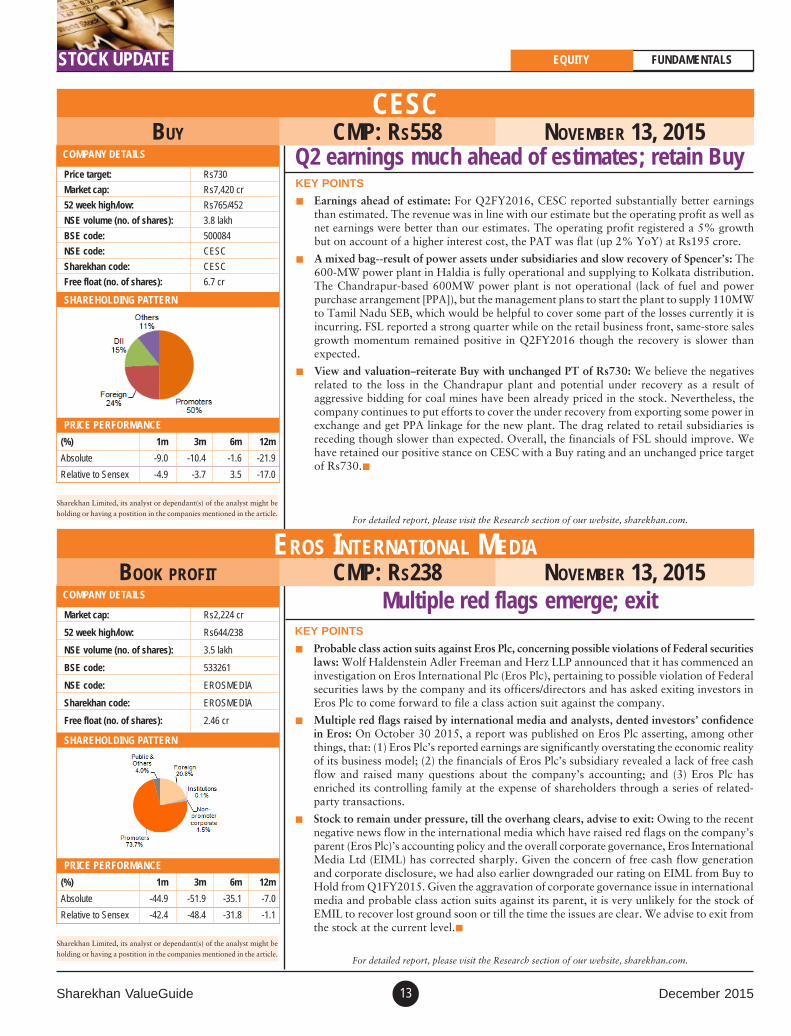
Market cap: Rs3,892 cr
52 week high/low: Rs262/135
NSE volume (no. of shares): 6.7 lakh
BSE code: 532548
NSE code: CENTURYPLY
Sharekhan code: CENTURYPLY
Free float (no. of shares): 5.9 cr
(%) 1m 3m 6m 12m
Absolute 8.6 -17.4 -14.1 19.0
Relative to Sensex 10.4 -11.6 -11.4 24.5
PRICE PERFORMANCE
BUY CMP: RS175 NOVEMBER 6, 2015CENTURY PLYBOARDS (INDIA)
KEY POINTS
Q2FY2016 result synopsis: Century Plyboards (Century)’s top line grew at 8.6% on a Y-o-Y basis, led by a 12.3% growth in the laminate business and a 6.8% Y-o-Y growth in theplyboard and allied business. Across the board, the home improvement business was muted.Aided by soft raw material prices and lower logistic cost, the gross profit margin improvedby 377BPS YoY, which resulted in a 102-BPS margin expansion at the operating level. As aresult, the operating profit grew by 15.7%. Due to a decent operating performance coupledwith lower depreciation and tax rate, the earnings grew by 29.4% on a Y-o-Y basis.
Management comments: The management continued to acknowledge the soft demandenvironment prevalent in the home improvement segment that continues to post challengesfor volume growth in the plyboard business.
Incorporated Q2, estimates reduced; maintain Buy with a revised price target of Rs240:Incorporating the H1FY2016 results and the reduced guidance by the management on thetop line growth, we have marginally tweaked our estimates. Our revised EPS estimates forFY2016 and FY2017 are Rs8.1 and Rs10.1 respectively. Despite revising earningsestimatesdownwards, we believe that Century is well positioned to ride the economic revival-driven recovery in demand and increase its market dominance in the plywood and laminatesegments. The implementation of GST would provide a fillip to the revenue and earningsperformance. In view of these positives, we maintain our Buy rating on the stock with arevised price target of Rs240 (valued at 24x its FY2017E EPS of Rs10.1).
SHAREHOLDING PATTERN
Sharekhan Limited, its analyst or dependant(s) of the analyst might beholding or having a postition in the companies mentioned in the article.
For detailed report, please visit the Research section of our website, sharekhan.com.
Sharekhan ValueGuide December 201513
STOCK UPDATE EQUITY FUNDAMENTALS
Q2 earnings much ahead of estimates; retain BuyCOMPANY DETAILS
Price target: Rs730
Market cap: Rs7,420 cr
52 week high/low: Rs765/452
NSE volume (no. of shares): 3.8 lakh
BSE code: 500084
NSE code: CESC
Sharekhan code: CESC
Free float (no. of shares): 6.7 cr
(%) 1m 3m 6m 12m
Absolute -9.0 -10.4 -1.6 -21.9
Relative to Sensex -4.9 -3.7 3.5 -17.0
PRICE PERFORMANCE
BUY CMP: RS558 NOVEMBER 13, 2015CESC
KEY POINTS
Earnings ahead of estimate: For Q2FY2016, CESC reported substantially better earningsthan estimated. The revenue was in line with our estimate but the operating profit as well asnet earnings were better than our estimates. The operating profit registered a 5% growthbut on account of a higher interest cost, the PAT was flat (up 2% YoY) at Rs195 crore.
A mixed bag--result of power assets under subsidiaries and slow recovery of Spencer’s: The600-MW power plant in Haldia is fully operational and supplying to Kolkata distribution.The Chandrapur-based 600MW power plant is not operational (lack of fuel and powerpurchase arrangement [PPA]), but the management plans to start the plant to supply 110MWto Tamil Nadu SEB, which would be helpful to cover some part of the losses currently it isincurring. FSL reported a strong quarter while on the retail business front, same-store salesgrowth momentum remained positive in Q2FY2016 though the recovery is slower thanexpected.
View and valuation–reiterate Buy with unchanged PT of Rs730: We believe the negativesrelated to the loss in the Chandrapur plant and potential under recovery as a result ofaggressive bidding for coal mines have been already priced in the stock. Nevertheless, thecompany continues to put efforts to cover the under recovery from exporting some power inexchange and get PPA linkage for the new plant. The drag related to retail subsidiaries isreceding though slower than expected. Overall, the financials of FSL should improve. Wehave retained our positive stance on CESC with a Buy rating and an unchanged price targetof Rs730.
SHAREHOLDING PATTERN
Sharekhan Limited, its analyst or dependant(s) of the analyst might beholding or having a postition in the companies mentioned in the article.
For detailed report, please visit the Research section of our website, sharekhan.com.
Multiple red flags emerge; exitCOMPANY DETAILS
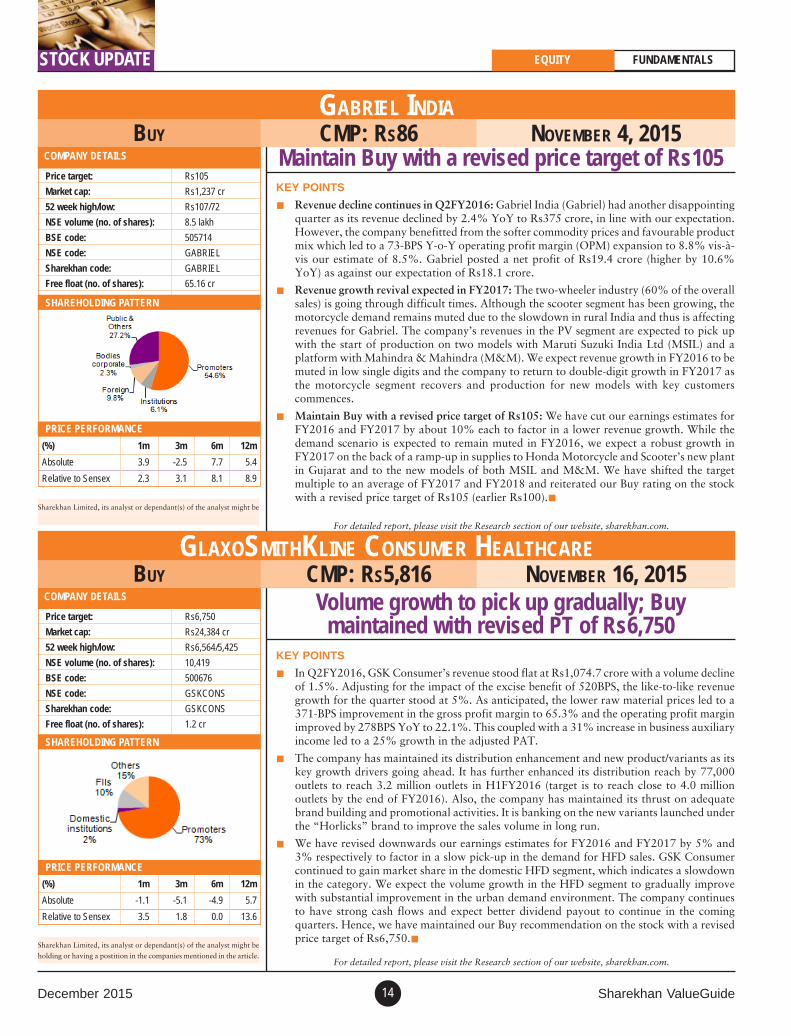
Market cap: Rs2,224 cr
52 week high/low: Rs644/238
NSE volume (no. of shares): 3.5 lakh
BSE code: 533261
NSE code: EROSMEDIA
Sharekhan code: EROSMEDIA
Free float (no. of shares): 2.46 cr
(%) 1m 3m 6m 12m
Absolute -44.9 -51.9 -35.1 -7.0
Relative to Sensex -42.4 -48.4 -31.8 -1.1
PRICE PERFORMANCE
BOOK PROFIT CMP: RS238 NOVEMBER 13, 2015EROS INTERNATIONAL MEDIA
KEY POINTS
Probable class action suits against Eros Plc, concerning possible violations of Federal securitieslaws: Wolf Haldenstein Adler Freeman and Herz LLP announced that it has commenced aninvestigation on Eros International Plc (Eros Plc), pertaining to possible violation of Federalsecurities laws by the company and its officers/directors and has asked exiting investors inEros Plc to come forward to file a class action suit against the company.
Multiple red flags raised by international media and analysts, dented investors’ confidencein Eros: On October 30 2015, a report was published on Eros Plc asserting, among otherthings, that: (1) Eros Plc’s reported earnings are significantly overstating the economic realityof its business model; (2) the financials of Eros Plc’s subsidiary revealed a lack of free cashflow and raised many questions about the company’s accounting; and (3) Eros Plc hasenriched its controlling family at the expense of shareholders through a series of related-party transactions.
Stock to remain under pressure, till the overhang clears, advise to exit: Owing to the recentnegative news flow in the international media which have raised red flags on the company’sparent (Eros Plc)’s accounting policy and the overall corporate governance, Eros InternationalMedia Ltd (EIML) has corrected sharply. Given the concern of free cash flow generationand corporate disclosure, we had also earlier downgraded our rating on EIML from Buy toHold from Q1FY2015. Given the aggravation of corporate governance issue in internationalmedia and probable class action suits against its parent, it is very unlikely for the stock ofEMIL to recover lost ground soon or till the time the issues are clear. We advise to exit fromthe stock at the current level.
SHAREHOLDING PATTERN
Sharekhan Limited, its analyst or dependant(s) of the analyst might beholding or having a postition in the companies mentioned in the article.
For detailed report, please visit the Research section of our website, sharekhan.com.
December 2015 Sharekhan ValueGuide14
Maintain Buy with a revised price target of Rs105COMPANY DETAILS
Price target: Rs105
Market cap: Rs1,237 cr
52 week high/low: Rs107/72
NSE volume (no. of shares): 8.5 lakh
BSE code: 505714
NSE code: GABRIEL
Sharekhan code: GABRIEL
Free float (no. of shares): 65.16 cr
(%) 1m 3m 6m 12m
Absolute 3.9 -2.5 7.7 5.4
Relative to Sensex 2.3 3.1 8.1 8.9
PRICE PERFORMANCE
BUY CMP: RS86 NOVEMBER 4, 2015GABRIEL INDIA
KEY POINTS
Revenue decline continues in Q2FY2016: Gabriel India (Gabriel) had another disappointingquarter as its revenue declined by 2.4% YoY to Rs375 crore, in line with our expectation.However, the company benefitted from the softer commodity prices and favourable productmix which led to a 73-BPS Y-o-Y operating profit margin (OPM) expansion to 8.8% vis-à-vis our estimate of 8.5%. Gabriel posted a net profit of Rs19.4 crore (higher by 10.6%YoY) as against our expectation of Rs18.1 crore.
Revenue growth revival expected in FY2017: The two-wheeler industry (60% of the overallsales) is going through difficult times. Although the scooter segment has been growing, themotorcycle demand remains muted due to the slowdown in rural India and thus is affectingrevenues for Gabriel. The company’s revenues in the PV segment are expected to pick upwith the start of production on two models with Maruti Suzuki India Ltd (MSIL) and aplatform with Mahindra & Mahindra (M&M). We expect revenue growth in FY2016 to bemuted in low single digits and the company to return to double-digit growth in FY2017 asthe motorcycle segment recovers and production for new models with key customerscommences.
Maintain Buy with a revised price target of Rs105: We have cut our earnings estimates forFY2016 and FY2017 by about 10% each to factor in a lower revenue growth. While thedemand scenario is expected to remain muted in FY2016, we expect a robust growth inFY2017 on the back of a ramp-up in supplies to Honda Motorcycle and Scooter’s new plantin Gujarat and to the new models of both MSIL and M&M. We have shifted the targetmultiple to an average of FY2017 and FY2018 and reiterated our Buy rating on the stockwith a revised price target of Rs105 (earlier Rs100).
SHAREHOLDING PATTERN
Sharekhan Limited, its analyst or dependant(s) of the analyst might be
For detailed report, please visit the Research section of our website, sharekhan.com.
STOCK UPDATE EQUITY FUNDAMENTALS
Volume growth to pick up gradually; Buymaintained with revised PT of Rs6,750
COMPANY DETAILS
Price target: Rs6,750
Market cap: Rs24,384 cr
52 week high/low: Rs6,564/5,425
NSE volume (no. of shares): 10,419
BSE code: 500676
NSE code: GSKCONS
Sharekhan code: GSKCONS
Free float (no. of shares): 1.2 cr
(%) 1m 3m 6m 12m
Absolute -1.1 -5.1 -4.9 5.7
Relative to Sensex 3.5 1.8 0.0 13.6
PRICE PERFORMANCE
BUY CMP: RS5,816 NOVEMBER 16, 2015GLAXOSMITHKLINE CONSUMER HEALTHCARE
KEY POINTS
In Q2FY2016, GSK Consumer’s revenue stood flat at Rs1,074.7 crore with a volume declineof 1.5%. Adjusting for the impact of the excise benefit of 520BPS, the like-to-like revenuegrowth for the quarter stood at 5%. As anticipated, the lower raw material prices led to a371-BPS improvement in the gross profit margin to 65.3% and the operating profit marginimproved by 278BPS YoY to 22.1%. This coupled with a 31% increase in business auxiliaryincome led to a 25% growth in the adjusted PAT.
The company has maintained its distribution enhancement and new product/variants as itskey growth drivers going ahead. It has further enhanced its distribution reach by 77,000outlets to reach 3.2 million outlets in H1FY2016 (target is to reach close to 4.0 millionoutlets by the end of FY2016). Also, the company has maintained its thrust on adequatebrand building and promotional activities. It is banking on the new variants launched underthe “Horlicks” brand to improve the sales volume in long run.
We have revised downwards our earnings estimates for FY2016 and FY2017 by 5% and3% respectively to factor in a slow pick-up in the demand for HFD sales. GSK Consumercontinued to gain market share in the domestic HFD segment, which indicates a slowdownin the category. We expect the volume growth in the HFD segment to gradually improvewith substantial improvement in the urban demand environment. The company continuesto have strong cash flows and expect better dividend payout to continue in the comingquarters. Hence, we have maintained our Buy recommendation on the stock with a revisedprice target of Rs6,750.
SHAREHOLDING PATTERN
Sharekhan Limited, its analyst or dependant(s) of the analyst might beholding or having a postition in the companies mentioned in the article.
For detailed report, please visit the Research section of our website, sharekhan.com.

Sharekhan ValueGuide December 201515
STOCK UPDATEEQUITY FUNDAMENTALS
In-line operating performance; maintain Buy withrevised PT of Rs1,000
COMPANY DETAILS
Price target: Rs1,000
Market cap: Rs8,540 cr
52 week high/low: Rs1,014/700
NSE volume (no. of shares): 1.0 lakh
BSE code: 532777
NSE code: NAUKRI
Sharekhan code: NAUKRI
Free float (no. of shares): 6.8 cr
(%) 1m 3m 6m 12m
Absolute -7.9 -15.1 -5.0 -16.0
Relative to Sensex -6.3 -9.1 -2.0 -12.2
PRICE PERFORMANCE
BUY CMP: RS708 NOVEMBER 6, 2015INFO EDGE (INDIA)
KEY POINTS
In-line operating performance: For Q2FY2016, Info Edge has delivered an in-line operatingperformance, with a revenue growth of 18% YoY to Rs174.1 crore. The performance wasled by a 19.6% Y-o-Y growth in recruitment solutions (Naukri) to Rs128.2 crore while therevenue from 99acres was up by 13.5% YoY to Rs27.8 crore. The net income for thequarter was up by 2% YoY and 18% QoQ to Rs33.9 crore.
Key management commentary: (1) Naukri’s growth momentum to continue led by IT marketin Bengaluru, up by 20-25% YoY, while revival in non-IT segment will drive the incrementalgrowth with a 15-20% Y-o-Y growth. Expect growth to sustain at 18-20% and margins toimprove further; (2) 99acres (real estate market) is witnessing a slowdown in the Delhi NCRregion (the largest market for the company) and other markets like Mumbai; overall transactionsvolume has fallen across the markets with inventory piled up to an all-time high
Maintain Buy with a revised price target of Rs1,000: Given the slowness in demand in thereal estate market, we have lowered our estimates and target multiple for 99acres and alsolowered our overall SOTP-based valuation for Info Edge to Rs1,000 (from Rs1,103 earlier).Nevertheless, we continue to see Info Edge as a strong play on India’s internet and mobilepenetration theme. Info Edge, with a strong online presence through various ventures,recruitment (Naukri), real estate (99acres), restaurant listing (Zomato) and coupons industry(mydala.com), is a preferred play on both e-commerce/online shift and macro recovery. Wehave maintained our Buy rating on the stock with a revised price target of Rs1,000.
SHAREHOLDING PATTERN
Sharekhan Limited, its analyst or dependant(s) of the analyst might beFor detailed report, please visit the Research section of our website, sharekhan.com.
Outlook remains uncertain due to currencyheadwinds; Book profit
COMPANY DETAILS
Market cap: Rs2,397 cr
52 week high/low: Rs318/180
NSE volume(no. of shares): 1.9 lakh
BSE code: 506943
NSE code: JBCHEPHARM
Sharekhan code: JBCHEPHARM
Free float (no. of shares): 3.8 cr
(%) 1m 3m 6m 12m
Absolute -7.9 13.2 20.6 42.9
Relative to Sensex -1.9 12.7 29.3 55.7
PRICE PERFORMANCE
BOOK PROFIT CMP: RS282 NOVEMBER 26, 2015JB CHEMICALS & PHARMACEUTICALS
KEY POINTS
Sluggish performance continued in Q2: In Q2FY2016, JB Chemicals and PharmaceuticalsLtd (JBCPL) reported a subdued performance with a revenue growth of just 2%, whileoperating profit margin declined by 350BPS to 17%. This quarter was the fourth consecutivequarter of dismal operating performance by the company.
Volatility in currency affects exports in key emerging markets: JBCPL reported a moderate3% growth in exports of formulation to Rs133 crore during Q2FY2016. The exports to theRest of the World (RoW) markets (10% decline during the quarter) were affected due tolower demand and depreciation of market currencies against dollar.
Outlook remains bleak; Book profit: The volatility in currencies in key emerging markets islikely to have an effect on H2FY2016 performance too. Also, for FY2017, demand willcontinue to be weak as dollar is likely to strengthen further. Hence, the operating profitmargin and profitability are likely to remain under pressure over the next few quarters.Hence, in view of bleak future, we advise our investors to Book profit from the stock.
SHAREHOLDING PATTERN
Sharekhan Limited, its analyst or dependant(s) of the analyst might beholding or having a postition in the companies mentioned in the article.
For detailed report, please visit the Research section of our website, sharekhan.com.

December 2015 Sharekhan ValueGuide16
STOCK UPDATEEQUITY FUNDAMENTALS
Maintain Buy with revised PT of Rs360COMPANY DETAILS
Price target: Rs360
Market cap: Rs272 cr
52-week high/low: Rs425/153
NSE volume (No of shares): 0.15 lakh
BSE code: 532054
Sharekhan code: KAMLADLS
Free float (No of shares): 0.5 cr
(%) 1m 3m 6m 12m
Absolute -7.4 -17.2 -22.1 70.8
Relative to Sensex -5.8 -11.4 -19.7 78.8
PRICE PERFORMANCE
BUY CMP: RS270 NOVEMBER 6, 2015KDDL
KEY POINTS
Consolidated performance snapshot: For Q2FY2016, KDDL’s consolidated top line grewby 12.6% on a Y-o-Y basis, aided by a robust 25.4% Y-o-Y growth in Ethos, while themanufacturing business posted a 7% decline in the revenue.
Ethos performance good: For Ethos, festive and marriage season drives demand for itsproduct, thus in the light of Diwali falling in Q3 this year as against Q2 in the last year, arevenue growth of 25.4% YoY is robust. Further, the other key indicators like increasingsales from the online segment (for Q2FY2016, 28% sales came from online) and growth intraffic (for H1FY2016 36% Y-o-Y growth in the traffic was witnessed) are in line with thestrategy of attaining growth through omni-channel presence.
Maintain Buy; revised price target to Rs360: Incorporating weak Q2 manufacturing resultsinto our model, we have marginally revised our earnings estimates downwards for themanufacturing business. Thus, our consolidated EPS estimates for FY2016 and FY2017 areRs11.5 and Rs14.1 respectively. Further, the growth momentum and the margin expansiontrend in the Ethos business are panning in line with our expectation. Thus, we continue tolike Ethos' unique high-end watch retailing business, which is expected to grow manifold bycashing in on the growth in the luxury watch segment and the increasing trend towardsonline e-tailing. Hence, we have maintained our Buy rating on the stock with a revised pricetarget of Rs360 (valued at 6x its FY2017E earnings for the stand-alone business + 1.2x itsFY2017E sales of Ethos).
SHAREHOLDING PATTERN
Sharekhan Limited, its analyst or dependant(s) of the analyst might beholding or having a postition in the companies mentioned in the article.
For detailed report, please visit the Research section of our website, sharekhan.com.
Maintain Buy with an unchanged PT of Rs1,450COMPANY DETAILS
Price target: Rs1,450
Market cap: Rs77,239 cr
52 week high/low: Rs1,441/1,095
NSE volume (no. of shares): 11.1 lakh
BSE code: 500520
NSE code: M&M
Sharekhan code: M&M
Free float (no. of shares): 45.7 cr
(%) 1m 3m 6m 12m
Absolute -0.9 -9.2 7.8 1.2
Relative to Sensex 0.8 -2.8 11.2 5.9
PRICE PERFORMANCE
BUY CMP: RS1,258 NOVEMBER 6, 2015MAHINDRA & MAHINDRA
KEY POINTS
OPM at 13.2% below estimate; PAT beats estimates on higher revenues and lower tax rate:Mahindra & Mahindra (M&M)’s poor run in terms of volumes continued in Q2FY2016with auto and tractor divisions reporting a 2.2% and 26% fall respectively. The net sales forthe quarter at Rs8,794 crore (down 2.8% YoY) beat estimates due to a sharp jump inrevenues from the genset business. The OPM contracted by 110BPS sequentially to 13.2%(vs expectation of 13.5%) due to the lower operating leverage. A higher revenue and alower tax rate enabled M&M to post a net profit of Rs978 crore, slightly higher than ourestimate of Rs951 crore.
Weak monsoon casts a shadow on tractor segment recovery; new launches to boost autovolumes: The sub-par monsoon rainfall during the season has hampered the recovery in thetractor segment. The management has cut its guidance for FY2016 tractor industry from agrowth of 4-5% earlier to a decline of 5%. The outlook for the auto division is positive. Thecompany has received a positive response for the recently launched TUV3OO and themanagement expects the model to stabilise at monthly volumes of 5,000 units. The companywill be following with the launch of another model (code name S101) in January whichwould further boost volumes.
Maintain Buy with an unchanged PT of Rs1,450: Given the current weakness in the tractorsegment and a delay in the recovery, we have cut our earnings estimate for FY2016 by 3%.We remain positive on the stock, given its leadership position in the domestic tractor andUV segments as well as the value derived from its subsidiaries across business segments. Wemaintain our Buy recommendation on the stock with an SOTP-based price target, unchangedat Rs1,450.
SHAREHOLDING PATTERN
Sharekhan Limited, its analyst or dependant(s) of the analyst might be
For detailed report, please visit the Research section of our website, sharekhan.com.
Sharekhan ValueGuide December 201517
STOCK UPDATEEQUITY FUNDAMENTALS
Maintain Buy with a price target of Rs950COMPANY DETAILS
Price target: Rs950
Market cap: Rs182,134 cr
52-week high/low: Rs1,200/748
NSE volume (no. of shares): 36.8 lakh
BSE code: 524715
NSE code: SUNPHARMA
Sharekhan code: SUNPHARMA
Free float (no. of shares): 109 cr
(%) 1m 3m 6m 12m
Absolute -11.4 -4.6 -14.0 -7.5
Relative to Sensex -9.3 2.5 -13.5 -3.1
PRICE PERFORMANCE
BUY CMP: RS757 NOVEMBER 9, 2015SUN PHARMACEUTICAL INDUSTRIES
KEY POINTS
High tax rate dents earnings: Revenue for the quarter declined by 15% to Rs6, 838 crore onaccount of decline in sales in the US and RoW markets, and supply constraints at its Halolplant. Also, revenue in Q2FY2015 included sales from Valsartan, in its 180-day exclusivity.The operating profit margin declined by 986BPS to 28.3% in Q2FY2016.
Synergy with Ranbaxy and Halol plant, the key developments to watch ahead: Themanagement is confident about the synergy with Ranbaxy through improving productivityof the overall Ranbaxy business and getting synergy benefits on certain products fromFY2018. As part of strategy, the company will focus on high-margin products which arestrategically fit and will continue to remain focused on the OTC business. The launch ofGlivec in Q4FY2016 will remain a key trigger for the company.
Near-term outlook remains cautious: Earlier, the company had issued caution statementregarding sales and profits for FY2016 due to the integration of Ranbaxy and supplyconstraints from Halol. Remediation efforts at Halol are on track but will take some time.After the settlement of Glivec with Novartis, Sun Pharma has delisted the drug from Haloland filed from an alternate site. We believe Sun Pharma will take two to three quarters moreto complete its restructuring and remediation efforts at Halol.
Maintain Buy with price target of Rs950: Remediation efforts at Halol are on track but willtake some time. Complete benefits of the remediation processes will be visible in FY2018.The filing of Glivec from an alternate site is a silver lining to the cloud. We have maintainedour Buy rating on the stock with a price target of Rs950.
SHAREHOLDING PATTERN
Sharekhan Limited, its analyst or dependant(s) of the analyst might beholding or having a postition in the companies mentioned in the article.
For detailed report, please visit the Research section of our website, sharekhan.com.
Strong Q2 but joint venture order intake weak;PT revised to Rs135
COMPANY DETAILS
Price target: Rs135
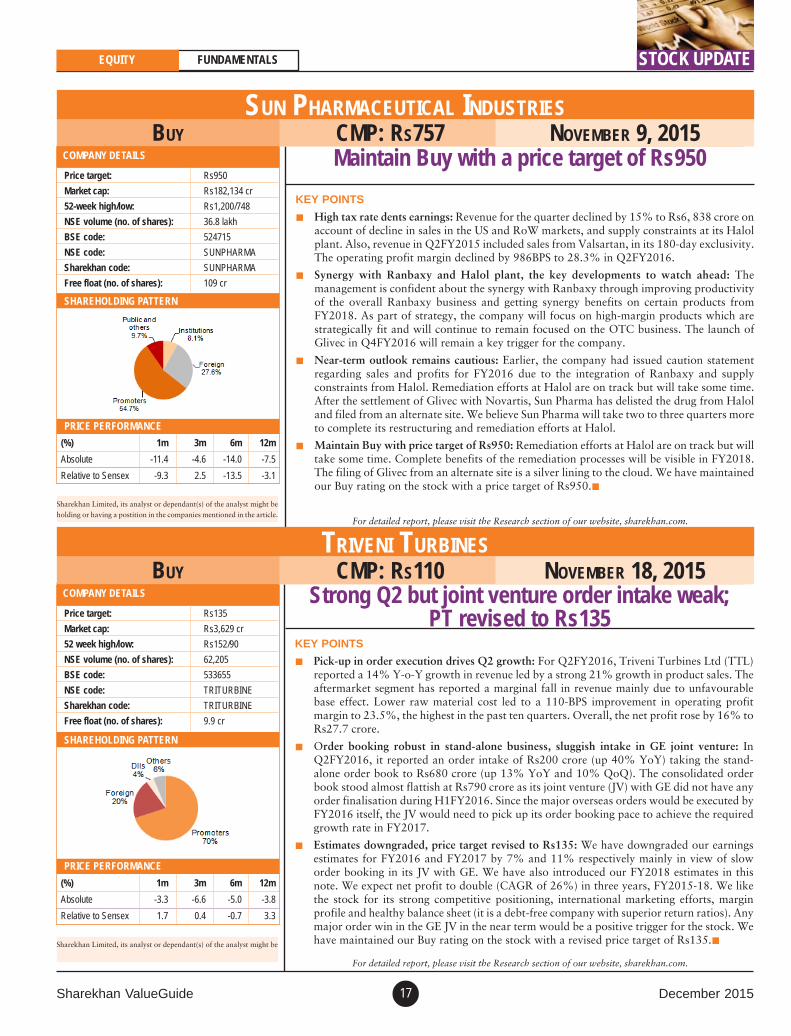
Market cap: Rs3,629 cr
52 week high/low: Rs152/90
NSE volume (no. of shares): 62,205
BSE code: 533655
NSE code: TRITURBINE
Sharekhan code: TRITURBINE
Free float (no. of shares): 9.9 cr
(%) 1m 3m 6m 12m
Absolute -3.3 -6.6 -5.0 -3.8
Relative to Sensex 1.7 0.4 -0.7 3.3
PRICE PERFORMANCE
BUY CMP: RS110 NOVEMBER 18, 2015TRIVENI TURBINES
KEY POINTS
Pick-up in order execution drives Q2 growth: For Q2FY2016, Triveni Turbines Ltd (TTL)reported a 14% Y-o-Y growth in revenue led by a strong 21% growth in product sales. Theaftermarket segment has reported a marginal fall in revenue mainly due to unfavourablebase effect. Lower raw material cost led to a 110-BPS improvement in operating profitmargin to 23.5%, the highest in the past ten quarters. Overall, the net profit rose by 16% toRs27.7 crore.
Order booking robust in stand-alone business, sluggish intake in GE joint venture: InQ2FY2016, it reported an order intake of Rs200 crore (up 40% YoY) taking the stand-alone order book to Rs680 crore (up 13% YoY and 10% QoQ). The consolidated orderbook stood almost flattish at Rs790 crore as its joint venture (JV) with GE did not have anyorder finalisation during H1FY2016. Since the major overseas orders would be executed byFY2016 itself, the JV would need to pick up its order booking pace to achieve the requiredgrowth rate in FY2017.
Estimates downgraded, price target revised to Rs135: We have downgraded our earningsestimates for FY2016 and FY2017 by 7% and 11% respectively mainly in view of sloworder booking in its JV with GE. We have also introduced our FY2018 estimates in thisnote. We expect net profit to double (CAGR of 26%) in three years, FY2015-18. We likethe stock for its strong competitive positioning, international marketing efforts, marginprofile and healthy balance sheet (it is a debt-free company with superior return ratios). Anymajor order win in the GE JV in the near term would be a positive trigger for the stock. Wehave maintained our Buy rating on the stock with a revised price target of Rs135.
SHAREHOLDING PATTERN
Sharekhan Limited, its analyst or dependant(s) of the analyst might be
For detailed report, please visit the Research section of our website, sharekhan.com.
December 2015 Sharekhan ValueGuide18
Goods and Services Tax BillSHAREKHAN SPECIAL NOVEMBER 27, 2015
Key points
GST–simplified indirect tax regime: The Goods and ServicesTax (GST) Bill aims to simplify the current indirect tax regimeby bringing all central and state levies (like excise duty, salestax, octroi, VAT and other countervailing duties) under onesingle head having uniform tax rate across goods and services(with some exclusions like electricity, alcohol and petroleumproducts).
Critical reform; to boost economic revival: The benefits areimmense in terms of reducing economic distortions, creating anationwide single tax market, widening of tax base andeliminating cascading of taxes (tax on tax). For manufacturingcompanies, it means level playing field for organised andunorganised sectors, and cost optimisation in terms of movementand warehousing of goods due to a uniform tax rate.Consequently, it would have a positive fall-out on inflation,curtailing tax avoidance and creating buoyancy in the economy.According to official estimates, the implementation of GST couldbring in incremental positive effect of 1.0-1.5% in the GDPdepending upon the GST rate (likely range of 18-20% would
Sharekhan Limited, its analyst or dependant(s) of the analyst might be holding orhaving a postition in the companies mentioned in the article.
For detailed report, please visit the Research section of our website, sharekhan.com.
Source: Company data, Sharekhan Research
SHAREKHAN SPECIALEQUITY FUNDAMENTALS
Q2FY2016 earnings reviewSHAREKHAN SPECIAL NOVEMBER 24, 2015
Earnings soft as expected; ex global cyclical growth appearsreasonable: In Q2FY2016, the aggregate earnings growth for theSensex companies (BSE-30) remained soft (down 2% year on year[YoY]) due to a slow pace of economic recovery and domesticdemand coupled with pressure on global cyclicals (global commoditycompanies, ie metals and energy). However, excluding globalcyclicals (ex metals, energy and Tata Motors), the earnings showeda decent growth of 7% compared with Q2FY2015.
Earnings breadth relatively better: The earnings breadth wasrelatively better as 20 out of the 30 Sensex companies showed agrowth in earnings YoY with 12 showing a double-digit growth.There was a mixed set of surprises as heavyweights like ZeeEntertainment Enterprises Ltd (ZEEL), Dr Reddy’s Laboratories(DRL), State Bank of India (SBI), Tata Steel, NTPC and RelianceIndustries Ltd (RIL) delivered a positive surprise whereas TataMotors (a one-off loss of Rs2,650 crore), Bharat Heavy ElectricalsLtd (BHEL), Larsen and Toubro (L&T), Lupin and SunPharmaceutical Industries (Sun Pharma) surprised negatively. Froma sectoral perspective, the financial and information technology(IT) services companies registered a double-digit growth whilecapital goods and pharmaceutical (pharma) companies disappointedthe most with their earnings performance.
Revenue momentum remains slack, margin expansion a silver line:The revenue growth has remained in the negative territory for thepast few quarters (down 6% in Q2FY2016 for the Sensexcompanies) reflecting weak underlying demand. Barring the IT andfinancial companies, the top line growth of most of the sectorsremained in low single digits or negative. Going ahead, the lag effect
Sharekhan Limited, its analyst or dependant(s) of the analyst might be holding orhaving a postition in the companies mentioned in the article.
For detailed report, please visit the Research section of our website, sharekhan.com.
Source: Company data, Sharekhan Research
mean tax saving of 3-4% for many manufacturing segments; aGST rate beyond 22% could be detrimental to businessconfidence and growth in near term). However, the proposedGST bill has exclusions and an additional tax of 1% for inter-state movement for the initial two years which dilutes the essenceof GST (to an extent) and limits positive impact on the economy.
Preferred Picks: (1) Maruti Suzuki India: potential reduction ineffective tax rate for mid-sized passenger vehicles; (2) BritanniaIndustries: cost optimisation at each level of product value chainand competitive advantage could improve the growth prospectsin long run; (3) Gateway Distriparks: with services across thedistribution value chain, it will gain from incremental demandarising from the higher inter-state transport of products; (4)Century Plyboards: organised players to gain market share withunorganised players losing tax advantage; and (5) PantaloonsFashion & Retail: set-off for service tax paid on lease rentalsand inventory cost optimisation.
of a decline in the interest rates and the implementation of theSeventh Pay Commission’s recommendation remain the key enablersof a demand recovery over the medium term. The EBITDA marginimproved by 48 basis points (BPS; YoY) which along with a lowerinterest cost supported the earnings.
Bracing for sub-10% earnings growth in FY2016; hopes pinned onH2 performance: The Q2FY2016 earnings season saw the consensusearnings estimate for the Sensex being downgraded by about 2%,implying a growth of 7-8% in FY2016 and of 18-20% in FY2017.Sectors like industrials and global cyclicals saw a higher downgradecompared with IT services and pharma companies while energycompanies saw a marginal upward revision in the earnings estimates.Going ahead, hopes are pinned on the H2FY2016 performance ledby a gradual improvement in the consumer demand (led by lowinflation, a dip in interest rates) along with a low base effect (H2 ofFY2015 was exceptionally weak).
Outlook—policy push and reasonable valuations: Of late, thegovernment has initiated several executive-led reforms (revival ofdistribution companies, increase in foreign direct investment [FDI]in multiple sectors) and is trying to push the Goods and ServicesTax (GST) bill in the upcoming session of the Parliament, reflectingits intention to shift focus to policy activism. The Sensex is tradingat reasonable valuation (14.5x FY2017E earnings) even afterfactoring .
Sharekhan ValueGuide December 201519
Earnings falling short of expectations; call closed with a loss of 24%
AURIONPRO SOLUTIONSVIEW: BOOK OUT NOVEMBER 6, 2015CMP: RS206
Key points
Disappointing earnings performance: Aurionpro Solutions Ltd(ASL) has reported a disappointing set of numbers forQ2FY2016, with the operating profit margin falling by 300BPSQoQ and 600BPS YoY to 11.8%. Though the revenues wereup by 7.6% QoQ to Rs176.8 crore, the same were down 4%YoY. The net income for the quarter fell by 25% QoQ and by35% YoY to Rs12.4 crore. For H1FY2016 the revenues weredown by 6.1% YoY while the OPM declined by 450BPS andthe net income fell by 14.3% YoY.
Earnings performance falling short of our expectations: In ourinitiation Viewpoint note dated October 16, 2014, we hadexpected ASL’s earnings trajectory to improve on the back ofthe company’s strategic and operational restructuring activitiesincluding a gradual exit from the low-margin business, expansion
VIEWPOINT
Book profit for a gain of 42% in the last one month
LLOYD ELECTRIC & ENGINEERINGVIEW: BOOK PROFIT NOVEMBER 4, 2015CMP: RS273
Key points
Posts absolute gains of 42%; limited scope for further re-ratingin the near term: We had recommended re-entering Lloyd Electric& Engineering Ltd (LEEL) in our Viewpoint report (datedOctober 1, 2015) as the risk-reward ratio had turned favourablepost-correction. Since the release of our report, the stock hasappreciated by 43% in a span of just over one month andnarrowed the valuation gap with some of its peers like Voltasand Blue Star. Hence, we advise investors to Book profit.
Competitive intensity could lead to margin pressure: InQ1FY2016, the company posted a strong 68% growth inconsumer durable (CD) revenue, mainly led by volume growth.While we remain positive on the company’s growth prospects,
VIEWPOINT
Sharekhan Limited, its analyst or dependant(s) of the analyst might be holding orhaving a postition in the companies mentioned in the article.
For detailed report, please visit the Research section of our website, sharekhan.com.
Sharekhan Limited, its analyst or dependant(s) of the analyst might be holding orhaving a postition in the companies mentioned in the article.
For detailed report, please visit the Research section of our website, sharekhan.com.
EQUITY FUNDAMENTALSVIEWPOINT
of the sales team, rationalisation of the G&A, consolidation ofoperations and a gradual shift of clients’ engagement to offshore.However, looking at the recent earnings performance, we believethe company’s strategy to revive earnings growth is falling shortof expectations and will take longer than expected.
Call closed, book loss of 24% from our initiation level: Afterthe initiation of the call at Rs270, the stock has touched a highof Rs316 on November 10, 2014. However, owing to a lacklustrefinancial performance ASL could not get re-rated as was expectedat the time of initiation of the call. We believe that animprovement in the financial performance could be furtherdelayed. Therefore, we close our Viewpoint recommendationon ASL with a loss of 24% from our initiation price.
competitive pricing pressure and inventory build-up in theindustry (especially in the AC segment) amid slow demandenvironment could lead to some margin pressure in the comingfew quarters. Its elongated working capital could also result inliquidity crunch in the near term. Hence, on a tactical basis, werecommend investors to Book profit, while we also advise themto re-enter the company in case of any declines.
Risk to our call: A better-than-expected uptick in the urbandiscretionary demand; and if the company is able to showimprovement in working capital cycle it could see further re-rating from the current level.
December 2015 Sharekhan ValueGuide20
Fall in JLR profitability affects Q2FY2016 results
TATA MOTORSVIEW: POSITIVE NOVEMBER 6, 2015CMP: RS396
Key points
Q2FY2016 consolidated results below estimate due to fall inJLR profitability: Tata Motors (TAMO)’s Q2FY2016consolidated results were below expectation given the higher-than-expected fall in Jaguar Land Rover (JLR) profitability. JLRmargins for the quarter were under stress given the unfavourablegeography mix (lower proportion of China sales) and higherexpenses related to new launches (“Jaguar XE” and “DiscoverySport”) and marketing. TAMO’s consolidated margins forQ2FY2016 stood at 11.2% as against our expectation of 14.4%.Additionally, the company took a hit of Rs2,493 crore relatedto destruction of vehicles by fire at Tainjin port in China.Adjusted for an exceptional loss, the adjusted net profit stoodat Rs1,360 crore as against our expectation of Rs2,100 crore.
Management guides for a positive outlook in H2FY2016: JLR’sH1FY2016 performance has been marred by the weakness inthe Chinese market even as the other developed geographieslike the UK, USA and Europe continue to perform well. However,the lower contribution from China has an effect on the overallprofitability of the company, given the realisations in China are
VIEWPOINT
Increasing effective tax to limit earnings growth; Book profit with 27% gain
WELSPUN SYNTEXVIEW: BOOK PROFIT NOVEMBER 2, 2015CMP: RS112
Key points
We had recommended buying Welspun Syntex Ltd (WSL) inour Viewpoint report (dated July 16, 2015) based on three keyrationales: (1) Focus on specialty yarns like bulk continuousfilament (BCF, used in carpets), drylon (used in bath rugs) andniche markets which has boosted its profitability in the recentquarters; (2) comfortable gearing levels with robust return ratios;and (3) available at attractive valuations. Since the release ofour Viewpoint note, the stock has appreciated by 27% in a timeperiod of close to three and a half months.
In H1FY2016, while the margin expansion of 190BPS to 12.2%was better than expected, a higher tax outgo (19.3% versus nil
VIEWPOINT
Sharekhan Limited, its analyst or dependant(s) of the analyst might be holding orhaving a postition in the companies mentioned in the article.
For detailed report, please visit the Research section of our website, sharekhan.com.
Sharekhan Limited, its analyst or dependant(s) of the analyst might be holding orhaving a postition in the companies mentioned in the article.
For detailed report, please visit the Research section of our website, sharekhan.com.
EQUITY FUNDAMENTALSVIEWPOINT
significantly higher than other geographies. The retail sales inChina after having declined for the last ten months have turnedpositive in October. The management expects the Chinese marketto slowly get back on track which will also have a positive effecton margins. However, the new launch and marketing expensesare expected to remain elevated for the next couple of quartersas the company has a heavy launch pipeline. Meanwhile, thedomestic operations have shown a decent recovery with OPMat 5.8%. We expect the trend to continue as the commercialvehicle (CV) segment gathers momentum.
10% cut in earnings estimates: We have cut our earnings forFY2016E and FY2017E by 10% each on account of the lowermargin expectation for JLR operations. The stock hasappreciated by 15% from the date of our Viewpoint datedSeptember 9, 2015 with a positive view. Despite the cut inestimates we remain positive on the stock and expect a 15-18%upside from the current level.
liability in H1FY2015) limited the earnings growth to 8% YoY.We feel that the expected tax liability at full tax rate wouldlimit its earnings growth in FY2017 also and consequently, theearnings growth could fall short of expectations.
With the current valuation of 9x forward earnings, the stockseems fairly valued, given the fact that it is in a commoditisedbusiness. Therefore, we see a limited near-term upside andrecommend our investors to Book profit at this level.

Sharekhan ValueGuide December 201521
The Nifty seems to have completed its pull-back in wave x ofwave z down and now wave y of wave z down has begun whichwill inch towards our medium-term target of 7422.
The index has formed a bearish head-and-shoulders patternon the daily chart and the neckline support of the same is peggedat 7691. So when this support is broken the index will slidesharply towards our medium-term target.
The daily momentum indicator has given a positive cross-over.
Crucial supports for the index will be around 7691 and 7540while crucial resistance will be near 7980 and 8340.
The Nifty has reversed after retracing 38.2% of its previousfall from 8336 to 7714 levels. Now, the next leg down in itswave z has begun. The pull-back was a corrective one; hence,the probability of a downside from hereon is quite high.
The index has reversed from the upper end of the downtrendline resistance and is now heading towards the lower end of thedowntrend line support. The minimum target is 7422 level;however, the wave equality target comes to 7382 level.
The momentum indicator is in sell mode. The reversal is peggedabove 8440 and as long as that is held the short-term trendshall remain down.
A crucial support would be around 7540 and resistance wouldbe around 8340.
The Nifty’s monthly chart gives the clearest view that the waveZ down is pending which will take the index below its previousswing low of 7540 level.
The Nifty needs to take off the falling channel on the upsidewith a buy cross-over in its momentum indicator in order toconfirm the reversal from down to up.
The index has a reversal pegged at 8440, ie the channelresistance, and until that level is taken off it will be difficult tosay if the market has bottomed. The downside risk is still thereas the recent bounce is also not impulsive on the way up. So,below 7691 the trend will accelerate on the downside whichwill take the index towards the monthly lower Bollinger Band,which currently stands at 7320.
A crucial support will be around 7540 and a crucial resistancewill be around 8340.
Daily view on Nifty
Weekly view on Nifty
Monthly view on Nifty
Medium term
In the final stages of correction
Trend Trend reversal Support Resistance Target
Down 8440 7422 8440 7422
TREND & VIEWEQUITY TECHNICALS
December 2015 Sharekhan ValueGuide22
Derivative View: Santa rally unlikely
The November series witnessed significant selling pressure due towhich the Nifty closed with a loss of around 2.50% comparedwith the previous series. The fall from 8200 to 7800 was mainlybacked by a short build-up by market participants and that too bythe stronger hands of the masses due to which the Nifty made alow of the series at around 7700, which was our target in theprevious column, “Shorts getting built up at every high”.
The roll-over in the December series was a bit on the lower side at68% compared with its last series where the roll-over was around73%. But with fresh accumulation of short positions since the startof this series we feel the market is still in a downward trend. Thesell-off in the recent trading sessions was not only due to the shortbuild-up but also due to the weakening of the fundamentals as amajority of the large-cap stocks disappointed in their earnings.
Market participants were also concerned about the looming interestrate hike decision by Fed later in this month and the relentless sellingby the foreign institutional investors (FIIs) in the cash marketbecause of that. In the derivatives segment too the FIIs have beenselling in index futures and they are now net short in index futures.However, similar to the last few series their major participation inthe derivatives market has been through the index options as theyhave already bought more than Rs6,500 crore worth of indexoptions. In the past we observed that whenever they went long onindex options with large volumes the Nifty witnessed a significantamount of volatility.
STOCK FUTURES (SHAREKHAN SCRIP CODE) OPEN INTEREST (RS CR)
RELIANCE 2458.41
HDFCBANK 2381.05
AXISBANK 2062.48
SUNPHARMA 1654.41
SBIN 1609.88
Top 5 stock futures with the highest OI in current series
Top 5 stock options with the highest OI in current series
STOCK OPTIONS (SHAREKHAN SCRIP CODE) OPEN INTEREST (RS CR)
RELIANCE 541.59
MARUTI 535.15
SBIN 517.49
DRREDDY 456.49
LT 449.55
On the options front, since the start of the December series a lot ofactivity has been observed in deep out-of-the-money strike price.The 7500 put option stands with the highest number of shares inopen interest followed by the 8000 strike price, which is an in-the-money put option. On the call side, a heavy pile-up of open interestis observed at 8000-8200 strike price levels indicating a stiffresistance around those levels. The Volatility Index has beenconstantly moving lower and is currently at a three-month low at16. The put-call ratio since the start of the December series hasbeen on the lower side. Currently, it is at around 0.79 levels. Inview of the above data, with accumulation of fresh short positionsdespite a low roll-over, increase in activity in the out-of the moneyput options and simultaneous heavy pile-up of open interest in calloptions, we feel the Nifty would find it difficult to cross the 8050-8100 level. On the lower side, below the 7780-7800 level (whichwas a strong support for the last series) the Nifty could see furthersell-off till the 7500-7600 level in the coming trading sessions.
ViewROLL-OVER: MARKET-WIDE VS NIFTY
EQUITY DERIVATIVESMONTHLY VIEW
Roll-over highlights
The benchmark index Nifty started the December series with around1.95 crore shares vs 2.05 crore shares in the previous series. Inrupee terms, it started the new month with open interest of Rs15,436crore in Nifty futures vs Rs16,966 crore in the previous series whilein stock futures it started the series with Rs58,530 crore of openinterest vs Rs57,106 crore in the previous series. In index options itstarted the month with Rs77,170 crore of open interest vs Rs76,082crore in the previous series and in stock options it saw open interestof Rs4,712 crore vs Rs5,525 crore in the previous series.
Roll-overs in Nifty stood at 68.63%, which was a bit lowercompared with the previous month’s roll-over of 73.62%. Themarket-wide roll-over stood at 83.63%, which is in line with theprevious month’s roll-over of 83.92%.
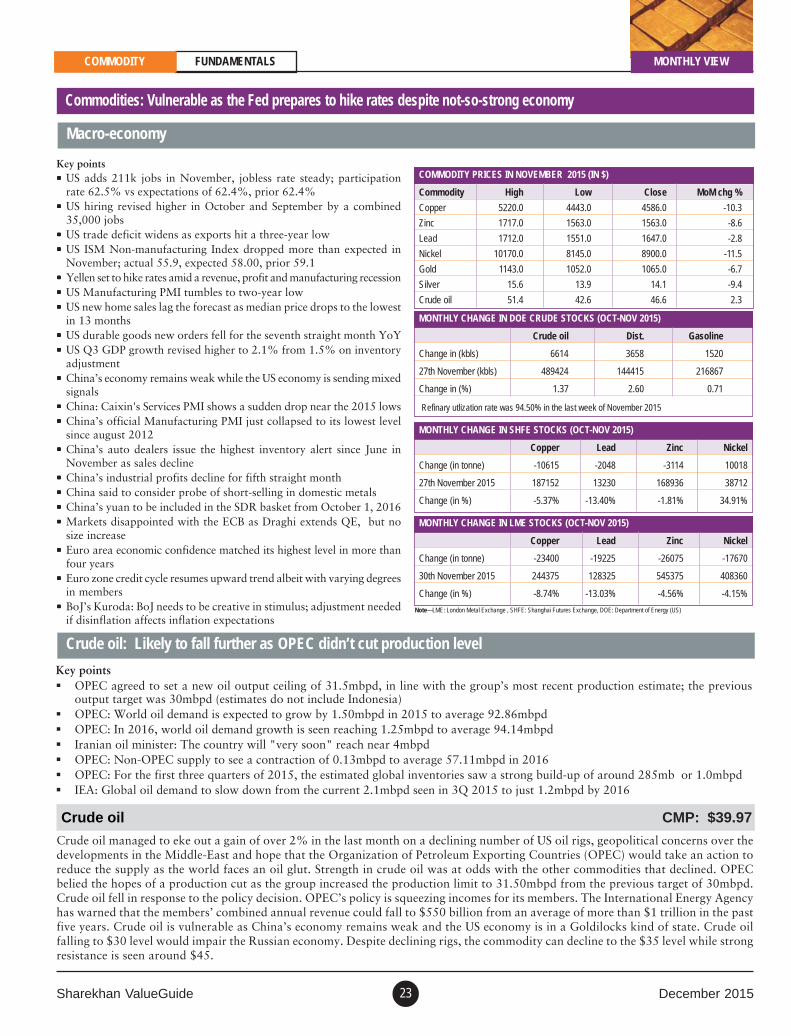
Sharekhan ValueGuide December 201523
Commodities: Vulnerable as the Fed prepares to hike rates despite not-so-strong economy
Key points US adds 211k jobs in November, jobless rate steady; participation
rate 62.5% vs expectations of 62.4%, prior 62.4% US hiring revised higher in October and September by a combined
35,000 jobs US trade deficit widens as exports hit a three-year low US ISM Non-manufacturing Index dropped more than expected in
November; actual 55.9, expected 58.00, prior 59.1 Yellen set to hike rates amid a revenue, profit and manufacturing recession US Manufacturing PMI tumbles to two-year low US new home sales lag the forecast as median price drops to the lowest
in 13 months US durable goods new orders fell for the seventh straight month YoY US Q3 GDP growth revised higher to 2.1% from 1.5% on inventory
adjustment China’s economy remains weak while the US economy is sending mixed
signals China: Caixin's Services PMI shows a sudden drop near the 2015 lows China’s official Manufacturing PMI just collapsed to its lowest level
since august 2012 China’s auto dealers issue the highest inventory alert since June in
November as sales decline China’s industrial profits decline for fifth straight month China said to consider probe of short-selling in domestic metals China’s yuan to be included in the SDR basket from October 1, 2016 Markets disappointed with the ECB as Draghi extends QE, but no
size increase Euro area economic confidence matched its highest level in more than
four years Euro zone credit cycle resumes upward trend albeit with varying degrees
in members BoJ’s Kuroda: BoJ needs to be creative in stimulus; adjustment needed
if disinflation affects inflation expectations
Macro-economy
Crude oil: Likely to fall further as OPEC didn’t cut production level
Key points OPEC agreed to set a new oil output ceiling of 31.5mbpd, in line with the group’s most recent production estimate; the previous
output target was 30mbpd (estimates do not include Indonesia) OPEC: World oil demand is expected to grow by 1.50mbpd in 2015 to average 92.86mbpd OPEC: In 2016, world oil demand growth is seen reaching 1.25mbpd to average 94.14mbpd Iranian oil minister: The country will "very soon" reach near 4mbpd OPEC: Non-OPEC supply to see a contraction of 0.13mbpd to average 57.11mbpd in 2016 OPEC: For the first three quarters of 2015, the estimated global inventories saw a strong build-up of around 285mb or 1.0mbpd IEA: Global oil demand to slow down from the current 2.1mbpd seen in 3Q 2015 to just 1.2mbpd by 2016
Crude oil managed to eke out a gain of over 2% in the last month on a declining number of US oil rigs, geopolitical concerns over thedevelopments in the Middle-East and hope that the Organization of Petroleum Exporting Countries (OPEC) would take an action toreduce the supply as the world faces an oil glut. Strength in crude oil was at odds with the other commodities that declined. OPECbelied the hopes of a production cut as the group increased the production limit to 31.50mbpd from the previous target of 30mbpd.Crude oil fell in response to the policy decision. OPEC’s policy is squeezing incomes for its members. The International Energy Agencyhas warned that the members’ combined annual revenue could fall to $550 billion from an average of more than $1 trillion in the pastfive years. Crude oil is vulnerable as China’s economy remains weak and the US economy is in a Goldilocks kind of state. Crude oilfalling to $30 level would impair the Russian economy. Despite declining rigs, the commodity can decline to the $35 level while strongresistance is seen around $45.
Crude oil CMP: $39.97
COMMODITY PRICES IN NOVEMBER 2015 (IN $)
Commodity High Low Close MoM chg %
Copper 5220.0 4443.0 4586.0 -10.3
Zinc 1717.0 1563.0 1563.0 -8.6
Lead 1712.0 1551.0 1647.0 -2.8
Nickel 10170.0 8145.0 8900.0 -11.5
Gold 1143.0 1052.0 1065.0 -6.7
Silver 15.6 13.9 14.1 -9.4
Crude oil 51.4 42.6 46.6 2.3
MONTHLY CHANGE IN SHFE STOCKS (OCT-NOV 2015)
Copper Lead Zinc Nickel
Change (in tonne) -10615 -2048 -3114 10018
27th November 2015 187152 13230 168936 38712
Change (in %) -5.37% -13.40% -1.81% 34.91%
MONTHLY CHANGE IN DOE CRUDE STOCKS (OCT-NOV 2015)
Crude oil Dist. Gasoline
Change in (kbls) 6614 3658 1520
27th November (kbls) 489424 144415 216867
Change in (%) 1.37 2.60 0.71
Refinary utlization rate was 94.50% in the last week of November 2015
MONTHLY CHANGE IN LME STOCKS (OCT-NOV 2015)
Copper Lead Zinc Nickel
Change (in tonne) -23400 -19225 -26075 -17670
30th November 2015 244375 128325 545375 408360
Change (in %) -8.74% -13.03% -4.56% -4.15%
Note—LME: London Metal Exchange , SHFE: Shanghai Futures Exchange, DOE: Department of Energy (US)
MONTHLY VIEWCOMMODITY FUNDAMENTALS

December 2015 Sharekhan ValueGuide24
Gold CMP: $1,086 (spot)
Bullion: rate hike mostly discounted, still possibility of further decline
Silver CMP: $14.55 (spot)
Like gold, silver too fell to a fresh cycle-low below $14 on the strength in the dollar amid a commodity-wide sell-off. Weakness in crudeoil and the base metals doesn’t bode well for the white metal. However, China’s imports could rise to the highest level since 2011 whichis supportive for the metal. We see the metal trading between $14 and $15 in the near term, with the possibility of falling to $13.50 shouldthe Fed hint at a quicker pace of rate hike.
Copper CMP: Rs312/kg (February 2016 contract)
Base metals: fail to surge on production cuts as weak Chinese economy and strong dollar dominateKey points ICSG: Copper market metal balance in surplus of 16,000 ton in August, total production surplus at 80,000 ton in the January-August period
against a deficit of 4,60,000 ton in the same period of 2014 EIU: Global copper consumption growth forecast to moderate at 2.2% against 7.7% in 2014 Codelco slashed its 2016 China copper premium to $98/ton from $133/ton offered in 2015 signifying weak demand outlook ILZSG: Lead market refined metal balance in surplus lowered to 13k ton in January-September period against surplus of 22k ton in the
corresponding period of 2014 EIU: Global refined lead consumption forecast to decline by 2.2% in 2015 from 1.8% in 2014 on Chinese battery destocking and slowing
momentum in auto sales in China ILZSG: Zinc production surplus balance widened to 188k ton in January-September 2015 against a deficit of 291k ton in the same period
of 2014 EIU forecast global zinc demand to slow to 3.3% in 2015 from 4.5% in 2014 while global zinc supply to rise by 5.5% in 2015 EIU: Global nickel consumption to rise to 1.907k ton in 2015 from 1.700k ton in 2014 on stock replenishment efforts by China post-ban
by Indonesia in early January 2014
MCX copper lost almost 10% of its value in November, most in 2015 as weak Chinese demand and growing surplus weighed on the price. As perEconomist Intelligence Unit (EIU), China’s apparent consumption in the January-September 2015 period grew by 3% year on year (YoY) on account oflower financing activity. China’s October copper imports grew by 12.3% YoY at 343,473 ton. As per EIU, recent production cuts and planned mineclosures on account of lower prices could affect the copper supply by 870,000 ton. Copper stocks in the London Metal Exchange (LME) warehouses havecome down by 10% to 244,375 ton in November end from 267,775 ton at the start of the month. As Fed’s December rate hike probability has increasedthe demand for copper remains weak and producers focus on cost reduction rather than supply cuts, we expect copper prices to remain depressed. Copperprice is expected to trade in the range of Rs336/kg on the higher side and Rs283/kg on the lower side in the current weakness.
Lead CMP: Rs112.90/kg (December 2015 contract)
Lead relatively suffered less losses compared with the other base metals with the price recovering from the low of Rs102.50 in the past month closing abovethe Rs108/kg support, as we had mentioned in our last monthly outlook column. Lower surplus forecast is helping prevent a further fall in the prices. Withweak demand lead’s supply has also been lower with the refined lead supply forecast by EIU at 10.678k ton in 2015 against 10.925k ton in 2014. We expectlead to trade in a range of Rs103/kg to Rs116/kg on the higher side.
Gold prices fell nearly 7% as the US Dollar Index hit a 12-year high on Fed rate hike expectations. The yellow metal fell to a fresh cycle-low of$1,052 and to the lowest level since 2010. Shanghai Gold Exchange (SGE) deliveries, as reported last Friday are robust, thus indicating gooddemand. China’s net imports of gold from Hong Kong dropped for the first time in four months in a holiday-shortened October. The rising UStreasury yields would pressurise the metal as the US Federal Reserve (Fed) moves on for a rate hike. Risk aversion coming on geopolitical concerns(ISIS, Middle-East, terrorism) would provide intermittent support. One possible support to gold might come from the slower than expected paceof rate hike by the Fed. Although a rate hike has been discounted to a great extent, further decline is not ruled out. The expected near-term rangeis $1,050-1,100, with a possibility of decline to $1,000 if the Fed becomes hawkish.
Key points India's November gold imports said to double on slump in prices Gold rebounds from 2010 lows on dollar after ECB rate decision At 1.4 million ounces the market is now in its biggest net short position ever on gold US imports of precious metals and jewellery increased at a double-digit pace in Q3 Gold industry in denial on debt, losses, and needs to explore more: Randgold US mint American Eagle gold coin sales surge in November, silver at record China adds 14 tonne gold bullion to its foreign exchange reserves in October Industrial metal production cuts to support silver as 40% silver is mined as a secondary metal from production of other metals China’s silver imports in 2015 likely to be the highest since 2011
Zinc CMP: Rs103.20/kg (December contract)
Zinc lost almost 5% in the last month ending at Rs103.10/kg, recovering from the lows of Rs98/kg as a growing metal balance surplus has led zinc to loseits premium against the other base metals. Glencore’s plans to cut zinc output by almost 4% of the global supply failed to prop the prices as Vedanta
MONTHLY VIEW COMMODITY FUNDAMENTALS
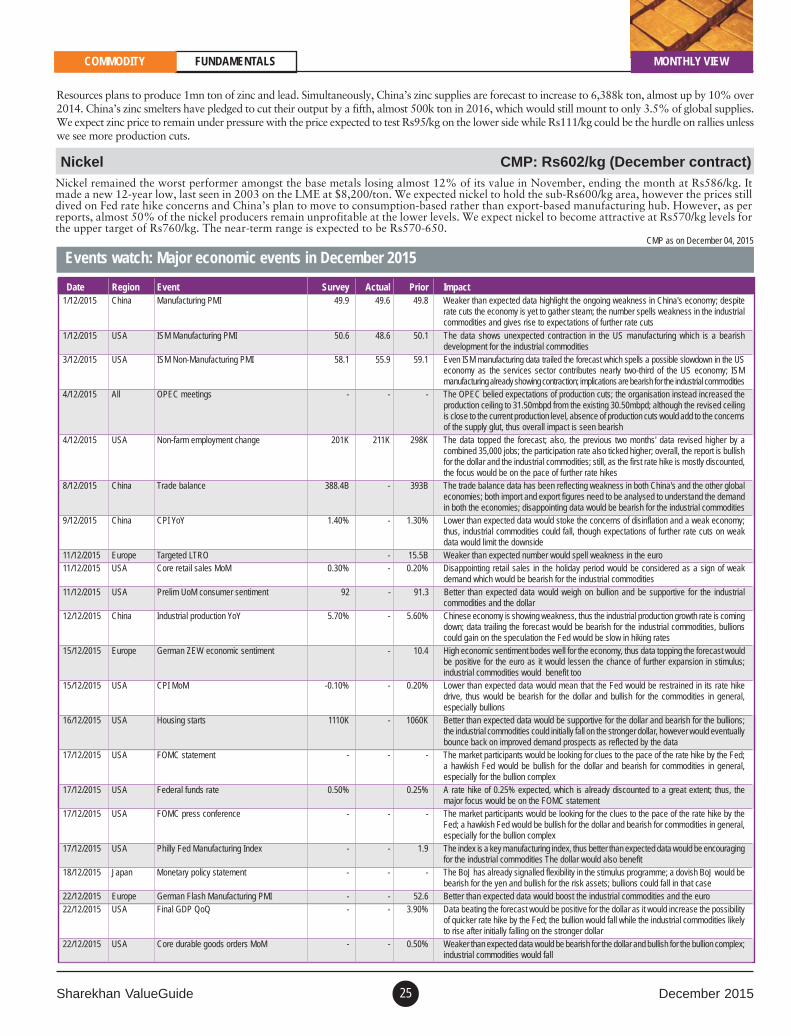
Sharekhan ValueGuide December 201525
Nickel CMP: Rs602/kg (December contract)Nickel remained the worst performer amongst the base metals losing almost 12% of its value in November, ending the month at Rs586/kg. Itmade a new 12-year low, last seen in 2003 on the LME at $8,200/ton. We expected nickel to hold the sub-Rs600/kg area, however the prices stilldived on Fed rate hike concerns and China’s plan to move to consumption-based rather than export-based manufacturing hub. However, as perreports, almost 50% of the nickel producers remain unprofitable at the lower levels. We expect nickel to become attractive at Rs570/kg levels forthe upper target of Rs760/kg. The near-term range is expected to be Rs570-650.
Events watch: Major economic events in December 2015CMP as on December 04, 2015
Date Region Event Survey Actual Prior Impact1/12/2015 China Manufacturing PMI 49.9 49.6 49.8 Weaker than expected data highlight the ongoing weakness in China's economy; despite
rate cuts the economy is yet to gather steam; the number spells weakness in the industrialcommodities and gives rise to expectations of further rate cuts
1/12/2015 USA ISM Manufacturing PMI 50.6 48.6 50.1 The data shows unexpected contraction in the US manufacturing which is a bearishdevelopment for the industrial commodities
3/12/2015 USA ISM Non-Manufacturing PMI 58.1 55.9 59.1 Even ISM manufacturing data trailed the forecast which spells a possible slowdown in the USeconomy as the services sector contributes nearly two-third of the US economy; ISMmanufacturing already showing contraction; implications are bearish for the industrial commodities
4/12/2015 All OPEC meetings - - - The OPEC belied expectations of production cuts; the organisation instead increased theproduction ceiling to 31.50mbpd from the existing 30.50mbpd; although the revised ceilingis close to the current production level, absence of production cuts would add to the concernsof the supply glut, thus overall impact is seen bearish
4/12/2015 USA Non-farm employment change 201K 211K 298K The data topped the forecast; also, the previous two months' data revised higher by acombined 35,000 jobs; the participation rate also ticked higher; overall, the report is bullishfor the dollar and the industrial commodities; still, as the first rate hike is mostly discounted,the focus would be on the pace of further rate hikes
8/12/2015 China Trade balance 388.4B - 393B The trade balance data has been reflecting weakness in both China's and the other globaleconomies; both import and export figures need to be analysed to understand the demandin both the economies; disappointing data would be bearish for the industrial commodities
9/12/2015 China CPI YoY 1.40% - 1.30% Lower than expected data would stoke the concerns of disinflation and a weak economy;thus, industrial commodities could fall, though expectations of further rate cuts on weakdata would limit the downside
11/12/2015 Europe Targeted LTRO - 15.5B Weaker than expected number would spell weakness in the euro11/12/2015 USA Core retail sales MoM 0.30% - 0.20% Disappointing retail sales in the holiday period would be considered as a sign of weak
demand which would be bearish for the industrial commodities11/12/2015 USA Prelim UoM consumer sentiment 92 - 91.3 Better than expected data would weigh on bullion and be supportive for the industrial
commodities and the dollar12/12/2015 China Industrial production YoY 5.70% - 5.60% Chinese economy is showing weakness, thus the industrial production growth rate is coming
down; data trailing the forecast would be bearish for the industrial commodities, bullionscould gain on the speculation the Fed would be slow in hiking rates
15/12/2015 Europe German ZEW economic sentiment - 10.4 High economic sentiment bodes well for the economy, thus data topping the forecast wouldbe positive for the euro as it would lessen the chance of further expansion in stimulus;industrial commodities would benefit too
15/12/2015 USA CPI MoM -0.10% - 0.20% Lower than expected data would mean that the Fed would be restrained in its rate hikedrive, thus would be bearish for the dollar and bullish for the commodities in general,especially bullions
16/12/2015 USA Housing starts 1110K - 1060K Better than expected data would be supportive for the dollar and bearish for the bullions;the industrial commodities could initially fall on the stronger dollar, however would eventuallybounce back on improved demand prospects as reflected by the data
17/12/2015 USA FOMC statement - - - The market participants would be looking for clues to the pace of the rate hike by the Fed;a hawkish Fed would be bullish for the dollar and bearish for commodities in general,especially for the bullion complex
17/12/2015 USA Federal funds rate 0.50% 0.25% A rate hike of 0.25% expected, which is already discounted to a great extent; thus, themajor focus would be on the FOMC statement
17/12/2015 USA FOMC press conference - - - The market participants would be looking for the clues to the pace of the rate hike by theFed; a hawkish Fed would be bullish for the dollar and bearish for commodities in general,especially for the bullion complex
17/12/2015 USA Philly Fed Manufacturing Index - - 1.9 The index is a key manufacturing index, thus better than expected data would be encouragingfor the industrial commodities The dollar would also benefit
18/12/2015 Japan Monetary policy statement - - - The BoJ has already signalled flexibility in the stimulus programme; a dovish BoJ would bebearish for the yen and bullish for the risk assets; bullions could fall in that case
22/12/2015 Europe German Flash Manufacturing PMI - - 52.6 Better than expected data would boost the industrial commodities and the euro22/12/2015 USA Final GDP QoQ - - 3.90% Data beating the forecast would be positive for the dollar as it would increase the possibility
of quicker rate hike by the Fed; the bullion would fall while the industrial commodities likelyto rise after initially falling on the stronger dollar
22/12/2015 USA Core durable goods orders MoM - - 0.50% Weaker than expected data would be bearish for the dollar and bullish for the bullion complex;industrial commodities would fall
MONTHLY VIEWCOMMODITY FUNDAMENTALS
Resources plans to produce 1mn ton of zinc and lead. Simultaneously, China’s zinc supplies are forecast to increase to 6,388k ton, almost up by 10% over2014. China’s zinc smelters have pledged to cut their output by a fifth, almost 500k ton in 2016, which would still mount to only 3.5% of global supplies.We expect zinc price to remain under pressure with the price expected to test Rs95/kg on the lower side while Rs111/kg could be the hurdle on rallies unlesswe see more production cuts.
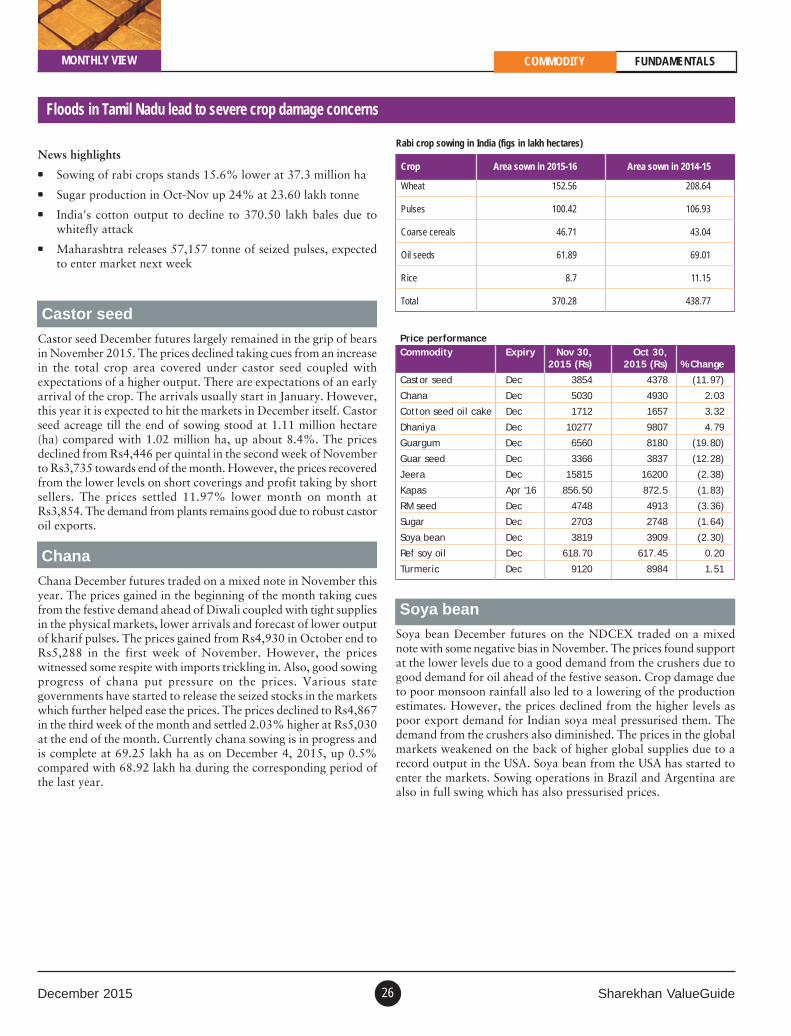
December 2015 Sharekhan ValueGuide26
MONTHLY VIEW COMMODITY FUNDAMENTALS
Floods in Tamil Nadu lead to severe crop damage concerns
News highlights
Sowing of rabi crops stands 15.6% lower at 37.3 million ha
Sugar production in Oct-Nov up 24% at 23.60 lakh tonne
India's cotton output to decline to 370.50 lakh bales due towhitefly attack
Maharashtra releases 57,157 tonne of seized pulses, expectedto enter market next week
Price performanceCommodity Expiry Nov 30, Oct 30,
2015 (Rs) 2015 (Rs) % Change
Castor seed Dec 3854 4378 (11.97)
Chana Dec 5030 4930 2.03
Cotton seed oil cake Dec 1712 1657 3.32
Dhaniya Dec 10277 9807 4.79
Guargum Dec 6560 8180 (19.80)
Guar seed Dec 3366 3837 (12.28)
Jeera Dec 15815 16200 (2.38)
Kapas Apr '16 856.50 872.5 (1.83)
RM seed Dec 4748 4913 (3.36)
Sugar Dec 2703 2748 (1.64)
Soya bean Dec 3819 3909 (2.30)
Ref soy oil Dec 618.70 617.45 0.20
Turmeric Dec 9120 8984 1.51
Castor seed
Castor seed December futures largely remained in the grip of bearsin November 2015. The prices declined taking cues from an increasein the total crop area covered under castor seed coupled withexpectations of a higher output. There are expectations of an earlyarrival of the crop. The arrivals usually start in January. However,this year it is expected to hit the markets in December itself. Castorseed acreage till the end of sowing stood at 1.11 million hectare(ha) compared with 1.02 million ha, up about 8.4%. The pricesdeclined from Rs4,446 per quintal in the second week of Novemberto Rs3,735 towards end of the month. However, the prices recoveredfrom the lower levels on short coverings and profit taking by shortsellers. The prices settled 11.97% lower month on month atRs3,854. The demand from plants remains good due to robust castoroil exports.
Chana
Chana December futures traded on a mixed note in November thisyear. The prices gained in the beginning of the month taking cuesfrom the festive demand ahead of Diwali coupled with tight suppliesin the physical markets, lower arrivals and forecast of lower outputof kharif pulses. The prices gained from Rs4,930 in October end toRs5,288 in the first week of November. However, the priceswitnessed some respite with imports trickling in. Also, good sowingprogress of chana put pressure on the prices. Various stategovernments have started to release the seized stocks in the marketswhich further helped ease the prices. The prices declined to Rs4,867in the third week of the month and settled 2.03% higher at Rs5,030at the end of the month. Currently chana sowing is in progress andis complete at 69.25 lakh ha as on December 4, 2015, up 0.5%compared with 68.92 lakh ha during the corresponding period ofthe last year.
Soya bean
Soya bean December futures on the NDCEX traded on a mixednote with some negative bias in November. The prices found supportat the lower levels due to a good demand from the crushers due togood demand for oil ahead of the festive season. Crop damage dueto poor monsoon rainfall also led to a lowering of the productionestimates. However, the prices declined from the higher levels aspoor export demand for Indian soya meal pressurised them. Thedemand from the crushers also diminished. The prices in the globalmarkets weakened on the back of higher global supplies due to arecord output in the USA. Soya bean from the USA has started toenter the markets. Sowing operations in Brazil and Argentina arealso in full swing which has also pressurised prices.
Rabi crop sowing in India (figs in lakh hectares)
Crop Area sown in 2015-16 Area sown in 2014-15
Wheat 152.56 208.64
Pulses 100.42 106.93
Coarse cereals 46.71 43.04
Oil seeds 61.89 69.01
Rice 8.7 11.15
Total 370.28 438.77
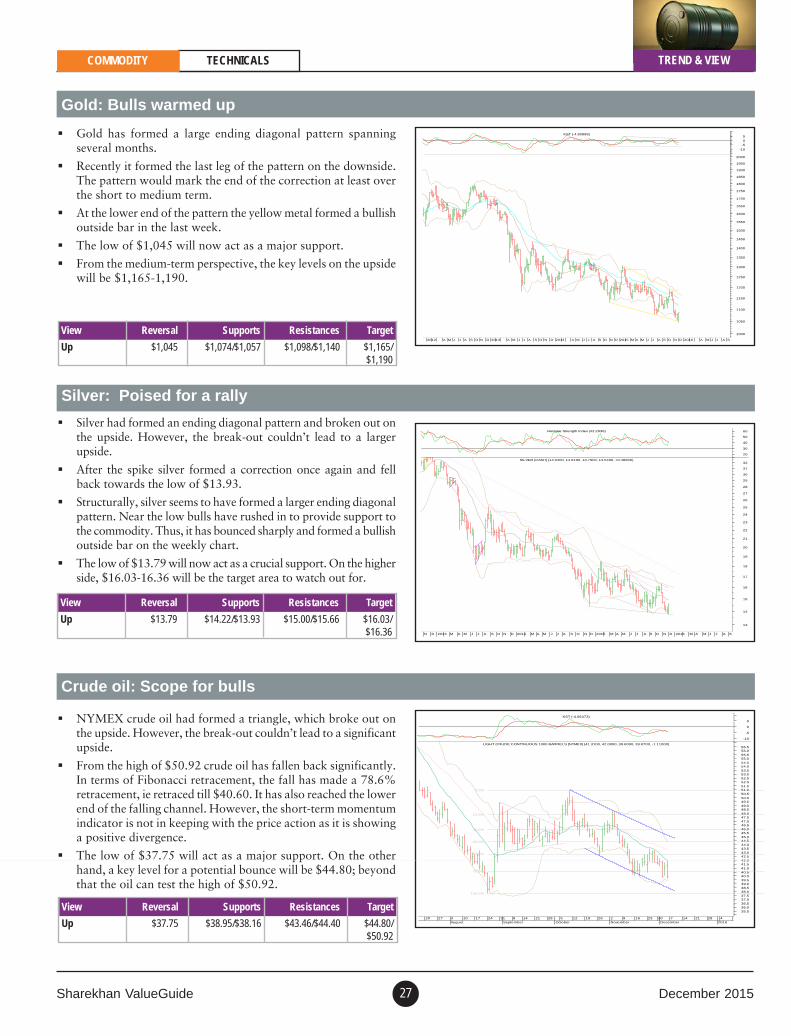
Sharekhan ValueGuide December 201527
Gold: Bulls warmed up
Gold has formed a large ending diagonal pattern spanningseveral months.
Recently it formed the last leg of the pattern on the downside.The pattern would mark the end of the correction at least overthe short to medium term.
At the lower end of the pattern the yellow metal formed a bullishoutside bar in the last week.
The low of $1,045 will now act as a major support.
From the medium-term perspective, the key levels on the upsidewill be $1,165-1,190.
Silver: Poised for a rally
Silver had formed an ending diagonal pattern and broken out onthe upside. However, the break-out couldn’t lead to a largerupside.
After the spike silver formed a correction once again and fellback towards the low of $13.93.
Structurally, silver seems to have formed a larger ending diagonalpattern. Near the low bulls have rushed in to provide support tothe commodity. Thus, it has bounced sharply and formed a bullishoutside bar on the weekly chart.
The low of $13.79 will now act as a crucial support. On the higherside, $16.03-16.36 will be the target area to watch out for.
View Reversal Supports Resistances Target
Up $13.79 $14.22/$13.93 $15.00/$15.66 $16.03/$16.36
NYMEX crude oil had formed a triangle, which broke out onthe upside. However, the break-out couldn’t lead to a significantupside.
From the high of $50.92 crude oil has fallen back significantly.In terms of Fibonacci retracement, the fall has made a 78.6%retracement, ie retraced till $40.60. It has also reached the lowerend of the falling channel. However, the short-term momentumindicator is not in keeping with the price action as it is showinga positive divergence.
The low of $37.75 will act as a major support. On the otherhand, a key level for a potential bounce will be $44.80; beyondthat the oil can test the high of $50.92.
Crude oil: Scope for bulls
View Reversal Supports Resistances Target
Up $1,045 $1,074/$1,057 $1,098/$1,140 $1,165/$1,190
View Reversal Supports Resistances Target
Up $37.75 $38.95/$38.16 $43.46/$44.40 $44.80/$50.92
TREND & VIEWCOMMODITY TECHNICALS
2012 A M J J A S O N D 2013 A M J J A S O N D 2014 A M J J A S O N D 2015 M A M J J A S O N D 2016 A M J J A S
1000
1050
1100
1150
1200
1250
1300
1350
1400
1450
1500
1550
1600
1650
1700
1750
1800
1850
1900
1950
2000
-10
-5
0
5KST (-4.80888)
N D 2013 M A M J J A S O N D 2014 M A M J J A S O N D 2015 M A M J J A S O N D 2016 M A M J J A S
13
14
15
16
17
18
19
20
21
22
23
24
25
26
27
28
29
30
31
32SILVER [CASH] (14.0400, 14.6190, 13.7900, 14.5490, +0.48900)
20
30
40
50
60Relative Strength Index (42.2936)
20 27 3 10August
17 24 31 8 14September
21 28 5October
12 19 26 2 9November
16 23 30 7December
14 21 28 42016
1
35.536.036.537.037.538.038.539.039.540.040.541.041.542.042.543.043.544.044.545.045.546.046.547.047.548.048.549.049.550.050.551.051.552.052.553.053.554.054.555.055.556.056.5
0.0%
23.6%
38.2%
50.0%
61.8%
78.6%
100.0%
LIGHT CRUDE CONTINUOUS 1000 BARRELS [NYMEX] (41.3100, 42.0000, 39.6000, 39.9700, -1.11000)
-10
-5
0
5
KST (-4.06473)
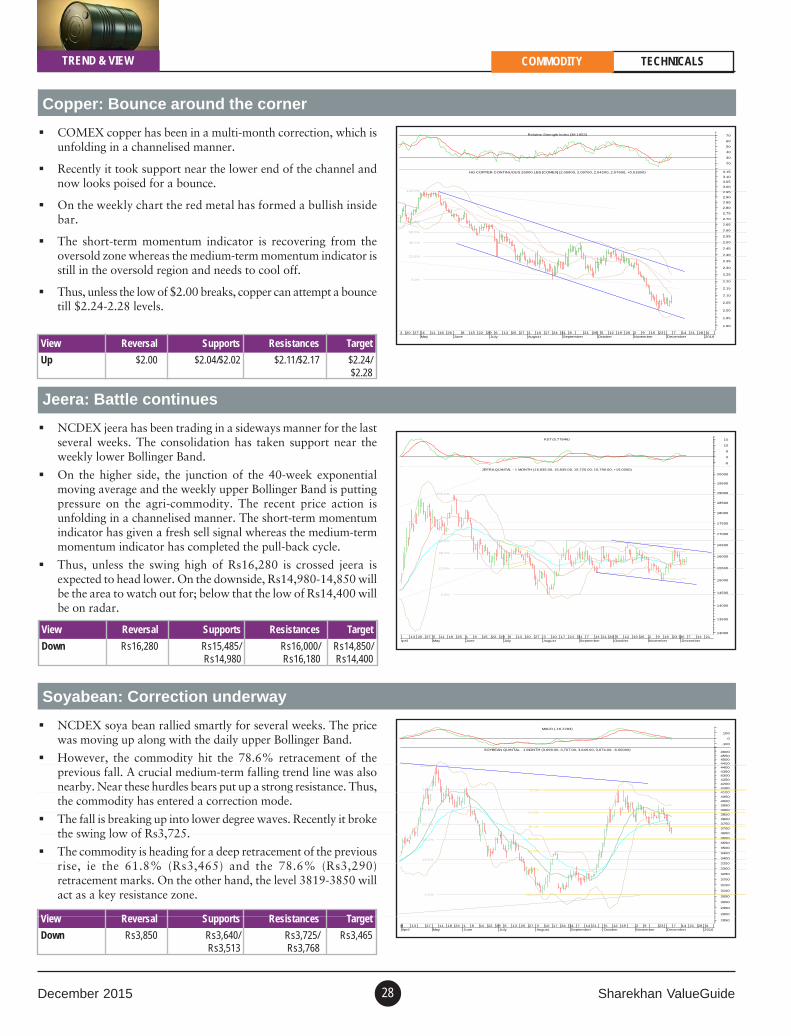
December 2015 Sharekhan ValueGuide28
Copper: Bounce around the corner
COMEX copper has been in a multi-month correction, which isunfolding in a channelised manner.
Recently it took support near the lower end of the channel andnow looks poised for a bounce.
On the weekly chart the red metal has formed a bullish insidebar.
The short-term momentum indicator is recovering from theoversold zone whereas the medium-term momentum indicator isstill in the oversold region and needs to cool off.
Thus, unless the low of $2.00 breaks, copper can attempt a bouncetill $2.24-2.28 levels.
Jeera: Battle continues
NCDEX jeera has been trading in a sideways manner for the lastseveral weeks. The consolidation has taken support near theweekly lower Bollinger Band.
On the higher side, the junction of the 40-week exponentialmoving average and the weekly upper Bollinger Band is puttingpressure on the agri-commodity. The recent price action isunfolding in a channelised manner. The short-term momentumindicator has given a fresh sell signal whereas the medium-termmomentum indicator has completed the pull-back cycle.
Thus, unless the swing high of Rs16,280 is crossed jeera isexpected to head lower. On the downside, Rs14,980-14,850 willbe the area to watch out for; below that the low of Rs14,400 willbe on radar.
Soyabean: Correction underway
NCDEX soya bean rallied smartly for several weeks. The pricewas moving up along with the daily upper Bollinger Band.
However, the commodity hit the 78.6% retracement of theprevious fall. A crucial medium-term falling trend line was alsonearby. Near these hurdles bears put up a strong resistance. Thus,the commodity has entered a correction mode.
The fall is breaking up into lower degree waves. Recently it brokethe swing low of Rs3,725.
The commodity is heading for a deep retracement of the previousrise, ie the 61.8% (Rs3,465) and the 78.6% (Rs3,290)retracement marks. On the other hand, the level 3819-3850 willact as a key resistance zone.
View Reversal Supports Resistances Target
Up $2.00 $2.04/$2.02 $2.11/$2.17 $2.24/$2.28
View Reversal Supports Resistances Target
Down Rs16,280 Rs15,485/ Rs16,000/ Rs14,850/Rs14,980 Rs16,180 Rs14,400
View Reversal Supports Resistances Target
Down Rs3,850 Rs3,640/ Rs3,725/ Rs3,465Rs3,513 Rs3,768
COMMODITY TECHNICALSTREND & VIEW
3 20 27 4May
11 18 26 8June
15 22 29 6July
13 20 27 3 10August
17 24 31 8September
21 28 5 12October
19 26 2 9 16November
23 7 14December
21 28 42016
1.90
1.95
2.00
2.05
2.10
2.15
2.20
2.25
2.30
2.35
2.40
2.45
2.50
2.55
2.60
2.65
2.70
2.75
2.80
2.85
2.90
2.95
3.00
3.05
3.10
3.15
0.0%
23.6%
38.2%
50.0%
61.8%
100.0%
HG COPPER CONTINUOUS 25000 LBS [COMEX] (2.05900, 2.09700, 2.04200, 2.07900, +0.01800)
20
30
40
50
60
70Relative Strength Index (38.1853)
0April
13 20 27 5 11May
18 25 1 8June
15 22 29 6July
13 20 27 3 10August
17 24 31 7 14September
21 28 5 12October
19 26 2 9 16November
23 30 7 14December
2113000
13500
14000
14500
15000
15500
16000
16500
17000
17500
18000
18500
19000
19500
20000
0.0%
23.6%
38.2%
50.0%
61.8%
100.0%
JEERA QUINTAL - 1 MONTH (15,935.00, 15,935.00, 15,725.00, 15,790.00, +15.0000)
-5
0
5
10
15KST (0.77846)
30April
13 27 11May
18 25 1 8June
15 22 29 6July
13 20 27 3 10August
17 24 31 7 14September
21 5 12October
19 2 9November
23 7 14December
21 28 42016
2850
2900
2950
3000
3050
3100
3150
3200
3250
3300
3350
3400
3450
3500
3550
3600
3650
3700
3750
3800
3850
3900
3950
4000
4050
4100
4150
4200
4250
43004350
44004450450045504600
0.0%
23.6%
38.2%
50.0%
61.8%
78.6%
100.0%
0.0%
23.6%
38.2%
50.0%
61.8%
78.6%
100.0%
SOYBEAN QUINTAL - 1 MONTH (3,699.00, 3,707.00, 3,646.00, 3,674.00, -6.00000)
-100
0
100
MACD (-16.2293)
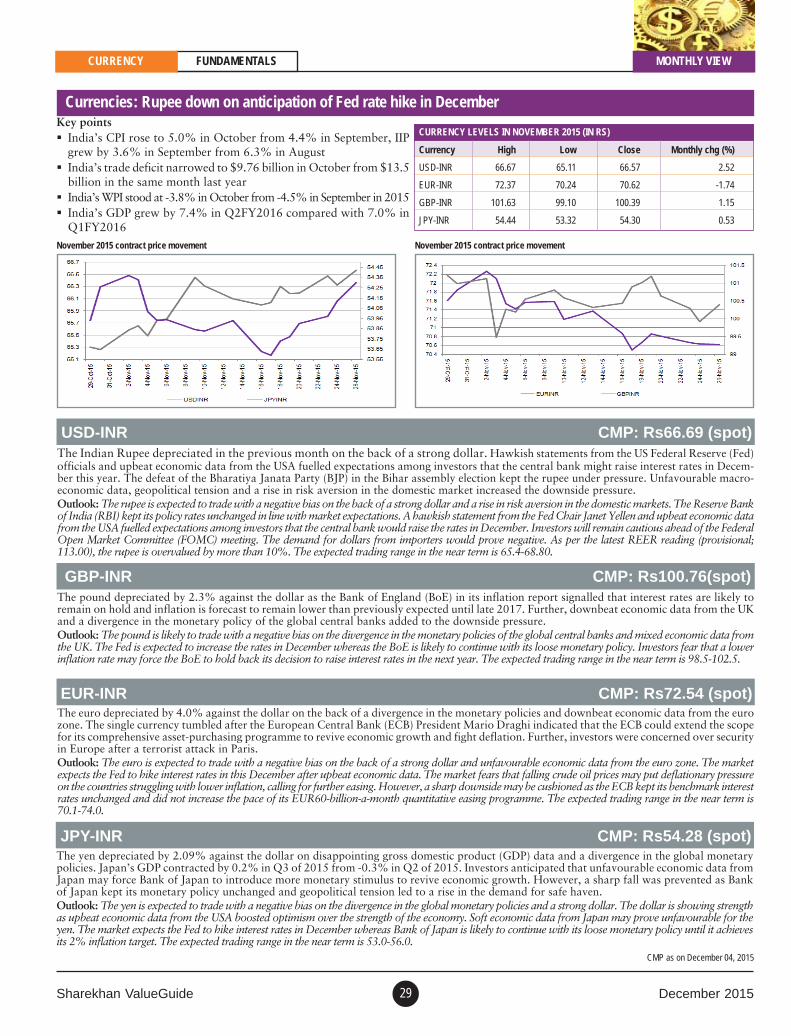
Sharekhan ValueGuide December 201529
Currencies: Rupee down on anticipation of Fed rate hike in DecemberKey points India’s CPI rose to 5.0% in October from 4.4% in September, IIP
grew by 3.6% in September from 6.3% in August India’s trade deficit narrowed to $9.76 billion in October from $13.5
billion in the same month last year India’s WPI stood at -3.8% in October from -4.5% in September in 2015 India’s GDP grew by 7.4% in Q2FY2016 compared with 7.0% in
Q1FY2016
CURRENCY LEVELS IN NOVEMBER 2015 (IN RS)
Currency High Low Close Monthly chg (%)
USD-INR 66.67 65.11 66.57 2.52
EUR-INR 72.37 70.24 70.62 -1.74
GBP-INR 101.63 99.10 100.39 1.15
JPY-INR 54.44 53.32 54.30 0.53
USD-INR CMP: Rs66.69 (spot)The Indian Rupee depreciated in the previous month on the back of a strong dollar. Hawkish statements from the US Federal Reserve (Fed)officials and upbeat economic data from the USA fuelled expectations among investors that the central bank might raise interest rates in Decem-ber this year. The defeat of the Bharatiya Janata Party (BJP) in the Bihar assembly election kept the rupee under pressure. Unfavourable macro-economic data, geopolitical tension and a rise in risk aversion in the domestic market increased the downside pressure.Outlook: The rupee is expected to trade with a negative bias on the back of a strong dollar and a rise in risk aversion in the domestic markets. The Reserve Bankof India (RBI) kept its policy rates unchanged in line with market expectations. A hawkish statement from the Fed Chair Janet Yellen and upbeat economic datafrom the USA fuelled expectations among investors that the central bank would raise the rates in December. Investors will remain cautious ahead of the FederalOpen Market Committee (FOMC) meeting. The demand for dollars from importers would prove negative. As per the latest REER reading (provisional;113.00), the rupee is overvalued by more than 10%. The expected trading range in the near term is 65.4-68.80.
GBP-INR CMP: Rs100.76(spot)
JPY-INR CMP: Rs54.28 (spot)The yen depreciated by 2.09% against the dollar on disappointing gross domestic product (GDP) data and a divergence in the global monetarypolicies. Japan’s GDP contracted by 0.2% in Q3 of 2015 from -0.3% in Q2 of 2015. Investors anticipated that unfavourable economic data fromJapan may force Bank of Japan to introduce more monetary stimulus to revive economic growth. However, a sharp fall was prevented as Bankof Japan kept its monetary policy unchanged and geopolitical tension led to a rise in the demand for safe haven.Outlook: The yen is expected to trade with a negative bias on the divergence in the global monetary policies and a strong dollar. The dollar is showing strengthas upbeat economic data from the USA boosted optimism over the strength of the economy. Soft economic data from Japan may prove unfavourable for theyen. The market expects the Fed to hike interest rates in December whereas Bank of Japan is likely to continue with its loose monetary policy until it achievesits 2% inflation target. The expected trading range in the near term is 53.0-56.0.
November 2015 contract price movement November 2015 contract price movement
The euro depreciated by 4.0% against the dollar on the back of a divergence in the monetary policies and downbeat economic data from the eurozone. The single currency tumbled after the European Central Bank (ECB) President Mario Draghi indicated that the ECB could extend the scopefor its comprehensive asset-purchasing programme to revive economic growth and fight deflation. Further, investors were concerned over securityin Europe after a terrorist attack in Paris.Outlook: The euro is expected to trade with a negative bias on the back of a strong dollar and unfavourable economic data from the euro zone. The marketexpects the Fed to hike interest rates in this December after upbeat economic data. The market fears that falling crude oil prices may put deflationary pressureon the countries struggling with lower inflation, calling for further easing. However, a sharp downside may be cushioned as the ECB kept its benchmark interestrates unchanged and did not increase the pace of its EUR60-billion-a-month quantitative easing programme. The expected trading range in the near term is70.1-74.0.
CURRENCY FUNDAMENTALS
EUR-INR CMP: Rs72.54 (spot)
MONTHLY VIEW
CMP as on December 04, 2015
The pound depreciated by 2.3% against the dollar as the Bank of England (BoE) in its inflation report signalled that interest rates are likely toremain on hold and inflation is forecast to remain lower than previously expected until late 2017. Further, downbeat economic data from the UKand a divergence in the monetary policy of the global central banks added to the downside pressure.Outlook: The pound is likely to trade with a negative bias on the divergence in the monetary policies of the global central banks and mixed economic data fromthe UK. The Fed is expected to increase the rates in December whereas the BoE is likely to continue with its loose monetary policy. Investors fear that a lowerinflation rate may force the BoE to hold back its decision to raise interest rates in the next year. The expected trading range in the near term is 98.5-102.5.
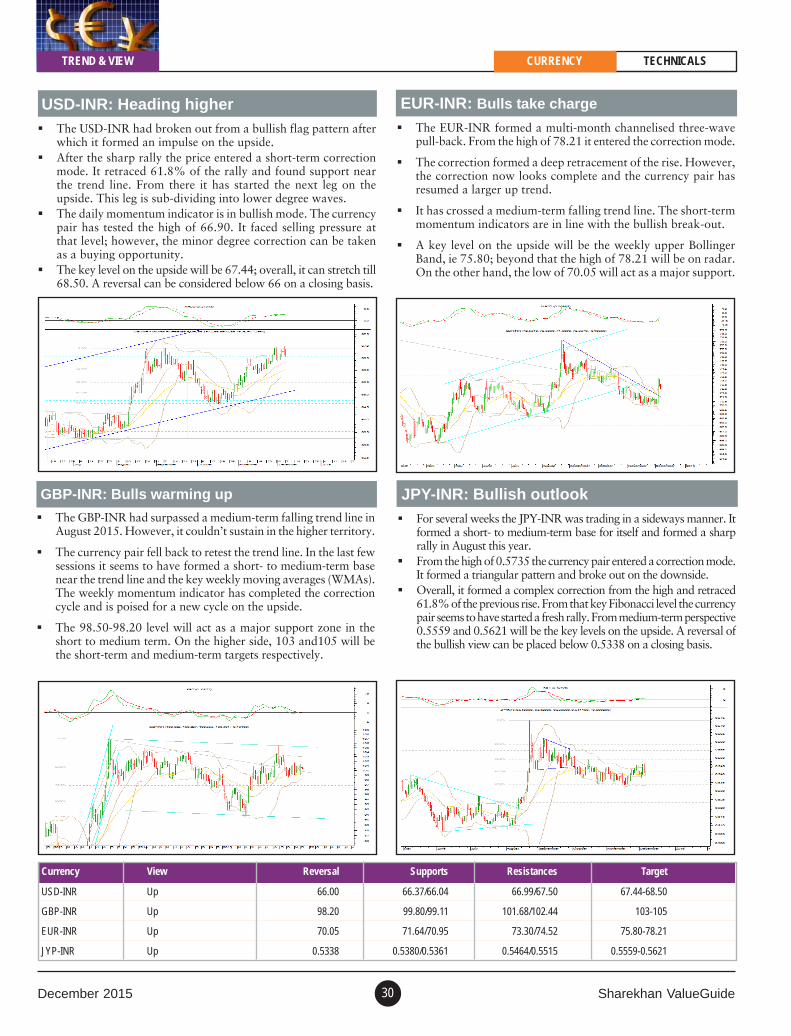
December 2015 Sharekhan ValueGuide30
Currency View Reversal Supports Resistances Target
USD-INR Up 66.00 66.37/66.04 66.99/67.50 67.44-68.50
GBP-INR Up 98.20 99.80/99.11 101.68/102.44 103-105
EUR-INR Up 70.05 71.64/70.95 73.30/74.52 75.80-78.21
JYP-INR Up 0.5338 0.5380/0.5361 0.5464/0.5515 0.5559-0.5621
JPY-INR: Bullish outlook
For several weeks the JPY-INR was trading in a sideways manner. Itformed a short- to medium-term base for itself and formed a sharprally in August this year.
From the high of 0.5735 the currency pair entered a correction mode.It formed a triangular pattern and broke out on the downside.
Overall, it formed a complex correction from the high and retraced61.8% of the previous rise. From that key Fibonacci level the currencypair seems to have started a fresh rally. From medium-term perspective0.5559 and 0.5621 will be the key levels on the upside. A reversal ofthe bullish view can be placed below 0.5338 on a closing basis.
USD-INR: Heading higher
The USD-INR had broken out from a bullish flag pattern afterwhich it formed an impulse on the upside.
After the sharp rally the price entered a short-term correctionmode. It retraced 61.8% of the rally and found support nearthe trend line. From there it has started the next leg on theupside. This leg is sub-dividing into lower degree waves.
The daily momentum indicator is in bullish mode. The currencypair has tested the high of 66.90. It faced selling pressure atthat level; however, the minor degree correction can be takenas a buying opportunity.
The key level on the upside will be 67.44; overall, it can stretch till68.50. A reversal can be considered below 66 on a closing basis.
CURRENCY TECHNICALSTREND & VIEW
EUR-INR: Bulls take charge
The EUR-INR formed a multi-month channelised three-wavepull-back. From the high of 78.21 it entered the correction mode.
The correction formed a deep retracement of the rise. However,the correction now looks complete and the currency pair hasresumed a larger up trend.
It has crossed a medium-term falling trend line. The short-termmomentum indicators are in line with the bullish break-out.
A key level on the upside will be the weekly upper BollingerBand, ie 75.80; beyond that the high of 78.21 will be on radar.On the other hand, the low of 70.05 will act as a major support.
GBP-INR: Bulls warming up
The GBP-INR had surpassed a medium-term falling trend line inAugust 2015. However, it couldn’t sustain in the higher territory.
The currency pair fell back to retest the trend line. In the last fewsessions it seems to have formed a short- to medium-term basenear the trend line and the key weekly moving averages (WMAs).The weekly momentum indicator has completed the correctioncycle and is poised for a new cycle on the upside.
The 98.50-98.20 level will act as a major support zone in theshort to medium term. On the higher side, 103 and105 will bethe short-term and medium-term targets respectively.

Sharekhan ValueGuide December 201531
MUTUAL FUNDS DESK MF PICKS
Sharekhan Limited, its analyst or dependant(s) of the analyst might be holding or having a postition in the mutual funds mentioned in the article.
Every individual has a different investment requirement, which depends on his financial goals and risk-taking capacities. We at Sharekhanfirst understand the individual’s investment objectives and risk-taking capacity, and then recommend a suitable portfolio. So, we suggestthat you get in touch with our Mutual Fund Advisor before investing in the best funds.
SHAREKHAN’S TOP MUTUAL FUND PICKS (EQUITY) NOVEMBER 13, 2015Data as on November 03, 2015
Scheme name Star NAV (Rs) Returns (%)rating Absolute Compounded annualised
6 months 1 year 3 years 5 years Since inception
Large-cap funds
SBI Bluechip Fund 28.2 2.5 10.4 21.5 11.6 11.3
Birla Sun Life Top 100 Fund 42.8 1.9 5.2 20.6 11.8 15.6
Birla Sun Life Frontline Equity Fund 160.4 1.0 5.2 19.8 10.8 23.4
Reliance Top 200 Fund 23.6 0.1 5.0 19.5 10.8 11.0
UTI Top 100 Fund 48.1 -0.4 5.1 16.1 9.2 12.4
Indices
BSE Sensex 26,590.6 -1.5 -4.6 12.3 5.4 16.3
Mid-cap funds
SBI Magnum Midcap Fund 59.4 5.9 19.8 33.5 17.6 18.3
Mirae Asset Emerging Bluechip Fund 30.9 8.0 19.2 33.3 21.1 23.6
UTI Mid Cap Fund 79.5 3.4 11.3 33.2 17.4 20.6
Franklin India Prima Fund 665.0 3.1 15.4 30.4 16.2 21.0
L&T Midcap Fund 87.7 5.3 15.1 29.8 13.5 21.3
Indices
BSE MID CAP 11,013.5 5.6 10.78 18.32 5.2 22.00
Multi-cap funds
Birla Sun Life Pure Value Fund 38.7 6.2 9.5 31.0 14.9 19.5
L&T India Value Fund 25.0 6.9 17.0 29.5 14.6 17.0
Franklin India High Growth Companies Fund 29.1 -0.4 11.9 29.4 14.8 13.8
SBI Magnum Global Fund 94 134.4 3.0 17.2 28.4 17.2 15.5
ICICI Prudential Value Discovery Fund 113.5 1.2 9.7 28.4 16.6 24.2
Indices
BSE 500 10,675.9 -0.2 0.5 13.9 5.3 15.2
Tax saving funds
Axis Long Term Equity Fund 30.8 2.5 13.4 29.3 18.3 21.2
Reliance Tax Saver (ELSS) Fund 44.5 -4.8 0.1 24.0 13.4 16.0
BNP Paribas Long Term Equity Fund 29.4 2.5 9.7 23.2 13.6 11.6
Franklin India Taxshield 423.4 3.1 11.4 23.0 13.9 25.4
IDFC Tax Advantage (ELSS) Fund 37.6 -4.3 10.3 21.5 10.9 21.3
Indices
CNX500 6,755.2 0.1 0.8 14.4 5.8 9.4
Thematic funds
ICICI Prudential Exports and Other Services Fund 47.8 11.2 19.3 38.1 20.4 17.1
Franklin Build India Fund 28.4 -1.8 12.0 31.1 16.1 18.4
Birla Sun Life Special Situations Fund 17.9 4.2 14.6 23.4 9.4 7.8
Religare Invesco Infrastructure Fund 13.0 -7.3 1.9 20.6 6.9 3.3
Kotak Infrastructure & Economic Reform Fund 15.2 2.7 8.3 19.1 8.3 5.6
Indices
S&P Nifty (CNX Nifty) 8,060.7 -1.5 -3.2 12.2 5.5 14.2
Balanced funds
L&T India Prudence Fund 19.6 3.7 13.3 21.8 -- 15.3
SBI Magnum Balanced Fund 95.9 1.9 11.8 21.7 11.9 16.6
HDFC Balanced Fund 108.5 2.4 8.3 20.6 13.4 17.0
Franklin India Balanced Fund 91.3 3.4 12.1 20.5 12.3 14.9
DSP BlackRock Balanced Fund 109.7 4.0 10.1 16.9 9.1 15.7
Indices
Crisil Balanced Fund Index -- 0.8 1.8 11.4 6.9 12.8
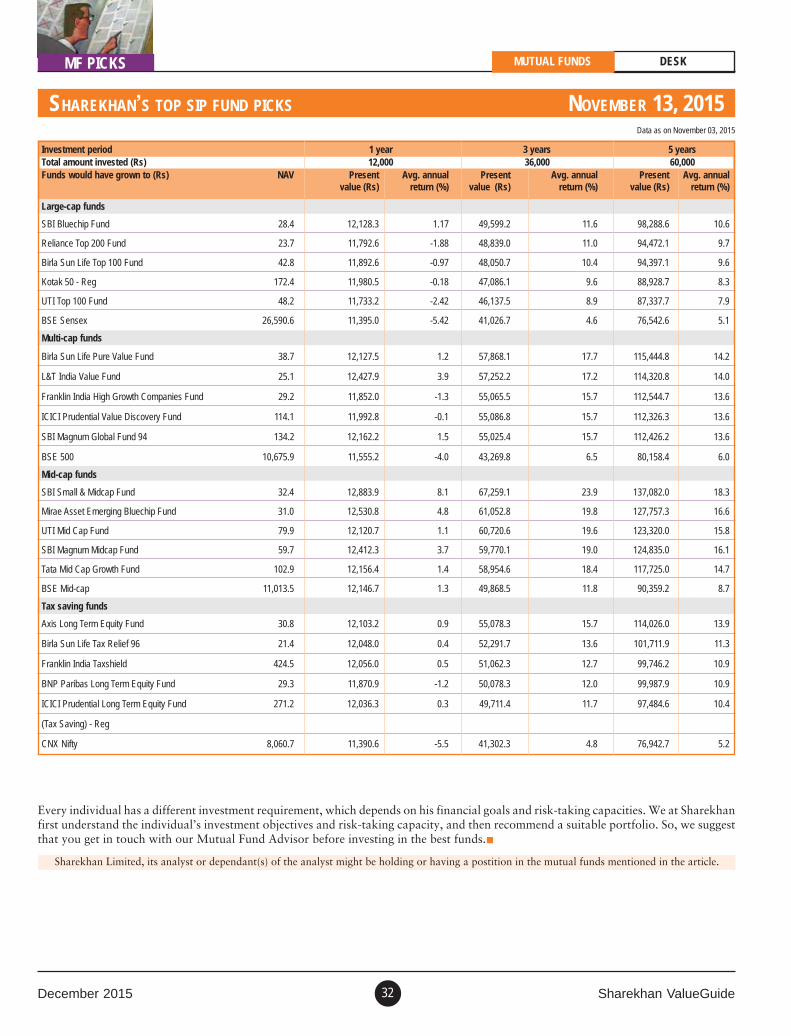
December 2015 Sharekhan ValueGuide32
MUTUAL FUNDS DESK
SHAREKHAN’S TOP SIP FUND PICKS NOVEMBER 13, 2015
MF PICKS
Sharekhan Limited, its analyst or dependant(s) of the analyst might be holding or having a postition in the mutual funds mentioned in the article.
Every individual has a different investment requirement, which depends on his financial goals and risk-taking capacities. We at Sharekhanfirst understand the individual’s investment objectives and risk-taking capacity, and then recommend a suitable portfolio. So, we suggestthat you get in touch with our Mutual Fund Advisor before investing in the best funds.
Data as on November 03, 2015
Investment period 1 year 3 years 5 yearsTotal amount invested (Rs) 12,000 36,000 60,000Funds would have grown to (Rs) NAV Present Avg. annual Present Avg. annual Present Avg. annual
value (Rs) return (%) value (Rs) return (%) value (Rs) return (%)
Large-cap funds
SBI Bluechip Fund 28.4 12,128.3 1.17 49,599.2 11.6 98,288.6 10.6
Reliance Top 200 Fund 23.7 11,792.6 -1.88 48,839.0 11.0 94,472.1 9.7
Birla Sun Life Top 100 Fund 42.8 11,892.6 -0.97 48,050.7 10.4 94,397.1 9.6
Kotak 50 - Reg 172.4 11,980.5 -0.18 47,086.1 9.6 88,928.7 8.3
UTI Top 100 Fund 48.2 11,733.2 -2.42 46,137.5 8.9 87,337.7 7.9
BSE Sensex 26,590.6 11,395.0 -5.42 41,026.7 4.6 76,542.6 5.1
Multi-cap funds
Birla Sun Life Pure Value Fund 38.7 12,127.5 1.2 57,868.1 17.7 115,444.8 14.2
L&T India Value Fund 25.1 12,427.9 3.9 57,252.2 17.2 114,320.8 14.0
Franklin India High Growth Companies Fund 29.2 11,852.0 -1.3 55,065.5 15.7 112,544.7 13.6
ICICI Prudential Value Discovery Fund 114.1 11,992.8 -0.1 55,086.8 15.7 112,326.3 13.6
SBI Magnum Global Fund 94 134.2 12,162.2 1.5 55,025.4 15.7 112,426.2 13.6
BSE 500 10,675.9 11,555.2 -4.0 43,269.8 6.5 80,158.4 6.0
Mid-cap funds
SBI Small & Midcap Fund 32.4 12,883.9 8.1 67,259.1 23.9 137,082.0 18.3
Mirae Asset Emerging Bluechip Fund 31.0 12,530.8 4.8 61,052.8 19.8 127,757.3 16.6
UTI Mid Cap Fund 79.9 12,120.7 1.1 60,720.6 19.6 123,320.0 15.8
SBI Magnum Midcap Fund 59.7 12,412.3 3.7 59,770.1 19.0 124,835.0 16.1
Tata Mid Cap Growth Fund 102.9 12,156.4 1.4 58,954.6 18.4 117,725.0 14.7
BSE Mid-cap 11,013.5 12,146.7 1.3 49,868.5 11.8 90,359.2 8.7
Tax saving funds
Axis Long Term Equity Fund 30.8 12,103.2 0.9 55,078.3 15.7 114,026.0 13.9
Birla Sun Life Tax Relief 96 21.4 12,048.0 0.4 52,291.7 13.6 101,711.9 11.3
Franklin India Taxshield 424.5 12,056.0 0.5 51,062.3 12.7 99,746.2 10.9
BNP Paribas Long Term Equity Fund 29.3 11,870.9 -1.2 50,078.3 12.0 99,987.9 10.9
ICICI Prudential Long Term Equity Fund 271.2 12,036.3 0.3 49,711.4 11.7 97,484.6 10.4
(Tax Saving) - Reg
CNX Nifty 8,060.7 11,390.6 -5.5 41,302.3 4.8 76,942.7 5.2

Sharekhan ValueGuide December 201533
Prices as on December 03, 2015
FY15 FY16E FY17E FY15 FY16E FY17E FY15 FY16E FY17E FY17/FY15 FY15 FY16E FY17E FY16E FY17E FY16E FY17E (Rs)
EQUITY FUNDAMENTALSEARNINGS GUIDE
Sharekhan Earnings Guide
Note: For Grasim and Apollo Tyres we have shifted our estimates to consolidated ^^ FY2015 earnings numbers are on reported basis, including the one-time impact of bonus for employees to the tune of Rs2,627.9 crore.
AUTOMOBILES
Apollo Tyres 158.5 12,785.2 11,802.7 13,063.3 1,060.1 1,092.9 1,134.6 20.8 21.5 22.3 3% 7.6 7.4 7.1 21.2 16.9 19.8 17.4 2.0 1.3
Ashok Leyland 92.0 13,562.2 18,698.1 23,084.2 233.9 996.3 1,559.4 0.8 3.5 5.5 158% 111.9 26.3 16.8 21.2 29.2 18.0 23.6 0.5 0.5
Bajaj Auto 2,480.2 21,612.0 23,784.6 27,220.7 3,087.1 3,774.8 4,396.2 106.7 130.4 151.9 19% 23.2 19.0 16.3 46.1 46.5 32.7 32.9 50.0 2.0
Gabriel Industries 89.5 1,444.1 1,489.6 1,745.5 60.6 78.7 104.6 4.2 5.5 7.3 31% 21.2 16.3 12.3 26.7 30.4 22.2 24.7 1.1 1.2
Hero MotoCorp 2,617.8 27,585.3 28,820.2 33,854.1 2,540.7 3,189.4 3,920.5 127.2 159.7 196.3 24% 20.6 16.4 13.3 62.8 63.8 45.0 45.9 60.0 2.3
M&M 1,345.7 37,468.3 40,680.6 48,139.3 3,087.6 3,644.4 4,727.1 52.2 61.6 79.9 24% 25.8 21.8 16.8 16.8 20.3 17.2 19.5 12.0 0.9
Maruti Suzuki 4,627.1 49,970.6 58,232.6 69,966.8 3,711.2 5,392.1 6,844.9 122.9 178.5 226.6 36% 37.7 25.9 20.4 22.2 22.2 18.0 18.0 25.0 0.5
Rico Auto Industries 45.3 1,346.3 1,076.1 1,234.9 -6.9 33.1 59.4 -0.5 2.4 4.4 - -88.7 18.5 10.3 10.4 15.2 7.1 11.6 3.0 6.6
TVS Motor 283.5 9,920.1 11,528.5 13,731.5 401.8 496.0 696.1 8.5 10.4 14.7 32% 33.5 27.2 19.3 24.1 30.2 27.4 31.9 1.9 0.7
BANKS & FINANCE
Allahabad Bank 74.8 8,173.9 8,649.8 9,692.6 620.9 866.5 1,261.3 10.9 15.2 22.1 43% 6.9 4.9 3.4 - - 6.7 9.1 1.6 2.2
Andhra Bank 67.6 6,037.5 6,677.9 7,660.9 638.4 1,050.5 1,261.1 10.6 17.4 20.9 41% 6.4 3.9 3.2 - - 10.0 11.1 2.0 3.0
Axis (UTI) Bank 462.5 22,589.2 26,402.1 31,221.0 7,355.9 8,612.3 10,424.2 31.0 36.3 44.0 19% 14.9 12.7 10.5 - - 17.9 18.6 5.5 1.2
Bajaj Finance 5,540.0 2,871.7 3,705.9 4,698.1 893.6 1,173.6 1,505.1 178.7 220.3 282.5 26% 31.0 25.1 19.6 - - 19.5 19.2 18.1 0.3
Bajaj Finserv 2,026.6 7,587.0 - - 1,689.8 - - 106.2 - - 19.1 0.0 0.0 - - 0.0 0.0 1.8 0.1
Bank of Baroda 171.3 17,589.2 18,291.2 20,895.5 3,398.4 3,382.6 4,557.0 15.3 15.3 20.5 16% 11.2 11.2 8.3 - - 8.2 10.3 3.2 1.9
Bank of India 125.3 15,576.7 16,884.6 19,188.1 1,708.9 1,640.0 2,106.4 25.7 24.6 31.6 11% 4.9 5.1 4.0 - - 5.1 6.3 5.1 4.1
Capital First 382.2 501.4 695.5 865.8 110.7 171.4 239.5 12.2 18.8 26.3 47% 31.4 20.3 14.5 - - 10.5 13.3 2.2 0.6
Corp Bank 42.4 5,552.8 6,204.3 7,092.3 584.0 685.2 995.5 7.0 8.2 11.9 31% 6.1 5.2 3.6 - - 6.4 8.7 1.4 3.3
Federal Bank 57.1 3,258.7 3,545.8 4,153.2 1,004.9 940.2 1,182.6 5.9 5.5 6.9 8% 9.7 10.4 8.3 - - 11.6 13.2 1.1 1.9
HDFC 1,200.2 7,630.7 9,263.1 11,220.9 5,990.1 7,164.2 8,521.1 38.0 45.5 54.1 19% 31.6 26.4 22.2 - - 20.4 21.2 13.0 1.1
HDFC Bank 1,076.8 31,392.0 37,450.7 45,076.5 10,215.9 12,467.9 15,358.2 40.8 49.7 61.3 23% 26.4 21.6 17.6 - - 18.7 19.8 8.0 0.7
ICICI Bank 265.8 31,215.7 35,218.7 40,280.5 11,175.4 12,725.0 14,794.4 19.3 21.9 25.5 15% 13.8 12.1 10.4 - - 15.1 15.9 5.0 1.9
IDBI Bank 93.2 9,755.5 9,552.3 10,757.3 873.4 948.2 1,310.5 5.4 5.9 8.2 22% 17.1 15.8 11.4 - - 3.8 5.1 0.7 0.8
LIC Housing Fin. 467.9 2,236.4 2,822.4 3,410.2 1,386.2 1,732.4 2,120.0 27.5 34.3 42.0 24% 17.0 13.6 11.1 - - 20.4 21.2 5.0 1.1
PTC India Fin. Ser. 40.3 340.7 444.6 576.9 160.9 277.6 372.5 4.4 7.1 9.5 47% 9.2 5.7 4.3 - - 18.1 21.3 1.0 2.5
PNB 136.4 22,446.3 24,459.4 28,244.3 3,061.6 4,110.4 5,168.4 16.5 22.2 27.9 30% 8.3 6.2 4.9 - - 10.1 11.6 3.3 2.4
SBI 241.1 77,591.1 85,970.2 99,619.3 13,101.6 17,862.2 23,772.7 17.5 23.9 31.8 35% 13.7 10.1 7.6 - - 13.2 15.7 3.5 1.5
Union Bank of India 168.8 11,966.9 12,770.0 14,604.2 1,781.6 2,198.3 2,735.1 28.0 34.6 43.0 24% 6.0 4.9 3.9 - - 10.7 12.2 6.0 3.6
Yes Bank 752.1 5,534.3 6,843.2 8,494.8 2,005.4 2,370.0 2,974.9 48.7 57.6 72.3 22% 15.4 13.1 10.4 - - 18.8 20.2 9.1 1.2
CONSUMER GOODS
Britannia 2,931.9 7,858.4 8,836.0 10,312.3 542.5 853.2 1,036.2 45.2 71.1 86.4 38% 64.9 41.2 33.9 51.9 45.6 55.9 47.5 16.0 0.5
GSK Consumers* 5,960.0 4,136.4 4,327.4 5,046.7 583.6 673.8 800.8 138.8 160.2 190.4 17% 42.9 37.2 31.3 44.2 44.2 29.2 29.2 55.0 0.9
Godrej Consumer 1,221.9 8,242.2 9,292.9 11,044.8 923.8 1,140.7 1,403.0 27.1 33.5 41.2 23% 45.1 36.5 29.7 22.5 24.6 25.7 25.8 5.5 0.5
Hindustan Unilever 816.6 31,199.7 33,912.4 38,564.1 3,886.5 4,389.7 5,379.5 18.0 20.3 24.9 18% 45.4 40.2 32.8 143.1 147.2 101.7 104.4 15.0 1.8
ITC 343.4 36,507.4 39,066.0 44,378.7 9,607.7 10,220.6 11,653.0 12.0 12.8 14.5 10% 28.6 26.8 23.7 39.0 38.0 30.9 30.4 6.3 1.8
Jyothy Laboratories 313.5 1,514.8 1,724.2 2,016.2 123.1 185.3 196.9 6.7 10.0 10.7 26% 46.8 31.4 29.3 15.8 21.4 22.4 20.7 4.0 1.3
Marico^ 425.2 5,733.0 6,190.7 7,022.9 573.5 711.3 857.2 8.9 11.0 13.3 22% 47.8 38.7 32.0 42.4 41.0 33.5 30.9 2.5 0.6
Zydus Wellness 831.0 415.2 432.3 497.6 98.7 108.4 129.0 25.3 27.7 33.0 14% 32.8 30.0 25.2 24.3 24.1 26.2 26.1 6.0 0.7
IT / IT SERVICESFirstsource Solution 42.6 3,034.6 3,260.5 3,568.2 234.3 273.6 336.1 3.5 4.1 5.0 20% 12.2 10.4 8.5 11.8 12.9 12.3 13.3 0.0 0.0
HCL Technologies** 851.2 37,062.0 41,931.9 46,415.3 7,255.0 7,612.9 8,746.0 51.4 54.0 62.0 10% 16.6 15.8 13.7 37.5 36.0 31.1 29.3 22.0 2.6
Infosys 1,057.8 53,319.0 60,873.1 68,084.5 12,330.0 13,082.3 14,889.8 53.9 57.2 65.1 10% 19.6 18.5 16.2 34.0 34.8 24.4 25.0 59.5 5.6
Persistent Systems 660.0 1,891.3 2,207.0 2,524.4 290.6 291.8 358.5 36.3 36.5 44.8 11% 18.2 18.1 14.7 26.3 27.6 19.2 20.3 10.0 1.5
TCS^^ 2,350.8 94,648.4 108,999.5 122,620.7 19,648.4 24,032.0 26,817.8 100.3 122.7 136.9 17% 23.4 19.2 17.2 41.9 38.0 32.7 29.7 32.0 1.4
Wipro 572.6 46,954.5 50,707.4 55,105.1 8,652.8 9,305.0 10,498.9 35.3 37.8 42.6 10% 16.2 15.1 13.4 17.6 17.9 20.2 20.0 12.0 2.1
CAPITAL GOODS / POWER
BHEL 168.7 29,542.0 27,106.0 32,886.0 1,419.9 721.0 1,945.0 5.8 2.9 7.9 17% 29.1 58.2 21.3 3.1 8.2 2.1 5.5 1.2 0.7
CESC 555.0 6,189.0 6,628.3 7,149.0 698.0 704.3 765.2 52.4 52.9 57.4 5% 10.6 10.5 9.7 7.2 7.3 8.4 8.6 9.0 1.6
Crompton Greaves 193.8 14,013.0 14,248.0 15,628.0 183.0 134.0 365.0 2.1 2.1 5.8 66% 92.3 92.3 33.4 8.0 11.2 3.0 8.7 1.2 0.6
Finolex Cable 250.0 2,449.1 2,736.9 3,162.8 175.8 191.9 243.3 11.5 12.5 15.9 18% 21.7 20.0 15.7 18.9 21.3 19.3 21.7 1.8 0.7
Greaves Cotton^ 149.3 1,692.2 1,668.6 1,800.3 127.7 187.6 210.4 5.2 7.7 8.6 28% 28.5 19.4 17.3 28.9 29.0 21.5 21.5 1.1 0.7
Kalpataru Power 275.0 4,422.3 4,696.0 5,371.0 165.6 194.0 236.0 10.8 12.6 15.4 19% 25.5 21.8 17.9 14.4 15.3 9.0 10.1 1.5 0.5
PTC India 65.1 13,081.7 13,561.0 14,080.0 189.3 207.0 216.0 6.4 7.0 7.3 7% 10.2 9.3 8.9 11.4 11.4 7.5 7.4 2.2 3.4
Skipper 163.6 1,312.8 1,601.7 1,935.0 61.4 88.9 124.0 6.0 8.7 12.1 42% 27.3 18.9 13.5 28.0 28.0 25.2 26.8 1.5 0.9
Company CMP Sales Net profit EPS (%) EPS PE (x) RoCE (%) RoNW (%) DPS Div(Rs) growth yield
(%)

Sharekhan ValueGuide December 201534
FY15 FY16E FY17E FY15 FY16E FY17E FY15 FY16E FY17E FY17/FY15 FY15 FY16E FY17E FY16E FY17E FY16E FY17E (Rs)
EQUITY FUNDAMENTALS EARNINGS GUIDE
^Marico estimates excluding Kaya’s financials ** June year ended * Inox Leisure FY2015 includes consolidation of Satyam Cineplexes, which will affect the overall profitability
Crompton Greaves is in the process of selling its overseas power system business by Q4FY2016. Hence, we have not estimated the FY2017 numbers #We have annualised these ratios to make them comparable
Divis Labs post 1:1 bonus BEL post Bonus: 2: 1 Cadila Healthcare post stock split from Rs 5 to Rs 1
Company CMP Sales Net profit EPS (%) EPS PE (x) RoCE (%) RoNW (%) DPS Div(Rs) growth yield
(%)Thermax 855.7 4,697.4 4,578.0 5,072.0 335.7 339.0 393.0 28.2 28.5 32.9 8% 30.4 30.0 26.0 21.2 22.1 14.3 14.9 7.0 0.8
Triveni Turbine 108.5 650.8 889.5 1,079.8 93.3 129.2 160.7 2.8 3.9 4.9 32% 38.8 27.8 22.1 62.4 51.1 44.1 36.7 1.0 0.9
Va Tech Wabag 701.3 2,435.2 2,869.0 3,448.0 110.1 137.2 181.1 20.3 25.3 33.4 28% 34.5 27.7 21.0 21.2 24.3 14.4 16.8 4.0 0.6
V-Guard Industries 913.5 1,745.9 1,938.0 2,221.0 70.7 96.0 121.0 23.6 32.0 40.2 31% 38.7 28.5 22.7 32.6 34.4 23.2 24.2 4.5 0.5
INFRASTRUCTURE / REAL ESTATE
Gayatri Projects 736.8 1,601.1 1,965.9 2,527.9 25.0 55.9 106.5 8.3 15.8 30.0 91% 89.1 46.7 24.5 9.2 11.8 7.5 12.3 2.0 0.3
ITNL 87.1 6,320.7 7,456.3 8,599.1 308.8 205.8 512.1 12.5 6.3 15.6 12% 7.0 13.9 5.6 8.2 9.4 3.4 7.7 4.0 4.6
IRB Infra 247.1 3,847.5 4,486.4 5,035.6 542.9 628.3 865.8 15.4 17.9 24.6 26% 16.0 13.8 10.0 11.1 13.5 13.7 16.7 4.0 1.6
Jaiprakash Asso 12.9 10,854.3 13,905.8 15,220.7 -867.3 -93.2 115.2 -4.1 -0.4 0.5 - -3.2 -29.4 23.8 6.6 7.3 -0.7 0.9 0.0 0.0
Larsen & Toubro 1,347.9 57,017.4 62,265.9 71,453.9 4,699.0 4,320.5 5,254.3 50.7 46.5 56.5 6% 26.6 29.0 23.8 12.5 14.2 11.2 12.5 16.3 1.2
Punj Lloyd 27.3 7,090.3 8,316.6 9,381.7 -1,681.4 -356.0 -268.0 -50.6 -10.7 -8.1 0% -0.5 -2.5 -3.4 -1.7 2.3 -48.8 -58.3 0.0 0.0
OIL & GAS
Oil India Ltd 386.5 9,748.2 9,754.0 10,988.0 2,510.2 2,584.0 2,857.0 41.8 43.0 47.5 7% 9.3 9.0 8.1 13.1 13.8 11.7 12.2 20.0 5.2
Reliance Ind 977.2 375,435.0 354,461.0 404,645.9 23,566.0 23,011.0 27,459.0 80.1 78.2 93.3 8% 12.2 12.5 10.5 7.7 8.8 9.7 10.5 10.0 1.0
Selan Exploration 242.1 79.3 74.2 110.9 28.3 26.3 39.1 17.3 16.0 23.8 17% 14.0 15.1 10.2 11.2 15.3 9.1 12.6 5.0 2.1
PHARMACEUTICALS
Aurobindo Pharma 820.8 12,120.5 13,965.1 16,216.4 1,635.4 1,987.0 2,545.8 28.0 34.0 43.6 25% 29.3 24.1 18.8 28.7 31.9 32.5 30.7 3.4 0.4
Cipla 651.2 11,345.4 13,627.0 16,673.0 1,180.8 1,793.0 2,563.0 14.7 22.3 31.9 47% 44.3 29.2 20.4 17.7 21.9 15.2 18.4 2.0 0.3
Cadila Healthcare 403.6 8,651.3 10,663.1 12,672.4 1,150.6 1,569.0 2,207.3 11.3 15.3 21.6 38% 35.7 26.4 18.7 27.3 30.3 27.5 28.3 2.4 0.6
Divi's Labs 1,126.7 3,114.9 3,732.8 4,580.9 865.5 1,040.2 1,350.3 32.6 39.2 40.9 12% 34.6 28.7 27.5 32.2 33.5 26.1 27.0 10.0 0.9
Glenmark Pharma 958.0 6,644.8 8,068.0 9,806.0 747.0 935.0 1,353.7 27.5 34.5 49.9 35% 34.8 27.8 19.2 18.9 22.6 24.2 26.3 2.0 0.2
Ipca Laboratories 765.0 3,142.0 3,337.0 3,931.0 254.0 330.0 538.0 19.8 26.1 42.7 47% 38.6 29.3 17.9 13.9 20.0 14.1 19.8 1.0 0.1
Lupin 1,821.7 12,599.7 14,206.0 16,887.0 2,403.0 2,655.0 3,341.0 53.5 59.1 74.3 18% 34.1 30.8 24.5 30.8 31.0 23.1 22.8 7.5 0.4
Sun Pharma 726.9 27,286.5 28,078.2 32,007.8 4,778.4 5,699.3 8,698.1 23.1 23.7 34.0 21% 31.5 30.7 21.4 21.1 25.1 18.3 22.4 0.0 0.0
Torrent Pharma 1,470.0 4,585.0 6,906.1 6,927.2 751.0 1,507.2 1,224.9 44.4 89.1 72.4 28% 33.1 16.5 20.3 38.5 28.7 45.4 26.1 11.3 0.8
BUILDING MATERIALS
Grasim 3,744.1 32,433.0 34,757.0 41,000.0 1,753.0 1,860.0 2,259.0 190.9 202.5 246.0 14% 19.6 18.5 15.2 11.7 13.5 7.3 7.8 18.0 0.5
The Ramco Cements 380.0 3,743.0 4,155.0 4,871.0 258.0 370.0 463.0 10.8 15.6 19.4 34% 35.2 24.4 19.6 13.2 14.6 7.7 8.4 1.5 0.4
Shree Cement** 11,300.0 6,454.0 6,134.0 9,687.0 462.0 390.0 1,220.0 133.1 112.0 350.3 62% 84.9 100.9 32.3 10.0 20.0 12.0 19.0 22.0 0.2
UltraTech Cement 2,859.4 22,656.0 24,839.0 29,933.0 2,062.0 2,217.0 3,147.0 75.3 80.9 114.9 24% 38.0 35.3 24.9 12.9 16.8 10.6 13.2 9.0 0.3
DISCRETIONARY CONSUMPTION
Cox and Kings 245.9 2,569.1 2,456.2 2,798.7 399.8 352.4 477.0 23.6 20.8 28.2 9% 10.4 11.8 8.7 11.3 13.5 15.5 18.3 1.0 0.4
Century Plyboards (I) 190.6 1,588.0 1,768.0 2,088.0 149.0 180.0 224.0 6.7 8.1 10.1 23% 28.4 23.5 18.9 23.4 23.2 38.1 33.3 2.0 1.0
Inox Leisure 245.3 1016.8* 1,373.9 1,651.0 20* 72.6 102.1 2.2 7.9 11.1 125% 111.5 31.1 22.1 12.9 15.6 9.7 12.0 0.0 0.0
KDDL 331.2 411.7 472.8 574.1 8.7 10.5 12.8 9.5 11.5 14.1 22% 34.9 28.8 23.5 13.3 13.4 16.5 16.4 2.0 0.6
KKCL 1,975.0 405.1 453.2 526.6 66.3 73.8 101.3 53.7 59.8 82.1 24% 36.8 33.0 24.1 29.3 31.5 21.5 26.0 22.0 1.1
Orbit Exports 373.0 158.0 175.0 209.0 27.9 30.8 31.0 19.4 22.8 27.6 19% 19.2 16.4 13.5 20.9 21.9 30.5 29.4 4.5 1.2
Raymond 417.3 5,352.0 5,850.0 6,497.0 115.8 88.3 124.3 18.9 14.4 20.2 3% 22.1 29.0 20.7 10.0 11.2 5.5 7.3 3.0 0.7
Relaxo Footwear 486.1 1,472.8 1,765.4 2,153.5 103.1 133.3 179.9 8.6 11.1 15.0 32% 56.5 43.8 32.4 26.0 27.7 22.1 22.3 0.5 0.1
Speciality Rest. 118.0 299.4 341.6 430.7 9.5 10.9 28.6 2.0 2.3 6.1 75% 59.0 51.3 19.3 4.8 12.0 3.5 8.9 1.0 0.8
Thomas Cook India 204.2 3244.3# 3,850.8 4,596.1 112.3 151.0 325.4 2.8 3.6 7.8 67% 72.9 56.7 26.2 20.4 21.8 23.4 25.6 0.5 0.2
Wonderla Holidays 365.6 181.9 212.9 312.5 50.6 56.1 74.1 9.0 9.9 13.1 21% 40.6 36.9 27.9 22.0 27.4 15.6 19.3 1.5 0.4
Zee Entertainment 409.9 4,883.7 5,727.5 6,767.1 977.5 1,075.2 1,353.9 8.6 9.9 12.4 20% 47.7 41.4 33.1 23.6 26.4 18.8 20.6 2.6 0.6
DIVERSIFIED / MISCELLANEOUS
Aditya Birla Nuvo 2,101.5 10,260.1 11,425.6 - 584.2 639.3 - 44.9 49.2 - -100% 46.8 42.7 0.0 8.9 - 7.1 - 7.0 0.3
Bajaj Holdings 1,725.0 523.9 - - 2,028.7 - - 182.3 - - - 9.5 0.0 0.0 - - - - 32.5 1.9
Bharti Airtel 319.6 92,039.0 97,293.0 107,143.0 5,883.0 5,211.0 6,712.0 14.7 13.0 16.8 7% 21.7 24.6 19.0 12.3 14.2 5.4 10.2 3.9 1.2
Bharat Electronics 1,223.4 6,775.9 7,742.9 9,312.0 1,100.6 1,324.3 1,598.8 45.9 55.2 66.6 21% 26.7 22.2 18.4 16.4 17.5 12.5 13.3 9.2 0.7
Gateway Distriparks 327.8 1,105.0 1,070.0 1,175.0 187.8 153.0 187.0 17.3 14.1 17.2 0% 19.0 23.2 19.1 14.5 17.2 16.7 20.1 7.0 2.1
Info Edge (India) 859.7 611.6 716.5 833.6 164.7 140.0 203.1 13.7 11.6 16.8 11% 62.7 74.1 51.2 11.1 14.9 7.8 10.3 3.0 0.3
Max India 539.4 14,815.0 - - 279.6 - - 10.5 - - - 51.4 - - - - - - 5.0 0.9
Ratnamani Metals 566.7 1,675.6 1,685.0 1,933.0 172.5 162.9 206.7 37.0 34.9 44.3 9% 15.3 16.2 12.8 23.3 25.7 16.7 18.2 5.5 1.0
Supreme Industries** 662.4 4,255.2 4,641.7 5,597.5 311.7 348.7 444.2 24.5 27.5 35.0 19% 27.0 24.1 18.9 28.6 32.0 24.2 25.7 9.0 1.4
UPL 421.4 12,090.5 13,198.5 15,000.7 1,224.0 1,220.7 1,534.3 28.6 28.5 35.8 12% 14.7 14.8 11.8 15.9 17.6 18.3 19.2 5.0 1.2

Sharekhan ValueGuide December 201535
Remarks
Automobiles
Apollo Tyres Apollo Tyres is the market leader in truck and bus tyre segments with a 28% market share. The management isexpecting strong demand traction in the European operations (particularly the summer tyre segment) and isgaining market share in Europe. Further, the domestic operations would see a pick-up in demand since H2FY15.The margins may sustain at higher levels due to subdued raw material prices. The company will be investing$560mn over the next three years to set up a greenfield facility in Hungary and Rs4,000 crore to expand capacityat Chennai facility. We maintain our Buy recommendation on the stock with a price target of Rs201.
Ashok Leyland Ashok Leyland, the second largest CV manufacturer in India, is a pure CV play. The MHCV volumes which havebeen under pressure over the past two years have witnessed a sustained recovery and been growing in doubledigits over the past few quarters. We expect MHCV volumes to remain buoyant over FY16-17 driven by a pick-up in the economic cycle, improved operator profitability and phase-wise implementation of Bharat Stage IVnorms across the country leading to pre-buying. The company has managed to take price hikes which along withthe higher operating leverage has propped up the margins. We have a Buy recommendation on the stock with aprice target of Rs105.
Bajaj Auto Bajaj Auto’s domestic motorcycle volumes have been under pressure over the last couple of years largely due toissues in the executive segment and a drop in its market share to an all-time low of 15.2% in Q4FY2015 from24.5% in FY2013. However, the launch of CT100 and refreshed Platina has given a much needed volume pushwhile the newly launched Pulsar variants would help consolidate its leadership in the premium motorcycle segment.After a blip in Q4FY15, exports are getting back on track and are expected to see a strong growth going ahead.The launch of its quadricycle, RE60, has been delayed by legal issues and the matter is expected to be sorted soon.The company maintains industry leading EBITDA margins and the rupee’s depreciation is expected to boost itsprofitability as exports contribute 45% of the total revenues.
Gabriel India Gabriel is one of India’s leading manufacturers of shock absorbers and front forks with a diversified customerbase. A pick-up in the volumes post-election in the PV and CV segments as well as higher growth in the two-wheeler segment, increase in market share with HMSI and continued growth in the aftermarket sales are expectedto drive the revenue growth going forward. Moreover, with increasing utilisation levels and higher proportion ofrevenues from the profitable CV segment, the OPM is expected to expand from 6.6% in FY13 to 7.9% in FY16.Further, a reduction in debt level would lead to higher return ratios, going forward. Therefore, we recommend aBuy with a price target of Rs105.
Hero MotoCorp HMCL is the largest two-wheeler manufacturer in the world with sales of over 6.6mn vehicles in FY15 and adomestic market share of 42%. We expect the two-wheeler industry to grow at 10-12% CAGR over the next fiveyears driven by increased penetration levels in rural areas and replacement demand. HMCL is expected to maintainits leadership position in the industry. It has presence in the fast growing scooter segment with two models. It willlaunch a couple of new scooters and double the scooter capacity which would boost its volumes. HMCL hasaggressive plans to increase export contribution to 10% (currently 2%) by 2017. Also, with the “Leap program”,which is being implemented currently, the management targets an OPM expansion of 200BPS in the next coupleof years through cost rationalisation. We recommend a Buy with a price target of Rs3,250.
M&M M&M is a leading maker of tractors and UVs in India. We expect demand for the automobile segment to pick upwith an improvement in customer sentiment. Additionally, new launches especially in the compact UV space willdrive volume growth. After growing in strong double digits, the tractor demand was under pressure in FY15-16due to weak monsoon rainfall. However, with the expectation of normal rainfall we expect the tractor segment torecover and report a strong growth in FY17. We remain positive on the stock, given its leadership position in thedomestic tractor and UV segments as well as the value derived from its subsidiaries across business segments.
Maruti Suzuki Maruti Suzuki is India’s largest passenger vehicle maker with a strong 45% market share. It has been able to gainmarket share over the last two years on the back of a diverse product portfolio, a large distribution network withan increased focus on rural markets and a shift in consumer preference to petrol models from diesel. It is poised toreap the benefits from the increased discretionary spending from the Seventh Pay Commission pay-out. Therecently launched premium hatchback, Baleno, has received a positive response which will help the companyexpand market share in the segment. Further, the company has a pipeline of new launches over the next few years,with the most important being the entry into the compact utility vehicle and light commercial vehicle segments.The management plans to double its existing sales and distribution network in order to achieve its target ofdoubling domestic volumes over the next five years. The profitability remains high due to soft commodity prices,depreciation of the yen and high operating leverage. We remain positive on the stock with a price target ofRs4,950.
Rico Auto Inds. Rico is one of the largest producers of high-pressure non-ferrous die castings for the auto sector. It has recentlydivested its 50% stake in a joint venture with FCC Co., Japan for Rs495 crore. The significant cash flow (nearlyequivalent to current market cap) is expected to be a game changer for the company and enable it to deleverage itsbalance sheet and fund future capex. Additionally, a lower interest burden will result in an exponential growth inthe earnings and free cash flow. The company will be commissioning three new plants in the next 12 months andis poised to benefit from an auto demand revival. We have a Buy recommendation on the stock with a price targetof Rs58.
EQUITY FUNDAMENTALSEARNINGS GUIDE
Sharekhan ValueGuide December 201536
Remarks
EQUITY FUNDAMENTALS EARNINGS GUIDE
TVS Motor TVS Motor is the fourth largest two-wheeler manufacturer in the country with a strong presence in the scootersegment. The scooter segment has grown at a CAGR of 25% over the past five years as opposed to 12% CAGR inmotorcycles and currently contributes 30% of the total two-wheeler volumes. With the launch of the Jupiter inOctober 2013, the company has balanced its scooter portfolio and witnessed incremental volumes. Additionally,new launches such as Star City+, refreshed Wego and new Scooty Zest have helped maintain the growth momentum.The company will launch two new motorcycles in H2FY15. Exports, especially of three-wheelers, are doingextremely well. We expect a margin expansion of 40-50BPS over FY14-16.
Banks & FinanceAllahabad Bank With a wide network of over 3,100 branches spread across India, Allahabad Bank enjoys a stronghold in north and east
India. But it has reported a rise in slippages resulting in deterioration of its asset quality. Relatively higher proportion ofstressed assets and low tier-I CAR remain concerns, though the low valuation partly factors the same.
Andhra Bank Andhra Bank, with a wide network of over 2,200 branches across the country, has a strong presence in southIndia especially in Andhra Pradesh. Though it is trading at an attractive valuation, but the concerns on assetquality front and the political situation within the state could affect its operations. Valuation factors the same.
Axis Bank Axis Bank is the third largest private sectors bank, continues to grow faster than the industry and is diversifying itsbook in favour of the retail segment. The bank’s liability profile has improved significantly which would help tosustain the margins at healthy levels. We expect the earnings growth to remain reasonably strong driven by ahealthy operating performance while asset quality pressures will be manageable.
Bajaj Finance Bajaj Finance, owned by Bajaj Finserv, is one of the most diversified and leading NBFCs in the country. It hasassets spread across products, viz loans for consumer durables, two- and three-wheelers, loans to small and mediumenterprises (SMEs), mortgage loans and commercial loans. Despite a strong growth in loans, the asset quality andprovisioning remain among the best in the system. Given the strong growth rate, high margins and return ratios,it deserves to trade at a premium to the other NBFCs
Bajaj Finserv Bajaj Finserv is a financial conglomerate having presence in financing business (vehicle finance, consumer financeand distribution) and is among the top players in the life insurance and general insurance segments. Its consumerfinance (Bajaj Finance) and general insurance businesses continue to report a robust performance while the lifeinsurance business is showing signs of a pick-up after being affected by a change in regulations.
Bank of Baroda Bank of Baroda is among the top public sector banks (PSBs) having a sizeable overseas presence (over 100 officesin 24 countries) and a strong network of over 5,200 branches across the country. It has a stronghold in westernand eastern India. Its performance metrics remain superior to that of the other PSBs, though the asset qualitytrends will be the key monitorable in the near term.
Bank of India Bank of India has a network of over 4,900 branches, spread across the country and abroad, along with a diversifiedproduct and services portfolio, and steadily growing assets. The operating performance has weakened due tomargin deterioration and sharp rise in NPAs. Given the rise in the number of incremental stressed loans and therelatively weaker capital position, its valuations may remain subdued.
Capital First Capital First (erstwhile Future Capital Holdings) has been acquired by global private equity firm, Warburg Pincus(a 72% stake). The present management has taken several initiatives to tap the high-growth retail product segments,like gold loans, loan against property and loan against shares. It has a strong CAR and sound asset quality. Itsloan book is expected to sustain a 25-30% growth in the next three years. As a result of several initiatives taken,the operating leverage will play out and may lead to significant pick-up in profitability over medium term.
Corp Bank Corporation Bank is a mid-sized PSB having a relatively higher presence in south India. It is predominantlyexposed to the corporate segment, which constitutes about 45% of its book. Due to a higher dependence on thewholesale business and a low CASA ratio, it lags its peers in terms of operational performance. Also, the rise inNPAs could keep provisioning high and weaken earnings performance.
Federal Bank Federal Bank is among the better performing old private sector banks in India with a strong presence in southIndia, especially Kerala. Under the new management, the bank has taken several initiatives, which would improvethe quality of its earnings and asset book. The asset quality has consistently improved in the past several quartersand the operating performance is picking up gradually. The valuations remain attractive over the medium to long term.
HDFC HDFC is among the top mortgage lenders providing housing loans to individuals, corporates and developers. Ithas interests in banking, asset management and insurance through its key subsidiaries. As these subsidiaries aregrowing faster than HDFC, the value contributed by them would be significantly higher going forward. Due to adominant market share and consistent return ratios, it should continue to command a premium over the otherNBFCs. Any unlocking of value from its insurance business will be positive for the stock.
HDFC Bank HDFC Bank is among the top performing banks in the country having deep roots in the retail segments. Despitethe general slowdown in the credit growth, the bank continues to report a strong growth in advances from retailproducts. Its relatively high margins (compared with its peers), strong branch network and better asset qualitymake HDFC Bank a safe bet and there is scope for expansion in the valuations.
ICICI Bank ICICI Bank is India’s largest private sector bank with a network of over 4,000 branches in India and a presence inaround 18 countries. The bank has once again entered an expansionary mode after making a conscious effort to

Sharekhan ValueGuide December 201537
Remarks
EQUITY FUNDAMENTALSEARNINGS GUIDE
contract its advances book due to asset quality concerns. The operating profit improved significantly and is thekey driver of the earnings growth. The bank offers substantial value unlocking opportunities from the insuranceand securities businesses.
IDBI Bank IDBI Bank is one of leading PSBs of India, though it is largely present in the corporate lending space. It is graduallyworking towards improving its liability base and expanding the retail book which is likely to reflect in the form ofbetter margins and return ratios. However, due to rising asset quality risks, low tier-I CAR and slower businessgrowth, the stock is likely to underperform in the near term.
LIC Housing LICHFL is the third largest mortgage financier (including banks) in India with a market share of 11% and loanbook of over Rs1,00,000 crore. It is promoted by Life Insurance Corporation of India, which is among the mosttrusted brand in the country. With over 200 branches, 1,241 direct sales agents, 6,535 home loan agents and 782customer relationship associates, the company has among the strongest distribution structures in India to supportbusiness expansion. Going ahead, a revival in the economy and moderation in the borrowing rates could be thekey triggers for the stock. Therefore, considering stable RoE of ~20%, sound asset quality and healthy growthoutlook, the company’s fundamentals are strong.
PNB Punjab National Bank has one of the best liability mixes in the banking space, with low-cost deposits constitutingaround 40% of its total deposits. This helps it to maintain one of the highest margins among PSBs. However, inview of the weakness in the economy and relatively higher exposure to troubled sectors, the asset quality stress hasincreased and NPA issues will persist over next 2-3 quarters.
PFS PTC India Financial Services, owned by PTC India, is focused on providing financial solutions to projects in theenergy value chain. Given the robust lending opportunities in the renewable energy segment and the likely reformsin the thermal power segment, the loan growth is expected to remain strong over the next two to three years. Theproceeds from exits in investments would add to the profitability. The asset quality despite some deteriorationremains among the best in the system.
SBI State Bank of India is the largest bank of India with loan assets of over Rs12 lakh crore. The loan growth for FY15was in line with the industry average while the core operating performance was relatively strong. The successfulmerger of the associate banks and value unlocking from insurance business could provide further upside for thebank. While the bank is favourably placed in terms of liability base and the operating profit is also improving, theasset quality would remain a key monitorable in the near term.
Union Bank Union Bank of India has a strong branch network and an all-India presence. The bank aspires to become thelargest retail bank. Hence, it has ramped up its manpower and infrastructure to ramp up retail, SME lending.While the high stressed loans and weak capital ratios remain concerns with the bank, the current valuations are atsteep discount to book value which partly factors the concerns.
Yes Bank Yes Bank, a new generation private bank, started its operations in November 2004 and has emerged as amongthe top performing banks. It follows a unique business model based on knowledge banking, which offers productdepth and a sustainable competitive edge over established banking players. The bank is suitably poised to ridethe recovery in the economy and the retail deposit franchise is showing a sharp improvement which will supportthe margins.
Consumer goodsBritannia Britannia is the second largest player in the Indian biscuit market with about 30% market share. Under a new
leadership, Britannia has been able to leverage and monetise its strong brand and position in the biscuit and snacksegments. The company can sustain its higher than industry growth rates with an improving distribution reach, entryinto newer categories and focus on cost efficiency. We recommend a Buy on the stock with a price target of Rs3,650.
GSK Consumers GSK Consumer Healthcare is a leading player in the MFD segment with a close to 70% share in the domestic market.Judicious new launches and brand extensions, and the expansion of its distribution reach have helped it to stay aheadof the competition and maintain its pricing power over the years. In a bid to de-risk its business model, it has expandedits product portfolio by entering into new categories such as biscuits and oats in the recent years. With cash balanceof more than Rs2,000 crore the company can invest in growth initiatives as well as reward its investors with a healthydividend payment. We recommend Buy on the stock.
GCPL Godrej Consumer Products is a major player in personal wash, hair colour and household insecticide marketsegments in India. The recent acquisitions of Darling Group, Tura, Megasari and Latin American companies havehelped the company to expand its geographic footprint. We believe the decent sales volume growth in the domesticbusiness coupled with a strong growth in the Indonesian, African and Argentine businesses would help it toachieve an 18% top line growth and a 26% bottom line growth (CAGR) over FY15-17.
HUL Hindustan Unilever is India’s largest FMCG Company. With declining inflation and improving sentiment, HUL’svolume growth in the domestic business is expected to improve in the coming years. Also it would be one of thekey beneficiaries of reducing input prices. Though business fundamentals have improved, the valuation remains atpremium levels. Hence we recommend Hold on the stock. In the long term, it will be one of the key beneficiariesof the Indian consumerism story.
ITC ITC has a strategy of effectively utilising the excess cash generated from its cash cow, the cigarette business, tostrengthen and enhance its other non-cigarette businesses. This would nurture the growth of these businesses someof which are at a nascent stage. The fourth consecutive year of a 15%+ hike in excise duty will continue to putpressure on the cigarette sales volume. However price hikes will maintain the profitability of the cigarette business.The current valuation makes ITC one of the cheapest stocks in the large-cap FMCG space.

Sharekhan ValueGuide December 201538
Remarks
EQUITY FUNDAMENTALS EARNINGS GUIDE
Jyothy Labs Jyothy Laboratories is the market leader in the fabric whitener segment in India. With the successful integration ofHenkel and the induction of a new management team led by S Raghunanadan, it is transforming itself from a one-brand wonder to an aggressive FMCG player. We expect its top line to grow at a CAGR of 15%. A stable OPMand lower interest cost would aid the PAT to grow at 26% CAGR over FY15-17.
Marico Marico is among India’s leading FMCG companies. Its core brands, Parachute and Saffola, have a strong footingin the market. It follows a three-pronged strategy which hinges on expansion of its existing brands, launch of newproduct categories (especially in the beauty and wellness space) and growth through acquisitions. While the domesticproduct portfolio is likely to achieve a steady growth in volumes, the international business is yet to gain momentum.Marico has been our preferred pick in the FMCG sector and we remain positive on its long-term growth story.
Zydus Wellness Zydus Wellness is bearing the brunt of a limited product portfolio of three brands (Nutralite, Sugar Free andEveryuth) that cater to a niche category. The company would benefit from a lower input cost, improving urbanconsumer sentiment and a new distribution system in FY17. Thus, we expect a better operating performance fromit in FY17.
IT/IT servicesFirstsource Firstsource Solutions is a specialized BPO service provider. The management has indicated that the worst is over
for earnings downgrades and expects to see an improvement in the earnings starting from Q2FY2016. The healthof its balance sheet is improving gradually as the company is gradually reducing its debt burden through internalaccruals. The management maintains a 6-8% revenue growth guidance for FY16. The growth in actual contractvalue (ACV) deals remained muted and grew from $495 million to $501 million sequentially, with net deal winsof $5-7 million. On the margins front, the management reduced its EBITDA margins guidance level for FY2016 to70-90BPS from 100-150BPS earlier in FY2015, leading to margin pain in H1FY2016.
HCL Tech HCL Technologies is a global technology company. Its management indicates that the demand environment lookspromising with an increase in market share coupled with a significant increase in the deal funnel. However, recentclient specific issue and skewed IMS revenues will affect the earnings performance in the near term. Nevertheless,the management has made investments in digital technologies and Internet of things (IOT), and already won a fewdeals in the space. (25% of total deals wins in FY2015 comes from digital space). However, the margins areexpected to remain under pressure in the medium term owing to these investments. We remain positive on thecompany in view of its order wins and superior earnings visibility, notwithstanding some near-term softness in theIMS vertical owing to some projects delays.
Infosys Infosys is India's premier IT and IT-enabled Services Company that provides business consulting, technology,engineering and outsourcing services. For FY16, the management has maintained revenue guidance of 10-12% Y-o-Y growth on a CC basis and increased guidance on a reported basis to 7.2-9.2% from 6-8% earlier, led by lesser impactof cross-currency headwinds. It has also given a promising aspiration target for 2020 of achieving $20bn in revenuesand 30% in margin. Margins will recover in the next two to three years. For FY16, the management maintained itsmargin of 24-25%. Under the leadership of Vishal Sikka, the company is doing the right thing by investing in the digitalspace (both organic and inorganic), improving client engagement through design thinking, and automating andinnovating for future growth prospects. We remain positive on the company’s growth prospects for the coming years.
Persistent Persistent Systems has proven expertise and a strong presence in newer technologies, strength to improve its IPbase and the best-in-the-class margin profile which set it apart from the other mid-cap IT companies. Looking atthe strong growth in enterprise revenue, which has delivered a 9% CQGR in the last six quarters, PSL’s enterprisedigital transformation strategy is shaping up well. Further, led by the recent acquisitions of Aepona Holdings anda pick-up in the IP-led revenue in Q4FY2016, we expect the revenue momentum to accelerate in FY17. Thecompany is also likely to see a gradual improvement in the margins with the tapering off of the SG&A investmentsand Aepona Holdings’ integration.
TCS Tata Consultancy Services is among the pioneers of the IT services outsourcing business in India and is the largestIT service firm in the country. Its management aspires to beat the Nasscom growth guidance of 12-14%. Thoughthe management expects the weakness in the telecom, energy and Diligenta businesses to continue, it expectsclients’ IT budget to increase modestly in FY16. We remain positive on the company, given its strong positioning,scale advantage and head start in digital technology.
Wipro Wipro is among the top 5 IT companies in India but in the last few years it has been lagging the industry in terms ofgrowth. We believe, owing to weakness in the energy and telecom spaces, it’s unlikely to show material improvementin earnings on an organic basis in FY16. However, we remain sceptical, as anecdotal evidence on Wipro in the lasttwo to three years does not inspire confidence.
Capital goods/PowerBHEL Bharat Heavy Electricals, India’s biggest power equipment manufacturer, has been the prime beneficiary of the multi-
fold increase in the investments made in the domestic power sector over the last few years. However, the order inflowhas been showing signs of slowing down which would remain a major concern for the company. The key challengebefore the company now would be to maintain a robust order inflow and margin amid rising competition and lowerorder inflow. The current order book of around Rs1 lakh crore stands at around 3.4x FY15 sales.

Sharekhan ValueGuide December 201539
RemarksRemarks
EQUITY FUNDAMENTALSEARNINGS GUIDE
CESC CESC is the power distributor in Kolkata and Howrah (backed by 1,225MW of power generation capacity) whichis a strong cash generating business. Further, 600MW of regulated generation capacity (to serve Kolkata distribution)has come on stream recently in Haldia. However, another 600MW is ready in Chandrapur which is looking forcoal and power purchase linkage. The losses in the retail business are coming down gradually over the past and itis expected to break even soon. The BPO subsidiary, FirstSource, is performing well in line with expectations. Weretain our Buy recommendation on CESC.
Crompton Greaves Crompton Greaves’ key businesses—industrial and power systems--are passing through a rough patch and arepotential beneficiaries of the upcoming investment cycle revival. Its consumer product segment is expected tosustain a high growth and unlock value from a demerger exercise. The troubled international power systembusiness, which was a major overhang for the stock, is considered for sale. This along with the demerger of theconsumer business could unlock value for shareholders.
Finolex Cables Finolex Cables, a leading manufacturer of power and communications cables, is set to benefit from an improvingdemand environment in its core business of cables. It is leveraging its brand strength to build a high-marginconsumer product business of fans. However, a derivative exposure and the subsequent overhang are matters ofpast now, leading to a strong case for a re-rating. We see a healthy earnings growth, return ratios in high teens andsuperior cash flow which bode well for the stock. Hence, we remain positive on the stock.
Greaves Cotton Greaves Cotton is a mid-sized and well-diversified engineering company. Its core competencies are in diesel/petrolengines, power gensets, agro engines, pump sets (engine segment) and construction equipment (infrastructureequipment segment). The foray in the mini tractor segment and international markets would open new growthavenues. The management has taken a strategic call to close and hive off the loss-making divisions. The stepstaken include (1) the closure of the legacy casting unit in Pune; (2) the hive-off of the engineering unit in Germany;and (3) the closure of operations at the infrastructure division. With the closure of the infrastructure business andan expected improvement in the engine business, we expect the company to return to its 15%-plus OPM level.
Kalpataru Kalpataru Power Transmission is a leading EPC player in the transmission & distribution space in India.Opportunities in this space are likely to grow significantly, thereby providing healthy growth visibility (also currentconsol order book is 1.4x its FY14 sales). The OPM of the stand-alone business is likely to remain around 10%;however the OPM of JMC Projects (a subsidiary) is showing signs of improvement. Listing of Subham Logistics isalso expected to unlock value. We retain our Buy rating.
PTC India PTC India is a leading power trading company in India with a market share of 35-40% in the short-term tradingmarket. In the last few years, the company has made substantial investments in areas like power generationprojects and power project financing which will start contributing to its earnings. Long pending receivables wasone of the drags on the company’s balance sheet and return ratios; however, the concern has receded after receivingpayment from UPSEB. We retain Buy due to expectations of a healthy volume uptick with an increasing share oflong-term contract business.
Skipper Skipper is uniquely placed to exploit the growing opportunities in two lucrative segments: power (transmissiontower manufacturing and EPC projects) and water (PVC pipes). It has a comfortable order book of more thanRs2,000 crore in the transmission business, which looks promising given the huge investments proposal by thegovernment in the power T&D segment in the next five years. It plans to expand the PVC capacity manifold (4x)and aspires to turn a national player from a regional player. After the revamp of its low-margin steel tube businessand due to operating leverage the overall margin may improve substantially in the next two years and boost itsearnings and return ratios. The earnings are poised to surge; hence we are positive on the stock.
Thermax The energy and environment businesses of Thermax are direct beneficiaries of the continuous rise in India Inc’scapex. Thermax’ group order book stands at around 2.4x its FY15 consolidated revenues. However, the companyhas shown its ability to maintain a double-digit margin in a tough environment. We retain Hold on the stock dueto its rich valuation.
Triveni Turbines Triveni Turbines Ltd (TTL) is a market leader in the up to 30MW steam turbine segment. TTL is at an inflexionpoint with a strong ramp-up in the after-market segment and overseas business while the domestic market isshowing distinct signs of a pick-up. The company has also formed a JV with GE for steam turbines of 30-100MWrange which is likely to grow multifold in the next 4-5 years. TTL is virtually a debt-free company with a limitedcapex requirement and an efficient working capital cycle, reflected in very healthy return ratios. Further, boostedby the expected uptick in the domestic capex cycle, the company’s earnings are likely to grow by 25%+ per annumover the next 3-4 years.
V Guard Ind V-Guard Industries is an established brand in the electrical and household goods space, particularly in southIndia. Over the years, it has successfully ramped up its operation and network to become a multi-product company.It has recently also forayed into regions other than the south and is particularly focusing on the tier-II and III citieswhere there is a lot of pent-up demand for its products. We expect a CAGR of over 13% in its earnings over FY15-17 and RoE of around 22% during this period.
Va Tech Wabag VA Tech Wabag (VTW) is one of the world’s leading companies in the water treatment field with eight decades ofplant building experience. Given the rising scarcity of fresh water availability, we expect flow of huge investmentsin water segment both globally and domestically. With rising urbanisation and industrialisation in India, weexpect substantial investments in this space. Moreover, we expect the water segment to get substantial focus andbudgetary allocation, with the pro-reform BJP-led government at the centre. Given the large opportunity aheadand inherent strengths of VTW, like professional management, niche technical expertise and global presence, weexpect the earnings to grow by 28% (CAGR) during FY15-17 and generate RoE of around 15%.
Sharekhan ValueGuide December 201540
RemarksRemarks
EQUITY FUNDAMENTALS EARNINGS GUIDE
Infrastructure/Real estateGayatri Proj Gayatri Projects is a Hyderabad-based infrastructure company with a very strong presence in irrigation, road and
industrial construction businesses. The order book stands at Rs5,968 crore, which is 3.7x its FY15 revenues. It isalso expanding its power and road BOT portfolio and plans to unlock value by offloading stake to private equity.The company has potential to transform itself into a bigger entity.
IL&FS Trans IL&FS Transportation Networks is India’s largest player in the BOT road segment with a pan-India presence anda diverse project portfolio. The fair mix of annuity and toll projects, and state and NHAI projects along with thegeographical diversification across 12 states reduce the risk to a large extent and provide comfort. Further, astrong pedigree along with the outsourcing of civil construction activity helps it to scale up its portfolio faster.Thus, it is well equipped to capitalise on the huge and growing opportunity in the road infrastructure sector.
IRB Infra IRB Infrastructure Developers is the largest toll road BOT player in India and the second largest BOT operator inthe country with all its projects being toll based. It has an integrated business model with an in-house constructionarm which provides a competitive advantage in bidding for the larger projects and captures the entire value fromthe BOT asset. Further, it has a profitable portfolio as majority of its operational projects have become debt-freeand it has presence in high-growth corridors which provides healthy cash flow. Thus, it is well poised to benefitfrom the huge opportunity in the road development projects on the back of its proven execution capability and thescale of its operations.
Jaiprakash Asso Jaiprakash Associates, India’s leading cement and construction company, is all set to reap the benefits of India’sinfrastructure spending. The company has also monetised very well the real estate properties of Yamuna Expressway.The marked improvement in the macro environment has improved accessibility to capital and thus eased theconcerns of liquidity to some extent. However, higher leverage could act as drag on the valuation.
L&T Larsen & Toubro, being the largest engineering and construction company in India, is a direct beneficiary of thedomestic infrastructure capex cycle. The strong potential of its international business, its sound execution track recordand bulging order book, and the strong performance of subsidiaries further reinforce our faith in it. Recent measuresplanned by the company to improve its return ratios augur well. Hence, we remain positive on the stock.
Punj Lloyd Punj Lloyd is the second largest EPC player in the country with a global presence. However, since FY09 theprofitability has come under severe pressure due to cost overruns/liquidated damages in some of Simon Carves (asubsidiary) projects. Thus, it has put Simon Carves under administration. Further, Libyan projects will take anotherfew quarters to begin execution. Therefore, the successful execution of its projects along with debt reduction andworking capital management will drive its growth as it enjoys a robust order book.
Oil & gasOil India Oil India has several hydrocarbon discoveries across reserves in Rajasthan and the north-eastern region of India.
The total proven and proven and probable reserves of the company stand at 473 million barrels (mmbbls) and941mmbbls respectively. In addition to the huge oil reserves, the company’s reserve-replacement ratio is quitehealthy at 1.6x, which implies a comfortable level of accretion of oil reserves through new discoveries. Further, itoffers healthy dividend yield, which provides comfort to investors. The full benefit of the recent policy reformslike deregulation of diesel, gas price revision and DBT scheme for LPG consumers are expected to reflect in itsfuture earnings and add value, though weak global oil prices are likely to be an overhang on the stock for sometime.
Reliance Ind Reliance Industries has one of the largest and complex refining businesses in India which enjoys a substantially higherrefining margin over the benchmark GRM. Further, its petrochemical business is also highly efficient while theprospects for its E&P business remains bright, though currently it remains depressed. We expect the GRM to remainhealthy and the petrochem margin to be maintained in the medium term on an uptick in the domestic demand.Currently, the decline in gas output from the KG-D6 basin is weighing on the stock price; however, incrementalcapacity in the petchem business would be the earnings driver in the coming years. Large investment in Reliance Jiocould add value in long term.
Selan Exploration Selan Exploration Technology is an oil E&P company with five oil fields in the oil-rich Cambay Basin of Gujarat.The initiatives taken to monetise the oil reserves in its Bakrol and Lohar oil fields are likely to improve production.Further, it intends to explore its next field, Indrora, which is the most prolific one with significant reserves. Basedon this, we expect it to ramp up production significantly, subject to approval for the new wells. We expectproduction ramp-up in FY16 and hence we expect the earnings to grow significantly in the next two to three years.However, weak global oil prices are likely to be an overhang on the stock in the medium term.
PharmaceuticalsAurobindo Pharma Aurobindo Pharma is set to post a healthy growth on the back of a ramp-up in the US and European markets,
thanks to a strong product pipeline built over a period and focus on niche segments like injectibles, hormones,penems and sterile products. The expected increase in the export-led business and a favourable tilt in the revenuemix are likely to boost the margin, resulting in a faster growth in the earnings as compared with the revenues. Ithas recently acquired the commercial operations (revenue size EUR320mn) of Actavis Plc in seven western Europeancountries and of Natrol in the USA to take on the nutraceutical business, which is a strategic fit.
Sharekhan ValueGuide December 201541
RemarksRemarks
EQUITY FUNDAMENTALSEARNINGS GUIDE
Cadila Cadila Healthcare’s performance in the US generic vertical is likely to improve on the back of new productapprovals. Besides, its consumer business and exports to the emerging markets will help it to achieve a superiorgrowth. It got DCGI approval for its first NCE called Lipaglyn to treat type-II diabetes; this will add value to itsR&D pipeline.
Cipla Cipla has brought about a paradigm shift in its business strategy. To revive growth, it has (1) enhanced focus ontechnology-intensive products in the inhalation and nasal spray segments; (2) established front-end presence in thekey markets like South Africa, USA and Europe; (3) developed an appetite for inorganic expansions; and (4)invested in future growth areas like biosimilars. Though the rationalisation of products and creation of front-endpresence in the key markets would hurt earnings in the short term, but the base business would continue to growsteadily. The growth would be fast-tracked on the back of the launch of combination inhalers in Europe, ramp-upin generics in the USA and synergy from consolidation.
Divi’s Labs The DSN SEZ facility at Vishakhapatnam that started in June 2011 augurs well for Divi’s Laboratories. Thecompany is likely to see an improvement in economies of scale which will also lead to tax benefits after USFDAapprovals for three additional production blocks. A near debt-free balance sheet and strong cash flow are likely tohelp build a war chest for pursuing strategic investments (biosimilars) and exploit the growth opportunities inniche segments, like oncology and steroids for contraceptives. The company has planned to set up a new facility atVishakhapatnam with an initial investment of Rs500 crore; it will start contributing revenues from H2FY17.
Glenmark Pharma Glenmark Pharmaceuticals exhibited a weaker operating performance during H1FY16 due to adverse economicscenario in the key emerging markets including Russia and a fewer number of product approvals in the USA.However, the management has given a revenue growth guidance of 18-20% for FY16 (vs 11% in FY15) and anEBITDA guidance of Rs1,750 crore for the same period (vs Rs1,359 crore in FY15; a Y-o-Y growth of 30%). Thegrowth would be mainly driven by the US and Latin American markets, which are witnessing exponential growth.The company’s focus on innovation augers well as evident from the fact that it received over $200 million as initialmilestone payment on out-licensing of partly developed molecules in a span of nine years. Currently, it has threenew chemical entities and four new biological entities in clinical trials, out-licensing potential.
Ipca Lab Ipca Laboratories has successfully capitalised on its inherent strength of producing low-cost drugs to tap theexport markets. But, it has recently got an import alert from USFDA for its Ratlam API facility and the formulationfacility at Indore SEZ. While the overhang related to the USFDA ban is unlikely to ease in near term, a respite isexpected from the shipment of two products to the US market, namely hydroxychloroquine sulfate and propranololhydrochloride (exempted from the import ban), and a clearance on its Ratlam facility by the WHO. This will helpthe company to resume a significant portion of the institutional business. The management has guided for amoderate growth outlook (revenue growth of 10% and EBIDTA margin of 17-18%) for FY16.
Lupin The expected ramp-up in the launch of oral contraceptives, ophthalmic products, branded franchise (with additionof in-licenced product-Alinia, Inspira Chamber VHC and Locoid lotion) in the USA and a robust pipeline of newlaunches in the domestic and overseas markets provide strong growth visibility for Lupin. Further, with an expandedfield force and therapy focused marketing division, its formulation business in the domestic market has beenperforming better than the industry. The deal with Eli-Lilly to distribute human insulin would open an incrementalrevenue stream for Lupin in the Indian market.
Sun Pharma The combination of Sun Pharma, Taro, Dusa Pharma, the generic business of URL Pharma and the recentlyacquired Ranbaxy offers an excellent business model for Sun Phaarma. However, the integration process withRanbaxy is set to affect the profitability in short term. Also, the USFDA’s adverse observation report (Form-483)on its Halol (Gujarat) facility creates a major overhang. However, the management maintains its aim to achieve a$250-mn synergy from the merger of Ranbaxy by FY18. With a strong cash balance, it is well positioned tocapitalise on the growth opportunities and inorganic initiatives.
Torrent Pharma A well-known name in the domestic formulation market, Torrent Pharmaceuticals has been investing in expandingits international presence. With the investment phase now over, it should start gaining from its internationaloperations in the USA, Russia and Brazil. Better field force productivity, focus on developed market and strongerbalance sheet would result in a sustainable earnings growth. It has recently acquired 30 key brands of ElderPharma for Rs2,000 crore which is a strategic fit in long run. The company has proposed to raise funds up toRs10,000 crore through a mix of equity and debt instruments, part of which may be used for inorganic initiatives.
Building materialsGrasim Grasim is better placed compared with the other large players in the cement space due to its strong balance sheet, comfortable
debt/equity ratio, attractive valuation and diversified business. The demand for VSF products remains strong in the globalmarket and Grasim being a leading domestic player is well placed to capture the incremental demand. However, a slowdownin demand for VSF and cement may affect the near-term earnings. The long-term outlook for the company remains intact.
The Ramco Cements The Ramco Cements, one of the most cost-efficient cement producers in India, will benefit from the capacity additioncarried out ahead of its peers in the southern region. The 3mtpa expansion will provide the much-needed volumegrowth in the future. The regional demand remains lacklustre but on account of the improvement in the realisationdue to supply discipline and a likely change in the market mix its profitability will improve (marginally) in FY16.
Sharekhan ValueGuide December 201542
RemarksRemarks
EQUITY FUNDAMENTALS EARNINGS GUIDE
Shree Cement Shree Cement’s cement grinding capacity has grown to 18.2mtpa which will support its volume growth in thecoming years. It has a power plant with capacity of 300MW entirely for merchant sale which is expected tosupport its revenue growth going ahead. Thus, a volume growth of the cement division and the additional revenueaccruing from the sale of surplus power will drive the earnings of the company.
UltraTech Cement UltraTech Cement is India’s largest cement company with approximately 62mtpa cement capacity. It has benefitedfrom an improvement in its market mix. Further, the ramping-up of the new capacity and savings accruing fromthe new captive power plants will improve its cost efficiency.
Discretionary consumption
Century Plyboard Century Plyboard is a leading player in the organised plywood industry with a market share of 25%. A strong growthin the sector, Century’s premium positioning and brand equity strength, and the impending GST roll-out would enableit to post a revenue growth (CAGR) of 16.5% over FY14-17. On the back of a revenue growth and better absorptionof fixed costs, the earnings are likely to grow at a much stronger rate of 25% CAGR over FY14-17. It is a qualityconsumer play in a niche growing segment. Its robust return ratios and strong growth potential make us positive onthe stock. We have a Buy rating on it with a price target of Rs260.
Cox & Kings: Cox & Kings is an integrated player with a strong presence in the global leisure travel segment and the educationtourism segment in Europe. It has 30% market share in the global outbound tourism market and a market leaderin education tourism in the UK. An improving global macro environment (conducive to travel & tourism industry)and the company’s focus on de-leveraging its balance sheet will help it to achieve a double-digit earnings growthin the medium term. Hence, we recommend a Buy on it with a price target of Rs300.
Info Edge (India) Info Edge is India’s premier online classified company in the recruitment, matrimony, real estate, education andrelated service sectors. Naukri is a quality play on the improving macro environment and is directly related to theGDP growth and Internet/mobile penetration. Thus, it can grow consistently at over 20% for the next few years.We expect Zomato business’ growth to extend in the coming years, with better integration of services and increasingmonetisation opportunities. Zomato’s online ordering services are currently available for around 12,000 restaurantpartners and it expects to take the count to more than 20,000 in FY2016. Going ahead, other investee ventures,like www.meritnation.com, www.policybazaar.com, www.mydala.com and www.canvera.com, are also likely togain from the ongoing e-commerce boom in India.
INOX Leisure INOX Leisure Ltd (ILL), India’s second largest multiplex operator with 101 properties and 393 screens across 55cities accounting for about 23% of the multiplex screens in India, is scripting a blockbuster growth story througha mix of inorganic and organic expansion plan to scale up the total screen count to 565-570 screens over the next24-30 months. The ILL mega show is supported by an improving content quality in the Indian mainstream andregional cinema with its movies regularly hitting the Rs100-crore or Rs200-crore box-office collection mark. Webelieve ILL with its strong brand and extended reach is well poised to leverage the opportunity in India’s under-penetrated multiplex sector.
KKCL Kewal Kiran Clothing is a branded apparel play with four brands in its kitty. Killer, its flagship denim brand, hascreated a niche space in the minds of consumers. With a gross market turnover of over Rs300 crore, Killer is aheadof its rival, Spykar. A strong brand profile, a disciplined management and a consistent track record coupled witha robust balance sheet make us positive on the company.
KKDL KKDL Ltd (erstwhile Kamala Dials and Devices) is present in the watch manufacturing business and has a strongpresence in the luxury watches retail business through subsidiary, Ethos. The watch business generates steady revenuesand cash flow with minimal capex, as no capacity is likely to come on stream and the utilisation levels are expectedto improve. The high-end retail watch business “Ethos” provides a strong growth opportunity in terms of revenuegrowth via its online venture wherein it generates leads that translate into lower customer acquisition cost and betterfixed cost management that would result in robust margin improvement and strong profit growth. This unique high-growth potential business along with the steady manufacturing business that generates free cash is attractively pricedcurrently and offers significant returns over the medium to long term. We put a Buy rating on the stock, valuing itusing the SOTP method (the manufacturing vertical is valued at 6x FY17E earnings + the high-end Ethos is valuedat 1.1x FY17E sales) to arrive at a price target of Rs375.
Orbit exports Orbit Exports (Orbit) is a leading manufacturer and exporter of novelty fabrics exporting its products to over 32countries. It is a recognised star export house and operates in the niche area of high-end fancy fabrics, which are mainlyused by designers in women’s fashion apparels. A strong OPM profile has enabled it to earn higher returns averagingat 21% in RoCE and at 33% in RoE over the last three years. Given the strong financials, niche capabilities and avigilant management, Orbit is well poised for a strong earnings growth. Hence, we expect its top line and bottom lineto grow at a CAGR of 19.6% and 22.8% respectively over FY15-18. Given the robust earnings potential and enviablereturn ratios, Orbit is expected to trade at higher multiples. Thus, we expect the stock to get re-rated (in line with itspeers like Kitex Garments). We initiate coverage on Orbit with a Buy rating and value the company at 22x its FY2017Eearnings to arrive at a price target of Rs630.
Sharekhan ValueGuide December 201543
RemarksRemarks
EQUITY FUNDAMENTALSEARNINGS GUIDE
RemarksRemarks
Raymond Raymond is present in the fast-growing discretionary & lifestyle category of branded textiles and apparels. Withgrowing incomes, rise in aspirations to lead a luxurious life, greater discretionary spending and favourabledemographics, the segment of branded apparels & fabrics presents a good growth opportunity and Raymond withits brands and superior distribution set-up is very well geared to encash the same. Any development with regard tothe Thane land in the form of either joint development or disposal would lead to value unlocking and providesignificant cash to the company.
Relaxo Footwear Relaxo Footwear is present in the fast-growing footwear category, wherein it caters to customers with its four top-of-the-mind-recall brands, viz, Hawaii, Sparx, Flite and Schoolmate. It has emerged as an attractive investmentopportunity due to its growing scale, strong brand positioning and healthy financial performance.
Speciality Rest. Speciality Restaurants is a leading player in the fine-dining space with a portfolio of well-established brands suchas Mainland China and Sigree. It is a good proxy on the Indian consumption story as several factors such asdemographics, increasing disposable income and the trend of nuclear families are playing in its favour. Given theslow pace of growth of consumer discretionary spending and pressure on the operating profit margin due to theaddition of new stores, we maintain our Hold rating on the stock.
Thomas Cook (I) Thomas Cook India Ltd (TCIL), owned by the legendary value investor Prem Watsa, is an integrated leisure traveland human service management company in India. The improvement in the domestic and global macro environmentsprovides a huge growth opportunity in the Indian leisure and travel industry. Quess Corp (its human resourcemanagement business) provides exposure to the fast growing HR, office management and technology solutionsbusiness. Moreover, we see a turn-around in the financial performance of Sterling. The recent stock price correctioncoupled with the improving financial health of Sterling Resorts, visibility in Quess Corp business and expansion inthe OPM and earnings, provide an opportunity to re-enter the stock. Hence, we maintain Buy with a price targetof Rs265.
Wonderla Holidays Wonderla Holidays Ltd (WHL) is the largest amusement park company in India with over a decade of successfuland profitable operations. It owns and operates two amusement parks under the brand name Wonderla in Kochiand Bengaluru, and is coming up with a third park in Hyderabad (to be operational by Q1FY17). With a steadyimprovement in footfalls, the Hyderabad park getting operational in Q1FY17, a strong growth in the non-ticketrevenues (F&B and product sales) and an 8-10% increase in the annual ticket price, WHL’s revenues are expectedto grow at a CAGR of 30% over FY15-18. Its OPM of 44-45% is better compared with some of the matureinternational parks.
Zee Entertainment Zee Entertainment Enterprises, part of the Essel group, is one of India's leading TV media and entertainmentcompanies. It has a bouquet of more than 34 channels across Hindi, regional, sports and lifestyle genres. For FY16,the management has indicated that the margin profile will be maintained at around 25.7% 25%. The managementalso indicates a better operating environment in terms of both advertisement revenues and subscription revenues. Onthe advertisement side, the management expects to exceed the industry’s low-teen growth in FY16. The subscriptionrevenue will also benefit from the phases III and IV of the digitisation process (will be more visible in FY17 and FY18).
Diversified/Miscellaneous
Aditya Birla Nuvo We like the strong positioning that Aditya Birla Nuvo’s businesses enjoy in their respective fields. It is amongst thetop five players in the insurance, asset management and telecom segments (Idea Cellular is the fastest growing telecomcompany, third in ranking). Madura Garments, with its marquee brands, and consistent and resilient growth, is aprofitable set-up. In an improving macro-economic environment the company would be well placed to grow.
Bajaj Holdings Bajaj Holdings & Investment Ltd (BHIL, erstwhile Bajaj Auto) was demerged in December 2007, whereby itsmanufacturing business was transferred to the new Bajaj Auto Ltd (BAL) and its strategic business consisting of thewind farm and financial services businesses was vested with Bajaj FinServ (BFS). All the businesses and properties,assets, investments and liabilities of erstwhile Bajaj Auto, other than the manufacturing and strategic ones, now remainwith BHIL. BHIL is a primary investment company focused on new business opportunities. It holds more than 30%stake each in BAL and BFS. We have a Buy recommendation on the stock with a price target of Rs1,815.
Bharti Airtel Bharti Airtel is the leader in the Indian mobile telephony space. With the regulatory overhang receding and the industryas well as the company focusing on the quality of revenues rather than volume, better times can be expected aheadfor the sector and hence the company. We remain optimistic about the company.
BEL Bharat Electronics, a PSU manufacturing electronic, communication and defence equipment, stands to benefit fromthe enhanced budgetary outlay for strengthening and modernising the country’s security. The “Make in India”initiative of the government will support the earnings growth in the coming years, as it is the only player with strongresearch and manufacturing units across the country. The company’s current order book of around Rs21,648 croreprovides revenue visibility for the next three to four years.

Sharekhan ValueGuide December 201544
GDL With its dominant presence in the container freight station segment and recent forays into the rail freight and coldchain businesses, Gateway Distriparks has evolved as an integrated logistic player. Its CFS business is a cash cowwhile its investments in the rail and cold storage businesses have started bearing fruits. It is one of the largestplayers in the CFS business and has also evolved as the largest player in the rail freight business as well as the coldstorage business. The proposed capex for all the three segments will strengthen its presence in each of the segmentsand increase its pan-India presence. We expect its revenues and net profit to grow at 20% and 16% CAGRrespectively over FY13-15.
Max India Max India is a unique investment opportunity providing direct exposure to two sunrise industries of insuranceand healthcare services. Max New York Life, its life insurance subsidiary, is among the leading private sectorplayers, has gained the critical mass and enjoys some of the best operating parameters in the industry. As theinsurance sector is showing signs of stablisation, the company’s favourable product mix and a strong distributionchannel will result in a healthy growth in the annual premium equivalent. The company has turned profitable ona consolidated basis and has announced dividend in past couple of years.
Ratnamani Metals Ratnamani Metals & Tubes is the largest stainless steel tube and pipe maker in India. In spite of the challenging businessenvironment due to increasing competition, the stock is attractively valued. The management has maintained a strongoutlook on the potential opportunities in the oil & gas sector and inter-connection of the rivers across the country.
Supreme Ind Supreme Industries is a leading manufacturer of plastic products with a significant presence across piping, packaging,industrial and consumer segments. We remain positive on its new launches of value-added products and capacityexpansion plans. However, the recent volatility in the prices of its raw materials (mainly polymers) amid a highlycompetitive environment is likely to limit the growth in the margin and volume offtake in the near term. Hence,while we remain positive on its long-term structural story, we downgrade our rating to Hold from Buy with arevised price target of Rs677.
UPL A leading global producer of crop protection products, intermediates, specialty chemicals and other industrialchemicals, United Phosphorus has presence across value-added agricultural inputs ranging from seeds to cropprotection products and post-harvest activities. A diversified geography and the recent acquisition of DVA AgroBrazil will help the company to have a strong presence in the Brazilian market and aid in inorganic growth. Itsrevenues are likely to grow at 12-15% and EBIDTA margin is expected to remain at 18-20% in FY16. It has alsostarted to focus on premium products in agro-chemicals and will slowly stop selling commodities and low-marginproducts. It has also started to focus on selling premium products and maintaining a strong balance sheet.
EQUITY FUNDAMENTALS EARNINGS GUIDE