value&narrative&survey&analysis&report all&data sais - c.ymcdn.com · 5 3.53 6...
TRANSCRIPT
VALUE NARRATIVE SURVEY ANALYSIS REPORT
The mission of SAIS is to strengthen member schools by providing highquality accreditation processes, comprehensive professional growthopportunities, and visionary leadership development programs.
forALL DATA
SAISSurvey Administration
Fall 2013, Spring 2014, Fall 2014
SAIS VALUE NARRATIVE SURVEY ANALYSIS © SAIS 2014 2
INTRODUCTION
METHODOLOGY
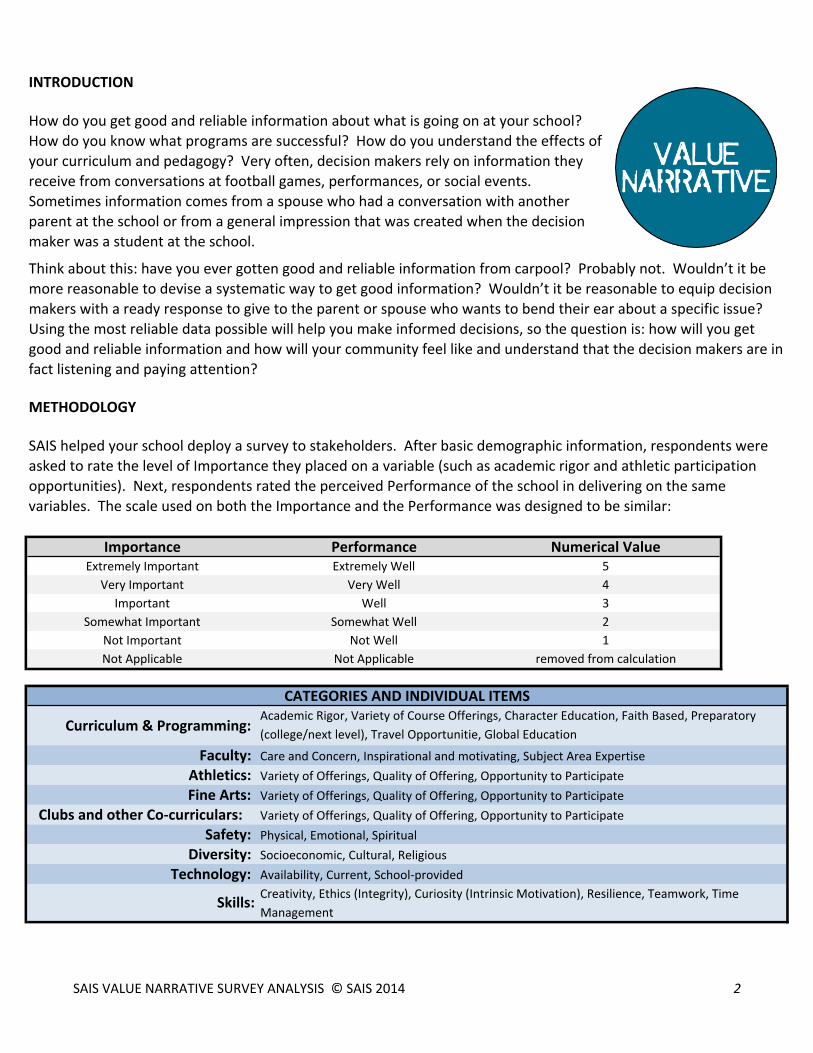
Care and Concern, Inspirational and motivating, Subject Area ExpertiseVariety of Offerings, Quality of Offering, Opportunity to ParticipateVariety of Offerings, Quality of Offering, Opportunity to ParticipateVariety of Offerings, Quality of Offering, Opportunity to ParticipatePhysical, Emotional, SpiritualSocioeconomic, Cultural, ReligiousAvailability, Current, School-‐provided
Very Well
Clubs and other Co-‐curriculars:
Faculty: Athletics: Fine Arts:
Creativity, Ethics (Integrity), Curiosity (Intrinsic Motivation), Resilience, Teamwork, Time Management
Skills:
SAIS helped your school deploy a survey to stakeholders. After basic demographic information, respondents were asked to rate the level of Importance they placed on a variable (such as academic rigor and athletic participation opportunities). Next, respondents rated the perceived Performance of the school in delivering on the same variables. The scale used on both the Importance and the Performance was designed to be similar:
Academic Rigor, Variety of Course Offerings, Character Education, Faith Based, Preparatory (college/next level), Travel Opportunitie, Global EducationCurriculum & Programming:
WellSomewhat Well
Not Well
ImportanceExtremely Important
Very Important
Not Applicable
Technology:
PerformanceExtremely Well
How do you get good and reliable information about what is going on at your school? How do you know what programs are successful? How do you understand the effects of your curriculum and pedagogy? Very often, decision makers rely on information they receive from conversations at football games, performances, or social events. Sometimes information comes from a spouse who had a conversation with another parent at the school or from a general impression that was created when the decision maker was a student at the school.
Think about this: have you ever gotten good and reliable information from carpool? Probably not. Wouldn’t it be more reasonable to devise a systematic way to get good information? Wouldn’t it be reasonable to equip decision makers with a ready response to give to the parent or spouse who wants to bend their ear about a specific issue? Using the most reliable data possible will help you make informed decisions, so the question is: how will you get good and reliable information and how will your community feel like and understand that the decision makers are in fact listening and paying attention?
CATEGORIES AND INDIVIDUAL ITEMS
Safety: Diversity:
Numerical Value54321
removed from calculation
ImportantSomewhat Important
Not ImportantNot Applicable

SAIS VALUE NARRATIVE SURVEY ANALYSIS © SAIS 2014 3
RELIABILITY
READING RESULTS
NEXT STEPS
WHEN TO GIVE AGAIN
SAIS conducted several reliability tests over the course of 14 months leading up to the release of the survey instrument. Responses from a pilot group of schools were subjected to analysis to ensure statistical reliability and all questions were subjected to face validity testing. Analysis shows that the survey instrument has a very high degree of reliability.
Your results are broken down into major categories: all respondents, promoters, passives, and detractors. Within each group and subgroup, this report contains the overall category congruence analysis, individual item analysis, and ranked order of question response (Importance vs Performance).
Analyze the data contained in this report carefully. Congruence scores for category and for individual items will suggest areas of continued strength and areas for further study. Understand that near perfect congruence means that the values respondents hold match the level of performance the school is delivering -‐ however, look closely at the ranked order of importance vs. performance to determine if these items are valued highly or not valued at all. Note that items that have a high importance and a high performance are likely to be areas of greatest strength for the school that can be leveraged to describe your value narrative. Items that have a high importance but a low performance should be studied for possible action plans. Items that have a low importance but a high performance may be areas where resources are being expended unnecessarily.
The purpose of giving the survey again is to reliably determine the impact and effectiveness that strategies and actions the school has taken have on changing perceptions of performance. While importance scores of the respondents will unlikely change, the performance scores (and therefore the congruency values) likely will change as a direct result of actions the school has implemented.
Individual responses were converted to numerical values, means were calculated and a comparison of the mean of Importance and mean of Performance yielded a Congruence Coefficient. The Congruence Coefficient is a number that lets you know how close the expectations of your stakeholders are to their perception of your delivery of the various variables.
4
ParentsStudentsFaculty 0-‐499 deployment
Trustees 500-‐999 deployment
Alumni 1000+ deployment
v
v
v
Parents
PassivePromoter
47.6%
50
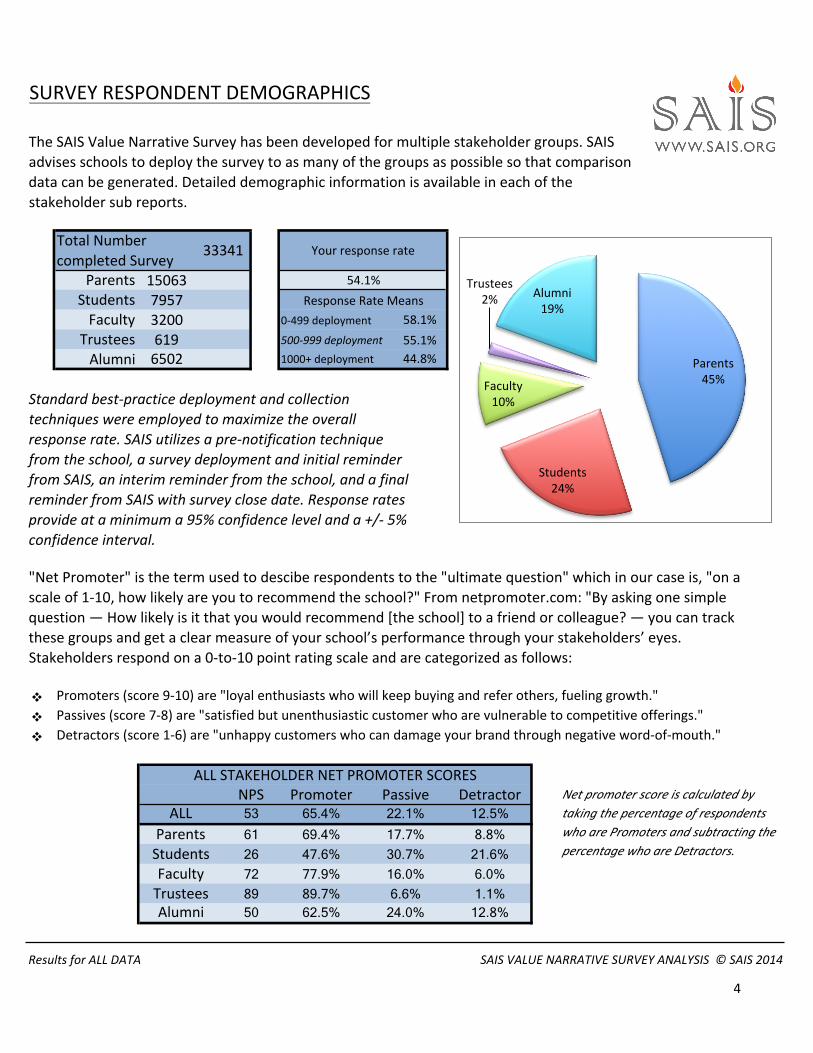
"Net Promoter" is the term used to descibe respondents to the "ultimate question" which in our case is, "on a scale of 1-‐10, how likely are you to recommend the school?" From netpromoter.com: "By asking one simple question — How likely is it that you would recommend [the school] to a friend or colleague? — you can track these groups and get a clear measure of your school’s performance through your stakeholders’ eyes. Stakeholders respond on a 0-‐to-‐10 point rating scale and are categorized as follows:
Promoters (score 9-‐10) are "loyal enthusiasts who will keep buying and refer others, fueling growth."Passives (score 7-‐8) are "satisfied but unenthusiastic customer who are vulnerable to competitive offerings."Detractors (score 1-‐6) are "unhappy customers who can damage your brand through negative word-‐of-‐mouth."
Net promoter score is calculated by taking the percentage of respondents who are Promoters and subtracting the percentage who are Detractors.
8.8%
26
72
DetractorALL STAKEHOLDER NET PROMOTER SCORES
ALL 53 65.4% 22.1% 12.5%
61 69.4% 17.7%
SURVEY RESPONDENT DEMOGRAPHICS
Results for ALL DATA SAIS VALUE NARRATIVE SURVEY ANALYSIS © SAIS 2014
The SAIS Value Narrative Survey has been developed for multiple stakeholder groups. SAIS advises schools to deploy the survey to as many of the groups as possible so that comparison data can be generated. Detailed demographic information is available in each of the stakeholder sub reports.
NPS
77.9%
89.7%62.5%
30.7% 21.6%
16.0% 6.0%
6.6%
Total Number completed Survey
33341
Standard best-‐practice deployment and collection techniques were employed to maximize the overall response rate. SAIS utilizes a pre-‐notification technique from the school, a survey deployment and initial reminder from SAIS, an interim reminder from the school, and a final reminder from SAIS with survey close date. Response rates provide at a minimum a 95% confidence level and a +/-‐ 5% confidence interval.
1.1%24.0% 12.8%
StudentsFacultyTrusteesAlumni
89
55.1%44.8%
Your response rate
54.1%Response Rate Means
58.1%
15063795732006196502 Parents
45%
Students 24%
Faculty 10%
Trustees 2% Alumni
19%

5
3.536 3.615 Athletics 95.83 3.83 3.67
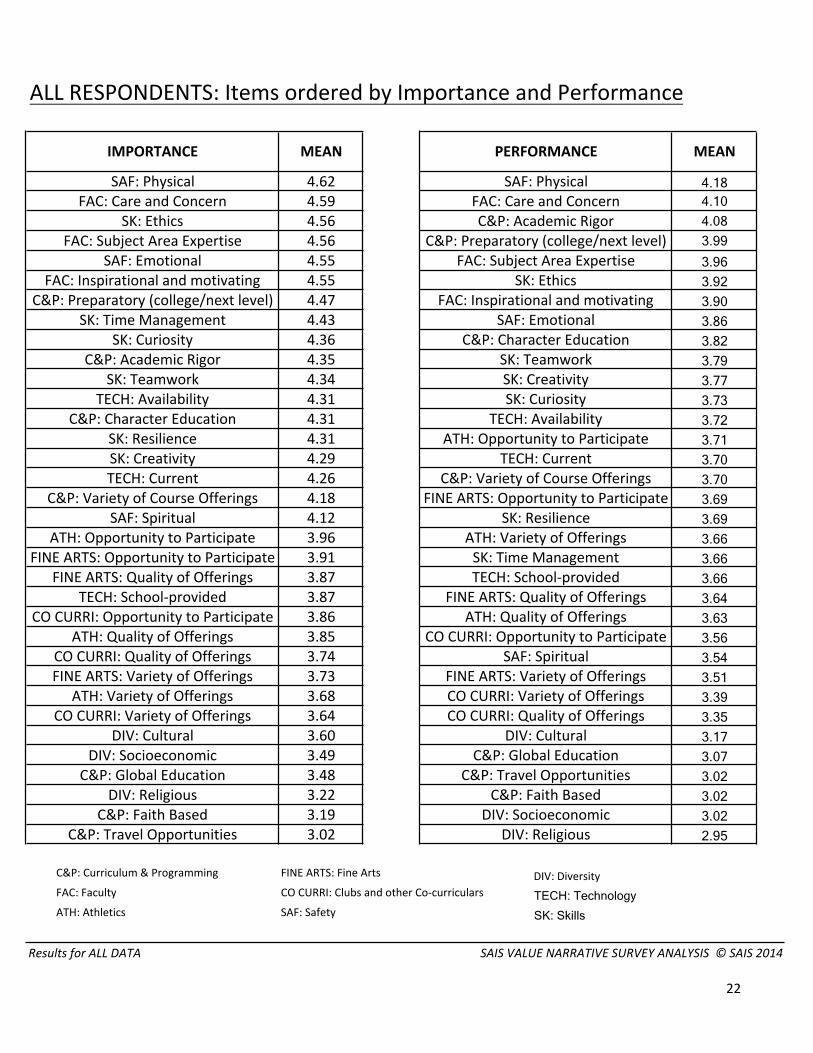
At the heart of the SAIS Value Narrative Survey is the series of questions that establish the beliefs held by stakeholder groups and the perception of the school's performance at delivering on what is held to be important. The two charts to the left present the overview of all survey respondents from your school and are in order according to the "Importance" and the "Performance." These are the overall categories that are represented by the individual items.
Note that calculations are computed to approximately ten decimal places, but results are displayed only to two.
4.38 3.762 Safety 87.08 4.43 3.861 Faculty 87.33 4.57 3.99
RANK CATEGORY
Congruency is a statement of the alignment between stakeholder beliefs (as measured by Importance) and stakeholder perceptions of the quality of deliverables from the school (as measured by Performance).
ORDERED BY CONGRUENCE
ORDERED BY PERFORMANCE
9 Diversity 88.70 3.44 3.058 Clubs and other Co-‐curriculars 91.69 3.75 3.437 Curriculum & Programming 91.38
4 Technology 89.07 4.15 3.693 Skills 85.83
CONGRUENCY IMPORTANCE PERFORMANCE
9 Diversity 88.70 3.44 3.058 Clubs and other Co-‐curriculars 91.69 3.75 3.437 Athletics 95.83 3.83 3.676 Fine Arts 94.13 3.84 3.61
3.86
5 Curriculum & Programming 91.38 3.86 3.534 Technology 89.07 4.15 3.69
3.863.76
RANK CATEGORY CONGRUENCY IMPORTANCE PERFORMANCE
4.434.38Skills
3.433.533.693.053.99
IMPORTANCE PERFORMANCE3.83 3.67
3 Skills 85.83 4.38 3.76
3.613.753.864.1589.07
Fine Arts 94.13 3.84
ORDERED BY IMPORTANCE
3.86
1 Faculty 87.33 4.57 3.992 Safety 87.08 4.43
3.444.57
CATEGORY95.8394.1391.69
Curriculum & ProgrammingTechnologyDiversityFaculty
3.84
Results for ALL DATA SAIS VALUE NARRATIVE SURVEY ANALYSIS © SAIS 2014
ALL STAKEHOLDERS CATEGORY SNAPSHOT:CONGRUENCE, IMPORTANCE, PERFORMANCE
RANK123456789
88.7087.3387.0885.83
CONGRUENCY
Safety
Clubs and other Co-‐curriculars
AthleticsFine Arts
91.38

6
The following pages list the seven top scoring items among each of the stakeholder groups in Congruence, Importance, and Performance. Comparing the responses in each of the groups will give you a sense of how aligned your various stakeholder groups are with each other. For the full list of items in each stakeholder group, refer to the Appendices.
This section also includes the same top seven items among the Promoters, Passives, and Detractors in each of the stakeholder groups.
STAKEHOLDER GROUP COMPARISON CHARTS

7
C&P: Travel Opportunities C&P: Travel OpportunitiesATH: Variety of Offerings ATH: Variety of OfferingsTECH: School-‐provided CO CURRI: Variety of OfferingsDIV: Religious ATH: Opportunity to ParticipateFINE ARTS: Variety of Offerings ATH: Quality of OfferingsDIV: Cultural TECH: School-‐providedFINE ARTS: Quality of Offerings FINE ARTS: Opportunity to Participate
C&P: Faith Based ATH: Variety of OfferingsFINE ARTS: Opportunity to Participate ATH: Quality of OfferingsTECH: School-‐provided C&P: Faith BasedC&P: Academic Rigor ATH: Opportunity to ParticipateFINE ARTS: Quality of Offerings C&P: Preparatory (college/next level)CO CURRI: Opportunity to Participate C&P: Academic RigorFINE ARTS: Variety of Offerings FAC: Care and Concern
C&P: Travel OpportunitiesATH: Variety of OfferingsATH: Opportunity to ParticipateATH: Quality of OfferingsCO CURRI: Variety of OfferingsCO CURRI: Opportunity to ParticipateFINE ARTS: Quality of Offerings
Results for ALL DATA SAIS VALUE NARRATIVE SURVEY ANALYSIS © SAIS 2014
STAKEHOLDER COMPARISONS: ITEMS OF HIGHEST CONGRUENCE IN EACH GROUP
PARENTS TRUSTEES
Congruence Congruence
105.35 105.9699.57 105.6798.30 97.2996.92 97.2694.62 94.7893.54 94.6793.11 94.48
STUDENTS ALUMNI
Congruence Congruence
102.43 97.79101.64 95.71101.61 95.33100.66 94.4599.41 93.1999.03 93.1498.44 89.71
FACULTY
This sheet shows the seven items of highest congruence in each of the stakeholder groups.
Congruence C&P: Curriculum & Programming111.77 FAC: Faculty109.49 ATH: Athletics102.13 FINE ARTS: Fine Arts100.27 CO CURRI: Clubs and other Co-‐curriculars99.77 SAF: Safety98.32 DIV: Diversity97.58 TECH: Technology
SK: Skills
ALL STAKEHOLDERS
8
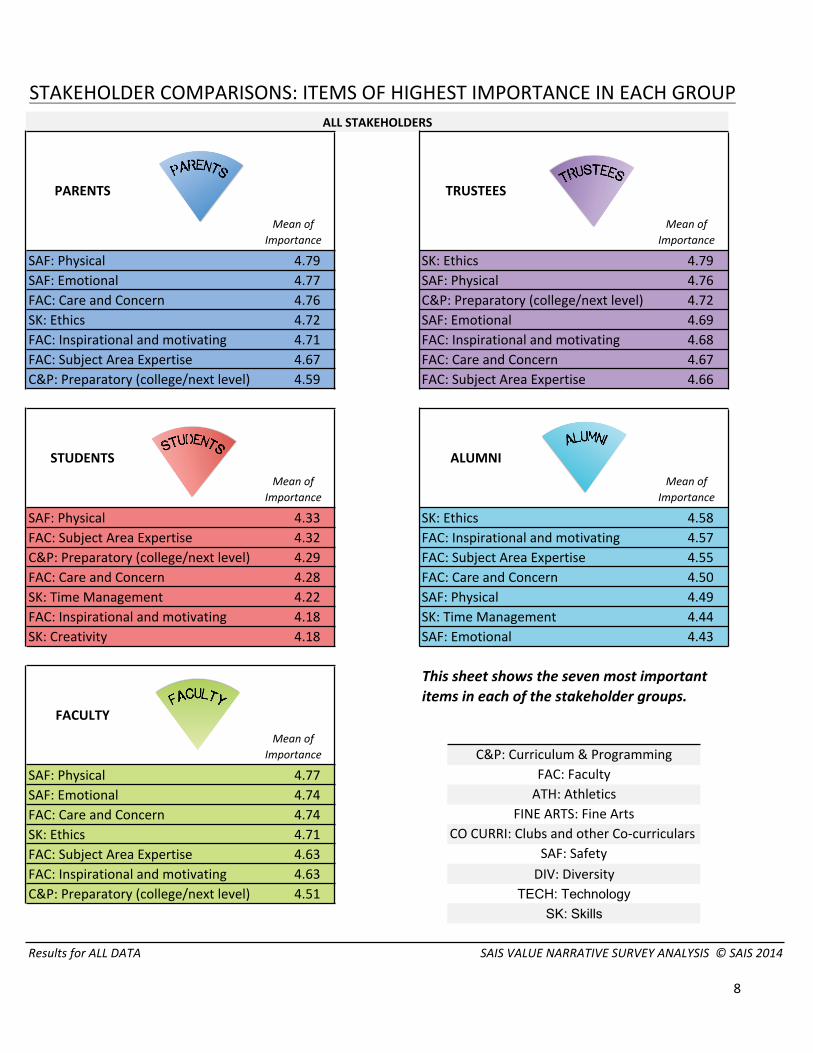
SAF: Physical SK: EthicsSAF: Emotional SAF: PhysicalFAC: Care and Concern C&P: Preparatory (college/next level)SK: Ethics SAF: EmotionalFAC: Inspirational and motivating FAC: Inspirational and motivatingFAC: Subject Area Expertise FAC: Care and ConcernC&P: Preparatory (college/next level) FAC: Subject Area Expertise
SAF: Physical SK: EthicsFAC: Subject Area Expertise FAC: Inspirational and motivatingC&P: Preparatory (college/next level) FAC: Subject Area ExpertiseFAC: Care and Concern FAC: Care and ConcernSK: Time Management SAF: PhysicalFAC: Inspirational and motivating SK: Time ManagementSK: Creativity SAF: Emotional
SAF: PhysicalSAF: EmotionalFAC: Care and ConcernSK: EthicsFAC: Subject Area ExpertiseFAC: Inspirational and motivatingC&P: Preparatory (college/next level)
PARENTS TRUSTEES
ALUMNISTUDENTS
4.724.764.79
4.434.444.494.504.554.574.58
4.63DIV: Diversity
TECH: Technology
SK: Skills
This sheet shows the seven most important items in each of the stakeholder groups.
STAKEHOLDER COMPARISONS: ITEMS OF HIGHEST IMPORTANCE IN EACH GROUP
C&P: Curriculum & Programming
Mean of Importance
Mean of Importance
Mean of Importance
Mean of Importance
Mean of Importance
CO CURRI: Clubs and other Co-‐curriculars
FAC: FacultyATH: Athletics
FINE ARTS: Fine Arts
SAF: Safety
4.184.18
4.774.744.744.71
4.294.284.22
4.794.774.76
4.634.51
FACULTY
Results for ALL DATA SAIS VALUE NARRATIVE SURVEY ANALYSIS © SAIS 2014
4.724.714.674.59
4.694.684.674.66
4.334.32
ALL STAKEHOLDERS
9
SAF: Physical FAC: Care and ConcernFAC: Care and Concern SAF: PhysicalC&P: Academic Rigor C&P: Academic RigorSK: Ethics C&P: Preparatory (college/next level)SAF: Emotional SK: EthicsFAC: Subject Area Expertise SAF: EmotionalFAC: Inspirational and motivating FAC: Subject Area Expertise
SAF: Physical C&P: Preparatory (college/next level)C&P: Preparatory (college/next level) C&P: Academic RigorC&P: Academic Rigor FAC: Care and ConcernTECH: Availability SAF: PhysicalATH: Opportunity to Participate FAC: Subject Area ExpertiseFAC: Care and Concern FAC: Inspirational and motivatingTECH: School-‐provided ATH: Opportunity to Participate
FAC: Care and ConcernSAF: PhysicalFAC: Subject Area ExpertiseC&P: Preparatory (college/next level)FAC: Inspirational and motivatingSAF: EmotionalATH: Opportunity to Participate
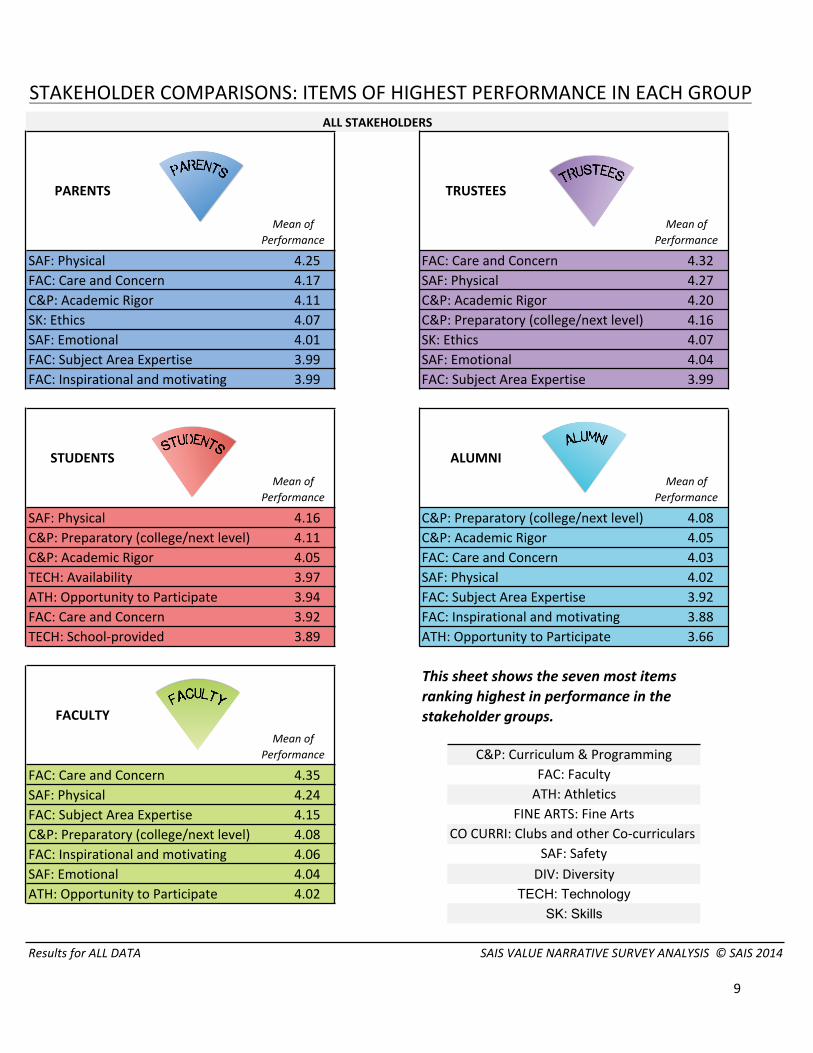
STAKEHOLDER COMPARISONS: ITEMS OF HIGHEST PERFORMANCE IN EACH GROUP
PARENTS TRUSTEES
Mean of Performance
Mean of Performance
4.25 4.324.17 4.274.11 4.204.07 4.164.01 4.073.99 4.043.99 3.99
STUDENTS ALUMNIMean of
PerformanceMean of
Performance
4.16 4.084.11 4.054.05 4.033.97 4.023.94 3.923.92 3.883.89 3.66
FACULTY
This sheet shows the seven most items ranking highest in performance in the stakeholder groups.
Mean of Performance C&P: Curriculum & Programming
4.35 FAC: Faculty4.24 ATH: Athletics4.15 FINE ARTS: Fine Arts4.08 CO CURRI: Clubs and other Co-‐curriculars4.06 SAF: Safety4.04 DIV: Diversity4.02 TECH: Technology
SK: Skills
Results for ALL DATA SAIS VALUE NARRATIVE SURVEY ANALYSIS © SAIS 2014
ALL STAKEHOLDERS

10
C&P: Travel Opportunities C&P: Travel OpportunitiesDIV: Religious ATH: Variety of OfferingsATH: Variety of Offerings ATH: Opportunity to ParticipateTECH: School-‐provided CO CURRI: Variety of OfferingsDIV: Cultural ATH: Quality of OfferingsFINE ARTS: Variety of Offerings FINE ARTS: Opportunity to ParticipateDIV: Socioeconomic CO CURRI: Opportunity to Participate
TECH: School-‐provided ATH: Variety of OfferingsC&P: Faith Based ATH: Quality of OfferingsC&P: Travel Opportunities C&P: Faith BasedFINE ARTS: Opportunity to Participate ATH: Opportunity to ParticipateFINE ARTS: Quality of Offerings C&P: Academic RigorC&P: Academic Rigor C&P: Preparatory (college/next level)FINE ARTS: Variety of Offerings CO CURRI: Variety of Offerings
C&P: Travel OpportunitiesATH: Variety of OfferingsATH: Opportunity to ParticipateATH: Quality of OfferingsCO CURRI: Variety of OfferingsCO CURRI: Opportunity to ParticipateFINE ARTS: Quality of Offerings
99.54 DIV: Diversity98.79 TECH: Technology
SK: Skills
Results for ALL DATA SAIS VALUE NARRATIVE SURVEY ANALYSIS © SAIS 2014
113.22 FAC: Faculty109.18 ATH: Athletics102.18 FINE ARTS: Fine Arts101.22 CO CURRI: Clubs and other Co-‐curriculars100.65 SAF: Safety
103.92 98.17103.71 97.42103.63 97.29102.96 94.24
FACULTY
This sheet shows the seven items of highest congruence in each of the stakeholder groups -‐ among PROMOTERS.
Congruence C&P: Curriculum & Programming
Promoters77.9%
STUDENTS ALUMNI
Congruence Congruence
105.86 101.46105.73 99.93105.05 99.02
Promoters47.6%
Promoters62.5%
102.72 98.8399.26 98.0298.39 96.5998.19 95.7096.59 95.54
STAKEHOLDER COMPARISONS: ITEMS OF HIGHEST CONGRUENCE IN EACH GROUP
PARENTS TRUSTEES
Congruence Congruence
109.02 107.46102.81 106.67
PROMOTERS
69.4%Promoters Promoters
89.7%

11
SAF: Physical SK: EthicsSAF: Emotional SAF: PhysicalFAC: Care and Concern C&P: Preparatory (college/next level)FAC: Inspirational and motivating SAF: EmotionalSK: Ethics FAC: Care and ConcernFAC: Subject Area Expertise FAC: Inspirational and motivatingC&P: Preparatory (college/next level) FAC: Subject Area Expertise
SAF: Physical SK: EthicsFAC: Care and Concern FAC: Inspirational and motivatingFAC: Subject Area Expertise FAC: Subject Area ExpertiseC&P: Preparatory (college/next level) FAC: Care and ConcernSK: Teamwork SAF: PhysicalSK: Time Management SK: Time ManagementSAF: Emotional SAF: Emotional
SAF: PhysicalFAC: Care and ConcernSAF: EmotionalSK: EthicsFAC: Inspirational and motivatingFAC: Subject Area ExpertiseC&P: Preparatory (college/next level) 4.55 TECH: Technology
SK: Skills
Results for ALL DATA SAIS VALUE NARRATIVE SURVEY ANALYSIS © SAIS 2014
4.79 ATH: Athletics4.79 FINE ARTS: Fine Arts4.76 CO CURRI: Clubs and other Co-‐curriculars4.69 SAF: Safety4.67 DIV: Diversity
4.37 4.49
FACULTY
This sheet shows the seven most important items in each of the stakeholder groups -‐ among PROMOTERS.
Mean of Importance C&P: Curriculum & Programming
4.81 FAC: Faculty
Promoters77.9%
4.46 4.654.43 4.594.43 4.564.41 4.554.39 4.53
4.73 4.684.69 4.67
STUDENTS ALUMNIMean of
ImportanceMean of
Importance
4.51 4.67
Promoters47.6%
Promoters62.5%
4.84 4.804.82 4.784.80 4.724.78 4.704.76 4.69
STAKEHOLDER COMPARISONS: ITEMS OF HIGHEST IMPORTANCE IN EACH GROUP
PARENTS TRUSTEES
Mean of Importance
Mean of Importance
PROMOTERS
Promoters69.4%
Promoters89.7%
12
FAC: Care and Concern FAC: Care and ConcernSAF: Physical SAF: PhysicalSK: Ethics C&P: Academic RigorC&P: Academic Rigor C&P: Preparatory (college/next level)SAF: Emotional SK: EthicsFAC: Inspirational and motivating SAF: EmotionalFAC: Subject Area Expertise FAC: Subject Area Expertise
SAF: Physical C&P: Preparatory (college/next level)C&P: Preparatory (college/next level) C&P: Academic RigorC&P: Academic Rigor FAC: Care and ConcernFAC: Care and Concern SAF: PhysicalSK: Teamwork FAC: Subject Area ExpertiseTECH: Availability FAC: Inspirational and motivatingSK: Creativity SK: Ethics
FAC: Care and ConcernSAF: PhysicalFAC: Subject Area ExpertiseC&P: Preparatory (college/next level)FAC: Inspirational and motivatingSAF: EmotionalC&P: Academic Rigor 4.15 TECH: Technology
SK: Skills
#CONCATENATE("Results for ",ALLMaster!$B$2) SAIS VALUE NARRATIVE SURVEY ANALYSIS © SAIS 2014
4.35 ATH: Athletics4.28 FINE ARTS: Fine Arts4.23 CO CURRI: Clubs and other Co-‐curriculars4.21 SAF: Safety4.20 DIV: Diversity
4.26 4.01
FACULTY
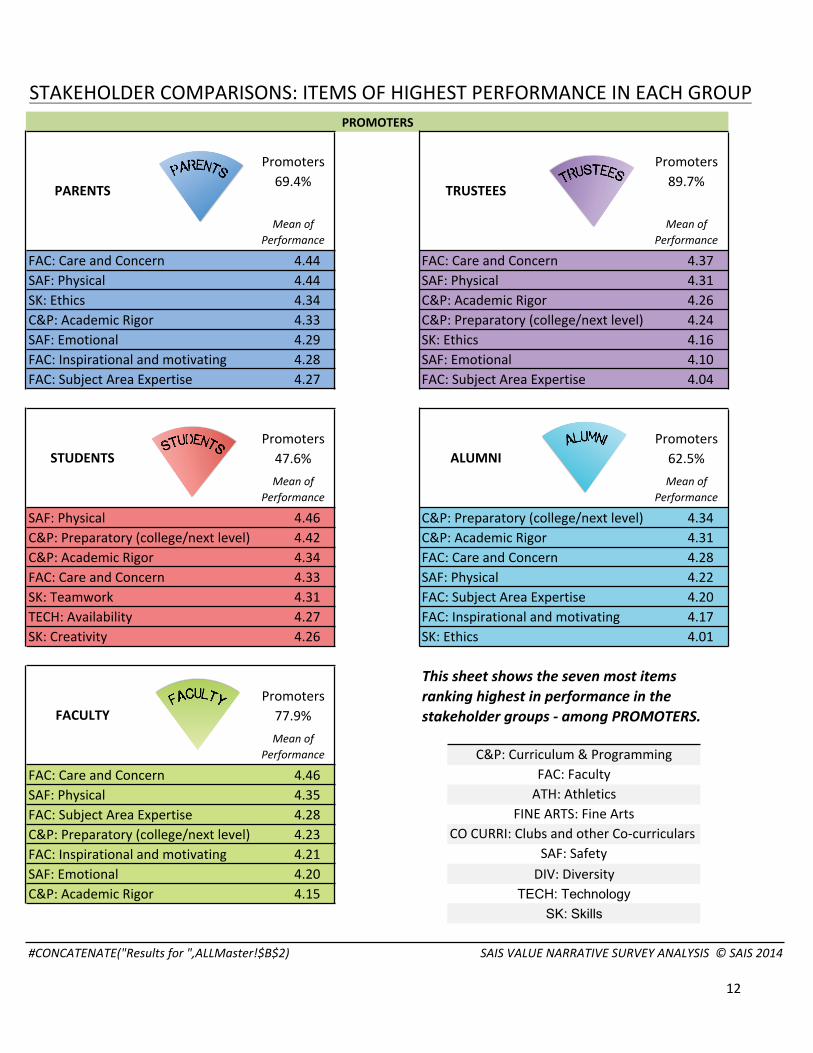
This sheet shows the seven most items ranking highest in performance in the stakeholder groups -‐ among PROMOTERS.
Mean of Performance C&P: Curriculum & Programming
4.46 FAC: Faculty
Promoters77.9%
4.42 4.314.34 4.284.33 4.224.31 4.204.27 4.17
4.28 4.104.27 4.04
STUDENTS ALUMNIMean of
PerformanceMean of
Performance
4.46 4.34
Promoters47.6%
Promoters62.5%
4.44 4.374.44 4.314.34 4.264.33 4.244.29 4.16
STAKEHOLDER COMPARISONS: ITEMS OF HIGHEST PERFORMANCE IN EACH GROUP
PARENTS TRUSTEES
Mean of Performance
Mean of Performance
PROMOTERS
Promoters69.4%
Promoters89.7%

13
C&P: Travel Opportunities ATH: Variety of OfferingsATH: Variety of Offerings C&P: Travel OpportunitiesFINE ARTS: Variety of Offerings TECH: School-‐providedTECH: School-‐provided FAC: Care and ConcernFINE ARTS: Quality of Offerings FINE ARTS: Variety of OfferingsFINE ARTS: Opportunity to Participate SAF: PhysicalC&P: Faith Based CO CURRI: Variety of Offerings
C&P: Faith Based ATH: Variety of OfferingsFINE ARTS: Opportunity to Participate ATH: Quality of OfferingsC&P: Academic Rigor C&P: Faith BasedTECH: School-‐provided ATH: Opportunity to ParticipateCO CURRI: Opportunity to Participate C&P: Academic RigorFINE ARTS: Quality of Offerings C&P: Preparatory (college/next level)FINE ARTS: Variety of Offerings FAC: Care and Concern
ATH: Variety of OfferingsC&P: Travel OpportunitiesATH: Opportunity to ParticipateATH: Quality of OfferingsCO CURRI: Variety of OfferingsFINE ARTS: Quality of OfferingsCO CURRI: Opportunity to Participate
PASSIVES
PARENTS TRUSTEES
Passives Passives17.7% 6.6%
Congruence Congruence
STAKEHOLDER COMPARISONS: ITEMS OF HIGHEST CONGRUENCE IN EACH GROUP
99.67 91.2293.83 90.1887.27 85.8286.53 84.6285.87 83.9285.79 83.3385.44 83.09
STUDENTS ALUMNIPassives Passives30.7% 24.0%
Congruence Congruence
102.90 93.23102.70 90.50100.71 89.80100.59 89.6499.24 88.6398.57 88.4198.19 86.06
FACULTY
This sheet shows the seven items of highest congruence in each of the stakeholder groups -‐ among PASSIVES.
Passives16.0%
Congruence C&P: Curriculum & Programming109.14 FAC: Faculty107.56 ATH: Athletics101.65 FINE ARTS: Fine Arts97.09 CO CURRI: Clubs and other Co-‐curriculars96.47 SAF: Safety95.13 DIV: Diversity94.15 TECH: Technology
SK: Skills
Results for ALL DATA SAIS VALUE NARRATIVE SURVEY ANALYSIS © SAIS 2014

14
SAF: Physical C&P: Preparatory (college/next level)SAF: Emotional SK: EthicsFAC: Inspirational and motivating SAF: EmotionalFAC: Care and Concern C&P: Academic RigorFAC: Subject Area Expertise FAC: Subject Area ExpertiseSK: Ethics SAF: PhysicalC&P: Preparatory (college/next level) FAC: Inspirational and motivating
FAC: Subject Area Expertise FAC: Inspirational and motivatingSAF: Physical FAC: Subject Area ExpertiseC&P: Preparatory (college/next level) SK: EthicsFAC: Care and Concern SAF: PhysicalSK: Time Management FAC: Care and ConcernFAC: Inspirational and motivating SAF: EmotionalSK: Creativity SK: Curiosity
SAF: PhysicalSAF: EmotionalFAC: Care and ConcernSK: EthicsFAC: Subject Area ExpertiseFAC: Inspirational and motivatingC&P: Preparatory (college/next level)
STAKEHOLDER COMPARISONS: ITEMS OF HIGHEST IMPORTANCE IN EACH GROUPPASSIVES
PARENTS TRUSTEES
Passives Passives17.7% 6.6%
Mean of Importance
Mean of Importance
4.75 4.764.73 4.714.66 4.684.65 4.594.65 4.544.64 4.544.57 4.51
STUDENTS ALUMNIPassives Passives30.7% 24.0%Mean of
ImportanceMean of
Importance
4.27 4.494.26 4.494.24 4.484.21 4.414.14 4.404.11 4.364.08 4.36
FACULTY
This sheet shows the seven most important items in each of the stakeholder groups -‐ among PASSIVES.
Passives16.0%Mean of
Importance C&P: Curriculum & Programming4.62 FAC: Faculty4.59 ATH: Athletics4.56 FINE ARTS: Fine Arts4.54 CO CURRI: Clubs and other Co-‐curriculars4.50 SAF: Safety4.43 DIV: Diversity4.33 TECH: Technology
SK: Skills
Results for ALL DATA SAIS VALUE NARRATIVE SURVEY ANALYSIS © SAIS 2014

15
SAF: Physical SAF: PhysicalC&P: Academic Rigor FAC: Care and ConcernFAC: Care and Concern C&P: Academic RigorSK: Ethics FAC: Subject Area ExpertiseFAC: Subject Area Expertise FAC: Inspirational and motivatingTECH: Availability ATH: Variety of OfferingsC&P: Preparatory (college/next level) SAF: Emotional
SAF: Physical SAF: PhysicalC&P: Preparatory (college/next level) FAC: Care and ConcernC&P: Academic Rigor C&P: Preparatory (college/next level)TECH: Availability C&P: Academic RigorATH: Opportunity to Participate FAC: Subject Area ExpertiseFAC: Care and Concern FAC: Inspirational and motivatingTECH: School-‐provided ATH: Opportunity to Participate
FAC: Care and ConcernSAF: PhysicalFAC: Subject Area ExpertiseFINE ARTS: Quality of OfferingsATH: Opportunity to ParticipateFINE ARTS: Opportunity to ParticipateFAC: Inspirational and motivating
STAKEHOLDER COMPARISONS: ITEMS OF HIGHEST PERFORMANCE IN EACH GROUPPASSIVES
PARENTS TRUSTEES
Passives Passives17.7% 6.6%
Mean of Performance
Mean of Performance
3.94 3.783.72 3.763.69 3.593.61 3.323.53 3.293.50 3.293.49 3.29
STUDENTS ALUMNIPassives Passives30.7% 24.0%Mean of
PerformanceMean of
Performance
4.09 3.794.03 3.783.98 3.783.85 3.773.84 3.623.82 3.563.77 3.40
FACULTY
This sheet shows the seven most items ranking highest in performance in the stakeholder groups -‐ among PASSIVES.
Passives16.0%Mean of
Performance C&P: Curriculum & Programming4.06 FAC: Faculty3.95 ATH: Athletics3.83 FINE ARTS: Fine Arts3.78 CO CURRI: Clubs and other Co-‐curriculars3.74 SAF: Safety3.71 DIV: Diversity3.69 TECH: Technology
SK: Skills
Results for ALL DATA SAIS VALUE NARRATIVE SURVEY ANALYSIS © SAIS 2014

16
C&P: Travel Opportunities ATH: Variety of OfferingsATH: Variety of Offerings C&P: Travel OpportunitiesTECH: School-‐provided ATH: Opportunity to ParticipateFINE ARTS: Variety of Offerings SK: CreativityFINE ARTS: Quality of Offerings DIV: ReligiousFINE ARTS: Opportunity to Participate SK: TeamworkCO CURRI: Variety of Offerings FINE ARTS: Opportunity to Participate
FINE ARTS: Opportunity to Participate ATH: Variety of OfferingsC&P: Academic Rigor ATH: Opportunity to ParticipateTECH: School-‐provided ATH: Quality of OfferingsC&P: Faith Based C&P: Faith BasedATH: Opportunity to Participate C&P: Academic RigorCO CURRI: Opportunity to Participate C&P: Preparatory (college/next level)FINE ARTS: Quality of Offerings SAF: Physical
ATH: Variety of OfferingsATH: Opportunity to ParticipateC&P: Travel OpportunitiesCO CURRI: Variety of OfferingsATH: Quality of OfferingsCO CURRI: Opportunity to ParticipateTECH: School-‐provided
STAKEHOLDER COMPARISONS: ITEMS OF HIGHEST CONGRUENCE IN EACH GROUPDETRACTORS
PARENTS TRUSTEES
Detractors Detractors8.8% 1.1%
Congruence Congruence
94.14 108.7088.08 105.8879.08 84.6278.68 83.3377.94 82.3577.72 80.0077.68 79.31
STUDENTS ALUMNIDetractors Detractors21.6% 12.8%
Congruence Congruence
94.31 86.3593.27 83.5892.87 82.8591.31 81.0290.96 79.7590.38 79.4889.93 79.09
FACULTY
This sheet shows the seven items of highest congruence in each of the stakeholder groups -‐ among DETRACTORS.
Detractors6.0%
Congruence C&P: Curriculum & Programming115.59 FAC: Faculty102.88 ATH: Athletics102.45 FINE ARTS: Fine Arts96.62 CO CURRI: Clubs and other Co-‐curriculars95.35 SAF: Safety92.85 DIV: Diversity90.21 TECH: Technology
SK: Skills
Results for ALL DATA SAIS VALUE NARRATIVE SURVEY ANALYSIS © SAIS 2014

17
SAF: Physical C&P: Variety of Course OfferingsFAC: Subject Area Expertise FAC: Subject Area ExpertiseSAF: Emotional SK: EthicsFAC: Care and Concern C&P: Academic RigorFAC: Inspirational and motivating C&P: Preparatory (college/next level)SK: Ethics FAC: Care and ConcernC&P: Preparatory (college/next level) SAF: Physical
FAC: Subject Area Expertise FAC: Subject Area ExpertiseC&P: Preparatory (college/next level) SK: EthicsSAF: Physical FAC: Care and ConcernSK: Creativity FAC: Inspirational and motivatingSK: Time Management SAF: PhysicalFAC: Care and Concern SK: CuriosityTECH: Availability SAF: Emotional
SAF: PhysicalSAF: EmotionalFAC: Subject Area ExpertiseSK: EthicsFAC: Care and ConcernC&P: Preparatory (college/next level)C&P: Academic Rigor
STAKEHOLDER COMPARISONS: ITEMS OF HIGHEST IMPORTANCE IN EACH GROUPDETRACTORS
PARENTS TRUSTEES
Detractors Detractors8.8% 1.1%
Mean of Importance
Mean of Importance
4.71 4.864.71 4.864.68 4.754.63 4.714.62 4.714.56 4.714.54 4.71
STUDENTS ALUMNIDetractors Detractors21.6% 12.8%Mean of
ImportanceMean of
Importance
4.13 4.514.11 4.464.05 4.403.98 4.393.98 4.363.97 4.353.95 4.31
FACULTY
This sheet shows the seven most important items in each of the stakeholder groups -‐ among DETRACTORS.
Detractors6.0%Mean of
Importance C&P: Curriculum & Programming4.64 FAC: Faculty4.59 ATH: Athletics4.55 FINE ARTS: Fine Arts4.52 CO CURRI: Clubs and other Co-‐curriculars4.49 SAF: Safety4.42 DIV: Diversity4.31 TECH: Technology
SK: Skills
Results for ALL DATA SAIS VALUE NARRATIVE SURVEY ANALYSIS © SAIS 2014

18
SAF: Physical SK: CreativityC&P: Academic Rigor ATH: Variety of OfferingsTECH: Availability SAF: PhysicalTECH: Current FAC: Care and ConcernC&P: Preparatory (college/next level) FINE ARTS: Opportunity to ParticipateC&P: Variety of Course Offerings SK: EthicsTECH: School-‐provided C&P: Academic Rigor
SAF: Physical SAF: PhysicalC&P: Preparatory (college/next level) C&P: Academic RigorC&P: Academic Rigor C&P: Preparatory (college/next level)TECH: Availability FAC: Care and ConcernATH: Opportunity to Participate FAC: Subject Area ExpertiseTECH: School-‐provided FAC: Inspirational and motivatingATH: Variety of Offerings ATH: Opportunity to Participate
FAC: Care and ConcernATH: Variety of OfferingsSAF: PhysicalATH: Opportunity to ParticipateFINE ARTS: Quality of OfferingsTECH: CurrentTECH: Availability
STAKEHOLDER COMPARISONS: ITEMS OF HIGHEST PERFORMANCE IN EACH GROUPDETRACTORS
PARENTS TRUSTEES
Detractors Detractors8.8% 1.1%
Mean of Performance
Mean of Performance
3.59 3.753.32 3.573.21 3.573.18 3.433.13 3.293.04 3.253.03 3.14
STUDENTS ALUMNIDetractors Detractors21.6% 12.8%Mean of
PerformanceMean of
Performance
FACULTY
This sheet shows the seven most items ranking highest in performance in the stakeholder groups -‐ among DETRACTORS.
Detractors6.0%Mean of
Performance C&P: Curriculum & Programming
3.61 3.453.53 3.353.50 3.333.47 3.293.42 3.15
3.39 DIV: Diversity3.38 TECH: Technology
SK: Skills
Results for ALL DATA SAIS VALUE NARRATIVE SURVEY ANALYSIS © SAIS 2014
3.61 FAC: Faculty3.57 ATH: Athletics3.57 FINE ARTS: Fine Arts3.55 CO CURRI: Clubs and other Co-‐curriculars3.47 SAF: Safety
3.37 3.043.33 3.02

19
APPENDIX: ALL RESPONDENTS
The following pages list the Category Congruency, Individual Item Cogruency,Importance, and Performance for all stakeholders and then presented by Promoters, Passives, and Detractors.
20
3.67Fine Arts 94.13 3.84 3.61
Clubs and other Co-‐curriculars 91.69 3.75 3.43
Results for ALL DATA SAIS VALUE NARRATIVE SURVEY ANALYSIS © SAIS 2014
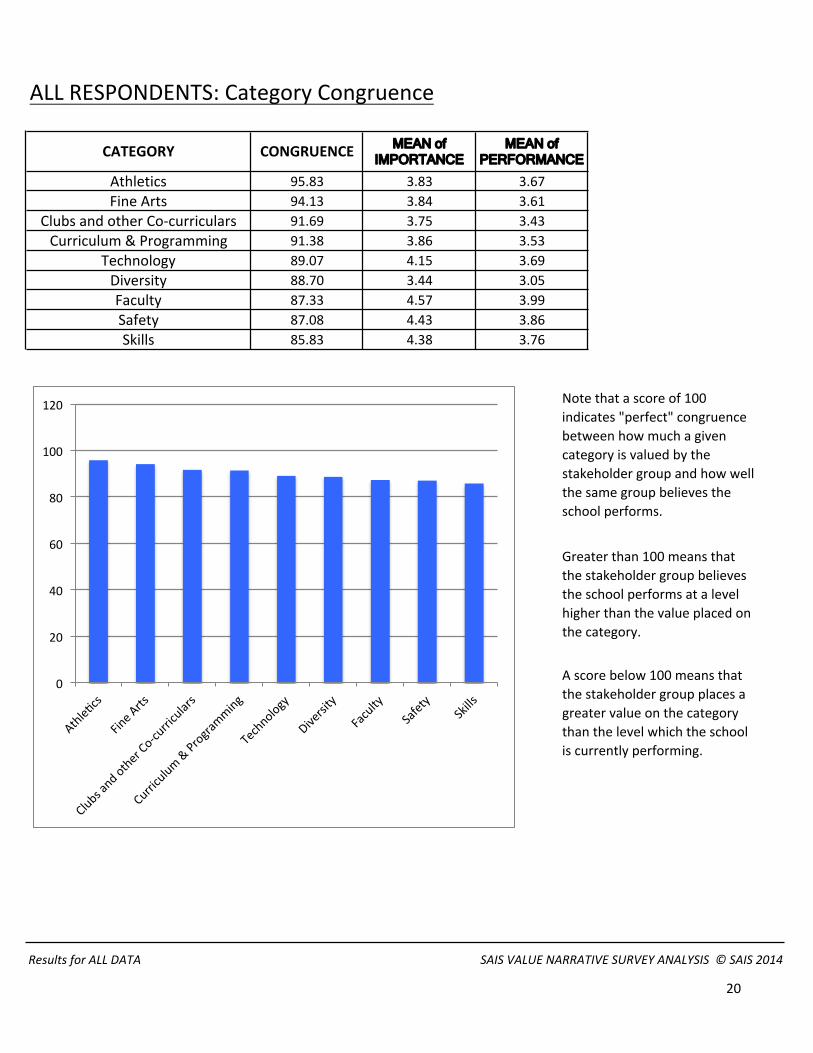
ALL RESPONDENTS: Category Congruence
CATEGORY CONGRUENCE MEAN of IMPORTANCE
MEAN of PERFORMANCE
Athletics 95.83 3.83
Safety 87.08 4.43 3.86Skills 85.83 4.38 3.76
Diversity 88.70 3.44 3.05Faculty 87.33 4.57 3.99
Curriculum & Programming 91.38 3.86 3.53Technology 89.07 4.15 3.69
Note that a score of 100 indicates "perfect" congruence between how much a given category is valued by the stakeholder group and how well the same group believes the school performs.
Greater than 100 means that the stakeholder group believes the school performs at a level higher than the value placed on the category.
A score below 100 means that the stakeholder group places a greater value on the category than the level which the school is currently performing.
0
20
40
60
80
100
120

21
3.873.913.19
Item
C&P: Travel OpportunitiesATH: Variety of OfferingsTECH: School-‐providedFINE ARTS: Opportunity to ParticipateC&P: Faith BasedATH: Quality of OfferingsFINE ARTS: Variety of OfferingsATH: Opportunity to ParticipateFINE ARTS: Quality of OfferingsC&P: Academic Rigor
C&P: Preparatory (college/next level)
3.02
CO CURRI: Variety of OfferingsCO CURRI: Opportunity to Participate
90.4489.6589.4189.24
4.264.56
3.693.023.633.513.713.644.084.35
3.643.863.224.62
4.594.47
88.50
ALL RESPONDENTS: Individual Item Congruence
87.8887.28
3.853.733.963.87
CONGRUENCE MEAN of IMPORTANCE
MEAN of PERFORMANCE
99.8499.5894.57
3.02
94.5394.4594.2593.9993.8893.8893.5893.2392.2091.76
FAC: Care and Concern
3.663.66
88.46
3.68
4.564.124.55
C&P: Variety of Course OfferingsC&P: Character EducationC&P: Global EducationDIV: CulturalSK: CreativitySK: TeamworkTECH: CurrentFAC: Subject Area ExpertiseDIV: SocioeconomicTECH: AvailabilitySK: EthicsSAF: SpiritualFAC: Inspirational and motivating
88.3088.12
4.294.34
85.75
86.9186.83
4.313.483.60
4.18
3.494.31
Greater than 100 means that the stakeholder group believes the school performs at a level higher than the value placed on the item; less than 100 means that the stakeholder group places a greater value on the item than the level which the school is currently performing.
This is a list sorted by individual item congruence. Note that a score of 100 indicates "perfect" congruence between how much a given item is valued by the stakeholder group and how well the same group believes the school performs at delivering on that item.
3.543.903.693.733.863.66
3.793.703.963.023.723.92
3.993.703.82
DIV: ReligiousSAF: PhysicalCO CURRI: Quality of Offerings
3.393.562.954.183.354.10
4.43
3.74
C&P: Curriculum & Programming
FAC: Faculty
ATH: Athletics
FINE ARTS: Fine Arts
CO CURRI: Clubs and other Co-‐curriculars
SAF: Safety
DIV: Diversity
TECH: Technology
SK: Skills
Results for ALL DATA SAIS VALUE NARRATIVE SURVEY ANALYSIS © SAIS 2014
3.073.173.77
SK: ResilienceSK: CuriositySAF: EmotionalSK: Time Management
85.6685.5484.7982.65
86.4786.2886.0385.84
4.314.364.55
22
ALL RESPONDENTS: Items ordered by Importance and Performance
3.39
3.35
3.17
3.66
3.64
3.63
3.56
3.54
3.51
4.184.10
3.77
3.73
3.72
3.71
3.70
3.70
3.69
SAF: Physical
FAC: Inspirational and motivatingC&P: Preparatory (college/next level)
TECH: AvailabilityC&P: Character Education
C&P: Academic RigorSK: Teamwork
4.554.474.434.364.354.34
IMPORTANCE MEAN PERFORMANCE
ATH: Quality of OfferingsCO CURRI: Opportunity to Participate
SAF: SpiritualFINE ARTS: Variety of OfferingsCO CURRI: Variety of Offerings
3.69
3.66
3.66
CO CURRI: Quality of OfferingsDIV: Cultural
C&P: Global EducationC&P: Travel Opportunities
3.07
3.02
4.08
3.99
3.96
3.92
3.90
3.86
3.82
3.79
ATH: Variety of OfferingsCO CURRI: Variety of Offerings
DIV: Cultural
3.853.743.733.68
C&P: Faith BasedDIV: Socioeconomic
DIV: Religious
SAF: PhysicalFAC: Care and ConcernC&P: Academic Rigor
C&P: Preparatory (college/next level)FAC: Subject Area Expertise
SK: EthicsFAC: Inspirational and motivating
SAF: EmotionalC&P: Character Education
SK: TeamworkSK: CreativitySK: Curiosity
TECH: AvailabilityATH: Opportunity to Participate
TECH: CurrentC&P: Variety of Course Offerings
FINE ARTS: Opportunity to ParticipateSK: Resilience
ATH: Variety of OfferingsSK: Time ManagementTECH: School-‐provided
FINE ARTS: Quality of Offerings
2.95
ATH: Athletics SAF: Safety SK: Skills
Results for ALL DATA SAIS VALUE NARRATIVE SURVEY ANALYSIS © SAIS 2014
SAF: SpiritualATH: Opportunity to Participate
ATH: Quality of OfferingsCO CURRI: Quality of Offerings
DIV: SocioeconomicC&P: Global Education
DIV: ReligiousC&P: Faith Based
C&P: Travel Opportunities
3.493.483.223.193.02
FINE ARTS: Opportunity to ParticipateFINE ARTS: Quality of Offerings
TECH: School-‐providedCO CURRI: Opportunity to Participate
4.123.963.913.873.873.86
FINE ARTS: Variety of Offerings
MEAN
4.62
C&P: Curriculum & Programming FINE ARTS: Fine Arts DIV: DiversityFAC: Faculty CO CURRI: Clubs and other Co-‐curriculars TECH: Technology
FAC: Care and ConcernSK: Ethics
FAC: Subject Area ExpertiseSAF: Emotional
4.594.564.564.55
SK: Time ManagementSK: Curiosity
3.643.60
SK: ResilienceSK: CreativityTECH: Current
C&P: Variety of Course Offerings
4.314.314.314.294.264.18
3.02
3.02

23
CATEGORY CONGRUENCE MEAN of IMPORTANCE
MEAN of PERFORMANCE
PROMOTERS: Category Congruence
Diversity 94.19 3.49 3.29Faculty 91.82 4.67 4.29
Curriculum & Programming 95.05 3.95 3.75Clubs and other Co-‐curriculars 94.87 3.81 3.61
Athletics 99.04 3.90 3.87Fine Arts 97.29 3.93 3.82
A score below 100 means that the stakeholder group places a greater value on the category than the level which the school is currently performing.
Results for ALL DATA SAIS VALUE NARRATIVE SURVEY ANALYSIS © SAIS 2014
Safety 90.60 4.55 4.12
Note that a score of 100 indicates "perfect" congruence between how much a given category is valued by the stakeholder group and how well the same group believes the school performs.
Greater than 100 means that the stakeholder group believes the school performs at a level higher than the value placed on the category.
Technology 91.23 4.23 3.86Skills 90.91 4.48 4.08
Promoters are those who responded with a 9 or 10 to the question, "on a scale of 1 to 10, how likely are you to recommend the school?"
Promoters for this group: 65.4%
0
20
40
60
80
100
120

24
PROMOTERS: Individual Item Congruence
Item CONGRUENCE MEAN of IMPORTANCE
MEAN of PERFORMANCE
ATH: Quality of Offerings 97.96 3.93 3.85 This is a list sorted by individual item congruence. Note that a score of 100 indicates "perfect" congruence between how much a given item is valued by the stakeholder group and how well the same group believes the school performs at delivering on that item.
FINE ARTS: Variety of Offerings 97.56 3.81 3.72DIV: Religious
C&P: Travel Opportunities 104.69 3.05 3.20ATH: Variety of Offerings 102.87 3.75 3.85
TECH: School-‐provided 96.61 3.93 3.79ATH: Opportunity to Participate 96.55 4.04 3.90
FINE ARTS: Opportunity to Participate 97.15 4.01 3.89C&P: Faith Based 96.80 3.29 3.19
97.52 3.25 3.17FINE ARTS: Quality of Offerings 97.17 3.96 3.85
DIV: Cultural 93.55 3.67 3.43C&P: Variety of Course Offerings 93.26 4.25 3.96
CO CURRI: Opportunity to Participate 95.02 3.92 3.72FAC: Care and Concern 93.60 4.69 4.39
C&P: Academic Rigor 96.53 4.46 4.30CO CURRI: Variety of Offerings 96.50 3.70 3.57
C&P: Preparatory (college/next level) 92.09 4.58 4.22DIV: Socioeconomic 91.80 3.56 3.27
C&P: Character Education 92.21 4.46 4.11SK: Teamwork 92.11 4.46 4.11
92.92 4.72 4.39C&P: Global Education 92.80 3.54 3.28SAF: Physical
90.35 4.67 4.22SAF: Emotional 89.48 4.67 4.18
SK: Ethics 90.67 4.68 4.24SK: Resilience 90.65 4.42 4.00
FAC: Subject Area Expertise 91.52 4.64 4.25SK: Curiosity 91.15 4.45 4.05
C&P: Curriculum & Programming FINE ARTS: Fine Arts DIV: DiversityFAC: Faculty CO CURRI: Clubs and other Co-‐curriculars TECH: Technology
TECH: Current 88.64 4.36 3.87SK: Time Management 87.91 4.52 3.97
SAF: Spiritual 89.27 4.26 3.80TECH: Availability 89.01 4.40 3.92
Greater than 100 means that the stakeholder group believes the school performs at a level higher than the value placed on the item; less than 100 means that the stakeholder group places a greater value on the item than the level which the school is currently performing.
CO CURRI: Quality of Offerings 93.13 3.81 3.55SK: Creativity 93.06 4.38 4.08
FAC: Inspirational and motivating
ATH: Athletics SAF: Safety SK: Skills
Results for ALL DATA SAIS VALUE NARRATIVE SURVEY ANALYSIS © SAIS 2014
25
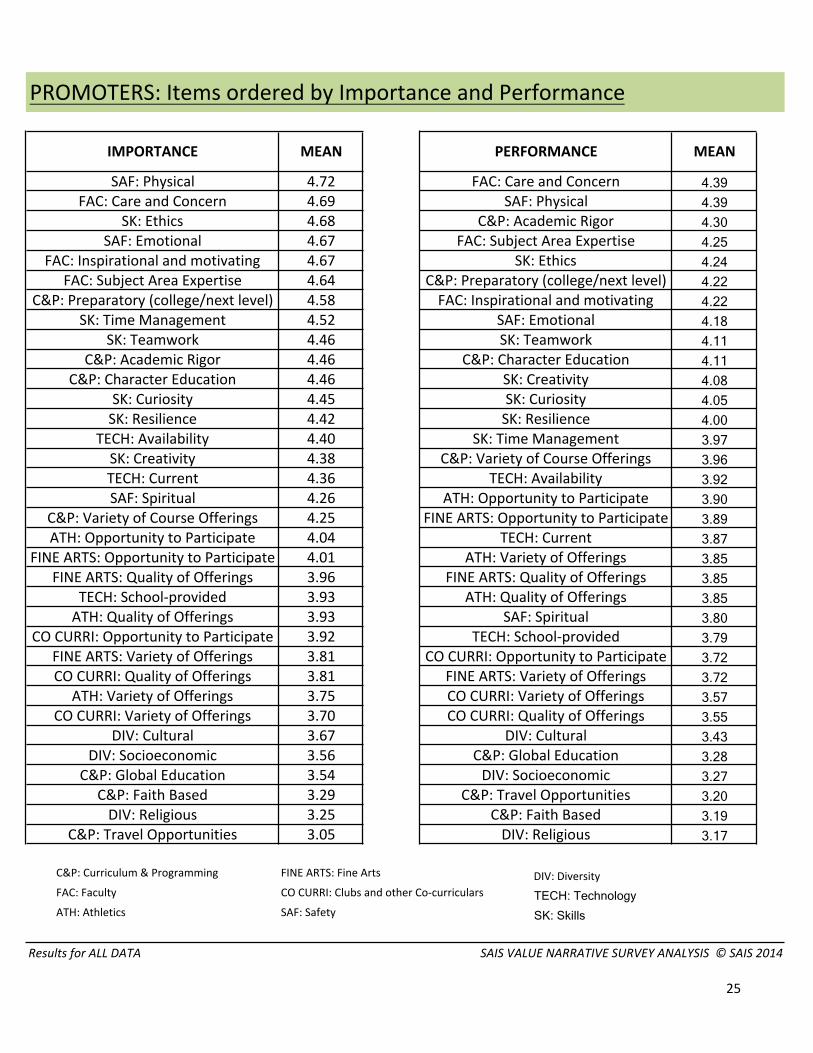
FAC: Care and Concern 4.69 SAF: Physical 4.39SK: Ethics 4.68 C&P: Academic Rigor 4.30
IMPORTANCE MEAN PERFORMANCE MEAN
SAF: Physical 4.72 FAC: Care and Concern 4.39
PROMOTERS: Items ordered by Importance and Performance
SK: Time Management 4.52 SAF: Emotional 4.18SK: Teamwork 4.46 SK: Teamwork 4.11
FAC: Subject Area Expertise 4.64 C&P: Preparatory (college/next level) 4.22C&P: Preparatory (college/next level) 4.58 FAC: Inspirational and motivating 4.22
SAF: Emotional 4.67 FAC: Subject Area Expertise 4.25FAC: Inspirational and motivating 4.67 SK: Ethics 4.24
TECH: Availability 4.40 SK: Time Management 3.97SK: Creativity 4.38 C&P: Variety of Course Offerings 3.96
SK: Curiosity 4.45 SK: Curiosity 4.05SK: Resilience 4.42 SK: Resilience 4.00
C&P: Academic Rigor 4.46 C&P: Character Education 4.11C&P: Character Education 4.46 SK: Creativity 4.08
FINE ARTS: Opportunity to Participate 4.01 ATH: Variety of Offerings 3.85FINE ARTS: Quality of Offerings 3.96 FINE ARTS: Quality of Offerings 3.85
C&P: Variety of Course Offerings 4.25 FINE ARTS: Opportunity to Participate 3.89ATH: Opportunity to Participate 4.04 TECH: Current 3.87
TECH: Current 4.36 TECH: Availability 3.92SAF: Spiritual 4.26 ATH: Opportunity to Participate 3.90
CO CURRI: Quality of Offerings 3.81 FINE ARTS: Variety of Offerings 3.72ATH: Variety of Offerings 3.75 CO CURRI: Variety of Offerings 3.57
CO CURRI: Opportunity to Participate 3.92 TECH: School-‐provided 3.79FINE ARTS: Variety of Offerings 3.81 CO CURRI: Opportunity to Participate 3.72
TECH: School-‐provided 3.93 ATH: Quality of Offerings 3.85ATH: Quality of Offerings 3.93 SAF: Spiritual 3.80
C&P: Faith Based 3.29 C&P: Travel Opportunities 3.20DIV: Religious 3.25 C&P: Faith Based 3.19
DIV: Socioeconomic 3.56 C&P: Global Education 3.28C&P: Global Education 3.54 DIV: Socioeconomic 3.27
CO CURRI: Variety of Offerings 3.70 CO CURRI: Quality of Offerings 3.55DIV: Cultural 3.67 DIV: Cultural 3.43
Results for ALL DATA SAIS VALUE NARRATIVE SURVEY ANALYSIS © SAIS 2014
FAC: Faculty CO CURRI: Clubs and other Co-‐curriculars TECH: TechnologyATH: Athletics SAF: Safety SK: Skills
C&P: Travel Opportunities 3.05 DIV: Religious 3.17
C&P: Curriculum & Programming FINE ARTS: Fine Arts DIV: Diversity
26
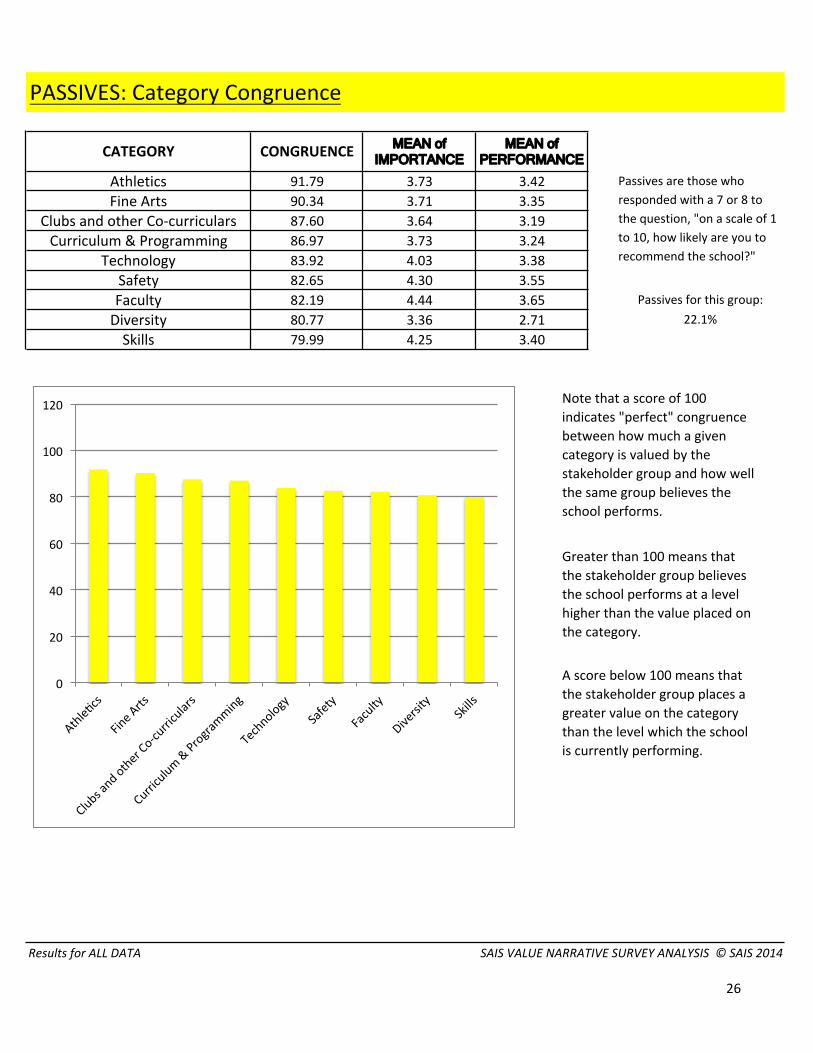
PASSIVES: Category Congruence
CATEGORY CONGRUENCE MEAN of IMPORTANCE
MEAN of PERFORMANCE
Technology 83.92 4.03 3.38Safety 82.65 4.30 3.55
Clubs and other Co-‐curriculars 87.60 3.64 3.19Curriculum & Programming 86.97 3.73 3.24
Athletics 91.79 3.73 3.42Fine Arts 90.34 3.71 3.35
A score below 100 means that the stakeholder group places a greater value on the category than the level which the school is currently performing.
Results for ALL DATA SAIS VALUE NARRATIVE SURVEY ANALYSIS © SAIS 2014
Skills 79.99 4.25 3.40
Note that a score of 100 indicates "perfect" congruence between how much a given category is valued by the stakeholder group and how well the same group believes the school performs.
Greater than 100 means that the stakeholder group believes the school performs at a level higher than the value placed on the category.
Faculty 82.19 4.44 3.65Diversity 80.77 3.36 2.71
Passives are those who responded with a 7 or 8 to the question, "on a scale of 1 to 10, how likely are you to recommend the school?"
Passives for this group: 22.1%
0
20
40
60
80
100
120

27
PASSIVES: Individual Item Congruence
Item CONGRUENCE MEAN of IMPORTANCE
MEAN of PERFORMANCE
C&P: Faith Based 92.30 2.99 2.76 This is a list sorted by individual item congruence. Note that a score of 100 indicates "perfect" congruence between how much a given item is valued by the stakeholder group and how well the same group believes the school performs at delivering on that item.
FINE ARTS: Opportunity to Participate 91.51 3.77 3.45C&P: Academic Rigor
ATH: Variety of Offerings 95.76 3.58 3.42C&P: Travel Opportunities 94.41 2.94 2.77
ATH: Quality of Offerings 89.60 3.74 3.35CO CURRI: Variety of Offerings 88.97 3.55 3.16
FINE ARTS: Quality of Offerings 89.76 3.75 3.37FINE ARTS: Variety of Offerings 89.71 3.59 3.22
90.34 4.22 3.81ATH: Opportunity to Participate 90.22 3.86 3.48
FAC: Care and Concern 85.16 4.44 3.78CO CURRI: Quality of Offerings 84.88 3.62 3.08
SAF: Physical 87.87 4.50 3.96C&P: Preparatory (college/next level) 85.52 4.38 3.75
CO CURRI: Opportunity to Participate 88.93 3.75 3.34TECH: School-‐provided 88.44 3.76 3.32
TECH: Current 81.60 4.13 3.37SK: Teamwork 81.43 4.19 3.42
SK: Creativity 82.26 4.16 3.42TECH: Availability 82.18 4.20 3.45
82.92 4.09 3.39C&P: Global Education 82.65 3.34 2.76C&P: Variety of Course Offerings
79.99 4.42 3.53SK: Resilience 79.60 4.16 3.31
SAF: Spiritual 81.00 3.97 3.22DIV: Cultural 80.25 3.53 2.83
FAC: Subject Area Expertise 81.41 4.47 3.64SK: Ethics 81.22 4.41 3.59
C&P: Curriculum & Programming FINE ARTS: Fine Arts DIV: DiversityFAC: Faculty CO CURRI: Clubs and other Co-‐curriculars TECH: Technology
DIV: Socioeconomic 78.44 3.42 2.68SK: Time Management 76.39 4.30 3.29
SK: Curiosity 79.07 4.24 3.35SAF: Emotional 78.82 4.42 3.48
Greater than 100 means that the stakeholder group believes the school performs at a level higher than the value placed on the item; less than 100 means that the stakeholder group places a greater value on the item than the level which the school is currently performing.
DIV: Religious 83.90 3.12 2.62C&P: Character Education 83.42 4.12 3.44
FAC: Inspirational and motivating
ATH: Athletics SAF: Safety SK: Skills
Results for ALL DATA SAIS VALUE NARRATIVE SURVEY ANALYSIS © SAIS 2014
28
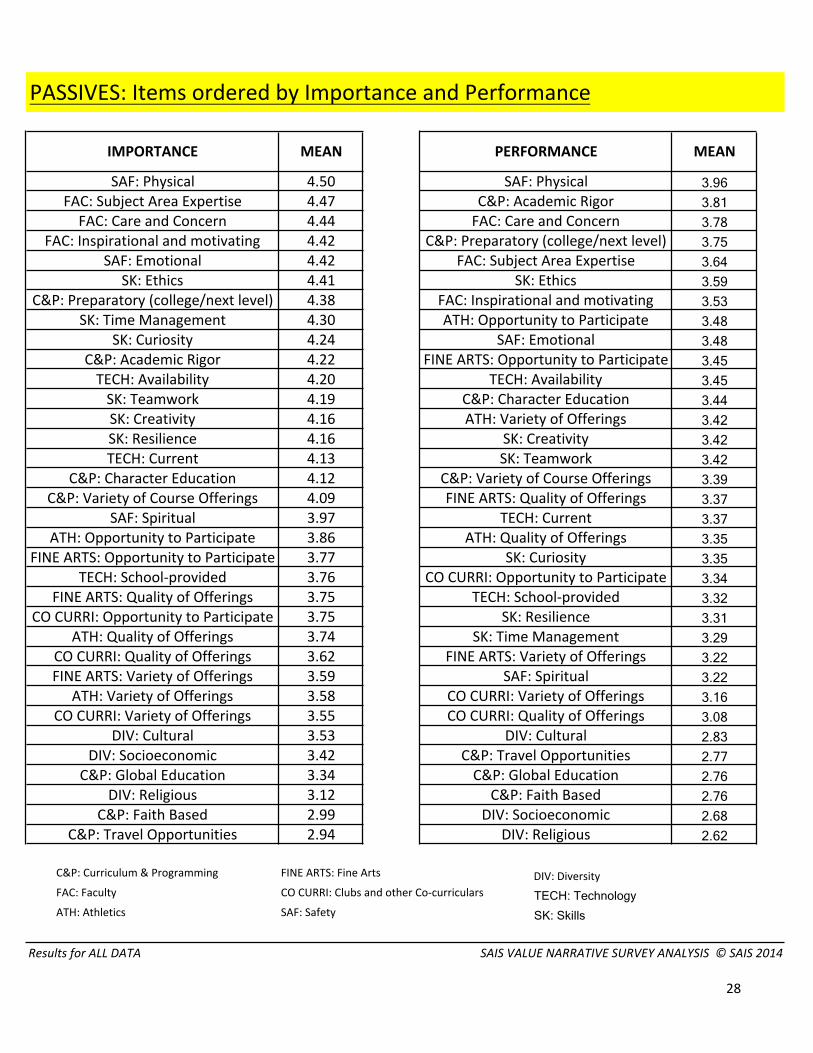
FAC: Subject Area Expertise 4.47 C&P: Academic Rigor 3.81FAC: Care and Concern 4.44 FAC: Care and Concern 3.78
IMPORTANCE MEAN PERFORMANCE MEAN
SAF: Physical 4.50 SAF: Physical 3.96
PASSIVES: Items ordered by Importance and Performance
SK: Time Management 4.30 ATH: Opportunity to Participate 3.48SK: Curiosity 4.24 SAF: Emotional 3.48
SK: Ethics 4.41 SK: Ethics 3.59C&P: Preparatory (college/next level) 4.38 FAC: Inspirational and motivating 3.53
FAC: Inspirational and motivating 4.42 C&P: Preparatory (college/next level) 3.75SAF: Emotional 4.42 FAC: Subject Area Expertise 3.64
SK: Resilience 4.16 SK: Creativity 3.42TECH: Current 4.13 SK: Teamwork 3.42
SK: Teamwork 4.19 C&P: Character Education 3.44SK: Creativity 4.16 ATH: Variety of Offerings 3.42
C&P: Academic Rigor 4.22 FINE ARTS: Opportunity to Participate 3.45TECH: Availability 4.20 TECH: Availability 3.45
FINE ARTS: Opportunity to Participate 3.77 SK: Curiosity 3.35TECH: School-‐provided 3.76 CO CURRI: Opportunity to Participate 3.34
SAF: Spiritual 3.97 TECH: Current 3.37ATH: Opportunity to Participate 3.86 ATH: Quality of Offerings 3.35
C&P: Character Education 4.12 C&P: Variety of Course Offerings 3.39C&P: Variety of Course Offerings 4.09 FINE ARTS: Quality of Offerings 3.37
FINE ARTS: Variety of Offerings 3.59 SAF: Spiritual 3.22ATH: Variety of Offerings 3.58 CO CURRI: Variety of Offerings 3.16
ATH: Quality of Offerings 3.74 SK: Time Management 3.29CO CURRI: Quality of Offerings 3.62 FINE ARTS: Variety of Offerings 3.22
FINE ARTS: Quality of Offerings 3.75 TECH: School-‐provided 3.32CO CURRI: Opportunity to Participate 3.75 SK: Resilience 3.31
DIV: Religious 3.12 C&P: Faith Based 2.76C&P: Faith Based 2.99 DIV: Socioeconomic 2.68
DIV: Socioeconomic 3.42 C&P: Travel Opportunities 2.77C&P: Global Education 3.34 C&P: Global Education 2.76
CO CURRI: Variety of Offerings 3.55 CO CURRI: Quality of Offerings 3.08DIV: Cultural 3.53 DIV: Cultural 2.83
Results for ALL DATA SAIS VALUE NARRATIVE SURVEY ANALYSIS © SAIS 2014
FAC: Faculty CO CURRI: Clubs and other Co-‐curriculars TECH: TechnologyATH: Athletics SAF: Safety SK: Skills
C&P: Travel Opportunities 2.94 DIV: Religious 2.62
C&P: Curriculum & Programming FINE ARTS: Fine Arts DIV: Diversity

29
DETRACTORS: Category Congruence
CATEGORY CONGRUENCE MEAN of IMPORTANCE
MEAN of PERFORMANCE
Curriculum & Programming 77.80 3.65 2.84Safety 74.20 4.12 3.06
Clubs and other Co-‐curriculars 80.75 3.52 2.84Technology 78.92 3.95 3.12
Athletics 85.37 3.61 3.09Fine Arts 82.42 3.60 2.96
A score below 100 means that the stakeholder group places a greater value on the category than the level which the school is currently performing.
Results for ALL DATA SAIS VALUE NARRATIVE SURVEY ANALYSIS © SAIS 2014
Skills 68.80 4.11 2.83
Note that a score of 100 indicates "perfect" congruence between how much a given category is valued by the stakeholder group and how well the same group believes the school performs.
Greater than 100 means that the stakeholder group believes the school performs at a level higher than the value placed on the category.
Diversity 71.73 3.23 2.31Faculty 70.45 4.32 3.04 12.5%
Detractors are those who responded below 7 to the question, "on a scale of 1 to 10, how likely are you to recommend the school?"
Detractors for this group:
0
20
40
60
80
100
120
30
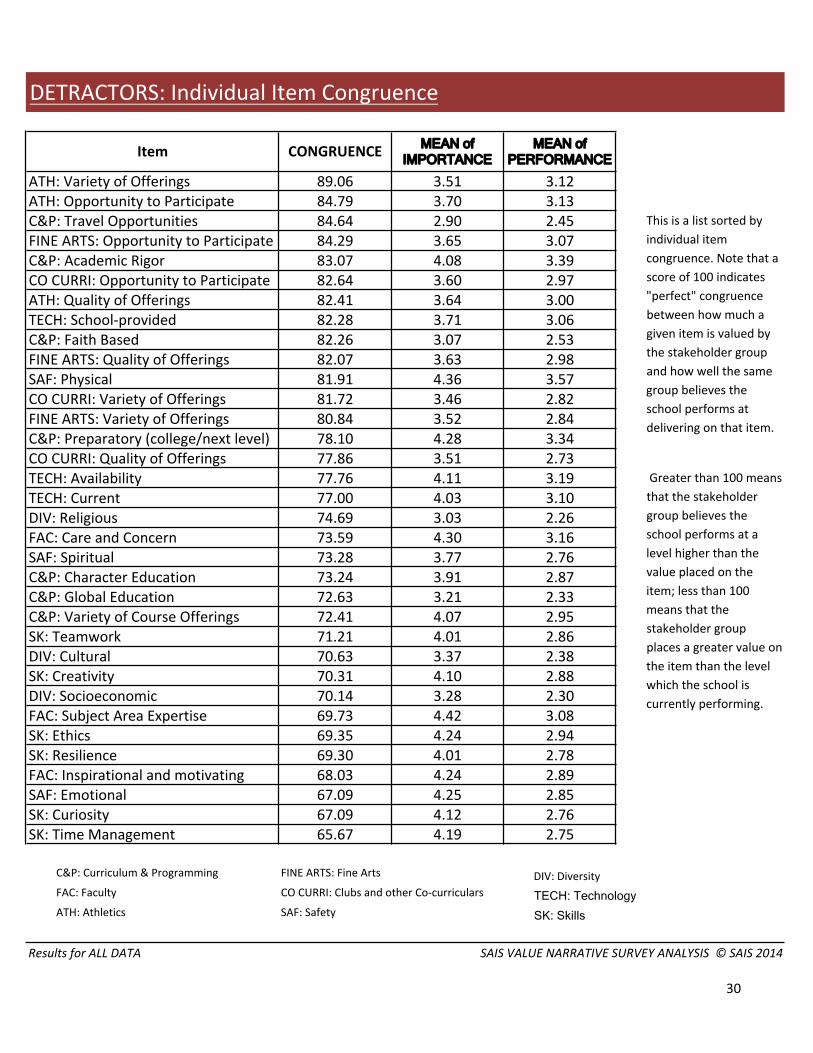
DETRACTORS: Individual Item Congruence
Item CONGRUENCE MEAN of IMPORTANCE
MEAN of PERFORMANCE
C&P: Travel Opportunities 84.64 2.90 2.45 This is a list sorted by individual item congruence. Note that a score of 100 indicates "perfect" congruence between how much a given item is valued by the stakeholder group and how well the same group believes the school performs at delivering on that item.
FINE ARTS: Opportunity to Participate 84.29 3.65 3.07C&P: Academic Rigor
ATH: Variety of Offerings 89.06 3.51 3.12ATH: Opportunity to Participate 84.79 3.70 3.13
C&P: Faith Based 82.26 3.07 2.53FINE ARTS: Quality of Offerings 82.07 3.63 2.98
ATH: Quality of Offerings 82.41 3.64 3.00TECH: School-‐provided 82.28 3.71 3.06
83.07 4.08 3.39CO CURRI: Opportunity to Participate 82.64 3.60 2.97
CO CURRI: Quality of Offerings 77.86 3.51 2.73TECH: Availability 77.76 4.11 3.19
FINE ARTS: Variety of Offerings 80.84 3.52 2.84C&P: Preparatory (college/next level) 78.10 4.28 3.34
SAF: Physical 81.91 4.36 3.57CO CURRI: Variety of Offerings 81.72 3.46 2.82
C&P: Variety of Course Offerings 72.41 4.07 2.95SK: Teamwork 71.21 4.01 2.86
C&P: Character Education 73.24 3.91 2.87C&P: Global Education 72.63 3.21 2.33
73.59 4.30 3.16SAF: Spiritual 73.28 3.77 2.76FAC: Care and Concern
69.35 4.24 2.94SK: Resilience 69.30 4.01 2.78
DIV: Socioeconomic 70.14 3.28 2.30FAC: Subject Area Expertise 69.73 4.42 3.08
DIV: Cultural 70.63 3.37 2.38SK: Creativity 70.31 4.10 2.88
C&P: Curriculum & Programming FINE ARTS: Fine Arts DIV: DiversityFAC: Faculty CO CURRI: Clubs and other Co-‐curriculars TECH: Technology
SK: Curiosity 67.09 4.12 2.76SK: Time Management 65.67 4.19 2.75
FAC: Inspirational and motivating 68.03 4.24 2.89SAF: Emotional 67.09 4.25 2.85
Greater than 100 means that the stakeholder group believes the school performs at a level higher than the value placed on the item; less than 100 means that the stakeholder group places a greater value on the item than the level which the school is currently performing.
TECH: Current 77.00 4.03 3.10DIV: Religious 74.69 3.03 2.26
SK: Ethics
ATH: Athletics SAF: Safety SK: Skills
Results for ALL DATA SAIS VALUE NARRATIVE SURVEY ANALYSIS © SAIS 2014

31
SAF: Physical 4.36 C&P: Academic Rigor 3.39FAC: Care and Concern 4.30 C&P: Preparatory (college/next level) 3.34
IMPORTANCE MEAN PERFORMANCE MEAN
FAC: Subject Area Expertise 4.42 SAF: Physical 3.57
DETRACTORS: Items ordered by Importance and Performance
SK: Time Management 4.19 TECH: Current 3.10SK: Curiosity 4.12 FAC: Subject Area Expertise 3.08
FAC: Inspirational and motivating 4.24 ATH: Opportunity to Participate 3.13SK: Ethics 4.24 ATH: Variety of Offerings 3.12
C&P: Preparatory (college/next level) 4.28 TECH: Availability 3.19SAF: Emotional 4.25 FAC: Care and Concern 3.16
TECH: Current 4.03 CO CURRI: Opportunity to Participate 2.97SK: Teamwork 4.01 C&P: Variety of Course Offerings 2.95
C&P: Academic Rigor 4.08 ATH: Quality of Offerings 3.00C&P: Variety of Course Offerings 4.07 FINE ARTS: Quality of Offerings 2.98
TECH: Availability 4.11 FINE ARTS: Opportunity to Participate 3.07SK: Creativity 4.10 TECH: School-‐provided 3.06
ATH: Opportunity to Participate 3.70 SK: Teamwork 2.86FINE ARTS: Opportunity to Participate 3.65 SAF: Emotional 2.85
SAF: Spiritual 3.77 SK: Creativity 2.88TECH: School-‐provided 3.71 C&P: Character Education 2.87
SK: Resilience 4.01 SK: Ethics 2.94C&P: Character Education 3.91 FAC: Inspirational and motivating 2.89
CO CURRI: Quality of Offerings 3.51 SAF: Spiritual 2.76ATH: Variety of Offerings 3.51 SK: Time Management 2.75
CO CURRI: Opportunity to Participate 3.60 SK: Resilience 2.78FINE ARTS: Variety of Offerings 3.52 SK: Curiosity 2.76
ATH: Quality of Offerings 3.64 FINE ARTS: Variety of Offerings 2.84FINE ARTS: Quality of Offerings 3.63 CO CURRI: Variety of Offerings 2.82
2.30
DIV: Socioeconomic 3.28 C&P: Travel Opportunities 2.45C&P: Global Education 3.21 DIV: Cultural 2.38
CO CURRI: Variety of Offerings 3.46 CO CURRI: Quality of Offerings 2.73DIV: Cultural 3.37 C&P: Faith Based 2.53
Results for ALL DATA SAIS VALUE NARRATIVE SURVEY ANALYSIS © SAIS 2014
FAC: Faculty CO CURRI: Clubs and other Co-‐curriculars TECH: TechnologyATH: Athletics SAF: Safety SK: Skills
C&P: Travel Opportunities 2.90 DIV: Religious 2.26
C&P: Curriculum & Programming FINE ARTS: Fine Arts DIV: Diversity
C&P: Faith Based 3.07 C&P: Global Education 2.33DIV: Religious 3.03 DIV: Socioeconomic