value's x-ray market research for technology vision co
TRANSCRIPT

1

2
INDEX i) Introduction…………………………………………………………. 4
ii) Abbreviation Letters……………………………………………. 4
1. General Market Analysis
1.1. Economical Market Growth……………………………5
1.2 Industrial Market Growth ..…………………………….7
1.3. X.RAY apparatus Market Growth…………………..9
2.Customer Analysis
i) Market Share of XRF……..…………………………………………10
ii) Export Volume 2013 for all Sectors…………………………11
2.1Construction and Building industries
2.1.1 Cement………………………………………………14
2.1.2 Gypsum……………………………………………..16
2.1.3 Iron & Steel………………………………………..17
2.1.4 Ceramic & Sanitary Ware…………………..18
2.1.5 Glass…………………………………………………..20

3
2.2 Oil & Petrol industries
2.2.1 Petrol & Petrochemicals……………………21
2.2.2 Fertilizers…………………………………….......22
2.3 Metal Industries
2.3.1 Machining of Metals………………………...23
2.3.2 Metals……………………………………………….24
2.3.3 Cables………………………………………….......25
2.3.4 Intermediate Goods………………………....26
2.3.5 Equipments and Transportation……….27
2.3.6 Ships & Boats…………………………………...28
2.4 Research & Development…………………………….29
3.Competitor Analysis
3.1 No. Of Apparatus for each competitor……….30
3.2 Market Volume For Competitors' Origin…….31

4
i) Introduction :
In this XRF market study we aimed our focus on the following marketing and economical areas:- 1- Egyptian general economic atmosphere and equations. 2- The reality of the industrial sector growth in Egypt. 3- Overview of XRF market volume in Egypt in the last ten years. 4- Present and analyze the market share of every targeted sector using XRF. 5- Develop a relative estimation for the different sectors using XRF. 6- Analyze the sectors that use XRF and have the most export potential in the next few years. 7-.Aiming to Offer a thorough study of the market, customer and competitors. Tools and methodology of this study. 1. Quantitative methodology. 1.1 Gathering, processing, combining and analyzing the official quantitative data for the market, different sectors and competitors. 1.2 Collecting only authenticated data. 2. Qualitative methodology. 2.1 Using statistical data to reach the right conclusion. Support the reader of this market research with non exaggerated forecasting. We depend on organizing the quantitative data to help the reader reach conclusion, nothing is more real than numbers.
ii) Abbreviation Letters Here is some of letters that will be shown in this report and what they stand for :
Letters Stands For
M$ Million Dollars
EGP Egyptian Pounds
U.D Undefined
Q Yearly Quarter
SCAF Military Council of Egypt
GDP Gross domestic product

5
1.General Market Analysis
As the Egyptian Market is going through many ups and downs,
in this part of the Study we are showing and discussing the whole
Egyptian economic growth conditions, and mainly the industrial
sector's growth.
1.1. Economical Market Growth
As all economic experts know since Q1 2011 - the Egyptian revolution
- the Egyptian market has suffered a large and fast decreasing rates
due to many factors that will be repeated after every dramatic
political event. Some of these factors are:-
1. The suspensions of many governmental tenders and contracts.
2. Security problems and political conflicts.
3. Vague and unclear political atmosphere leading to downsizing
of foreign capitals.
4. Social bad mode covers all the economical chain from (business
people to consumers).
2010-2011 2011-2012 2012-2013
-6
-4
-2
0
2
4
6
8
Q3 2010
Q4 2010
Q1 2011
Q2 2011
Q3 2011
Q4 2011
Q1 2012
Q2 2012
Q3 2012
Q4 2012
Q1 2013
Q2 2013
Q3 2013
6.75.6
-4.2
0.4 0.7 0.4
5.2
3.32.6 2.2 2.2
1.51
M$
Economical Growth in Egypt ( Per ) Quarter ( Q=3 Months )

6
Overview :
What clearly appears is that any dramatic event affects the
economic growth in three stages, these stages are:-:
o Firstly, we have the critical dramatic point: uncertainty about
the (upcoming or current) regime results in enormous
decreasing in economical growth rate.
Example 1: Quarter 1 2011 “the falling of Mubarak’s Regime
and its substitution with SCAF regime".
Example 2: Quarter 2 2012 the beginning of the unclear view
of the political future of Egypt
o Secondly, a decaying period: about 2 to 3 Quarters the
economy suffers the chaotic behaviors and closing of many
business activities.
Example : Q2 and Q3 2012
o Finally , The economical Adaptation Period
Example : Q4 2012 a stable phase
Key Indications :
o The Egyptian economic in this political instability period in
every political critical point goes through three stages :
1. Critical dramatic point
2. Decaying period
3. Economical adaptation
7
1.General Market Analysis
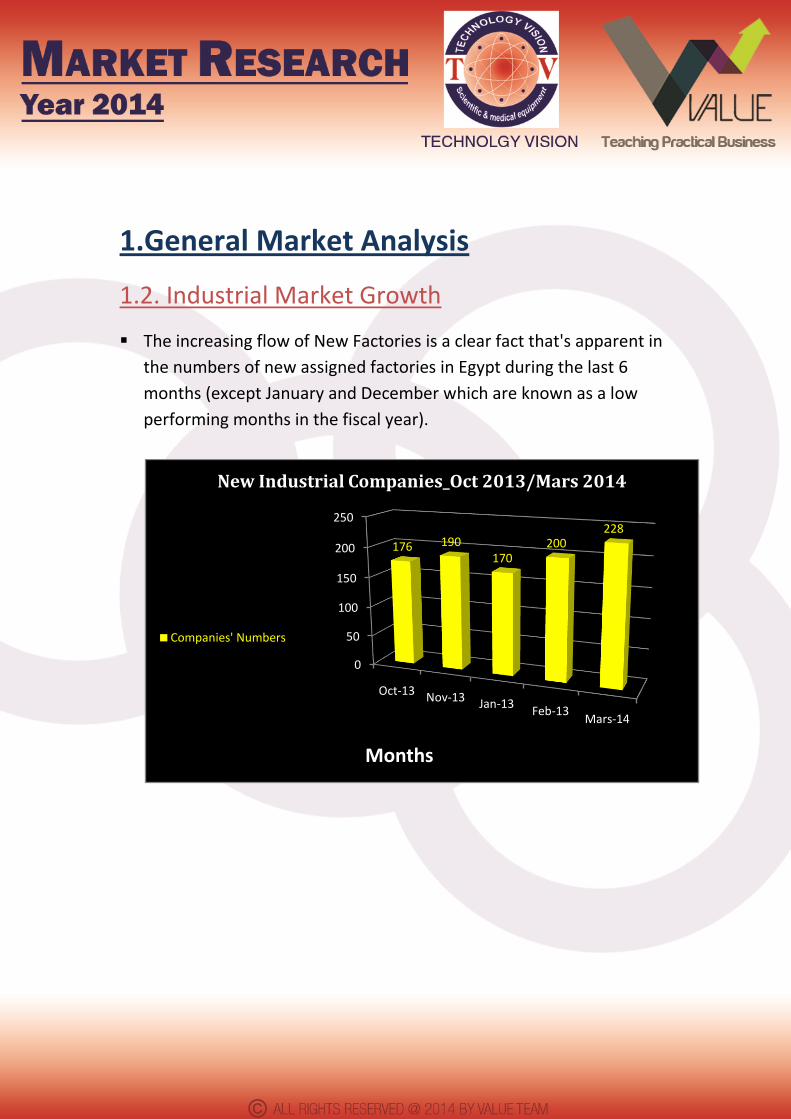
1.2. Industrial Market Growth
The increasing flow of New Factories is a clear fact that's apparent in
the numbers of new assigned factories in Egypt during the last 6
months (except January and December which are known as a low
performing months in the fiscal year).
0
50
100
150
200
250
Oct-13 Nov-13 Jan-13Feb-13
Mars-14
176 190170
200228
Months
New Industrial Companies_Oct 2013/Mars 2014
Companies' Numbers

8
Also The Capital flow increases from (275 M EGP) in Oct 2013 to (364
M EGP) in Mar 2014 including the low performing months (Dec and
Jan).
This uniform Market stretching despite of the political instability
results from two main reasons :
1. The gap caused by the closure of many industrial business that
couldn’t face the (decaying phase we have just mentioned) is
being filled.
2. The starting of new adaptation period.
050
100150200250300350400450
275.2
395.1
201.6
419.9
364.2
Months
New Capital_Oct 2013/Mars 2014
Share Capital ( Million EGP )

9
1.General Market Analysis
1.3. X.RAY apparatus Market Growth
Please note that XRF is 35 % – 40 % of the total X-Ray market
0
10000000
20000000
30000000
40000000
50000000
60000000
70000000
80000000
90000000
2005 2006 2007 2008 2009 2010 2011 2012 2013
30,127,959
39,654,218
29,161,082
82,030,061
63,382,698
48,187,498
86,191,542
55,290,763
51,616,392
EGP

10
2.Customer Analysis
i) Market Share of XRF Customers 2013 calculated
through ( Production + Earnings )
Sector Market Share % Cement 4.75% Iron & Steel 8.23%
Petrol & Petrochemicals 67.36%
Glass 0.43% Machining of Metals 0.14%
Cables 0.44% Tools , Equipments and Transportation 2.33%
Ships & Boats 0.12% Metals 10.50%
Fertilizers 3.70%
Gypsum 0.10% Ceramic & Sanitary Ware 1.90%
Cement Iron & Steel
Petrol & Petrochemicals Glass
Machining of Metals Cables
Tools , Equipments and Transportation Ships & Boats
Metals Fertilizers
Gypsum Ceramic & Sanitary Ware

11
ii) Export Volume 2013 for all Sectors
Sector Export Volume % Cement 00.15%
Iron & Steel 01.85% Petrol & Petrochemicals 87.00%
Glass 01.40% Machining of Metals 00.04%
Cables 01.70%
Tools , Equipments and Transportation 00.69% Ships & Boats 00.01%
Metals 02.90% Fertilizers 02.24%
Gypsum 00.01%
Ceramic & Sanitary Ware 01.00%
Cement Iron & Steel
Petrol & Petrochemicals Glass
Machining of Metals Cables
Tools , Equipments and Transportation Ships & Boats
Metals Fertilizers
Gypsum Ceramic & Sanitary Ware

12
2.1Construction and Building
As shown below The black horse of Egypt’s Market Sectors is the
construction and building sector appears in its market growth
remaining in the most difficult years (+.3% for 2010/2011) also it
exceeded the general economical market growth itself (+5.9% 2013)
This data indicates how much this sector is expanding regardless the
political issues we can see it in the flow of capital in this sector
( exceeds 500 MEGP in Mar 2014)
0
20
40
60
80
100
120
140
Oct-13 Nov-13 Jan-13Feb-13
Mars-14
73 81 81
118133
Months
New Construction & Building CompaniesOct 2013/Mars 2014
Companies' Numbers
13
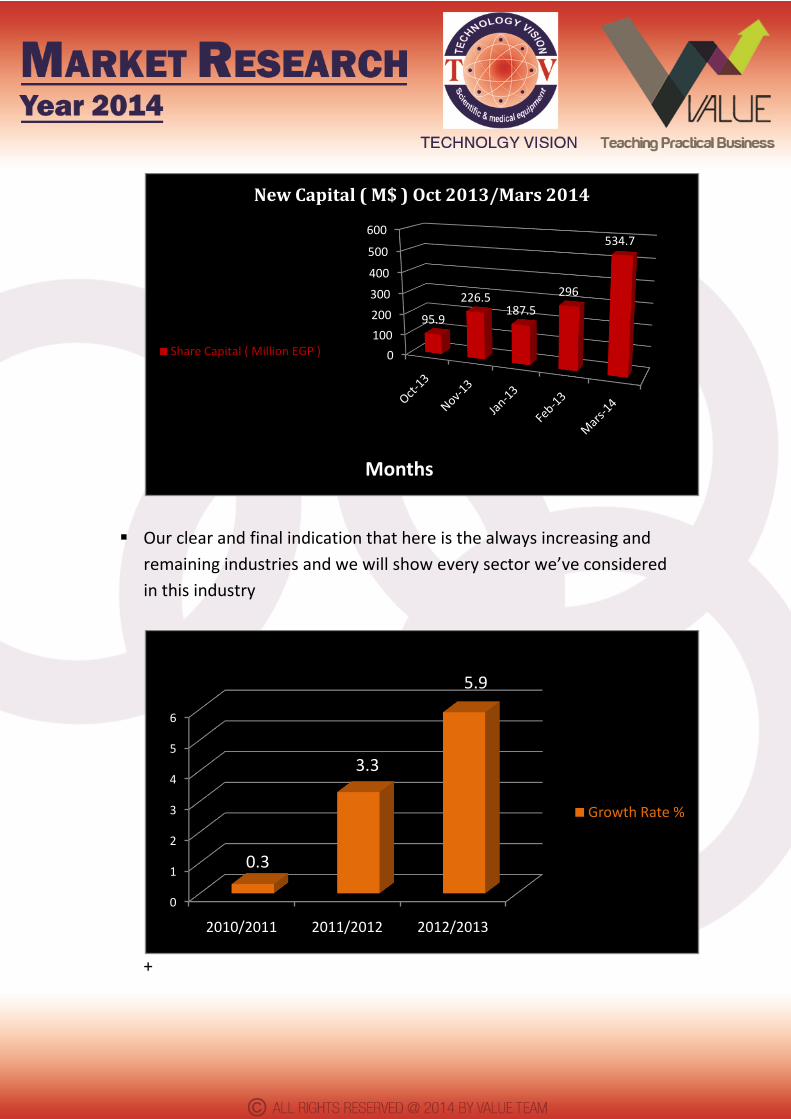
Our clear and final indication that here is the always increasing and
remaining industries and we will show every sector we’ve considered
in this industry
+
0
100
200
300
400
500
600
95.9
226.5187.5
296
534.7
Months
New Capital ( M$ ) Oct 2013/Mars 2014
Share Capital ( Million EGP )
0
1
2
3
4
5
6
2010/2011 2011/2012 2012/2013
0.3
3.3
5.9
Construction & Building Trade Volume/Year
Growth Rate %

14
2.1Construction and Building
2.1.1 Cement
No. of Factories 22 Market Share (Production + Earnings) (EGP) 24,000,000,000 Market Share (Production + Earnings) % 04.75%
Last Export 2013 (M$) 70 Last Export 2013 % 00.15 % X.R.F Market Share % 07.89 %
The Second Contributing Industrial Sector in the GDP after the
petroleum industries it’s one of the most promising industries now
and the next years
As appeared from 2012 a decay in cement exports (100 M$ for 2012
– 70 M$ for 2013) because of the enormous increasing in growth rate
of construction and building sector (5.9% for 2012) as the local
market demand covered the majority of production Capacity.
0
20
40
60
80
100
20102011
20122013
55
84
100
70
M$
Years
(Cement ) Export Volume_Annual (2010/2013)

15
Key Customers
Building Materials Industries Company (BMIC) Assiut Cement Company Arabian Cement Company ( ACC ) Amreyah Cement Company Qena Cement Company ( MCQE ) ALEXANDRIA PORTLAND CEMENT (TITAN) El-Nahda Cement Company Wadi El Nile Cement Company LAFARGE CEMENT EGYPT MEDCOM - Aswan Cement Sinai White Portland Cement Co. Sinai Cement Company (SCEM) National Cement Company - Helwan Helwan Cement Company (HCC Misr Beni Suef Cement Co (MBSC) SEWEDY CEMENT Company Suez Cement Company South Valley Cement (SVCE) Royal El Minya Cement Co. Tourah Portland Cement (TORA) El Arish Cement. Company
Promising opportunities
The government decided releasing 12 new cement factories license
very soon Covering the (demand – production) Gap
The Emirates Construction Company (Arabtech) announced the
Million unit Construction project putting a condition for Cement
factories that it will import Cement if there’s no new factories
support it.

16
2.1Construction and Building
2.1.2 Gypsum
Facts We import more than 80 % of its manufacturing components
Factories are facing some difficult times
The quality isn't good enough to help export it
The product doesn't meet the expectation of the Egyptian
market
No. of Factories 24
Market Share (Production + Earnings) (EGP) 750,000,000
Market Share (Production + Earnings) % 0.10 % Last Export 2013 (M$) 5.5
Last Export 2013 % 0.01 % X.R.F Market Share % U.D
Key Customers
Egyptian Gypsum Company
National Cement Company - Helwan
ALEXANDRIA PORTLAND CEMENT (TITAN)
Isoblock Swiss
17
2.1Construction and Building
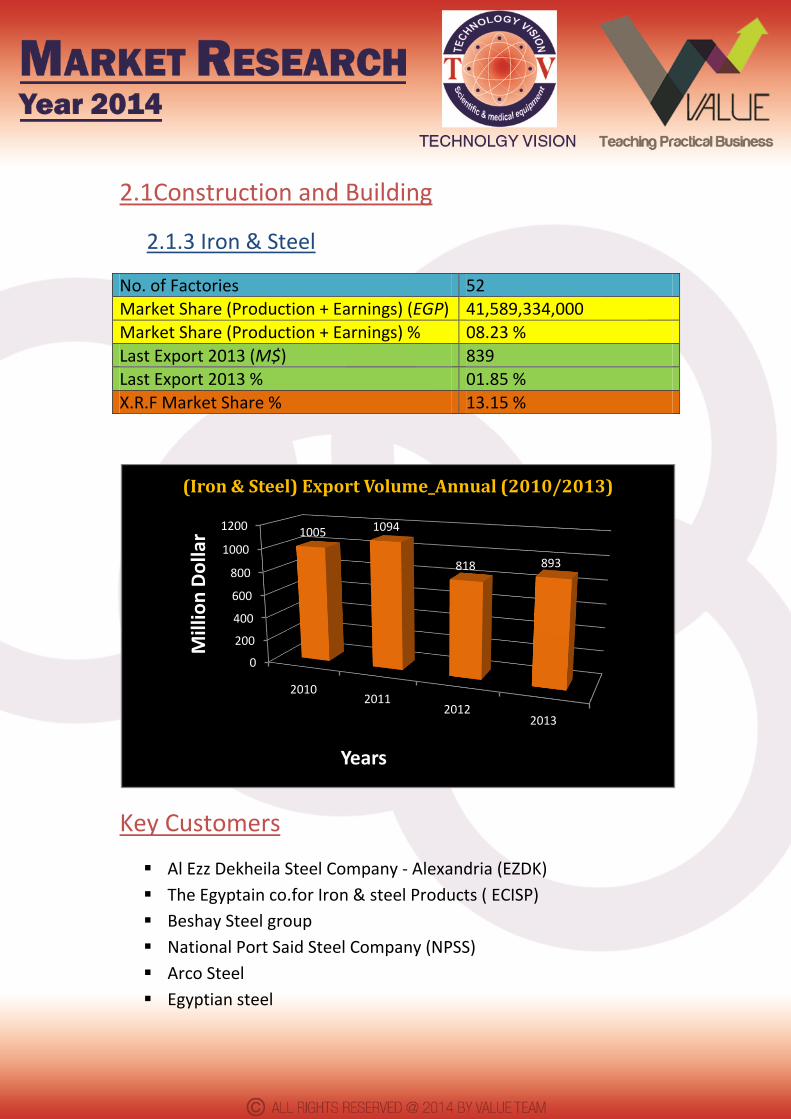
2.1.3 Iron & Steel
No. of Factories 52 Market Share (Production + Earnings) (EGP) 41,589,334,000 Market Share (Production + Earnings) % 08.23 %
Last Export 2013 (M$) 839 Last Export 2013 % 01.85 % X.R.F Market Share % 13.15 %
Key Customers
Al Ezz Dekheila Steel Company - Alexandria (EZDK)
The Egyptain co.for Iron & steel Products ( ECISP)
Beshay Steel group
National Port Said Steel Company (NPSS)
Arco Steel
Egyptian steel
0
200
400
600
800
1000
1200
20102011
20122013
1005 1094
818 893
Mill
ion
Do
llar
Years
(Iron & Steel) Export Volume_Annual (2010/2013)

18
2.1Construction and Building
2.1.4 Ceramic & Sanitary Ware
No. of Factories 37 Market Share (Production + Earnings) (EGP) 10,000,000,000
Market Share (Production + Earnings) % 01.90 % Last Export 2013 (M$) 466 Last Export 2013 % 01.00 % X.R.F Market Share % U.D
0
100
200
300
400
20102011
20122013
260
208
398
361
Mill
ion
Do
llar
Years
(Ceramic) Export Volume_Annual (2010/2013)

19
Key Customers
Royal Ceramica
Cleopatra Ceramics
EL GAWHARA FOR CERAMIC AND PORCELAIN
ALFA Ceramic
Rock Ceramic
Ideal Standard Sanitary Ware
Roka Sanitary Ware
Duravit Sanitary Ware
0
20
40
60
80
100
120
20102011
20122013
86
72
95 105
Mill
ion
Do
llar
Years
(Sanitary Ware) Export Volume_Annual (2010/2013)

20
2.1Construction and Building
2.1.5 Glass
No. of Factories 41 Market Share (Production + Earnings) (EGP) 2,204,258,000 Market Share (Production + Earnings) % 00.43 %
Last Export 2013 (M$) 502 Last Export 2013 % 01.10 % X.R.F Market Share % 02.60 %
Key Customers
Dr.Greiche ( Glass Products )
El Asfour Crystal International
Obour For Glass Technology
Pearl Glass Group
0
100
200
300
400
500
600
700
20102011
20122013
663 657 654
502
Mill
ion
Do
llar
Years
(Glass) Export Volume_Annual (2010/2013)

21
2.2 Oil & Petrol Products
2.2.1 Petrol & Petrochemicals
No. of Factories 63 Market Share (Production + Earnings) (EGP) 340,136,160,000
Market Share (Production + Earnings) % 67.31 %
Last Export 2013 (M$) 39, 480 Last Export 2013 % 87.00 %
X.R.F Market Share % 15.70 %
Key Customers
The Egyptian Petrochemicals Holding Company (ECHEM)
Sidpec - Sidi Kerir Petrochemicals
ASORC - Assiut Oil Refining Co
Ganoub El-Wadi Petroleum Holding Company (GANOPE)
Cairo Oil Refining Company CORC
Engineering for the petroleum and process industries. (Enppi)

22
2.2 Petrol & Petrochemicals
2.2.2 Fertilizers
No. of Factories 86 Market Share (Production + Earnings) (EGP) 18,778,160,000
Market Share (Production + Earnings) % 03.07 %
Last Export 2013 (M$) 973 Last Export 2013 % 02.14 %
X.R.F Market Share % U.D
Key Customers
Misr Fertilizers Production Company (MOPCO)
The National Company for Fertilizers & Chemicals (AGROCHEM
Suez Company For Fertilizer Production
Abu Zaabal Fertilizer and Chemical Factory
Abu Qir Fertilizers and Chemicals Company (AFC)
0
200
400
600
800
1000
1200
1400
20102011
20122013
10051209 1207
973
Mill
ion
Do
llar
Years
(Fertlizers) Export Volume_Annual (2010/2013)

23
2.3 Metal Industries
2.3.1 Machining of Metals
No. of Factories 14 Market Share (Production + Earnings) (EGP) 728,236,000
Market Share (Production + Earnings) % 00.14 %
Last Export 2013 (M$) 20 Last Export 2013 % 00.04 %
X.R.F Market Share % 10.50 %
0
20
40
60
80
20102011
20122013
35
52
79
20
Mill
ion
Do
llar
Years
(Machining of Metals) Export Volume_Annual (2010/2013)

24
2.3 Metal Industries
2.3.2 Metals
No. of Factories 852 Market Share (Production + Earnings) (EGP) 53,126,422,000
Market Share (Production + Earnings) % 10.50 %
Last Export 2013 (M$) 1,375 Last Export 2013 % 2.90 %
X.R.F Market Share % U.D
0
500
1000
1500
2000
20102011
20122013
1574 17161694
1357
Mill
ion
Do
llar
Years
(Metals) Export Volume_Annual (2010/2013)

25
2.3 Metal Industries
2.3.3 Cables
No. of Factories 19 Market Share (Production + Earnings) (EGP) 2,256,400,000
Market Share (Production + Earnings) % 00.44 %
Last Export 2013 (M$) 782 Last Export 2013 % 1.70 %
X.R.F Market Share % 5.20 %
Key Customers
El Sewedy Cables
Schneider Electric
Abb Power Systems & Automation Technology
0
200
400
600
800
1000
1200
20102011
20122013
9911114
937
782
Mill
ion
Do
llar
Years
(Cables) Export Volume_Annual (2010/2013)

26
2.3 Metal Industries
2.3.4 Intermediate Goods
No. of Factories 308 Market Share (Production + Earnings) (EGP) U.D
Market Share (Production + Earnings) % U.D
Last Export 2013 (M$) 492 Last Export 2013 % 1.00 %
X.R.F Market Share % 5.20 %
Key Customers
Hamenz German Technological Industries
Egyptian Automotive & Trading Co.
interbus company
EL-Wahab Group
0
100
200
300
400
500
600
20102011
20122013
392472
577
492
Mill
ion
Do
llar
Years
(Intermediate Goods) Export Volume_Annual (2010/2013)
27
2.3 Metal Industries
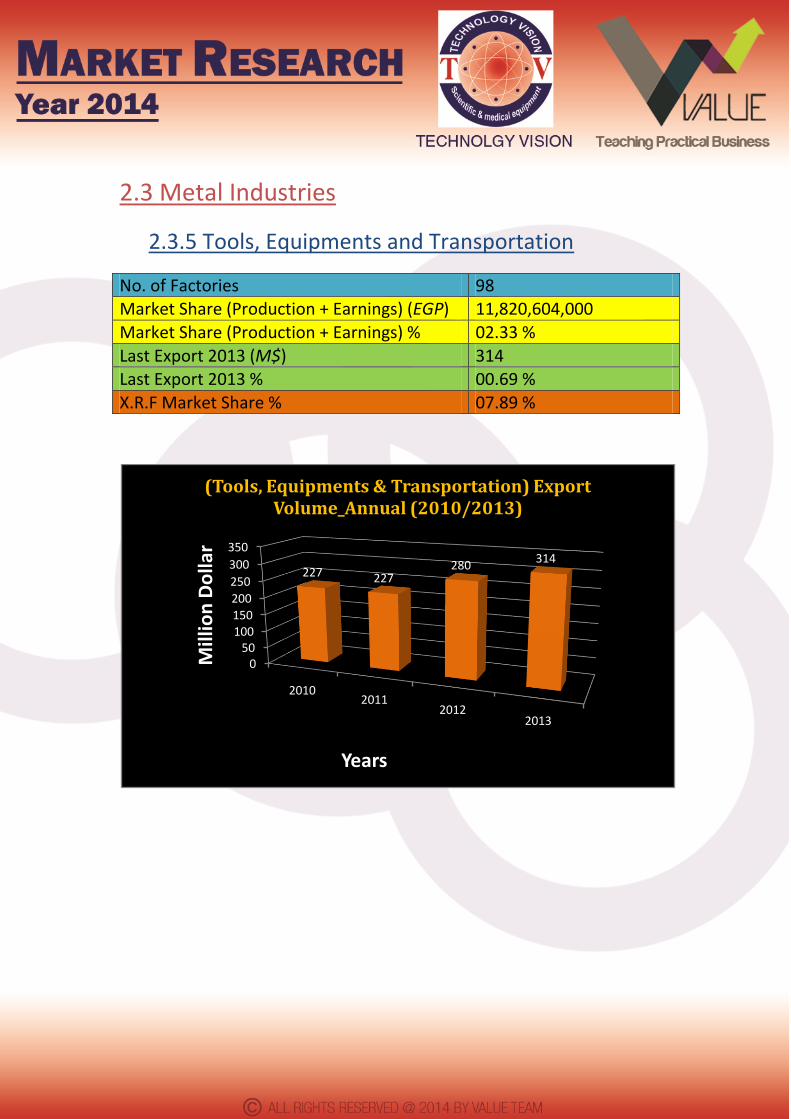
2.3.5 Tools, Equipments and Transportation
No. of Factories 98 Market Share (Production + Earnings) (EGP) 11,820,604,000
Market Share (Production + Earnings) % 02.33 %
Last Export 2013 (M$) 314 Last Export 2013 % 00.69 %
X.R.F Market Share % 07.89 %
050
100150
200
250
300
350
20102011
20122013
227 227280
314
Mill
ion
Do
llar
Years
(Tools, Equipments & Transportation) Export Volume_Annual (2010/2013)
28
2.3 Metal Industries
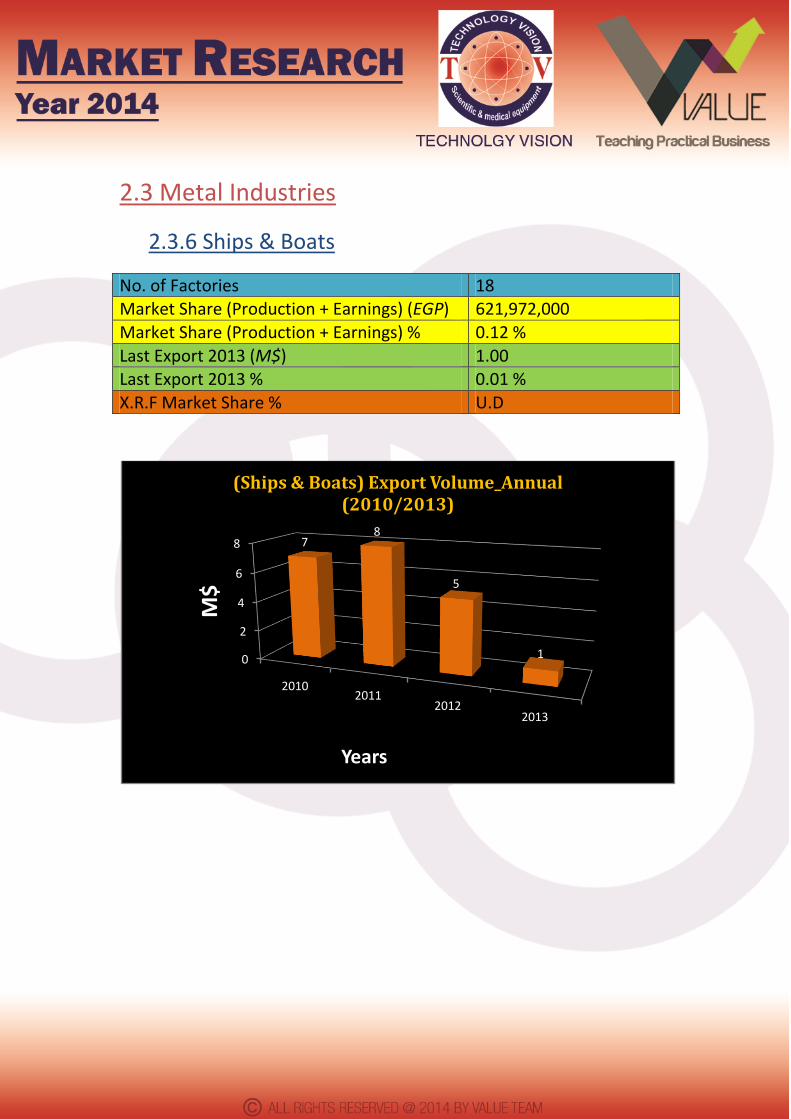
2.3.6 Ships & Boats
No. of Factories 18 Market Share (Production + Earnings) (EGP) 621,972,000
Market Share (Production + Earnings) % 0.12 %
Last Export 2013 (M$) 1.00 Last Export 2013 % 0.01 %
X.R.F Market Share % U.D
0
2
4
6
8
20102011
20122013
78
5
1
M$
Years
(Ships & Boats) Export Volume_Annual (2010/2013)

29
2.4 Research & Development
Total No. of Facilities 132
Sector No. X.R.F Market Share % Research Sectors and Institutes 53 41.40% Engineering 37 28.90% Science 18 14.00% Agriculture 20 15.60%
41.40%
28.90%
14.00%
15.60%
Research Sectors and Institutes
Engineering
Science
Agriculture

30
3.Competitor Analysis
3.1 No. Of Apparatus for each competitor in 2013
Country Company Name No. Of Apparatus
USA Thermo Arl 3 to 6
Germany Bruker 3 to 5
Netherlands Panalytical 2 to 3
Japan Japanese Brands Maximum 2
China China Brandes Maximum 2
3.2 Market Volume For Competitors' Origin ( X-ray
in general )
Country Market Volume 2013
( Categorized By Origin) EGP
USA 29.94 %
Germany 27.44 %
Netherlands 09.90 %
Japan 04.00 %
China 02.70 %

31
3.3 Market Volume For Competitors' Origin ( X-ray
in general )
Total Import Volume ( EGP )
America Germany Netherlands Japan China
2010 9197121.97 3621501.84 10908475 3027752 503872
2011 8416829.8 10081604.35 9362032 5950500 858365
2012 9256803.95 18606945.47 8046224 1785046 3550485
2013 15457573 14165013.16 5157967.75 2094708 1444841
0
5000000
10000000
15000000
20000000
25000000
30000000
35000000
40000000
45000000
2010 2011 2012 2013
EGP
China
Japan
Netherlands
Germany
America

32