vanguard ftse international index funds semiannual report april
TRANSCRIPT
Vanguard FTSE International Index Funds
Vanguard FTSE All-World ex-US Index Fund
Vanguard FTSE All-World ex-US Small-Cap Index Fund
Semiannual Report | April 30, 2017
Contents
Please note: The opinions expressed in this report are just that—informed opinions. They should not be considered promises or advice.Also, please keep in mind that the information and opinions cover the period through the date on the front of this report. Of course, therisks of investing in your fund are spelled out in the prospectus.
See the Glossary for definitions of investment terms used in this report.About the cover: No matter what language you speak, Vanguard has one consistent message and set of principles. Our primary focus is on you, our clients. We conduct our business with integrity as a faithful steward of your assets. This message is showntranslated into seven languages, reflecting our expanding global presence.
A new format, unwavering commitment
As you begin reading this report, you’ll notice that we’ve made some improvementsto the opening sections—based on feedback from you, our clients.
Page 1 starts with a new ”Your Fund’s Performance at a Glance,” a concise, handysummary of how your fund performed during the period.
In the renamed ”Chairman’s Perspective,” Bill McNabb will focus on enduringprinciples and investment insights.
We’ve modified some tables, and eliminated some redundancy, but we haven’tremoved any information.
At Vanguard, we’re always looking for better ways to communicate and to help youmake sound investment decisions. Thank you for entrusting your assets to us.
Your Fund’s Performance at a Glance. . . . . . . . . . . . . . . . . . 1
Chairman’s Perspective. . . . . . . . . . . . . . . . . . . . . . . . . . . . . 3
FTSE All-World ex-US Index Fund. . . . . . . . . . . . . . . . . . . . . 7
FTSE All-World ex-US Small-Cap Index Fund. . . . . . . . . . . . 33
About Your Fund’s Expenses. . . . . . . . . . . . . . . . . . . . . . . . 54
Trustees Approve Advisory Arrangements. . . . . . . . . . . . . .56
Glossary. . . . . . . . . . . . . . . . . . . . . . . . . . . . . . . . . . . . . . . . 58
Your Fund’s Performance at a Glance
1
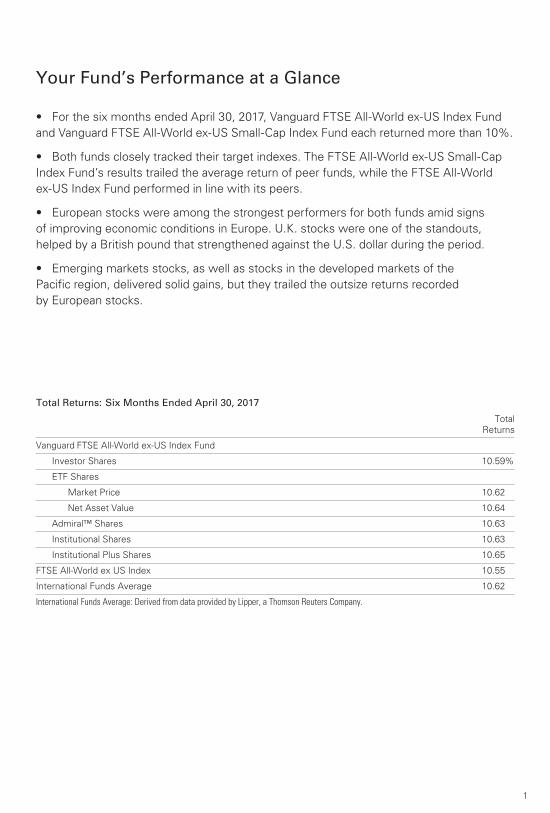
Total Returns: Six Months Ended April 30, 2017
TotalReturns
Vanguard FTSE All-World ex-US Index Fund
Investor Shares 10.59%
ETF Shares
Market Price 10.62
Net Asset Value 10.64
Admiral™ Shares 10.63
Institutional Shares 10.63
Institutional Plus Shares 10.65
FTSE All-World ex US Index 10.55
International Funds Average 10.62
International Funds Average: Derived from data provided by Lipper, a Thomson Reuters Company.
• For the six months ended April 30, 2017, Vanguard FTSE All-World ex-US Index Fund
and Vanguard FTSE All-World ex-US Small-Cap Index Fund each returned more than 10%.
• Both funds closely tracked their target indexes. The FTSE All-World ex-US Small-Cap
Index Fund’s results trailed the average return of peer funds, while the FTSE All-World
ex-US Index Fund performed in line with its peers.
• European stocks were among the strongest performers for both funds amid signs
of improving economic conditions in Europe. U.K. stocks were one of the standouts,
helped by a British pound that strengthened against the U.S. dollar during the period.
• Emerging markets stocks, as well as stocks in the developed markets of the
Pacific region, delivered solid gains, but they trailed the outsize returns recorded
by European stocks.
2
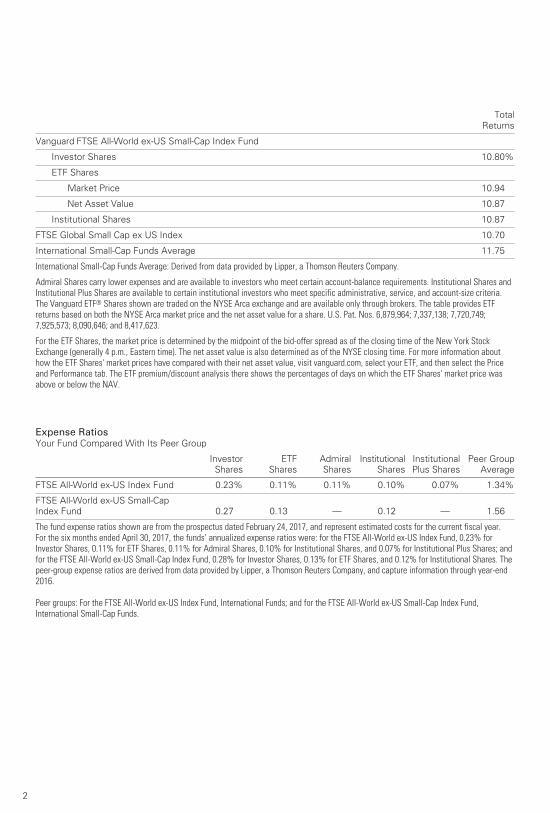
TotalReturns
Vanguard FTSE All-World ex-US Small-Cap Index Fund
Investor Shares 10.80%
ETF Shares
Market Price 10.94
Net Asset Value 10.87
Institutional Shares 10.87
FTSE Global Small Cap ex US Index 10.70
International Small-Cap Funds Average 11.75
International Small-Cap Funds Average: Derived from data provided by Lipper, a Thomson Reuters Company.
Admiral Shares carry lower expenses and are available to investors who meet certain account-balance requirements. Institutional Shares andInstitutional Plus Shares are available to certain institutional investors who meet specific administrative, service, and account-size criteria.The Vanguard ETF® Shares shown are traded on the NYSE Arca exchange and are available only through brokers. The table provides ETFreturns based on both the NYSE Arca market price and the net asset value for a share. U.S. Pat. Nos. 6,879,964; 7,337,138; 7,720,749;7,925,573; 8,090,646; and 8,417,623.
For the ETF Shares, the market price is determined by the midpoint of the bid-offer spread as of the closing time of the New York Stock Exchange (generally 4 p.m., Eastern time). The net asset value is also determined as of the NYSE closing time. For more information about how the ETF Shares' market prices have compared with their net asset value, visit vanguard.com, select your ETF, and then select the Price and Performance tab. The ETF premium/discount analysis there shows the percentages of days on which the ETF Shares' market price was above or below the NAV.
Expense RatiosYour Fund Compared With Its Peer Group
Investor
Shares
ETF
Shares
Admiral
Shares
Institutional
Shares
Institutional
Plus Shares
Peer Group
Average
FTSE All-World ex-US Index Fund 0.23% 0.11% 0.11% 0.10% 0.07% 1.34%
FTSE All-World ex-US Small-Cap
Index Fund 0.27 0.13 — 0.12 — 1.56
The fund expense ratios shown are from the prospectus dated February 24, 2017, and represent estimated costs for the current fiscal year.For the six months ended April 30, 2017, the funds’ annualized expense ratios were: for the FTSE All-World ex-US Index Fund, 0.23% forInvestor Shares, 0.11% for ETF Shares, 0.11% for Admiral Shares, 0.10% for Institutional Shares, and 0.07% for Institutional Plus Shares; andfor the FTSE All-World ex-US Small-Cap Index Fund, 0.28% for Investor Shares, 0.13% for ETF Shares, and 0.12% for Institutional Shares. Thepeer-group expense ratios are derived from data provided by Lipper, a Thomson Reuters Company, and capture information through year-end2016.
Peer groups: For the FTSE All-World ex-US Index Fund, International Funds; and for the FTSE All-World ex-US Small-Cap Index Fund,International Small-Cap Funds.
Dear Shareholder,
“Buy what you know.”
It’s one of the adages of investing, and it
has plenty of intuitive appeal. After all, the
familiar seems inherently less risky. It’s
no wonder that many investors heavily
tilt their portfolios toward the stocks and
bonds of their home country. This is known
in investing parlance as “home bias.”
U.S. investors sometimes think they
can get all the global diversification they
need by owning shares of U.S.-based
multinational companies. And that may
seem like the best of both worlds:
international diversification without ever
leaving the friendly confines of home.
The potential pitfall is that, as Vanguard
research has suggested, the performance
of a company’s shares tends to be highly
correlated to its domestic market, regardless
of where that company conducts most of
its business.
Americans aren’t alone in being portfolio
homebodies. Vanguard has found that in
a range of developed countries—Australia,
Canada, Japan, and the United Kingdom,
as well as the United States—investors
held a greater percentage of domestic
stocks than would be indicated if they
had taken their cues from a globally
diversified, market-weighted benchmark.
(You can see this tendency in the chart
later in this letter.)
Chairman’s Perspective
Bill McNabbChairman and Chief Executive Officer
3
Why home bias exists Vanguard’s Investment Strategy Group
identified a range of reasons why investors
might not embrace global diversification,
including concerns about currency risk and
an expectation that their home country will
deliver outsized returns.
One factor we identified—preference for
the familiar—seems particularly relevant.
With so much global uncertainty about
geopolitics, monetary policy, and the
economic outlook, it’s understandable
why investors may not want to stray
too far from home.
But in their aversion to the unknown,
investors can end up increasing, rather
than lessening, their risks. That’s
because they’re sacrificing broad global
diversification—one of the best ways
I know of to help control risk.
In many cases, individual country markets
are much less diversified than the global
market in total. Global investing, then, can
be an answer for investors who want to
reduce concentration risk. That can include
overconcentration in a particular country,
region, or industry.
And the good news is that global investing
is easier than ever, thanks to the wide
availability of low-cost, internationally
diversified stock and bond funds. It’s
possible, in a sense, to own the whole
world with just a couple of funds.
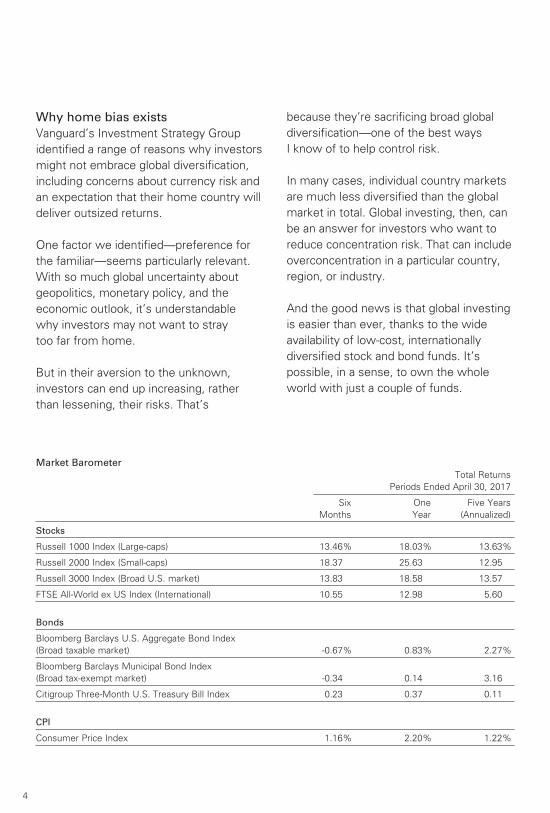
Market Barometer Total Returns
Periods Ended April 30, 2017
Six One Five Years
Months Year (Annualized)
Stocks
Russell 1000 Index (Large-caps) 13.46% 18.03% 13.63%
Russell 2000 Index (Small-caps) 18.37 25.63 12.95
Russell 3000 Index (Broad U.S. market) 13.83 18.58 13.57
FTSE All-World ex US Index (International) 10.55 12.98 5.60
Bonds
Bloomberg Barclays U.S. Aggregate Bond Index
(Broad taxable market) -0.67% 0.83% 2.27%
Bloomberg Barclays Municipal Bond Index
(Broad tax-exempt market) -0.34 0.14 3.16
Citigroup Three-Month U.S. Treasury Bill Index 0.23 0.37 0.11
CPI
Consumer Price Index 1.16% 2.20% 1.22%
4
Expanding our opportunitiesA key to overcoming home bias is
reframing the way we look at investing
outside our home countries. Take, for
example, automakers or pharmaceutical
companies. There are well-regarded firms
in both industries located throughout the
world. Over the next five years, nobody
can know for sure whether a Japanese
or U.S. or European company will produce
a popular new sedan that outsells the
competition or come up with new treat-
ments to combat illness. So why not own
them all? And that includes their bonds
along with their stocks.
Full global diversification also allows
you to capitalize on opportunities in both
developed and emerging economies.
Betting on which individual country—let
alone company—will be the next market
darling can be a fool’s errand.
A better choice can be to harness the
potential of all markets. In my personal
investment account, I have an emerging
markets position that complements my
developed-market holdings. Not only can
global diversification help control risk, but
it can also expand our set of opportunities
among stocks and bonds.
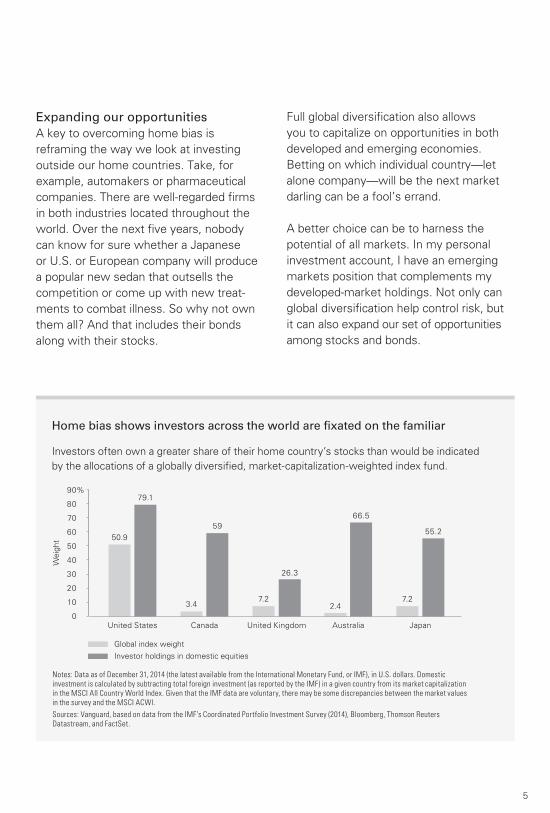
Home bias shows investors across the world are fixated on the familiar
Investors often own a greater share of their home country’s stocks than would be indicated
by the allocations of a globally diversified, market-capitalization-weighted index fund.
Weight
Notes: Data as of December 31, 2014 (the latest available from the International Monetary Fund, or IMF), in U.S. dollars. Domestic
investment is calculated by subtracting total foreign investment (as reported by the IMF) in a given country from its market capitalization
in the MSCI All Country World Index. Given that the IMF data are voluntary, there may be some discrepancies between the market values
in the survey and the MSCI ACWI.
Sources: Vanguard, based on data from the IMF’s Coordinated Portfolio Investment Survey (2014), Bloomberg, Thomson Reuters
Datastream, and FactSet.
0
80
70
60
50
40
30
20
10
90%
United States Canada United Kingdom Australia Japan
50.9
79.1
3.4
59
7.2
26.3
2.4
66.5
7.2
55.2
Global index weight
Investor holdings in domestic equities
5
Ultimately, I believe we have the best
chance for investment success by giving
ourselves more opportunities, not fewer.
Own the whole haystack and you never
have to worry about finding the needle.
Thank you for entrusting your assets
to Vanguard.
Sincerely,
F. William McNabb III
Chairman and Chief Executive Officer
May 12, 2017
6
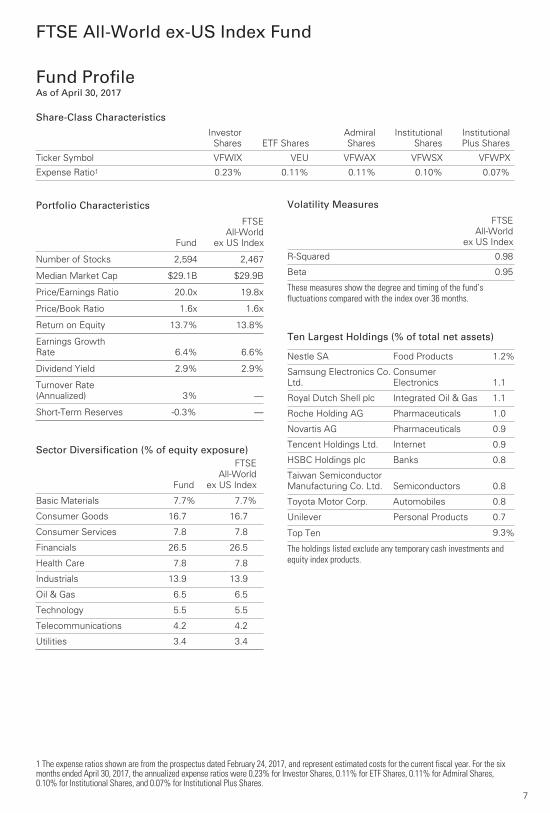
1 The expense ratios shown are from the prospectus dated February 24, 2017, and represent estimated costs for the current fiscal year. For the six months ended April 30, 2017, the annualized expense ratios were 0.23% for Investor Shares, 0.11% for ETF Shares, 0.11% for Admiral Shares, 0.10% for Institutional Shares, and 0.07% for Institutional Plus Shares.
Fund ProfileAs of April 30, 2017
Volatility Measures
FTSE
All-World
ex US Index
R-Squared 0.98
Beta 0.95
These measures show the degree and timing of the fund’s fluctuations compared with the index over 36 months.
FTSE All-World ex-US Index Fund
Share-Class Characteristics
Investor
Shares ETF Shares
Admiral
Shares
Institutional
Shares
Institutional
Plus Shares
Ticker Symbol VFWIX VEU VFWAX VFWSX VFWPX
Expense Ratio1 0.23% 0.11% 0.11% 0.10% 0.07%
7
Portfolio Characteristics
Fund
FTSE
All-World
ex US Index
Number of Stocks 2,594 2,467
Median Market Cap $29.1B $29.9B
Price/Earnings Ratio 20.0x 19.8x
Price/Book Ratio 1.6x 1.6x
Return on Equity 13.7% 13.8%
Earnings Growth
Rate 6.4% 6.6%
Dividend Yield 2.9% 2.9%
Turnover Rate
(Annualized) 3% —
Short-Term Reserves -0.3% —
Sector Diversification (% of equity exposure)
Fund
FTSEAll-World
ex US Index
Basic Materials 7.7% 7.7%
Consumer Goods 16.7 16.7
Consumer Services 7.8 7.8
Financials 26.5 26.5
Health Care 7.8 7.8
Industrials 13.9 13.9
Oil & Gas 6.5 6.5
Technology 5.5 5.5
Telecommunications 4.2 4.2
Utilities 3.4 3.4
Ten Largest Holdings (% of total net assets)
Nestle SA Food Products 1.2%
Samsung Electronics Co.
Ltd.
Consumer
Electronics 1.1
Royal Dutch Shell plc Integrated Oil & Gas 1.1
Roche Holding AG Pharmaceuticals 1.0
Novartis AG Pharmaceuticals 0.9
Tencent Holdings Ltd. Internet 0.9
HSBC Holdings plc Banks 0.8
Taiwan Semiconductor
Manufacturing Co. Ltd. Semiconductors 0.8
Toyota Motor Corp. Automobiles 0.8
Unilever Personal Products 0.7
Top Ten 9.3%
The holdings listed exclude any temporary cash investments andequity index products.
FTSE All-World ex-US Index Fund
8
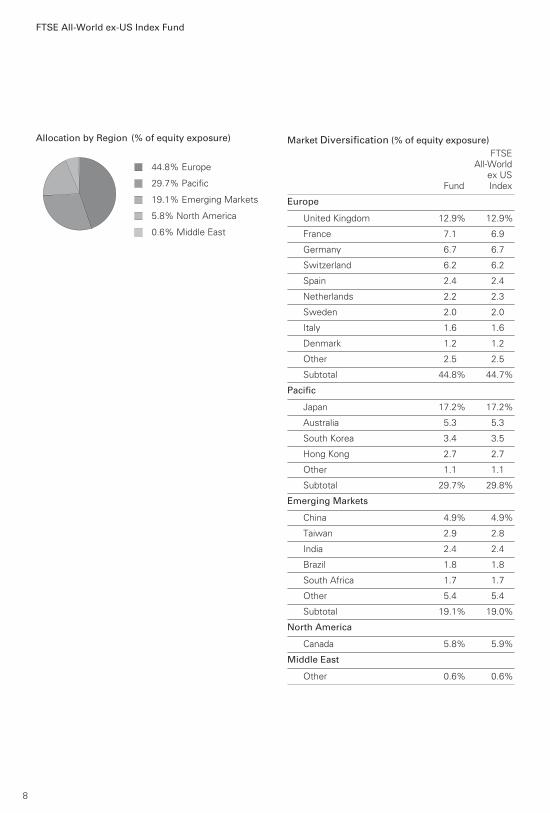
Allocation by Region (% of equity exposure)
44.8% Europe
29.7% Pacific
19.1% Emerging Markets
5.8% North America
0.6% Middle East
Market Diversification (% of equity exposure)
Fund
FTSEAll-World
ex USIndex
Europe
United Kingdom 12.9% 12.9%
France 7.1 6.9
Germany 6.7 6.7
Switzerland 6.2 6.2
Spain 2.4 2.4
Netherlands 2.2 2.3
Sweden 2.0 2.0
Italy 1.6 1.6
Denmark 1.2 1.2
Other 2.5 2.5
Subtotal 44.8% 44.7%
Pacific
Japan 17.2% 17.2%
Australia 5.3 5.3
South Korea 3.4 3.5
Hong Kong 2.7 2.7
Other 1.1 1.1
Subtotal 29.7% 29.8%
Emerging Markets
China 4.9% 4.9%
Taiwan 2.9 2.8
India 2.4 2.4
Brazil 1.8 1.8
South Africa 1.7 1.7
Other 5.4 5.4
Subtotal 19.1% 19.0%
North America
Canada 5.8% 5.9%
Middle East
Other 0.6% 0.6%
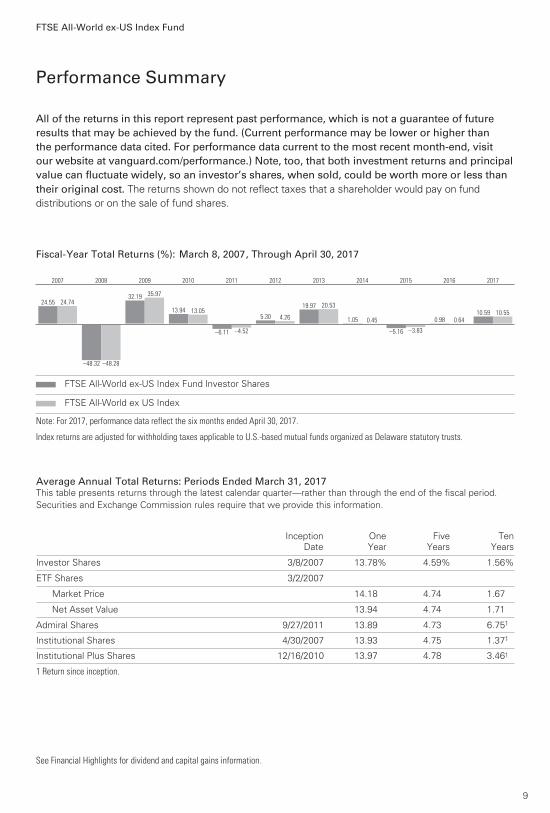
All of the returns in this report represent past performance, which is not a guarantee of future results that may be achieved by the fund. (Current performance may be lower or higher thanthe performance data cited. For performance data current to the most recent month-end, visitour website at vanguard.com/performance.) Note, too, that both investment returns and principalvalue can fluctuate widely, so an investor’s shares, when sold, could be worth more or less than their original cost. The returns shown do not reflect taxes that a shareholder would pay on fund
distributions or on the sale of fund shares.
Performance Summary
See Financial Highlights for dividend and capital gains information.
FTSE All-World ex-US Index Fund
9
Fiscal-Year Total Returns (%): March 8, 2007, Through April 30, 2017
24.55 24.74
2007
–48.32 –48.28
2008
32.19 35.97
2009
13.94 13.05
2010
–6.11 –4.52
2011
5.30 4.26
2012
19.97 20.53
2013
1.05 0.45
2014
–5.16 –3.83
2015
0.98 0.64
2016
10.59 10.55
2017
FTSE All-World ex-US Index Fund Investor Shares
FTSE All-World ex US Index
Note: For 2017, performance data reflect the six months ended April 30, 2017.
Index returns are adjusted for withholding taxes applicable to U.S.-based mutual funds organized as Delaware statutory trusts.
Average Annual Total Returns: Periods Ended March 31, 2017This table presents returns through the latest calendar quarter—rather than through the end of the fiscal period.Securities and Exchange Commission rules require that we provide this information.
InceptionDate
OneYear
FiveYears
TenYears
Investor Shares 3/8/2007 13.78% 4.59% 1.56%
ETF Shares 3/2/2007
Market Price 14.18 4.74 1.67
Net Asset Value 13.94 4.74 1.71
Admiral Shares 9/27/2011 13.89 4.73 6.751
Institutional Shares 4/30/2007 13.93 4.75 1.371
Institutional Plus Shares 12/16/2010 13.97 4.78 3.461
1 Return since inception.
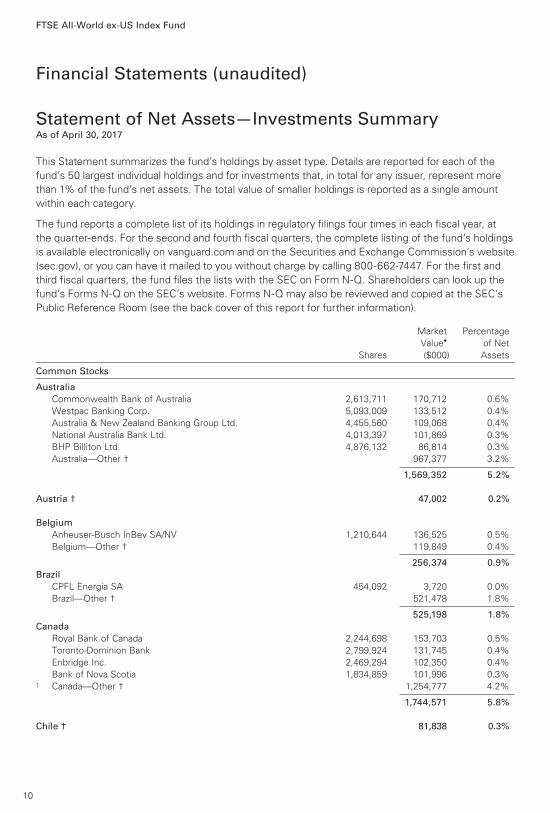
Financial Statements (unaudited)
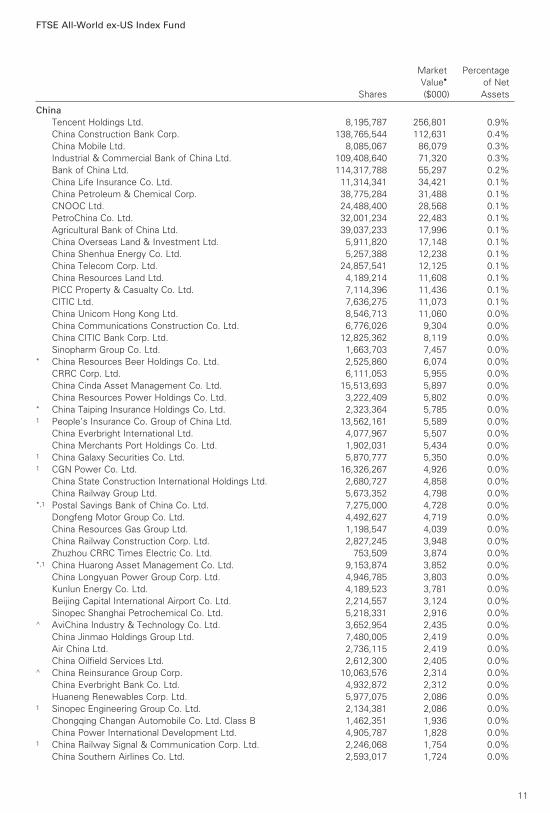
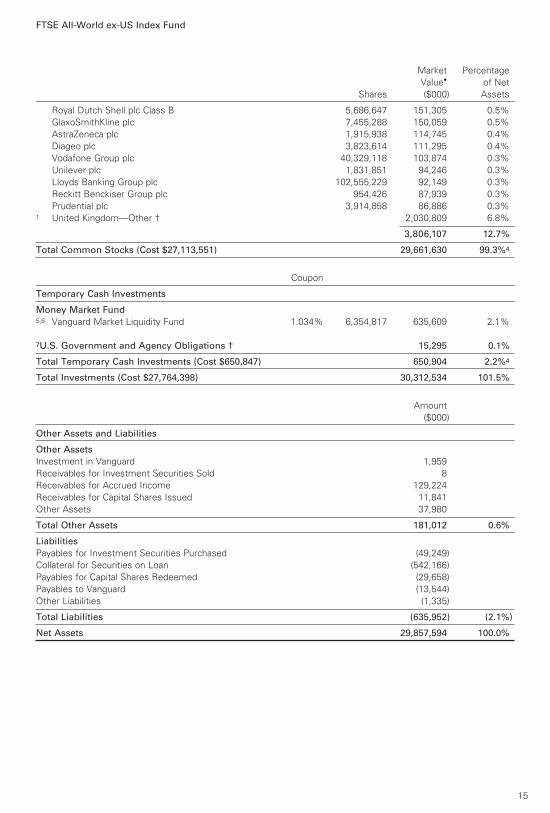
Statement of Net Assets—Investments SummaryAs of April 30, 2017
This Statement summarizes the fund’s holdings by asset type. Details are reported for each of the
fund’s 50 largest individual holdings and for investments that, in total for any issuer, represent more
than 1% of the fund’s net assets. The total value of smaller holdings is reported as a single amount
within each category.
The fund reports a complete list of its holdings in regulatory filings four times in each fiscal year, at
the quarter-ends. For the second and fourth fiscal quarters, the complete listing of the fund’s holdings
is available electronically on vanguard.com and on the Securities and Exchange Commission’s website
(sec.gov), or you can have it mailed to you without charge by calling 800-662-7447. For the first and
third fiscal quarters, the fund files the lists with the SEC on Form N-Q. Shareholders can look up the
fund’s Forms N-Q on the SEC’s website. Forms N-Q may also be reviewed and copied at the SEC’s
Public Reference Room (see the back cover of this report for further information).
FTSE All-World ex-US Index Fund
Market Percentage
Value• of Net
Shares ($000) Assets
Common Stocks
Australia Commonwealth Bank of Australia 2,613,711 170,712 0.6%
Westpac Banking Corp. 5,093,009 133,512 0.4%
Australia & New Zealand Banking Group Ltd. 4,455,560 109,068 0.4%
National Australia Bank Ltd. 4,013,397 101,869 0.3%
BHP Billiton Ltd. 4,876,132 86,814 0.3%
Australia—Other † 967,377 3.2%
1,569,352 5.2%
Austria † 47,002 0.2%
Belgium Anheuser-Busch InBev SA/NV 1,210,644 136,525 0.5%
Belgium—Other † 119,849 0.4%
256,374 0.9% Brazil CPFL Energia SA 454,092 3,720 0.0%
Brazil—Other † 521,478 1.8%
525,198 1.8% Canada Royal Bank of Canada 2,244,698 153,703 0.5%
Toronto-Dominion Bank 2,799,924 131,745 0.4%
Enbridge Inc. 2,469,294 102,350 0.4%
Bank of Nova Scotia 1,834,859 101,996 0.3% 1 Canada—Other † 1,254,777 4.2%
1,744,571 5.8%
Chile † 81,838 0.3%
10
FTSE All-World ex-US Index Fund
China Tencent Holdings Ltd. 8,195,787 256,801 0.9%
China Construction Bank Corp. 138,765,544 112,631 0.4%
China Mobile Ltd. 8,085,067 86,079 0.3%
Industrial & Commercial Bank of China Ltd. 109,408,640 71,320 0.3%
Bank of China Ltd. 114,317,788 55,297 0.2%
China Life Insurance Co. Ltd. 11,314,341 34,421 0.1%
China Petroleum & Chemical Corp. 38,775,284 31,488 0.1%
CNOOC Ltd. 24,488,400 28,568 0.1%
PetroChina Co. Ltd. 32,001,234 22,483 0.1%
Agricultural Bank of China Ltd. 39,037,233 17,996 0.1%
China Overseas Land & Investment Ltd. 5,911,820 17,148 0.1%
China Shenhua Energy Co. Ltd. 5,257,388 12,238 0.1%
China Telecom Corp. Ltd. 24,857,541 12,125 0.1%
China Resources Land Ltd. 4,189,214 11,608 0.1%
PICC Property & Casualty Co. Ltd. 7,114,396 11,436 0.1%
CITIC Ltd. 7,636,275 11,073 0.1%
China Unicom Hong Kong Ltd. 8,546,713 11,060 0.0%
China Communications Construction Co. Ltd. 6,776,026 9,304 0.0%
China CITIC Bank Corp. Ltd. 12,825,362 8,119 0.0%
Sinopharm Group Co. Ltd. 1,663,703 7,457 0.0% * China Resources Beer Holdings Co. Ltd. 2,525,860 6,074 0.0%
CRRC Corp. Ltd. 6,111,053 5,955 0.0%
China Cinda Asset Management Co. Ltd. 15,513,693 5,897 0.0%
China Resources Power Holdings Co. Ltd. 3,222,409 5,802 0.0% * China Taiping Insurance Holdings Co. Ltd. 2,323,364 5,785 0.0% 1 People’s Insurance Co. Group of China Ltd. 13,562,161 5,589 0.0%
China Everbright International Ltd. 4,077,967 5,507 0.0%
China Merchants Port Holdings Co. Ltd. 1,902,031 5,434 0.0% 1 China Galaxy Securities Co. Ltd. 5,870,777 5,350 0.0% 1 CGN Power Co. Ltd. 16,326,267 4,926 0.0%
China State Construction International Holdings Ltd. 2,680,727 4,858 0.0%
China Railway Group Ltd. 5,673,352 4,798 0.0% *,1 Postal Savings Bank of China Co. Ltd. 7,275,000 4,728 0.0%
Dongfeng Motor Group Co. Ltd. 4,492,627 4,719 0.0%
China Resources Gas Group Ltd. 1,198,547 4,039 0.0%
China Railway Construction Corp. Ltd. 2,827,245 3,948 0.0%
Zhuzhou CRRC Times Electric Co. Ltd. 753,509 3,874 0.0% *,1 China Huarong Asset Management Co. Ltd. 9,153,874 3,852 0.0%
China Longyuan Power Group Corp. Ltd. 4,946,785 3,803 0.0%
Kunlun Energy Co. Ltd. 4,189,523 3,781 0.0%
Beijing Capital International Airport Co. Ltd. 2,214,557 3,124 0.0%
Sinopec Shanghai Petrochemical Co. Ltd. 5,218,331 2,916 0.0% ^ AviChina Industry & Technology Co. Ltd. 3,652,954 2,435 0.0%
China Jinmao Holdings Group Ltd. 7,480,005 2,419 0.0%
Air China Ltd. 2,736,115 2,419 0.0%
China Oilfield Services Ltd. 2,612,300 2,405 0.0% ^ China Reinsurance Group Corp. 10,063,576 2,314 0.0%
China Everbright Bank Co. Ltd. 4,932,872 2,312 0.0%
Huaneng Renewables Corp. Ltd. 5,977,075 2,086 0.0% 1 Sinopec Engineering Group Co. Ltd. 2,134,381 2,086 0.0%
Chongqing Changan Automobile Co. Ltd. Class B 1,462,351 1,936 0.0%
China Power International Development Ltd. 4,905,787 1,828 0.0% 1 China Railway Signal & Communication Corp. Ltd. 2,246,068 1,754 0.0%
China Southern Airlines Co. Ltd. 2,593,017 1,724 0.0%
Market Percentage
Value• of Net
Shares ($000) Assets
11
FTSE All-World ex-US Index Fund
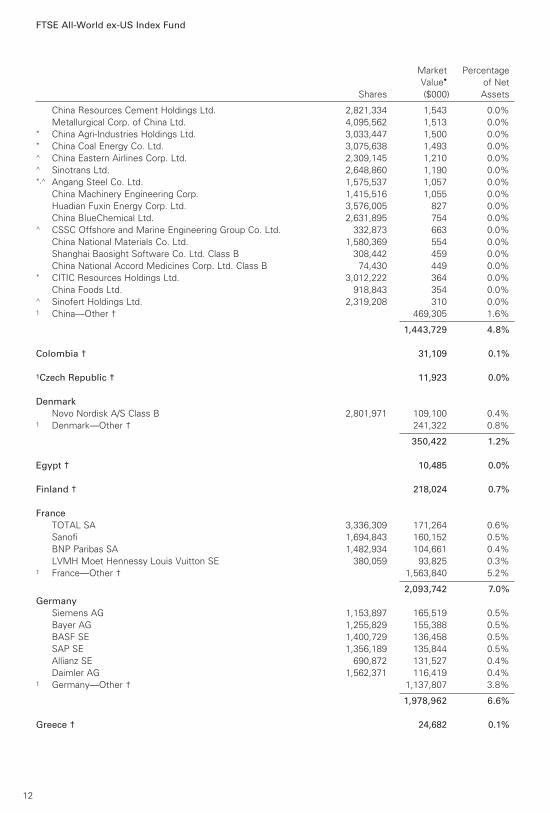
China Resources Cement Holdings Ltd. 2,821,334 1,543 0.0%
Metallurgical Corp. of China Ltd. 4,095,562 1,513 0.0% * China Agri-Industries Holdings Ltd. 3,033,447 1,500 0.0% * China Coal Energy Co. Ltd. 3,075,638 1,493 0.0% ^ China Eastern Airlines Corp. Ltd. 2,309,145 1,210 0.0% ^ Sinotrans Ltd. 2,648,860 1,190 0.0% *,^ Angang Steel Co. Ltd. 1,575,537 1,057 0.0%
China Machinery Engineering Corp. 1,415,516 1,055 0.0%
Huadian Fuxin Energy Corp. Ltd. 3,576,005 827 0.0%
China BlueChemical Ltd. 2,631,895 754 0.0% ^ CSSC Offshore and Marine Engineering Group Co. Ltd. 332,873 663 0.0%
China National Materials Co. Ltd. 1,580,369 554 0.0%
Shanghai Baosight Software Co. Ltd. Class B 308,442 459 0.0%
China National Accord Medicines Corp. Ltd. Class B 74,430 449 0.0% * CITIC Resources Holdings Ltd. 3,012,222 364 0.0%
China Foods Ltd. 918,843 354 0.0% ^ Sinofert Holdings Ltd. 2,319,208 310 0.0% 1 China—Other † 469,305 1.6%
1,443,729 4.8%
Colombia † 31,109 0.1%
1Czech Republic † 11,923 0.0%
Denmark Novo Nordisk A/S Class B 2,801,971 109,100 0.4% 1 Denmark—Other † 241,322 0.8%
350,422 1.2%
Egypt † 10,485 0.0%
Finland † 218,024 0.7%
France TOTAL SA 3,336,309 171,264 0.6%
Sanofi 1,694,843 160,152 0.5%
BNP Paribas SA 1,482,934 104,661 0.4%
LVMH Moet Hennessy Louis Vuitton SE 380,059 93,825 0.3% 1 France—Other † 1,563,840 5.2%
2,093,742 7.0% Germany Siemens AG 1,153,897 165,519 0.5%
Bayer AG 1,255,829 155,388 0.5%
BASF SE 1,400,729 136,458 0.5%
SAP SE 1,356,189 135,844 0.5%
Allianz SE 690,872 131,527 0.4%
Daimler AG 1,562,371 116,419 0.4% 1 Germany—Other † 1,137,807 3.8%
1,978,962 6.6%
Greece † 24,682 0.1%
Market Percentage
Value• of Net
Shares ($000) Assets
12
FTSE All-World ex-US Index Fund
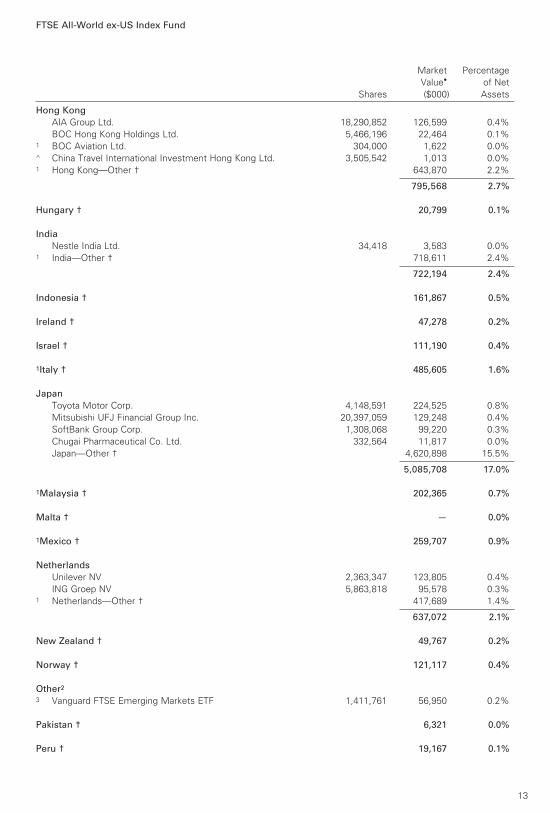
Hong Kong AIA Group Ltd. 18,290,852 126,599 0.4%
BOC Hong Kong Holdings Ltd. 5,466,196 22,464 0.1% 1 BOC Aviation Ltd. 304,000 1,622 0.0% ^ China Travel International Investment Hong Kong Ltd. 3,505,542 1,013 0.0% 1 Hong Kong—Other † 643,870 2.2%
795,568 2.7%
Hungary † 20,799 0.1%
India Nestle India Ltd. 34,418 3,583 0.0% 1 India—Other † 718,611 2.4%
722,194 2.4%
Indonesia † 161,867 0.5%
Ireland † 47,278 0.2%
Israel † 111,190 0.4%
1Italy † 485,605 1.6%
Japan Toyota Motor Corp. 4,148,591 224,525 0.8%
Mitsubishi UFJ Financial Group Inc. 20,397,059 129,248 0.4%
SoftBank Group Corp. 1,308,068 99,220 0.3%
Chugai Pharmaceutical Co. Ltd. 332,564 11,817 0.0%
Japan—Other † 4,620,898 15.5%
5,085,708 17.0%
1Malaysia † 202,365 0.7%
Malta † — 0.0%
1Mexico † 259,707 0.9%
Netherlands Unilever NV 2,363,347 123,805 0.4%
ING Groep NV 5,863,818 95,578 0.3% 1 Netherlands—Other † 417,689 1.4%
637,072 2.1%
New Zealand † 49,767 0.2%
Norway † 121,117 0.4%
Other2
3 Vanguard FTSE Emerging Markets ETF 1,411,761 56,950 0.2%
Pakistan † 6,321 0.0%
Peru † 19,167 0.1%
Market Percentage
Value• of Net
Shares ($000) Assets
13
FTSE All-World ex-US Index Fund
Philippines † 85,223 0.3% Poland † 90,898 0.3%
Portugal † 33,191 0.1%
Qatar † 56,467 0.2%
Russia † 269,126 0.9%
Singapore † 273,057 0.9%
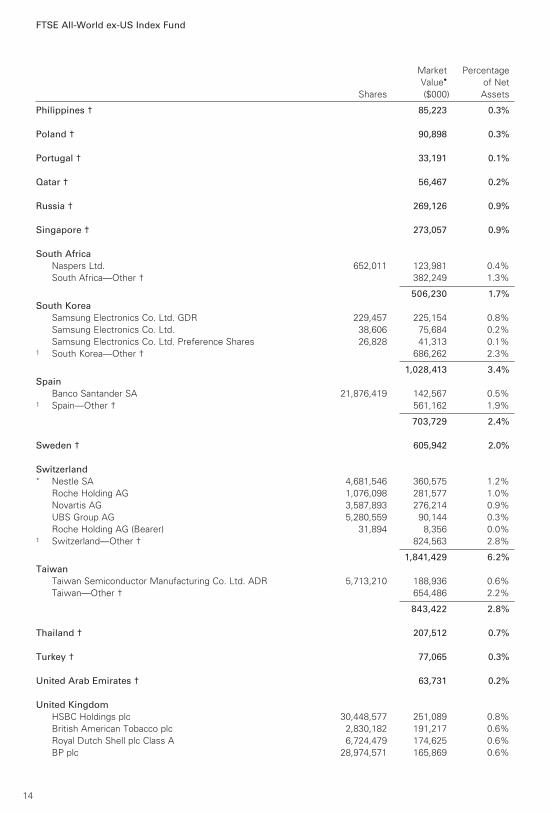
South Africa Naspers Ltd. 652,011 123,981 0.4%
South Africa—Other † 382,249 1.3%
506,230 1.7% South Korea Samsung Electronics Co. Ltd. GDR 229,457 225,154 0.8%
Samsung Electronics Co. Ltd. 38,606 75,684 0.2%
Samsung Electronics Co. Ltd. Preference Shares 26,828 41,313 0.1% 1 South Korea—Other † 686,262 2.3%
1,028,413 3.4% Spain Banco Santander SA 21,876,419 142,567 0.5% 1 Spain—Other † 561,162 1.9%
703,729 2.4%
Sweden † 605,942 2.0%
Switzerland* Nestle SA 4,681,546 360,575 1.2%
Roche Holding AG 1,076,098 281,577 1.0%
Novartis AG 3,587,893 276,214 0.9%
UBS Group AG 5,280,559 90,144 0.3%
Roche Holding AG (Bearer) 31,894 8,356 0.0% 1 Switzerland—Other † 824,563 2.8%
1,841,429 6.2% Taiwan Taiwan Semiconductor Manufacturing Co. Ltd. ADR 5,713,210 188,936 0.6%
Taiwan—Other † 654,486 2.2%
843,422 2.8%
Thailand † 207,512 0.7%
Turkey † 77,065 0.3%
United Arab Emirates † 63,731 0.2%
United Kingdom HSBC Holdings plc 30,448,577 251,089 0.8%
British American Tobacco plc 2,830,182 191,217 0.6%
Royal Dutch Shell plc Class A 6,724,479 174,625 0.6%
BP plc 28,974,571 165,869 0.6%
Market Percentage
Value• of Net
Shares ($000) Assets
14
FTSE All-World ex-US Index Fund
Royal Dutch Shell plc Class B 5,686,647 151,305 0.5%
GlaxoSmithKline plc 7,455,288 150,059 0.5%
AstraZeneca plc 1,915,938 114,745 0.4%
Diageo plc 3,823,614 111,295 0.4%
Vodafone Group plc 40,329,118 103,874 0.3%
Unilever plc 1,831,851 94,246 0.3%
Lloyds Banking Group plc 102,555,229 92,149 0.3%
Reckitt Benckiser Group plc 954,426 87,939 0.3%
Prudential plc 3,914,858 86,886 0.3% 1 United Kingdom—Other † 2,030,809 6.8%
3,806,107 12.7%
Total Common Stocks (Cost $27,113,551) 29,661,630 99.3%4
Coupon
Temporary Cash Investments
Money Market Fund5,6 Vanguard Market Liquidity Fund 1.034% 6,354,817 635,609 2.1%
7U.S. Government and Agency Obligations † 15,295 0.1%
Total Temporary Cash Investments (Cost $650,847) 650,904 2.2%4
Total Investments (Cost $27,764,398) 30,312,534 101.5%
Amount
($000)
Other Assets and Liabilities
Other Assets Investment in Vanguard 1,959
Receivables for Investment Securities Sold 8
Receivables for Accrued Income 129,224
Receivables for Capital Shares Issued 11,841
Other Assets 37,980
Total Other Assets 181,012 0.6%
Liabilities Payables for Investment Securities Purchased (49,249)
Collateral for Securities on Loan (542,166)
Payables for Capital Shares Redeemed (29,658)
Payables to Vanguard (13,544)
Other Liabilities (1,335)
Total Liabilities (635,952) (2.1%)
Net Assets 29,857,594 100.0%
Market Percentage
Value• of Net
Shares ($000) Assets
15
FTSE All-World ex-US Index Fund
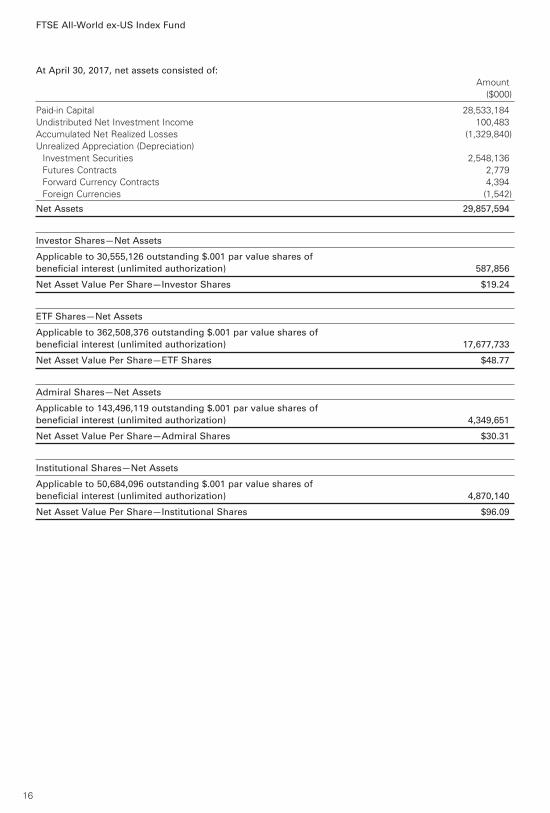
Paid-in Capital 28,533,184
Undistributed Net Investment Income 100,483
Accumulated Net Realized Losses (1,329,840)
Unrealized Appreciation (Depreciation)
Investment Securities 2,548,136
Futures Contracts 2,779
Forward Currency Contracts 4,394
Foreign Currencies (1,542)
Net Assets 29,857,594
Investor Shares—Net Assets
Applicable to 30,555,126 outstanding $.001 par value shares of beneficial interest (unlimited authorization) 587,856
Net Asset Value Per Share—Investor Shares $19.24
ETF Shares—Net Assets
Applicable to 362,508,376 outstanding $.001 par value shares of beneficial interest (unlimited authorization) 17,677,733
Net Asset Value Per Share—ETF Shares $48.77
Admiral Shares—Net Assets
Applicable to 143,496,119 outstanding $.001 par value shares of beneficial interest (unlimited authorization) 4,349,651
Net Asset Value Per Share—Admiral Shares $30.31
Institutional Shares—Net Assets
Applicable to 50,684,096 outstanding $.001 par value shares of beneficial interest (unlimited authorization) 4,870,140
Net Asset Value Per Share—Institutional Shares $96.09
At April 30, 2017, net assets consisted of: Amount
($000)
16
FTSE All-World ex-US Index Fund
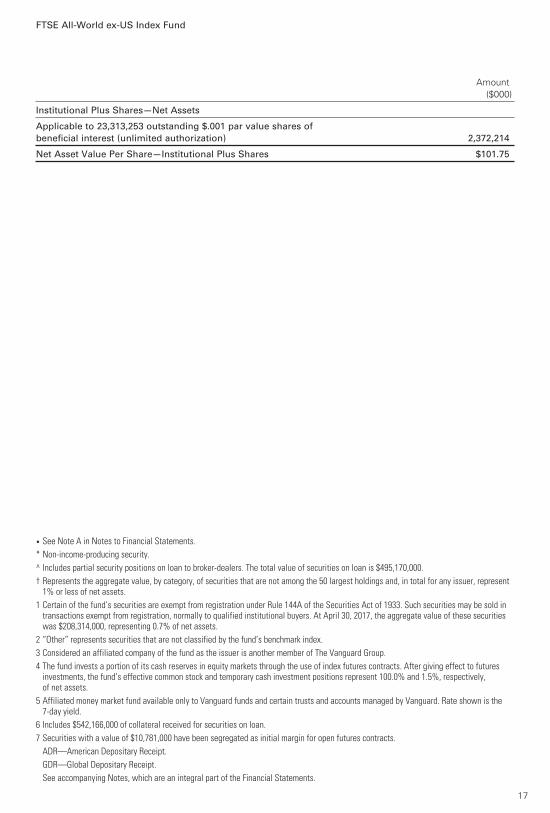
Institutional Plus Shares—Net Assets
Applicable to 23,313,253 outstanding $.001 par value shares of beneficial interest (unlimited authorization) 2,372,214
Net Asset Value Per Share—Institutional Plus Shares $101.75
Amount
($000)
• See Note A in Notes to Financial Statements.
* Non-income-producing security.
^ Includes partial security positions on loan to broker-dealers. The total value of securities on loan is $495,170,000.
† Represents the aggregate value, by category, of securities that are not among the 50 largest holdings and, in total for any issuer, represent 1% or less of net assets.
1 Certain of the fund’s securities are exempt from registration under Rule 144A of the Securities Act of 1933. Such securities may be sold in transactions exempt from registration, normally to qualified institutional buyers. At April 30, 2017, the aggregate value of these securities was $208,314,000, representing 0.7% of net assets.
2 “Other” represents securities that are not classified by the fund’s benchmark index.
3 Considered an affiliated company of the fund as the issuer is another member of The Vanguard Group.
4 The fund invests a portion of its cash reserves in equity markets through the use of index futures contracts. After giving effect to futures investments, the fund’s effective common stock and temporary cash investment positions represent 100.0% and 1.5%, respectively, of net assets.
5 Affiliated money market fund available only to Vanguard funds and certain trusts and accounts managed by Vanguard. Rate shown is the 7-day yield.
6 Includes $542,166,000 of collateral received for securities on loan.
7 Securities with a value of $10,781,000 have been segregated as initial margin for open futures contracts.
ADR—American Depositary Receipt.
GDR—Global Depositary Receipt.
See accompanying Notes, which are an integral part of the Financial Statements.
17
18
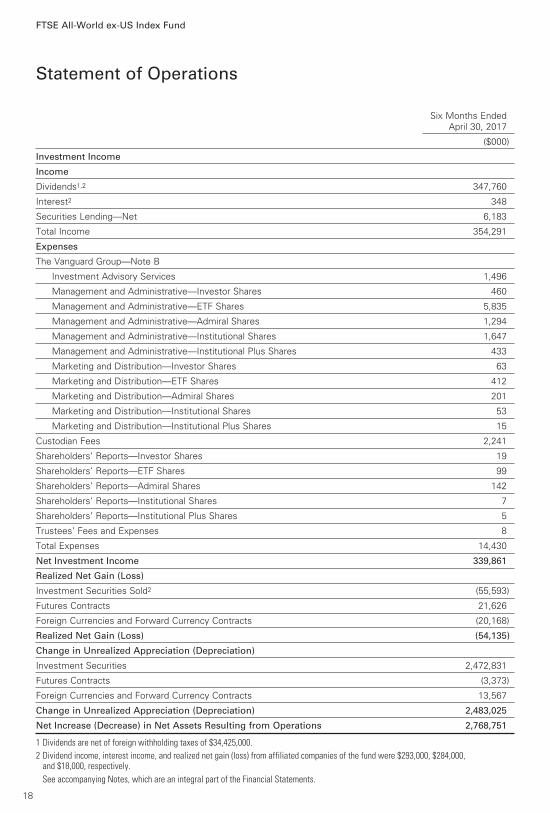
Six Months Ended
April 30, 2017
($000)
Investment Income
Income
Dividends1,2 347,760
Interest2 348
Securities Lending—Net 6,183
Total Income 354,291
Expenses
The Vanguard Group—Note B
Investment Advisory Services 1,496
Management and Administrative—Investor Shares 460
Management and Administrative—ETF Shares 5,835
Management and Administrative—Admiral Shares 1,294
Management and Administrative—Institutional Shares 1,647
Management and Administrative—Institutional Plus Shares 433
Marketing and Distribution—Investor Shares 63
Marketing and Distribution—ETF Shares 412
Marketing and Distribution—Admiral Shares 201
Marketing and Distribution—Institutional Shares 53
Marketing and Distribution—Institutional Plus Shares 15
Custodian Fees 2,241
Shareholders’ Reports—Investor Shares 19
Shareholders’ Reports—ETF Shares 99
Shareholders’ Reports—Admiral Shares 142
Shareholders’ Reports—Institutional Shares 7
Shareholders’ Reports—Institutional Plus Shares 5
Trustees’ Fees and Expenses 8
Total Expenses 14,430
Net Investment Income 339,861
Realized Net Gain (Loss)
Investment Securities Sold2 (55,593)
Futures Contracts 21,626
Foreign Currencies and Forward Currency Contracts (20,168)
Realized Net Gain (Loss) (54,135)
Change in Unrealized Appreciation (Depreciation)
Investment Securities 2,472,831
Futures Contracts (3,373)
Foreign Currencies and Forward Currency Contracts 13,567
Change in Unrealized Appreciation (Depreciation) 2,483,025
Net Increase (Decrease) in Net Assets Resulting from Operations 2,768,751
1 Dividends are net of foreign withholding taxes of $34,425,000.
2 Dividend income, interest income, and realized net gain (loss) from affiliated companies of the fund were $293,000, $284,000, and $18,000, respectively.
See accompanying Notes, which are an integral part of the Financial Statements.
Statement of Operations
FTSE All-World ex-US Index Fund
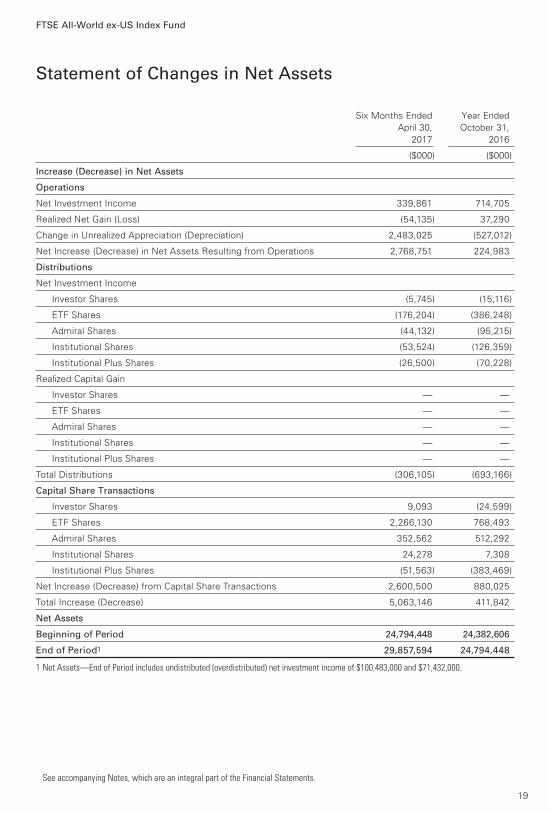
Statement of Changes in Net Assets
FTSE All-World ex-US Index Fund
See accompanying Notes, which are an integral part of the Financial Statements.
Six Months Ended Year Ended
April 30, October 31,
2017 2016
($000) ($000)
Increase (Decrease) in Net Assets
Operations
Net Investment Income 339,861 714,705
Realized Net Gain (Loss) (54,135) 37,290
Change in Unrealized Appreciation (Depreciation) 2,483,025 (527,012)
Net Increase (Decrease) in Net Assets Resulting from Operations 2,768,751 224,983
Distributions
Net Investment Income
Investor Shares (5,745) (15,116)
ETF Shares (176,204) (386,248)
Admiral Shares (44,132) (95,215)
Institutional Shares (53,524) (126,359)
Institutional Plus Shares (26,500) (70,228)
Realized Capital Gain
Investor Shares — —
ETF Shares — —
Admiral Shares — —
Institutional Shares — —
Institutional Plus Shares — —
Total Distributions (306,105) (693,166)
Capital Share Transactions
Investor Shares 9,093 (24,599)
ETF Shares 2,266,130 768,493
Admiral Shares 352,562 512,292
Institutional Shares 24,278 7,308
Institutional Plus Shares (51,563) (383,469)
Net Increase (Decrease) from Capital Share Transactions 2,600,500 880,025
Total Increase (Decrease) 5,063,146 411,842
Net Assets
Beginning of Period 24,794,448 24,382,606
End of Period1 29,857,594 24,794,448
1 Net Assets—End of Period includes undistributed (overdistributed) net investment income of $100,483,000 and $71,432,000.
19
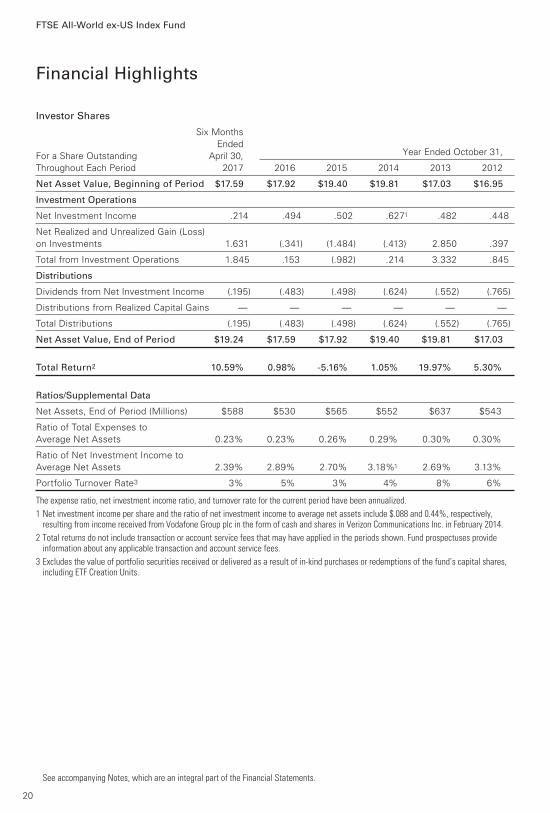
Investor Shares Six Months
Ended
For a Share Outstanding April 30, Year Ended October 31,
Throughout Each Period 2017 2016 2015 2014 2013 2012
Net Asset Value, Beginning of Period $17.59 $17.92 $19.40 $19.81 $17.03 $16.95
Investment Operations
Net Investment Income .214 .494 .502 .6271 .482 .448
Net Realized and Unrealized Gain (Loss)
on Investments 1.631 (.341) (1.484) (.413) 2.850 .397
Total from Investment Operations 1.845 .153 (.982) .214 3.332 .845
Distributions
Dividends from Net Investment Income (.195) (.483) (.498) (.624) (.552) (.765)
Distributions from Realized Capital Gains — — — — — —
Total Distributions (.195) (.483) (.498) (.624) (.552) (.765)
Net Asset Value, End of Period $19.24 $17.59 $17.92 $19.40 $19.81 $17.03
Total Return2 10.59% 0.98% -5.16% 1.05% 19.97% 5.30%
Ratios/Supplemental Data
Net Assets, End of Period (Millions) $588 $530 $565 $552 $637 $543
Ratio of Total Expenses to
Average Net Assets 0.23% 0.23% 0.26% 0.29% 0.30% 0.30%
Ratio of Net Investment Income to
Average Net Assets 2.39% 2.89% 2.70% 3.18%1 2.69% 3.13%
Portfolio Turnover Rate3 3% 5% 3% 4% 8% 6%
The expense ratio, net investment income ratio, and turnover rate for the current period have been annualized.
1 Net investment income per share and the ratio of net investment income to average net assets include $.088 and 0.44%, respectively, resulting from income received from Vodafone Group plc in the form of cash and shares in Verizon Communications Inc. in February 2014.
2 Total returns do not include transaction or account service fees that may have applied in the periods shown. Fund prospectuses provide information about any applicable transaction and account service fees.
3 Excludes the value of portfolio securities received or delivered as a result of in-kind purchases or redemptions of the fund’s capital shares, including ETF Creation Units.
Financial Highlights
See accompanying Notes, which are an integral part of the Financial Statements.
FTSE All-World ex-US Index Fund
20
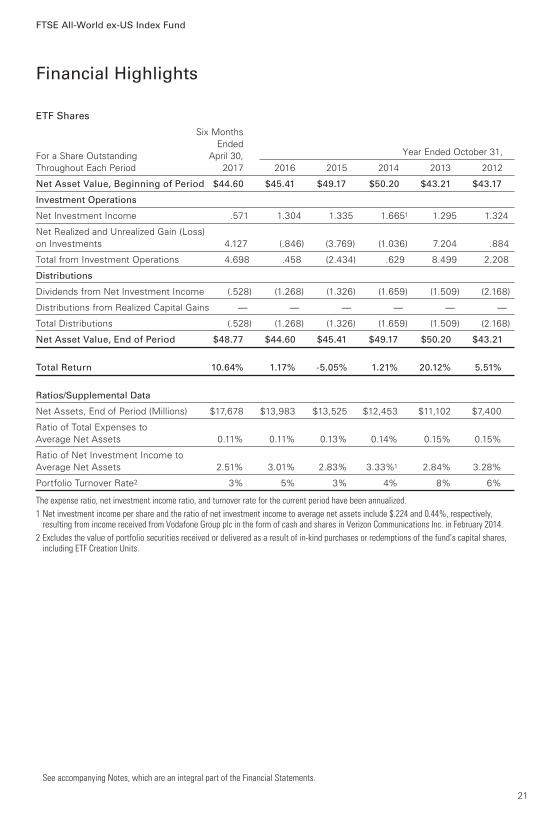
ETF Shares Six Months
Ended
For a Share Outstanding April 30, Year Ended October 31,
Throughout Each Period 2017 2016 2015 2014 2013 2012
Net Asset Value, Beginning of Period $44.60 $45.41 $49.17 $50.20 $43.21 $43.17
Investment Operations
Net Investment Income .571 1.304 1.335 1.6651 1.295 1.324
Net Realized and Unrealized Gain (Loss)
on Investments 4.127 (.846) (3.769) (1.036) 7.204 .884
Total from Investment Operations 4.698 .458 (2.434) .629 8.499 2.208
Distributions
Dividends from Net Investment Income (.528) (1.268) (1.326) (1.659) (1.509) (2.168)
Distributions from Realized Capital Gains — — — — — —
Total Distributions (.528) (1.268) (1.326) (1.659) (1.509) (2.168)
Net Asset Value, End of Period $48.77 $44.60 $45.41 $49.17 $50.20 $43.21
Total Return 10.64% 1.17% -5.05% 1.21% 20.12% 5.51%
Ratios/Supplemental Data
Net Assets, End of Period (Millions) $17,678 $13,983 $13,525 $12,453 $11,102 $7,400
Ratio of Total Expenses to
Average Net Assets 0.11% 0.11% 0.13% 0.14% 0.15% 0.15%
Ratio of Net Investment Income to
Average Net Assets 2.51% 3.01% 2.83% 3.33%1 2.84% 3.28%
Portfolio Turnover Rate2 3% 5% 3% 4% 8% 6%
The expense ratio, net investment income ratio, and turnover rate for the current period have been annualized.
1 Net investment income per share and the ratio of net investment income to average net assets include $.224 and 0.44%, respectively, resulting from income received from Vodafone Group plc in the form of cash and shares in Verizon Communications Inc. in February 2014.
2 Excludes the value of portfolio securities received or delivered as a result of in-kind purchases or redemptions of the fund’s capital shares, including ETF Creation Units.
Financial Highlights
See accompanying Notes, which are an integral part of the Financial Statements.
FTSE All-World ex-US Index Fund
21
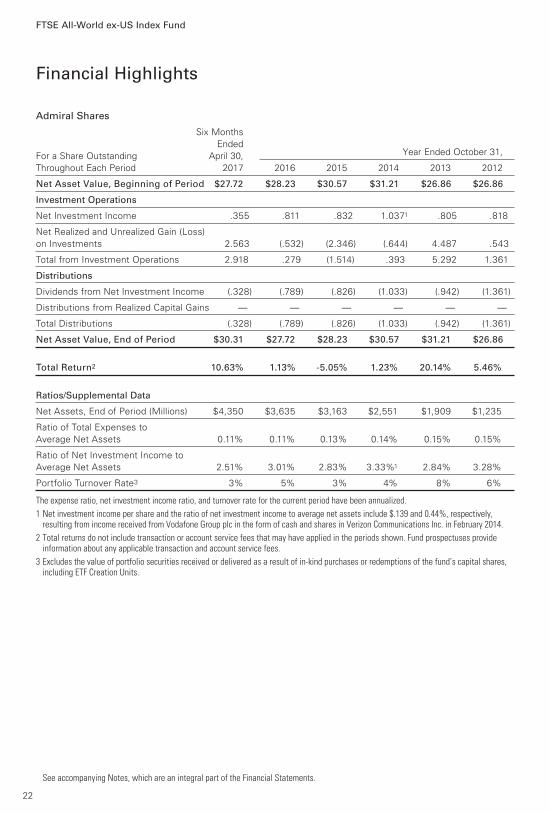
Admiral Shares Six Months
Ended
For a Share Outstanding April 30, Year Ended October 31,
Throughout Each Period 2017 2016 2015 2014 2013 2012
Net Asset Value, Beginning of Period $27.72 $28.23 $30.57 $31.21 $26.86 $26.86
Investment Operations
Net Investment Income .355 .811 .832 1.0371 .805 .818
Net Realized and Unrealized Gain (Loss)
on Investments 2.563 (.532) (2.346) (.644) 4.487 .543
Total from Investment Operations 2.918 .279 (1.514) .393 5.292 1.361
Distributions
Dividends from Net Investment Income (.328) (.789) (.826) (1.033) (.942) (1.361)
Distributions from Realized Capital Gains — — — — — —
Total Distributions (.328) (.789) (.826) (1.033) (.942) (1.361)
Net Asset Value, End of Period $30.31 $27.72 $28.23 $30.57 $31.21 $26.86
Total Return2 10.63% 1.13% -5.05% 1.23% 20.14% 5.46%
Ratios/Supplemental Data
Net Assets, End of Period (Millions) $4,350 $3,635 $3,163 $2,551 $1,909 $1,235
Ratio of Total Expenses to
Average Net Assets 0.11% 0.11% 0.13% 0.14% 0.15% 0.15%
Ratio of Net Investment Income to
Average Net Assets 2.51% 3.01% 2.83% 3.33%1 2.84% 3.28%
Portfolio Turnover Rate3 3% 5% 3% 4% 8% 6%
The expense ratio, net investment income ratio, and turnover rate for the current period have been annualized.
1 Net investment income per share and the ratio of net investment income to average net assets include $.139 and 0.44%, respectively, resulting from income received from Vodafone Group plc in the form of cash and shares in Verizon Communications Inc. in February 2014.
2 Total returns do not include transaction or account service fees that may have applied in the periods shown. Fund prospectuses provide information about any applicable transaction and account service fees.
3 Excludes the value of portfolio securities received or delivered as a result of in-kind purchases or redemptions of the fund’s capital shares, including ETF Creation Units.
Financial Highlights
See accompanying Notes, which are an integral part of the Financial Statements.
FTSE All-World ex-US Index Fund
22
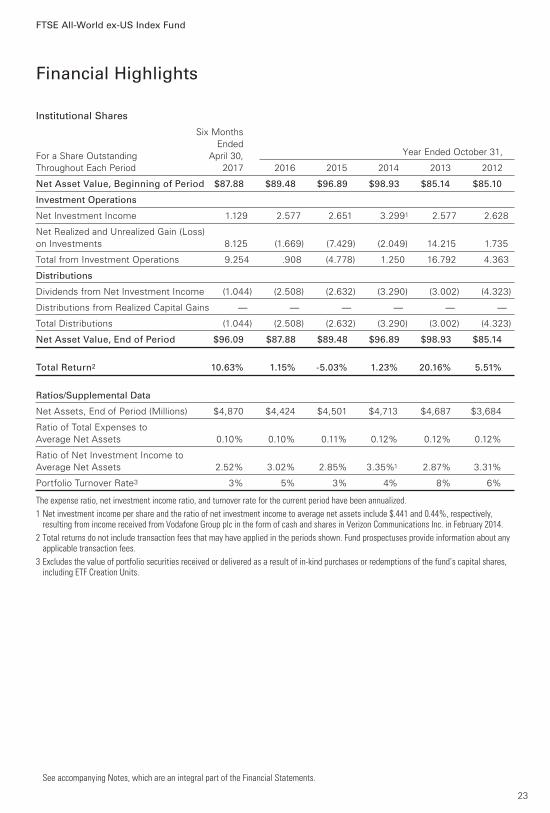
Institutional Shares Six Months
Ended
For a Share Outstanding April 30, Year Ended October 31,
Throughout Each Period 2017 2016 2015 2014 2013 2012
Net Asset Value, Beginning of Period $87.88 $89.48 $96.89 $98.93 $85.14 $85.10
Investment Operations
Net Investment Income 1.129 2.577 2.651 3.2991 2.577 2.628
Net Realized and Unrealized Gain (Loss)
on Investments 8.125 (1.669) (7.429) (2.049) 14.215 1.735
Total from Investment Operations 9.254 .908 (4.778) 1.250 16.792 4.363
Distributions
Dividends from Net Investment Income (1.044) (2.508) (2.632) (3.290) (3.002) (4.323)
Distributions from Realized Capital Gains — — — — — —
Total Distributions (1.044) (2.508) (2.632) (3.290) (3.002) (4.323)
Net Asset Value, End of Period $96.09 $87.88 $89.48 $96.89 $98.93 $85.14
Total Return2 10.63% 1.15% -5.03% 1.23% 20.16% 5.51%
Ratios/Supplemental Data
Net Assets, End of Period (Millions) $4,870 $4,424 $4,501 $4,713 $4,687 $3,684
Ratio of Total Expenses to
Average Net Assets 0.10% 0.10% 0.11% 0.12% 0.12% 0.12%
Ratio of Net Investment Income to
Average Net Assets 2.52% 3.02% 2.85% 3.35%1 2.87% 3.31%
Portfolio Turnover Rate3 3% 5% 3% 4% 8% 6%
The expense ratio, net investment income ratio, and turnover rate for the current period have been annualized.
1 Net investment income per share and the ratio of net investment income to average net assets include $.441 and 0.44%, respectively, resulting from income received from Vodafone Group plc in the form of cash and shares in Verizon Communications Inc. in February 2014.
2 Total returns do not include transaction fees that may have applied in the periods shown. Fund prospectuses provide information about any applicable transaction fees.
3 Excludes the value of portfolio securities received or delivered as a result of in-kind purchases or redemptions of the fund’s capital shares, including ETF Creation Units.
Financial Highlights
See accompanying Notes, which are an integral part of the Financial Statements.
FTSE All-World ex-US Index Fund
23

Institutional Plus Shares Six Months
Ended
For a Share Outstanding April 30, Year Ended October 31,
Throughout Each Period 2017 2016 2015 2014 2013 2012
Net Asset Value, Beginning of Period $93.06 $94.75 $102.60 $104.76 $90.17 $90.15
Investment Operations
Net Investment Income 1.210 2.754 2.829 3.5171 2.749 2.809
Net Realized and Unrealized Gain (Loss)
on Investments 8.604 (1.767) (7.869) (2.169) 15.050 1.829
Total from Investment Operations 9.814 .987 (5.040) 1.348 17.799 4.638
Distributions
Dividends from Net Investment Income (1.124) (2.677) (2.810) (3.508) (3.209) (4.618)
Distributions from Realized Capital Gains — — — — — —
Total Distributions (1.124) (2.677) (2.810) (3.508) (3.209) (4.618)
Net Asset Value, End of Period $101.75 $93.06 $94.75 $102.60 $104.76 $90.17
Total Return2 10.65% 1.18% -5.01% 1.25% 20.18% 5.54%
Ratios/Supplemental Data
Net Assets, End of Period (Millions) $2,372 $2,222 $2,628 $2,122 $1,671 $1,274
Ratio of Total Expenses to
Average Net Assets 0.07% 0.07% 0.09% 0.10% 0.10% 0.10%
Ratio of Net Investment Income to
Average Net Assets 2.55% 3.05% 2.87% 3.37%1 2.89% 3.33%
Portfolio Turnover Rate3 3% 5% 3% 4% 8% 6%
The expense ratio, net investment income ratio, and turnover rate for the current period have been annualized.
1 Net investment income per share and the ratio of net investment income to average net assets include $.467 and 0.44%, respectively, resulting from income received from Vodafone Group plc in the form of cash and shares in Verizon Communications Inc. in February 2014.
2 Total returns do not include transaction fees that may have applied in the periods shown. Fund prospectuses provide information about any applicable transaction fees.
3 Excludes the value of portfolio securities received or delivered as a result of in-kind purchases or redemptions of the fund’s capital shares, including ETF Creation Units.
Financial Highlights
See accompanying Notes, which are an integral part of the Financial Statements.
FTSE All-World ex-US Index Fund
24
Notes to Financial Statements
FTSE All-World ex-US Index Fund
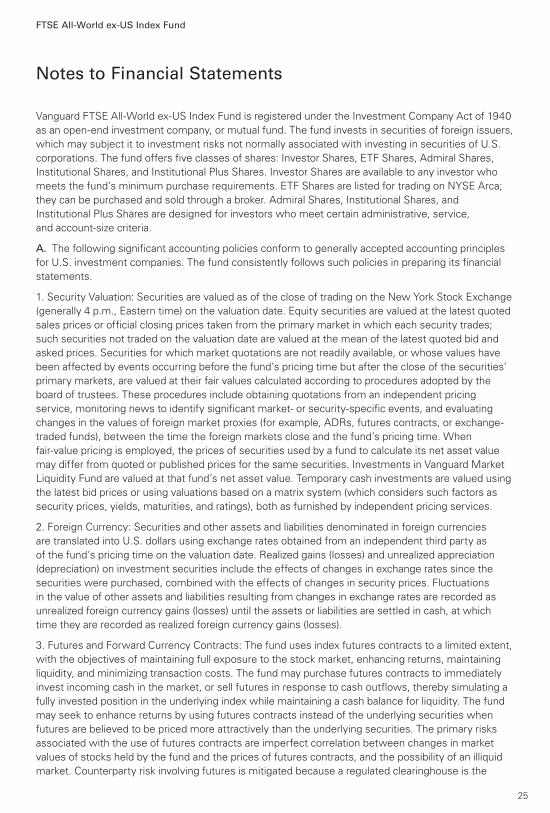
Vanguard FTSE All-World ex-US Index Fund is registered under the Investment Company Act of 1940
as an open-end investment company, or mutual fund. The fund invests in securities of foreign issuers,
which may subject it to investment risks not normally associated with investing in securities of U.S.
corporations. The fund offers five classes of shares: Investor Shares, ETF Shares, Admiral Shares,
Institutional Shares, and Institutional Plus Shares. Investor Shares are available to any investor who
meets the fund’s minimum purchase requirements. ETF Shares are listed for trading on NYSE Arca;
they can be purchased and sold through a broker. Admiral Shares, Institutional Shares, and
Institutional Plus Shares are designed for investors who meet certain administrative, service,
and account-size criteria.
A. The following significant accounting policies conform to generally accepted accounting principles
for U.S. investment companies. The fund consistently follows such policies in preparing its financial
statements.
1. Security Valuation: Securities are valued as of the close of trading on the New York Stock Exchange
(generally 4 p.m., Eastern time) on the valuation date. Equity securities are valued at the latest quoted
sales prices or official closing prices taken from the primary market in which each security trades;
such securities not traded on the valuation date are valued at the mean of the latest quoted bid and
asked prices. Securities for which market quotations are not readily available, or whose values have
been affected by events occurring before the fund’s pricing time but after the close of the securities’
primary markets, are valued at their fair values calculated according to procedures adopted by the
board of trustees. These procedures include obtaining quotations from an independent pricing
service, monitoring news to identify significant market- or security-specific events, and evaluating
changes in the values of foreign market proxies (for example, ADRs, futures contracts, or exchange-
traded funds), between the time the foreign markets close and the fund’s pricing time. When
fair-value pricing is employed, the prices of securities used by a fund to calculate its net asset value
may differ from quoted or published prices for the same securities. Investments in Vanguard Market
Liquidity Fund are valued at that fund’s net asset value. Temporary cash investments are valued using
the latest bid prices or using valuations based on a matrix system (which considers such factors as
security prices, yields, maturities, and ratings), both as furnished by independent pricing services.
2. Foreign Currency: Securities and other assets and liabilities denominated in foreign currencies
are translated into U.S. dollars using exchange rates obtained from an independent third party as
of the fund’s pricing time on the valuation date. Realized gains (losses) and unrealized appreciation
(depreciation) on investment securities include the effects of changes in exchange rates since the
securities were purchased, combined with the effects of changes in security prices. Fluctuations
in the value of other assets and liabilities resulting from changes in exchange rates are recorded as
unrealized foreign currency gains (losses) until the assets or liabilities are settled in cash, at which
time they are recorded as realized foreign currency gains (losses).
3. Futures and Forward Currency Contracts: The fund uses index futures contracts to a limited extent,
with the objectives of maintaining full exposure to the stock market, enhancing returns, maintaining
liquidity, and minimizing transaction costs. The fund may purchase futures contracts to immediately
invest incoming cash in the market, or sell futures in response to cash outflows, thereby simulating a
fully invested position in the underlying index while maintaining a cash balance for liquidity. The fund
may seek to enhance returns by using futures contracts instead of the underlying securities when
futures are believed to be priced more attractively than the underlying securities. The primary risks
associated with the use of futures contracts are imperfect correlation between changes in market
values of stocks held by the fund and the prices of futures contracts, and the possibility of an illiquid
market. Counterparty risk involving futures is mitigated because a regulated clearinghouse is the
25
FTSE All-World ex-US Index Fund
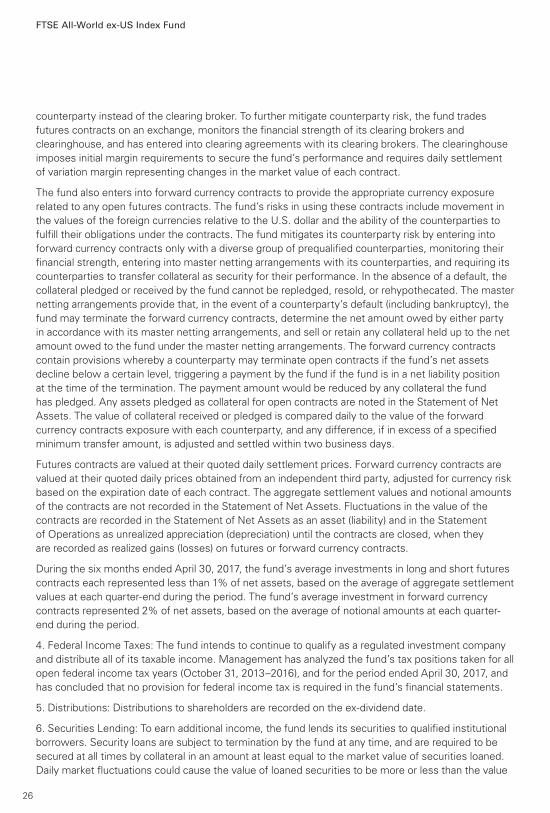
counterparty instead of the clearing broker. To further mitigate counterparty risk, the fund trades
futures contracts on an exchange, monitors the financial strength of its clearing brokers and
clearinghouse, and has entered into clearing agreements with its clearing brokers. The clearinghouse
imposes initial margin requirements to secure the fund’s performance and requires daily settlement
of variation margin representing changes in the market value of each contract.
The fund also enters into forward currency contracts to provide the appropriate currency exposure
related to any open futures contracts. The fund’s risks in using these contracts include movement in
the values of the foreign currencies relative to the U.S. dollar and the ability of the counterparties to
fulfill their obligations under the contracts. The fund mitigates its counterparty risk by entering into
forward currency contracts only with a diverse group of prequalified counterparties, monitoring their
financial strength, entering into master netting arrangements with its counterparties, and requiring its
counterparties to transfer collateral as security for their performance. In the absence of a default, the
collateral pledged or received by the fund cannot be repledged, resold, or rehypothecated. The master
netting arrangements provide that, in the event of a counterparty’s default (including bankruptcy), the
fund may terminate the forward currency contracts, determine the net amount owed by either party
in accordance with its master netting arrangements, and sell or retain any collateral held up to the net
amount owed to the fund under the master netting arrangements. The forward currency contracts
contain provisions whereby a counterparty may terminate open contracts if the fund’s net assets
decline below a certain level, triggering a payment by the fund if the fund is in a net liability position
at the time of the termination. The payment amount would be reduced by any collateral the fund
has pledged. Any assets pledged as collateral for open contracts are noted in the Statement of Net
Assets. The value of collateral received or pledged is compared daily to the value of the forward
currency contracts exposure with each counterparty, and any difference, if in excess of a specified
minimum transfer amount, is adjusted and settled within two business days.
Futures contracts are valued at their quoted daily settlement prices. Forward currency contracts are
valued at their quoted daily prices obtained from an independent third party, adjusted for currency risk
based on the expiration date of each contract. The aggregate settlement values and notional amounts
of the contracts are not recorded in the Statement of Net Assets. Fluctuations in the value of the
contracts are recorded in the Statement of Net Assets as an asset (liability) and in the Statement
of Operations as unrealized appreciation (depreciation) until the contracts are closed, when they
are recorded as realized gains (losses) on futures or forward currency contracts.
During the six months ended April 30, 2017, the fund’s average investments in long and short futures
contracts each represented less than 1% of net assets, based on the average of aggregate settlement
values at each quarter-end during the period. The fund’s average investment in forward currency
contracts represented 2% of net assets, based on the average of notional amounts at each quarter-
end during the period.
4. Federal Income Taxes: The fund intends to continue to qualify as a regulated investment company
and distribute all of its taxable income. Management has analyzed the fund’s tax positions taken for all
open federal income tax years (October 31, 2013–2016), and for the period ended April 30, 2017, and
has concluded that no provision for federal income tax is required in the fund’s financial statements.
5. Distributions: Distributions to shareholders are recorded on the ex-dividend date.
6. Securities Lending: To earn additional income, the fund lends its securities to qualified institutional
borrowers. Security loans are subject to termination by the fund at any time, and are required to be
secured at all times by collateral in an amount at least equal to the market value of securities loaned.
Daily market fluctuations could cause the value of loaned securities to be more or less than the value
26
FTSE All-World ex-US Index Fund
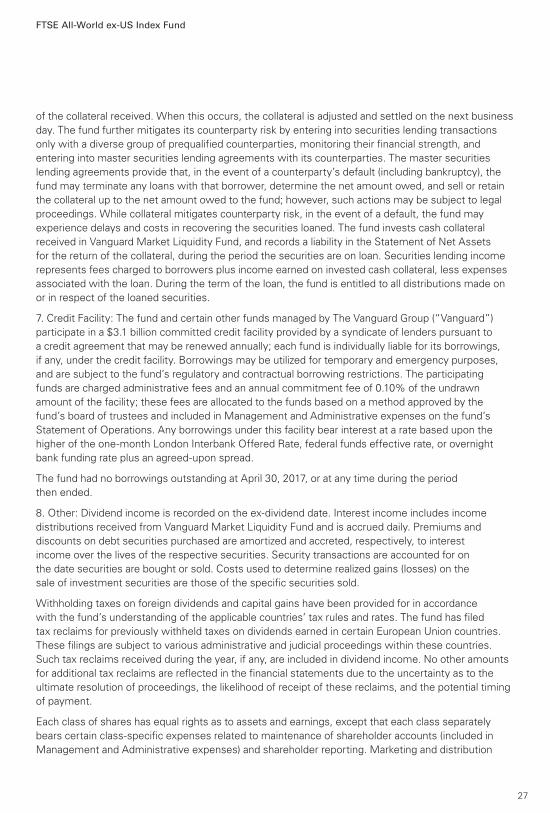
of the collateral received. When this occurs, the collateral is adjusted and settled on the next business
day. The fund further mitigates its counterparty risk by entering into securities lending transactions
only with a diverse group of prequalified counterparties, monitoring their financial strength, and
entering into master securities lending agreements with its counterparties. The master securities
lending agreements provide that, in the event of a counterparty’s default (including bankruptcy), the
fund may terminate any loans with that borrower, determine the net amount owed, and sell or retain
the collateral up to the net amount owed to the fund; however, such actions may be subject to legal
proceedings. While collateral mitigates counterparty risk, in the event of a default, the fund may
experience delays and costs in recovering the securities loaned. The fund invests cash collateral
received in Vanguard Market Liquidity Fund, and records a liability in the Statement of Net Assets
for the return of the collateral, during the period the securities are on loan. Securities lending income
represents fees charged to borrowers plus income earned on invested cash collateral, less expenses
associated with the loan. During the term of the loan, the fund is entitled to all distributions made on
or in respect of the loaned securities.
7. Credit Facility: The fund and certain other funds managed by The Vanguard Group (“Vanguard”)
participate in a $3.1 billion committed credit facility provided by a syndicate of lenders pursuant to
a credit agreement that may be renewed annually; each fund is individually liable for its borrowings,
if any, under the credit facility. Borrowings may be utilized for temporary and emergency purposes,
and are subject to the fund’s regulatory and contractual borrowing restrictions. The participating
funds are charged administrative fees and an annual commitment fee of 0.10% of the undrawn
amount of the facility; these fees are allocated to the funds based on a method approved by the
fund’s board of trustees and included in Management and Administrative expenses on the fund’s
Statement of Operations. Any borrowings under this facility bear interest at a rate based upon the
higher of the one-month London Interbank Offered Rate, federal funds effective rate, or overnight
bank funding rate plus an agreed-upon spread.
The fund had no borrowings outstanding at April 30, 2017, or at any time during the period
then ended.
8. Other: Dividend income is recorded on the ex-dividend date. Interest income includes income
distributions received from Vanguard Market Liquidity Fund and is accrued daily. Premiums and
discounts on debt securities purchased are amortized and accreted, respectively, to interest
income over the lives of the respective securities. Security transactions are accounted for on
the date securities are bought or sold. Costs used to determine realized gains (losses) on the
sale of investment securities are those of the specific securities sold.
Withholding taxes on foreign dividends and capital gains have been provided for in accordance
with the fund’s understanding of the applicable countries’ tax rules and rates. The fund has filed
tax reclaims for previously withheld taxes on dividends earned in certain European Union countries.
These filings are subject to various administrative and judicial proceedings within these countries.
Such tax reclaims received during the year, if any, are included in dividend income. No other amounts
for additional tax reclaims are reflected in the financial statements due to the uncertainty as to the
ultimate resolution of proceedings, the likelihood of receipt of these reclaims, and the potential timing
of payment.
Each class of shares has equal rights as to assets and earnings, except that each class separately
bears certain class-specific expenses related to maintenance of shareholder accounts (included in
Management and Administrative expenses) and shareholder reporting. Marketing and distribution
27
FTSE All-World ex-US Index Fund
expenses are allocated to each class of shares based on a method approved by the board of trustees.
Income, other non-class-specific expenses, and gains and losses on investments are allocated to
each class of shares based on its relative net assets.
B. In accordance with the terms of a Funds’ Service Agreement (the “FSA”) between Vanguard and
the fund, Vanguard furnishes to the fund investment advisory, corporate management, administrative,
marketing, and distribution services at Vanguard’s cost of operations (as defined by the FSA). These
costs of operations are allocated to the fund based on methods and guidelines approved by the board
of trustees. Vanguard does not require reimbursement in the current period for certain costs of
operations (such as deferred compensation/benefits and risk/insurance costs); the fund’s liability
for these costs of operations is included in Payables to Vanguard on the Statement of Net Assets.
Upon the request of Vanguard, the fund may invest up to 0.40% of its net assets as capital in
Vanguard. At April 30, 2017, the fund had contributed to Vanguard capital in the amount of
$1,959,000, representing 0.01% of the fund’s net assets and 0.78% of Vanguard’s capitalization.
The fund’s trustees and officers are also directors and employees, respectively, of Vanguard.
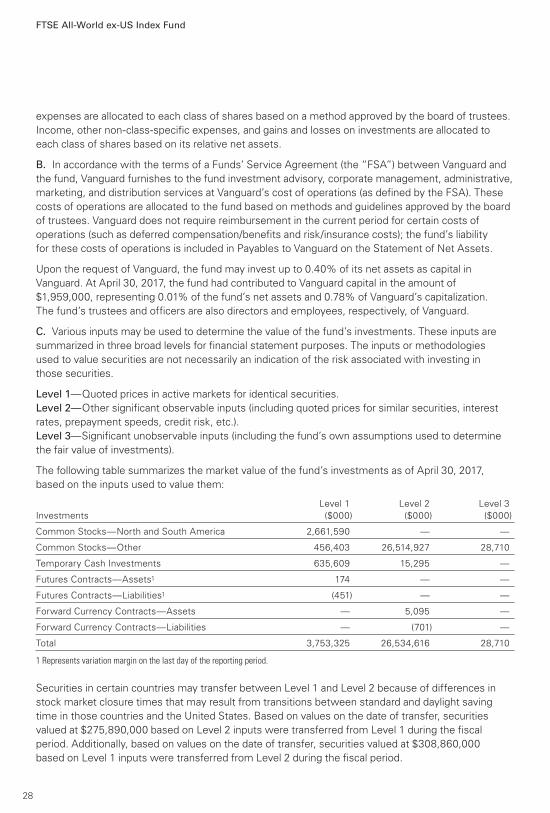
C. Various inputs may be used to determine the value of the fund’s investments. These inputs are
summarized in three broad levels for financial statement purposes. The inputs or methodologies
used to value securities are not necessarily an indication of the risk associated with investing in
those securities.
Level 1—Quoted prices in active markets for identical securities.
Level 2—Other significant observable inputs (including quoted prices for similar securities, interest
rates, prepayment speeds, credit risk, etc.).
Level 3—Significant unobservable inputs (including the fund’s own assumptions used to determine
the fair value of investments).
The following table summarizes the market value of the fund’s investments as of April 30, 2017,
based on the inputs used to value them:
Level 1 Level 2 Level 3
Investments ($000) ($000) ($000)
Common Stocks—North and South America 2,661,590 — —
Common Stocks—Other 456,403 26,514,927 28,710
Temporary Cash Investments 635,609 15,295 —
Futures Contracts—Assets1 174 — —
Futures Contracts—Liabilities1 (451) — —
Forward Currency Contracts—Assets — 5,095 —
Forward Currency Contracts—Liabilities — (701) —
Total 3,753,325 26,534,616 28,710
1 Represents variation margin on the last day of the reporting period.
Securities in certain countries may transfer between Level 1 and Level 2 because of differences in
stock market closure times that may result from transitions between standard and daylight saving
time in those countries and the United States. Based on values on the date of transfer, securities
valued at $275,890,000 based on Level 2 inputs were transferred from Level 1 during the fiscal
period. Additionally, based on values on the date of transfer, securities valued at $308,860,000
based on Level 1 inputs were transferred from Level 2 during the fiscal period.
28
FTSE All-World ex-US Index Fund
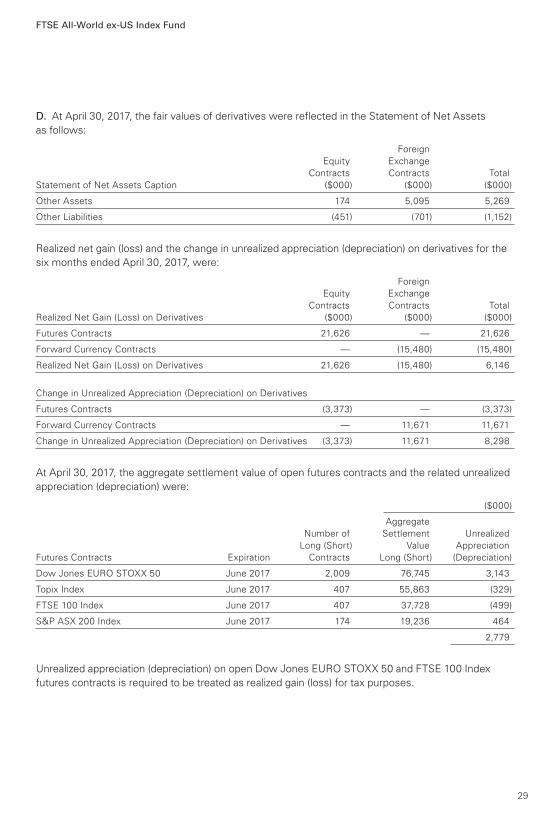
D. At April 30, 2017, the fair values of derivatives were reflected in the Statement of Net Assets
as follows:
Foreign
Equity Exchange
Contracts Contracts Total
Statement of Net Assets Caption ($000) ($000) ($000)
Other Assets 174 5,095 5,269
Other Liabilities (451) (701) (1,152)
Realized net gain (loss) and the change in unrealized appreciation (depreciation) on derivatives for the
six months ended April 30, 2017, were:
Foreign
Equity Exchange
Contracts Contracts Total
Realized Net Gain (Loss) on Derivatives ($000) ($000) ($000)
Futures Contracts 21,626 — 21,626
Forward Currency Contracts — (15,480) (15,480)
Realized Net Gain (Loss) on Derivatives 21,626 (15,480) 6,146
Change in Unrealized Appreciation (Depreciation) on Derivatives
Futures Contracts (3,373) — (3,373)
Forward Currency Contracts — 11,671 11,671
Change in Unrealized Appreciation (Depreciation) on Derivatives (3,373) 11,671 8,298
At April 30, 2017, the aggregate settlement value of open futures contracts and the related unrealized
appreciation (depreciation) were:
($000)
Aggregate
Number of Settlement Unrealized
Long (Short) Value Appreciation
Futures Contracts Expiration Contracts Long (Short) (Depreciation)
Dow Jones EURO STOXX 50 June 2017 2,009 76,745 3,143
Topix Index June 2017 407 55,863 (329)
FTSE 100 Index June 2017 407 37,728 (499)
S&P ASX 200 Index June 2017 174 19,236 464
2,779
Unrealized appreciation (depreciation) on open Dow Jones EURO STOXX 50 and FTSE 100 Index
futures contracts is required to be treated as realized gain (loss) for tax purposes.
29
FTSE All-World ex-US Index Fund
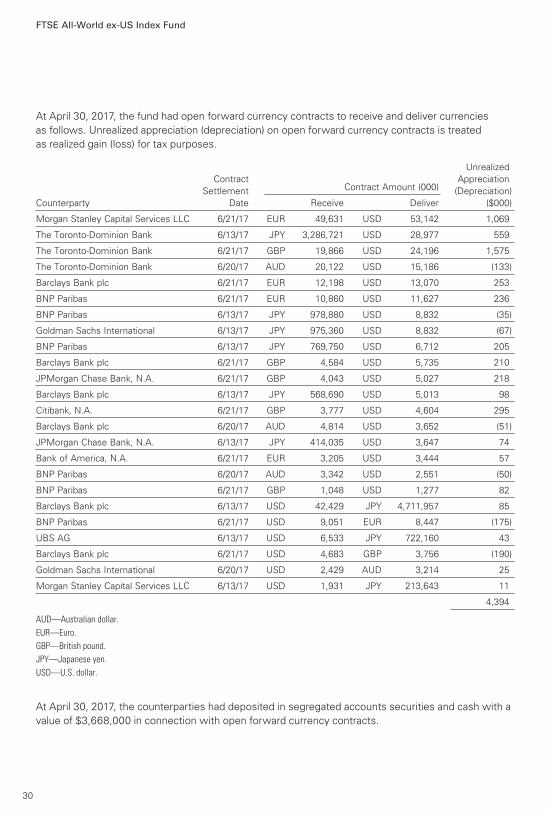
At April 30, 2017, the fund had open forward currency contracts to receive and deliver currencies
as follows. Unrealized appreciation (depreciation) on open forward currency contracts is treated
as realized gain (loss) for tax purposes.
Unrealized
Contract Appreciation
Settlement Contract Amount (000) (Depreciation)
Counterparty Date Receive Deliver ($000)
Morgan Stanley Capital Services LLC 6/21/17 EUR 49,631 USD 53,142 1,069
The Toronto-Dominion Bank 6/13/17 JPY 3,286,721 USD 28,977 559
The Toronto-Dominion Bank 6/21/17 GBP 19,866 USD 24,196 1,575
The Toronto-Dominion Bank 6/20/17 AUD 20,122 USD 15,186 (133)
Barclays Bank plc 6/21/17 EUR 12,198 USD 13,070 253
BNP Paribas 6/21/17 EUR 10,860 USD 11,627 236
BNP Paribas 6/13/17 JPY 978,880 USD 8,832 (35)
Goldman Sachs International 6/13/17 JPY 975,360 USD 8,832 (67)
BNP Paribas 6/13/17 JPY 769,750 USD 6,712 205
Barclays Bank plc 6/21/17 GBP 4,584 USD 5,735 210
JPMorgan Chase Bank, N.A. 6/21/17 GBP 4,043 USD 5,027 218
Barclays Bank plc 6/13/17 JPY 568,690 USD 5,013 98
Citibank, N.A. 6/21/17 GBP 3,777 USD 4,604 295
Barclays Bank plc 6/20/17 AUD 4,814 USD 3,652 (51)
JPMorgan Chase Bank, N.A. 6/13/17 JPY 414,035 USD 3,647 74
Bank of America, N.A. 6/21/17 EUR 3,205 USD 3,444 57
BNP Paribas 6/20/17 AUD 3,342 USD 2,551 (50)
BNP Paribas 6/21/17 GBP 1,048 USD 1,277 82
Barclays Bank plc 6/13/17 USD 42,429 JPY 4,711,957 85
BNP Paribas 6/21/17 USD 9,051 EUR 8,447 (175)
UBS AG 6/13/17 USD 6,533 JPY 722,160 43
Barclays Bank plc 6/21/17 USD 4,683 GBP 3,756 (190)
Goldman Sachs International 6/20/17 USD 2,429 AUD 3,214 25
Morgan Stanley Capital Services LLC 6/13/17 USD 1,931 JPY 213,643 11
4,394
AUD—Australian dollar.
EUR—Euro.
GBP—British pound.
JPY—Japanese yen.
USD—U.S. dollar.
At April 30, 2017, the counterparties had deposited in segregated accounts securities and cash with a
value of $3,668,000 in connection with open forward currency contracts.
30
FTSE All-World ex-US Index Fund
E. Distributions are determined on a tax basis and may differ from net investment income and
realized capital gains for financial reporting purposes. Differences may be permanent or temporary.
Permanent differences are reclassified among capital accounts in the financial statements to reflect
their tax character. Temporary differences arise when certain items of income, expense, gain, or loss
are recognized in different periods for financial statement and tax purposes. These differences will
reverse at some time in the future. Differences in classification may also result from the treatment
of short-term gains as ordinary income for tax purposes.
During the six months ended April 30, 2017, the fund realized net foreign currency losses of
$4,688,000, which decreased distributable net income for tax purposes; accordingly, such losses
have been reclassified from accumulated net realized losses to undistributed net investment income.
The fund’s tax-basis capital gains and losses are determined only at the end of each fiscal year.
For tax purposes, at October 31, 2016, the fund had available capital losses totaling $1,284,197,000
to offset future net capital gains. Of this amount, $249,855,000 is subject to expiration dates;
$138,065,000 may be used to offset future net capital gains through October 31, 2017, $32,560,000
through October 31, 2018, and $79,230,000 through October 31, 2019. Capital losses of
$1,034,342,000 realized beginning in fiscal 2012 may be carried forward indefinitely under the
Regulated Investment Company Modernization Act of 2010, but must be used before any expiring
loss carryforwards. The fund will use these capital losses to offset net taxable capital gains, if any,
realized during the year ending October 31, 2017; should the fund realize net capital losses for the
year, the losses will be added to the loss carryforward balance above.
At April 30, 2017, the cost of investment securities for tax purposes was $27,828,131,000. Net
unrealized appreciation of investment securities for tax purposes was $2,484,403,000, consisting
of unrealized gains of $5,352,910,000 on securities that had risen in value since their purchase and
$2,868,507,000 in unrealized losses on securities that had fallen in value since their purchase.
F. During the six months ended April 30, 2017, the fund purchased $3,029,630,000 of investment
securities and sold $391,226,000 of investment securities, other than temporary cash investments.
Purchases and sales include $1,930,244,000 and $0, respectively, in connection with in-kind
purchases and redemptions of the fund’s capital shares.
31
FTSE All-World ex-US Index Fund
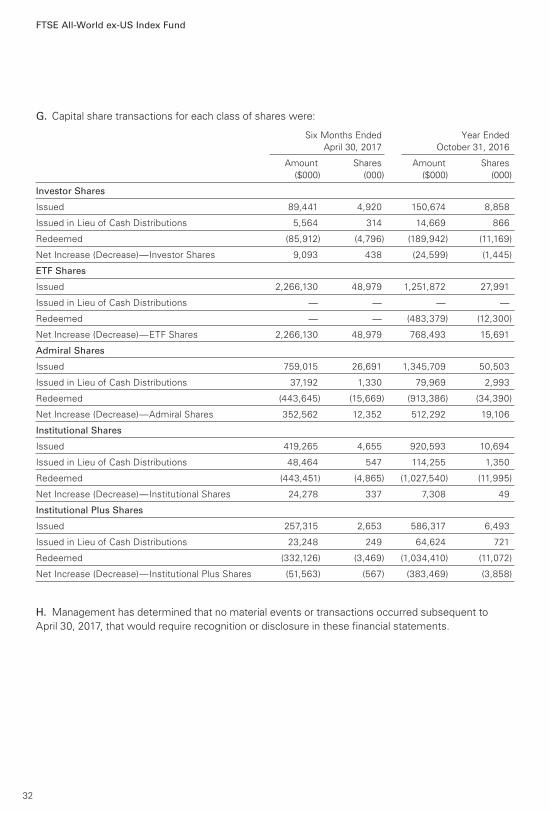
G. Capital share transactions for each class of shares were:
Six Months Ended Year Ended
April 30, 2017 October 31, 2016
Amount Shares Amount Shares
($000) (000) ($000) (000)
Investor Shares
Issued 89,441 4,920 150,674 8,858
Issued in Lieu of Cash Distributions 5,564 314 14,669 866
Redeemed (85,912) (4,796) (189,942) (11,169)
Net Increase (Decrease)—Investor Shares 9,093 438 (24,599) (1,445)
ETF Shares
Issued 2,266,130 48,979 1,251,872 27,991
Issued in Lieu of Cash Distributions — — — —
Redeemed — — (483,379) (12,300)
Net Increase (Decrease)—ETF Shares 2,266,130 48,979 768,493 15,691
Admiral Shares
Issued 759,015 26,691 1,345,709 50,503
Issued in Lieu of Cash Distributions 37,192 1,330 79,969 2,993
Redeemed (443,645) (15,669) (913,386) (34,390)
Net Increase (Decrease)—Admiral Shares 352,562 12,352 512,292 19,106
Institutional Shares
Issued 419,265 4,655 920,593 10,694
Issued in Lieu of Cash Distributions 48,464 547 114,255 1,350
Redeemed (443,451) (4,865) (1,027,540) (11,995)
Net Increase (Decrease)—Institutional Shares 24,278 337 7,308 49
Institutional Plus Shares
Issued 257,315 2,653 586,317 6,493
Issued in Lieu of Cash Distributions 23,248 249 64,624 721
Redeemed (332,126) (3,469) (1,034,410) (11,072)
Net Increase (Decrease)—Institutional Plus Shares (51,563) (567) (383,469) (3,858)
H. Management has determined that no material events or transactions occurred subsequent to
April 30, 2017, that would require recognition or disclosure in these financial statements.
32
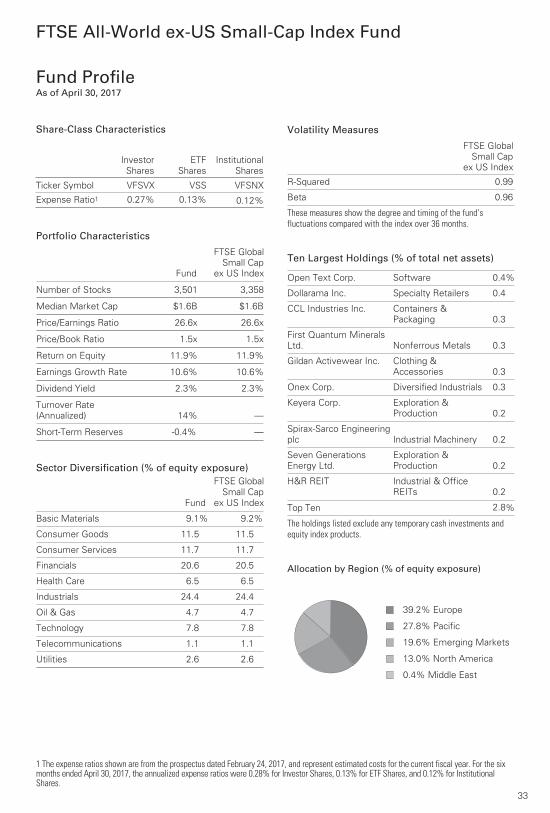
1 The expense ratios shown are from the prospectus dated February 24, 2017, and represent estimated costs for the current fiscal year. For the six months ended April 30, 2017, the annualized expense ratios were 0.28% for Investor Shares, 0.13% for ETF Shares, and 0.12% for Institutional Shares.
Fund ProfileAs of April 30, 2017
FTSE All-World ex-US Small-Cap Index Fund
33
Volatility Measures
FTSE Global
Small Cap
ex US Index
R-Squared 0.99
Beta 0.96
These measures show the degree and timing of the fund’s fluctuations compared with the index over 36 months.
Ten Largest Holdings (% of total net assets)
Open Text Corp. Software 0.4%
Dollarama Inc. Specialty Retailers 0.4
CCL Industries Inc. Containers &
Packaging 0.3
First Quantum Minerals
Ltd. Nonferrous Metals 0.3
Gildan Activewear Inc. Clothing &
Accessories 0.3
Onex Corp. Diversified Industrials 0.3
Keyera Corp. Exploration &
Production 0.2
Spirax-Sarco Engineering
plc Industrial Machinery 0.2
Seven Generations
Energy Ltd.
Exploration &
Production 0.2
H&R REIT Industrial & Office
REITs 0.2
Top Ten 2.8%
The holdings listed exclude any temporary cash investments andequity index products.
Allocation by Region (% of equity exposure)
39.2% Europe
27.8% Pacific
19.6% Emerging Markets
13.0% North America
0.4% Middle East
Share-Class Characteristics
InvestorShares
ETF Shares
InstitutionalShares
Ticker Symbol VFSVX VSS VFSNX
Expense Ratio1 0.27% 0.13% 0.12%
Portfolio Characteristics
Fund
FTSE Global
Small Cap
ex US Index
Number of Stocks 3,501 3,358
Median Market Cap $1.6B $1.6B
Price/Earnings Ratio 26.6x 26.6x
Price/Book Ratio 1.5x 1.5x
Return on Equity 11.9% 11.9%
Earnings Growth Rate 10.6% 10.6%
Dividend Yield 2.3% 2.3%
Turnover Rate
(Annualized) 14% —
Short-Term Reserves -0.4% —
Sector Diversification (% of equity exposure)
Fund
FTSE GlobalSmall Cap
ex US Index
Basic Materials 9.1% 9.2%
Consumer Goods 11.5 11.5
Consumer Services 11.7 11.7
Financials 20.6 20.5
Health Care 6.5 6.5
Industrials 24.4 24.4
Oil & Gas 4.7 4.7
Technology 7.8 7.8
Telecommunications 1.1 1.1
Utilities 2.6 2.6
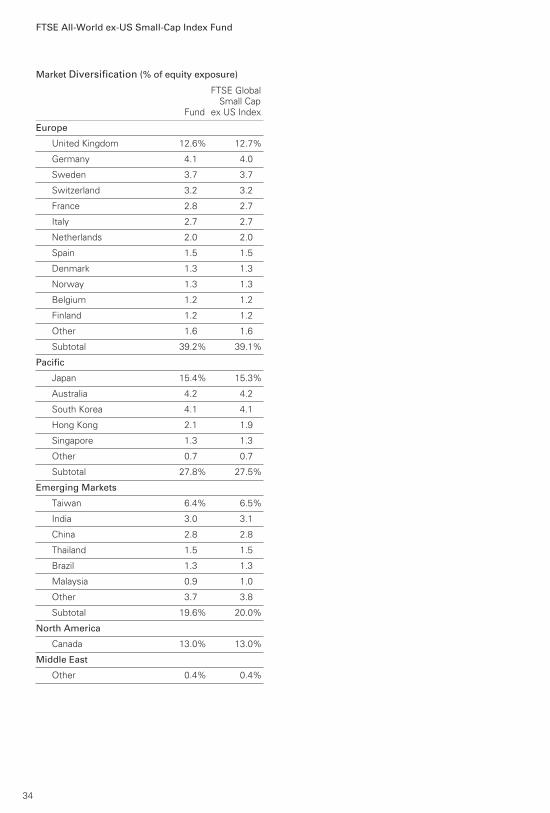
FTSE All-World ex-US Small-Cap Index Fund
34
Market Diversification (% of equity exposure)
Fund
FTSE GlobalSmall Cap
ex US Index
Europe
United Kingdom 12.6% 12.7%
Germany 4.1 4.0
Sweden 3.7 3.7
Switzerland 3.2 3.2
France 2.8 2.7
Italy 2.7 2.7
Netherlands 2.0 2.0
Spain 1.5 1.5
Denmark 1.3 1.3
Norway 1.3 1.3
Belgium 1.2 1.2
Finland 1.2 1.2
Other 1.6 1.6
Subtotal 39.2% 39.1%
Pacific
Japan 15.4% 15.3%
Australia 4.2 4.2
South Korea 4.1 4.1
Hong Kong 2.1 1.9
Singapore 1.3 1.3
Other 0.7 0.7
Subtotal 27.8% 27.5%
Emerging Markets
Taiwan 6.4% 6.5%
India 3.0 3.1
China 2.8 2.8
Thailand 1.5 1.5
Brazil 1.3 1.3
Malaysia 0.9 1.0
Other 3.7 3.8
Subtotal 19.6% 20.0%
North America
Canada 13.0% 13.0%
Middle East
Other 0.4% 0.4%
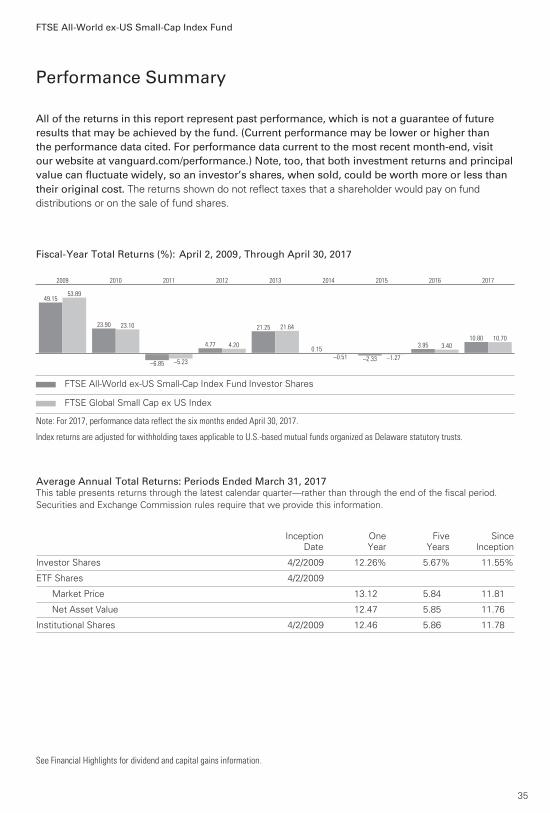
All of the returns in this report represent past performance, which is not a guarantee of future results that may be achieved by the fund. (Current performance may be lower or higher thanthe performance data cited. For performance data current to the most recent month-end, visitour website at vanguard.com/performance.) Note, too, that both investment returns and principalvalue can fluctuate widely, so an investor’s shares, when sold, could be worth more or less than their original cost. The returns shown do not reflect taxes that a shareholder would pay on fund
distributions or on the sale of fund shares.
Performance Summary
See Financial Highlights for dividend and capital gains information.
FTSE All-World ex-US Small-Cap Index Fund
35
Fiscal-Year Total Returns (%): April 2, 2009, Through April 30, 2017
49.1553.89
2009
23.90 23.10
2010
–6.85 –5.23
2011
4.77 4.20
2012
21.25 21.64
2013
0.15
–0.51
2014
–2.33 –1.27
2015
3.95 3.40
2016
10.80 10.70
2017
FTSE All-World ex-US Small-Cap Index Fund Investor Shares
FTSE Global Small Cap ex US Index
Note: For 2017, performance data reflect the six months ended April 30, 2017.
Index returns are adjusted for withholding taxes applicable to U.S.-based mutual funds organized as Delaware statutory trusts.
Average Annual Total Returns: Periods Ended March 31, 2017This table presents returns through the latest calendar quarter—rather than through the end of the fiscal period.Securities and Exchange Commission rules require that we provide this information.
InceptionDate
OneYear
FiveYears
SinceInception
Investor Shares 4/2/2009 12.26% 5.67% 11.55%
ETF Shares 4/2/2009
Market Price 13.12 5.84 11.81
Net Asset Value 12.47 5.85 11.76
Institutional Shares 4/2/2009 12.46 5.86 11.78
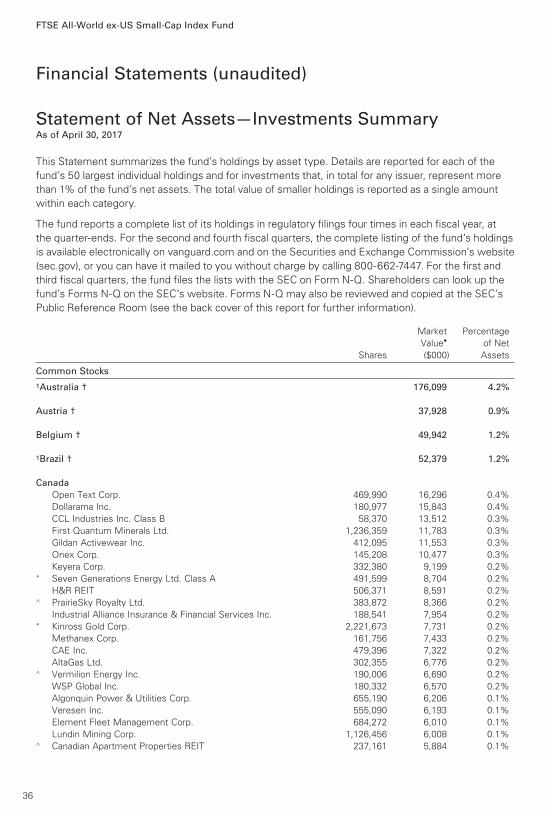
Financial Statements (unaudited)
Statement of Net Assets—Investments SummaryAs of April 30, 2017
This Statement summarizes the fund’s holdings by asset type. Details are reported for each of the
fund’s 50 largest individual holdings and for investments that, in total for any issuer, represent more
than 1% of the fund’s net assets. The total value of smaller holdings is reported as a single amount
within each category.
The fund reports a complete list of its holdings in regulatory filings four times in each fiscal year, at
the quarter-ends. For the second and fourth fiscal quarters, the complete listing of the fund’s holdings
is available electronically on vanguard.com and on the Securities and Exchange Commission’s website
(sec.gov), or you can have it mailed to you without charge by calling 800-662-7447. For the first and
third fiscal quarters, the fund files the lists with the SEC on Form N-Q. Shareholders can look up the
fund’s Forms N-Q on the SEC’s website. Forms N-Q may also be reviewed and copied at the SEC’s
Public Reference Room (see the back cover of this report for further information).
FTSE All-World ex-US Small-Cap Index Fund
Market Percentage
Value• of Net
Shares ($000) Assets
Common Stocks
1Australia † 176,099 4.2%
Austria † 37,928 0.9%
Belgium † 49,942 1.2%
1Brazil † 52,379 1.2%
Canada Open Text Corp. 469,990 16,296 0.4%
Dollarama Inc. 180,977 15,843 0.4%
CCL Industries Inc. Class B 58,370 13,512 0.3%
First Quantum Minerals Ltd. 1,236,359 11,783 0.3%
Gildan Activewear Inc. 412,095 11,553 0.3%
Onex Corp. 145,208 10,477 0.3%
Keyera Corp. 332,380 9,199 0.2% * Seven Generations Energy Ltd. Class A 491,599 8,704 0.2%
H&R REIT 506,371 8,591 0.2% ^ PrairieSky Royalty Ltd. 383,872 8,366 0.2%
Industrial Alliance Insurance & Financial Services Inc. 188,541 7,954 0.2% * Kinross Gold Corp. 2,221,673 7,731 0.2%
Methanex Corp. 161,756 7,433 0.2%
CAE Inc. 479,396 7,322 0.2%
AltaGas Ltd. 302,355 6,776 0.2% ^ Vermilion Energy Inc. 190,006 6,690 0.2%
WSP Global Inc. 180,332 6,570 0.2%
Algonquin Power & Utilities Corp. 655,190 6,206 0.1%
Veresen Inc. 555,090 6,193 0.1%
Element Fleet Management Corp. 684,272 6,010 0.1%
Lundin Mining Corp. 1,126,456 6,008 0.1% ^ Canadian Apartment Properties REIT 237,161 5,884 0.1%
36
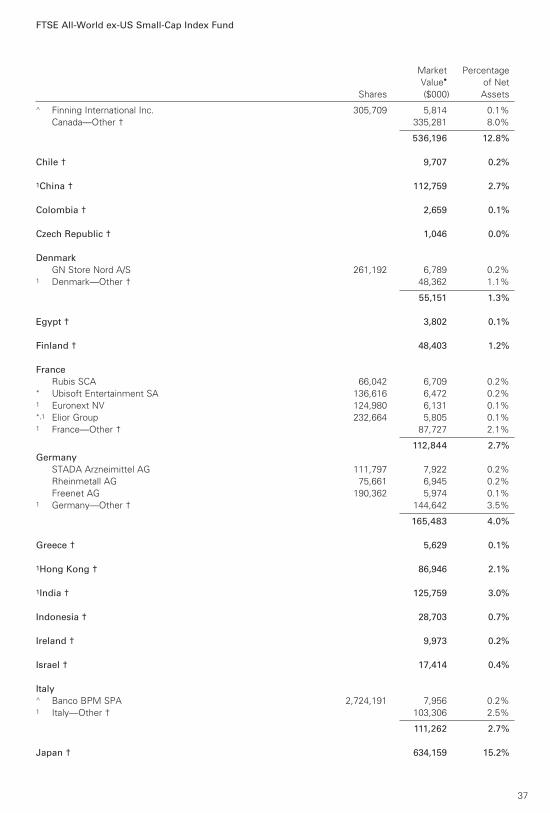
FTSE All-World ex-US Small-Cap Index Fund
^ Finning International Inc. 305,709 5,814 0.1%
Canada—Other † 335,281 8.0%
536,196 12.8%
Chile † 9,707 0.2%
1China † 112,759 2.7%
Colombia † 2,659 0.1%
Czech Republic † 1,046 0.0%
Denmark GN Store Nord A/S 261,192 6,789 0.2% 1 Denmark—Other † 48,362 1.1%
55,151 1.3%
Egypt † 3,802 0.1%
Finland † 48,403 1.2%
France Rubis SCA 66,042 6,709 0.2% * Ubisoft Entertainment SA 136,616 6,472 0.2% 1 Euronext NV 124,980 6,131 0.1% *,1 Elior Group 232,664 5,805 0.1% 1 France—Other † 87,727 2.1%
112,844 2.7% Germany STADA Arzneimittel AG 111,797 7,922 0.2%
Rheinmetall AG 75,661 6,945 0.2%
Freenet AG 190,362 5,974 0.1% 1 Germany—Other † 144,642 3.5%
165,483 4.0%
Greece † 5,629 0.1%
1Hong Kong † 86,946 2.1%
1India † 125,759 3.0%
Indonesia † 28,703 0.7%
Ireland † 9,973 0.2%
Israel † 17,414 0.4%
Italy^ Banco BPM SPA 2,724,191 7,956 0.2% 1 Italy—Other † 103,306 2.5%
111,262 2.7%
Japan † 634,159 15.2%
Market Percentage
Value• of Net
Shares ($000) Assets
37
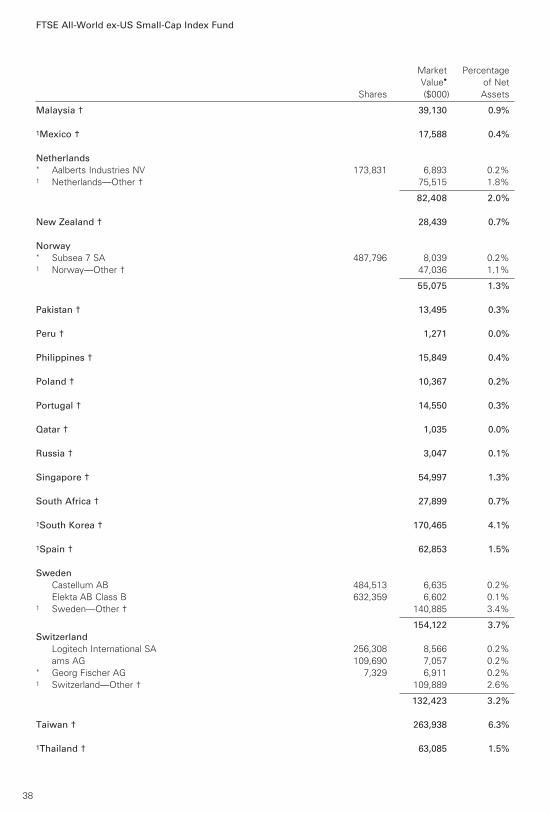
FTSE All-World ex-US Small-Cap Index Fund
Malaysia † 39,130 0.9%
1Mexico † 17,588 0.4%
Netherlands* Aalberts Industries NV 173,831 6,893 0.2% 1 Netherlands—Other † 75,515 1.8%
82,408 2.0%
New Zealand † 28,439 0.7%
Norway* Subsea 7 SA 487,796 8,039 0.2% 1 Norway—Other † 47,036 1.1%
55,075 1.3%
Pakistan † 13,495 0.3%
Peru † 1,271 0.0%
Philippines † 15,849 0.4%
Poland † 10,367 0.2%
Portugal † 14,550 0.3%
Qatar † 1,035 0.0%
Russia † 3,047 0.1%
Singapore † 54,997 1.3%
South Africa † 27,899 0.7%
1South Korea † 170,465 4.1%
1Spain † 62,853 1.5%
Sweden Castellum AB 484,513 6,635 0.2%
Elekta AB Class B 632,359 6,602 0.1% 1 Sweden—Other † 140,885 3.4%
154,122 3.7% Switzerland Logitech International SA 256,308 8,566 0.2%
ams AG 109,690 7,057 0.2% * Georg Fischer AG 7,329 6,911 0.2% 1 Switzerland—Other † 109,889 2.6%
132,423 3.2%
Taiwan † 263,938 6.3%
1Thailand † 63,085 1.5%
Market Percentage
Value• of Net
Shares ($000) Assets
38
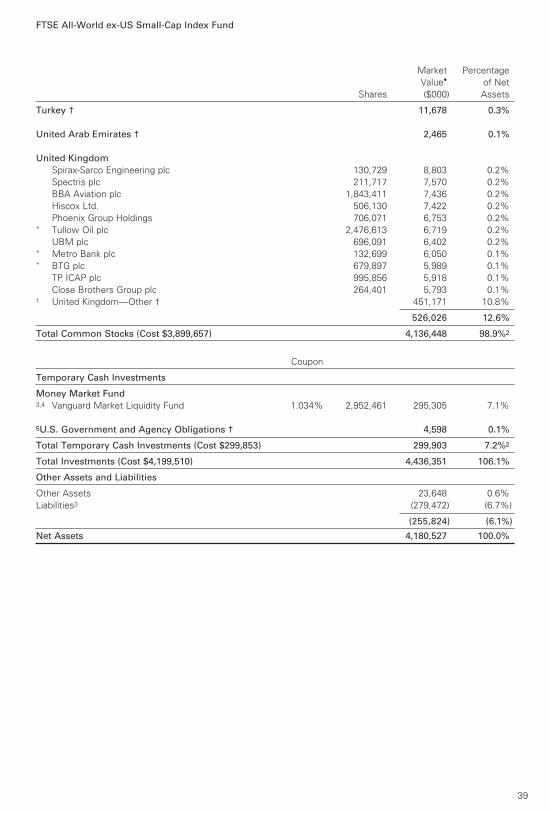
FTSE All-World ex-US Small-Cap Index Fund
Turkey † 11,678 0.3%
United Arab Emirates † 2,465 0.1%
United Kingdom Spirax-Sarco Engineering plc 130,729 8,803 0.2%
Spectris plc 211,717 7,570 0.2%
BBA Aviation plc 1,843,411 7,436 0.2%
Hiscox Ltd. 506,130 7,422 0.2%
Phoenix Group Holdings 706,071 6,753 0.2% * Tullow Oil plc 2,476,613 6,719 0.2%
UBM plc 696,091 6,402 0.2% * Metro Bank plc 132,699 6,050 0.1% * BTG plc 679,897 5,989 0.1%
TP ICAP plc 995,856 5,918 0.1%
Close Brothers Group plc 264,401 5,793 0.1% 1 United Kingdom—Other † 451,171 10.8%
526,026 12.6%
Total Common Stocks (Cost $3,899,657) 4,136,448 98.9%2
Coupon
Temporary Cash Investments
Money Market Fund3,4 Vanguard Market Liquidity Fund 1.034% 2,952,461 295,305 7.1%
5U.S. Government and Agency Obligations † 4,598 0.1%
Total Temporary Cash Investments (Cost $299,853) 299,903 7.2%2
Total Investments (Cost $4,199,510) 4,436,351 106.1%
Other Assets and Liabilities
Other Assets 23,648 0.6%
Liabilities3 (279,472) (6.7%)
(255,824) (6.1%)
Net Assets 4,180,527 100.0%
Market Percentage
Value• of Net
Shares ($000) Assets
39

FTSE All-World ex-US Small-Cap Index Fund
Statement of Assets and Liabilities
Assets Investments in Securities, at Value
Unaffiliated Issuers 4,141,046
Affiliated Vanguard Funds 295,305
Total Investments in Securities 4,436,351
Investment in Vanguard 272
Receivables for Investment Securities Sold 170
Receivables for Accrued Income 14,261
Receivables for Capital Shares Issued 480
Other Assets 8,465
Total Assets 4,459,999
Liabilities Payables for Investment Securities Purchased 245
Collateral for Securities on Loan 276,579
Payables for Capital Shares Redeemed 235
Payables to Vanguard 1,814
Other Liabilities 599
Total Liabilities 279,472
Net Assets 4.180,527
At April 30, 2017, net assets consisted of: Amount
($000)
Paid-in Capital 4,097,027
Undistributed Net Investment Income 3,841
Accumulated Net Realized Losses (157,792)
Unrealized Appreciation (Depreciation)
Investment Securities 236,841
Futures Contracts 583
Forward Currency Contracts 122
Foreign Currencies (95)
Net Assets 4,180,527
Investor Shares—Net Assets
Applicable to 16,769,534 outstanding $.001 par value shares of beneficial interest (unlimited authorization) 672,098
Net Asset Value Per Share—Investor Shares $40.08
ETF Shares—Net Assets
Applicable to 31,759,676 outstanding $.001 par value shares of beneficial interest (unlimited authorization) 3,337,211
Net Asset Value Per Share—ETF Shares $105.08
Amount
($000)
40
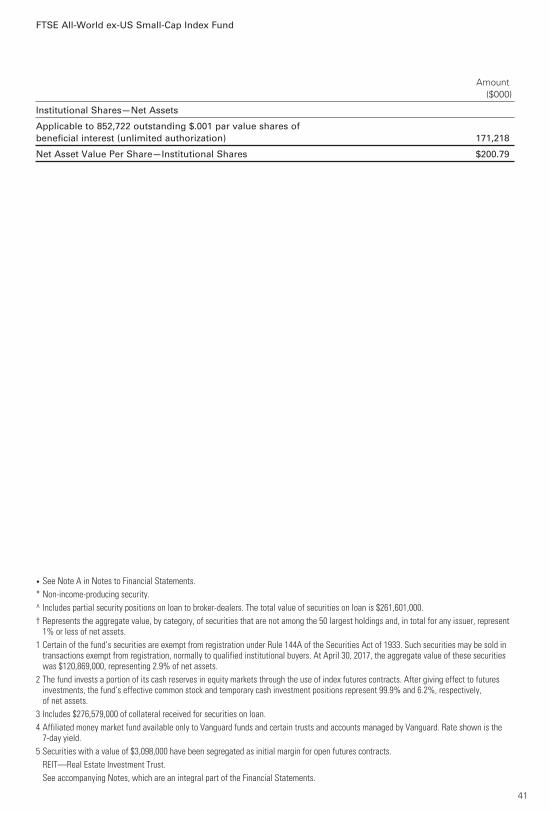
FTSE All-World ex-US Small-Cap Index Fund
Institutional Shares—Net Assets
Applicable to 852,722 outstanding $.001 par value shares of beneficial interest (unlimited authorization) 171,218
Net Asset Value Per Share—Institutional Shares $200.79
Amount
($000)
• See Note A in Notes to Financial Statements.
* Non-income-producing security.
^ Includes partial security positions on loan to broker-dealers. The total value of securities on loan is $261,601,000.
† Represents the aggregate value, by category, of securities that are not among the 50 largest holdings and, in total for any issuer, represent 1% or less of net assets.
1 Certain of the fund’s securities are exempt from registration under Rule 144A of the Securities Act of 1933. Such securities may be sold in transactions exempt from registration, normally to qualified institutional buyers. At April 30, 2017, the aggregate value of these securities was $120,869,000, representing 2.9% of net assets.
2 The fund invests a portion of its cash reserves in equity markets through the use of index futures contracts. After giving effect to futures investments, the fund’s effective common stock and temporary cash investment positions represent 99.9% and 6.2%, respectively, of net assets.
3 Includes $276,579,000 of collateral received for securities on loan.
4 Affiliated money market fund available only to Vanguard funds and certain trusts and accounts managed by Vanguard. Rate shown is the 7-day yield.
5 Securities with a value of $3,098,000 have been segregated as initial margin for open futures contracts.
REIT—Real Estate Investment Trust.
See accompanying Notes, which are an integral part of the Financial Statements.
41
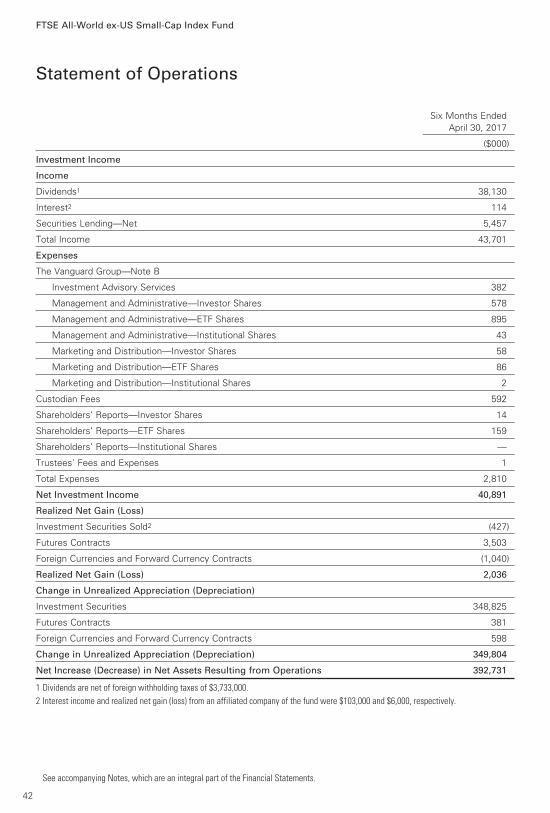
42
Six Months Ended
April 30, 2017
($000)
Investment Income
Income
Dividends1 38,130
Interest2 114
Securities Lending—Net 5,457
Total Income 43,701
Expenses
The Vanguard Group—Note B
Investment Advisory Services 382
Management and Administrative—Investor Shares 578
Management and Administrative—ETF Shares 895
Management and Administrative—Institutional Shares 43
Marketing and Distribution—Investor Shares 58
Marketing and Distribution—ETF Shares 86
Marketing and Distribution—Institutional Shares 2
Custodian Fees 592
Shareholders’ Reports—Investor Shares 14
Shareholders’ Reports—ETF Shares 159
Shareholders’ Reports—Institutional Shares —
Trustees’ Fees and Expenses 1
Total Expenses 2,810
Net Investment Income 40,891
Realized Net Gain (Loss)
Investment Securities Sold2 (427)
Futures Contracts 3,503
Foreign Currencies and Forward Currency Contracts (1,040)
Realized Net Gain (Loss) 2,036
Change in Unrealized Appreciation (Depreciation)
Investment Securities 348,825
Futures Contracts 381
Foreign Currencies and Forward Currency Contracts 598
Change in Unrealized Appreciation (Depreciation) 349,804
Net Increase (Decrease) in Net Assets Resulting from Operations 392,731
1 Dividends are net of foreign withholding taxes of $3,733,000.
2 Interest income and realized net gain (loss) from an affiliated company of the fund were $103,000 and $6,000, respectively.
Statement of Operations
FTSE All-World ex-US Small-Cap Index Fund
See accompanying Notes, which are an integral part of the Financial Statements.
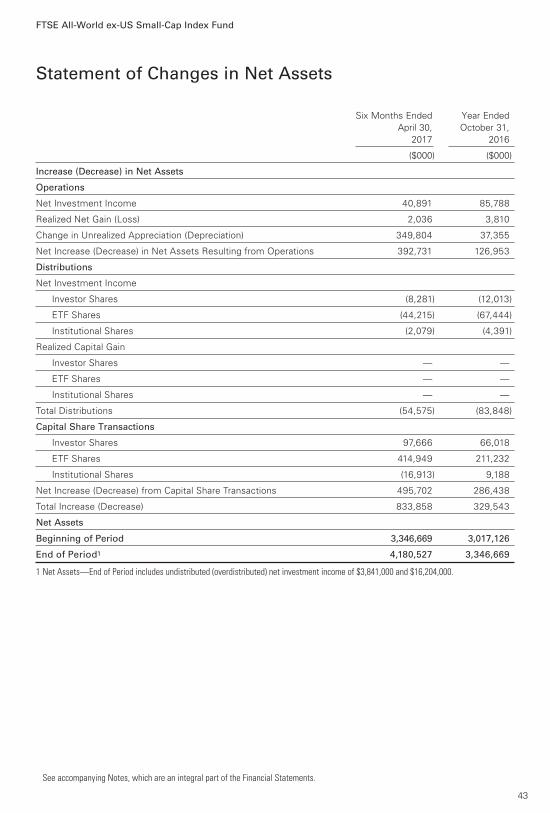
Statement of Changes in Net Assets
FTSE All-World ex-US Small-Cap Index Fund
See accompanying Notes, which are an integral part of the Financial Statements.
Six Months Ended Year Ended
April 30, October 31,
2017 2016
($000) ($000)
Increase (Decrease) in Net Assets
Operations
Net Investment Income 40,891 85,788
Realized Net Gain (Loss) 2,036 3,810
Change in Unrealized Appreciation (Depreciation) 349,804 37,355
Net Increase (Decrease) in Net Assets Resulting from Operations 392,731 126,953
Distributions
Net Investment Income
Investor Shares (8,281) (12,013)
ETF Shares (44,215) (67,444)
Institutional Shares (2,079) (4,391)
Realized Capital Gain
Investor Shares — —
ETF Shares — —
Institutional Shares — —
Total Distributions (54,575) (83,848)
Capital Share Transactions
Investor Shares 97,666 66,018
ETF Shares 414,949 211,232
Institutional Shares (16,913) 9,188
Net Increase (Decrease) from Capital Share Transactions 495,702 286,438
Total Increase (Decrease) 833,858 329,543
Net Assets
Beginning of Period 3,346,669 3,017,126
End of Period1 4,180,527 3,346,669
1 Net Assets—End of Period includes undistributed (overdistributed) net investment income of $3,841,000 and $16,204,000.
43
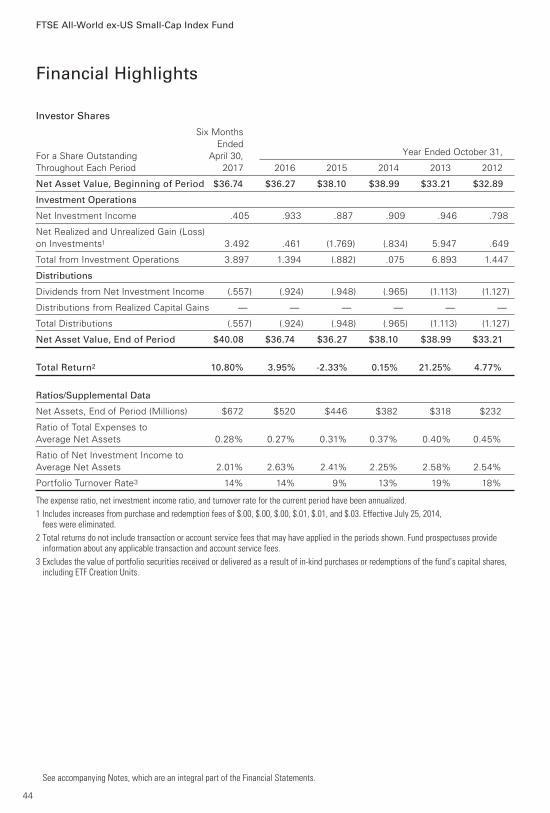
Investor Shares Six Months
Ended
For a Share Outstanding April 30, Year Ended October 31,
Throughout Each Period 2017 2016 2015 2014 2013 2012
Net Asset Value, Beginning of Period $36.74 $36.27 $38.10 $38.99 $33.21 $32.89
Investment Operations
Net Investment Income .405 .933 .887 .909 .946 .798
Net Realized and Unrealized Gain (Loss)
on Investments1 3.492 .461 (1.769) (.834) 5.947 .649
Total from Investment Operations 3.897 1.394 (.882) .075 6.893 1.447
Distributions
Dividends from Net Investment Income (.557) (.924) (.948) (.965) (1.113) (1.127)
Distributions from Realized Capital Gains — — — — — —
Total Distributions (.557) (.924) (.948) (.965) (1.113) (1.127)
Net Asset Value, End of Period $40.08 $36.74 $36.27 $38.10 $38.99 $33.21
Total Return2 10.80% 3.95% -2.33% 0.15% 21.25% 4.77%
Ratios/Supplemental Data
Net Assets, End of Period (Millions) $672 $520 $446 $382 $318 $232
Ratio of Total Expenses to
Average Net Assets 0.28% 0.27% 0.31% 0.37% 0.40% 0.45%
Ratio of Net Investment Income to
Average Net Assets 2.01% 2.63% 2.41% 2.25% 2.58% 2.54%
Portfolio Turnover Rate3 14% 14% 9% 13% 19% 18%
The expense ratio, net investment income ratio, and turnover rate for the current period have been annualized.
1 Includes increases from purchase and redemption fees of $.00, $.00, $.00, $.01, $.01, and $.03. Effective July 25, 2014, fees were eliminated.
2 Total returns do not include transaction or account service fees that may have applied in the periods shown. Fund prospectuses provide information about any applicable transaction and account service fees.
3 Excludes the value of portfolio securities received or delivered as a result of in-kind purchases or redemptions of the fund’s capital shares, including ETF Creation Units.
Financial Highlights
See accompanying Notes, which are an integral part of the Financial Statements.
FTSE All-World ex-US Small-Cap Index Fund
44
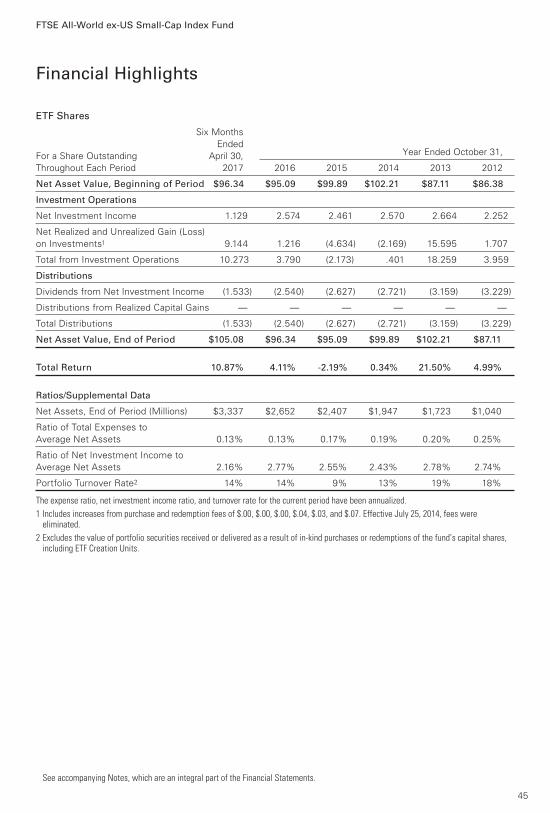
ETF Shares Six Months
Ended
For a Share Outstanding April 30, Year Ended October 31,
Throughout Each Period 2017 2016 2015 2014 2013 2012
Net Asset Value, Beginning of Period $96.34 $95.09 $99.89 $102.21 $87.11 $86.38
Investment Operations
Net Investment Income 1.129 2.574 2.461 2.570 2.664 2.252
Net Realized and Unrealized Gain (Loss)
on Investments1 9.144 1.216 (4.634) (2.169) 15.595 1.707
Total from Investment Operations 10.273 3.790 (2.173) .401 18.259 3.959
Distributions
Dividends from Net Investment Income (1.533) (2.540) (2.627) (2.721) (3.159) (3.229)
Distributions from Realized Capital Gains — — — — — —
Total Distributions (1.533) (2.540) (2.627) (2.721) (3.159) (3.229)
Net Asset Value, End of Period $105.08 $96.34 $95.09 $99.89 $102.21 $87.11
Total Return 10.87% 4.11% -2.19% 0.34% 21.50% 4.99%
Ratios/Supplemental Data
Net Assets, End of Period (Millions) $3,337 $2,652 $2,407 $1,947 $1,723 $1,040
Ratio of Total Expenses to
Average Net Assets 0.13% 0.13% 0.17% 0.19% 0.20% 0.25%
Ratio of Net Investment Income to
Average Net Assets 2.16% 2.77% 2.55% 2.43% 2.78% 2.74%
Portfolio Turnover Rate2 14% 14% 9% 13% 19% 18%
The expense ratio, net investment income ratio, and turnover rate for the current period have been annualized.
1 Includes increases from purchase and redemption fees of $.00, $.00, $.00, $.04, $.03, and $.07. Effective July 25, 2014, fees were eliminated.
2 Excludes the value of portfolio securities received or delivered as a result of in-kind purchases or redemptions of the fund’s capital shares, including ETF Creation Units.
Financial Highlights
See accompanying Notes, which are an integral part of the Financial Statements.
FTSE All-World ex-US Small-Cap Index Fund
45
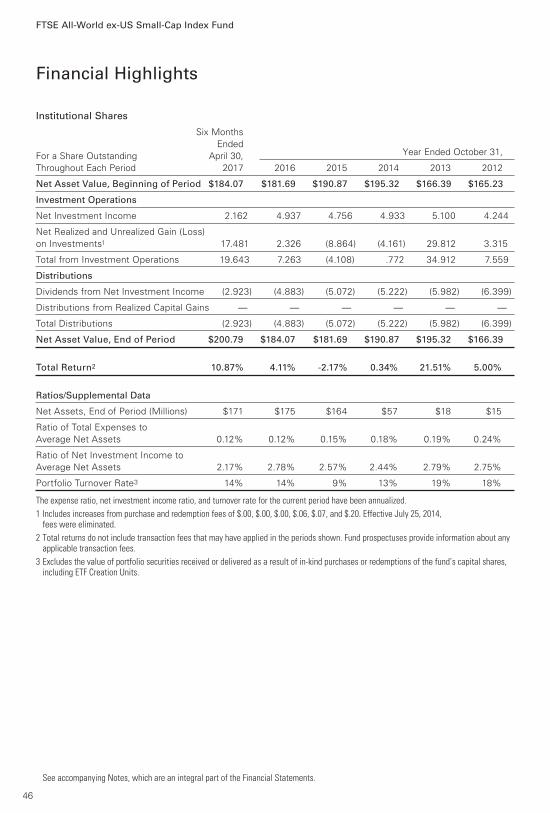
Institutional Shares Six Months
Ended
For a Share Outstanding April 30, Year Ended October 31,
Throughout Each Period 2017 2016 2015 2014 2013 2012
Net Asset Value, Beginning of Period $184.07 $181.69 $190.87 $195.32 $166.39 $165.23
Investment Operations
Net Investment Income 2.162 4.937 4.756 4.933 5.100 4.244
Net Realized and Unrealized Gain (Loss)
on Investments1 17.481 2.326 (8.864) (4.161) 29.812 3.315
Total from Investment Operations 19.643 7.263 (4.108) .772 34.912 7.559
Distributions
Dividends from Net Investment Income (2.923) (4.883) (5.072) (5.222) (5.982) (6.399)
Distributions from Realized Capital Gains — — — — — —
Total Distributions (2.923) (4.883) (5.072) (5.222) (5.982) (6.399)
Net Asset Value, End of Period $200.79 $184.07 $181.69 $190.87 $195.32 $166.39
Total Return2 10.87% 4.11% -2.17% 0.34% 21.51% 5.00%
Ratios/Supplemental Data
Net Assets, End of Period (Millions) $171 $175 $164 $57 $18 $15
Ratio of Total Expenses to
Average Net Assets 0.12% 0.12% 0.15% 0.18% 0.19% 0.24%
Ratio of Net Investment Income to
Average Net Assets 2.17% 2.78% 2.57% 2.44% 2.79% 2.75%
Portfolio Turnover Rate3 14% 14% 9% 13% 19% 18%
The expense ratio, net investment income ratio, and turnover rate for the current period have been annualized.
1 Includes increases from purchase and redemption fees of $.00, $.00, $.00, $.06, $.07, and $.20. Effective July 25, 2014, fees were eliminated.
2 Total returns do not include transaction fees that may have applied in the periods shown. Fund prospectuses provide information about any applicable transaction fees.
3 Excludes the value of portfolio securities received or delivered as a result of in-kind purchases or redemptions of the fund’s capital shares, including ETF Creation Units.
Financial Highlights
See accompanying Notes, which are an integral part of the Financial Statements.
FTSE All-World ex-US Small-Cap Index Fund
46
Notes to Financial Statements
FTSE All-World ex-US Small-Cap Index Fund
Vanguard FTSE All-World ex-US Small-Cap Index Fund is registered under the Investment Company
Act of 1940 as an open-end investment company, or mutual fund. The fund invests in securities of
foreign issuers, which may subject it to investment risks not normally associated with investing in
securities of U.S. corporations. The fund offers three classes of shares: Investor Shares, ETF Shares,
and Institutional Shares. Investor Shares are available to any investor who meets the fund’s minimum
purchase requirements. ETF Shares are listed for trading on NYSE Arca; they can be purchased and
sold through a broker. Institutional Shares are designed for investors who meet certain administrative,
service, and account-size criteria.
A. The following significant accounting policies conform to generally accepted accounting principles
for U.S. investment companies. The fund consistently follows such policies in preparing its financial
statements.
1. Security Valuation: Securities are valued as of the close of trading on the New York Stock Exchange
(generally 4 p.m., Eastern time) on the valuation date. Equity securities are valued at the latest quoted
sales prices or official closing prices taken from the primary market in which each security trades;
such securities not traded on the valuation date are valued at the mean of the latest quoted bid and
asked prices. Securities for which market quotations are not readily available, or whose values have
been affected by events occurring before the fund’s pricing time but after the close of the securities’
primary markets, are valued at their fair values calculated according to procedures adopted by the
board of trustees. These procedures include obtaining quotations from an independent pricing
service, monitoring news to identify significant market- or security-specific events, and evaluating
changes in the values of foreign market proxies (for example, ADRs, futures contracts, or exchange-
traded funds), between the time the foreign markets close and the fund’s pricing time. When
fair-value pricing is employed, the prices of securities used by a fund to calculate its net asset value
may differ from quoted or published prices for the same securities. Investments in Vanguard Market
Liquidity Fund are valued at that fund’s net asset value. Temporary cash investments are valued using
the latest bid prices or using valuations based on a matrix system (which considers such factors as
security prices, yields, maturities, and ratings), both as furnished by independent pricing services.
2. Foreign Currency: Securities and other assets and liabilities denominated in foreign currencies
are translated into U.S. dollars using exchange rates obtained from an independent third party as
of the fund’s pricing time on the valuation date. Realized gains (losses) and unrealized appreciation
(depreciation) on investment securities include the effects of changes in exchange rates since the
securities were purchased, combined with the effects of changes in security prices. Fluctuations
in the value of other assets and liabilities resulting from changes in exchange rates are recorded as
unrealized foreign currency gains (losses) until the assets or liabilities are settled in cash, at which
time they are recorded as realized foreign currency gains (losses).
3. Futures and Forward Currency Contracts: The fund uses index futures contracts to a limited extent,
with the objectives of maintaining full exposure to the stock market, enhancing returns, maintaining
liquidity, and minimizing transaction costs. The fund may purchase futures contracts to immediately
invest incoming cash in the market, or sell futures in response to cash outflows, thereby simulating a
fully invested position in the underlying index while maintaining a cash balance for liquidity. The fund
may seek to enhance returns by using futures contracts instead of the underlying securities when
futures are believed to be priced more attractively than the underlying securities. The primary risks
associated with the use of futures contracts are imperfect correlation between changes in market
values of stocks held by the fund and the prices of futures contracts, and the possibility of an illiquid
market. Counterparty risk involving futures is mitigated because a regulated clearinghouse is the
counterparty instead of the clearing broker. To further mitigate counterparty risk, the fund trades
47
FTSE All-World ex-US Small-Cap Index Fund
futures contracts on an exchange, monitors the financial strength of its clearing brokers and
clearinghouse, and has entered into clearing agreements with its clearing brokers. The clearinghouse
imposes initial margin requirements to secure the fund’s performance and requires daily settlement
of variation margin representing changes in the market value of each contract.
The fund also enters into forward currency contracts to provide the appropriate currency exposure
related to any open futures contracts. The fund’s risks in using these contracts include movement in
the values of the foreign currencies relative to the U.S. dollar and the ability of the counterparties to
fulfill their obligations under the contracts. The fund mitigates its counterparty risk by entering into
forward currency contracts only with a diverse group of prequalified counterparties, monitoring their
financial strength, entering into master netting arrangements with its counterparties, and requiring its
counterparties to transfer collateral as security for their performance. In the absence of a default, the
collateral pledged or received by the fund cannot be repledged, resold, or rehypothecated. The master
netting arrangements provide that, in the event of a counterparty’s default (including bankruptcy), the
fund may terminate the forward currency contracts, determine the net amount owed by either party
in accordance with its master netting arrangements, and sell or retain any collateral held up to the net
amount owed to the fund under the master netting arrangements. The forward currency contracts
contain provisions whereby a counterparty may terminate open contracts if the fund’s net assets
decline below a certain level, triggering a payment by the fund if the fund is in a net liability position
at the time of the termination. The payment amount would be reduced by any collateral the fund has
pledged. Any assets pledged as collateral for open contracts are noted in the Statement of Net
Assets. The value of collateral received or pledged is compared daily to the value of the forward
currency contracts exposure with each counterparty, and any difference, if in excess of a specified
minimum transfer amount, is adjusted and settled within two business days.
Futures contracts are valued at their quoted daily settlement prices. Forward currency contracts are
valued at their quoted daily prices obtained from an independent third party, adjusted for currency risk
based on the expiration date of each contract. The aggregate settlement values and notional amounts
of the contracts are not recorded in the Statement of Assets and Liabilities. Fluctuations in the value
of the contracts are recorded in the Statement of Assets and Liabilities as an asset (liability) and in the
Statement of Operations as unrealized appreciation (depreciation) until the contracts are closed, when
they are recorded as realized gains (losses) on futures or forward currency contracts.
During the six months ended April 30, 2017, the fund’s average investments in long and short futures
contracts represented less than 1% and 0% of net assets, respectively, based on the average of
aggregate settlement values at each quarter-end during the period. The fund’s average investment in
forward currency contracts represented 1% of net assets, based on the average of notional amounts
at each quarter-end during the period.
4. Federal Income Taxes: The fund intends to continue to qualify as a regulated investment company
and distribute all of its taxable income. Management has analyzed the fund’s tax positions taken for all
open federal income tax years (October 31, 2013–2016), and for the period ended April 30, 2017, and
has concluded that no provision for federal income tax is required in the fund’s financial statements.
5. Distributions: Distributions to shareholders are recorded on the ex-dividend date.
6. Securities Lending: To earn additional income, the fund lends its securities to qualified institutional
borrowers. Security loans are subject to termination by the fund at any time, and are required to be
secured at all times by collateral in an amount at least equal to the market value of securities loaned.
Daily market fluctuations could cause the value of loaned securities to be more or less than the value
48
FTSE All-World ex-US Small-Cap Index Fund
of the collateral received. When this occurs, the collateral is adjusted and settled on the next business
day. The fund further mitigates its counterparty risk by entering into securities lending transactions
only with a diverse group of prequalified counterparties, monitoring their financial strength, and
entering into master securities lending agreements with its counterparties. The master securities
lending agreements provide that, in the event of a counterparty’s default (including bankruptcy), the
fund may terminate any loans with that borrower, determine the net amount owed, and sell or retain
the collateral up to the net amount owed to the fund; however, such actions may be subject to legal
proceedings. While collateral mitigates counterparty risk, in the event of a default, the fund may
experience delays and costs in recovering the securities loaned. The fund invests cash collateral
received in Vanguard Market Liquidity Fund, and records a liability in the Statement of Assets and
Liabilities for the return of the collateral, during the period the securities are on loan. Securities lending
income represents fees charged to borrowers plus income earned on invested cash collateral, less
expenses associated with the loan. During the term of the loan, the fund is entitled to all distributions
made on or in respect of the loaned securities.
7. Credit Facility: The fund and certain other funds managed by The Vanguard Group (“Vanguard”)
participate in a $3.1 billion committed credit facility provided by a syndicate of lenders pursuant to a
credit agreement that may be renewed annually; each fund is individually liable for its borrowings,
if any, under the credit facility. Borrowings may be utilized for temporary and emergency purposes,
and are subject to the fund’s regulatory and contractual borrowing restrictions. The participating
funds are charged administrative fees and an annual commitment fee of 0.10% of the undrawn
amount of the facility; these fees are allocated to the funds based on a method approved by the
fund’s board of trustees and included in Management and Administrative expenses on the fund’s
Statement of Operations. Any borrowings under this facility bear interest at a rate based upon the
higher of the one-month London Interbank Offered Rate, federal funds effective rate, or overnight
bank funding rate plus an agreed-upon spread.
The fund had no borrowings outstanding at April 30, 2017, or at any time during the period
then ended.
8. Other: Dividend income is recorded on the ex-dividend date. Interest income includes income
distributions received from Vanguard Market Liquidity Fund and is accrued daily. Premiums and
discounts on debt securities purchased are amortized and accreted, respectively, to interest
income over the lives of the respective securities. Security transactions are accounted for on
the date securities are bought or sold. Costs used to determine realized gains (losses) on the
sale of investment securities are those of the specific securities sold.
Withholding taxes on foreign dividends and capital gains have been provided for in accordance
with the fund’s understanding of the applicable countries’ tax rules and rates. The fund has filed
tax reclaims for previously withheld taxes on dividends earned in certain European Union countries.
These filings are subject to various administrative and judicial proceedings within these countries.
Such tax reclaims received during the year, if any, are included in dividend income. No other amounts
for additional tax reclaims are reflected in the financial statements due to the uncertainty as to the
ultimate resolution of proceedings, the likelihood of receipt of these reclaims, and the potential timing
of payment.
Each class of shares has equal rights as to assets and earnings, except that each class separately
bears certain class-specific expenses related to maintenance of shareholder accounts (included in
Management and Administrative expenses) and shareholder reporting. Marketing and distribution
49
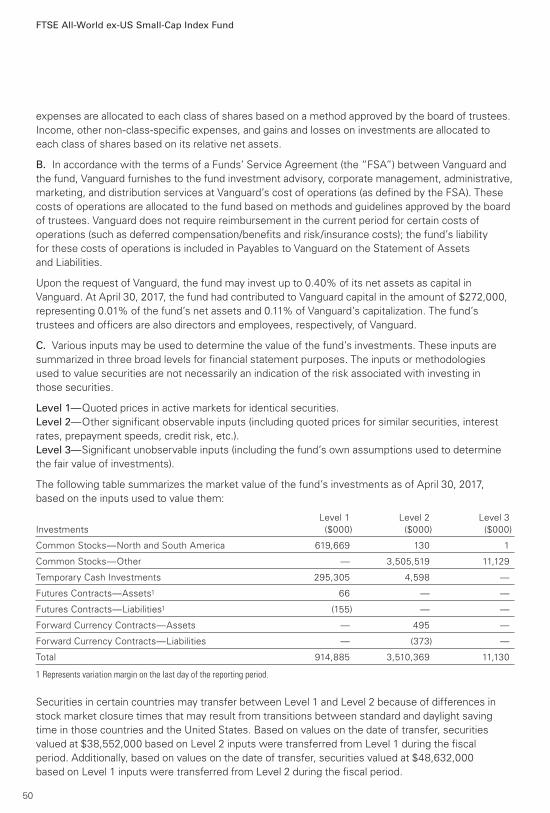
FTSE All-World ex-US Small-Cap Index Fund
expenses are allocated to each class of shares based on a method approved by the board of trustees.
Income, other non-class-specific expenses, and gains and losses on investments are allocated to
each class of shares based on its relative net assets.
B. In accordance with the terms of a Funds’ Service Agreement (the “FSA”) between Vanguard and
the fund, Vanguard furnishes to the fund investment advisory, corporate management, administrative,
marketing, and distribution services at Vanguard’s cost of operations (as defined by the FSA). These
costs of operations are allocated to the fund based on methods and guidelines approved by the board
of trustees. Vanguard does not require reimbursement in the current period for certain costs of
operations (such as deferred compensation/benefits and risk/insurance costs); the fund’s liability
for these costs of operations is included in Payables to Vanguard on the Statement of Assets
and Liabilities.
Upon the request of Vanguard, the fund may invest up to 0.40% of its net assets as capital in
Vanguard. At April 30, 2017, the fund had contributed to Vanguard capital in the amount of $272,000,
representing 0.01% of the fund’s net assets and 0.11% of Vanguard’s capitalization. The fund’s
trustees and officers are also directors and employees, respectively, of Vanguard.
C. Various inputs may be used to determine the value of the fund’s investments. These inputs are
summarized in three broad levels for financial statement purposes. The inputs or methodologies
used to value securities are not necessarily an indication of the risk associated with investing in
those securities.
Level 1—Quoted prices in active markets for identical securities.
Level 2—Other significant observable inputs (including quoted prices for similar securities, interest
rates, prepayment speeds, credit risk, etc.).
Level 3—Significant unobservable inputs (including the fund’s own assumptions used to determine
the fair value of investments).
The following table summarizes the market value of the fund’s investments as of April 30, 2017,
based on the inputs used to value them:
Level 1 Level 2 Level 3
Investments ($000) ($000) ($000)
Common Stocks—North and South America 619,669 130 1
Common Stocks—Other — 3,505,519 11,129
Temporary Cash Investments 295,305 4,598 —
Futures Contracts—Assets1 66 — —
Futures Contracts—Liabilities1 (155) — —
Forward Currency Contracts—Assets — 495 —
Forward Currency Contracts—Liabilities — (373) —
Total 914,885 3,510,369 11,130
1 Represents variation margin on the last day of the reporting period.
Securities in certain countries may transfer between Level 1 and Level 2 because of differences in
stock market closure times that may result from transitions between standard and daylight saving
time in those countries and the United States. Based on values on the date of transfer, securities
valued at $38,552,000 based on Level 2 inputs were transferred from Level 1 during the fiscal
period. Additionally, based on values on the date of transfer, securities valued at $48,632,000
based on Level 1 inputs were transferred from Level 2 during the fiscal period.
50
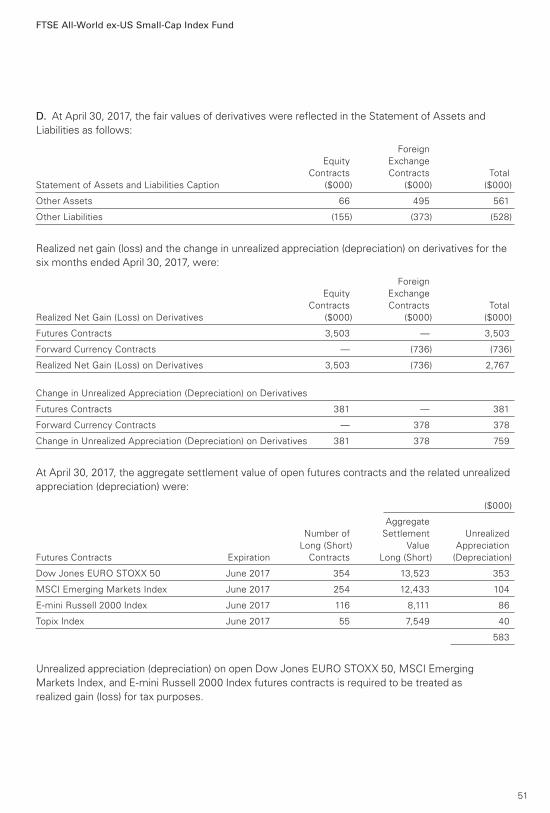
FTSE All-World ex-US Small-Cap Index Fund
D. At April 30, 2017, the fair values of derivatives were reflected in the Statement of Assets and
Liabilities as follows:
Foreign
Equity Exchange
Contracts Contracts Total
Statement of Assets and Liabilities Caption ($000) ($000) ($000)
Other Assets 66 495 561
Other Liabilities (155) (373) (528)
Realized net gain (loss) and the change in unrealized appreciation (depreciation) on derivatives for the
six months ended April 30, 2017, were:
Foreign
Equity Exchange
Contracts Contracts Total
Realized Net Gain (Loss) on Derivatives ($000) ($000) ($000)
Futures Contracts 3,503 — 3,503
Forward Currency Contracts — (736) (736)
Realized Net Gain (Loss) on Derivatives 3,503 (736) 2,767
Change in Unrealized Appreciation (Depreciation) on Derivatives
Futures Contracts 381 — 381
Forward Currency Contracts — 378 378
Change in Unrealized Appreciation (Depreciation) on Derivatives 381 378 759
At April 30, 2017, the aggregate settlement value of open futures contracts and the related unrealized
appreciation (depreciation) were:
($000)
Aggregate
Number of Settlement Unrealized
Long (Short) Value Appreciation
Futures Contracts Expiration Contracts Long (Short) (Depreciation)
Dow Jones EURO STOXX 50 June 2017 354 13,523 353
MSCI Emerging Markets Index June 2017 254 12,433 104
E-mini Russell 2000 Index June 2017 116 8,111 86
Topix Index June 2017 55 7,549 40
583
Unrealized appreciation (depreciation) on open Dow Jones EURO STOXX 50, MSCI Emerging
Markets Index, and E-mini Russell 2000 Index futures contracts is required to be treated as
realized gain (loss) for tax purposes.
51
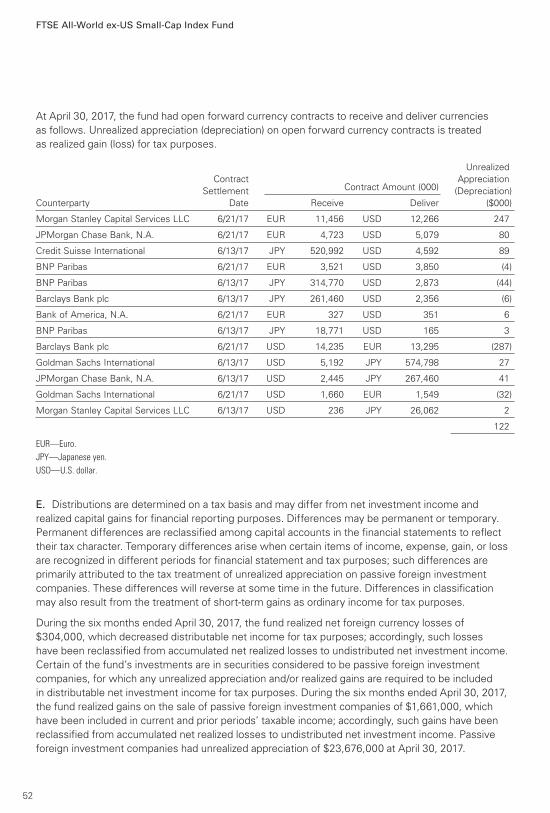
FTSE All-World ex-US Small-Cap Index Fund
At April 30, 2017, the fund had open forward currency contracts to receive and deliver currencies
as follows. Unrealized appreciation (depreciation) on open forward currency contracts is treated
as realized gain (loss) for tax purposes.
Unrealized
Contract Appreciation
Settlement Contract Amount (000) (Depreciation)
Counterparty Date Receive Deliver ($000)
Morgan Stanley Capital Services LLC 6/21/17 EUR 11,456 USD 12,266 247
JPMorgan Chase Bank, N.A. 6/21/17 EUR 4,723 USD 5,079 80
Credit Suisse International 6/13/17 JPY 520,992 USD 4,592 89
BNP Paribas 6/21/17 EUR 3,521 USD 3,850 (4)
BNP Paribas 6/13/17 JPY 314,770 USD 2,873 (44)
Barclays Bank plc 6/13/17 JPY 261,460 USD 2,356 (6)
Bank of America, N.A. 6/21/17 EUR 327 USD 351 6
BNP Paribas 6/13/17 JPY 18,771 USD 165 3
Barclays Bank plc 6/21/17 USD 14,235 EUR 13,295 (287)
Goldman Sachs International 6/13/17 USD 5,192 JPY 574,798 27
JPMorgan Chase Bank, N.A. 6/13/17 USD 2,445 JPY 267,460 41
Goldman Sachs International 6/21/17 USD 1,660 EUR 1,549 (32)
Morgan Stanley Capital Services LLC 6/13/17 USD 236 JPY 26,062 2
122
EUR—Euro.
JPY—Japanese yen.
USD—U.S. dollar.
E. Distributions are determined on a tax basis and may differ from net investment income and
realized capital gains for financial reporting purposes. Differences may be permanent or temporary.
Permanent differences are reclassified among capital accounts in the financial statements to reflect
their tax character. Temporary differences arise when certain items of income, expense, gain, or loss
are recognized in different periods for financial statement and tax purposes; such differences are
primarily attributed to the tax treatment of unrealized appreciation on passive foreign investment
companies. These differences will reverse at some time in the future. Differences in classification
may also result from the treatment of short-term gains as ordinary income for tax purposes.
During the six months ended April 30, 2017, the fund realized net foreign currency losses of
$304,000, which decreased distributable net income for tax purposes; accordingly, such losses
have been reclassified from accumulated net realized losses to undistributed net investment income.
Certain of the fund’s investments are in securities considered to be passive foreign investment
companies, for which any unrealized appreciation and/or realized gains are required to be included
in distributable net investment income for tax purposes. During the six months ended April 30, 2017,
the fund realized gains on the sale of passive foreign investment companies of $1,661,000, which
have been included in current and prior periods’ taxable income; accordingly, such gains have been
reclassified from accumulated net realized losses to undistributed net investment income. Passive
foreign investment companies had unrealized appreciation of $23,676,000 at April 30, 2017.
52
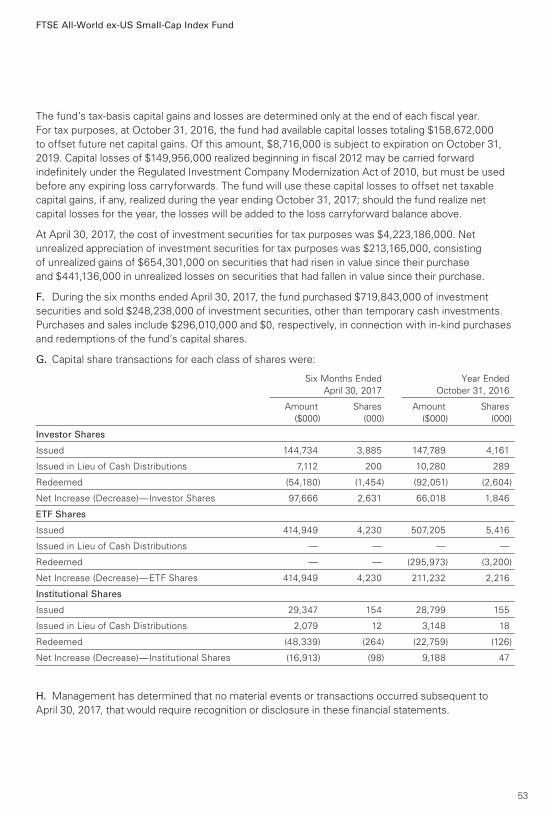
FTSE All-World ex-US Small-Cap Index Fund
The fund’s tax-basis capital gains and losses are determined only at the end of each fiscal year.
For tax purposes, at October 31, 2016, the fund had available capital losses totaling $158,672,000
to offset future net capital gains. Of this amount, $8,716,000 is subject to expiration on October 31,
2019. Capital losses of $149,956,000 realized beginning in fiscal 2012 may be carried forward
indefinitely under the Regulated Investment Company Modernization Act of 2010, but must be used
before any expiring loss carryforwards. The fund will use these capital losses to offset net taxable
capital gains, if any, realized during the year ending October 31, 2017; should the fund realize net
capital losses for the year, the losses will be added to the loss carryforward balance above.
At April 30, 2017, the cost of investment securities for tax purposes was $4,223,186,000. Net
unrealized appreciation of investment securities for tax purposes was $213,165,000, consisting
of unrealized gains of $654,301,000 on securities that had risen in value since their purchase
and $441,136,000 in unrealized losses on securities that had fallen in value since their purchase.
F. During the six months ended April 30, 2017, the fund purchased $719,843,000 of investment
securities and sold $248,238,000 of investment securities, other than temporary cash investments.
Purchases and sales include $296,010,000 and $0, respectively, in connection with in-kind purchases
and redemptions of the fund’s capital shares.
G. Capital share transactions for each class of shares were:
Six Months Ended Year Ended
April 30, 2017 October 31, 2016
Amount Shares Amount Shares
($000) (000) ($000) (000)
Investor Shares
Issued 144,734 3,885 147,789 4,161
Issued in Lieu of Cash Distributions 7,112 200 10,280 289
Redeemed (54,180) (1,454) (92,051) (2,604)
Net Increase (Decrease)—Investor Shares 97,666 2,631 66,018 1,846
ETF Shares
Issued 414,949 4,230 507,205 5,416
Issued in Lieu of Cash Distributions — — — —
Redeemed — — (295,973) (3,200)
Net Increase (Decrease)—ETF Shares 414,949 4,230 211,232 2,216
Institutional Shares
Issued 29,347 154 28,799 155
Issued in Lieu of Cash Distributions 2,079 12 3,148 18
Redeemed (48,339) (264) (22,759) (126)
Net Increase (Decrease)—Institutional Shares (16,913) (98) 9,188 47
H. Management has determined that no material events or transactions occurred subsequent to
April 30, 2017, that would require recognition or disclosure in these financial statements.
53
About Your Fund’s Expenses
As a shareholder of the fund, you incur ongoing costs, which include costs for portfolio management,
administrative services, and shareholder reports (like this one), among others. Operating expenses,
which are deducted from a fund’s gross income, directly reduce the investment return of the fund.
A fund’s expenses are expressed as a percentage of its average net assets. This figure is known as the
expense ratio. The following examples are intended to help you understand the ongoing costs (in
dollars) of investing in your fund and to compare these costs with those of other mutual funds. The
examples are based on an investment of $1,000 made at the beginning of the period shown and held
for the entire period.
The accompanying table illustrates your fund’s costs in two ways:
• Based on actual fund return. This section helps you to estimate the actual expenses that you paid
over the period. The ”Ending Account Value“ shown is derived from the fund‘s actual return, and the
third column shows the dollar amount that would have been paid by an investor who started with
$1,000 in the fund. You may use the information here, together with the amount you invested, to
estimate the expenses that you paid over the period.
To do so, simply divide your account value by $1,000 (for example, an $8,600 account value divided by
$1,000 = 8.6), then multiply the result by the number given for your fund under the heading ”Expenses
Paid During Period.“
• Based on hypothetical 5% yearly return. This section is intended to help you compare your fund‘s
costs with those of other mutual funds. It assumes that the fund had a yearly return of 5% before
expenses, but that the expense ratio is unchanged. In this case—because the return used is not the
fund’s actual return—the results do not apply to your investment. The example is useful in making
comparisons because the Securities and Exchange Commission requires all mutual funds to calculate
expenses based on a 5% return. You can assess your fund’s costs by comparing this hypothetical
example with the hypothetical examples that appear in shareholder reports of other funds.
Note that the expenses shown in the table are meant to highlight and help you compare ongoingcosts only and do not reflect transaction costs incurred by the fund for buying and selling securities.Further, the expenses do not include any purchase, redemption, or account service fees described inthe fund prospectus. If such fees were applied to your account, your costs would be higher. Yourfund does not carry a “sales load.”
The calculations assume no shares were bought or sold during the period. Your actual costs may
have been higher or lower, depending on the amount of your investment and the timing of any
purchases or redemptions.
You can find more information about the fund’s expenses, including annual expense ratios, in the
Financial Statements section of this report. For additional information on operating expenses and
other shareholder costs, please refer to your fund’s current prospectus.
54
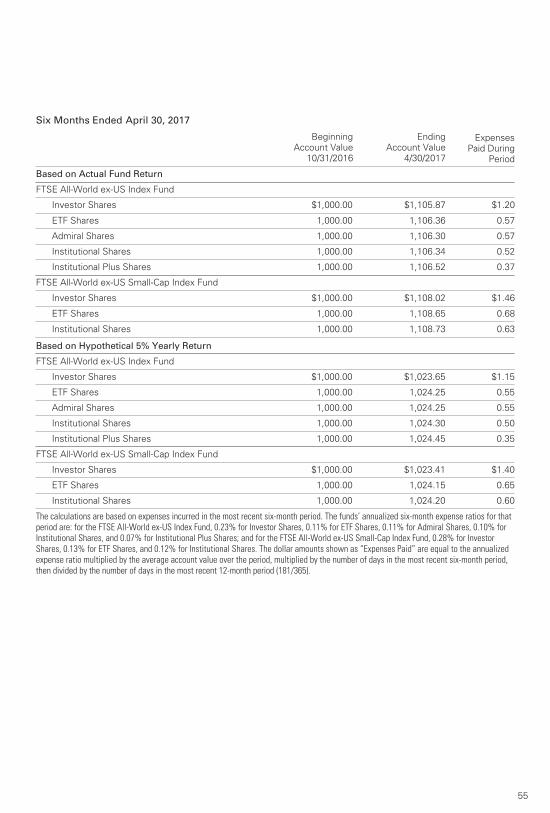
55
Six Months Ended April 30, 2017
Beginning
Account Value
10/31/2016
Ending
Account Value
4/30/2017
Expenses
Paid During
Period
Based on Actual Fund Return
FTSE All-World ex-US Index Fund
Investor Shares $1,000.00 $1,105.87 $1.20
ETF Shares 1,000.00 1,106.36 0.57
Admiral Shares 1,000.00 1,106.30 0.57
Institutional Shares 1,000.00 1,106.34 0.52
Institutional Plus Shares 1,000.00 1,106.52 0.37
FTSE All-World ex-US Small-Cap Index Fund
Investor Shares $1,000.00 $1,108.02 $1.46
ETF Shares 1,000.00 1,108.65 0.68
Institutional Shares 1,000.00 1,108.73 0.63
Based on Hypothetical 5% Yearly Return
FTSE All-World ex-US Index Fund
Investor Shares $1,000.00 $1,023.65 $1.15
ETF Shares 1,000.00 1,024.25 0.55
Admiral Shares 1,000.00 1,024.25 0.55
Institutional Shares 1,000.00 1,024.30 0.50
Institutional Plus Shares 1,000.00 1,024.45 0.35
FTSE All-World ex-US Small-Cap Index Fund
Investor Shares $1,000.00 $1,023.41 $1.40
ETF Shares 1,000.00 1,024.15 0.65
Institutional Shares 1,000.00 1,024.20 0.60
The calculations are based on expenses incurred in the most recent six-month period. The funds’ annualized six-month expense ratios for thatperiod are: for the FTSE All-World ex-US Index Fund, 0.23% for Investor Shares, 0.11% for ETF Shares, 0.11% for Admiral Shares, 0.10% forInstitutional Shares, and 0.07% for Institutional Plus Shares; and for the FTSE All-World ex-US Small-Cap Index Fund, 0.28% for InvestorShares, 0.13% for ETF Shares, and 0.12% for Institutional Shares. The dollar amounts shown as “Expenses Paid” are equal to the annualizedexpense ratio multiplied by the average account value over the period, multiplied by the number of days in the most recent six-month period,then divided by the number of days in the most recent 12-month period (181/365).
The board of trustees of Vanguard FTSE All-World ex-US Index Fund and Vanguard FTSE All-World
ex-US Small-Cap Index Fund has renewed each fund’s investment advisory arrangement with
The Vanguard Group, Inc. (Vanguard)—through its Equity Index Group. The board determined
that continuing each fund’s internalized management structure was in the best interests of the
funds and their shareholders.
The board based its decision upon an evaluation of the advisor’s investment staff, portfolio
management process, and performance. This evaluation included information provided to the
board by Vanguard’s Portfolio Review Department, which is responsible for fund and advisor
oversight and product management. The Portfolio Review Department met regularly with
the advisor and made monthly presentations to the board during the fiscal year that directed
the board’s focus to relevant information and topics.
The board, or an investment committee made up of board members, also received information
throughout the year during advisor presentations. For each advisor presentation, the board was
provided with letters and reports that included information about, among other things, the advisory
firm and the advisor’s assessment of the investment environment, portfolio performance, and
portfolio characteristics.
In addition, the board received monthly reports, which included a Market and Economic Report,
a Fund Dashboard Monthly Summary, and a Fund Performance Report.
Prior to their meeting, the trustees were provided with a memo and materials that summarized the
information they received over the courses of the year. They also considered the factors discussed
below, among others. However, no single factor determined whether the board approved the
arrangements. Rather, it was the totality of the circumstances that drove the board’s decision.
Nature, extent, and quality of servicesThe board reviewed the quality of the investment management services provided to the FTSE
All-World ex-US Index Fund since its inception in 2007 and to the FTSE All-World ex-US Small-Cap
Index Fund since its inception in 2009, and took into account the organizational depth and stability
of the advisor. The board considered that Vanguard has been managing investments for more than
three decades. The Equity Index Group adheres to a sound, disciplined investment management
process; the team has considerable experience, stability, and depth.
The board concluded that Vanguard’s experience, stability, depth, and performance, among other
factors, warranted continuation of the advisory arrangements.
Investment performanceThe board considered each fund’s performance since its inception, including any periods of
outperformance or underperformance compared with its target index and peer group. The
board concluded that the performance was such that the advisory arrangements should
continue. Information about each fund’s most recent performance can be found in the
Performance Summary sections of this report.
Cost The board concluded that each fund’s expense ratio was well below the average expense ratio
charged by funds in its peer group and that each fund’s advisory expenses were also well below
its peer-group average. Information about the funds’ expenses appears in the About Your Fund’s
Expenses section of this report as well as in the Financial Statements sections.
Trustees Approve Advisory Arrangements
56
The board does not conduct a profitability analysis of Vanguard because of Vanguard’s unique
“at-cost” structure. Unlike most other mutual fund management companies, Vanguard is owned
by the funds it oversees and produces “profits” only in the form of reduced expenses for fund
shareholders.
The benefit of economies of scale The board concluded that the funds’ at-cost arrangements with Vanguard ensure that the funds
will realize economies of scale as they grow, with the cost to shareholders declining as fund
assets increase.
The board will consider whether to renew the advisory arrangements again after a one-year period.
57
Glossary
58
Beta. A measure of the magnitude of a fund’s past share-price fluctuations in relation to the ups and
downs of a given market index. The index is assigned a beta of 1.00. Compared with a given index,
a fund with a beta of 1.20 typically would have seen its share price rise or fall by 12% when the
index rose or fell by 10%. For this report, beta is based on returns over the past 36 months for both
the fund and the index. Note that a fund’s beta should be reviewed in conjunction with its R-squared
(see definition). The lower the R-squared, the less correlation there is between the fund and the
index, and the less reliable beta is as an indicator of volatility.
Dividend Yield. Dividend income earned by stocks, expressed as a percentage of the aggregate
market value (or of net asset value, for a fund). The yield is determined by dividing the amount of the
annual dividends by the aggregate value (or net asset value) at the end of the period. For a fund, the
dividend yield is based solely on stock holdings and does not include any income produced by other
investments.
Earnings Growth Rate. The average annual rate of growth in earnings over the past five years for
the stocks now in a fund.
Equity Exposure. A measure that reflects a fund’s investments in stocks and stock futures. Any
holdings in short-term reserves are excluded.
Expense Ratio. A fund’s total annual operating expenses expressed as a percentage of the fund’s
average net assets. The expense ratio includes management and administrative expenses, but does
not include the transaction costs of buying and selling portfolio securities.
Fair-Value Pricing. Fair-value adjustments, which are required by the Securities and Exchange
Commission, address pricing discrepancies that may arise because of time-zone differences among
global stock markets. Foreign stocks may trade on exchanges that close many hours before a fund’s
closing share price is calculated in the United States, generally at 4 p.m., Eastern time. In the hours
between the foreign close and the U.S. close, the value of these foreign securities may
change—because of company-specific announcements or market-wide developments, for example.
Such price changes are not immediately reflected in international index values. Fair-value pricing
takes such changes into account in calculating the fund’s daily net asset value, thus ensuring that
the NAV doesn’t include “stale” prices. The result can be a temporary divergence between the
return of the fund and that of its benchmark index—a difference that usually corrects itself when the
foreign markets reopen.
Inception Date. The date on which the assets of a fund (or one of its share classes) are first
invested in accordance with the fund’s investment objective. For funds with a subscription period,
the inception date is the day after that period ends. Investment performance is measured from the
inception date.
Median Market Cap. An indicator of the size of companies in which a fund invests; the midpoint of
market capitalization (market price x shares outstanding) of a fund’s stocks, weighted by the
proportion of the fund’s assets invested in each stock. Stocks representing half of the fund’s assets
have market capitalizations above the median, and the rest are below it.
Price/Book Ratio. The share price of a stock divided by its net worth, or book value, per share. For a
fund, the weighted average price/book ratio of the stocks it holds.
59
Price/Earnings Ratio. The ratio of a stock’s current price to its per-share earnings over the past
year. For a fund, the weighted average P/E of the stocks it holds. P/E is an indicator of market
expectations about corporate prospects; the higher the P/E, the greater the expectations for a
company’s future growth.
R-Squared. A measure of how much of a fund’s past returns can be explained by the returns from
the market in general, as measured by a given index. If a fund’s total returns were precisely
synchronized with an index’s returns, its R-squared would be 1.00. If the fund’s returns bore no
relationship to the index’s returns, its R-squared would be 0. For this report, R-squared is based on
returns over the past 36 months for both the fund and the index.
Return on Equity. The annual average rate of return generated by a company during the past five
years for each dollar of shareholder’s equity (net income divided by shareholder’s equity). For a fund,
the weighted average return on equity for the companies whose stocks it holds.
Short-Term Reserves. The percentage of a fund invested in highly liquid, short-term securities that
can be readily converted to cash.
Turnover Rate. An indication of the fund’s trading activity. Funds with high turnover rates incur
higher transaction costs and may be more likely to distribute capital gains (which may be taxable to
investors). The turnover rate excludes in-kind transactions, which have minimal impact on costs.
The People Who Govern Your Fund
The trustees of your mutual fund are there to see that the fund is operated and managed in your best
interests since, as a shareholder, you are a part owner of the fund. Your fund’s trustees also serve on
the board of directors of The Vanguard Group, Inc., which is owned by the Vanguard funds and
provides services to them on an at-cost basis.
A majority of Vanguard’s board members are independent, meaning that they have no affiliation with
Vanguard or the funds they oversee, apart from the sizable personal investments they have made as
private individuals. The independent board members have distinguished backgrounds in business,
academia, and public service. Each of the trustees and executive officers oversees 197 Vanguard funds.
The following table provides information for each trustee and executive officer of the fund. The mailing
address of the trustees and officers is P.O. Box 876, Valley Forge, PA 19482. More information about
the trustees is in the Statement of Additional Information, which can be obtained, without charge, by
contacting Vanguard at 800-662-7447, or online at vanguard.com.
Interested Trustee1
F. William McNabb IIIBorn 1957. Trustee Since July 2009. Chairman of
the Board. Principal Occupation(s) During the Past
Five Years and Other Experience: Chairman of the
Board of The Vanguard Group, Inc., and of each of the
investment companies served by The Vanguard Group,
since January 2010; Director of The Vanguard Group
since 2008; Chief Executive Officer and President of
The Vanguard Group, and of each of the investment
companies served by The Vanguard Group, since 2008;
Director of Vanguard Marketing Corporation; Managing
Director of The Vanguard Group (1995–2008).
Independent Trustees
Emerson U. Fullwood Born 1948. Trustee Since January 2008. Principal
Occupation(s) During the Past Five Years and Other
Experience: Executive Chief Staff and Marketing
Officer for North America and Corporate Vice President
(retired 2008) of Xerox Corporation (document manage-
ment products and services); Executive in Residence
and 2009–2010 Distinguished Minett Professor at
the Rochester Institute of Technology; Lead Director
of SPX FLOW, Inc. (multi-industry manufacturing);
Director of the United Way of Rochester, the
University of Rochester Medical Center, Monroe
Community College Foundation, North Carolina
A&T University, and Roberts Wesleyan College.
Rajiv L. Gupta Born 1945. Trustee Since December 2001.2 Principal
Occupation(s) During the Past Five Years and Other
Experience: Chairman and Chief Executive Officer
(retired 2009) and President (2006–2008) of Rohm
and Haas Co. (chemicals); Director of Arconic Inc.
(diversified manufacturer), HP Inc. (printer and personal
computer manufacturing), and Delphi Automotive plc
(automotive components); Senior Advisor at New
Mountain Capital.
Amy GutmannBorn 1949. Trustee Since June 2006. Principal
Occupation(s) During the Past Five Years and Other
Experience: President of the University of Pennsylvania;
Christopher H. Browne Distinguished Professor of
Political Science, School of Arts and Sciences, and
Professor of Communication, Annenberg School for
Communication, with secondary faculty appointments
in the Department of Philosophy, School of Arts and
Sciences, and at the Graduate School of Education,
University of Pennsylvania; Trustee of the National
Constitution Center; Chair of the Presidential
Commission for the Study of Bioethical Issues.
JoAnn Heffernan HeisenBorn 1950. Trustee Since July 1998. Principal
Occupation(s) During the Past Five Years and Other
Experience: Corporate Vice President and Member of
the Executive Committee (1997–2008), Chief Global
Diversity Officer (retired 2008), Vice President and
Chief Information Officer (1997–2005), Controller
(1995–1997), Treasurer (1991–1995), and Assistant
Treasurer (1989–1991) of Johnson & Johnson
(pharmaceuticals/medical devices/consumer products);
Director of Skytop Lodge Corporation (hotels) and the
Robert Wood Johnson Foundation; Member of the
Advisory Board of the Institute for Women’s Leadership
at Rutgers University.
F. Joseph LoughreyBorn 1949. Trustee Since October 2009. Principal
Occupation(s) During the Past Five Years and Other
Experience: President and Chief Operating Officer
(retired 2009) of Cummins Inc. (industrial machinery);
Chairman of the Board of Hillenbrand, Inc. (specialized
consumer services), Oxfam America, and the Lumina
Foundation for Education; Director of SKF AB
(industrial machinery), Hyster-Yale Materials Handling,
Inc. (forklift trucks), and the V Foundation for Cancer
Research; Member of the Advisory Council for the
College of Arts and Letters and Chair of the Advisory
Board to the Kellogg Institute for International Studies,
both at the University of Notre Dame.
Mark LoughridgeBorn 1953. Trustee Since March 2012. Principal
Occupation(s) During the Past Five Years and Other
Experience: Senior Vice President and Chief Financial
Officer (retired 2013) at IBM (information technology
services); Fiduciary Member of IBM’s Retirement Plan
Committee (2004–2013); Director of the Dow Chemical
Company; Member of the Council on Chicago Booth.
Scott C. MalpassBorn 1962. Trustee Since March 2012. Principal
Occupation(s) During the Past Five Years and Other
Experience: Chief Investment Officer and Vice
President at the University of Notre Dame; Assistant
Professor of Finance at the Mendoza College of
Business at Notre Dame; Member of the Notre Dame
403(b) Investment Committee, the Board of Advisors
for Spruceview Capital Partners, and the Investment
Advisory Committee of Major League Baseball; Board
Member of TIFF Advisory Services, Inc., and Catholic
Investment Services, Inc. (investment advisors);
Member of the Board of Superintendence of the
Institute for the Works of Religion.
André F. PeroldBorn 1952. Trustee Since December 2004.
Principal Occupation(s) During the Past Five Years
and Other Experience: George Gund Professor
of Finance and Banking, Emeritus at the Harvard
Business School (retired 2011); Chief Investment
Officer and Co-Managing Partner of HighVista
Strategies LLC (private investment firm);
Overseer of the Museum of Fine Arts Boston.
Peter F. VolanakisBorn 1955. Trustee Since July 2009. Principal
Occupation(s) During the Past Five Years and Other
Experience: President and Chief Operating Officer
(retired 2010) of Corning Incorporated (communications
equipment); Chairman of the Board of Trustees of
Colby-Sawyer College; Member of the Board of
Hypertherm, Inc. (industrial cutting systems,
software, and consumables).
Executive Officers
Glenn BooraemBorn 1967. Investment Stewardship Officer Since
February 2017. Principal Occupation(s) During the
Past Five Years and Other Experience: Principal of
The Vanguard Group, Inc.; Treasurer (2015–2017),
Controller (2010–2015), and Assistant Controller
(2001–2010) of each of the investment companies
served by The Vanguard Group.
Thomas J. HigginsBorn 1957. Chief Financial Officer Since September
2008. Principal Occupation(s) During the Past Five
Years and Other Experience: Principal of The Vanguard
Group, Inc.; Chief Financial Officer of each of the
investment companies served by The Vanguard Group;
Treasurer of each of the investment companies served
by The Vanguard Group (1998–2008).
Peter MahoneyBorn 1974. Controller Since May 2015. Principal
Occupation(s) During the Past Five Years and Other
Experience: Principal of The Vanguard Group, Inc.;
Controller of each of the investment companies served
by The Vanguard Group; Head of International Fund
Services at The Vanguard Group (2008–2014).
Anne E. RobinsonBorn 1970. Secretary Since September 2016. Principal
Occupation(s) During the Past Five Years and Other
Experience: Managing Director of The Vanguard Group,
Inc.; General Counsel of The Vanguard Group; Secretary
of The Vanguard Group and of each of the investment
companies served by The Vanguard Group; Director
and Senior Vice President of Vanguard Marketing
Corporation; Managing Director and General Counsel
of Global Cards and Consumer Services at Citigroup
(2014–2016); Counsel at American Express
(2003–2014).
Michael RollingsBorn 1963. Treasurer Since February 2017. Principal
Occupation(s) During the Past Five Years and Other
Experience: Managing Director of The Vanguard Group,
Inc.; Treasurer of each of the investment companies
served by The Vanguard Group; Executive Vice
President and Chief Financial Officer of MassMutual
Financial Group (2006–2016).
Vanguard Senior Management Team
Mortimer J. Buckley James M. Norris John James Thomas M. Rampulla Martha G. King Glenn W. Reed John T. Marcante Karin A. Risi Chris D. McIsaac
Chairman Emeritus and Senior AdvisorJohn J. BrennanChairman, 1996–2009
Chief Executive Officer and President, 1996–2008
Founder John C. BogleChairman and Chief Executive Officer, 1974–1996
1 Mr. McNabb is considered an “interested person,” as defined in the Investment Company Act of 1940, because he is an officer of the Vanguard funds.
2 December 2002 for Vanguard Equity Income Fund, the Vanguard Municipal Bond Funds, and the Vanguard State Tax-Exempt Funds.
P.O. Box 2600
Valley Forge, PA 19482-2600
Connect with Vanguard® > vanguard.com
Fund Information > 800-662-7447
Direct Investor Account Services > 800-662-2739
Institutional Investor Services > 800-523-1036
Text Telephone for PeopleWho Are Deaf or Hard of Hearing > 800-749-7273
This material may be used in conjunctionwith the offering of shares of any Vanguardfund only if preceded or accompanied bythe fund’s current prospectus.
All comparative mutual fund data are from Lipper, aThomson Reuters Company, or Morningstar, Inc., unlessotherwise noted.
You can obtain a free copy of Vanguard’s proxy votingguidelines by visiting vanguard.com/proxyreporting or bycalling Vanguard at 800-662-2739. The guidelines arealso available from the SEC’s website, sec.gov. Inaddition, you may obtain a free report on how your fundvoted the proxies for securities it owned during the 12months ended June 30. To get the report, visit eithervanguard.com/proxyreporting or sec.gov.
You can review and copy information about your fund atthe SEC’s Public Reference Room in Washington, D.C. Tofind out more about this public service, call the SEC at202-551-8090. Information about your fund is alsoavailable on the SEC’s website, and you can receivecopies of this information, for a fee, by sending arequest in either of two ways: via email addressed [email protected] or via regular mail addressed to thePublic Reference Section, Securities and ExchangeCommission, Washington, DC 20549-1520.
London Stock Exchange Group companies include FTSEInternational Limited (”FTSE”), Frank Russell Company(”Russell”), MTS Next Limited (”MTS”), and FTSE TMXGlobal Debt Capital Markets Inc. (”FTSE TMX”). Allrights reserved. ”FTSE®”, ”Russell®”, ”MTS®”, ”FTSETMX®” and ”FTSE Russell” and other service marksand trademarks related to the FTSE or Russell indexesare trademarks of the London Stock Exchange Groupcompanies and are used by FTSE, MTS, FTSE TMX andRussell under licence. All information is provided forinformation purposes only. No responsibility or liabilitycan be accepted by the London Stock Exchange Groupcompanies nor its licensors for any errors or for anyloss from use of this publication. Neither the LondonStock Exchange Group companies nor any of itslicensors make any claim, prediction, warranty orrepresentation whatsoever, expressly or impliedly,either as to the results to be obtained from the use ofthe FTSE Indexes or the fitness or suitability of theIndexes for any particular purpose to which they mightbe put.
The Industry Classification Benchmark (”ICB”) is ownedby FTSE. FTSE does not accept any liability to anyperson for any loss or damage arising out of any erroror omission in the ICB.
© 2017 The Vanguard Group, Inc.All rights reserved.Vanguard Marketing Corporation, Distributor.
Q7702 062017
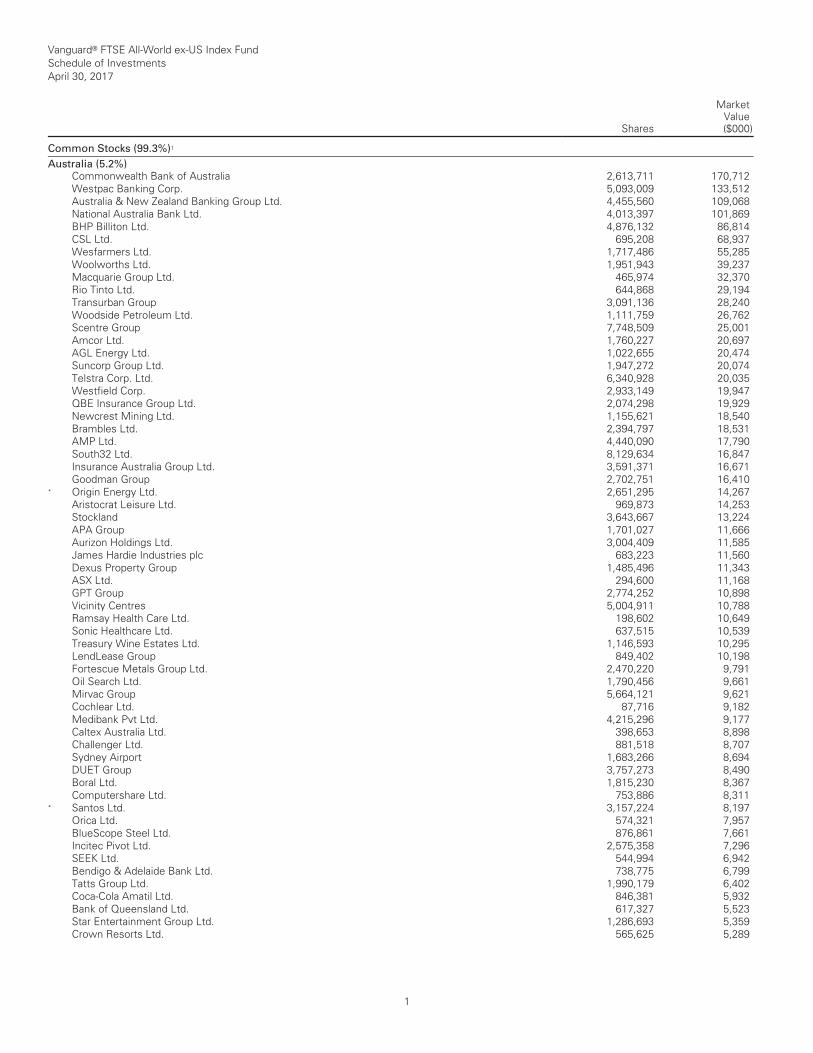
Vanguard® FTSE All-World ex-US Index Fund Schedule of Investments April 30, 2017
Shares
MarketValue($000)
__________________________________________________________________________________________________________________________________________________________________________________________________________________________________________________________________________________________________________________________________________________________________________________________________________________________________________________________________________________________________________________________________________________________________________________________________________________________________________________________________________________________ __________________________________________________________________________________________________________________________________________________________________________________________________________________________________________________________________________________________________________________________________________________________________________________________________________________________________________________________________________________________________________________________________________________________________________________________________________________________________________________________________________________________
Common Stocks (99.3%)1 __________________________________________________________________________________________________________________________________________________________________________________________________________________________________________________________________________________________________________________________________________________________________________________________________________________________________________________________________________________________________________________________________________________________________________________________________________________________________________________________________________________________ __________________________________________________________________________________________________________________________________________________________________________________________________________________________________________________________________________________________________________________________________________________________________________________________________________________________________________________________________________________________________________________________________________________________________________________________________________________________________________________________________________________________
Australia (5.2%)
Commonwealth Bank of Australia 2,613,711 170,712 Westpac Banking Corp. 5,093,009 133,512 Australia & New Zealand Banking Group Ltd. 4,455,560 109,068 National Australia Bank Ltd. 4,013,397 101,869 BHP Billiton Ltd. 4,876,132 86,814 CSL Ltd. 695,208 68,937 Wesfarmers Ltd. 1,717,486 55,285 Woolworths Ltd. 1,951,943 39,237 Macquarie Group Ltd. 465,974 32,370 Rio Tinto Ltd. 644,868 29,194 Transurban Group 3,091,136 28,240 Woodside Petroleum Ltd. 1,111,759 26,762 Scentre Group 7,748,509 25,001 Amcor Ltd. 1,760,227 20,697 AGL Energy Ltd. 1,022,655 20,474 Suncorp Group Ltd. 1,947,272 20,074 Telstra Corp. Ltd. 6,340,928 20,035 Westfield Corp. 2,933,149 19,947 QBE Insurance Group Ltd. 2,074,298 19,929 Newcrest Mining Ltd. 1,155,621 18,540 Brambles Ltd. 2,394,797 18,531 AMP Ltd. 4,440,090 17,790 South32 Ltd. 8,129,634 16,847 Insurance Australia Group Ltd. 3,591,371 16,671 Goodman Group 2,702,751 16,410 * Origin Energy Ltd. 2,651,295 14,267 Aristocrat Leisure Ltd. 969,873 14,253 Stockland 3,643,667 13,224 APA Group 1,701,027 11,666 Aurizon Holdings Ltd. 3,004,409 11,585 James Hardie Industries plc 683,223 11,560 Dexus Property Group 1,485,496 11,343 ASX Ltd. 294,600 11,168 GPT Group 2,774,252 10,898 Vicinity Centres 5,004,911 10,788 Ramsay Health Care Ltd. 198,602 10,649 Sonic Healthcare Ltd. 637,515 10,539 Treasury Wine Estates Ltd. 1,146,593 10,295 LendLease Group 849,402 10,198 Fortescue Metals Group Ltd. 2,470,220 9,791 Oil Search Ltd. 1,790,456 9,661 Mirvac Group 5,664,121 9,621 Cochlear Ltd. 87,716 9,182 Medibank Pvt Ltd. 4,215,296 9,177 Caltex Australia Ltd. 398,653 8,898 Challenger Ltd. 881,518 8,707 Sydney Airport 1,683,266 8,694 DUET Group 3,757,273 8,490 Boral Ltd. 1,815,230 8,367 Computershare Ltd. 753,886 8,311 * Santos Ltd. 3,157,224 8,197 Orica Ltd. 574,321 7,957 BlueScope Steel Ltd. 876,861 7,661 Incitec Pivot Ltd. 2,575,358 7,296 SEEK Ltd. 544,994 6,942 Bendigo & Adelaide Bank Ltd. 738,775 6,799 Tatts Group Ltd. 1,990,179 6,402 Coca-Cola Amatil Ltd. 846,381 5,932 Bank of Queensland Ltd. 617,327 5,523 Star Entertainment Group Ltd. 1,286,693 5,359 Crown Resorts Ltd. 565,625 5,289
1
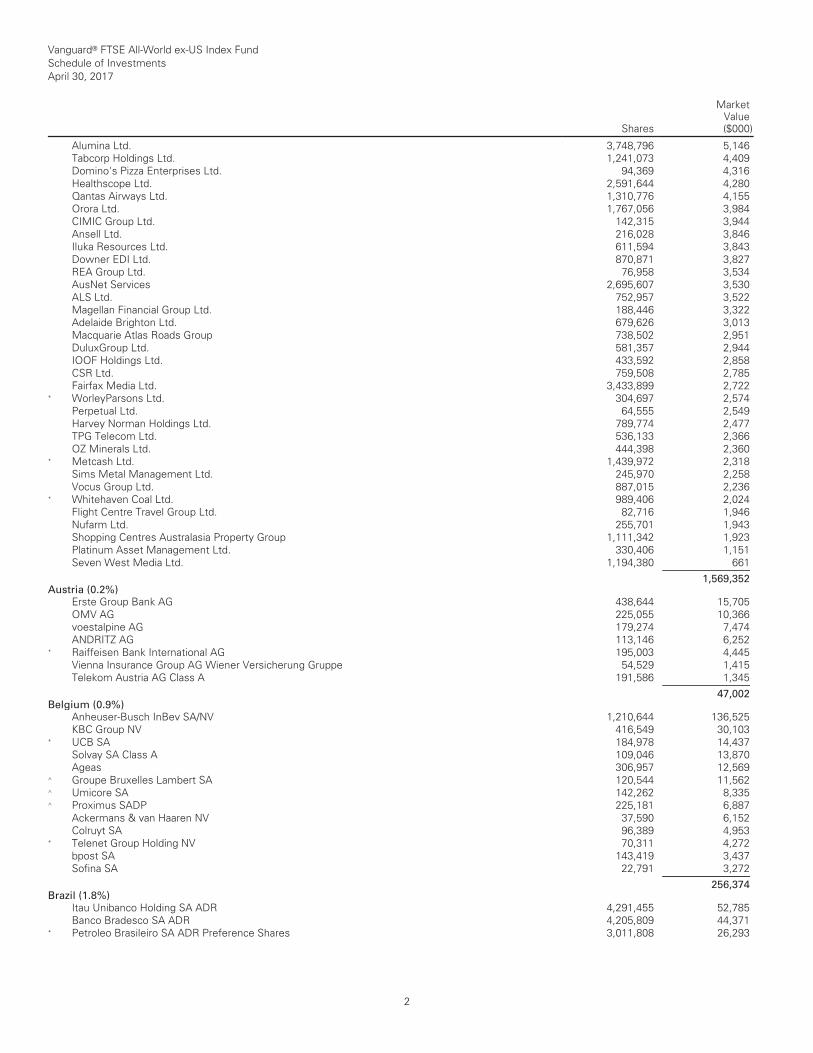
Vanguard® FTSE All-World ex-US Index Fund Schedule of Investments April 30, 2017
Shares
MarketValue($000)
__________________________________________________________________________________________________________________________________________________________________________________________________________________________________________________________________________________________________________________________________________________________________________________________________________________________________________________________________________________________________________________________________________________________________________________________________________________________________________________________________________________________ __________________________________________________________________________________________________________________________________________________________________________________________________________________________________________________________________________________________________________________________________________________________________________________________________________________________________________________________________________________________________________________________________________________________________________________________________________________________________________________________________________________________
Alumina Ltd. 3,748,796 5,146 Tabcorp Holdings Ltd. 1,241,073 4,409 Domino's Pizza Enterprises Ltd. 94,369 4,316 Healthscope Ltd. 2,591,644 4,280 Qantas Airways Ltd. 1,310,776 4,155 Orora Ltd. 1,767,056 3,984 CIMIC Group Ltd. 142,315 3,944 Ansell Ltd. 216,028 3,846 Iluka Resources Ltd. 611,594 3,843 Downer EDI Ltd. 870,871 3,827 REA Group Ltd. 76,958 3,534 AusNet Services 2,695,607 3,530 ALS Ltd. 752,957 3,522 Magellan Financial Group Ltd. 188,446 3,322 Adelaide Brighton Ltd. 679,626 3,013 Macquarie Atlas Roads Group 738,502 2,951 DuluxGroup Ltd. 581,357 2,944 IOOF Holdings Ltd. 433,592 2,858 CSR Ltd. 759,508 2,785 Fairfax Media Ltd. 3,433,899 2,722 * WorleyParsons Ltd. 304,697 2,574 Perpetual Ltd. 64,555 2,549 Harvey Norman Holdings Ltd. 789,774 2,477 TPG Telecom Ltd. 536,133 2,366 OZ Minerals Ltd. 444,398 2,360 * Metcash Ltd. 1,439,972 2,318 Sims Metal Management Ltd. 245,970 2,258 Vocus Group Ltd. 887,015 2,236 * Whitehaven Coal Ltd. 989,406 2,024 Flight Centre Travel Group Ltd. 82,716 1,946 Nufarm Ltd. 255,701 1,943 Shopping Centres Australasia Property Group 1,111,342 1,923 Platinum Asset Management Ltd. 330,406 1,151 Seven West Media Ltd. 1,194,380 661 ___________ 1,569,352 Austria (0.2%)
Erste Group Bank AG 438,644 15,705 OMV AG 225,055 10,366 voestalpine AG 179,274 7,474 ANDRITZ AG 113,146 6,252 * Raiffeisen Bank International AG 195,003 4,445 Vienna Insurance Group AG Wiener Versicherung Gruppe 54,529 1,415 Telekom Austria AG Class A 191,586 1,345 ___________ 47,002 Belgium (0.9%)
Anheuser-Busch InBev SA/NV 1,210,644 136,525 KBC Group NV 416,549 30,103 * UCB SA 184,978 14,437 Solvay SA Class A 109,046 13,870 Ageas 306,957 12,569 ^ Groupe Bruxelles Lambert SA 120,544 11,562 ^ Umicore SA 142,262 8,335 ^ Proximus SADP 225,181 6,887 Ackermans & van Haaren NV 37,590 6,152 Colruyt SA 96,389 4,953 * Telenet Group Holding NV 70,311 4,272 bpost SA 143,419 3,437 Sofina SA 22,791 3,272 ___________ 256,374 Brazil (1.8%)
Itau Unibanco Holding SA ADR 4,291,455 52,785 Banco Bradesco SA ADR 4,205,809 44,371 * Petroleo Brasileiro SA ADR Preference Shares 3,011,808 26,293
2
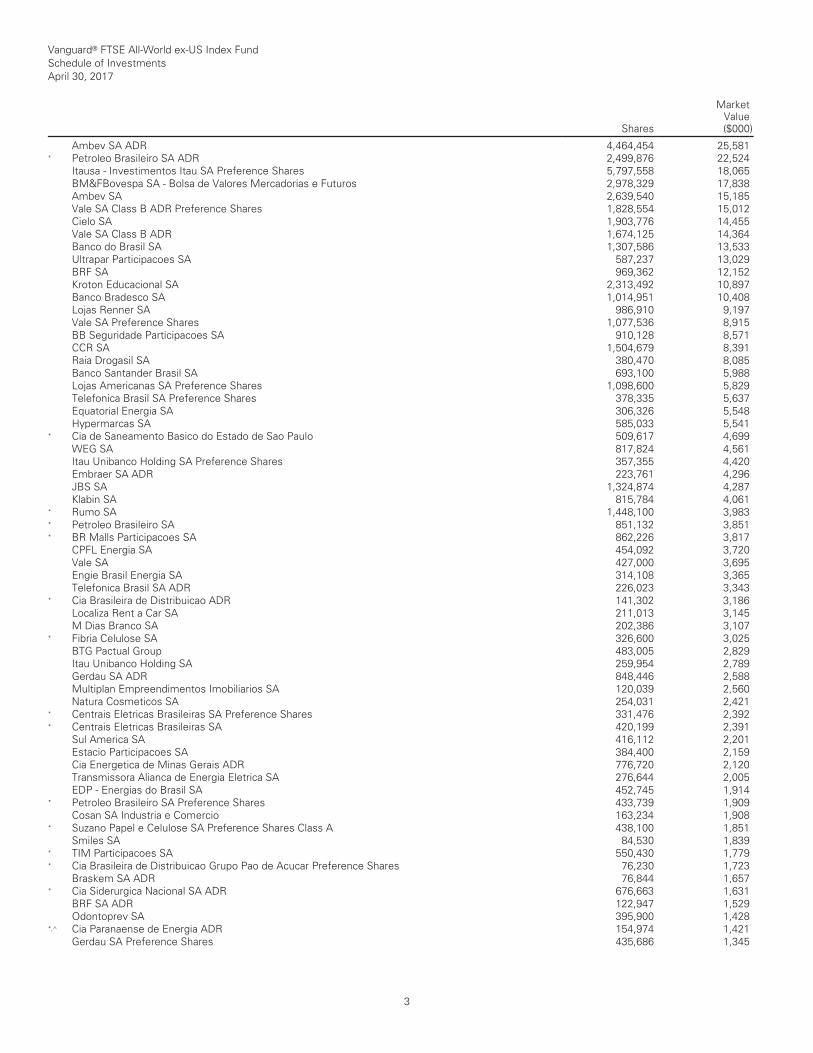
Vanguard® FTSE All-World ex-US Index Fund Schedule of Investments April 30, 2017
Shares
MarketValue($000)
__________________________________________________________________________________________________________________________________________________________________________________________________________________________________________________________________________________________________________________________________________________________________________________________________________________________________________________________________________________________________________________________________________________________________________________________________________________________________________________________________________________________ __________________________________________________________________________________________________________________________________________________________________________________________________________________________________________________________________________________________________________________________________________________________________________________________________________________________________________________________________________________________________________________________________________________________________________________________________________________________________________________________________________________________
Ambev SA ADR 4,464,454 25,581 * Petroleo Brasileiro SA ADR 2,499,876 22,524 Itausa - Investimentos Itau SA Preference Shares 5,797,558 18,065 BM&FBovespa SA - Bolsa de Valores Mercadorias e Futuros 2,978,329 17,838 Ambev SA 2,639,540 15,185 Vale SA Class B ADR Preference Shares 1,828,554 15,012 Cielo SA 1,903,776 14,455 Vale SA Class B ADR 1,674,125 14,364 Banco do Brasil SA 1,307,586 13,533 Ultrapar Participacoes SA 587,237 13,029 BRF SA 969,362 12,152 Kroton Educacional SA 2,313,492 10,897 Banco Bradesco SA 1,014,951 10,408 Lojas Renner SA 986,910 9,197 Vale SA Preference Shares 1,077,536 8,915 BB Seguridade Participacoes SA 910,128 8,571 CCR SA 1,504,679 8,391 Raia Drogasil SA 380,470 8,085 Banco Santander Brasil SA 693,100 5,988 Lojas Americanas SA Preference Shares 1,098,600 5,829 Telefonica Brasil SA Preference Shares 378,335 5,637 Equatorial Energia SA 306,326 5,548 Hypermarcas SA 585,033 5,541 * Cia de Saneamento Basico do Estado de Sao Paulo 509,617 4,699 WEG SA 817,824 4,561 Itau Unibanco Holding SA Preference Shares 357,355 4,420 Embraer SA ADR 223,761 4,296 JBS SA 1,324,874 4,287 Klabin SA 815,784 4,061 * Rumo SA 1,448,100 3,983 * Petroleo Brasileiro SA 851,132 3,851 * BR Malls Participacoes SA 862,226 3,817 CPFL Energia SA 454,092 3,720 Vale SA 427,000 3,695 Engie Brasil Energia SA 314,108 3,365 Telefonica Brasil SA ADR 226,023 3,343 * Cia Brasileira de Distribuicao ADR 141,302 3,186 Localiza Rent a Car SA 211,013 3,145 M Dias Branco SA 202,386 3,107 * Fibria Celulose SA 326,600 3,025 BTG Pactual Group 483,005 2,829 Itau Unibanco Holding SA 259,954 2,789 Gerdau SA ADR 848,446 2,588 Multiplan Empreendimentos Imobiliarios SA 120,039 2,560 Natura Cosmeticos SA 254,031 2,421 * Centrais Eletricas Brasileiras SA Preference Shares 331,476 2,392 * Centrais Eletricas Brasileiras SA 420,199 2,391 Sul America SA 416,112 2,201 Estacio Participacoes SA 384,400 2,159 Cia Energetica de Minas Gerais ADR 776,720 2,120 Transmissora Alianca de Energia Eletrica SA 276,644 2,005 EDP - Energias do Brasil SA 452,745 1,914 * Petroleo Brasileiro SA Preference Shares 433,739 1,909 Cosan SA Industria e Comercio 163,234 1,908 * Suzano Papel e Celulose SA Preference Shares Class A 438,100 1,851 Smiles SA 84,530 1,839 * TIM Participacoes SA 550,430 1,779 * Cia Brasileira de Distribuicao Grupo Pao de Acucar Preference Shares 76,230 1,723 Braskem SA ADR 76,844 1,657 * Cia Siderurgica Nacional SA ADR 676,663 1,631 BRF SA ADR 122,947 1,529 Odontoprev SA 395,900 1,428 *,^ Cia Paranaense de Energia ADR 154,974 1,421 Gerdau SA Preference Shares 435,686 1,345
3
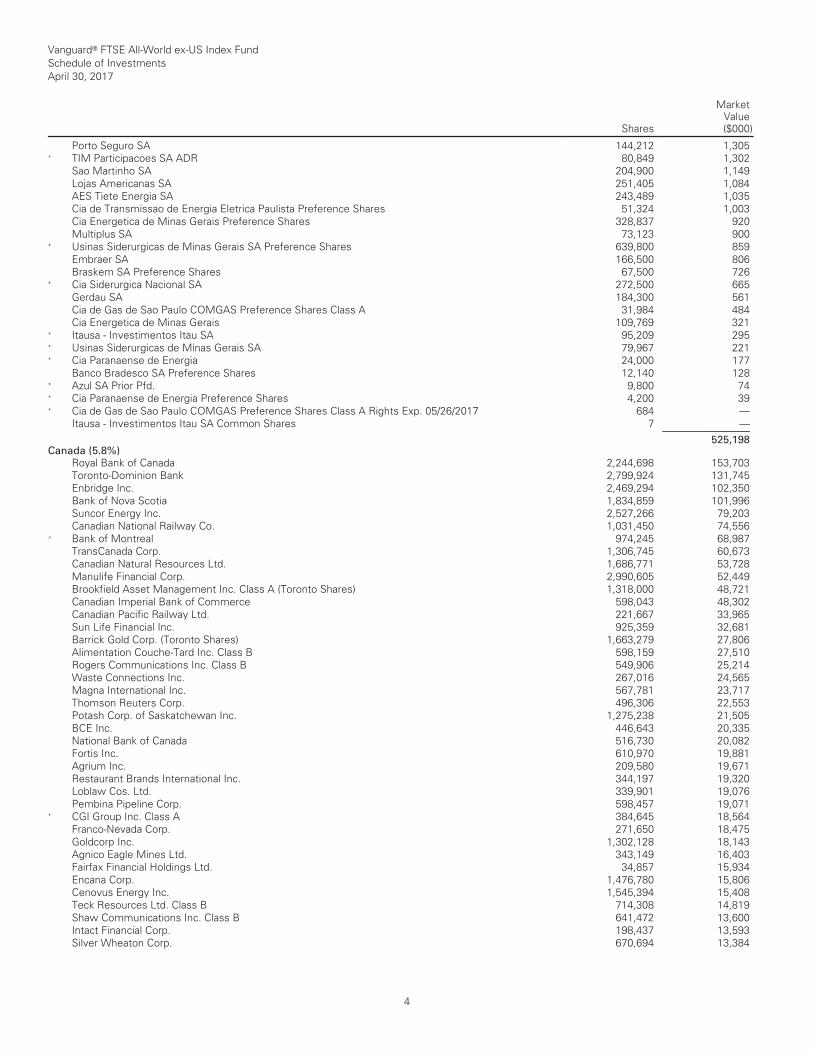
Vanguard® FTSE All-World ex-US Index Fund Schedule of Investments April 30, 2017
Shares
MarketValue($000)
__________________________________________________________________________________________________________________________________________________________________________________________________________________________________________________________________________________________________________________________________________________________________________________________________________________________________________________________________________________________________________________________________________________________________________________________________________________________________________________________________________________________ __________________________________________________________________________________________________________________________________________________________________________________________________________________________________________________________________________________________________________________________________________________________________________________________________________________________________________________________________________________________________________________________________________________________________________________________________________________________________________________________________________________________
Porto Seguro SA 144,212 1,305 * TIM Participacoes SA ADR 80,849 1,302 Sao Martinho SA 204,900 1,149 Lojas Americanas SA 251,405 1,084 AES Tiete Energia SA 243,489 1,035 Cia de Transmissao de Energia Eletrica Paulista Preference Shares 51,324 1,003 Cia Energetica de Minas Gerais Preference Shares 328,837 920 Multiplus SA 73,123 900 * Usinas Siderurgicas de Minas Gerais SA Preference Shares 639,800 859 Embraer SA 166,500 806 Braskem SA Preference Shares 67,500 726 * Cia Siderurgica Nacional SA 272,500 665 Gerdau SA 184,300 561 Cia de Gas de Sao Paulo COMGAS Preference Shares Class A 31,984 484 Cia Energetica de Minas Gerais 109,769 321 * Itausa - Investimentos Itau SA 95,209 295 * Usinas Siderurgicas de Minas Gerais SA 79,967 221 * Cia Paranaense de Energia 24,000 177 Banco Bradesco SA Preference Shares 12,140 128 * Azul SA Prior Pfd. 9,800 74 * Cia Paranaense de Energia Preference Shares 4,200 39 * Cia de Gas de Sao Paulo COMGAS Preference Shares Class A Rights Exp. 05/26/2017 684 — Itausa - Investimentos Itau SA Common Shares 7 — ___________ 525,198 Canada (5.8%)
Royal Bank of Canada 2,244,698 153,703 Toronto-Dominion Bank 2,799,924 131,745 Enbridge Inc. 2,469,294 102,350 Bank of Nova Scotia 1,834,859 101,996 Suncor Energy Inc. 2,527,266 79,203 Canadian National Railway Co. 1,031,450 74,556 ^ Bank of Montreal 974,245 68,987 TransCanada Corp. 1,306,745 60,673 Canadian Natural Resources Ltd. 1,686,771 53,728 Manulife Financial Corp. 2,990,605 52,449 Brookfield Asset Management Inc. Class A (Toronto Shares) 1,318,000 48,721 Canadian Imperial Bank of Commerce 598,043 48,302 Canadian Pacific Railway Ltd. 221,667 33,965 Sun Life Financial Inc. 925,359 32,681 Barrick Gold Corp. (Toronto Shares) 1,663,279 27,806 Alimentation Couche-Tard Inc. Class B 598,159 27,510 Rogers Communications Inc. Class B 549,906 25,214 Waste Connections Inc. 267,016 24,565 Magna International Inc. 567,781 23,717 Thomson Reuters Corp. 496,306 22,553 Potash Corp. of Saskatchewan Inc. 1,275,238 21,505 BCE Inc. 446,643 20,335 National Bank of Canada 516,730 20,082 Fortis Inc. 610,970 19,881 Agrium Inc. 209,580 19,671 Restaurant Brands International Inc. 344,197 19,320 Loblaw Cos. Ltd. 339,901 19,076 Pembina Pipeline Corp. 598,457 19,071 * CGI Group Inc. Class A 384,645 18,564 Franco-Nevada Corp. 271,650 18,475 Goldcorp Inc. 1,302,128 18,143 Agnico Eagle Mines Ltd. 343,149 16,403 Fairfax Financial Holdings Ltd. 34,857 15,934 Encana Corp. 1,476,780 15,806 Cenovus Energy Inc. 1,545,394 15,408 Teck Resources Ltd. Class B 714,308 14,819 Shaw Communications Inc. Class B 641,472 13,600 Intact Financial Corp. 198,437 13,593 Silver Wheaton Corp. 670,694 13,384
4
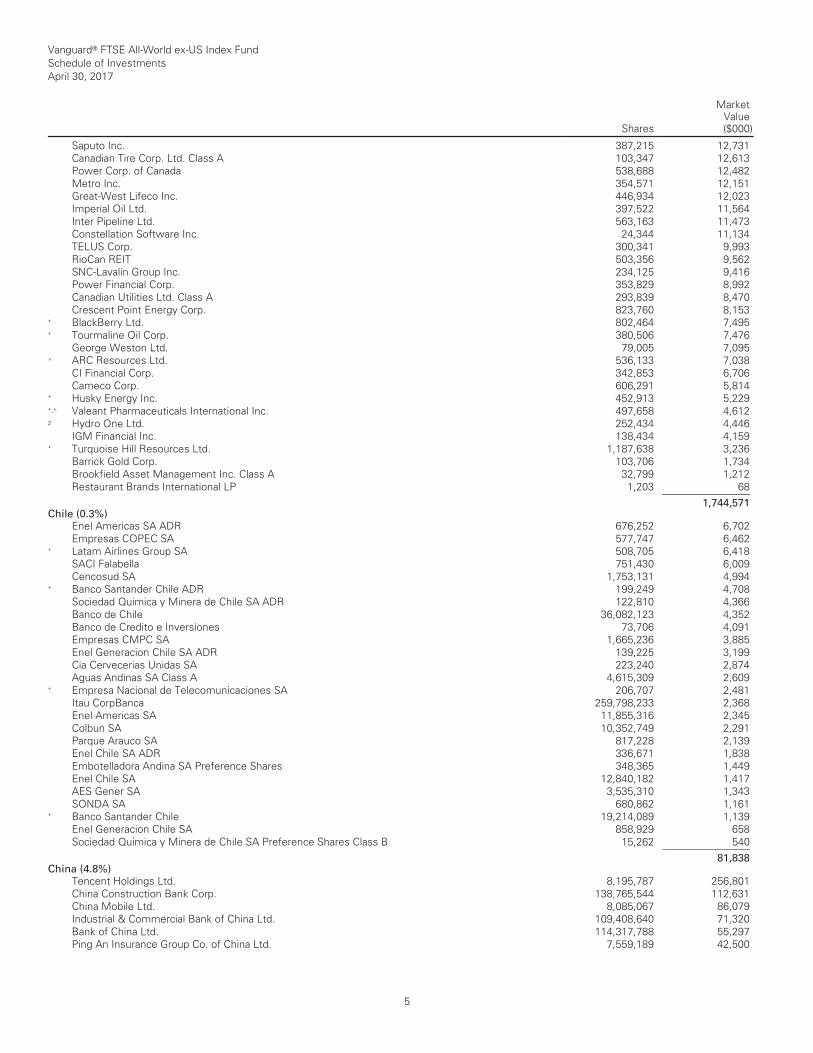
Vanguard® FTSE All-World ex-US Index Fund Schedule of Investments April 30, 2017
Shares
MarketValue($000)
__________________________________________________________________________________________________________________________________________________________________________________________________________________________________________________________________________________________________________________________________________________________________________________________________________________________________________________________________________________________________________________________________________________________________________________________________________________________________________________________________________________________ __________________________________________________________________________________________________________________________________________________________________________________________________________________________________________________________________________________________________________________________________________________________________________________________________________________________________________________________________________________________________________________________________________________________________________________________________________________________________________________________________________________________
Saputo Inc. 387,215 12,731 Canadian Tire Corp. Ltd. Class A 103,347 12,613 Power Corp. of Canada 538,688 12,482 Metro Inc. 354,571 12,151 Great-West Lifeco Inc. 446,934 12,023 Imperial Oil Ltd. 397,522 11,564 Inter Pipeline Ltd. 563,163 11,473 Constellation Software Inc. 24,344 11,134 TELUS Corp. 300,341 9,993 RioCan REIT 503,356 9,562 SNC-Lavalin Group Inc. 234,125 9,416 Power Financial Corp. 353,829 8,992 Canadian Utilities Ltd. Class A 293,839 8,470 Crescent Point Energy Corp. 823,760 8,153 * BlackBerry Ltd. 802,464 7,495 * Tourmaline Oil Corp. 380,506 7,476 George Weston Ltd. 79,005 7,095 ^ ARC Resources Ltd. 536,133 7,038 CI Financial Corp. 342,853 6,706 Cameco Corp. 606,291 5,814 * Husky Energy Inc. 452,913 5,229 *,^ Valeant Pharmaceuticals International Inc. 497,658 4,612 2 Hydro One Ltd. 252,434 4,446 IGM Financial Inc. 138,434 4,159 * Turquoise Hill Resources Ltd. 1,187,638 3,236 Barrick Gold Corp. 103,706 1,734 Brookfield Asset Management Inc. Class A 32,799 1,212 Restaurant Brands International LP 1,203 68 ___________ 1,744,571 Chile (0.3%)
Enel Americas SA ADR 676,252 6,702 Empresas COPEC SA 577,747 6,462 * Latam Airlines Group SA 508,705 6,418 SACI Falabella 751,430 6,009 Cencosud SA 1,753,131 4,994 * Banco Santander Chile ADR 199,249 4,708 Sociedad Quimica y Minera de Chile SA ADR 122,810 4,366 Banco de Chile 36,082,123 4,352 Banco de Credito e Inversiones 73,706 4,091 Empresas CMPC SA 1,665,236 3,885 Enel Generacion Chile SA ADR 139,225 3,199 Cia Cervecerias Unidas SA 223,240 2,874 Aguas Andinas SA Class A 4,615,309 2,609 * Empresa Nacional de Telecomunicaciones SA 206,707 2,481 Itau CorpBanca 259,798,233 2,368 Enel Americas SA 11,855,316 2,345 Colbun SA 10,352,749 2,291 Parque Arauco SA 817,228 2,139 Enel Chile SA ADR 336,671 1,838 Embotelladora Andina SA Preference Shares 348,365 1,449 Enel Chile SA 12,840,182 1,417 AES Gener SA 3,535,310 1,343 SONDA SA 680,862 1,161 * Banco Santander Chile 19,214,089 1,139 Enel Generacion Chile SA 858,929 658 Sociedad Quimica y Minera de Chile SA Preference Shares Class B 15,262 540 ___________ 81,838 China (4.8%)
Tencent Holdings Ltd. 8,195,787 256,801 China Construction Bank Corp. 138,765,544 112,631 China Mobile Ltd. 8,085,067 86,079 Industrial & Commercial Bank of China Ltd. 109,408,640 71,320 Bank of China Ltd. 114,317,788 55,297 Ping An Insurance Group Co. of China Ltd. 7,559,189 42,500
5
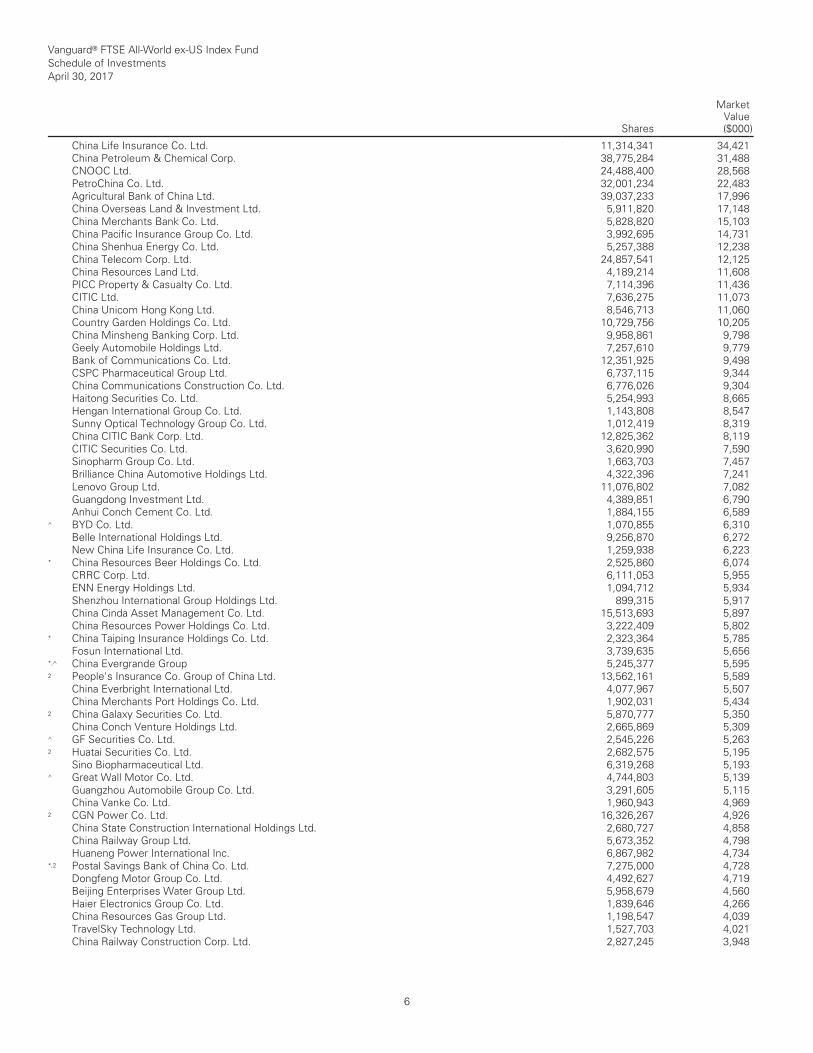
Vanguard® FTSE All-World ex-US Index Fund Schedule of Investments April 30, 2017
Shares
MarketValue($000)
__________________________________________________________________________________________________________________________________________________________________________________________________________________________________________________________________________________________________________________________________________________________________________________________________________________________________________________________________________________________________________________________________________________________________________________________________________________________________________________________________________________________ __________________________________________________________________________________________________________________________________________________________________________________________________________________________________________________________________________________________________________________________________________________________________________________________________________________________________________________________________________________________________________________________________________________________________________________________________________________________________________________________________________________________
China Life Insurance Co. Ltd. 11,314,341 34,421 China Petroleum & Chemical Corp. 38,775,284 31,488 CNOOC Ltd. 24,488,400 28,568 PetroChina Co. Ltd. 32,001,234 22,483 Agricultural Bank of China Ltd. 39,037,233 17,996 China Overseas Land & Investment Ltd. 5,911,820 17,148 China Merchants Bank Co. Ltd. 5,828,820 15,103 China Pacific Insurance Group Co. Ltd. 3,992,695 14,731 China Shenhua Energy Co. Ltd. 5,257,388 12,238 China Telecom Corp. Ltd. 24,857,541 12,125 China Resources Land Ltd. 4,189,214 11,608 PICC Property & Casualty Co. Ltd. 7,114,396 11,436 CITIC Ltd. 7,636,275 11,073 China Unicom Hong Kong Ltd. 8,546,713 11,060 Country Garden Holdings Co. Ltd. 10,729,756 10,205 China Minsheng Banking Corp. Ltd. 9,958,861 9,798 Geely Automobile Holdings Ltd. 7,257,610 9,779 Bank of Communications Co. Ltd. 12,351,925 9,498 CSPC Pharmaceutical Group Ltd. 6,737,115 9,344 China Communications Construction Co. Ltd. 6,776,026 9,304 Haitong Securities Co. Ltd. 5,254,993 8,665 Hengan International Group Co. Ltd. 1,143,808 8,547 Sunny Optical Technology Group Co. Ltd. 1,012,419 8,319 China CITIC Bank Corp. Ltd. 12,825,362 8,119 CITIC Securities Co. Ltd. 3,620,990 7,590 Sinopharm Group Co. Ltd. 1,663,703 7,457 Brilliance China Automotive Holdings Ltd. 4,322,396 7,241 Lenovo Group Ltd. 11,076,802 7,082 Guangdong Investment Ltd. 4,389,851 6,790 Anhui Conch Cement Co. Ltd. 1,884,155 6,589 ^ BYD Co. Ltd. 1,070,855 6,310 Belle International Holdings Ltd. 9,256,870 6,272 New China Life Insurance Co. Ltd. 1,259,938 6,223 * China Resources Beer Holdings Co. Ltd. 2,525,860 6,074 CRRC Corp. Ltd. 6,111,053 5,955 ENN Energy Holdings Ltd. 1,094,712 5,934 Shenzhou International Group Holdings Ltd. 899,315 5,917 China Cinda Asset Management Co. Ltd. 15,513,693 5,897 China Resources Power Holdings Co. Ltd. 3,222,409 5,802 * China Taiping Insurance Holdings Co. Ltd. 2,323,364 5,785 Fosun International Ltd. 3,739,635 5,656 *,^ China Evergrande Group 5,245,377 5,595 2 People's Insurance Co. Group of China Ltd. 13,562,161 5,589 China Everbright International Ltd. 4,077,967 5,507 China Merchants Port Holdings Co. Ltd. 1,902,031 5,434 2 China Galaxy Securities Co. Ltd. 5,870,777 5,350 China Conch Venture Holdings Ltd. 2,665,869 5,309 ^ GF Securities Co. Ltd. 2,545,226 5,263 2 Huatai Securities Co. Ltd. 2,682,575 5,195 Sino Biopharmaceutical Ltd. 6,319,268 5,193 ^ Great Wall Motor Co. Ltd. 4,744,803 5,139 Guangzhou Automobile Group Co. Ltd. 3,291,605 5,115 China Vanke Co. Ltd. 1,960,943 4,969 2 CGN Power Co. Ltd. 16,326,267 4,926 China State Construction International Holdings Ltd. 2,680,727 4,858 China Railway Group Ltd. 5,673,352 4,798 Huaneng Power International Inc. 6,867,982 4,734 *,2 Postal Savings Bank of China Co. Ltd. 7,275,000 4,728 Dongfeng Motor Group Co. Ltd. 4,492,627 4,719 Beijing Enterprises Water Group Ltd. 5,958,679 4,560 Haier Electronics Group Co. Ltd. 1,839,646 4,266 China Resources Gas Group Ltd. 1,198,547 4,039 TravelSky Technology Ltd. 1,527,703 4,021 China Railway Construction Corp. Ltd. 2,827,245 3,948
6
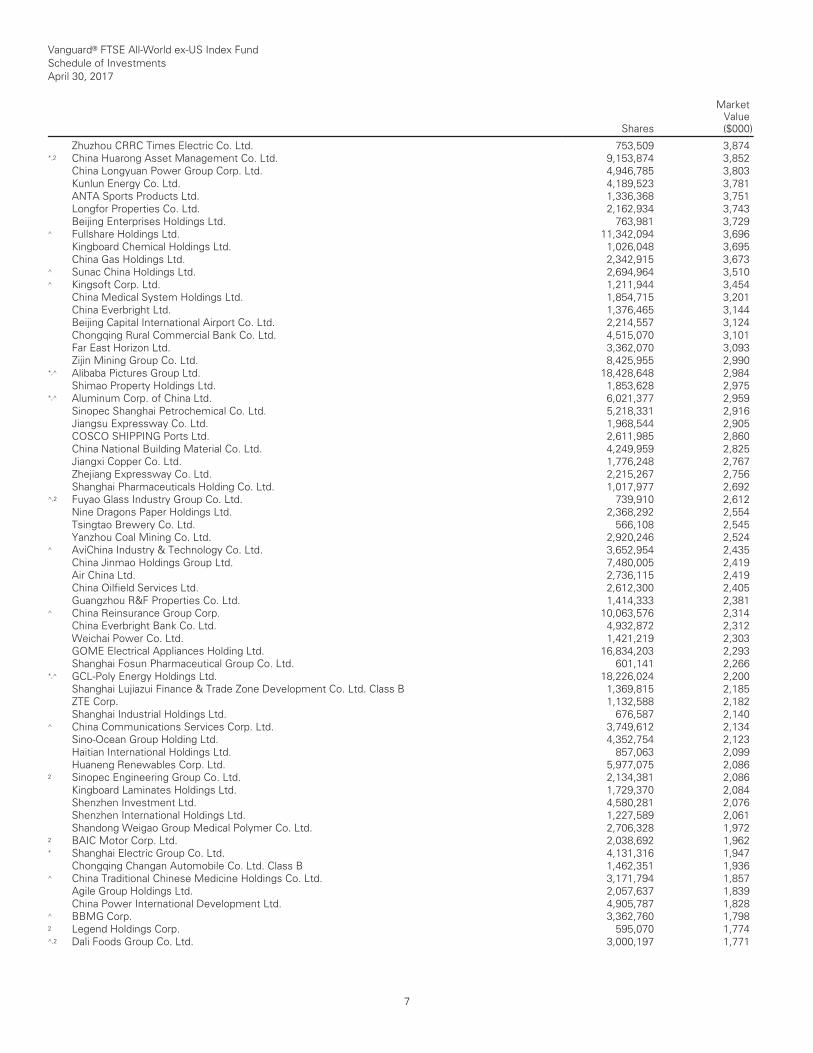
Vanguard® FTSE All-World ex-US Index Fund Schedule of Investments April 30, 2017
Shares
MarketValue($000)
__________________________________________________________________________________________________________________________________________________________________________________________________________________________________________________________________________________________________________________________________________________________________________________________________________________________________________________________________________________________________________________________________________________________________________________________________________________________________________________________________________________________ __________________________________________________________________________________________________________________________________________________________________________________________________________________________________________________________________________________________________________________________________________________________________________________________________________________________________________________________________________________________________________________________________________________________________________________________________________________________________________________________________________________________
Zhuzhou CRRC Times Electric Co. Ltd. 753,509 3,874 *,2 China Huarong Asset Management Co. Ltd. 9,153,874 3,852 China Longyuan Power Group Corp. Ltd. 4,946,785 3,803 Kunlun Energy Co. Ltd. 4,189,523 3,781 ANTA Sports Products Ltd. 1,336,368 3,751 Longfor Properties Co. Ltd. 2,162,934 3,743 Beijing Enterprises Holdings Ltd. 763,981 3,729 ^ Fullshare Holdings Ltd. 11,342,094 3,696 Kingboard Chemical Holdings Ltd. 1,026,048 3,695 China Gas Holdings Ltd. 2,342,915 3,673 ^ Sunac China Holdings Ltd. 2,694,964 3,510 ^ Kingsoft Corp. Ltd. 1,211,944 3,454 China Medical System Holdings Ltd. 1,854,715 3,201 China Everbright Ltd. 1,376,465 3,144 Beijing Capital International Airport Co. Ltd. 2,214,557 3,124 Chongqing Rural Commercial Bank Co. Ltd. 4,515,070 3,101 Far East Horizon Ltd. 3,362,070 3,093 Zijin Mining Group Co. Ltd. 8,425,955 2,990 *,^ Alibaba Pictures Group Ltd. 18,428,648 2,984 Shimao Property Holdings Ltd. 1,853,628 2,975 *,^ Aluminum Corp. of China Ltd. 6,021,377 2,959 Sinopec Shanghai Petrochemical Co. Ltd. 5,218,331 2,916 Jiangsu Expressway Co. Ltd. 1,968,544 2,905 COSCO SHIPPING Ports Ltd. 2,611,985 2,860 China National Building Material Co. Ltd. 4,249,959 2,825 Jiangxi Copper Co. Ltd. 1,776,248 2,767 Zhejiang Expressway Co. Ltd. 2,215,267 2,756 Shanghai Pharmaceuticals Holding Co. Ltd. 1,017,977 2,692 ^,2 Fuyao Glass Industry Group Co. Ltd. 739,910 2,612 Nine Dragons Paper Holdings Ltd. 2,368,292 2,554 Tsingtao Brewery Co. Ltd. 566,108 2,545 Yanzhou Coal Mining Co. Ltd. 2,920,246 2,524 ^ AviChina Industry & Technology Co. Ltd. 3,652,954 2,435 China Jinmao Holdings Group Ltd. 7,480,005 2,419 Air China Ltd. 2,736,115 2,419 China Oilfield Services Ltd. 2,612,300 2,405 Guangzhou R&F Properties Co. Ltd. 1,414,333 2,381 ^ China Reinsurance Group Corp. 10,063,576 2,314 China Everbright Bank Co. Ltd. 4,932,872 2,312 Weichai Power Co. Ltd. 1,421,219 2,303 GOME Electrical Appliances Holding Ltd. 16,834,203 2,293 Shanghai Fosun Pharmaceutical Group Co. Ltd. 601,141 2,266 *,^ GCL-Poly Energy Holdings Ltd. 18,226,024 2,200 Shanghai Lujiazui Finance & Trade Zone Development Co. Ltd. Class B 1,369,815 2,185 ZTE Corp. 1,132,588 2,182 Shanghai Industrial Holdings Ltd. 676,587 2,140 ^ China Communications Services Corp. Ltd. 3,749,612 2,134 Sino-Ocean Group Holding Ltd. 4,352,754 2,123 Haitian International Holdings Ltd. 857,063 2,099 Huaneng Renewables Corp. Ltd. 5,977,075 2,086 2 Sinopec Engineering Group Co. Ltd. 2,134,381 2,086 Kingboard Laminates Holdings Ltd. 1,729,370 2,084 Shenzhen Investment Ltd. 4,580,281 2,076 Shenzhen International Holdings Ltd. 1,227,589 2,061 Shandong Weigao Group Medical Polymer Co. Ltd. 2,706,328 1,972 2 BAIC Motor Corp. Ltd. 2,038,692 1,962 * Shanghai Electric Group Co. Ltd. 4,131,316 1,947 Chongqing Changan Automobile Co. Ltd. Class B 1,462,351 1,936 ^ China Traditional Chinese Medicine Holdings Co. Ltd. 3,171,794 1,857 Agile Group Holdings Ltd. 2,057,637 1,839 China Power International Development Ltd. 4,905,787 1,828 ^ BBMG Corp. 3,362,760 1,798 2 Legend Holdings Corp. 595,070 1,774 ^,2 Dali Foods Group Co. Ltd. 3,000,197 1,771
7
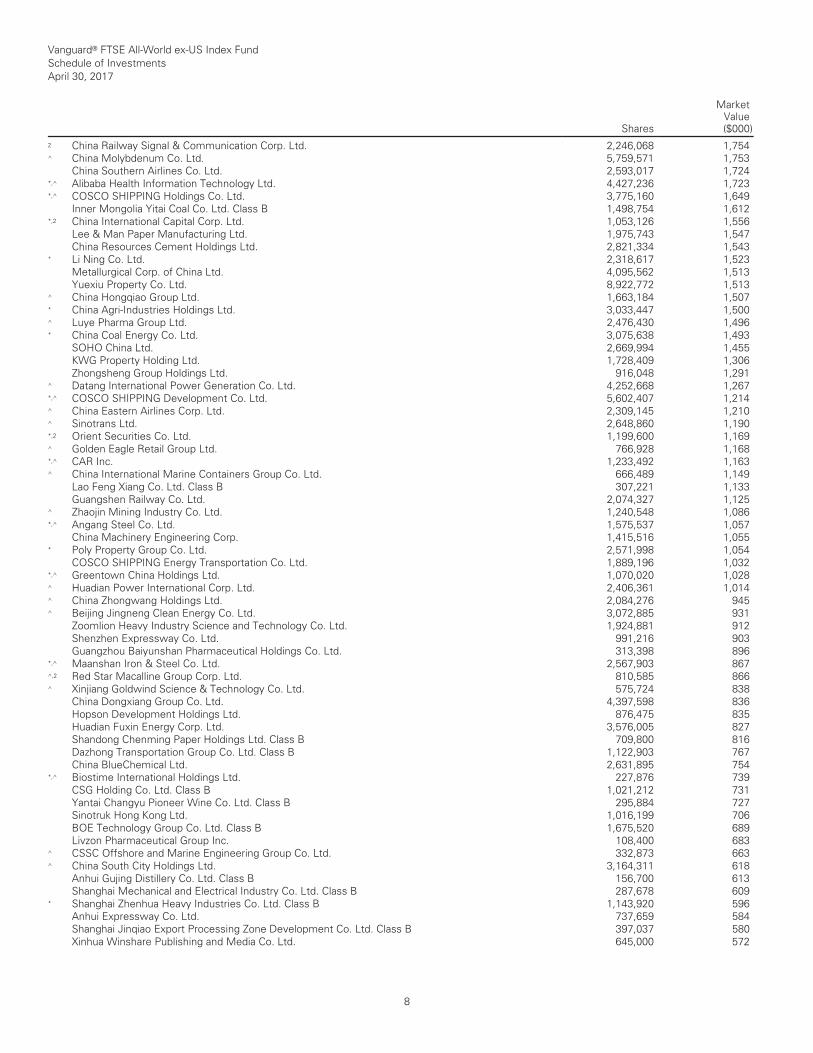
Vanguard® FTSE All-World ex-US Index Fund Schedule of Investments April 30, 2017
Shares
MarketValue($000)
__________________________________________________________________________________________________________________________________________________________________________________________________________________________________________________________________________________________________________________________________________________________________________________________________________________________________________________________________________________________________________________________________________________________________________________________________________________________________________________________________________________________ __________________________________________________________________________________________________________________________________________________________________________________________________________________________________________________________________________________________________________________________________________________________________________________________________________________________________________________________________________________________________________________________________________________________________________________________________________________________________________________________________________________________
2 China Railway Signal & Communication Corp. Ltd. 2,246,068 1,754 ^ China Molybdenum Co. Ltd. 5,759,571 1,753 China Southern Airlines Co. Ltd. 2,593,017 1,724 *,^ Alibaba Health Information Technology Ltd. 4,427,236 1,723 *,^ COSCO SHIPPING Holdings Co. Ltd. 3,775,160 1,649 Inner Mongolia Yitai Coal Co. Ltd. Class B 1,498,754 1,612 *,2 China International Capital Corp. Ltd. 1,053,126 1,556 Lee & Man Paper Manufacturing Ltd. 1,975,743 1,547 China Resources Cement Holdings Ltd. 2,821,334 1,543 * Li Ning Co. Ltd. 2,318,617 1,523 Metallurgical Corp. of China Ltd. 4,095,562 1,513 Yuexiu Property Co. Ltd. 8,922,772 1,513 ^ China Hongqiao Group Ltd. 1,663,184 1,507 * China Agri-Industries Holdings Ltd. 3,033,447 1,500 ^ Luye Pharma Group Ltd. 2,476,430 1,496 * China Coal Energy Co. Ltd. 3,075,638 1,493 SOHO China Ltd. 2,669,994 1,455 KWG Property Holding Ltd. 1,728,409 1,306 Zhongsheng Group Holdings Ltd. 916,048 1,291 ^ Datang International Power Generation Co. Ltd. 4,252,668 1,267 *,^ COSCO SHIPPING Development Co. Ltd. 5,602,407 1,214 ^ China Eastern Airlines Corp. Ltd. 2,309,145 1,210 ^ Sinotrans Ltd. 2,648,860 1,190 *,2 Orient Securities Co. Ltd. 1,199,600 1,169 ^ Golden Eagle Retail Group Ltd. 766,928 1,168 *,^ CAR Inc. 1,233,492 1,163 ^ China International Marine Containers Group Co. Ltd. 666,489 1,149 Lao Feng Xiang Co. Ltd. Class B 307,221 1,133 Guangshen Railway Co. Ltd. 2,074,327 1,125 ^ Zhaojin Mining Industry Co. Ltd. 1,240,548 1,086 *,^ Angang Steel Co. Ltd. 1,575,537 1,057 China Machinery Engineering Corp. 1,415,516 1,055 * Poly Property Group Co. Ltd. 2,571,998 1,054 COSCO SHIPPING Energy Transportation Co. Ltd. 1,889,196 1,032 *,^ Greentown China Holdings Ltd. 1,070,020 1,028 ^ Huadian Power International Corp. Ltd. 2,406,361 1,014 ^ China Zhongwang Holdings Ltd. 2,084,276 945 ^ Beijing Jingneng Clean Energy Co. Ltd. 3,072,885 931 Zoomlion Heavy Industry Science and Technology Co. Ltd. 1,924,881 912 Shenzhen Expressway Co. Ltd. 991,216 903 Guangzhou Baiyunshan Pharmaceutical Holdings Co. Ltd. 313,398 896 *,^ Maanshan Iron & Steel Co. Ltd. 2,567,903 867 ^,2 Red Star Macalline Group Corp. Ltd. 810,585 866 ^ Xinjiang Goldwind Science & Technology Co. Ltd. 575,724 838 China Dongxiang Group Co. Ltd. 4,397,598 836 Hopson Development Holdings Ltd. 876,475 835 Huadian Fuxin Energy Corp. Ltd. 3,576,005 827 Shandong Chenming Paper Holdings Ltd. Class B 709,800 816 Dazhong Transportation Group Co. Ltd. Class B 1,122,903 767 China BlueChemical Ltd. 2,631,895 754 *,^ Biostime International Holdings Ltd. 227,876 739 CSG Holding Co. Ltd. Class B 1,021,212 731 Yantai Changyu Pioneer Wine Co. Ltd. Class B 295,884 727 Sinotruk Hong Kong Ltd. 1,016,199 706 BOE Technology Group Co. Ltd. Class B 1,675,520 689 Livzon Pharmaceutical Group Inc. 108,400 683 ^ CSSC Offshore and Marine Engineering Group Co. Ltd. 332,873 663 ^ China South City Holdings Ltd. 3,164,311 618 Anhui Gujing Distillery Co. Ltd. Class B 156,700 613 Shanghai Mechanical and Electrical Industry Co. Ltd. Class B 287,678 609 * Shanghai Zhenhua Heavy Industries Co. Ltd. Class B 1,143,920 596 Anhui Expressway Co. Ltd. 737,659 584 Shanghai Jinqiao Export Processing Zone Development Co. Ltd. Class B 397,037 580 Xinhua Winshare Publishing and Media Co. Ltd. 645,000 572
8

Vanguard® FTSE All-World ex-US Index Fund Schedule of Investments April 30, 2017
Shares
MarketValue($000)
__________________________________________________________________________________________________________________________________________________________________________________________________________________________________________________________________________________________________________________________________________________________________________________________________________________________________________________________________________________________________________________________________________________________________________________________________________________________________________________________________________________________ __________________________________________________________________________________________________________________________________________________________________________________________________________________________________________________________________________________________________________________________________________________________________________________________________________________________________________________________________________________________________________________________________________________________________________________________________________________________________________________________________________________________
Shandong Chenming Paper Holdings Ltd. 487,874 561 China National Materials Co. Ltd. 1,580,369 554 *,2 Tianhe Chemicals Group Ltd. 3,538,329 532 *,^ Renhe Commercial Holdings Co. Ltd. 20,656,355 528 Weifu High-Technology Group Co. Ltd. Class B 213,062 517 Sichuan Expressway Co. Ltd. 1,167,487 512 *,2 Everbright Securities Co. Ltd. 339,200 502 Guangdong Electric Power Development Co. Ltd. Class B 1,134,572 502 *,^ Sinopec Oilfield Service Corp. 2,790,643 487 Shanghai Jinjiang International Hotels Development Co. Ltd. Class B 220,415 478 ^ Dalian Port PDA Co. Ltd. 2,651,103 470 Shanghai Baosight Software Co. Ltd. Class B 308,442 459 ^ CIMC Enric Holdings Ltd. 772,225 450 China National Accord Medicines Corp. Ltd. Class B 74,430 449 Shanghai Haixin Group Co. Class B 596,446 430 Shanghai Waigaoqiao Free Trade Zone Group Co. Ltd. Class B 254,321 423 ^ Dongfang Electric Corp. Ltd. 451,295 398 * Hanergy Thin Film Power Group Ltd. 14,742,000 385 2 Shengjing Bank Co. Ltd. 443,632 382 * CITIC Resources Holdings Ltd. 3,012,222 364 China Foods Ltd. 918,843 354 ^ Beijing North Star Co. Ltd. 907,223 351 * Shanghai Bailian Group Co. Ltd. Class B 239,123 349 Bosideng International Holdings Ltd. 4,255,541 344 Shenzhen Chiwan Wharf Holdings Ltd. Class B 190,700 340 * Shanghai Chlor-Alkali Chemical Co. Ltd. Class B 521,434 336 Foshan Electrical and Lighting Co. Ltd. Class B 394,576 329 Shanghai Shibei Hi-Tech Co. Ltd. Class B 309,130 327 * Huadian Energy Co. Ltd. Class B 630,800 315 ^ Sinofert Holdings Ltd. 2,319,208 310 Shanghai Jinjiang International Industrial Investment Co. Ltd. Class B 213,740 302 ^ China Huishan Dairy Holdings Co. Ltd. 5,503,795 297 Tianjin Capital Environmental Protection Group Co. Ltd. 412,838 280 Shanghai Huayi Group Corp. Ltd. Class B 311,547 278 Jiangling Motors Corp. Ltd. Class B 111,283 236 * Bengang Steel Plates Co. Ltd. Class B 637,300 229 Huishang Bank Corp. Ltd. 439,092 207 Jinzhou Port Co. Ltd. Class B 370,560 199 * Bank of Communications Co. Ltd. Rights Exp. 05/10/2017 24,283 — ___________ 1,443,729 Colombia (0.1%)
Bancolombia SA ADR 178,094 7,033 Grupo de Inversiones Suramericana SA 370,496 4,899 Grupo Argos SA 483,212 3,350 Cementos Argos SA 572,449 2,315 * Ecopetrol SA 4,821,790 2,229 Grupo de Inversiones Suramericana SA Preference Shares 162,012 2,074 Grupo Aval Acciones y Valores Preference Shares 5,017,064 1,987 Interconexion Electrica SA ESP 493,487 1,956 Almacenes Exito SA 337,184 1,747 Cementos Argos SA Preference Shares 310,732 1,160 * Ecopetrol SA ADR 119,695 1,094 * Cemex Latam Holdings SA 244,889 894 Grupo Aval Acciones y Valores SA ADR 46,572 371 ___________ 31,109 Czech Republic (0.0%)
* Komercni banka as 113,523 4,401 CEZ AS 239,341 4,176 *,2 Moneta Money Bank AS 763,097 2,467 * O2 Czech Republic AS 74,494 879 ___________ 11,923 Denmark (1.2%)
Novo Nordisk A/S Class B 2,801,971 109,100
9
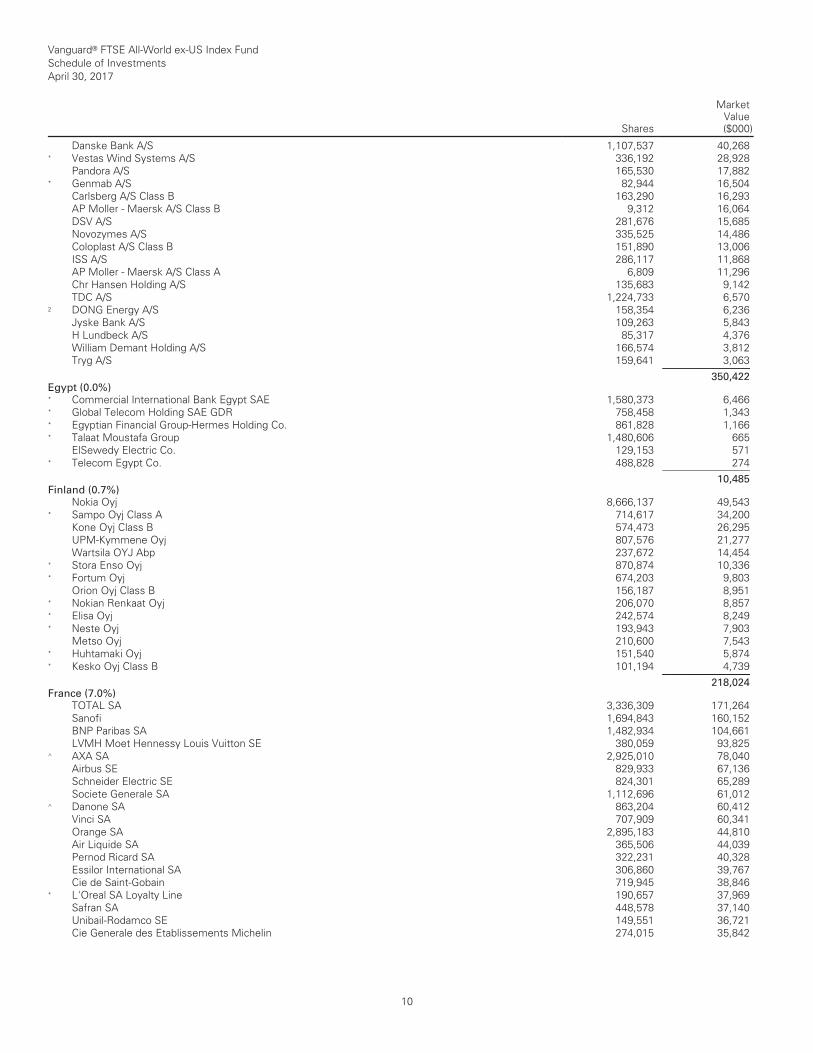
Vanguard® FTSE All-World ex-US Index Fund Schedule of Investments April 30, 2017
Shares
MarketValue($000)
__________________________________________________________________________________________________________________________________________________________________________________________________________________________________________________________________________________________________________________________________________________________________________________________________________________________________________________________________________________________________________________________________________________________________________________________________________________________________________________________________________________________ __________________________________________________________________________________________________________________________________________________________________________________________________________________________________________________________________________________________________________________________________________________________________________________________________________________________________________________________________________________________________________________________________________________________________________________________________________________________________________________________________________________________
Danske Bank A/S 1,107,537 40,268 * Vestas Wind Systems A/S 336,192 28,928 Pandora A/S 165,530 17,882 * Genmab A/S 82,944 16,504 Carlsberg A/S Class B 163,290 16,293 AP Moller - Maersk A/S Class B 9,312 16,064 DSV A/S 281,676 15,685 Novozymes A/S 335,525 14,486 Coloplast A/S Class B 151,890 13,006 ISS A/S 286,117 11,868 AP Moller - Maersk A/S Class A 6,809 11,296 Chr Hansen Holding A/S 135,683 9,142 TDC A/S 1,224,733 6,570 2 DONG Energy A/S 158,354 6,236 Jyske Bank A/S 109,263 5,843 H Lundbeck A/S 85,317 4,376 William Demant Holding A/S 166,574 3,812 Tryg A/S 159,641 3,063 ___________ 350,422 Egypt (0.0%)
* Commercial International Bank Egypt SAE 1,580,373 6,466 * Global Telecom Holding SAE GDR 758,458 1,343 * Egyptian Financial Group-Hermes Holding Co. 861,828 1,166 * Talaat Moustafa Group 1,480,606 665 ElSewedy Electric Co. 129,153 571 * Telecom Egypt Co. 488,828 274 ___________ 10,485 Finland (0.7%)
Nokia Oyj 8,666,137 49,543 * Sampo Oyj Class A 714,617 34,200 Kone Oyj Class B 574,473 26,295 UPM-Kymmene Oyj 807,576 21,277 Wartsila OYJ Abp 237,672 14,454 * Stora Enso Oyj 870,874 10,336 * Fortum Oyj 674,203 9,803 Orion Oyj Class B 156,187 8,951 * Nokian Renkaat Oyj 206,070 8,857 * Elisa Oyj 242,574 8,249 * Neste Oyj 193,943 7,903 Metso Oyj 210,600 7,543 * Huhtamaki Oyj 151,540 5,874 * Kesko Oyj Class B 101,194 4,739 ___________ 218,024 France (7.0%)
TOTAL SA 3,336,309 171,264 Sanofi 1,694,843 160,152 BNP Paribas SA 1,482,934 104,661 LVMH Moet Hennessy Louis Vuitton SE 380,059 93,825 ^ AXA SA 2,925,010 78,040 Airbus SE 829,933 67,136 Schneider Electric SE 824,301 65,289 Societe Generale SA 1,112,696 61,012 ^ Danone SA 863,204 60,412 Vinci SA 707,909 60,341 Orange SA 2,895,183 44,810 Air Liquide SA 365,506 44,039 Pernod Ricard SA 322,231 40,328 Essilor International SA 306,860 39,767 Cie de Saint-Gobain 719,945 38,846 * L'Oreal SA Loyalty Line 190,657 37,969 Safran SA 448,578 37,140 Unibail-Rodamco SE 149,551 36,721 Cie Generale des Etablissements Michelin 274,015 35,842
10

Vanguard® FTSE All-World ex-US Index Fund Schedule of Investments April 30, 2017
Shares
MarketValue($000)
__________________________________________________________________________________________________________________________________________________________________________________________________________________________________________________________________________________________________________________________________________________________________________________________________________________________________________________________________________________________________________________________________________________________________________________________________________________________________________________________________________________________ __________________________________________________________________________________________________________________________________________________________________________________________________________________________________________________________________________________________________________________________________________________________________________________________________________________________________________________________________________________________________________________________________________________________________________________________________________________________________________________________________________________________
^ Kering 113,207 35,089 * L'Oreal SA 174,642 34,780 ^ Engie SA 2,366,108 33,362 *,^ Vivendi SA 1,639,980 32,529 Air Liquide SA (Prime de fidelite) 219,013 26,388 Legrand SA 404,395 26,177 * Valeo SA 358,569 25,803 Renault SA 261,195 24,357 Cap Gemini SA 242,327 24,262 Publicis Groupe SA 312,627 22,570 Christian Dior SE 78,480 21,524 * TechnipFMC plc 700,821 21,069 Credit Agricole SA 1,346,479 20,027 Carrefour SA 815,754 19,212 Atos SE 137,921 18,066 Sodexo SA 137,248 17,443 Hermes International 36,146 17,280 Dassault Systemes SE 193,022 17,222 Thales SA 158,044 16,611 STMicroelectronics NV 955,091 15,333 ^ Veolia Environnement SA 746,344 14,203 *,^ Bouygues SA 304,698 12,808 * Peugeot SA 595,996 12,495 *,^ Klepierre 315,467 12,382 * Accor SA 265,393 12,102 * SES SA Class A 546,767 11,951 Arkema SA 108,736 11,513 Teleperformance 87,741 11,033 Natixis SA 1,433,732 9,978 *,^ SCOR SE 242,171 9,580 Eiffage SA 110,988 9,401 Bureau Veritas SA 398,343 9,230 Edenred 354,208 9,074 Gecina SA 61,974 8,814 Iliad SA 36,183 8,782 ^ Suez 523,124 8,593 Rexel SA 467,995 8,358 Groupe Eurotunnel SE 716,116 7,867 Ingenico Group SA 84,381 7,640 * Alstom SA 238,048 7,556 Zodiac Aerospace 299,779 7,277 Eurofins Scientific SE 14,642 7,212 Wendel SA 49,259 6,905 Orpea 61,639 6,296 Eutelsat Communications SA 260,021 6,152 Ipsen SA 51,557 6,002 Bollore SA 1,467,298 5,970 Aeroports de Paris 42,164 5,625 Credit Agricole SA Loyalty Line 374,217 5,566 Fonciere Des Regions 62,045 5,537 Lagardere SCA 178,919 5,477 Faurecia 108,481 5,302 Casino Guichard Perrachon SA 83,884 5,052 CNP Assurances 240,706 5,028 2 Amundi SA 74,723 4,917 SEB SA 30,496 4,911 Imerys SA 55,173 4,747 Societe BIC SA 39,897 4,484 Eurazeo SA 62,806 4,257 BioMerieux 20,860 4,172 * Dassault Aviation SA 3,000 4,100 JCDecaux SA 111,181 3,925 Electricite de France SA 462,450 3,860 ICADE 51,233 3,804
11
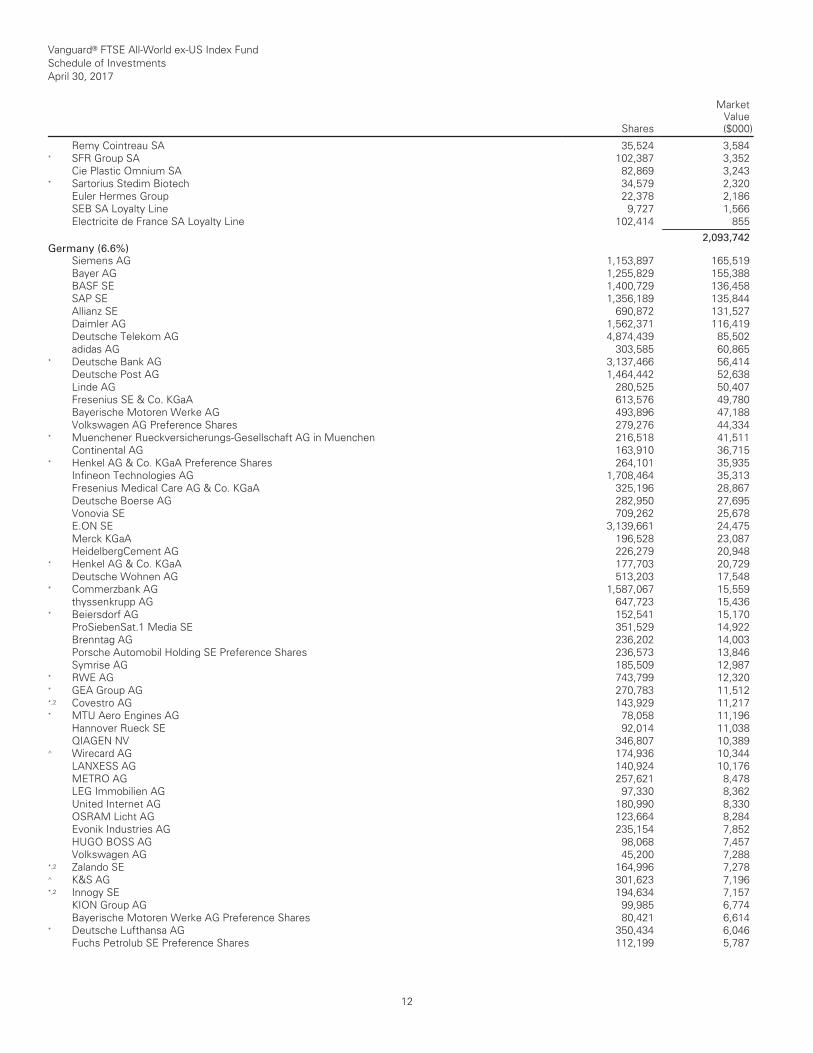
Vanguard® FTSE All-World ex-US Index Fund Schedule of Investments April 30, 2017
Shares
MarketValue($000)
__________________________________________________________________________________________________________________________________________________________________________________________________________________________________________________________________________________________________________________________________________________________________________________________________________________________________________________________________________________________________________________________________________________________________________________________________________________________________________________________________________________________ __________________________________________________________________________________________________________________________________________________________________________________________________________________________________________________________________________________________________________________________________________________________________________________________________________________________________________________________________________________________________________________________________________________________________________________________________________________________________________________________________________________________
Remy Cointreau SA 35,524 3,584 * SFR Group SA 102,387 3,352 Cie Plastic Omnium SA 82,869 3,243 * Sartorius Stedim Biotech 34,579 2,320 Euler Hermes Group 22,378 2,186 SEB SA Loyalty Line 9,727 1,566 Electricite de France SA Loyalty Line 102,414 855 ___________ 2,093,742 Germany (6.6%)
Siemens AG 1,153,897 165,519 Bayer AG 1,255,829 155,388 BASF SE 1,400,729 136,458 SAP SE 1,356,189 135,844 Allianz SE 690,872 131,527 Daimler AG 1,562,371 116,419 Deutsche Telekom AG 4,874,439 85,502 adidas AG 303,585 60,865 * Deutsche Bank AG 3,137,466 56,414 Deutsche Post AG 1,464,442 52,638 Linde AG 280,525 50,407 Fresenius SE & Co. KGaA 613,576 49,780 Bayerische Motoren Werke AG 493,896 47,188 Volkswagen AG Preference Shares 279,276 44,334 * Muenchener Rueckversicherungs-Gesellschaft AG in Muenchen 216,518 41,511 Continental AG 163,910 36,715 * Henkel AG & Co. KGaA Preference Shares 264,101 35,935 Infineon Technologies AG 1,708,464 35,313 Fresenius Medical Care AG & Co. KGaA 325,196 28,867 Deutsche Boerse AG 282,950 27,695 Vonovia SE 709,262 25,678 E.ON SE 3,139,661 24,475 Merck KGaA 196,528 23,087 HeidelbergCement AG 226,279 20,948 * Henkel AG & Co. KGaA 177,703 20,729 Deutsche Wohnen AG 513,203 17,548 * Commerzbank AG 1,587,067 15,559 thyssenkrupp AG 647,723 15,436 * Beiersdorf AG 152,541 15,170 ProSiebenSat.1 Media SE 351,529 14,922 Brenntag AG 236,202 14,003 Porsche Automobil Holding SE Preference Shares 236,573 13,846 Symrise AG 185,509 12,987 * RWE AG 743,799 12,320 * GEA Group AG 270,783 11,512 *,2 Covestro AG 143,929 11,217 * MTU Aero Engines AG 78,058 11,196 Hannover Rueck SE 92,014 11,038 QIAGEN NV 346,807 10,389 ^ Wirecard AG 174,936 10,344 LANXESS AG 140,924 10,176 METRO AG 257,621 8,478 LEG Immobilien AG 97,330 8,362 United Internet AG 180,990 8,330 OSRAM Licht AG 123,664 8,284 Evonik Industries AG 235,154 7,852 HUGO BOSS AG 98,068 7,457 Volkswagen AG 45,200 7,288 *,2 Zalando SE 164,996 7,278 ^ K&S AG 301,623 7,196 *,2 Innogy SE 194,634 7,157 KION Group AG 99,985 6,774 Bayerische Motoren Werke AG Preference Shares 80,421 6,614 * Deutsche Lufthansa AG 350,434 6,046 Fuchs Petrolub SE Preference Shares 112,199 5,787
12

Vanguard® FTSE All-World ex-US Index Fund Schedule of Investments April 30, 2017
Shares
MarketValue($000)
__________________________________________________________________________________________________________________________________________________________________________________________________________________________________________________________________________________________________________________________________________________________________________________________________________________________________________________________________________________________________________________________________________________________________________________________________________________________________________________________________________________________ __________________________________________________________________________________________________________________________________________________________________________________________________________________________________________________________________________________________________________________________________________________________________________________________________________________________________________________________________________________________________________________________________________________________________________________________________________________________________________________________________________________________
MAN SE 51,578 5,419 HOCHTIEF AG 29,083 5,238 Telefonica Deutschland Holding AG 1,000,880 4,853 * Uniper SE 295,686 4,853 * Sartorius AG Preference Shares 49,998 4,577 RTL Group SA 56,524 4,381 Fraport AG Frankfurt Airport Services Worldwide 54,494 4,287 * Axel Springer SE 66,295 3,720 TUI AG (Frankfurt Shares) 232,404 3,369 Hella KGaA Hueck & Co. 65,084 3,222 Rational AG 5,913 2,972 Fielmann AG 36,849 2,817 Suedzucker AG 112,294 2,403 Wacker Chemie AG 22,582 2,390 FUCHS PETROLUB SE 48,186 2,176 Talanx AG 54,122 1,951 * RWE AG Preference Shares 43,770 532 ___________ 1,978,962 Greece (0.1%)
* Alpha Bank AE 2,042,627 4,352 Hellenic Telecommunications Organization SA 381,622 3,706 OPAP SA 309,887 3,071 * National Bank of Greece SA 8,255,169 2,570 JUMBO SA 142,245 2,244 * Eurobank Ergasias SA 2,630,467 2,120 * Piraeus Bank SA 8,431,618 1,791 Titan Cement Co. SA 68,110 1,778 Motor Oil Hellas Corinth Refineries SA 81,305 1,380 * FF Group 49,006 1,042 * Hellenic Petroleum SA 109,018 628 ___________ 24,682 Hong Kong (2.7%)
AIA Group Ltd. 18,290,852 126,599 CK Hutchison Holdings Ltd. 4,278,610 53,428 Hong Kong Exchanges & Clearing Ltd. 1,848,271 45,456 Sun Hung Kai Properties Ltd. 2,145,233 32,146 Cheung Kong Property Holdings Ltd. 4,214,449 30,172 CLP Holdings Ltd. 2,341,444 24,693 Link REIT 3,369,460 24,220 Hang Seng Bank Ltd. 1,164,266 23,583 Hong Kong & China Gas Co. Ltd. 11,404,327 22,784 BOC Hong Kong Holdings Ltd. 5,466,196 22,464 Jardine Matheson Holdings Ltd. 316,292 20,354 Power Assets Holdings Ltd. 2,024,816 18,211 Galaxy Entertainment Group Ltd. 3,250,309 18,057 Sands China Ltd. 3,694,008 16,731 AAC Technologies Holdings Inc. 1,073,949 15,743 Wharf Holdings Ltd. 1,838,430 15,675 Jardine Strategic Holdings Ltd. 337,047 14,242 Hongkong Land Holdings Ltd. 1,805,491 13,915 MTR Corp. Ltd. 2,128,342 12,245 Henderson Land Development Co. Ltd. 1,708,128 10,813 2 WH Group Ltd. 11,855,266 10,577 New World Development Co. Ltd. 8,331,840 10,361 Wheelock & Co. Ltd. 1,255,113 9,777 Cheung Kong Infrastructure Holdings Ltd. 1,008,318 8,827 Techtronic Industries Co. Ltd. 1,959,888 8,409 Hang Lung Properties Ltd. 3,196,742 8,376 Sino Land Co. Ltd. 4,820,374 8,157 China Mengniu Dairy Co. Ltd. 4,186,849 8,089 Bank of East Asia Ltd. 1,846,515 7,636 Samsonite International SA 1,976,658 7,627 Swire Pacific Ltd. Class A 771,587 7,440 ^ Want Want China Holdings Ltd. 9,062,382 6,517
13
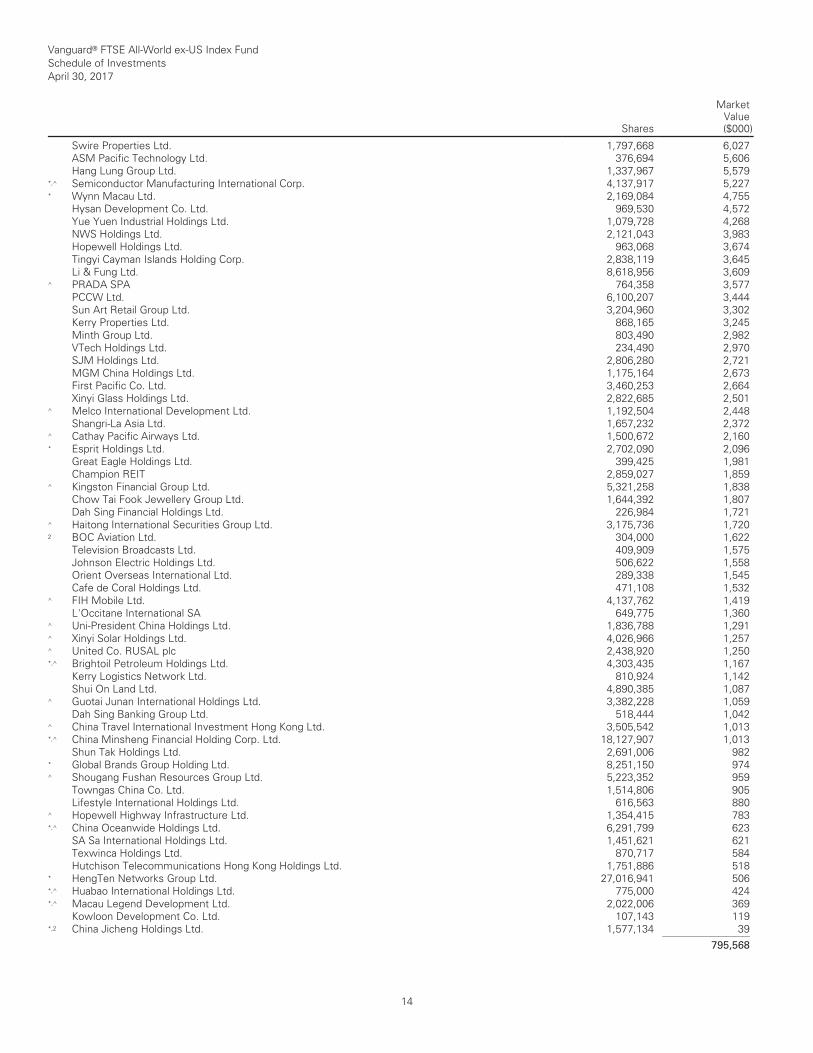
Vanguard® FTSE All-World ex-US Index Fund Schedule of Investments April 30, 2017
Shares
MarketValue($000)
__________________________________________________________________________________________________________________________________________________________________________________________________________________________________________________________________________________________________________________________________________________________________________________________________________________________________________________________________________________________________________________________________________________________________________________________________________________________________________________________________________________________ __________________________________________________________________________________________________________________________________________________________________________________________________________________________________________________________________________________________________________________________________________________________________________________________________________________________________________________________________________________________________________________________________________________________________________________________________________________________________________________________________________________________
Swire Properties Ltd. 1,797,668 6,027 ASM Pacific Technology Ltd. 376,694 5,606 Hang Lung Group Ltd. 1,337,967 5,579 *,^ Semiconductor Manufacturing International Corp. 4,137,917 5,227 * Wynn Macau Ltd. 2,169,084 4,755 Hysan Development Co. Ltd. 969,530 4,572 Yue Yuen Industrial Holdings Ltd. 1,079,728 4,268 NWS Holdings Ltd. 2,121,043 3,983 Hopewell Holdings Ltd. 963,068 3,674 Tingyi Cayman Islands Holding Corp. 2,838,119 3,645 Li & Fung Ltd. 8,618,956 3,609 ^ PRADA SPA 764,358 3,577 PCCW Ltd. 6,100,207 3,444 Sun Art Retail Group Ltd. 3,204,960 3,302 Kerry Properties Ltd. 868,165 3,245 Minth Group Ltd. 803,490 2,982 VTech Holdings Ltd. 234,490 2,970 SJM Holdings Ltd. 2,806,280 2,721 MGM China Holdings Ltd. 1,175,164 2,673 First Pacific Co. Ltd. 3,460,253 2,664 Xinyi Glass Holdings Ltd. 2,822,685 2,501 ^ Melco International Development Ltd. 1,192,504 2,448 Shangri-La Asia Ltd. 1,657,232 2,372 ^ Cathay Pacific Airways Ltd. 1,500,672 2,160 * Esprit Holdings Ltd. 2,702,090 2,096 Great Eagle Holdings Ltd. 399,425 1,981 Champion REIT 2,859,027 1,859 ^ Kingston Financial Group Ltd. 5,321,258 1,838 Chow Tai Fook Jewellery Group Ltd. 1,644,392 1,807 Dah Sing Financial Holdings Ltd. 226,984 1,721 ^ Haitong International Securities Group Ltd. 3,175,736 1,720 2 BOC Aviation Ltd. 304,000 1,622 Television Broadcasts Ltd. 409,909 1,575 Johnson Electric Holdings Ltd. 506,622 1,558 Orient Overseas International Ltd. 289,338 1,545 Cafe de Coral Holdings Ltd. 471,108 1,532 ^ FIH Mobile Ltd. 4,137,762 1,419 L'Occitane International SA 649,775 1,360 ^ Uni-President China Holdings Ltd. 1,836,788 1,291 ^ Xinyi Solar Holdings Ltd. 4,026,966 1,257 ^ United Co. RUSAL plc 2,438,920 1,250 *,^ Brightoil Petroleum Holdings Ltd. 4,303,435 1,167 Kerry Logistics Network Ltd. 810,924 1,142 Shui On Land Ltd. 4,890,385 1,087 ^ Guotai Junan International Holdings Ltd. 3,382,228 1,059 Dah Sing Banking Group Ltd. 518,444 1,042 ^ China Travel International Investment Hong Kong Ltd. 3,505,542 1,013 *,^ China Minsheng Financial Holding Corp. Ltd. 18,127,907 1,013 Shun Tak Holdings Ltd. 2,691,006 982 * Global Brands Group Holding Ltd. 8,251,150 974 ^ Shougang Fushan Resources Group Ltd. 5,223,352 959 Towngas China Co. Ltd. 1,514,806 905 Lifestyle International Holdings Ltd. 616,563 880 ^ Hopewell Highway Infrastructure Ltd. 1,354,415 783 *,^ China Oceanwide Holdings Ltd. 6,291,799 623 SA Sa International Holdings Ltd. 1,451,621 621 Texwinca Holdings Ltd. 870,717 584 Hutchison Telecommunications Hong Kong Holdings Ltd. 1,751,886 518 * HengTen Networks Group Ltd. 27,016,941 506 *,^ Huabao International Holdings Ltd. 775,000 424 *,^ Macau Legend Development Ltd. 2,022,006 369 Kowloon Development Co. Ltd. 107,143 119 *,2 China Jicheng Holdings Ltd. 1,577,134 39 ___________ 795,568
14
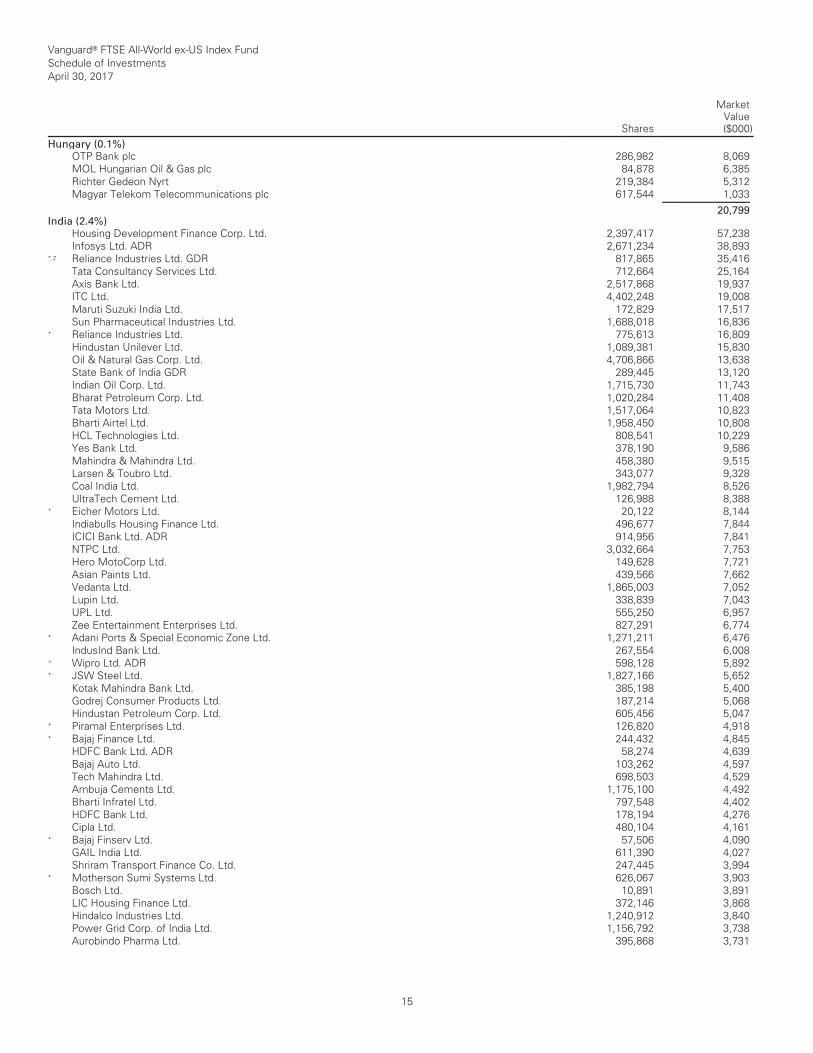
Vanguard® FTSE All-World ex-US Index Fund Schedule of Investments April 30, 2017
Shares
MarketValue($000)
__________________________________________________________________________________________________________________________________________________________________________________________________________________________________________________________________________________________________________________________________________________________________________________________________________________________________________________________________________________________________________________________________________________________________________________________________________________________________________________________________________________________ __________________________________________________________________________________________________________________________________________________________________________________________________________________________________________________________________________________________________________________________________________________________________________________________________________________________________________________________________________________________________________________________________________________________________________________________________________________________________________________________________________________________
Hungary (0.1%)
OTP Bank plc 286,982 8,069 MOL Hungarian Oil & Gas plc 84,878 6,385 Richter Gedeon Nyrt 219,384 5,312 Magyar Telekom Telecommunications plc 617,544 1,033 ___________ 20,799 India (2.4%)
Housing Development Finance Corp. Ltd. 2,397,417 57,238 Infosys Ltd. ADR 2,671,234 38,893 *,2 Reliance Industries Ltd. GDR 817,865 35,416 Tata Consultancy Services Ltd. 712,664 25,164 Axis Bank Ltd. 2,517,868 19,937 ITC Ltd. 4,402,248 19,008 Maruti Suzuki India Ltd. 172,829 17,517 Sun Pharmaceutical Industries Ltd. 1,688,018 16,836 * Reliance Industries Ltd. 775,613 16,809 Hindustan Unilever Ltd. 1,089,381 15,830 Oil & Natural Gas Corp. Ltd. 4,706,866 13,638 State Bank of India GDR 289,445 13,120 Indian Oil Corp. Ltd. 1,715,730 11,743 Bharat Petroleum Corp. Ltd. 1,020,284 11,408 Tata Motors Ltd. 1,517,064 10,823 Bharti Airtel Ltd. 1,958,450 10,808 HCL Technologies Ltd. 808,541 10,229 Yes Bank Ltd. 378,190 9,586 Mahindra & Mahindra Ltd. 458,380 9,515 Larsen & Toubro Ltd. 343,077 9,328 Coal India Ltd. 1,982,794 8,526 UltraTech Cement Ltd. 126,988 8,388 * Eicher Motors Ltd. 20,122 8,144 Indiabulls Housing Finance Ltd. 496,677 7,844 ICICI Bank Ltd. ADR 914,956 7,841 NTPC Ltd. 3,032,664 7,753 Hero MotoCorp Ltd. 149,628 7,721 Asian Paints Ltd. 439,566 7,662 Vedanta Ltd. 1,865,003 7,052 Lupin Ltd. 338,839 7,043 UPL Ltd. 555,250 6,957 Zee Entertainment Enterprises Ltd. 827,291 6,774 * Adani Ports & Special Economic Zone Ltd. 1,271,211 6,476 IndusInd Bank Ltd. 267,554 6,008 ^ Wipro Ltd. ADR 598,128 5,892 * JSW Steel Ltd. 1,827,166 5,652 Kotak Mahindra Bank Ltd. 385,198 5,400 Godrej Consumer Products Ltd. 187,214 5,068 Hindustan Petroleum Corp. Ltd. 605,456 5,047 * Piramal Enterprises Ltd. 126,820 4,918 * Bajaj Finance Ltd. 244,432 4,845 HDFC Bank Ltd. ADR 58,274 4,639 Bajaj Auto Ltd. 103,262 4,597 Tech Mahindra Ltd. 698,503 4,529 Ambuja Cements Ltd. 1,175,100 4,492 Bharti Infratel Ltd. 797,548 4,402 HDFC Bank Ltd. 178,194 4,276 Cipla Ltd. 480,104 4,161 * Bajaj Finserv Ltd. 57,506 4,090 GAIL India Ltd. 611,390 4,027 Shriram Transport Finance Co. Ltd. 247,445 3,994 * Motherson Sumi Systems Ltd. 626,067 3,903 Bosch Ltd. 10,891 3,891 LIC Housing Finance Ltd. 372,146 3,868 Hindalco Industries Ltd. 1,240,912 3,840 Power Grid Corp. of India Ltd. 1,156,792 3,738 Aurobindo Pharma Ltd. 395,868 3,731
15
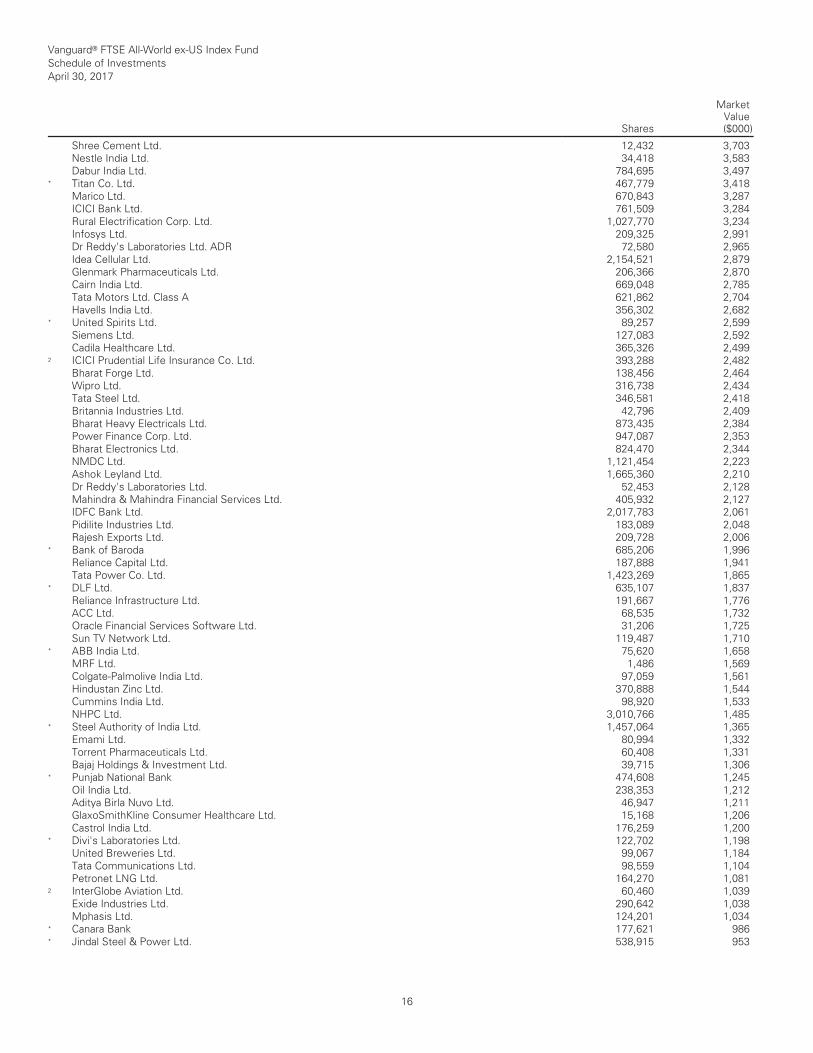
Vanguard® FTSE All-World ex-US Index Fund Schedule of Investments April 30, 2017
Shares
MarketValue($000)
__________________________________________________________________________________________________________________________________________________________________________________________________________________________________________________________________________________________________________________________________________________________________________________________________________________________________________________________________________________________________________________________________________________________________________________________________________________________________________________________________________________________ __________________________________________________________________________________________________________________________________________________________________________________________________________________________________________________________________________________________________________________________________________________________________________________________________________________________________________________________________________________________________________________________________________________________________________________________________________________________________________________________________________________________
Shree Cement Ltd. 12,432 3,703 Nestle India Ltd. 34,418 3,583 Dabur India Ltd. 784,695 3,497 * Titan Co. Ltd. 467,779 3,418 Marico Ltd. 670,843 3,287 ICICI Bank Ltd. 761,509 3,284 Rural Electrification Corp. Ltd. 1,027,770 3,234 Infosys Ltd. 209,325 2,991 Dr Reddy's Laboratories Ltd. ADR 72,580 2,965 Idea Cellular Ltd. 2,154,521 2,879 Glenmark Pharmaceuticals Ltd. 206,366 2,870 Cairn India Ltd. 669,048 2,785 Tata Motors Ltd. Class A 621,862 2,704 Havells India Ltd. 356,302 2,682 * United Spirits Ltd. 89,257 2,599 Siemens Ltd. 127,083 2,592 Cadila Healthcare Ltd. 365,326 2,499 2 ICICI Prudential Life Insurance Co. Ltd. 393,288 2,482 Bharat Forge Ltd. 138,456 2,464 Wipro Ltd. 316,738 2,434 Tata Steel Ltd. 346,581 2,418 Britannia Industries Ltd. 42,796 2,409 Bharat Heavy Electricals Ltd. 873,435 2,384 Power Finance Corp. Ltd. 947,087 2,353 Bharat Electronics Ltd. 824,470 2,344 NMDC Ltd. 1,121,454 2,223 Ashok Leyland Ltd. 1,665,360 2,210 Dr Reddy's Laboratories Ltd. 52,453 2,128 Mahindra & Mahindra Financial Services Ltd. 405,932 2,127 IDFC Bank Ltd. 2,017,783 2,061 Pidilite Industries Ltd. 183,089 2,048 Rajesh Exports Ltd. 209,728 2,006 * Bank of Baroda 685,206 1,996 Reliance Capital Ltd. 187,888 1,941 Tata Power Co. Ltd. 1,423,269 1,865 * DLF Ltd. 635,107 1,837 Reliance Infrastructure Ltd. 191,667 1,776 ACC Ltd. 68,535 1,732 Oracle Financial Services Software Ltd. 31,206 1,725 Sun TV Network Ltd. 119,487 1,710 * ABB India Ltd. 75,620 1,658 MRF Ltd. 1,486 1,569 Colgate-Palmolive India Ltd. 97,059 1,561 Hindustan Zinc Ltd. 370,888 1,544 Cummins India Ltd. 98,920 1,533 NHPC Ltd. 3,010,766 1,485 * Steel Authority of India Ltd. 1,457,064 1,365 Emami Ltd. 80,994 1,332 Torrent Pharmaceuticals Ltd. 60,408 1,331 Bajaj Holdings & Investment Ltd. 39,715 1,306 * Punjab National Bank 474,608 1,245 Oil India Ltd. 238,353 1,212 Aditya Birla Nuvo Ltd. 46,947 1,211 GlaxoSmithKline Consumer Healthcare Ltd. 15,168 1,206 Castrol India Ltd. 176,259 1,200 * Divi's Laboratories Ltd. 122,702 1,198 United Breweries Ltd. 99,067 1,184 Tata Communications Ltd. 98,559 1,104 Petronet LNG Ltd. 164,270 1,081 2 InterGlobe Aviation Ltd. 60,460 1,039 Exide Industries Ltd. 290,642 1,038 Mphasis Ltd. 124,201 1,034 * Canara Bank 177,621 986 * Jindal Steel & Power Ltd. 538,915 953
16
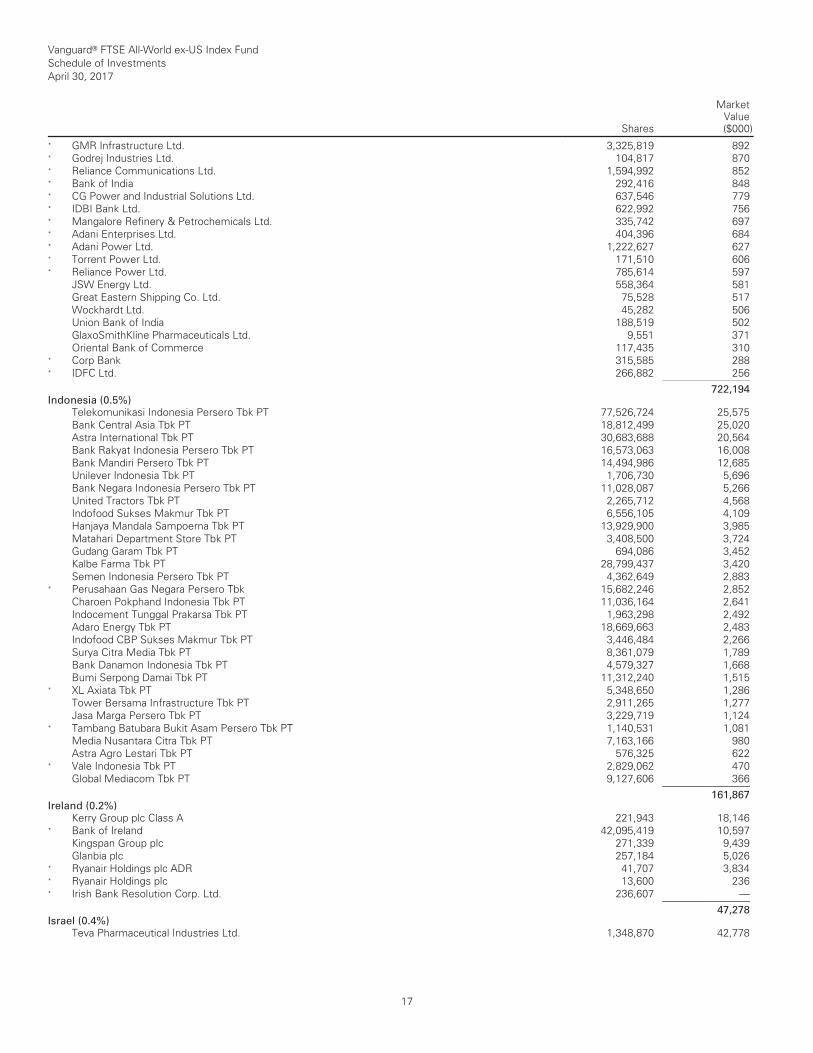
Vanguard® FTSE All-World ex-US Index Fund Schedule of Investments April 30, 2017
Shares
MarketValue($000)
__________________________________________________________________________________________________________________________________________________________________________________________________________________________________________________________________________________________________________________________________________________________________________________________________________________________________________________________________________________________________________________________________________________________________________________________________________________________________________________________________________________________ __________________________________________________________________________________________________________________________________________________________________________________________________________________________________________________________________________________________________________________________________________________________________________________________________________________________________________________________________________________________________________________________________________________________________________________________________________________________________________________________________________________________
* GMR Infrastructure Ltd. 3,325,819 892 * Godrej Industries Ltd. 104,817 870 * Reliance Communications Ltd. 1,594,992 852 * Bank of India 292,416 848 * CG Power and Industrial Solutions Ltd. 637,546 779 * IDBI Bank Ltd. 622,992 756 * Mangalore Refinery & Petrochemicals Ltd. 335,742 697 * Adani Enterprises Ltd. 404,396 684 * Adani Power Ltd. 1,222,627 627 * Torrent Power Ltd. 171,510 606 * Reliance Power Ltd. 785,614 597 JSW Energy Ltd. 558,364 581 Great Eastern Shipping Co. Ltd. 75,528 517 Wockhardt Ltd. 45,282 506 Union Bank of India 188,519 502 GlaxoSmithKline Pharmaceuticals Ltd. 9,551 371 Oriental Bank of Commerce 117,435 310 * Corp Bank 315,585 288 * IDFC Ltd. 266,882 256 ___________ 722,194 Indonesia (0.5%)
Telekomunikasi Indonesia Persero Tbk PT 77,526,724 25,575 Bank Central Asia Tbk PT 18,812,499 25,020 Astra International Tbk PT 30,683,688 20,564 Bank Rakyat Indonesia Persero Tbk PT 16,573,063 16,008 Bank Mandiri Persero Tbk PT 14,494,986 12,685 Unilever Indonesia Tbk PT 1,706,730 5,696 Bank Negara Indonesia Persero Tbk PT 11,028,087 5,266 United Tractors Tbk PT 2,265,712 4,568 Indofood Sukses Makmur Tbk PT 6,556,105 4,109 Hanjaya Mandala Sampoerna Tbk PT 13,929,900 3,985 Matahari Department Store Tbk PT 3,408,500 3,724 Gudang Garam Tbk PT 694,086 3,452 Kalbe Farma Tbk PT 28,799,437 3,420 Semen Indonesia Persero Tbk PT 4,362,649 2,883 * Perusahaan Gas Negara Persero Tbk 15,682,246 2,852 Charoen Pokphand Indonesia Tbk PT 11,036,164 2,641 Indocement Tunggal Prakarsa Tbk PT 1,963,298 2,492 Adaro Energy Tbk PT 18,669,663 2,483 Indofood CBP Sukses Makmur Tbk PT 3,446,484 2,266 Surya Citra Media Tbk PT 8,361,079 1,789 Bank Danamon Indonesia Tbk PT 4,579,327 1,668 Bumi Serpong Damai Tbk PT 11,312,240 1,515 * XL Axiata Tbk PT 5,348,650 1,286 Tower Bersama Infrastructure Tbk PT 2,911,265 1,277 Jasa Marga Persero Tbk PT 3,229,719 1,124 * Tambang Batubara Bukit Asam Persero Tbk PT 1,140,531 1,081 Media Nusantara Citra Tbk PT 7,163,166 980 Astra Agro Lestari Tbk PT 576,325 622 * Vale Indonesia Tbk PT 2,829,062 470 Global Mediacom Tbk PT 9,127,606 366 ___________ 161,867 Ireland (0.2%)
Kerry Group plc Class A 221,943 18,146 * Bank of Ireland 42,095,419 10,597 Kingspan Group plc 271,339 9,439 Glanbia plc 257,184 5,026 * Ryanair Holdings plc ADR 41,707 3,834 * Ryanair Holdings plc 13,600 236 * Irish Bank Resolution Corp. Ltd. 236,607 — ___________ 47,278 Israel (0.4%)
Teva Pharmaceutical Industries Ltd. 1,348,870 42,778
17
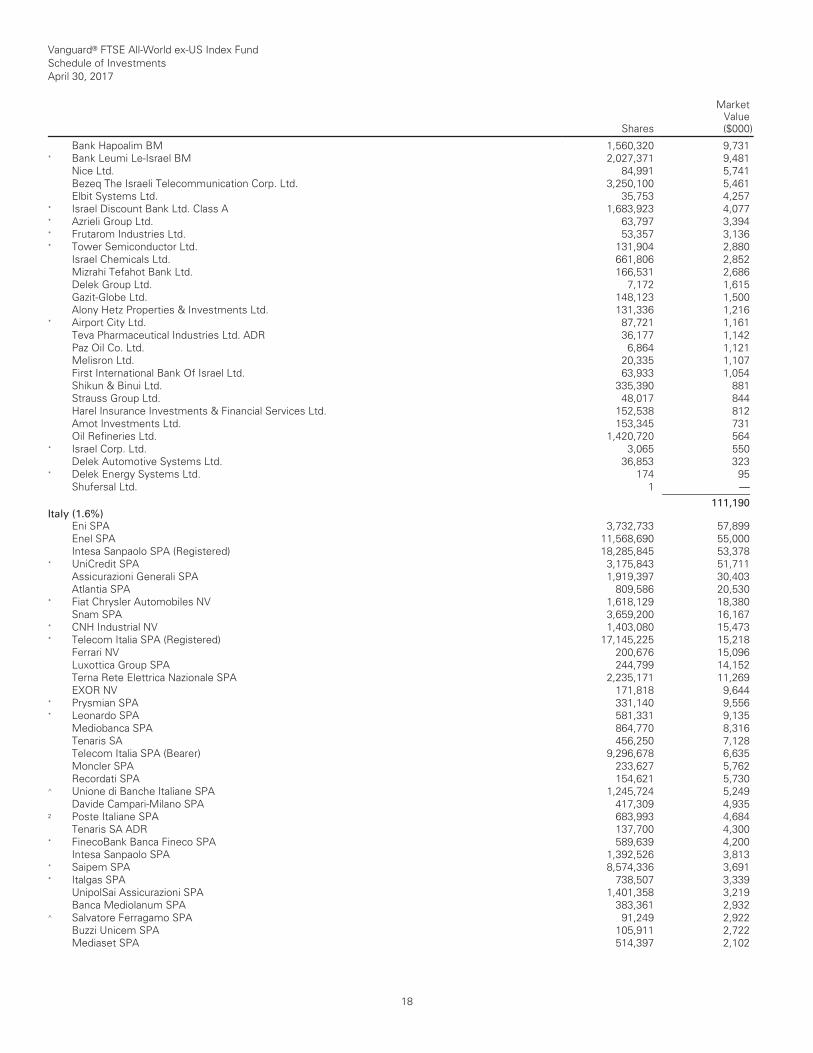
Vanguard® FTSE All-World ex-US Index Fund Schedule of Investments April 30, 2017
Shares
MarketValue($000)
__________________________________________________________________________________________________________________________________________________________________________________________________________________________________________________________________________________________________________________________________________________________________________________________________________________________________________________________________________________________________________________________________________________________________________________________________________________________________________________________________________________________ __________________________________________________________________________________________________________________________________________________________________________________________________________________________________________________________________________________________________________________________________________________________________________________________________________________________________________________________________________________________________________________________________________________________________________________________________________________________________________________________________________________________
Bank Hapoalim BM 1,560,320 9,731 * Bank Leumi Le-Israel BM 2,027,371 9,481 Nice Ltd. 84,991 5,741 Bezeq The Israeli Telecommunication Corp. Ltd. 3,250,100 5,461 Elbit Systems Ltd. 35,753 4,257 * Israel Discount Bank Ltd. Class A 1,683,923 4,077 * Azrieli Group Ltd. 63,797 3,394 * Frutarom Industries Ltd. 53,357 3,136 * Tower Semiconductor Ltd. 131,904 2,880 Israel Chemicals Ltd. 661,806 2,852 Mizrahi Tefahot Bank Ltd. 166,531 2,686 Delek Group Ltd. 7,172 1,615 Gazit-Globe Ltd. 148,123 1,500 Alony Hetz Properties & Investments Ltd. 131,336 1,216 * Airport City Ltd. 87,721 1,161 Teva Pharmaceutical Industries Ltd. ADR 36,177 1,142 Paz Oil Co. Ltd. 6,864 1,121 Melisron Ltd. 20,335 1,107 First International Bank Of Israel Ltd. 63,933 1,054 Shikun & Binui Ltd. 335,390 881 Strauss Group Ltd. 48,017 844 Harel Insurance Investments & Financial Services Ltd. 152,538 812 Amot Investments Ltd. 153,345 731 Oil Refineries Ltd. 1,420,720 564 * Israel Corp. Ltd. 3,065 550 Delek Automotive Systems Ltd. 36,853 323 * Delek Energy Systems Ltd. 174 95 Shufersal Ltd. 1 — ___________ 111,190 Italy (1.6%)
Eni SPA 3,732,733 57,899 Enel SPA 11,568,690 55,000 Intesa Sanpaolo SPA (Registered) 18,285,845 53,378 * UniCredit SPA 3,175,843 51,711 Assicurazioni Generali SPA 1,919,397 30,403 Atlantia SPA 809,586 20,530 * Fiat Chrysler Automobiles NV 1,618,129 18,380 Snam SPA 3,659,200 16,167 * CNH Industrial NV 1,403,080 15,473 * Telecom Italia SPA (Registered) 17,145,225 15,218 Ferrari NV 200,676 15,096 Luxottica Group SPA 244,799 14,152 Terna Rete Elettrica Nazionale SPA 2,235,171 11,269 EXOR NV 171,818 9,644 * Prysmian SPA 331,140 9,556 * Leonardo SPA 581,331 9,135 Mediobanca SPA 864,770 8,316 Tenaris SA 456,250 7,128 Telecom Italia SPA (Bearer) 9,296,678 6,635 Moncler SPA 233,627 5,762 Recordati SPA 154,621 5,730 ^ Unione di Banche Italiane SPA 1,245,724 5,249 Davide Campari-Milano SPA 417,309 4,935 2 Poste Italiane SPA 683,993 4,684 Tenaris SA ADR 137,700 4,300 * FinecoBank Banca Fineco SPA 589,639 4,200 Intesa Sanpaolo SPA 1,392,526 3,813 * Saipem SPA 8,574,336 3,691 * Italgas SPA 738,507 3,339 UnipolSai Assicurazioni SPA 1,401,358 3,219 Banca Mediolanum SPA 383,361 2,932 ^ Salvatore Ferragamo SPA 91,249 2,922 Buzzi Unicem SPA 105,911 2,722 Mediaset SPA 514,397 2,102
18
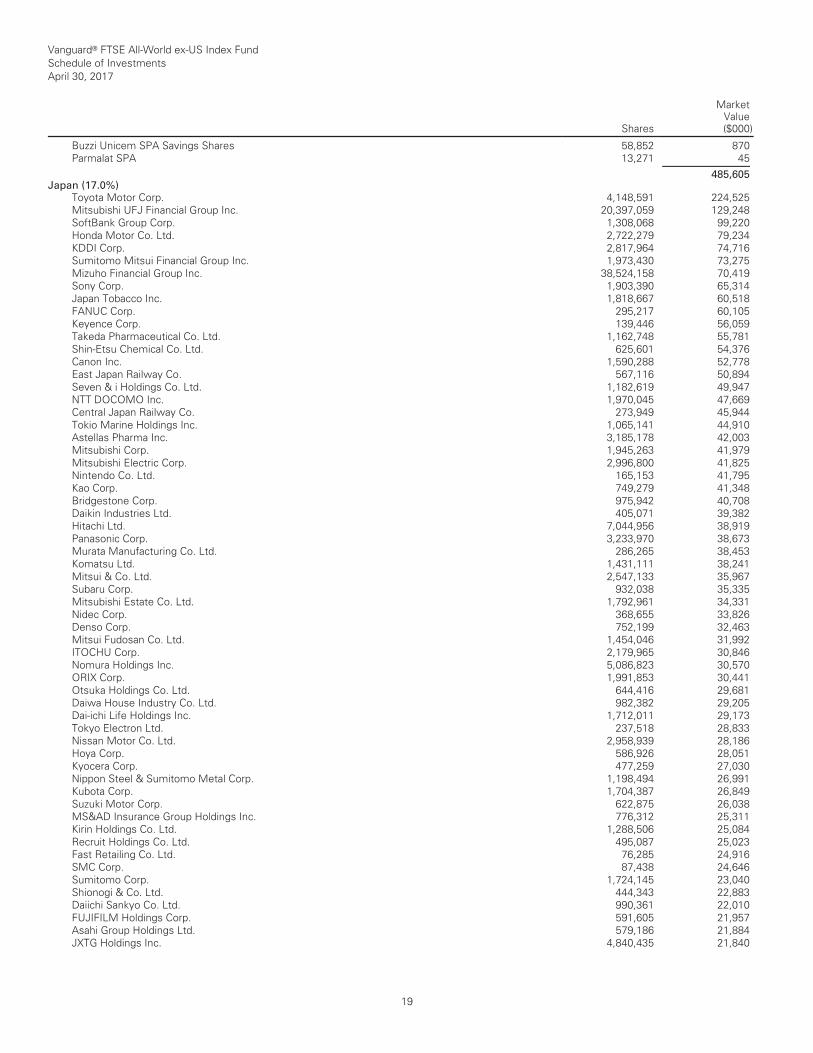
Vanguard® FTSE All-World ex-US Index Fund Schedule of Investments April 30, 2017
Shares
MarketValue($000)
__________________________________________________________________________________________________________________________________________________________________________________________________________________________________________________________________________________________________________________________________________________________________________________________________________________________________________________________________________________________________________________________________________________________________________________________________________________________________________________________________________________________ __________________________________________________________________________________________________________________________________________________________________________________________________________________________________________________________________________________________________________________________________________________________________________________________________________________________________________________________________________________________________________________________________________________________________________________________________________________________________________________________________________________________
Buzzi Unicem SPA Savings Shares 58,852 870 Parmalat SPA 13,271 45 ___________ 485,605 Japan (17.0%)
Toyota Motor Corp. 4,148,591 224,525 Mitsubishi UFJ Financial Group Inc. 20,397,059 129,248 SoftBank Group Corp. 1,308,068 99,220 Honda Motor Co. Ltd. 2,722,279 79,234 KDDI Corp. 2,817,964 74,716 Sumitomo Mitsui Financial Group Inc. 1,973,430 73,275 Mizuho Financial Group Inc. 38,524,158 70,419 Sony Corp. 1,903,390 65,314 Japan Tobacco Inc. 1,818,667 60,518 FANUC Corp. 295,217 60,105 Keyence Corp. 139,446 56,059 Takeda Pharmaceutical Co. Ltd. 1,162,748 55,781 Shin-Etsu Chemical Co. Ltd. 625,601 54,376 Canon Inc. 1,590,288 52,778 East Japan Railway Co. 567,116 50,894 Seven & i Holdings Co. Ltd. 1,182,619 49,947 NTT DOCOMO Inc. 1,970,045 47,669 Central Japan Railway Co. 273,949 45,944 Tokio Marine Holdings Inc. 1,065,141 44,910 Astellas Pharma Inc. 3,185,178 42,003 Mitsubishi Corp. 1,945,263 41,979 Mitsubishi Electric Corp. 2,996,800 41,825 Nintendo Co. Ltd. 165,153 41,795 Kao Corp. 749,279 41,348 Bridgestone Corp. 975,942 40,708 Daikin Industries Ltd. 405,071 39,382 Hitachi Ltd. 7,044,956 38,919 Panasonic Corp. 3,233,970 38,673 Murata Manufacturing Co. Ltd. 286,265 38,453 Komatsu Ltd. 1,431,111 38,241 Mitsui & Co. Ltd. 2,547,133 35,967 Subaru Corp. 932,038 35,335 Mitsubishi Estate Co. Ltd. 1,792,961 34,331 Nidec Corp. 368,655 33,826 Denso Corp. 752,199 32,463 Mitsui Fudosan Co. Ltd. 1,454,046 31,992 ITOCHU Corp. 2,179,965 30,846 Nomura Holdings Inc. 5,086,823 30,570 ORIX Corp. 1,991,853 30,441 Otsuka Holdings Co. Ltd. 644,416 29,681 Daiwa House Industry Co. Ltd. 982,382 29,205 Dai-ichi Life Holdings Inc. 1,712,011 29,173 Tokyo Electron Ltd. 237,518 28,833 Nissan Motor Co. Ltd. 2,958,939 28,186 Hoya Corp. 586,926 28,051 Kyocera Corp. 477,259 27,030 Nippon Steel & Sumitomo Metal Corp. 1,198,494 26,991 Kubota Corp. 1,704,387 26,849 Suzuki Motor Corp. 622,875 26,038 MS&AD Insurance Group Holdings Inc. 776,312 25,311 Kirin Holdings Co. Ltd. 1,288,506 25,084 Recruit Holdings Co. Ltd. 495,087 25,023 Fast Retailing Co. Ltd. 76,285 24,916 SMC Corp. 87,438 24,646 Sumitomo Corp. 1,724,145 23,040 Shionogi & Co. Ltd. 444,343 22,883 Daiichi Sankyo Co. Ltd. 990,361 22,010 FUJIFILM Holdings Corp. 591,605 21,957 Asahi Group Holdings Ltd. 579,186 21,884 JXTG Holdings Inc. 4,840,435 21,840
19
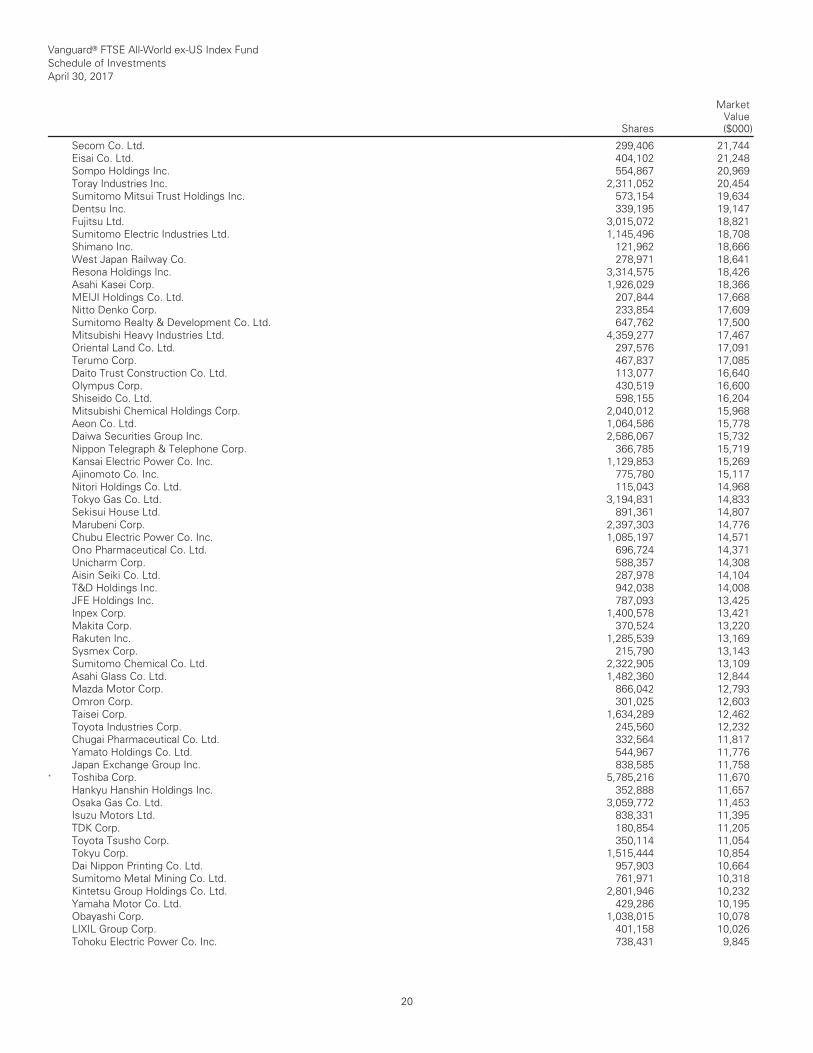
Vanguard® FTSE All-World ex-US Index Fund Schedule of Investments April 30, 2017
Shares
MarketValue($000)
__________________________________________________________________________________________________________________________________________________________________________________________________________________________________________________________________________________________________________________________________________________________________________________________________________________________________________________________________________________________________________________________________________________________________________________________________________________________________________________________________________________________ __________________________________________________________________________________________________________________________________________________________________________________________________________________________________________________________________________________________________________________________________________________________________________________________________________________________________________________________________________________________________________________________________________________________________________________________________________________________________________________________________________________________
Secom Co. Ltd. 299,406 21,744 Eisai Co. Ltd. 404,102 21,248 Sompo Holdings Inc. 554,867 20,969 Toray Industries Inc. 2,311,052 20,454 Sumitomo Mitsui Trust Holdings Inc. 573,154 19,634 Dentsu Inc. 339,195 19,147 Fujitsu Ltd. 3,015,072 18,821 Sumitomo Electric Industries Ltd. 1,145,496 18,708 Shimano Inc. 121,962 18,666 West Japan Railway Co. 278,971 18,641 Resona Holdings Inc. 3,314,575 18,426 Asahi Kasei Corp. 1,926,029 18,366 MEIJI Holdings Co. Ltd. 207,844 17,668 Nitto Denko Corp. 233,854 17,609 Sumitomo Realty & Development Co. Ltd. 647,762 17,500 Mitsubishi Heavy Industries Ltd. 4,359,277 17,467 Oriental Land Co. Ltd. 297,576 17,091 Terumo Corp. 467,837 17,085 Daito Trust Construction Co. Ltd. 113,077 16,640 Olympus Corp. 430,519 16,600 Shiseido Co. Ltd. 598,155 16,204 Mitsubishi Chemical Holdings Corp. 2,040,012 15,968 Aeon Co. Ltd. 1,064,586 15,778 Daiwa Securities Group Inc. 2,586,067 15,732 Nippon Telegraph & Telephone Corp. 366,785 15,719 Kansai Electric Power Co. Inc. 1,129,853 15,269 Ajinomoto Co. Inc. 775,780 15,117 Nitori Holdings Co. Ltd. 115,043 14,968 Tokyo Gas Co. Ltd. 3,194,831 14,833 Sekisui House Ltd. 891,361 14,807 Marubeni Corp. 2,397,303 14,776 Chubu Electric Power Co. Inc. 1,085,197 14,571 Ono Pharmaceutical Co. Ltd. 696,724 14,371 Unicharm Corp. 588,357 14,308 Aisin Seiki Co. Ltd. 287,978 14,104 T&D Holdings Inc. 942,038 14,008 JFE Holdings Inc. 787,093 13,425 Inpex Corp. 1,400,578 13,421 Makita Corp. 370,524 13,220 Rakuten Inc. 1,285,539 13,169 Sysmex Corp. 215,790 13,143 Sumitomo Chemical Co. Ltd. 2,322,905 13,109 Asahi Glass Co. Ltd. 1,482,360 12,844 Mazda Motor Corp. 866,042 12,793 Omron Corp. 301,025 12,603 Taisei Corp. 1,634,289 12,462 Toyota Industries Corp. 245,560 12,232 Chugai Pharmaceutical Co. Ltd. 332,564 11,817 Yamato Holdings Co. Ltd. 544,967 11,776 Japan Exchange Group Inc. 838,585 11,758 * Toshiba Corp. 5,785,216 11,670 Hankyu Hanshin Holdings Inc. 352,888 11,657 Osaka Gas Co. Ltd. 3,059,772 11,453 Isuzu Motors Ltd. 838,331 11,395 TDK Corp. 180,854 11,205 Toyota Tsusho Corp. 350,114 11,054 Tokyu Corp. 1,515,444 10,854 Dai Nippon Printing Co. Ltd. 957,903 10,664 Sumitomo Metal Mining Co. Ltd. 761,971 10,318 Kintetsu Group Holdings Co. Ltd. 2,801,946 10,232 Yamaha Motor Co. Ltd. 429,286 10,195 Obayashi Corp. 1,038,015 10,078 LIXIL Group Corp. 401,158 10,026 Tohoku Electric Power Co. Inc. 738,431 9,845
20
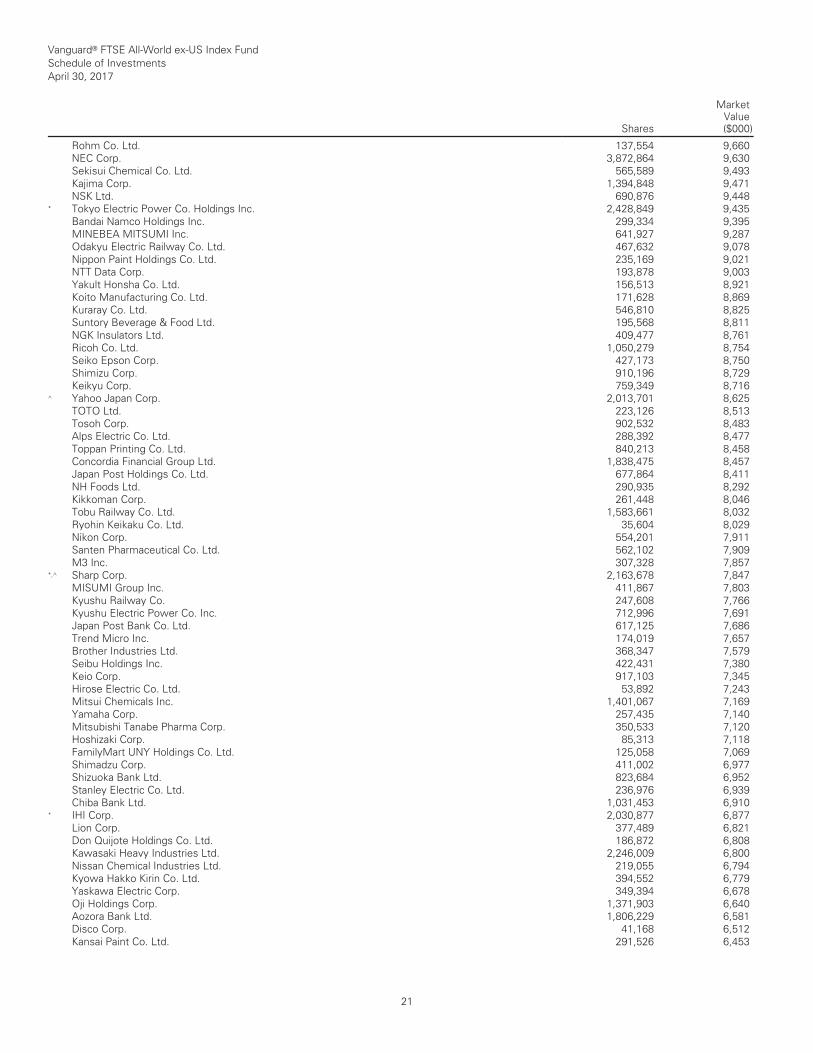
Vanguard® FTSE All-World ex-US Index Fund Schedule of Investments April 30, 2017
Shares
MarketValue($000)
__________________________________________________________________________________________________________________________________________________________________________________________________________________________________________________________________________________________________________________________________________________________________________________________________________________________________________________________________________________________________________________________________________________________________________________________________________________________________________________________________________________________ __________________________________________________________________________________________________________________________________________________________________________________________________________________________________________________________________________________________________________________________________________________________________________________________________________________________________________________________________________________________________________________________________________________________________________________________________________________________________________________________________________________________
Rohm Co. Ltd. 137,554 9,660 NEC Corp. 3,872,864 9,630 Sekisui Chemical Co. Ltd. 565,589 9,493 Kajima Corp. 1,394,848 9,471 NSK Ltd. 690,876 9,448 * Tokyo Electric Power Co. Holdings Inc. 2,428,849 9,435 Bandai Namco Holdings Inc. 299,334 9,395 MINEBEA MITSUMI Inc. 641,927 9,287 Odakyu Electric Railway Co. Ltd. 467,632 9,078 Nippon Paint Holdings Co. Ltd. 235,169 9,021 NTT Data Corp. 193,878 9,003 Yakult Honsha Co. Ltd. 156,513 8,921 Koito Manufacturing Co. Ltd. 171,628 8,869 Kuraray Co. Ltd. 546,810 8,825 Suntory Beverage & Food Ltd. 195,568 8,811 NGK Insulators Ltd. 409,477 8,761 Ricoh Co. Ltd. 1,050,279 8,754 Seiko Epson Corp. 427,173 8,750 Shimizu Corp. 910,196 8,729 Keikyu Corp. 759,349 8,716 ^ Yahoo Japan Corp. 2,013,701 8,625 TOTO Ltd. 223,126 8,513 Tosoh Corp. 902,532 8,483 Alps Electric Co. Ltd. 288,392 8,477 Toppan Printing Co. Ltd. 840,213 8,458 Concordia Financial Group Ltd. 1,838,475 8,457 Japan Post Holdings Co. Ltd. 677,864 8,411 NH Foods Ltd. 290,935 8,292 Kikkoman Corp. 261,448 8,046 Tobu Railway Co. Ltd. 1,583,661 8,032 Ryohin Keikaku Co. Ltd. 35,604 8,029 Nikon Corp. 554,201 7,911 Santen Pharmaceutical Co. Ltd. 562,102 7,909 M3 Inc. 307,328 7,857 *,^ Sharp Corp. 2,163,678 7,847 MISUMI Group Inc. 411,867 7,803 Kyushu Railway Co. 247,608 7,766 Kyushu Electric Power Co. Inc. 712,996 7,691 Japan Post Bank Co. Ltd. 617,125 7,686 Trend Micro Inc. 174,019 7,657 Brother Industries Ltd. 368,347 7,579 Seibu Holdings Inc. 422,431 7,380 Keio Corp. 917,103 7,345 Hirose Electric Co. Ltd. 53,892 7,243 Mitsui Chemicals Inc. 1,401,067 7,169 Yamaha Corp. 257,435 7,140 Mitsubishi Tanabe Pharma Corp. 350,533 7,120 Hoshizaki Corp. 85,313 7,118 FamilyMart UNY Holdings Co. Ltd. 125,058 7,069 Shimadzu Corp. 411,002 6,977 Shizuoka Bank Ltd. 823,684 6,952 Stanley Electric Co. Ltd. 236,976 6,939 Chiba Bank Ltd. 1,031,453 6,910 * IHI Corp. 2,030,877 6,877 Lion Corp. 377,489 6,821 Don Quijote Holdings Co. Ltd. 186,872 6,808 Kawasaki Heavy Industries Ltd. 2,246,009 6,800 Nissan Chemical Industries Ltd. 219,055 6,794 Kyowa Hakko Kirin Co. Ltd. 394,552 6,779 Yaskawa Electric Corp. 349,394 6,678 Oji Holdings Corp. 1,371,903 6,640 Aozora Bank Ltd. 1,806,229 6,581 Disco Corp. 41,168 6,512 Kansai Paint Co. Ltd. 291,526 6,453
21
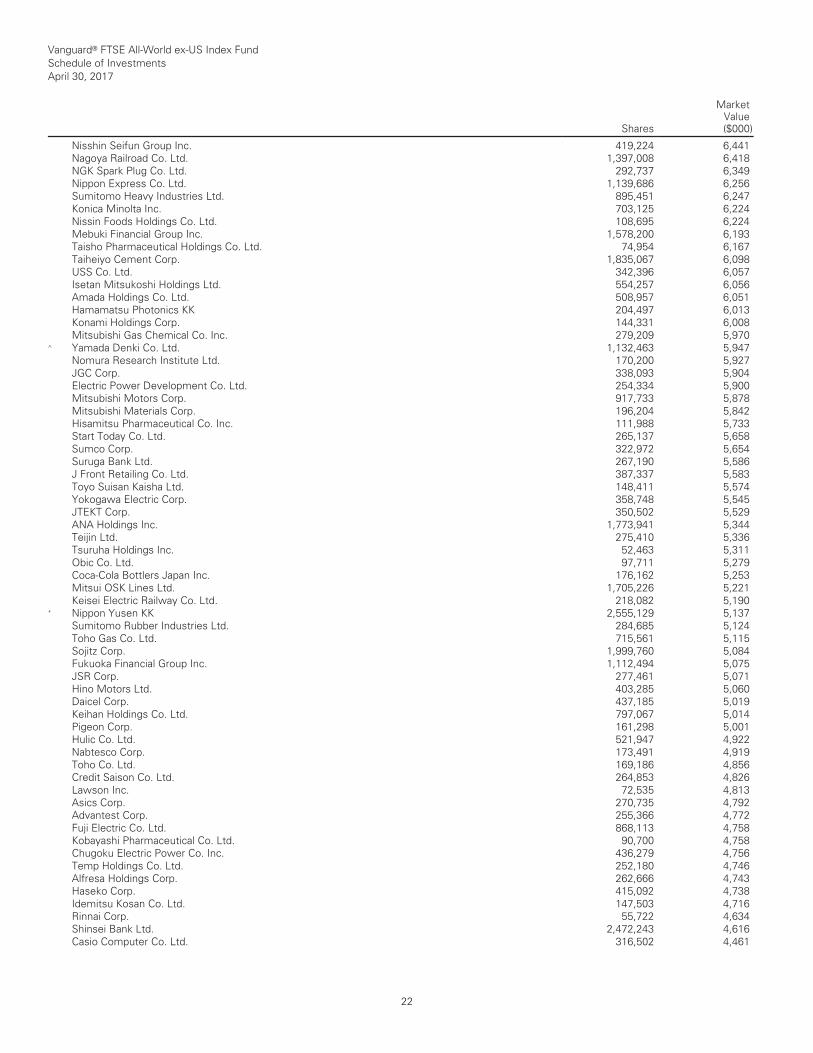
Vanguard® FTSE All-World ex-US Index Fund Schedule of Investments April 30, 2017
Shares
MarketValue($000)
__________________________________________________________________________________________________________________________________________________________________________________________________________________________________________________________________________________________________________________________________________________________________________________________________________________________________________________________________________________________________________________________________________________________________________________________________________________________________________________________________________________________ __________________________________________________________________________________________________________________________________________________________________________________________________________________________________________________________________________________________________________________________________________________________________________________________________________________________________________________________________________________________________________________________________________________________________________________________________________________________________________________________________________________________
Nisshin Seifun Group Inc. 419,224 6,441 Nagoya Railroad Co. Ltd. 1,397,008 6,418 NGK Spark Plug Co. Ltd. 292,737 6,349 Nippon Express Co. Ltd. 1,139,686 6,256 Sumitomo Heavy Industries Ltd. 895,451 6,247 Konica Minolta Inc. 703,125 6,224 Nissin Foods Holdings Co. Ltd. 108,695 6,224 Mebuki Financial Group Inc. 1,578,200 6,193 Taisho Pharmaceutical Holdings Co. Ltd. 74,954 6,167 Taiheiyo Cement Corp. 1,835,067 6,098 USS Co. Ltd. 342,396 6,057 Isetan Mitsukoshi Holdings Ltd. 554,257 6,056 Amada Holdings Co. Ltd. 508,957 6,051 Hamamatsu Photonics KK 204,497 6,013 Konami Holdings Corp. 144,331 6,008 Mitsubishi Gas Chemical Co. Inc. 279,209 5,970 ^ Yamada Denki Co. Ltd. 1,132,463 5,947 Nomura Research Institute Ltd. 170,200 5,927 JGC Corp. 338,093 5,904 Electric Power Development Co. Ltd. 254,334 5,900 Mitsubishi Motors Corp. 917,733 5,878 Mitsubishi Materials Corp. 196,204 5,842 Hisamitsu Pharmaceutical Co. Inc. 111,988 5,733 Start Today Co. Ltd. 265,137 5,658 Sumco Corp. 322,972 5,654 Suruga Bank Ltd. 267,190 5,586 J Front Retailing Co. Ltd. 387,337 5,583 Toyo Suisan Kaisha Ltd. 148,411 5,574 Yokogawa Electric Corp. 358,748 5,545 JTEKT Corp. 350,502 5,529 ANA Holdings Inc. 1,773,941 5,344 Teijin Ltd. 275,410 5,336 Tsuruha Holdings Inc. 52,463 5,311 Obic Co. Ltd. 97,711 5,279 Coca-Cola Bottlers Japan Inc. 176,162 5,253 Mitsui OSK Lines Ltd. 1,705,226 5,221 Keisei Electric Railway Co. Ltd. 218,082 5,190 * Nippon Yusen KK 2,555,129 5,137 Sumitomo Rubber Industries Ltd. 284,685 5,124 Toho Gas Co. Ltd. 715,561 5,115 Sojitz Corp. 1,999,760 5,084 Fukuoka Financial Group Inc. 1,112,494 5,075 JSR Corp. 277,461 5,071 Hino Motors Ltd. 403,285 5,060 Daicel Corp. 437,185 5,019 Keihan Holdings Co. Ltd. 797,067 5,014 Pigeon Corp. 161,298 5,001 Hulic Co. Ltd. 521,947 4,922 Nabtesco Corp. 173,491 4,919 Toho Co. Ltd. 169,186 4,856 Credit Saison Co. Ltd. 264,853 4,826 Lawson Inc. 72,535 4,813 Asics Corp. 270,735 4,792 Advantest Corp. 255,366 4,772 Fuji Electric Co. Ltd. 868,113 4,758 Kobayashi Pharmaceutical Co. Ltd. 90,700 4,758 Chugoku Electric Power Co. Inc. 436,279 4,756 Temp Holdings Co. Ltd. 252,180 4,746 Alfresa Holdings Corp. 262,666 4,743 Haseko Corp. 415,092 4,738 Idemitsu Kosan Co. Ltd. 147,503 4,716 Rinnai Corp. 55,722 4,634 Shinsei Bank Ltd. 2,472,243 4,616 Casio Computer Co. Ltd. 316,502 4,461
22

Vanguard® FTSE All-World ex-US Index Fund Schedule of Investments April 30, 2017
Shares
MarketValue($000)
__________________________________________________________________________________________________________________________________________________________________________________________________________________________________________________________________________________________________________________________________________________________________________________________________________________________________________________________________________________________________________________________________________________________________________________________________________________________________________________________________________________________ __________________________________________________________________________________________________________________________________________________________________________________________________________________________________________________________________________________________________________________________________________________________________________________________________________________________________________________________________________________________________________________________________________________________________________________________________________________________________________________________________________________________
Sohgo Security Services Co. Ltd. 101,289 4,422 Marui Group Co. Ltd. 321,458 4,402 Shimamura Co. Ltd. 32,075 4,390 Kurita Water Industries Ltd. 169,835 4,386 Air Water Inc. 227,518 4,382 Ebara Corp. 143,826 4,381 CyberAgent Inc. 140,340 4,360 Mabuchi Motor Co. Ltd. 76,908 4,341 Hakuhodo DY Holdings Inc. 356,143 4,341 Hitachi Chemical Co. Ltd. 151,549 4,340 THK Co. Ltd. 165,824 4,277 DIC Corp. 119,277 4,246 SCREEN Holdings Co. Ltd. 58,371 4,240 Sony Financial Holdings Inc. 253,388 4,215 Bank of Kyoto Ltd. 531,432 4,209 Tokyo Tatemono Co. Ltd. 307,816 4,205 Kewpie Corp. 164,369 4,182 Tokyu Fudosan Holdings Corp. 756,982 4,134 Nichirei Corp. 164,726 4,100 Kose Corp. 42,595 4,047 Hitachi Metals Ltd. 287,319 4,024 Otsuka Corp. 75,035 4,019 Suzuken Co. Ltd. 121,457 4,019 Nankai Electric Railway Co. Ltd. 814,704 4,007 Takashimaya Co. Ltd. 434,825 4,004 Sega Sammy Holdings Inc. 297,263 3,991 Ezaki Glico Co. Ltd. 75,723 3,990 Nippon Shinyaku Co. Ltd. 74,934 3,985 NOK Corp. 166,333 3,965 Yamazaki Baking Co. Ltd. 186,944 3,946 Hitachi Construction Machinery Co. Ltd. 152,532 3,932 Toyo Seikan Group Holdings Ltd. 233,565 3,917 MediPal Holdings Corp. 235,707 3,905 Calbee Inc. 111,452 3,897 Park24 Co. Ltd. 150,756 3,890 * Kobe Steel Ltd. 436,318 3,876 SBI Holdings Inc. 278,191 3,859 Nippon Electric Glass Co. Ltd. 615,929 3,820 Chugoku Bank Ltd. 256,363 3,809 Sumitomo Dainippon Pharma Co. Ltd. 231,489 3,802 Hiroshima Bank Ltd. 875,043 3,777 Hitachi High-Technologies Corp. 94,556 3,775 Showa Denko KK 193,675 3,699 Yamaguchi Financial Group Inc. 331,300 3,671 Furukawa Electric Co. Ltd. 89,826 3,636 Hachijuni Bank Ltd. 612,058 3,614 Ube Industries Ltd. 1,547,988 3,599 Kyushu Financial Group Inc. 576,130 3,592 Daifuku Co. Ltd. 139,649 3,530 *,^ PeptiDream Inc. 58,930 3,528 Miraca Holdings Inc. 75,716 3,491 Sundrug Co. Ltd. 99,396 3,486 Gunma Bank Ltd. 645,751 3,464 Nippon Kayaku Co. Ltd. 252,477 3,450 Mitsubishi UFJ Lease & Finance Co. Ltd. 658,991 3,444 Nexon Co. Ltd. 202,213 3,442 Kaneka Corp. 432,677 3,412 Horiba Ltd. 57,337 3,380 Iida Group Holdings Co. Ltd. 210,707 3,356 ^ AEON Financial Service Co. Ltd. 174,273 3,349 Square Enix Holdings Co. Ltd. 115,953 3,339 Denka Co. Ltd. 647,797 3,338 DeNA Co. Ltd. 154,607 3,314 Hikari Tsushin Inc. 34,223 3,287
23
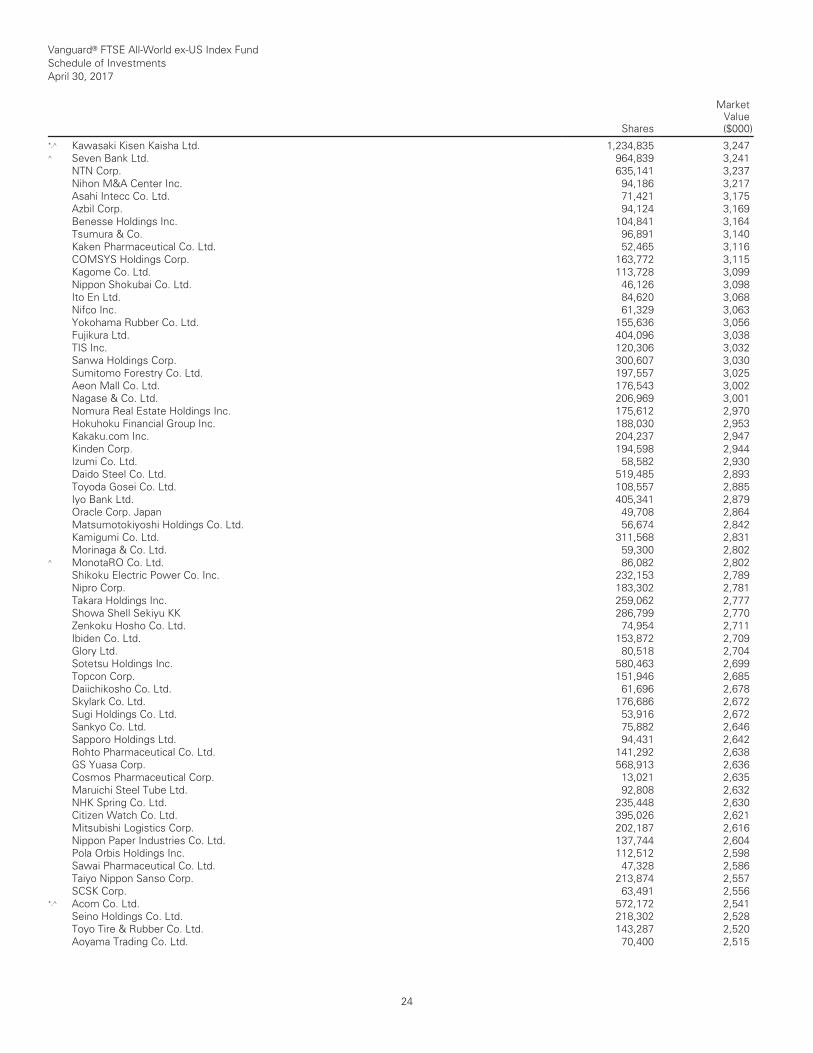
Vanguard® FTSE All-World ex-US Index Fund Schedule of Investments April 30, 2017
Shares
MarketValue($000)
__________________________________________________________________________________________________________________________________________________________________________________________________________________________________________________________________________________________________________________________________________________________________________________________________________________________________________________________________________________________________________________________________________________________________________________________________________________________________________________________________________________________ __________________________________________________________________________________________________________________________________________________________________________________________________________________________________________________________________________________________________________________________________________________________________________________________________________________________________________________________________________________________________________________________________________________________________________________________________________________________________________________________________________________________
*,^ Kawasaki Kisen Kaisha Ltd. 1,234,835 3,247 ^ Seven Bank Ltd. 964,839 3,241 NTN Corp. 635,141 3,237 Nihon M&A Center Inc. 94,186 3,217 Asahi Intecc Co. Ltd. 71,421 3,175 Azbil Corp. 94,124 3,169 Benesse Holdings Inc. 104,841 3,164 Tsumura & Co. 96,891 3,140 Kaken Pharmaceutical Co. Ltd. 52,465 3,116 COMSYS Holdings Corp. 163,772 3,115 Kagome Co. Ltd. 113,728 3,099 Nippon Shokubai Co. Ltd. 46,126 3,098 Ito En Ltd. 84,620 3,068 Nifco Inc. 61,329 3,063 Yokohama Rubber Co. Ltd. 155,636 3,056 Fujikura Ltd. 404,096 3,038 TIS Inc. 120,306 3,032 Sanwa Holdings Corp. 300,607 3,030 Sumitomo Forestry Co. Ltd. 197,557 3,025 Aeon Mall Co. Ltd. 176,543 3,002 Nagase & Co. Ltd. 206,969 3,001 Nomura Real Estate Holdings Inc. 175,612 2,970 Hokuhoku Financial Group Inc. 188,030 2,953 Kakaku.com Inc. 204,237 2,947 Kinden Corp. 194,598 2,944 Izumi Co. Ltd. 58,582 2,930 Daido Steel Co. Ltd. 519,485 2,893 Toyoda Gosei Co. Ltd. 108,557 2,885 Iyo Bank Ltd. 405,341 2,879 Oracle Corp. Japan 49,708 2,864 Matsumotokiyoshi Holdings Co. Ltd. 56,674 2,842 Kamigumi Co. Ltd. 311,568 2,831 Morinaga & Co. Ltd. 59,300 2,802 ^ MonotaRO Co. Ltd. 86,082 2,802 Shikoku Electric Power Co. Inc. 232,153 2,789 Nipro Corp. 183,302 2,781 Takara Holdings Inc. 259,062 2,777 Showa Shell Sekiyu KK 286,799 2,770 Zenkoku Hosho Co. Ltd. 74,954 2,711 Ibiden Co. Ltd. 153,872 2,709 Glory Ltd. 80,518 2,704 Sotetsu Holdings Inc. 580,463 2,699 Topcon Corp. 151,946 2,685 Daiichikosho Co. Ltd. 61,696 2,678 Skylark Co. Ltd. 176,686 2,672 Sugi Holdings Co. Ltd. 53,916 2,672 Sankyo Co. Ltd. 75,882 2,646 Sapporo Holdings Ltd. 94,431 2,642 Rohto Pharmaceutical Co. Ltd. 141,292 2,638 GS Yuasa Corp. 568,913 2,636 Cosmos Pharmaceutical Corp. 13,021 2,635 Maruichi Steel Tube Ltd. 92,808 2,632 NHK Spring Co. Ltd. 235,448 2,630 Citizen Watch Co. Ltd. 395,026 2,621 Mitsubishi Logistics Corp. 202,187 2,616 Nippon Paper Industries Co. Ltd. 137,744 2,604 Pola Orbis Holdings Inc. 112,512 2,598 Sawai Pharmaceutical Co. Ltd. 47,328 2,586 Taiyo Nippon Sanso Corp. 213,874 2,557 SCSK Corp. 63,491 2,556 *,^ Acom Co. Ltd. 572,172 2,541 Seino Holdings Co. Ltd. 218,302 2,528 Toyo Tire & Rubber Co. Ltd. 143,287 2,520 Aoyama Trading Co. Ltd. 70,400 2,515
24
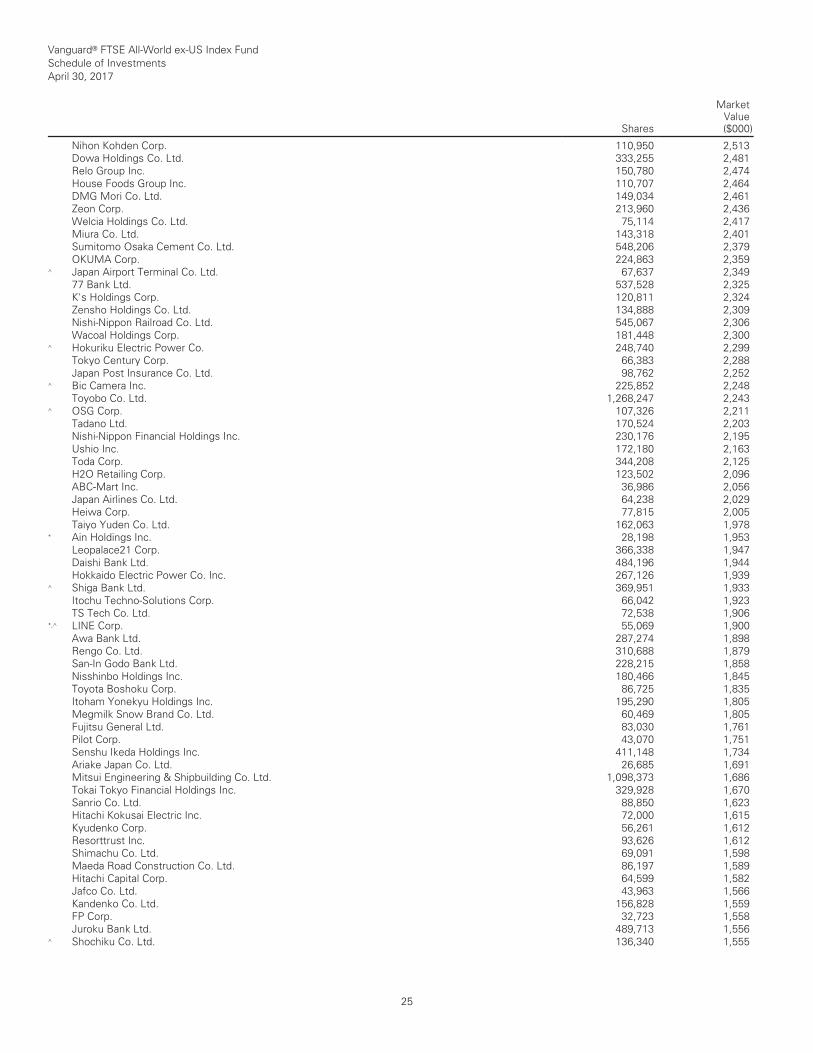
Vanguard® FTSE All-World ex-US Index Fund Schedule of Investments April 30, 2017
Shares
MarketValue($000)
__________________________________________________________________________________________________________________________________________________________________________________________________________________________________________________________________________________________________________________________________________________________________________________________________________________________________________________________________________________________________________________________________________________________________________________________________________________________________________________________________________________________ __________________________________________________________________________________________________________________________________________________________________________________________________________________________________________________________________________________________________________________________________________________________________________________________________________________________________________________________________________________________________________________________________________________________________________________________________________________________________________________________________________________________
Nihon Kohden Corp. 110,950 2,513 Dowa Holdings Co. Ltd. 333,255 2,481 Relo Group Inc. 150,780 2,474 House Foods Group Inc. 110,707 2,464 DMG Mori Co. Ltd. 149,034 2,461 Zeon Corp. 213,960 2,436 Welcia Holdings Co. Ltd. 75,114 2,417 Miura Co. Ltd. 143,318 2,401 Sumitomo Osaka Cement Co. Ltd. 548,206 2,379 OKUMA Corp. 224,863 2,359 ^ Japan Airport Terminal Co. Ltd. 67,637 2,349 77 Bank Ltd. 537,528 2,325 K's Holdings Corp. 120,811 2,324 Zensho Holdings Co. Ltd. 134,888 2,309 Nishi-Nippon Railroad Co. Ltd. 545,067 2,306 Wacoal Holdings Corp. 181,448 2,300 ^ Hokuriku Electric Power Co. 248,740 2,299 Tokyo Century Corp. 66,383 2,288 Japan Post Insurance Co. Ltd. 98,762 2,252 ^ Bic Camera Inc. 225,852 2,248 Toyobo Co. Ltd. 1,268,247 2,243 ^ OSG Corp. 107,326 2,211 Tadano Ltd. 170,524 2,203 Nishi-Nippon Financial Holdings Inc. 230,176 2,195 Ushio Inc. 172,180 2,163 Toda Corp. 344,208 2,125 H2O Retailing Corp. 123,502 2,096 ABC-Mart Inc. 36,986 2,056 Japan Airlines Co. Ltd. 64,238 2,029 Heiwa Corp. 77,815 2,005 Taiyo Yuden Co. Ltd. 162,063 1,978 * Ain Holdings Inc. 28,198 1,953 Leopalace21 Corp. 366,338 1,947 Daishi Bank Ltd. 484,196 1,944 Hokkaido Electric Power Co. Inc. 267,126 1,939 ^ Shiga Bank Ltd. 369,951 1,933 Itochu Techno-Solutions Corp. 66,042 1,923 TS Tech Co. Ltd. 72,538 1,906 *,^ LINE Corp. 55,069 1,900 Awa Bank Ltd. 287,274 1,898 Rengo Co. Ltd. 310,688 1,879 San-In Godo Bank Ltd. 228,215 1,858 Nisshinbo Holdings Inc. 180,466 1,845 Toyota Boshoku Corp. 86,725 1,835 Itoham Yonekyu Holdings Inc. 195,290 1,805 Megmilk Snow Brand Co. Ltd. 60,469 1,805 Fujitsu General Ltd. 83,030 1,761 Pilot Corp. 43,070 1,751 Senshu Ikeda Holdings Inc. 411,148 1,734 Ariake Japan Co. Ltd. 26,685 1,691 Mitsui Engineering & Shipbuilding Co. Ltd. 1,098,373 1,686 Tokai Tokyo Financial Holdings Inc. 329,928 1,670 Sanrio Co. Ltd. 88,850 1,623 Hitachi Kokusai Electric Inc. 72,000 1,615 Kyudenko Corp. 56,261 1,612 Resorttrust Inc. 93,626 1,612 Shimachu Co. Ltd. 69,091 1,598 Maeda Road Construction Co. Ltd. 86,197 1,589 Hitachi Capital Corp. 64,599 1,582 Jafco Co. Ltd. 43,963 1,566 Kandenko Co. Ltd. 156,828 1,559 FP Corp. 32,723 1,558 Juroku Bank Ltd. 489,713 1,556 ^ Shochiku Co. Ltd. 136,340 1,555
25
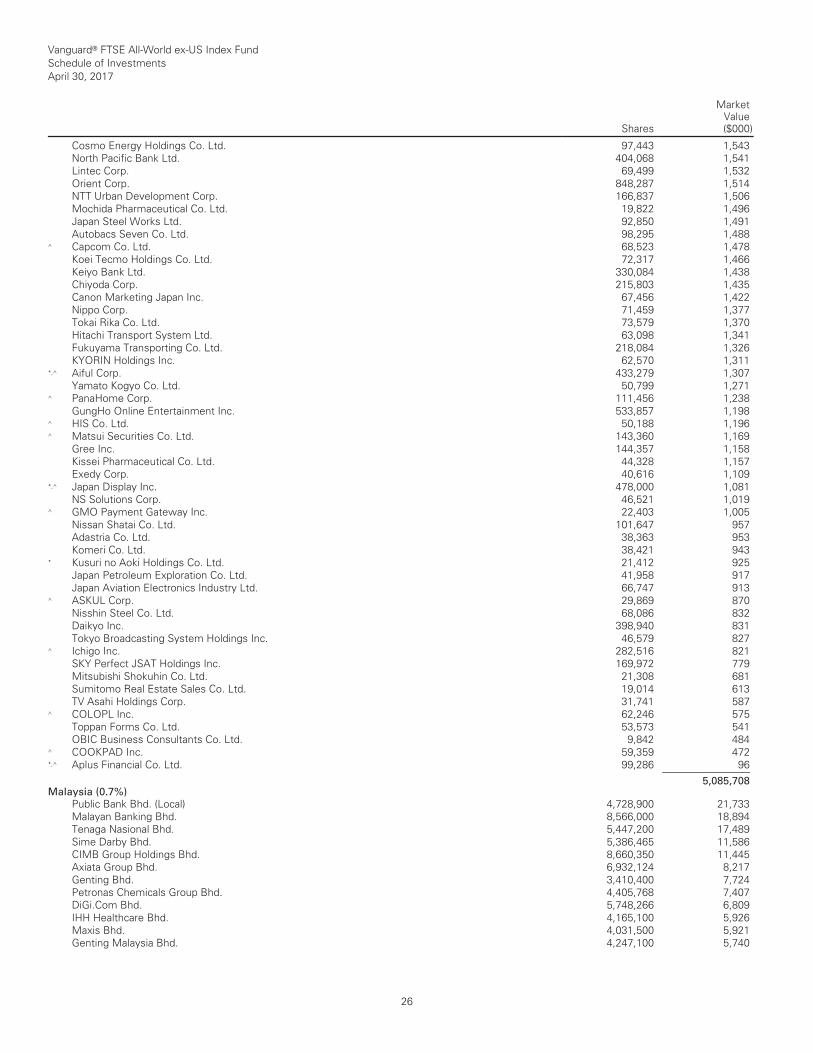
Vanguard® FTSE All-World ex-US Index Fund Schedule of Investments April 30, 2017
Shares
MarketValue($000)
__________________________________________________________________________________________________________________________________________________________________________________________________________________________________________________________________________________________________________________________________________________________________________________________________________________________________________________________________________________________________________________________________________________________________________________________________________________________________________________________________________________________ __________________________________________________________________________________________________________________________________________________________________________________________________________________________________________________________________________________________________________________________________________________________________________________________________________________________________________________________________________________________________________________________________________________________________________________________________________________________________________________________________________________________
Cosmo Energy Holdings Co. Ltd. 97,443 1,543 North Pacific Bank Ltd. 404,068 1,541 Lintec Corp. 69,499 1,532 Orient Corp. 848,287 1,514 NTT Urban Development Corp. 166,837 1,506 Mochida Pharmaceutical Co. Ltd. 19,822 1,496 Japan Steel Works Ltd. 92,850 1,491 Autobacs Seven Co. Ltd. 98,295 1,488 ^ Capcom Co. Ltd. 68,523 1,478 Koei Tecmo Holdings Co. Ltd. 72,317 1,466 Keiyo Bank Ltd. 330,084 1,438 Chiyoda Corp. 215,803 1,435 Canon Marketing Japan Inc. 67,456 1,422 Nippo Corp. 71,459 1,377 Tokai Rika Co. Ltd. 73,579 1,370 Hitachi Transport System Ltd. 63,098 1,341 Fukuyama Transporting Co. Ltd. 218,084 1,326 KYORIN Holdings Inc. 62,570 1,311 *,^ Aiful Corp. 433,279 1,307 Yamato Kogyo Co. Ltd. 50,799 1,271 ^ PanaHome Corp. 111,456 1,238 GungHo Online Entertainment Inc. 533,857 1,198 ^ HIS Co. Ltd. 50,188 1,196 ^ Matsui Securities Co. Ltd. 143,360 1,169 Gree Inc. 144,357 1,158 Kissei Pharmaceutical Co. Ltd. 44,328 1,157 Exedy Corp. 40,616 1,109 *,^ Japan Display Inc. 478,000 1,081 NS Solutions Corp. 46,521 1,019 ^ GMO Payment Gateway Inc. 22,403 1,005 Nissan Shatai Co. Ltd. 101,647 957 Adastria Co. Ltd. 38,363 953 Komeri Co. Ltd. 38,421 943 * Kusuri no Aoki Holdings Co. Ltd. 21,412 925 Japan Petroleum Exploration Co. Ltd. 41,958 917 Japan Aviation Electronics Industry Ltd. 66,747 913 ^ ASKUL Corp. 29,869 870 Nisshin Steel Co. Ltd. 68,086 832 Daikyo Inc. 398,940 831 Tokyo Broadcasting System Holdings Inc. 46,579 827 ^ Ichigo Inc. 282,516 821 SKY Perfect JSAT Holdings Inc. 169,972 779 Mitsubishi Shokuhin Co. Ltd. 21,308 681 Sumitomo Real Estate Sales Co. Ltd. 19,014 613 TV Asahi Holdings Corp. 31,741 587 ^ COLOPL Inc. 62,246 575 Toppan Forms Co. Ltd. 53,573 541 OBIC Business Consultants Co. Ltd. 9,842 484 ^ COOKPAD Inc. 59,359 472 *,^ Aplus Financial Co. Ltd. 99,286 96 ___________ 5,085,708 Malaysia (0.7%)
Public Bank Bhd. (Local) 4,728,900 21,733 Malayan Banking Bhd. 8,566,000 18,894 Tenaga Nasional Bhd. 5,447,200 17,489 Sime Darby Bhd. 5,386,465 11,586 CIMB Group Holdings Bhd. 8,660,350 11,445 Axiata Group Bhd. 6,932,124 8,217 Genting Bhd. 3,410,400 7,724 Petronas Chemicals Group Bhd. 4,405,768 7,407 DiGi.Com Bhd. 5,748,266 6,809 IHH Healthcare Bhd. 4,165,100 5,926 Maxis Bhd. 4,031,500 5,921 Genting Malaysia Bhd. 4,247,100 5,740
26
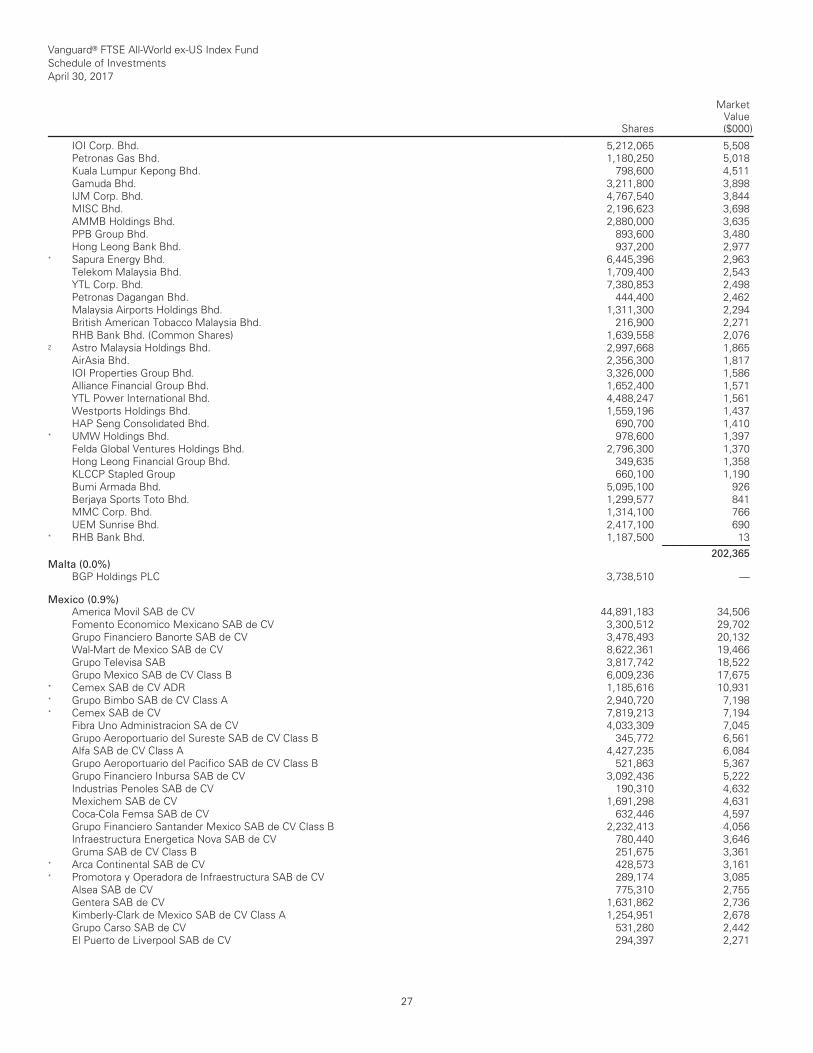
Vanguard® FTSE All-World ex-US Index Fund Schedule of Investments April 30, 2017
Shares
MarketValue($000)
__________________________________________________________________________________________________________________________________________________________________________________________________________________________________________________________________________________________________________________________________________________________________________________________________________________________________________________________________________________________________________________________________________________________________________________________________________________________________________________________________________________________ __________________________________________________________________________________________________________________________________________________________________________________________________________________________________________________________________________________________________________________________________________________________________________________________________________________________________________________________________________________________________________________________________________________________________________________________________________________________________________________________________________________________
IOI Corp. Bhd. 5,212,065 5,508 Petronas Gas Bhd. 1,180,250 5,018 Kuala Lumpur Kepong Bhd. 798,600 4,511 Gamuda Bhd. 3,211,800 3,898 IJM Corp. Bhd. 4,767,540 3,844 MISC Bhd. 2,196,623 3,698 AMMB Holdings Bhd. 2,880,000 3,635 PPB Group Bhd. 893,600 3,480 Hong Leong Bank Bhd. 937,200 2,977 * Sapura Energy Bhd. 6,445,396 2,963 Telekom Malaysia Bhd. 1,709,400 2,543 YTL Corp. Bhd. 7,380,853 2,498 Petronas Dagangan Bhd. 444,400 2,462 Malaysia Airports Holdings Bhd. 1,311,300 2,294 British American Tobacco Malaysia Bhd. 216,900 2,271 RHB Bank Bhd. (Common Shares) 1,639,558 2,076 2 Astro Malaysia Holdings Bhd. 2,997,668 1,865 AirAsia Bhd. 2,356,300 1,817 IOI Properties Group Bhd. 3,326,000 1,586 Alliance Financial Group Bhd. 1,652,400 1,571 YTL Power International Bhd. 4,488,247 1,561 Westports Holdings Bhd. 1,559,196 1,437 HAP Seng Consolidated Bhd. 690,700 1,410 * UMW Holdings Bhd. 978,600 1,397 Felda Global Ventures Holdings Bhd. 2,796,300 1,370 Hong Leong Financial Group Bhd. 349,635 1,358 KLCCP Stapled Group 660,100 1,190 Bumi Armada Bhd. 5,095,100 926 Berjaya Sports Toto Bhd. 1,299,577 841 MMC Corp. Bhd. 1,314,100 766 UEM Sunrise Bhd. 2,417,100 690 * RHB Bank Bhd. 1,187,500 13 ___________ 202,365 Malta (0.0%)
BGP Holdings PLC 3,738,510 — Mexico (0.9%)
America Movil SAB de CV 44,891,183 34,506 Fomento Economico Mexicano SAB de CV 3,300,512 29,702 Grupo Financiero Banorte SAB de CV 3,478,493 20,132 Wal-Mart de Mexico SAB de CV 8,622,361 19,466 Grupo Televisa SAB 3,817,742 18,522 Grupo Mexico SAB de CV Class B 6,009,236 17,675 * Cemex SAB de CV ADR 1,185,616 10,931 * Grupo Bimbo SAB de CV Class A 2,940,720 7,198 * Cemex SAB de CV 7,819,213 7,194 Fibra Uno Administracion SA de CV 4,033,309 7,045 Grupo Aeroportuario del Sureste SAB de CV Class B 345,772 6,561 Alfa SAB de CV Class A 4,427,235 6,084 Grupo Aeroportuario del Pacifico SAB de CV Class B 521,863 5,367 Grupo Financiero Inbursa SAB de CV 3,092,436 5,222 Industrias Penoles SAB de CV 190,310 4,632 Mexichem SAB de CV 1,691,298 4,631 Coca-Cola Femsa SAB de CV 632,446 4,597 Grupo Financiero Santander Mexico SAB de CV Class B 2,232,413 4,056 Infraestructura Energetica Nova SAB de CV 780,440 3,646 Gruma SAB de CV Class B 251,675 3,361 * Arca Continental SAB de CV 428,573 3,161 * Promotora y Operadora de Infraestructura SAB de CV 289,174 3,085 Alsea SAB de CV 775,310 2,755 Gentera SAB de CV 1,631,862 2,736 Kimberly-Clark de Mexico SAB de CV Class A 1,254,951 2,678 Grupo Carso SAB de CV 531,280 2,442 El Puerto de Liverpool SAB de CV 294,397 2,271
27
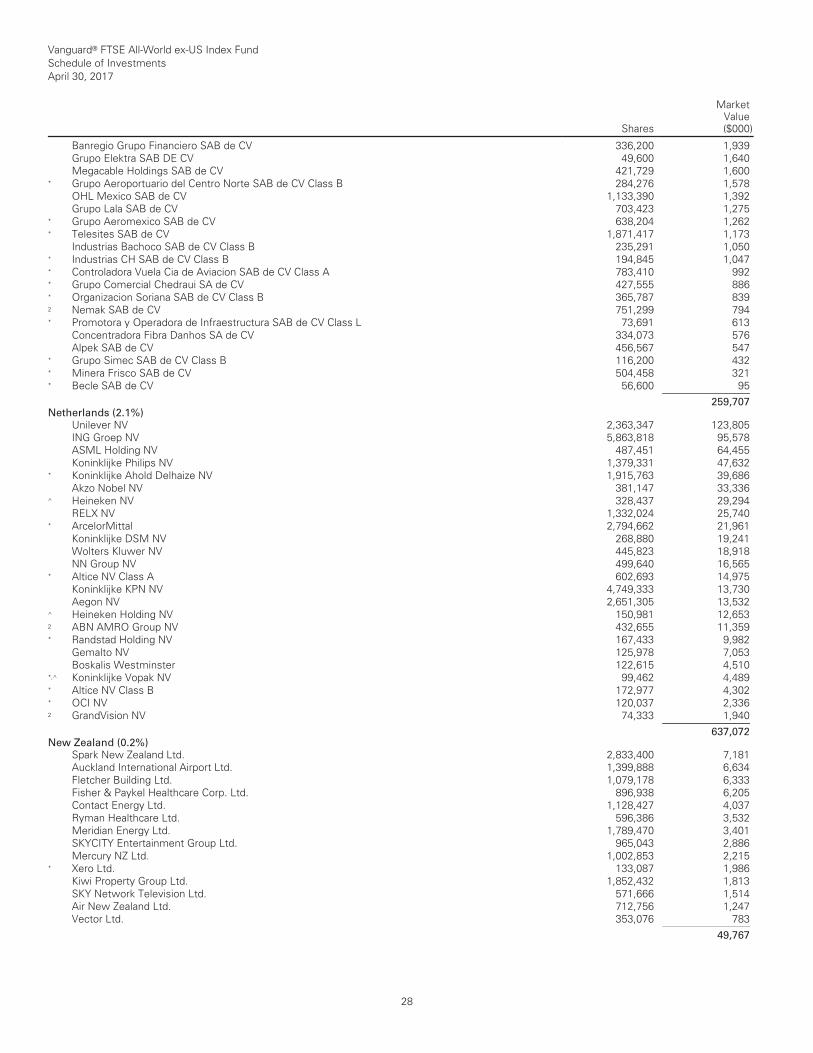
Vanguard® FTSE All-World ex-US Index Fund Schedule of Investments April 30, 2017
Shares
MarketValue($000)
__________________________________________________________________________________________________________________________________________________________________________________________________________________________________________________________________________________________________________________________________________________________________________________________________________________________________________________________________________________________________________________________________________________________________________________________________________________________________________________________________________________________ __________________________________________________________________________________________________________________________________________________________________________________________________________________________________________________________________________________________________________________________________________________________________________________________________________________________________________________________________________________________________________________________________________________________________________________________________________________________________________________________________________________________
Banregio Grupo Financiero SAB de CV 336,200 1,939 Grupo Elektra SAB DE CV 49,600 1,640 Megacable Holdings SAB de CV 421,729 1,600 * Grupo Aeroportuario del Centro Norte SAB de CV Class B 284,276 1,578 OHL Mexico SAB de CV 1,133,390 1,392 Grupo Lala SAB de CV 703,423 1,275 * Grupo Aeromexico SAB de CV 638,204 1,262 * Telesites SAB de CV 1,871,417 1,173 Industrias Bachoco SAB de CV Class B 235,291 1,050 * Industrias CH SAB de CV Class B 194,845 1,047 * Controladora Vuela Cia de Aviacion SAB de CV Class A 783,410 992 * Grupo Comercial Chedraui SA de CV 427,555 886 * Organizacion Soriana SAB de CV Class B 365,787 839 2 Nemak SAB de CV 751,299 794 * Promotora y Operadora de Infraestructura SAB de CV Class L 73,691 613 Concentradora Fibra Danhos SA de CV 334,073 576 Alpek SAB de CV 456,567 547 * Grupo Simec SAB de CV Class B 116,200 432 * Minera Frisco SAB de CV 504,458 321 * Becle SAB de CV 56,600 95 ___________ 259,707 Netherlands (2.1%)
Unilever NV 2,363,347 123,805 ING Groep NV 5,863,818 95,578 ASML Holding NV 487,451 64,455 Koninklijke Philips NV 1,379,331 47,632 * Koninklijke Ahold Delhaize NV 1,915,763 39,686 Akzo Nobel NV 381,147 33,336 ^ Heineken NV 328,437 29,294 RELX NV 1,332,024 25,740 * ArcelorMittal 2,794,662 21,961 Koninklijke DSM NV 268,880 19,241 Wolters Kluwer NV 445,823 18,918 NN Group NV 499,640 16,565 * Altice NV Class A 602,693 14,975 Koninklijke KPN NV 4,749,333 13,730 Aegon NV 2,651,305 13,532 ^ Heineken Holding NV 150,981 12,653 2 ABN AMRO Group NV 432,655 11,359 * Randstad Holding NV 167,433 9,982 Gemalto NV 125,978 7,053 Boskalis Westminster 122,615 4,510 *,^ Koninklijke Vopak NV 99,462 4,489 * Altice NV Class B 172,977 4,302 * OCI NV 120,037 2,336 2 GrandVision NV 74,333 1,940 ___________ 637,072 New Zealand (0.2%)
Spark New Zealand Ltd. 2,833,400 7,181 Auckland International Airport Ltd. 1,399,888 6,634 Fletcher Building Ltd. 1,079,178 6,333 Fisher & Paykel Healthcare Corp. Ltd. 896,938 6,205 Contact Energy Ltd. 1,128,427 4,037 Ryman Healthcare Ltd. 596,386 3,532 Meridian Energy Ltd. 1,789,470 3,401 SKYCITY Entertainment Group Ltd. 965,043 2,886 Mercury NZ Ltd. 1,002,853 2,215 * Xero Ltd. 133,087 1,986 Kiwi Property Group Ltd. 1,852,432 1,813 SKY Network Television Ltd. 571,666 1,514 Air New Zealand Ltd. 712,756 1,247 Vector Ltd. 353,076 783 ___________ 49,767
28
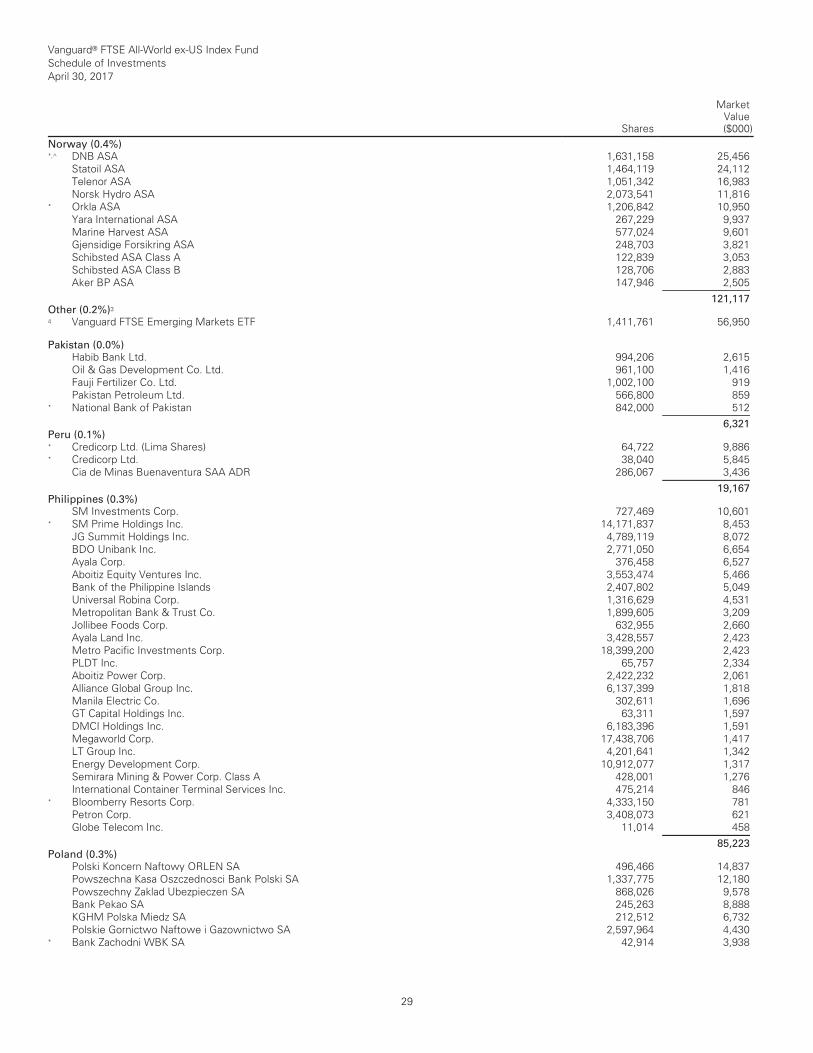
Vanguard® FTSE All-World ex-US Index Fund Schedule of Investments April 30, 2017
Shares
MarketValue($000)
__________________________________________________________________________________________________________________________________________________________________________________________________________________________________________________________________________________________________________________________________________________________________________________________________________________________________________________________________________________________________________________________________________________________________________________________________________________________________________________________________________________________ __________________________________________________________________________________________________________________________________________________________________________________________________________________________________________________________________________________________________________________________________________________________________________________________________________________________________________________________________________________________________________________________________________________________________________________________________________________________________________________________________________________________
Norway (0.4%)
*,^ DNB ASA 1,631,158 25,456 Statoil ASA 1,464,119 24,112 Telenor ASA 1,051,342 16,983 Norsk Hydro ASA 2,073,541 11,816 * Orkla ASA 1,206,842 10,950 Yara International ASA 267,229 9,937 Marine Harvest ASA 577,024 9,601 Gjensidige Forsikring ASA 248,703 3,821 Schibsted ASA Class A 122,839 3,053 Schibsted ASA Class B 128,706 2,883 Aker BP ASA 147,946 2,505 ___________ 121,117 Other (0.2%)3
4 Vanguard FTSE Emerging Markets ETF 1,411,761 56,950 Pakistan (0.0%)
Habib Bank Ltd. 994,206 2,615 Oil & Gas Development Co. Ltd. 961,100 1,416 Fauji Fertilizer Co. Ltd. 1,002,100 919 Pakistan Petroleum Ltd. 566,800 859 * National Bank of Pakistan 842,000 512 ___________ 6,321 Peru (0.1%)
* Credicorp Ltd. (Lima Shares) 64,722 9,886 * Credicorp Ltd. 38,040 5,845 Cia de Minas Buenaventura SAA ADR 286,067 3,436 ___________ 19,167 Philippines (0.3%)
SM Investments Corp. 727,469 10,601 * SM Prime Holdings Inc. 14,171,837 8,453 JG Summit Holdings Inc. 4,789,119 8,072 BDO Unibank Inc. 2,771,050 6,654 Ayala Corp. 376,458 6,527 Aboitiz Equity Ventures Inc. 3,553,474 5,466 Bank of the Philippine Islands 2,407,802 5,049 Universal Robina Corp. 1,316,629 4,531 Metropolitan Bank & Trust Co. 1,899,605 3,209 Jollibee Foods Corp. 632,955 2,660 Ayala Land Inc. 3,428,557 2,423 Metro Pacific Investments Corp. 18,399,200 2,423 PLDT Inc. 65,757 2,334 Aboitiz Power Corp. 2,422,232 2,061 Alliance Global Group Inc. 6,137,399 1,818 Manila Electric Co. 302,611 1,696 GT Capital Holdings Inc. 63,311 1,597 DMCI Holdings Inc. 6,183,396 1,591 Megaworld Corp. 17,438,706 1,417 LT Group Inc. 4,201,641 1,342 Energy Development Corp. 10,912,077 1,317 Semirara Mining & Power Corp. Class A 428,001 1,276 International Container Terminal Services Inc. 475,214 846 * Bloomberry Resorts Corp. 4,333,150 781 Petron Corp. 3,408,073 621 Globe Telecom Inc. 11,014 458 ___________ 85,223 Poland (0.3%)
Polski Koncern Naftowy ORLEN SA 496,466 14,837 Powszechna Kasa Oszczednosci Bank Polski SA 1,337,775 12,180 Powszechny Zaklad Ubezpieczen SA 868,026 9,578 Bank Pekao SA 245,263 8,888 KGHM Polska Miedz SA 212,512 6,732 Polskie Gornictwo Naftowe i Gazownictwo SA 2,597,964 4,430 * Bank Zachodni WBK SA 42,914 3,938
29

Vanguard® FTSE All-World ex-US Index Fund Schedule of Investments April 30, 2017
Shares
MarketValue($000)
__________________________________________________________________________________________________________________________________________________________________________________________________________________________________________________________________________________________________________________________________________________________________________________________________________________________________________________________________________________________________________________________________________________________________________________________________________________________________________________________________________________________ __________________________________________________________________________________________________________________________________________________________________________________________________________________________________________________________________________________________________________________________________________________________________________________________________________________________________________________________________________________________________________________________________________________________________________________________________________________________________________________________________________________________
LPP SA 1,891 3,383 PGE Polska Grupa Energetyczna SA 1,087,423 3,230 *,^ Alior Bank SA 123,926 2,383 * Grupa Lotos SA 137,844 2,147 * mBank SA 18,903 2,110 CCC SA 31,300 1,810 Asseco Poland SA 111,395 1,567 * Bank Millennium SA 872,749 1,557 *,^ Jastrzebska Spolka Weglowa SA 75,434 1,523 * Cyfrowy Polsat SA 226,982 1,420 * Tauron Polska Energia SA 1,484,163 1,259 Orange Polska SA 947,487 1,130 Grupa Azoty SA 63,988 1,128 Budimex SA 15,278 1,083 ^ Synthos SA 773,710 1,075 *,^ Enea SA 315,732 970 Eurocash SA 105,159 933 Bank Handlowy w Warszawie SA 48,064 928 Ciech SA 33,968 679 ___________ 90,898 Portugal (0.1%)
Galp Energia SGPS SA 796,161 12,373 EDP - Energias de Portugal SA 3,504,678 11,566 Jeronimo Martins SGPS SA 384,912 7,063 EDP Renovaveis SA 286,411 2,183 * Banco Espirito Santo SA 3,873,216 6 ___________ 33,191 Qatar (0.2%)
Qatar National Bank QPSC 347,517 13,722 Industries Qatar QSC 226,199 6,478 * Masraf Al Rayan QSC 533,011 6,129 Ooredoo QSC 158,187 4,508 Qatar Insurance Co. SAQ 206,606 4,034 * Commercial Bank QSC 289,098 2,382 Qatar Islamic Bank SAQ 85,908 2,380 Qatar Electricity & Water Co. QSC 40,544 2,315 Qatar Gas Transport Co. Ltd. 398,296 2,178 Doha Bank QSC 226,551 1,945 Qatar Navigation QSC 81,586 1,579 * Aamal Co. 375,073 1,361 Barwa Real Estate Co. 141,367 1,321 United Development Co. QSC 250,651 1,320 * Vodafone Qatar QSC 477,764 1,235 * Qatar International Islamic Bank QSC 60,177 1,041 * Ezdan Holding Group QSC 233,312 980 Qatari Investors Group QSC 46,024 721 Gulf International Services QSC 65,074 457 Al Meera Consumer Goods Co. QSC 7,863 339 * Doha Bank QSC Rights Exp. 05/09/2017 24,519 42 ___________ 56,467 Russia (0.9%)
Lukoil PJSC ADR 694,702 34,483 Sberbank of Russia PJSC 11,682,416 33,932 Gazprom PJSC ADR 6,775,100 32,165 Novatek PJSC 1,680,935 20,538 Magnit PJSC GDR 426,963 14,934 Tatneft PJSC ADR 372,550 14,582 Sberbank of Russia PJSC ADR 1,170,483 13,954 MMC Norilsk Nickel PJSC ADR 728,617 11,193 Rosneft Oil Co. PJSC GDR 1,791,321 9,911 AK Transneft OAO Preference Shares 2,271 7,688 Alrosa PJSC 3,750,000 6,465 Gazprom PJSC 2,583,277 6,206
30
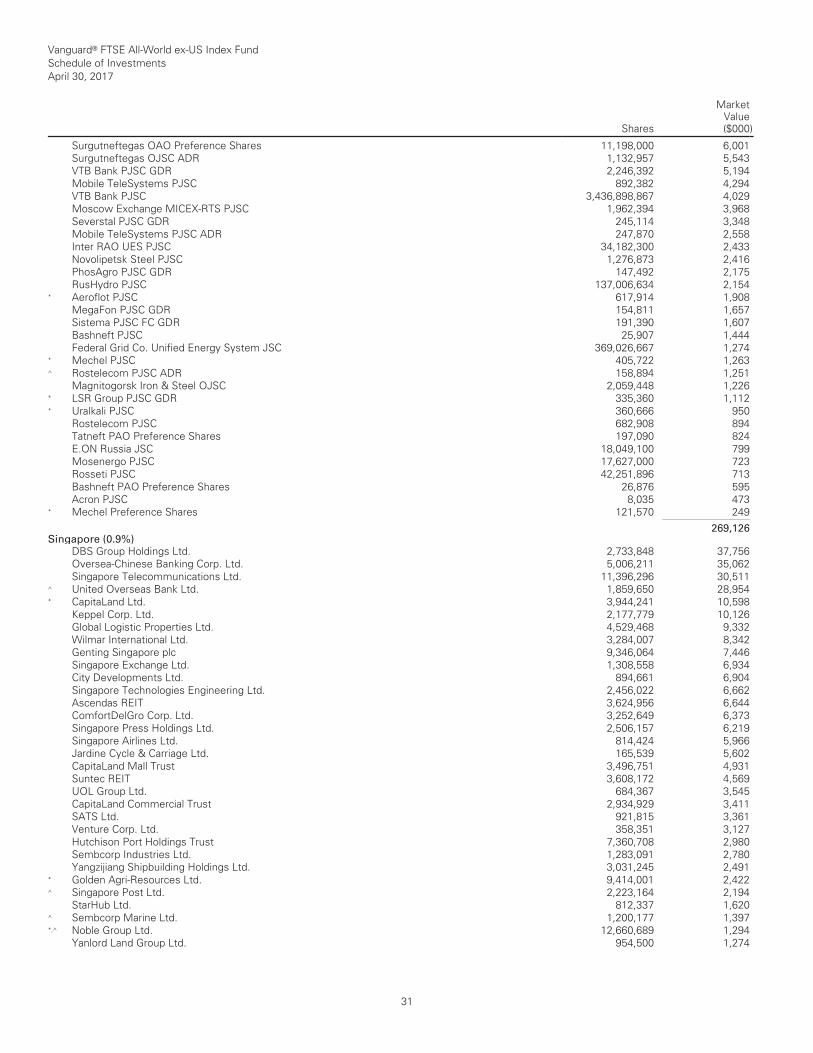
Vanguard® FTSE All-World ex-US Index Fund Schedule of Investments April 30, 2017
Shares
MarketValue($000)
__________________________________________________________________________________________________________________________________________________________________________________________________________________________________________________________________________________________________________________________________________________________________________________________________________________________________________________________________________________________________________________________________________________________________________________________________________________________________________________________________________________________ __________________________________________________________________________________________________________________________________________________________________________________________________________________________________________________________________________________________________________________________________________________________________________________________________________________________________________________________________________________________________________________________________________________________________________________________________________________________________________________________________________________________
Surgutneftegas OAO Preference Shares 11,198,000 6,001 Surgutneftegas OJSC ADR 1,132,957 5,543 VTB Bank PJSC GDR 2,246,392 5,194 Mobile TeleSystems PJSC 892,382 4,294 VTB Bank PJSC 3,436,898,867 4,029 Moscow Exchange MICEX-RTS PJSC 1,962,394 3,968 Severstal PJSC GDR 245,114 3,348 Mobile TeleSystems PJSC ADR 247,870 2,558 Inter RAO UES PJSC 34,182,300 2,433 Novolipetsk Steel PJSC 1,276,873 2,416 PhosAgro PJSC GDR 147,492 2,175 RusHydro PJSC 137,006,634 2,154 * Aeroflot PJSC 617,914 1,908 MegaFon PJSC GDR 154,811 1,657 Sistema PJSC FC GDR 191,390 1,607 Bashneft PJSC 25,907 1,444 Federal Grid Co. Unified Energy System JSC 369,026,667 1,274 * Mechel PJSC 405,722 1,263 ^ Rostelecom PJSC ADR 158,894 1,251 Magnitogorsk Iron & Steel OJSC 2,059,448 1,226 * LSR Group PJSC GDR 335,360 1,112 * Uralkali PJSC 360,666 950 Rostelecom PJSC 682,908 894 Tatneft PAO Preference Shares 197,090 824 E.ON Russia JSC 18,049,100 799 Mosenergo PJSC 17,627,000 723 Rosseti PJSC 42,251,896 713 Bashneft PAO Preference Shares 26,876 595 Acron PJSC 8,035 473 * Mechel Preference Shares 121,570 249 ___________ 269,126 Singapore (0.9%)
DBS Group Holdings Ltd. 2,733,848 37,756 Oversea-Chinese Banking Corp. Ltd. 5,006,211 35,062 Singapore Telecommunications Ltd. 11,396,296 30,511 ^ United Overseas Bank Ltd. 1,859,650 28,954 * CapitaLand Ltd. 3,944,241 10,598 Keppel Corp. Ltd. 2,177,779 10,126 Global Logistic Properties Ltd. 4,529,468 9,332 Wilmar International Ltd. 3,284,007 8,342 Genting Singapore plc 9,346,064 7,446 Singapore Exchange Ltd. 1,308,558 6,934 City Developments Ltd. 894,661 6,904 Singapore Technologies Engineering Ltd. 2,456,022 6,662 Ascendas REIT 3,624,956 6,644 ComfortDelGro Corp. Ltd. 3,252,649 6,373 Singapore Press Holdings Ltd. 2,506,157 6,219 Singapore Airlines Ltd. 814,424 5,966 Jardine Cycle & Carriage Ltd. 165,539 5,602 CapitaLand Mall Trust 3,496,751 4,931 Suntec REIT 3,608,172 4,569 UOL Group Ltd. 684,367 3,545 CapitaLand Commercial Trust 2,934,929 3,411 SATS Ltd. 921,815 3,361 Venture Corp. Ltd. 358,351 3,127 Hutchison Port Holdings Trust 7,360,708 2,980 Sembcorp Industries Ltd. 1,283,091 2,780 Yangzijiang Shipbuilding Holdings Ltd. 3,031,245 2,491 * Golden Agri-Resources Ltd. 9,414,001 2,422 ^ Singapore Post Ltd. 2,223,164 2,194 StarHub Ltd. 812,337 1,620 ^ Sembcorp Marine Ltd. 1,200,177 1,397 *,^ Noble Group Ltd. 12,660,689 1,294 Yanlord Land Group Ltd. 954,500 1,274
31

Vanguard® FTSE All-World ex-US Index Fund Schedule of Investments April 30, 2017
Shares
MarketValue($000)
__________________________________________________________________________________________________________________________________________________________________________________________________________________________________________________________________________________________________________________________________________________________________________________________________________________________________________________________________________________________________________________________________________________________________________________________________________________________________________________________________________________________ __________________________________________________________________________________________________________________________________________________________________________________________________________________________________________________________________________________________________________________________________________________________________________________________________________________________________________________________________________________________________________________________________________________________________________________________________________________________________________________________________________________________
SIA Engineering Co. Ltd. 327,809 877 Wing Tai Holdings Ltd. 547,240 740 ^ M1 Ltd. 394,943 613 ___________ 273,057 South Africa (1.7%)
Naspers Ltd. 652,011 123,981 Sasol Ltd. 843,588 25,852 MTN Group Ltd. 2,726,180 25,782 Standard Bank Group Ltd. 1,835,428 20,382 Steinhoff International Holdings NV (Johannesburg Shares) 3,781,001 19,234 FirstRand Ltd. 4,643,815 17,325 * Sanlam Ltd. 2,699,614 14,336 ^ Remgro Ltd. 817,873 13,577 Aspen Pharmacare Holdings Ltd. 557,246 11,558 Bid Corp. Ltd. 518,725 10,989 Shoprite Holdings Ltd. 666,843 10,462 Vodacom Group Ltd. 797,182 9,016 Growthpoint Properties Ltd. 4,353,458 8,343 Woolworths Holdings Ltd. 1,486,926 8,060 Tiger Brands Ltd. 254,927 7,699 AngloGold Ashanti Ltd. 640,611 7,336 Barclays Africa Group Ltd. 658,334 7,231 Redefine Properties Ltd. 7,844,772 6,457 Bidvest Group Ltd. 532,365 6,354 Sappi Ltd. 830,749 6,170 Nedbank Group Ltd. 338,680 5,710 Discovery Ltd. 479,312 4,799 RMB Holdings Ltd. 990,196 4,541 Mondi Ltd. 173,252 4,492 ^ Capitec Bank Holdings Ltd. 77,592 4,430 Netcare Ltd. 2,228,600 4,422 Life Healthcare Group Holdings Ltd. 2,011,878 4,331 Truworths International Ltd. 649,089 4,203 Mr Price Group Ltd. 352,391 4,142 Gold Fields Ltd. 1,225,088 4,015 SPAR Group Ltd. 281,769 3,798 New Europe Property Investments plc 342,822 3,761 Foschini Group Ltd. 302,321 3,610 Resilient REIT Ltd. 412,874 3,597 Clicks Group Ltd. 355,937 3,577 AVI Ltd. 481,135 3,517 Hyprop Investments Ltd. 371,131 3,427 * Impala Platinum Holdings Ltd. 1,008,061 3,235 Rand Merchant Investment Holdings Ltd. 1,019,599 3,201 Imperial Holdings Ltd. 248,760 3,146 Brait SE 480,198 3,064 Investec Ltd. 404,768 3,037 PSG Group Ltd. 147,981 2,805 Barloworld Ltd. 310,412 2,796 Fortress Income Fund Ltd. Class B 1,113,822 2,794 MMI Holdings Ltd. 1,548,876 2,703 Pioneer Foods Group Ltd. 213,910 2,639 Telkom SA SOC Ltd. 463,664 2,595 Pick n Pay Stores Ltd. 511,966 2,432 * Anglo American Platinum Ltd. 88,474 2,185 Sibanye Gold Ltd. 1,066,138 2,142 Fortress Income Fund Ltd. Class A 1,612,425 2,116 Exxaro Resources Ltd. 237,859 2,024 ^ EOH Holdings Ltd. 182,560 1,933 * Northam Platinum Ltd. 519,865 1,931 Coronation Fund Managers Ltd. 394,265 1,870 Massmart Holdings Ltd. 165,015 1,596 KAP Industrial Holdings Ltd. 2,131,173 1,493 Liberty Holdings Ltd. 182,186 1,469
32
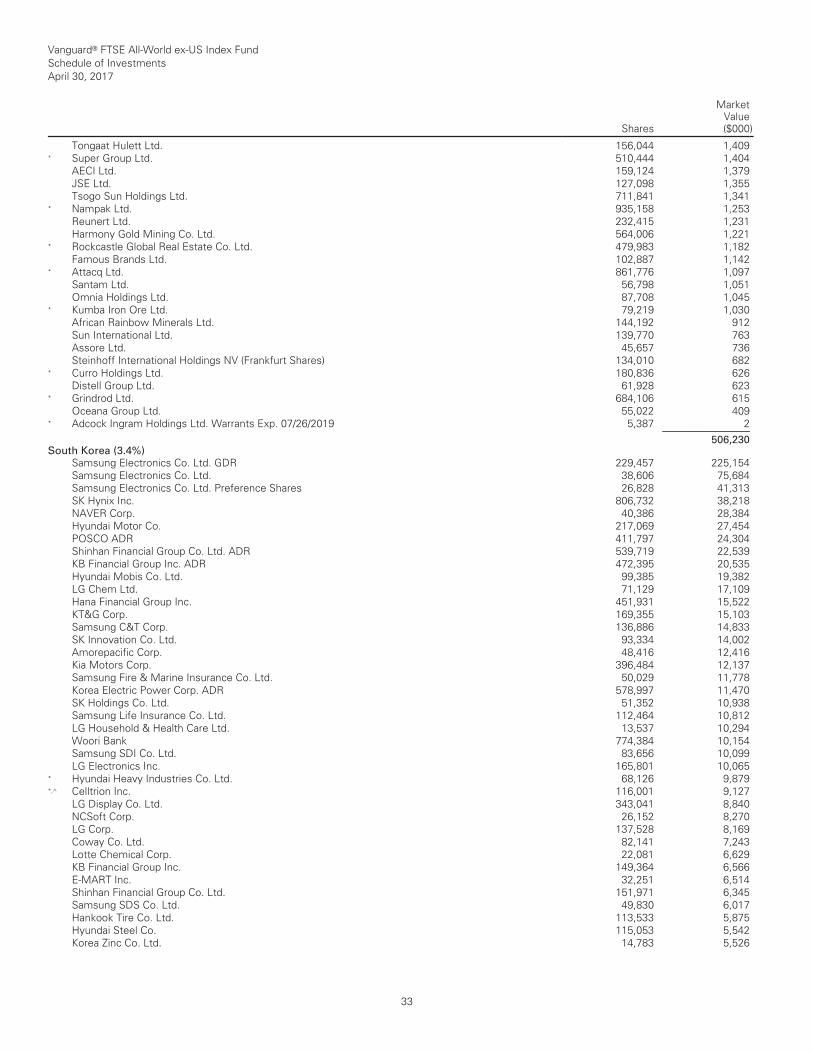
Vanguard® FTSE All-World ex-US Index Fund Schedule of Investments April 30, 2017
Shares
MarketValue($000)
__________________________________________________________________________________________________________________________________________________________________________________________________________________________________________________________________________________________________________________________________________________________________________________________________________________________________________________________________________________________________________________________________________________________________________________________________________________________________________________________________________________________ __________________________________________________________________________________________________________________________________________________________________________________________________________________________________________________________________________________________________________________________________________________________________________________________________________________________________________________________________________________________________________________________________________________________________________________________________________________________________________________________________________________________
Tongaat Hulett Ltd. 156,044 1,409 * Super Group Ltd. 510,444 1,404 AECI Ltd. 159,124 1,379 JSE Ltd. 127,098 1,355 Tsogo Sun Holdings Ltd. 711,841 1,341 * Nampak Ltd. 935,158 1,253 Reunert Ltd. 232,415 1,231 Harmony Gold Mining Co. Ltd. 564,006 1,221 * Rockcastle Global Real Estate Co. Ltd. 479,983 1,182 Famous Brands Ltd. 102,887 1,142 * Attacq Ltd. 861,776 1,097 Santam Ltd. 56,798 1,051 Omnia Holdings Ltd. 87,708 1,045 * Kumba Iron Ore Ltd. 79,219 1,030 African Rainbow Minerals Ltd. 144,192 912 Sun International Ltd. 139,770 763 Assore Ltd. 45,657 736 Steinhoff International Holdings NV (Frankfurt Shares) 134,010 682 * Curro Holdings Ltd. 180,836 626 Distell Group Ltd. 61,928 623 * Grindrod Ltd. 684,106 615 Oceana Group Ltd. 55,022 409 * Adcock Ingram Holdings Ltd. Warrants Exp. 07/26/2019 5,387 2 ___________ 506,230 South Korea (3.4%)
Samsung Electronics Co. Ltd. GDR 229,457 225,154 Samsung Electronics Co. Ltd. 38,606 75,684 Samsung Electronics Co. Ltd. Preference Shares 26,828 41,313 SK Hynix Inc. 806,732 38,218 NAVER Corp. 40,386 28,384 Hyundai Motor Co. 217,069 27,454 POSCO ADR 411,797 24,304 Shinhan Financial Group Co. Ltd. ADR 539,719 22,539 KB Financial Group Inc. ADR 472,395 20,535 Hyundai Mobis Co. Ltd. 99,385 19,382 LG Chem Ltd. 71,129 17,109 Hana Financial Group Inc. 451,931 15,522 KT&G Corp. 169,355 15,103 Samsung C&T Corp. 136,886 14,833 SK Innovation Co. Ltd. 93,334 14,002 Amorepacific Corp. 48,416 12,416 Kia Motors Corp. 396,484 12,137 Samsung Fire & Marine Insurance Co. Ltd. 50,029 11,778 Korea Electric Power Corp. ADR 578,997 11,470 SK Holdings Co. Ltd. 51,352 10,938 Samsung Life Insurance Co. Ltd. 112,464 10,812 LG Household & Health Care Ltd. 13,537 10,294 Woori Bank 774,384 10,154 Samsung SDI Co. Ltd. 83,656 10,099 LG Electronics Inc. 165,801 10,065 * Hyundai Heavy Industries Co. Ltd. 68,126 9,879 *,^ Celltrion Inc. 116,001 9,127 LG Display Co. Ltd. 343,041 8,840 NCSoft Corp. 26,152 8,270 LG Corp. 137,528 8,169 Coway Co. Ltd. 82,141 7,243 Lotte Chemical Corp. 22,081 6,629 KB Financial Group Inc. 149,364 6,566 E-MART Inc. 32,251 6,514 Shinhan Financial Group Co. Ltd. 151,971 6,345 Samsung SDS Co. Ltd. 49,830 6,017 Hankook Tire Co. Ltd. 113,533 5,875 Hyundai Steel Co. 115,053 5,542 Korea Zinc Co. Ltd. 14,783 5,526
33
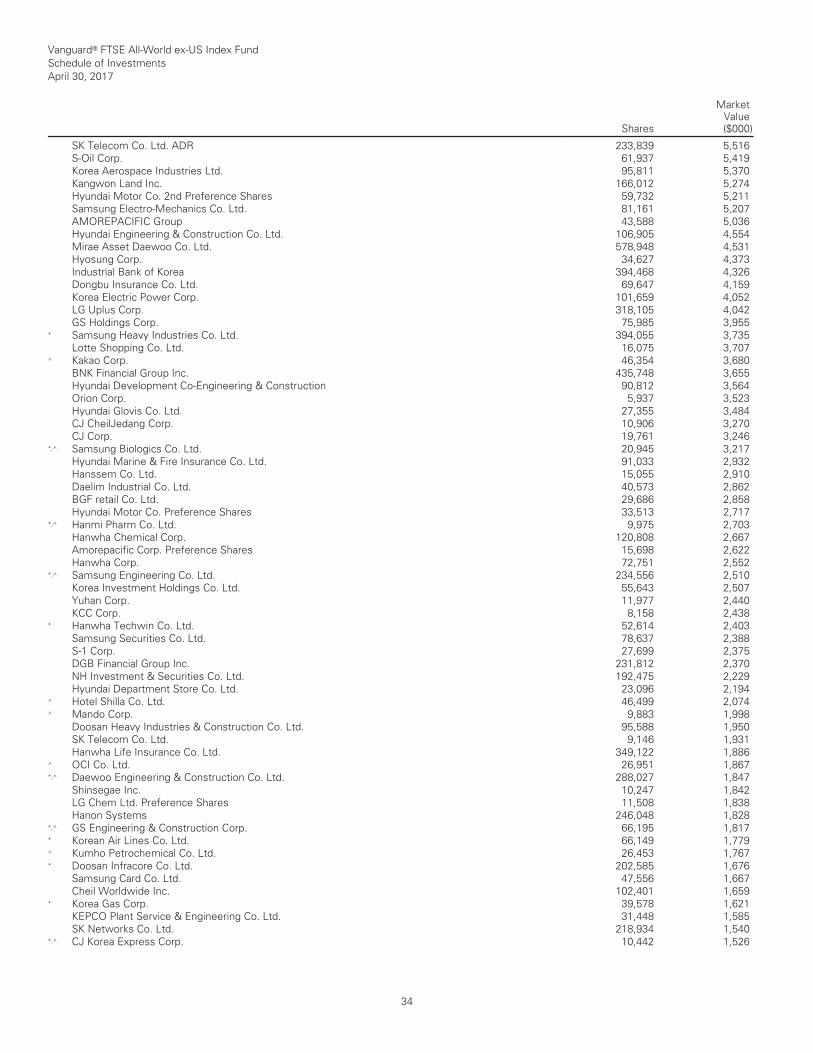
Vanguard® FTSE All-World ex-US Index Fund Schedule of Investments April 30, 2017
Shares
MarketValue($000)
__________________________________________________________________________________________________________________________________________________________________________________________________________________________________________________________________________________________________________________________________________________________________________________________________________________________________________________________________________________________________________________________________________________________________________________________________________________________________________________________________________________________ __________________________________________________________________________________________________________________________________________________________________________________________________________________________________________________________________________________________________________________________________________________________________________________________________________________________________________________________________________________________________________________________________________________________________________________________________________________________________________________________________________________________
SK Telecom Co. Ltd. ADR 233,839 5,516 S-Oil Corp. 61,937 5,419 Korea Aerospace Industries Ltd. 95,811 5,370 Kangwon Land Inc. 166,012 5,274 Hyundai Motor Co. 2nd Preference Shares 59,732 5,211 Samsung Electro-Mechanics Co. Ltd. 81,161 5,207 AMOREPACIFIC Group 43,588 5,036 Hyundai Engineering & Construction Co. Ltd. 106,905 4,554 Mirae Asset Daewoo Co. Ltd. 578,948 4,531 Hyosung Corp. 34,627 4,373 Industrial Bank of Korea 394,468 4,326 Dongbu Insurance Co. Ltd. 69,647 4,159 Korea Electric Power Corp. 101,659 4,052 LG Uplus Corp. 318,105 4,042 GS Holdings Corp. 75,985 3,955 * Samsung Heavy Industries Co. Ltd. 394,055 3,735 Lotte Shopping Co. Ltd. 16,075 3,707 ^ Kakao Corp. 46,354 3,680 BNK Financial Group Inc. 435,748 3,655 Hyundai Development Co-Engineering & Construction 90,812 3,564 Orion Corp. 5,937 3,523 Hyundai Glovis Co. Ltd. 27,355 3,484 CJ CheilJedang Corp. 10,906 3,270 CJ Corp. 19,761 3,246 *,^ Samsung Biologics Co. Ltd. 20,945 3,217 Hyundai Marine & Fire Insurance Co. Ltd. 91,033 2,932 Hanssem Co. Ltd. 15,055 2,910 Daelim Industrial Co. Ltd. 40,573 2,862 BGF retail Co. Ltd. 29,686 2,858 Hyundai Motor Co. Preference Shares 33,513 2,717 *,^ Hanmi Pharm Co. Ltd. 9,975 2,703 Hanwha Chemical Corp. 120,808 2,667 Amorepacific Corp. Preference Shares 15,698 2,622 Hanwha Corp. 72,751 2,552 *,^ Samsung Engineering Co. Ltd. 234,556 2,510 Korea Investment Holdings Co. Ltd. 55,643 2,507 Yuhan Corp. 11,977 2,440 KCC Corp. 8,158 2,438 * Hanwha Techwin Co. Ltd. 52,614 2,403 Samsung Securities Co. Ltd. 78,637 2,388 S-1 Corp. 27,699 2,375 DGB Financial Group Inc. 231,812 2,370 NH Investment & Securities Co. Ltd. 192,475 2,229 Hyundai Department Store Co. Ltd. 23,096 2,194 ^ Hotel Shilla Co. Ltd. 46,499 2,074 ^ Mando Corp. 9,883 1,998 Doosan Heavy Industries & Construction Co. Ltd. 95,588 1,950 SK Telecom Co. Ltd. 9,146 1,931 Hanwha Life Insurance Co. Ltd. 349,122 1,886 ^ OCI Co. Ltd. 26,951 1,867 *,^ Daewoo Engineering & Construction Co. Ltd. 288,027 1,847 Shinsegae Inc. 10,247 1,842 LG Chem Ltd. Preference Shares 11,508 1,838 Hanon Systems 246,048 1,828 *,^ GS Engineering & Construction Corp. 66,195 1,817 * Korean Air Lines Co. Ltd. 66,149 1,779 ^ Kumho Petrochemical Co. Ltd. 26,453 1,767 * Doosan Infracore Co. Ltd. 202,585 1,676 Samsung Card Co. Ltd. 47,556 1,667 Cheil Worldwide Inc. 102,401 1,659 * Korea Gas Corp. 39,578 1,621 KEPCO Plant Service & Engineering Co. Ltd. 31,448 1,585 SK Networks Co. Ltd. 218,934 1,540 *,^ CJ Korea Express Corp. 10,442 1,526
34
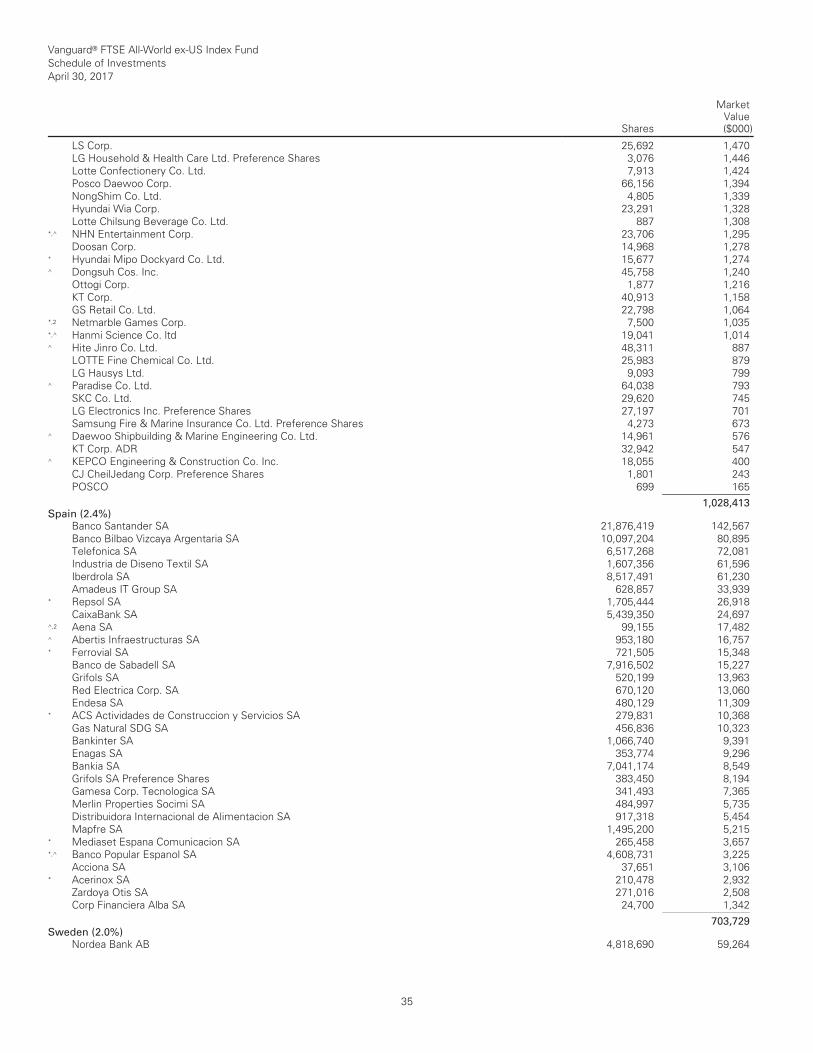
Vanguard® FTSE All-World ex-US Index Fund Schedule of Investments April 30, 2017
Shares
MarketValue($000)
__________________________________________________________________________________________________________________________________________________________________________________________________________________________________________________________________________________________________________________________________________________________________________________________________________________________________________________________________________________________________________________________________________________________________________________________________________________________________________________________________________________________ __________________________________________________________________________________________________________________________________________________________________________________________________________________________________________________________________________________________________________________________________________________________________________________________________________________________________________________________________________________________________________________________________________________________________________________________________________________________________________________________________________________________
LS Corp. 25,692 1,470 LG Household & Health Care Ltd. Preference Shares 3,076 1,446 Lotte Confectionery Co. Ltd. 7,913 1,424 Posco Daewoo Corp. 66,156 1,394 NongShim Co. Ltd. 4,805 1,339 Hyundai Wia Corp. 23,291 1,328 Lotte Chilsung Beverage Co. Ltd. 887 1,308 *,^ NHN Entertainment Corp. 23,706 1,295 Doosan Corp. 14,968 1,278 * Hyundai Mipo Dockyard Co. Ltd. 15,677 1,274 ^ Dongsuh Cos. Inc. 45,758 1,240 Ottogi Corp. 1,877 1,216 KT Corp. 40,913 1,158 GS Retail Co. Ltd. 22,798 1,064 *,2 Netmarble Games Corp. 7,500 1,035 *,^ Hanmi Science Co. ltd 19,041 1,014 ^ Hite Jinro Co. Ltd. 48,311 887 LOTTE Fine Chemical Co. Ltd. 25,983 879 LG Hausys Ltd. 9,093 799 ^ Paradise Co. Ltd. 64,038 793 SKC Co. Ltd. 29,620 745 LG Electronics Inc. Preference Shares 27,197 701 Samsung Fire & Marine Insurance Co. Ltd. Preference Shares 4,273 673 ^ Daewoo Shipbuilding & Marine Engineering Co. Ltd. 14,961 576 KT Corp. ADR 32,942 547 ^ KEPCO Engineering & Construction Co. Inc. 18,055 400 CJ CheilJedang Corp. Preference Shares 1,801 243 POSCO 699 165 ___________ 1,028,413 Spain (2.4%)
Banco Santander SA 21,876,419 142,567 Banco Bilbao Vizcaya Argentaria SA 10,097,204 80,895 Telefonica SA 6,517,268 72,081 Industria de Diseno Textil SA 1,607,356 61,596 Iberdrola SA 8,517,491 61,230 Amadeus IT Group SA 628,857 33,939 * Repsol SA 1,705,444 26,918 CaixaBank SA 5,439,350 24,697 ^,2 Aena SA 99,155 17,482 ^ Abertis Infraestructuras SA 953,180 16,757 * Ferrovial SA 721,505 15,348 Banco de Sabadell SA 7,916,502 15,227 Grifols SA 520,199 13,963 Red Electrica Corp. SA 670,120 13,060 Endesa SA 480,129 11,309 * ACS Actividades de Construccion y Servicios SA 279,831 10,368 Gas Natural SDG SA 456,836 10,323 Bankinter SA 1,066,740 9,391 Enagas SA 353,774 9,296 Bankia SA 7,041,174 8,549 Grifols SA Preference Shares 383,450 8,194 Gamesa Corp. Tecnologica SA 341,493 7,365 Merlin Properties Socimi SA 484,997 5,735 Distribuidora Internacional de Alimentacion SA 917,318 5,454 Mapfre SA 1,495,200 5,215 * Mediaset Espana Comunicacion SA 265,458 3,657 *,^ Banco Popular Espanol SA 4,608,731 3,225 Acciona SA 37,651 3,106 * Acerinox SA 210,478 2,932 Zardoya Otis SA 271,016 2,508 Corp Financiera Alba SA 24,700 1,342 ___________ 703,729 Sweden (2.0%)
Nordea Bank AB 4,818,690 59,264
35
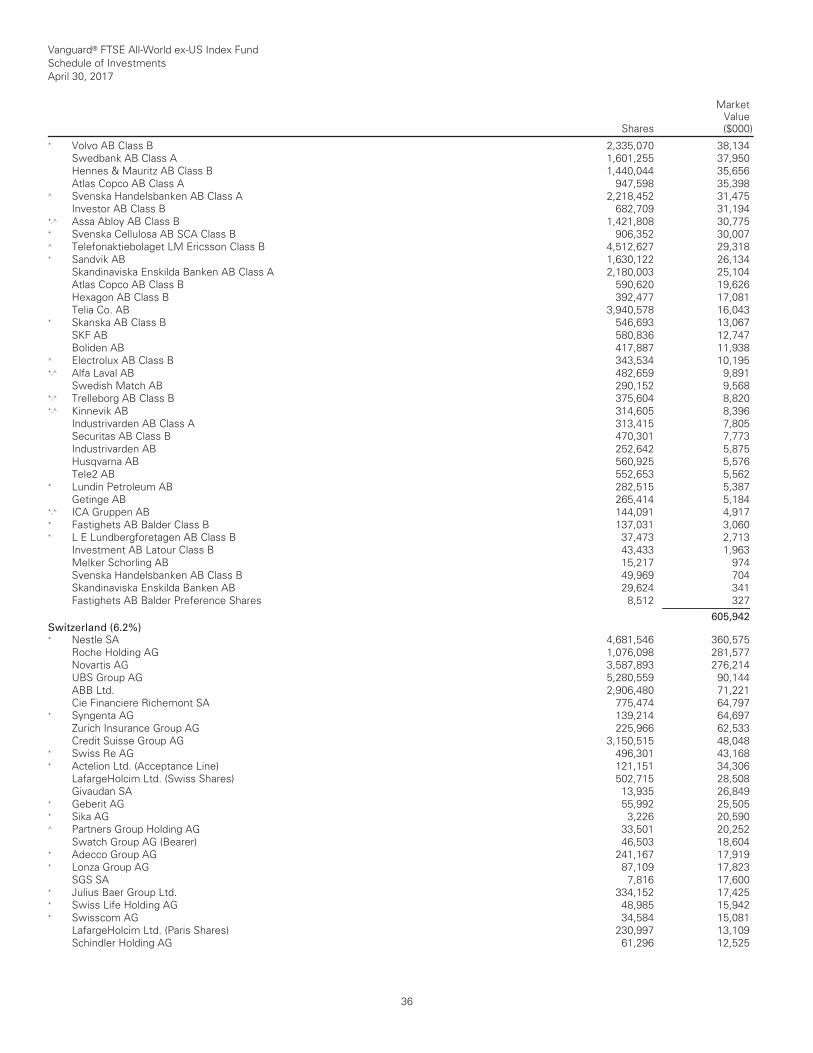
Vanguard® FTSE All-World ex-US Index Fund Schedule of Investments April 30, 2017
Shares
MarketValue($000)
__________________________________________________________________________________________________________________________________________________________________________________________________________________________________________________________________________________________________________________________________________________________________________________________________________________________________________________________________________________________________________________________________________________________________________________________________________________________________________________________________________________________ __________________________________________________________________________________________________________________________________________________________________________________________________________________________________________________________________________________________________________________________________________________________________________________________________________________________________________________________________________________________________________________________________________________________________________________________________________________________________________________________________________________________
* Volvo AB Class B 2,335,070 38,134 Swedbank AB Class A 1,601,255 37,950 Hennes & Mauritz AB Class B 1,440,044 35,656 Atlas Copco AB Class A 947,598 35,398 ^ Svenska Handelsbanken AB Class A 2,218,452 31,475 Investor AB Class B 682,709 31,194 *,^ Assa Abloy AB Class B 1,421,808 30,775 * Svenska Cellulosa AB SCA Class B 906,352 30,007 ^ Telefonaktiebolaget LM Ericsson Class B 4,512,627 29,318 * Sandvik AB 1,630,122 26,134 Skandinaviska Enskilda Banken AB Class A 2,180,003 25,104 Atlas Copco AB Class B 590,620 19,626 Hexagon AB Class B 392,477 17,081 Telia Co. AB 3,940,578 16,043 * Skanska AB Class B 546,693 13,067 SKF AB 580,836 12,747 Boliden AB 417,887 11,938 ^ Electrolux AB Class B 343,534 10,195 *,^ Alfa Laval AB 482,659 9,891 Swedish Match AB 290,152 9,568 *,^ Trelleborg AB Class B 375,604 8,820 *,^ Kinnevik AB 314,605 8,396 Industrivarden AB Class A 313,415 7,805 Securitas AB Class B 470,301 7,773 Industrivarden AB 252,642 5,875 Husqvarna AB 560,925 5,576 Tele2 AB 552,653 5,562 * Lundin Petroleum AB 282,515 5,387 Getinge AB 265,414 5,184 *,^ ICA Gruppen AB 144,091 4,917 * Fastighets AB Balder Class B 137,031 3,060 * L E Lundbergforetagen AB Class B 37,473 2,713 Investment AB Latour Class B 43,433 1,963 Melker Schorling AB 15,217 974 Svenska Handelsbanken AB Class B 49,969 704 Skandinaviska Enskilda Banken AB 29,624 341 Fastighets AB Balder Preference Shares 8,512 327 ___________ 605,942 Switzerland (6.2%)
* Nestle SA 4,681,546 360,575 Roche Holding AG 1,076,098 281,577 Novartis AG 3,587,893 276,214 UBS Group AG 5,280,559 90,144 ABB Ltd. 2,906,480 71,221 Cie Financiere Richemont SA 775,474 64,797 * Syngenta AG 139,214 64,697 Zurich Insurance Group AG 225,966 62,533 Credit Suisse Group AG 3,150,515 48,048 * Swiss Re AG 496,301 43,168 * Actelion Ltd. (Acceptance Line) 121,151 34,306 LafargeHolcim Ltd. (Swiss Shares) 502,715 28,508 Givaudan SA 13,935 26,849 * Geberit AG 55,992 25,505 * Sika AG 3,226 20,590 ^ Partners Group Holding AG 33,501 20,252 Swatch Group AG (Bearer) 46,503 18,604 * Adecco Group AG 241,167 17,919 * Lonza Group AG 87,109 17,823 SGS SA 7,816 17,600 * Julius Baer Group Ltd. 334,152 17,425 * Swiss Life Holding AG 48,985 15,942 * Swisscom AG 34,584 15,081 LafargeHolcim Ltd. (Paris Shares) 230,997 13,109 Schindler Holding AG 61,296 12,525
36
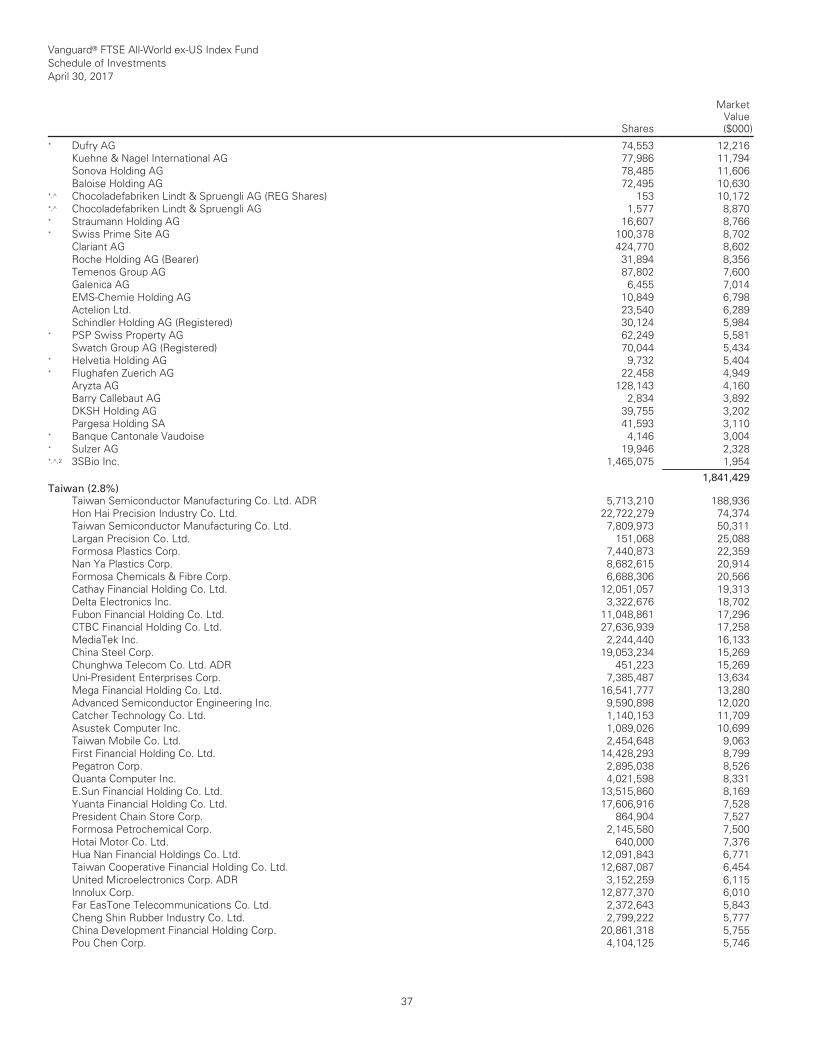
Vanguard® FTSE All-World ex-US Index Fund Schedule of Investments April 30, 2017
Shares
MarketValue($000)
__________________________________________________________________________________________________________________________________________________________________________________________________________________________________________________________________________________________________________________________________________________________________________________________________________________________________________________________________________________________________________________________________________________________________________________________________________________________________________________________________________________________ __________________________________________________________________________________________________________________________________________________________________________________________________________________________________________________________________________________________________________________________________________________________________________________________________________________________________________________________________________________________________________________________________________________________________________________________________________________________________________________________________________________________
* Dufry AG 74,553 12,216 Kuehne & Nagel International AG 77,986 11,794 Sonova Holding AG 78,485 11,606 Baloise Holding AG 72,495 10,630 *,^ Chocoladefabriken Lindt & Spruengli AG (REG Shares) 153 10,172 *,^ Chocoladefabriken Lindt & Spruengli AG 1,577 8,870 * Straumann Holding AG 16,607 8,766 * Swiss Prime Site AG 100,378 8,702 Clariant AG 424,770 8,602 Roche Holding AG (Bearer) 31,894 8,356 Temenos Group AG 87,802 7,600 Galenica AG 6,455 7,014 EMS-Chemie Holding AG 10,849 6,798 Actelion Ltd. 23,540 6,289 Schindler Holding AG (Registered) 30,124 5,984 * PSP Swiss Property AG 62,249 5,581 Swatch Group AG (Registered) 70,044 5,434 * Helvetia Holding AG 9,732 5,404 * Flughafen Zuerich AG 22,458 4,949 Aryzta AG 128,143 4,160 Barry Callebaut AG 2,834 3,892 DKSH Holding AG 39,755 3,202 Pargesa Holding SA 41,593 3,110 * Banque Cantonale Vaudoise 4,146 3,004 * Sulzer AG 19,946 2,328 *,^,2 3SBio Inc. 1,465,075 1,954 ___________ 1,841,429 Taiwan (2.8%)
Taiwan Semiconductor Manufacturing Co. Ltd. ADR 5,713,210 188,936 Hon Hai Precision Industry Co. Ltd. 22,722,279 74,374 Taiwan Semiconductor Manufacturing Co. Ltd. 7,809,973 50,311 Largan Precision Co. Ltd. 151,068 25,088 Formosa Plastics Corp. 7,440,873 22,359 Nan Ya Plastics Corp. 8,682,615 20,914 Formosa Chemicals & Fibre Corp. 6,688,306 20,566 Cathay Financial Holding Co. Ltd. 12,051,057 19,313 Delta Electronics Inc. 3,322,676 18,702 Fubon Financial Holding Co. Ltd. 11,048,861 17,296 CTBC Financial Holding Co. Ltd. 27,636,939 17,258 MediaTek Inc. 2,244,440 16,133 China Steel Corp. 19,053,234 15,269 Chunghwa Telecom Co. Ltd. ADR 451,223 15,269 Uni-President Enterprises Corp. 7,385,487 13,634 Mega Financial Holding Co. Ltd. 16,541,777 13,280 Advanced Semiconductor Engineering Inc. 9,590,898 12,020 Catcher Technology Co. Ltd. 1,140,153 11,709 Asustek Computer Inc. 1,089,026 10,699 Taiwan Mobile Co. Ltd. 2,454,648 9,063 First Financial Holding Co. Ltd. 14,428,293 8,799 Pegatron Corp. 2,895,038 8,526 Quanta Computer Inc. 4,021,598 8,331 E.Sun Financial Holding Co. Ltd. 13,515,860 8,169 Yuanta Financial Holding Co. Ltd. 17,606,916 7,528 President Chain Store Corp. 864,904 7,527 Formosa Petrochemical Corp. 2,145,580 7,500 Hotai Motor Co. Ltd. 640,000 7,376 Hua Nan Financial Holdings Co. Ltd. 12,091,843 6,771 Taiwan Cooperative Financial Holding Co. Ltd. 12,687,087 6,454 United Microelectronics Corp. ADR 3,152,259 6,115 Innolux Corp. 12,877,370 6,010 Far EasTone Telecommunications Co. Ltd. 2,372,643 5,843 Cheng Shin Rubber Industry Co. Ltd. 2,799,222 5,777 China Development Financial Holding Corp. 20,861,318 5,755 Pou Chen Corp. 4,104,125 5,746
37
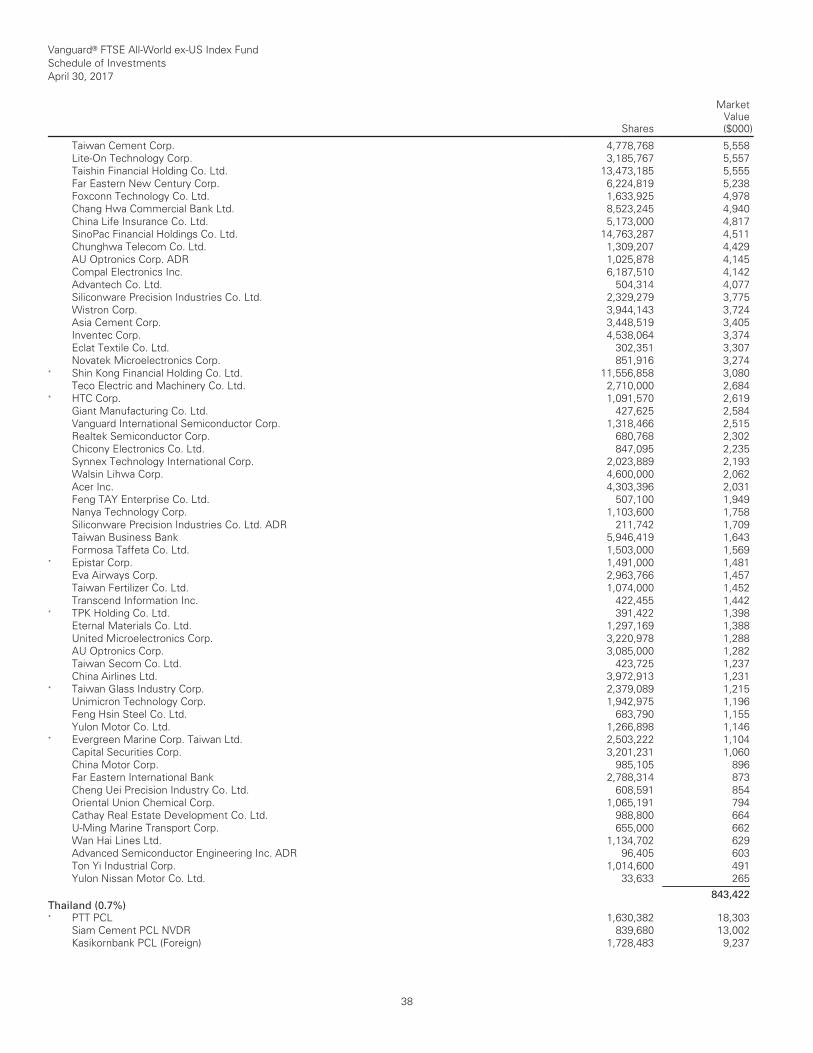
Vanguard® FTSE All-World ex-US Index Fund Schedule of Investments April 30, 2017
Shares
MarketValue($000)
__________________________________________________________________________________________________________________________________________________________________________________________________________________________________________________________________________________________________________________________________________________________________________________________________________________________________________________________________________________________________________________________________________________________________________________________________________________________________________________________________________________________ __________________________________________________________________________________________________________________________________________________________________________________________________________________________________________________________________________________________________________________________________________________________________________________________________________________________________________________________________________________________________________________________________________________________________________________________________________________________________________________________________________________________
Taiwan Cement Corp. 4,778,768 5,558 Lite-On Technology Corp. 3,185,767 5,557 Taishin Financial Holding Co. Ltd. 13,473,185 5,555 Far Eastern New Century Corp. 6,224,819 5,238 Foxconn Technology Co. Ltd. 1,633,925 4,978 Chang Hwa Commercial Bank Ltd. 8,523,245 4,940 China Life Insurance Co. Ltd. 5,173,000 4,817 SinoPac Financial Holdings Co. Ltd. 14,763,287 4,511 Chunghwa Telecom Co. Ltd. 1,309,207 4,429 AU Optronics Corp. ADR 1,025,878 4,145 Compal Electronics Inc. 6,187,510 4,142 Advantech Co. Ltd. 504,314 4,077 Siliconware Precision Industries Co. Ltd. 2,329,279 3,775 Wistron Corp. 3,944,143 3,724 Asia Cement Corp. 3,448,519 3,405 Inventec Corp. 4,538,064 3,374 Eclat Textile Co. Ltd. 302,351 3,307 Novatek Microelectronics Corp. 851,916 3,274 * Shin Kong Financial Holding Co. Ltd. 11,556,858 3,080 Teco Electric and Machinery Co. Ltd. 2,710,000 2,684 * HTC Corp. 1,091,570 2,619 Giant Manufacturing Co. Ltd. 427,625 2,584 Vanguard International Semiconductor Corp. 1,318,466 2,515 Realtek Semiconductor Corp. 680,768 2,302 Chicony Electronics Co. Ltd. 847,095 2,235 Synnex Technology International Corp. 2,023,889 2,193 Walsin Lihwa Corp. 4,600,000 2,062 Acer Inc. 4,303,396 2,031 Feng TAY Enterprise Co. Ltd. 507,100 1,949 Nanya Technology Corp. 1,103,600 1,758 Siliconware Precision Industries Co. Ltd. ADR 211,742 1,709 Taiwan Business Bank 5,946,419 1,643 Formosa Taffeta Co. Ltd. 1,503,000 1,569 * Epistar Corp. 1,491,000 1,481 Eva Airways Corp. 2,963,766 1,457 Taiwan Fertilizer Co. Ltd. 1,074,000 1,452 Transcend Information Inc. 422,455 1,442 * TPK Holding Co. Ltd. 391,422 1,398 Eternal Materials Co. Ltd. 1,297,169 1,388 United Microelectronics Corp. 3,220,978 1,288 AU Optronics Corp. 3,085,000 1,282 Taiwan Secom Co. Ltd. 423,725 1,237 China Airlines Ltd. 3,972,913 1,231 * Taiwan Glass Industry Corp. 2,379,089 1,215 Unimicron Technology Corp. 1,942,975 1,196 Feng Hsin Steel Co. Ltd. 683,790 1,155 Yulon Motor Co. Ltd. 1,266,898 1,146 * Evergreen Marine Corp. Taiwan Ltd. 2,503,222 1,104 Capital Securities Corp. 3,201,231 1,060 China Motor Corp. 985,105 896 Far Eastern International Bank 2,788,314 873 Cheng Uei Precision Industry Co. Ltd. 608,591 854 Oriental Union Chemical Corp. 1,065,191 794 Cathay Real Estate Development Co. Ltd. 988,800 664 U-Ming Marine Transport Corp. 655,000 662 Wan Hai Lines Ltd. 1,134,702 629 Advanced Semiconductor Engineering Inc. ADR 96,405 603 Ton Yi Industrial Corp. 1,014,600 491 Yulon Nissan Motor Co. Ltd. 33,633 265 ___________ 843,422 Thailand (0.7%)
* PTT PCL 1,630,382 18,303 Siam Cement PCL NVDR 839,680 13,002 Kasikornbank PCL (Foreign) 1,728,483 9,237
38
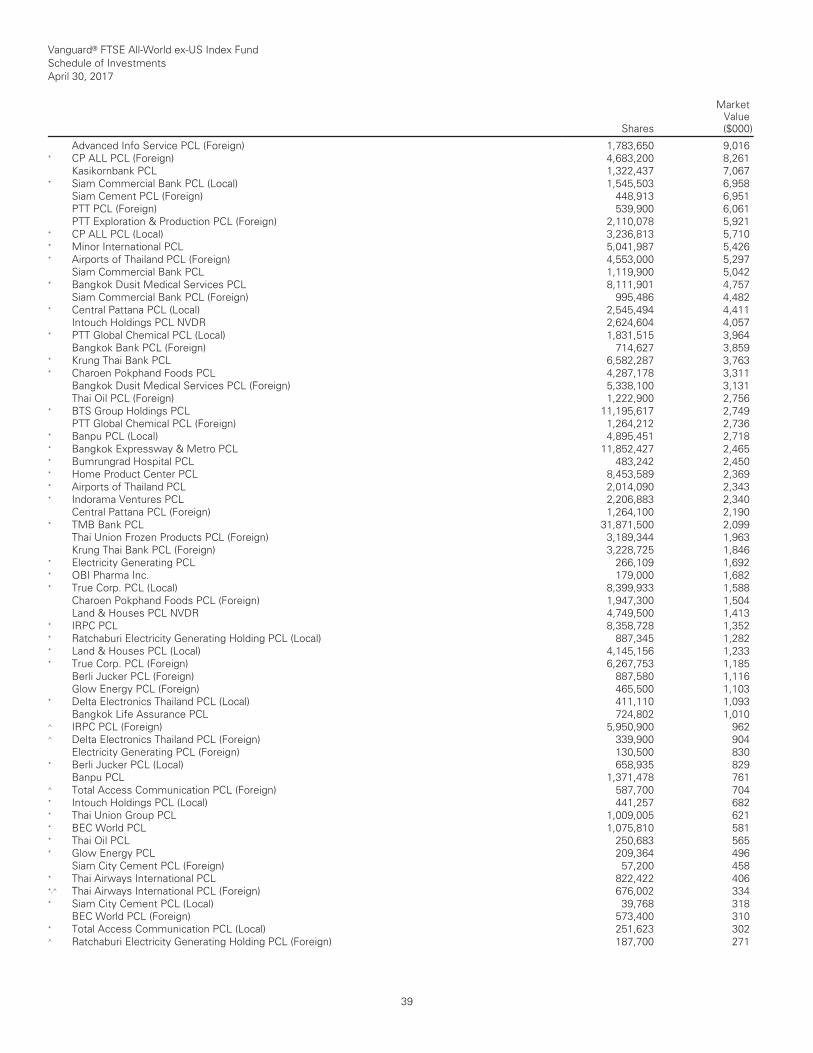
Vanguard® FTSE All-World ex-US Index Fund Schedule of Investments April 30, 2017
Shares
MarketValue($000)
__________________________________________________________________________________________________________________________________________________________________________________________________________________________________________________________________________________________________________________________________________________________________________________________________________________________________________________________________________________________________________________________________________________________________________________________________________________________________________________________________________________________ __________________________________________________________________________________________________________________________________________________________________________________________________________________________________________________________________________________________________________________________________________________________________________________________________________________________________________________________________________________________________________________________________________________________________________________________________________________________________________________________________________________________
Advanced Info Service PCL (Foreign) 1,783,650 9,016 * CP ALL PCL (Foreign) 4,683,200 8,261 Kasikornbank PCL 1,322,437 7,067 * Siam Commercial Bank PCL (Local) 1,545,503 6,958 Siam Cement PCL (Foreign) 448,913 6,951 PTT PCL (Foreign) 539,900 6,061 PTT Exploration & Production PCL (Foreign) 2,110,078 5,921 * CP ALL PCL (Local) 3,236,813 5,710 * Minor International PCL 5,041,987 5,426 * Airports of Thailand PCL (Foreign) 4,553,000 5,297 Siam Commercial Bank PCL 1,119,900 5,042 * Bangkok Dusit Medical Services PCL 8,111,901 4,757 Siam Commercial Bank PCL (Foreign) 995,486 4,482 * Central Pattana PCL (Local) 2,545,494 4,411 Intouch Holdings PCL NVDR 2,624,604 4,057 * PTT Global Chemical PCL (Local) 1,831,515 3,964 Bangkok Bank PCL (Foreign) 714,627 3,859 * Krung Thai Bank PCL 6,582,287 3,763 * Charoen Pokphand Foods PCL 4,287,178 3,311 Bangkok Dusit Medical Services PCL (Foreign) 5,338,100 3,131 Thai Oil PCL (Foreign) 1,222,900 2,756 * BTS Group Holdings PCL 11,195,617 2,749 PTT Global Chemical PCL (Foreign) 1,264,212 2,736 * Banpu PCL (Local) 4,895,451 2,718 * Bangkok Expressway & Metro PCL 11,852,427 2,465 * Bumrungrad Hospital PCL 483,242 2,450 * Home Product Center PCL 8,453,589 2,369 * Airports of Thailand PCL 2,014,090 2,343 * Indorama Ventures PCL 2,206,883 2,340 Central Pattana PCL (Foreign) 1,264,100 2,190 * TMB Bank PCL 31,871,500 2,099 Thai Union Frozen Products PCL (Foreign) 3,189,344 1,963 Krung Thai Bank PCL (Foreign) 3,228,725 1,846 * Electricity Generating PCL 266,109 1,692 * OBI Pharma Inc. 179,000 1,682 * True Corp. PCL (Local) 8,399,933 1,588 Charoen Pokphand Foods PCL (Foreign) 1,947,300 1,504 Land & Houses PCL NVDR 4,749,500 1,413 * IRPC PCL 8,358,728 1,352 * Ratchaburi Electricity Generating Holding PCL (Local) 887,345 1,282 * Land & Houses PCL (Local) 4,145,156 1,233 * True Corp. PCL (Foreign) 6,267,753 1,185 Berli Jucker PCL (Foreign) 887,580 1,116 Glow Energy PCL (Foreign) 465,500 1,103 * Delta Electronics Thailand PCL (Local) 411,110 1,093 Bangkok Life Assurance PCL 724,802 1,010 ^ IRPC PCL (Foreign) 5,950,900 962 ^ Delta Electronics Thailand PCL (Foreign) 339,900 904 Electricity Generating PCL (Foreign) 130,500 830 * Berli Jucker PCL (Local) 658,935 829 Banpu PCL 1,371,478 761 ^ Total Access Communication PCL (Foreign) 587,700 704 * Intouch Holdings PCL (Local) 441,257 682 * Thai Union Group PCL 1,009,005 621 * BEC World PCL 1,075,810 581 * Thai Oil PCL 250,683 565 * Glow Energy PCL 209,364 496 Siam City Cement PCL (Foreign) 57,200 458 * Thai Airways International PCL 822,422 406 *,^ Thai Airways International PCL (Foreign) 676,002 334 * Siam City Cement PCL (Local) 39,768 318 BEC World PCL (Foreign) 573,400 310 * Total Access Communication PCL (Local) 251,623 302 ^ Ratchaburi Electricity Generating Holding PCL (Foreign) 187,700 271
39
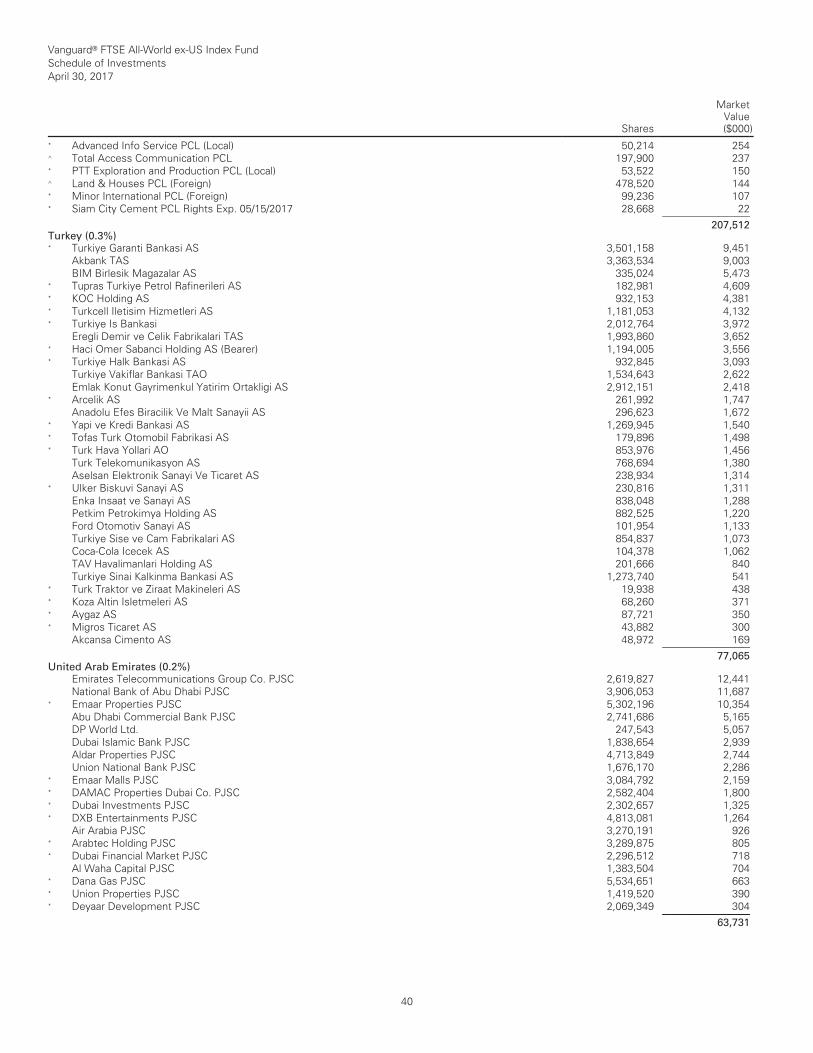
Vanguard® FTSE All-World ex-US Index Fund Schedule of Investments April 30, 2017
Shares
MarketValue($000)
__________________________________________________________________________________________________________________________________________________________________________________________________________________________________________________________________________________________________________________________________________________________________________________________________________________________________________________________________________________________________________________________________________________________________________________________________________________________________________________________________________________________ __________________________________________________________________________________________________________________________________________________________________________________________________________________________________________________________________________________________________________________________________________________________________________________________________________________________________________________________________________________________________________________________________________________________________________________________________________________________________________________________________________________________
* Advanced Info Service PCL (Local) 50,214 254 ^ Total Access Communication PCL 197,900 237 * PTT Exploration and Production PCL (Local) 53,522 150 ^ Land & Houses PCL (Foreign) 478,520 144 * Minor International PCL (Foreign) 99,236 107 * Siam City Cement PCL Rights Exp. 05/15/2017 28,668 22 ___________ 207,512 Turkey (0.3%)
* Turkiye Garanti Bankasi AS 3,501,158 9,451 Akbank TAS 3,363,534 9,003 BIM Birlesik Magazalar AS 335,024 5,473 * Tupras Turkiye Petrol Rafinerileri AS 182,981 4,609 * KOC Holding AS 932,153 4,381 * Turkcell Iletisim Hizmetleri AS 1,181,053 4,132 * Turkiye Is Bankasi 2,012,764 3,972 Eregli Demir ve Celik Fabrikalari TAS 1,993,860 3,652 * Haci Omer Sabanci Holding AS (Bearer) 1,194,005 3,556 * Turkiye Halk Bankasi AS 932,845 3,093 Turkiye Vakiflar Bankasi TAO 1,534,643 2,622 Emlak Konut Gayrimenkul Yatirim Ortakligi AS 2,912,151 2,418 * Arcelik AS 261,992 1,747 Anadolu Efes Biracilik Ve Malt Sanayii AS 296,623 1,672 * Yapi ve Kredi Bankasi AS 1,269,945 1,540 * Tofas Turk Otomobil Fabrikasi AS 179,896 1,498 * Turk Hava Yollari AO 853,976 1,456 Turk Telekomunikasyon AS 768,694 1,380 Aselsan Elektronik Sanayi Ve Ticaret AS 238,934 1,314 * Ulker Biskuvi Sanayi AS 230,816 1,311 Enka Insaat ve Sanayi AS 838,048 1,288 Petkim Petrokimya Holding AS 882,525 1,220 Ford Otomotiv Sanayi AS 101,954 1,133 Turkiye Sise ve Cam Fabrikalari AS 854,837 1,073 Coca-Cola Icecek AS 104,378 1,062 TAV Havalimanlari Holding AS 201,666 840 Turkiye Sinai Kalkinma Bankasi AS 1,273,740 541 * Turk Traktor ve Ziraat Makineleri AS 19,938 438 * Koza Altin Isletmeleri AS 68,260 371 * Aygaz AS 87,721 350 * Migros Ticaret AS 43,882 300 Akcansa Cimento AS 48,972 169 ___________ 77,065 United Arab Emirates (0.2%)
Emirates Telecommunications Group Co. PJSC 2,619,827 12,441 National Bank of Abu Dhabi PJSC 3,906,053 11,687 * Emaar Properties PJSC 5,302,196 10,354 Abu Dhabi Commercial Bank PJSC 2,741,686 5,165 DP World Ltd. 247,543 5,057 Dubai Islamic Bank PJSC 1,838,654 2,939 Aldar Properties PJSC 4,713,849 2,744 Union National Bank PJSC 1,676,170 2,286 * Emaar Malls PJSC 3,084,792 2,159 * DAMAC Properties Dubai Co. PJSC 2,582,404 1,800 * Dubai Investments PJSC 2,302,657 1,325 * DXB Entertainments PJSC 4,813,081 1,264 Air Arabia PJSC 3,270,191 926 * Arabtec Holding PJSC 3,289,875 805 * Dubai Financial Market PJSC 2,296,512 718 Al Waha Capital PJSC 1,383,504 704 * Dana Gas PJSC 5,534,651 663 * Union Properties PJSC 1,419,520 390 * Deyaar Development PJSC 2,069,349 304 ___________ 63,731
40
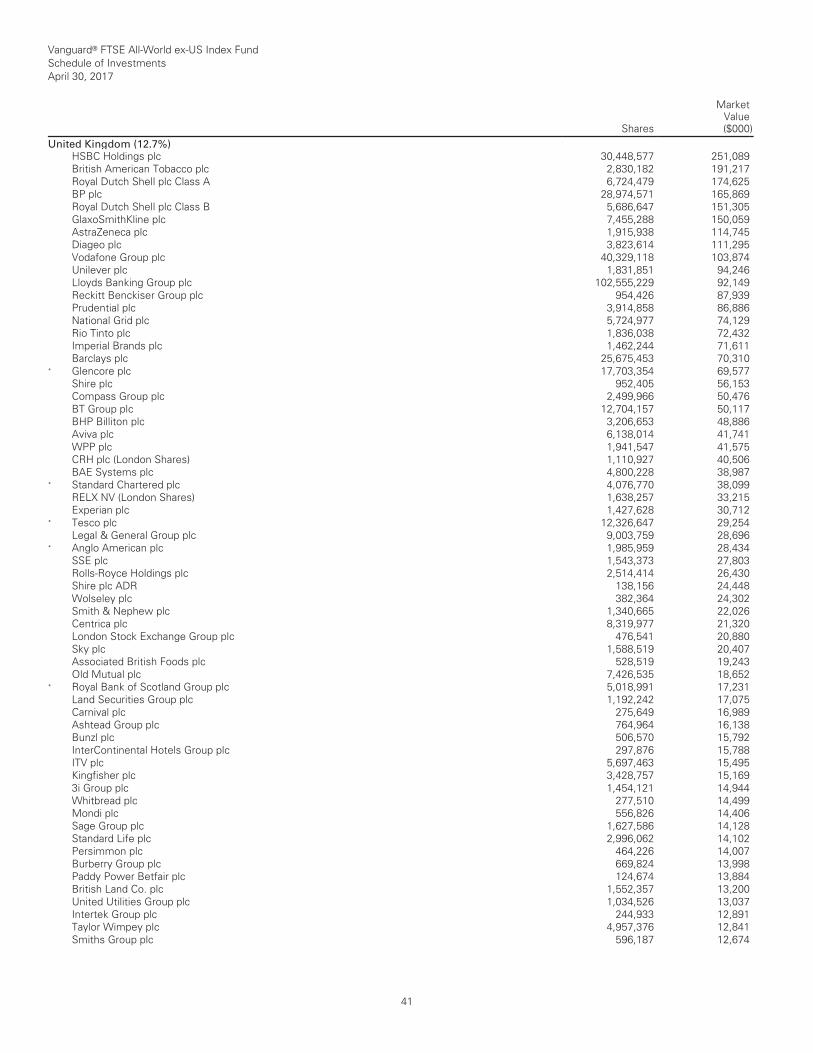
Vanguard® FTSE All-World ex-US Index Fund Schedule of Investments April 30, 2017
Shares
MarketValue($000)
__________________________________________________________________________________________________________________________________________________________________________________________________________________________________________________________________________________________________________________________________________________________________________________________________________________________________________________________________________________________________________________________________________________________________________________________________________________________________________________________________________________________ __________________________________________________________________________________________________________________________________________________________________________________________________________________________________________________________________________________________________________________________________________________________________________________________________________________________________________________________________________________________________________________________________________________________________________________________________________________________________________________________________________________________
United Kingdom (12.7%)
HSBC Holdings plc 30,448,577 251,089 British American Tobacco plc 2,830,182 191,217 Royal Dutch Shell plc Class A 6,724,479 174,625 BP plc 28,974,571 165,869 Royal Dutch Shell plc Class B 5,686,647 151,305 GlaxoSmithKline plc 7,455,288 150,059 AstraZeneca plc 1,915,938 114,745 Diageo plc 3,823,614 111,295 Vodafone Group plc 40,329,118 103,874 Unilever plc 1,831,851 94,246 Lloyds Banking Group plc 102,555,229 92,149 Reckitt Benckiser Group plc 954,426 87,939 Prudential plc 3,914,858 86,886 National Grid plc 5,724,977 74,129 Rio Tinto plc 1,836,038 72,432 Imperial Brands plc 1,462,244 71,611 Barclays plc 25,675,453 70,310 * Glencore plc 17,703,354 69,577 Shire plc 952,405 56,153 Compass Group plc 2,499,966 50,476 BT Group plc 12,704,157 50,117 BHP Billiton plc 3,206,653 48,886 Aviva plc 6,138,014 41,741 WPP plc 1,941,547 41,575 CRH plc (London Shares) 1,110,927 40,506 BAE Systems plc 4,800,228 38,987 * Standard Chartered plc 4,076,770 38,099 RELX NV (London Shares) 1,638,257 33,215 Experian plc 1,427,628 30,712 * Tesco plc 12,326,647 29,254 Legal & General Group plc 9,003,759 28,696 * Anglo American plc 1,985,959 28,434 SSE plc 1,543,373 27,803 Rolls-Royce Holdings plc 2,514,414 26,430 Shire plc ADR 138,156 24,448 Wolseley plc 382,364 24,302 Smith & Nephew plc 1,340,665 22,026 Centrica plc 8,319,977 21,320 London Stock Exchange Group plc 476,541 20,880 Sky plc 1,588,519 20,407 Associated British Foods plc 528,519 19,243 Old Mutual plc 7,426,535 18,652 * Royal Bank of Scotland Group plc 5,018,991 17,231 Land Securities Group plc 1,192,242 17,075 Carnival plc 275,649 16,989 Ashtead Group plc 764,964 16,138 Bunzl plc 506,570 15,792 InterContinental Hotels Group plc 297,876 15,788 ITV plc 5,697,463 15,495 Kingfisher plc 3,428,757 15,169 3i Group plc 1,454,121 14,944 Whitbread plc 277,510 14,499 Mondi plc 556,826 14,406 Sage Group plc 1,627,586 14,128 Standard Life plc 2,996,062 14,102 Persimmon plc 464,226 14,007 Burberry Group plc 669,824 13,998 Paddy Power Betfair plc 124,674 13,884 British Land Co. plc 1,552,357 13,200 United Utilities Group plc 1,034,526 13,037 Intertek Group plc 244,933 12,891 Taylor Wimpey plc 4,957,376 12,841 Smiths Group plc 596,187 12,674
41
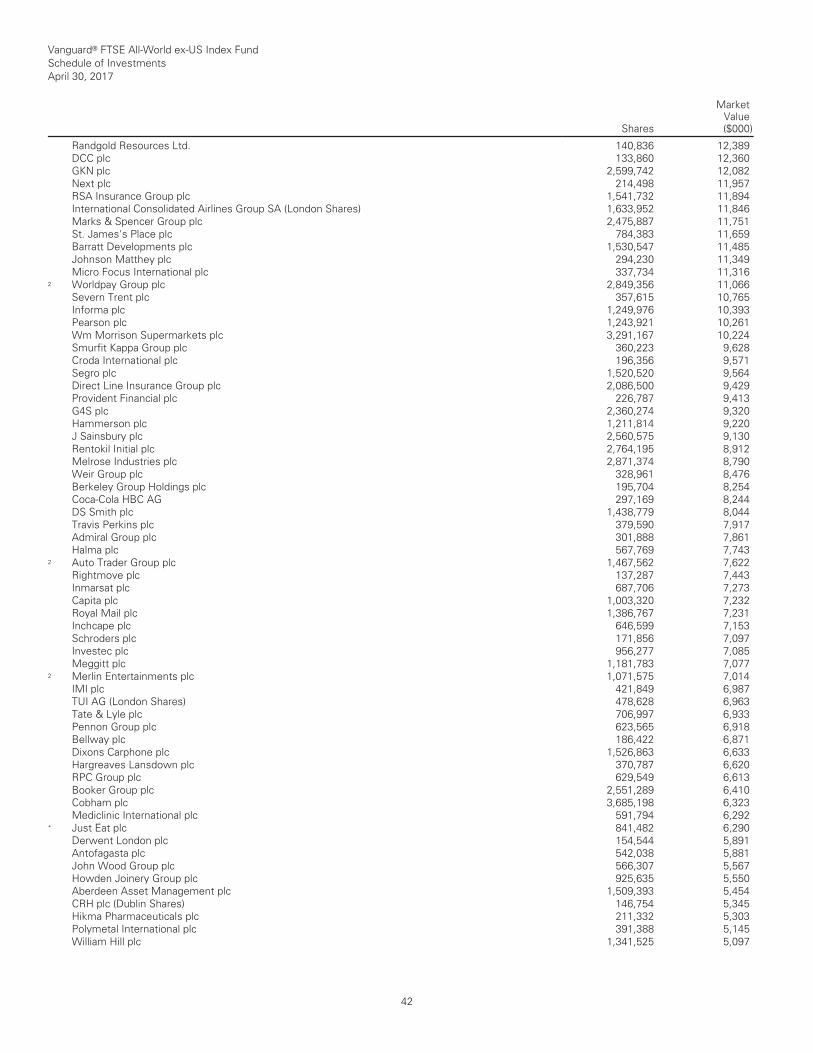
Vanguard® FTSE All-World ex-US Index Fund Schedule of Investments April 30, 2017
Shares
MarketValue($000)
__________________________________________________________________________________________________________________________________________________________________________________________________________________________________________________________________________________________________________________________________________________________________________________________________________________________________________________________________________________________________________________________________________________________________________________________________________________________________________________________________________________________ __________________________________________________________________________________________________________________________________________________________________________________________________________________________________________________________________________________________________________________________________________________________________________________________________________________________________________________________________________________________________________________________________________________________________________________________________________________________________________________________________________________________
Randgold Resources Ltd. 140,836 12,389 DCC plc 133,860 12,360 GKN plc 2,599,742 12,082 Next plc 214,498 11,957 RSA Insurance Group plc 1,541,732 11,894 International Consolidated Airlines Group SA (London Shares) 1,633,952 11,846 Marks & Spencer Group plc 2,475,887 11,751 St. James's Place plc 784,383 11,659 Barratt Developments plc 1,530,547 11,485 Johnson Matthey plc 294,230 11,349 Micro Focus International plc 337,734 11,316 2 Worldpay Group plc 2,849,356 11,066 Severn Trent plc 357,615 10,765 Informa plc 1,249,976 10,393 Pearson plc 1,243,921 10,261 Wm Morrison Supermarkets plc 3,291,167 10,224 Smurfit Kappa Group plc 360,223 9,628 Croda International plc 196,356 9,571 Segro plc 1,520,520 9,564 Direct Line Insurance Group plc 2,086,500 9,429 Provident Financial plc 226,787 9,413 G4S plc 2,360,274 9,320 Hammerson plc 1,211,814 9,220 J Sainsbury plc 2,560,575 9,130 Rentokil Initial plc 2,764,195 8,912 Melrose Industries plc 2,871,374 8,790 Weir Group plc 328,961 8,476 Berkeley Group Holdings plc 195,704 8,254 Coca-Cola HBC AG 297,169 8,244 DS Smith plc 1,438,779 8,044 Travis Perkins plc 379,590 7,917 Admiral Group plc 301,888 7,861 Halma plc 567,769 7,743 2 Auto Trader Group plc 1,467,562 7,622 Rightmove plc 137,287 7,443 Inmarsat plc 687,706 7,273 Capita plc 1,003,320 7,232 Royal Mail plc 1,386,767 7,231 Inchcape plc 646,599 7,153 Schroders plc 171,856 7,097 Investec plc 956,277 7,085 Meggitt plc 1,181,783 7,077 2 Merlin Entertainments plc 1,071,575 7,014 IMI plc 421,849 6,987 TUI AG (London Shares) 478,628 6,963 Tate & Lyle plc 706,997 6,933 Pennon Group plc 623,565 6,918 Bellway plc 186,422 6,871 Dixons Carphone plc 1,526,863 6,633 Hargreaves Lansdown plc 370,787 6,620 RPC Group plc 629,549 6,613 Booker Group plc 2,551,289 6,410 Cobham plc 3,685,198 6,323 Mediclinic International plc 591,794 6,292 * Just Eat plc 841,482 6,290 Derwent London plc 154,544 5,891 Antofagasta plc 542,038 5,881 John Wood Group plc 566,307 5,567 Howden Joinery Group plc 925,635 5,550 Aberdeen Asset Management plc 1,509,393 5,454 CRH plc (Dublin Shares) 146,754 5,345 Hikma Pharmaceuticals plc 211,332 5,303 Polymetal International plc 391,388 5,145 William Hill plc 1,341,525 5,097
42

Vanguard® FTSE All-World ex-US Index Fund Schedule of Investments April 30, 2017
Shares
MarketValue($000)
__________________________________________________________________________________________________________________________________________________________________________________________________________________________________________________________________________________________________________________________________________________________________________________________________________________________________________________________________________________________________________________________________________________________________________________________________________________________________________________________________________________________ __________________________________________________________________________________________________________________________________________________________________________________________________________________________________________________________________________________________________________________________________________________________________________________________________________________________________________________________________________________________________________________________________________________________________________________________________________________________________________________________________________________________
easyJet plc 331,712 5,018 * CYBG plc 1,357,041 4,954 Fresnillo plc 258,383 4,858 Intu Properties plc 1,346,925 4,811 Henderson Group plc 1,597,773 4,779 Capital & Counties Properties plc 1,143,251 4,675 Babcock International Group plc 385,791 4,494 Petrofac Ltd. 401,570 4,232 Aggreko plc 363,105 4,174 Daily Mail & General Trust plc 413,494 3,831 Ashmore Group plc 587,607 2,648 ___________ 3,806,107 __________________________________________________________________________________________________________________________________________________________________________________________________________________________________________________________________________________________________________________________________________________________________________________________________________________________________________________________________________________________________________________________________________________________________________________________________________________________________________________________________________________________ __________________________________________________________________________________________________________________________________________________________________________________________________________________________________________________________________________________________________________________________________________________________________________________________________________________________________________________________________________________________________________________________________________________________________________________________________________________________________________________________________________________________
Total Common Stocks (Cost $27,113,551) 29,661,630 __________________________________________________________________________________________________________________________________________________________________________________________________________________________________________________________________________________________________________________________________________________________________________________________________________________________________________________________________________________________________________________________________________________________________________________________________________________________________________________________________________________________ __________________________________________________________________________________________________________________________________________________________________________________________________________________________________________________________________________________________________________________________________________________________________________________________________________________________________________________________________________________________________________________________________________________________________________________________________________________________________________________________________________________________
Coupon __________________________________________________________________________________________________________________________________________________________________________________________________________________________________________________________________________________________________________________________________________________________________________________________________________________________________________________________________________________________________________________________________________________________________________________________________________________________________________________________________________________________ __________________________________________________________________________________________________________________________________________________________________________________________________________________________________________________________________________________________________________________________________________________________________________________________________________________________________________________________________________________________________________________________________________________________________________________________________________________________________________________________________________________________
Temporary Cash Investments (2.2%)1 __________________________________________________________________________________________________________________________________________________________________________________________________________________________________________________________________________________________________________________________________________________________________________________________________________________________________________________________________________________________________________________________________________________________________________________________________________________________________________________________________________________________ __________________________________________________________________________________________________________________________________________________________________________________________________________________________________________________________________________________________________________________________________________________________________________________________________________________________________________________________________________________________________________________________________________________________________________________________________________________________________________________________________________________________
Money Market Fund (2.1%)
5,6 Vanguard Market Liquidity Fund 1.034% 6,354,817 635,609
Maturity
Date
FaceAmount
($000) __________________________________________________________________________________________________________________________________________________________________________________________________________________________________________________________________________________________________________________________________________________________________________________________________________________________________________________________________________________________________________________________________________________________________________________________________________________________________________________________________________________________ __________________________________________________________________________________________________________________________________________________________________________________________________________________________________________________________________________________________________________________________________________________________________________________________________________________________________________________________________________________________________________________________________________________________________________________________________________________________________________________________________________________________
U.S. Government and Agency Obligations (0.1%)
7 United States Treasury Bill 0.566% 5/4/17 4,300 4,300 7 United States Treasury Bill 0.587%-0.591% 5/18/17 5,000 4,998 7 United States Treasury Bill 0.618% 5/25/17 6,000 5,997 ___________ 15,295 __________________________________________________________________________________________________________________________________________________________________________________________________________________________________________________________________________________________________________________________________________________________________________________________________________________________________________________________________________________________________________________________________________________________________________________________________________________________________________________________________________________________ __________________________________________________________________________________________________________________________________________________________________________________________________________________________________________________________________________________________________________________________________________________________________________________________________________________________________________________________________________________________________________________________________________________________________________________________________________________________________________________________________________________________
Total Temporary Cash Investments (Cost $650,847) 650,904 __________________________________________________________________________________________________________________________________________________________________________________________________________________________________________________________________________________________________________________________________________________________________________________________________________________________________________________________________________________________________________________________________________________________________________________________________________________________________________________________________________________________ __________________________________________________________________________________________________________________________________________________________________________________________________________________________________________________________________________________________________________________________________________________________________________________________________________________________________________________________________________________________________________________________________________________________________________________________________________________________________________________________________________________________
Total Investments (101.5%) (Cost $27,764,398) 30,312,534 __________________________________________________________________________________________________________________________________________________________________________________________________________________________________________________________________________________________________________________________________________________________________________________________________________________________________________________________________________________________________________________________________________________________________________________________________________________________________________________________________________________________ __________________________________________________________________________________________________________________________________________________________________________________________________________________________________________________________________________________________________________________________________________________________________________________________________________________________________________________________________________________________________________________________________________________________________________________________________________________________________________________________________________________________
Other Assets and Liabilities—Net (-1.5%)6 (454,940) __________________________________________________________________________________________________________________________________________________________________________________________________________________________________________________________________________________________________________________________________________________________________________________________________________________________________________________________________________________________________________________________________________________________________________________________________________________________________________________________________________________________ __________________________________________________________________________________________________________________________________________________________________________________________________________________________________________________________________________________________________________________________________________________________________________________________________________________________________________________________________________________________________________________________________________________________________________________________________________________________________________________________________________________________
Net Assets (100%) 29,857,594 __________________________________________________________________________________________________________________________________________________________________________________________________________________________________________________________________________________________________________________________________________________________________________________________________________________________________________________________________________________________________________________________________________________________________________________________________________________________________________________________________________________________ __________________________________________________________________________________________________________________________________________________________________________________________________________________________________________________________________________________________________________________________________________________________________________________________________________________________________________________________________________________________________________________________________________________________________________________________________________________________________________________________________________________________
* Non-income-producing security. ^ Includes partial security positions on loan to broker-dealers. The total value of securities on loan is $495,170,000. 1 The fund invests a portion of its cash reserves in equity markets through the use of index futures contracts. After giving effect to futures
investments, the fund's effective common stock and temporary cash investment positions represent 100.0% and 1.5%, respectively, of net assets.
2 Security exempt from registration under Rule 144A of the Securities Act of 1933. Such securities may be sold in transactions exempt from registration, normally to qualified institutional buyers. At April 30, 2017, the aggregate value of these securities was $208,314,000, representing 0.7% of net assets.
3 “Other” represents securities that are not classified by the fund’s benchmark index. 4 Considered an affiliated company of the fund as the issuer is another member of The Vanguard Group. 5 Affiliated money market fund available only to Vanguard funds and certain trusts and accounts managed by Vanguard. Rate shown is the 7-day
yield. 6 Includes $542,166,000 of collateral received for securities on loan. 7 Securities with a value of $10,781,000 have been segregated as initial margin for open futures contracts. ADR—American Depositary Receipt. GDR—Global Depositary Receipt. NVDR—Non-Voting Depository Receipt. REIT—Real Estate Investment Trust. __________________________________________________________________________________________________________________________________________________________________________________________________________________________________________________________________________________________________________________________________________________________________________________________________________________________________________________________________________________________________________________________________________________________________________________________________________________________________________________________________________________________ __________________________________________________________________________________________________________________________________________________________________________________________________________________________________________________________________________________________________________________________________________________________________________________________________________________________________________________________________________________________________________________________________________________________________________________________________________________________________________________________________________________________
43
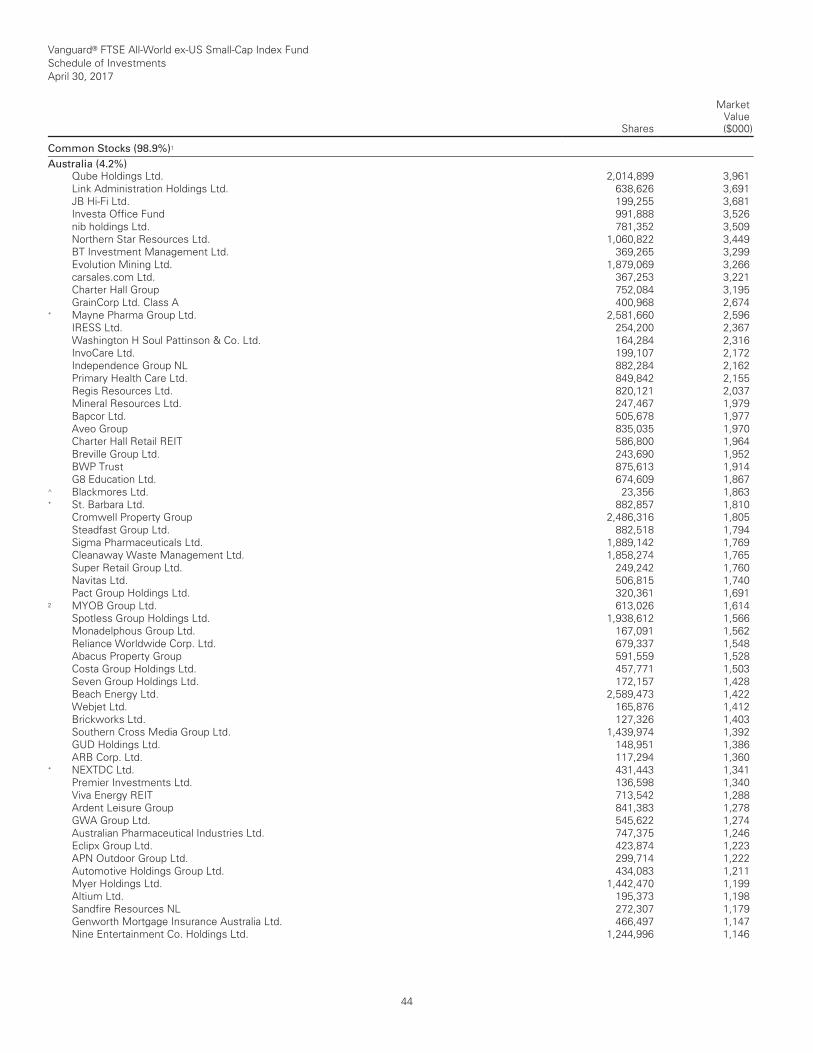
Vanguard® FTSE All-World ex-US Small-Cap Index Fund Schedule of Investments April 30, 2017
Shares
MarketValue($000)
__________________________________________________________________________________________________________________________________________________________________________________________________________________________________________________________________________________________________________________________________________________________________________________________________________________________________________________________________________________________________________________________________________________________________________________________________________________________________________________________________________________________ __________________________________________________________________________________________________________________________________________________________________________________________________________________________________________________________________________________________________________________________________________________________________________________________________________________________________________________________________________________________________________________________________________________________________________________________________________________________________________________________________________________________
Common Stocks (98.9%)1 __________________________________________________________________________________________________________________________________________________________________________________________________________________________________________________________________________________________________________________________________________________________________________________________________________________________________________________________________________________________________________________________________________________________________________________________________________________________________________________________________________________________ __________________________________________________________________________________________________________________________________________________________________________________________________________________________________________________________________________________________________________________________________________________________________________________________________________________________________________________________________________________________________________________________________________________________________________________________________________________________________________________________________________________________
Australia (4.2%)
Qube Holdings Ltd. 2,014,899 3,961 Link Administration Holdings Ltd. 638,626 3,691 JB Hi-Fi Ltd. 199,255 3,681 Investa Office Fund 991,888 3,526 nib holdings Ltd. 781,352 3,509 Northern Star Resources Ltd. 1,060,822 3,449 BT Investment Management Ltd. 369,265 3,299 Evolution Mining Ltd. 1,879,069 3,266 carsales.com Ltd. 367,253 3,221 Charter Hall Group 752,084 3,195 GrainCorp Ltd. Class A 400,968 2,674 * Mayne Pharma Group Ltd. 2,581,660 2,596 IRESS Ltd. 254,200 2,367 Washington H Soul Pattinson & Co. Ltd. 164,284 2,316 InvoCare Ltd. 199,107 2,172 Independence Group NL 882,284 2,162 Primary Health Care Ltd. 849,842 2,155 Regis Resources Ltd. 820,121 2,037 Mineral Resources Ltd. 247,467 1,979 Bapcor Ltd. 505,678 1,977 Aveo Group 835,035 1,970 Charter Hall Retail REIT 586,800 1,964 Breville Group Ltd. 243,690 1,952 BWP Trust 875,613 1,914 G8 Education Ltd. 674,609 1,867 ^ Blackmores Ltd. 23,356 1,863 * St. Barbara Ltd. 882,857 1,810 Cromwell Property Group 2,486,316 1,805 Steadfast Group Ltd. 882,518 1,794 Sigma Pharmaceuticals Ltd. 1,889,142 1,769 Cleanaway Waste Management Ltd. 1,858,274 1,765 Super Retail Group Ltd. 249,242 1,760 Navitas Ltd. 506,815 1,740 Pact Group Holdings Ltd. 320,361 1,691 2 MYOB Group Ltd. 613,026 1,614 Spotless Group Holdings Ltd. 1,938,612 1,566 Monadelphous Group Ltd. 167,091 1,562 Reliance Worldwide Corp. Ltd. 679,337 1,548 Abacus Property Group 591,559 1,528 Costa Group Holdings Ltd. 457,771 1,503 Seven Group Holdings Ltd. 172,157 1,428 Beach Energy Ltd. 2,589,473 1,422 Webjet Ltd. 165,876 1,412 Brickworks Ltd. 127,326 1,403 Southern Cross Media Group Ltd. 1,439,974 1,392 GUD Holdings Ltd. 148,951 1,386 ARB Corp. Ltd. 117,294 1,360 * NEXTDC Ltd. 431,443 1,341 Premier Investments Ltd. 136,598 1,340 Viva Energy REIT 713,542 1,288 Ardent Leisure Group 841,383 1,278 GWA Group Ltd. 545,622 1,274 Australian Pharmaceutical Industries Ltd. 747,375 1,246 Eclipx Group Ltd. 423,874 1,223 APN Outdoor Group Ltd. 299,714 1,222 Automotive Holdings Group Ltd. 434,083 1,211 Myer Holdings Ltd. 1,442,470 1,199 Altium Ltd. 195,373 1,198 Sandfire Resources NL 272,307 1,179 Genworth Mortgage Insurance Australia Ltd. 466,497 1,147 Nine Entertainment Co. Holdings Ltd. 1,244,996 1,146
44
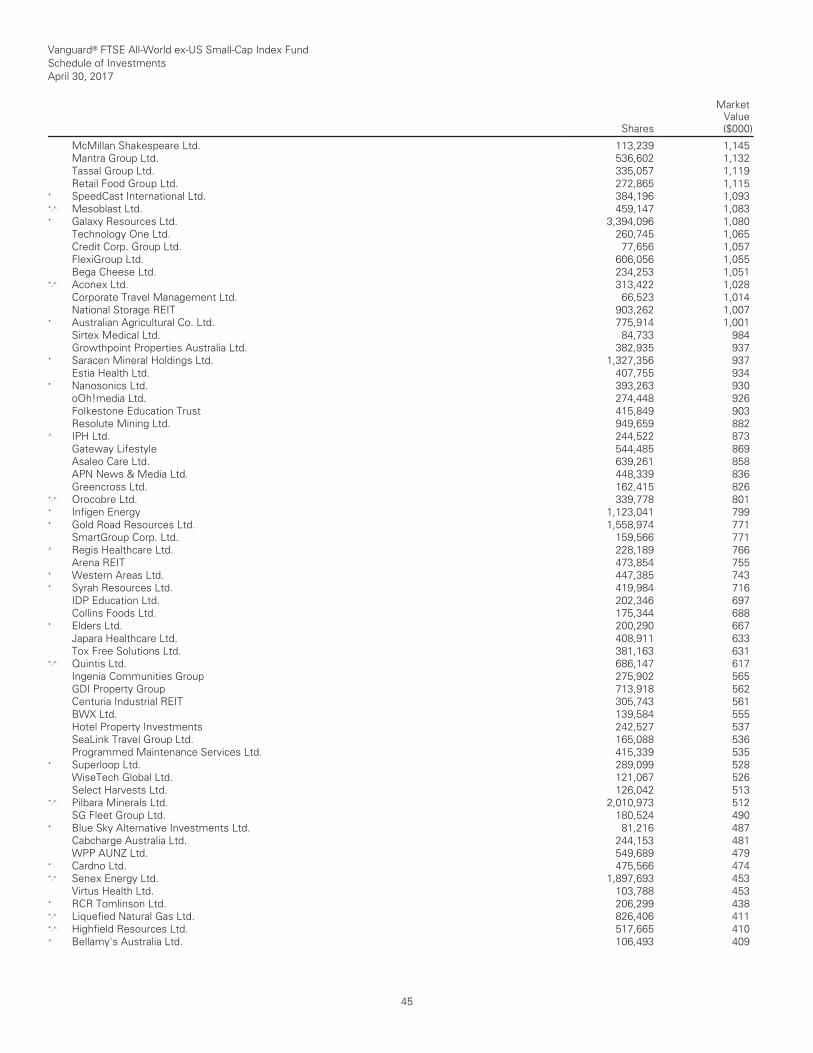
Vanguard® FTSE All-World ex-US Small-Cap Index Fund Schedule of Investments April 30, 2017
Shares
MarketValue($000)
__________________________________________________________________________________________________________________________________________________________________________________________________________________________________________________________________________________________________________________________________________________________________________________________________________________________________________________________________________________________________________________________________________________________________________________________________________________________________________________________________________________________ __________________________________________________________________________________________________________________________________________________________________________________________________________________________________________________________________________________________________________________________________________________________________________________________________________________________________________________________________________________________________________________________________________________________________________________________________________________________________________________________________________________________
McMillan Shakespeare Ltd. 113,239 1,145 Mantra Group Ltd. 536,602 1,132 Tassal Group Ltd. 335,057 1,119 Retail Food Group Ltd. 272,865 1,115 * SpeedCast International Ltd. 384,196 1,093 *,^ Mesoblast Ltd. 459,147 1,083 * Galaxy Resources Ltd. 3,394,096 1,080 Technology One Ltd. 260,745 1,065 Credit Corp. Group Ltd. 77,656 1,057 FlexiGroup Ltd. 606,056 1,055 Bega Cheese Ltd. 234,253 1,051 *,^ Aconex Ltd. 313,422 1,028 Corporate Travel Management Ltd. 66,523 1,014 National Storage REIT 903,262 1,007 * Australian Agricultural Co. Ltd. 775,914 1,001 Sirtex Medical Ltd. 84,733 984 Growthpoint Properties Australia Ltd. 382,935 937 * Saracen Mineral Holdings Ltd. 1,327,356 937 Estia Health Ltd. 407,755 934 * Nanosonics Ltd. 393,263 930 oOh!media Ltd. 274,448 926 Folkestone Education Trust 415,849 903 Resolute Mining Ltd. 949,659 882 ^ IPH Ltd. 244,522 873 Gateway Lifestyle 544,485 869 Asaleo Care Ltd. 639,261 858 APN News & Media Ltd. 448,339 836 Greencross Ltd. 162,415 826 *,^ Orocobre Ltd. 339,778 801 * Infigen Energy 1,123,041 799 * Gold Road Resources Ltd. 1,558,974 771 SmartGroup Corp. Ltd. 159,566 771 ^ Regis Healthcare Ltd. 228,189 766 Arena REIT 473,854 755 * Western Areas Ltd. 447,385 743 * Syrah Resources Ltd. 419,984 716 IDP Education Ltd. 202,346 697 Collins Foods Ltd. 175,344 688 * Elders Ltd. 200,290 667 Japara Healthcare Ltd. 408,911 633 Tox Free Solutions Ltd. 381,163 631 *,^ Quintis Ltd. 686,147 617 Ingenia Communities Group 275,902 565 GDI Property Group 713,918 562 Centuria Industrial REIT 305,743 561 BWX Ltd. 139,584 555 Hotel Property Investments 242,527 537 SeaLink Travel Group Ltd. 165,088 536 Programmed Maintenance Services Ltd. 415,339 535 * Superloop Ltd. 289,099 528 WiseTech Global Ltd. 121,067 526 Select Harvests Ltd. 126,042 513 *,^ Pilbara Minerals Ltd. 2,010,973 512 SG Fleet Group Ltd. 180,524 490 * Blue Sky Alternative Investments Ltd. 81,216 487 Cabcharge Australia Ltd. 244,153 481 WPP AUNZ Ltd. 549,689 479 * Cardno Ltd. 475,566 474 *,^ Senex Energy Ltd. 1,897,693 453 Virtus Health Ltd. 103,788 453 * RCR Tomlinson Ltd. 206,299 438 *,^ Liquefied Natural Gas Ltd. 826,406 411 *,^ Highfield Resources Ltd. 517,665 410 ^ Bellamy's Australia Ltd. 106,493 409
45
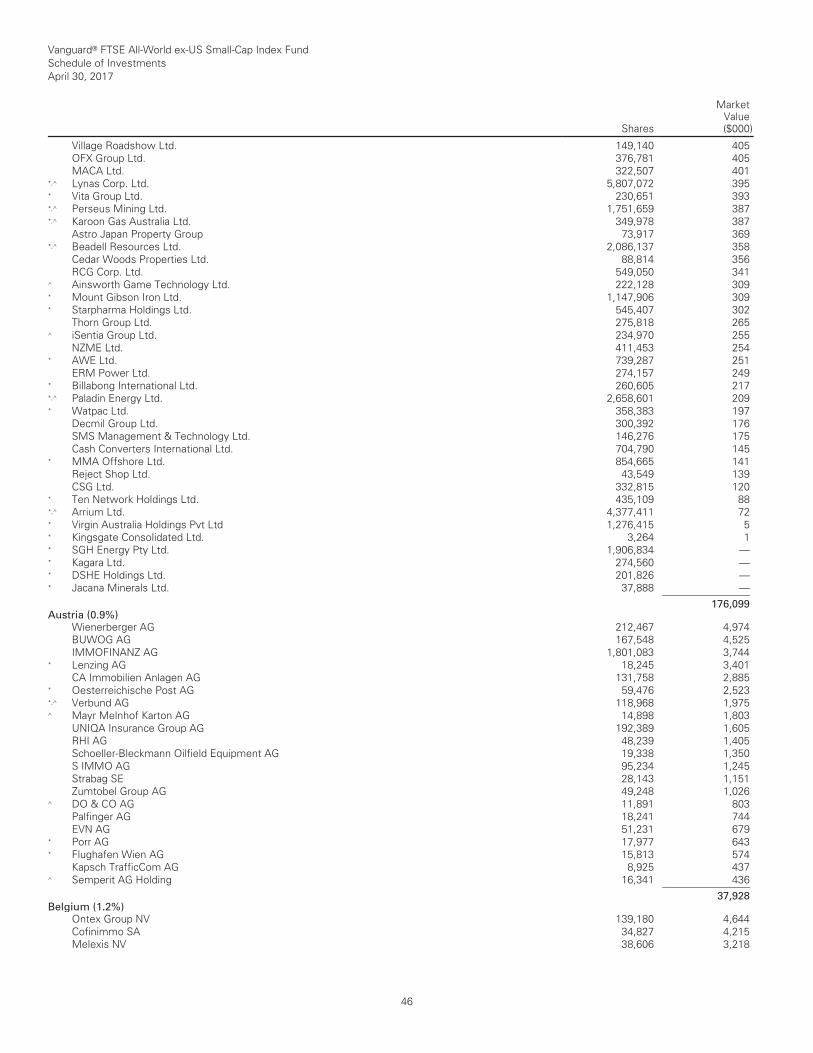
Vanguard® FTSE All-World ex-US Small-Cap Index Fund Schedule of Investments April 30, 2017
Shares
MarketValue($000)
__________________________________________________________________________________________________________________________________________________________________________________________________________________________________________________________________________________________________________________________________________________________________________________________________________________________________________________________________________________________________________________________________________________________________________________________________________________________________________________________________________________________ __________________________________________________________________________________________________________________________________________________________________________________________________________________________________________________________________________________________________________________________________________________________________________________________________________________________________________________________________________________________________________________________________________________________________________________________________________________________________________________________________________________________
Village Roadshow Ltd. 149,140 405 OFX Group Ltd. 376,781 405 MACA Ltd. 322,507 401 *,^ Lynas Corp. Ltd. 5,807,072 395 * Vita Group Ltd. 230,651 393 *,^ Perseus Mining Ltd. 1,751,659 387 *,^ Karoon Gas Australia Ltd. 349,978 387 Astro Japan Property Group 73,917 369 *,^ Beadell Resources Ltd. 2,086,137 358 Cedar Woods Properties Ltd. 88,814 356 RCG Corp. Ltd. 549,050 341 ^ Ainsworth Game Technology Ltd. 222,128 309 * Mount Gibson Iron Ltd. 1,147,906 309 * Starpharma Holdings Ltd. 545,407 302 Thorn Group Ltd. 275,818 265 ^ iSentia Group Ltd. 234,970 255 NZME Ltd. 411,453 254 * AWE Ltd. 739,287 251 ERM Power Ltd. 274,157 249 * Billabong International Ltd. 260,605 217 *,^ Paladin Energy Ltd. 2,658,601 209 * Watpac Ltd. 358,383 197 Decmil Group Ltd. 300,392 176 SMS Management & Technology Ltd. 146,276 175 Cash Converters International Ltd. 704,790 145 * MMA Offshore Ltd. 854,665 141 Reject Shop Ltd. 43,549 139 CSG Ltd. 332,815 120 * Ten Network Holdings Ltd. 435,109 88 *,^ Arrium Ltd. 4,377,411 72 * Virgin Australia Holdings Pvt Ltd 1,276,415 5 * Kingsgate Consolidated Ltd. 3,264 1 * SGH Energy Pty Ltd. 1,906,834 — * Kagara Ltd. 274,560 — * DSHE Holdings Ltd. 201,826 — * Jacana Minerals Ltd. 37,888 — ___________ 176,099 Austria (0.9%)
Wienerberger AG 212,467 4,974 BUWOG AG 167,548 4,525 IMMOFINANZ AG 1,801,083 3,744 * Lenzing AG 18,245 3,401 CA Immobilien Anlagen AG 131,758 2,885 * Oesterreichische Post AG 59,476 2,523 *,^ Verbund AG 118,968 1,975 ^ Mayr Melnhof Karton AG 14,898 1,803 UNIQA Insurance Group AG 192,389 1,605 RHI AG 48,239 1,405 Schoeller-Bleckmann Oilfield Equipment AG 19,338 1,350 S IMMO AG 95,234 1,245 Strabag SE 28,143 1,151 Zumtobel Group AG 49,248 1,026 ^ DO & CO AG 11,891 803 Palfinger AG 18,241 744 EVN AG 51,231 679 * Porr AG 17,977 643 * Flughafen Wien AG 15,813 574 Kapsch TrafficCom AG 8,925 437 ^ Semperit AG Holding 16,341 436 ___________ 37,928 Belgium (1.2%)
Ontex Group NV 139,180 4,644 Cofinimmo SA 34,827 4,215 Melexis NV 38,606 3,218
46

Vanguard® FTSE All-World ex-US Small-Cap Index Fund Schedule of Investments April 30, 2017
Shares
MarketValue($000)
__________________________________________________________________________________________________________________________________________________________________________________________________________________________________________________________________________________________________________________________________________________________________________________________________________________________________________________________________________________________________________________________________________________________________________________________________________________________________________________________________________________________ __________________________________________________________________________________________________________________________________________________________________________________________________________________________________________________________________________________________________________________________________________________________________________________________________________________________________________________________________________________________________________________________________________________________________________________________________________________________________________________________________________________________
Bekaert SA 62,439 3,143 * KBC Ancora 65,865 3,135 * Warehouses De Pauw CVA 29,493 2,822 Elia System Operator SA/NV 50,461 2,677 D'ieteren SA/NV 49,725 2,426 Aedifica SA 27,594 2,169 Ion Beam Applications 35,399 2,101 Gimv NV 31,677 1,933 Befimmo SA 32,768 1,912 Econocom Group SA/NV 116,498 1,873 Euronav NV 228,188 1,811 Cie d'Entreprises CFE 12,356 1,801 * Tessenderlo Chemie NV (Voting Shares) 42,147 1,730 * AGFA-Gevaert NV 307,676 1,562 Barco NV 15,449 1,522 Kinepolis Group NV 24,649 1,423 * Orange Belgium SA 50,649 1,057 *,^ Nyrstar (Voting Shares) 168,788 955 EVS Broadcast Equipment SA 16,923 682 Van de Velde NV 11,777 647 * Wereldhave Belgium NV 4,443 484 ___________ 49,942 Brazil (1.2%)
Qualicorp SA 394,500 2,809 Bradespar SA Preference Shares 406,500 2,542 MRV Engenharia e Participacoes SA 496,400 2,493 Fleury SA 138,856 2,298 TOTVS SA 257,900 2,259 * Cyrela Brazil Realty SA Empreendimentos e Participacoes 469,000 1,950 Cia Energetica de Sao Paulo Preference Shares 320,400 1,827 CVC Brasil Operadora e Agencia de Viagens SA 177,800 1,734 * Metalurgica Gerdau SA Preference Shares Class A 1,175,200 1,703 Cia Hering 245,200 1,701 Duratex SA 521,500 1,467 Cia de Saneamento do Parana Preference Shares 443,200 1,435 * Alupar Investimento SA 232,709 1,382 Banco do Estado do Rio Grande do Sul SA Preference Shares 298,950 1,338 Cia de Saneamento de Minas Gerais-COPASA 113,570 1,288 * Iguatemi Empresa de Shopping Centers SA 110,700 1,157 Linx SA 194,634 1,086 Aliansce Shopping Centers SA 224,203 1,065 Grendene SA 137,064 1,064 * B2W Cia Digital Common Shares 246,500 1,039 EcoRodovias Infraestrutura e Logistica SA 343,600 1,022 Alpargatas SA Preference Shares 243,602 1,021 Iochpe Maxion SA 180,190 949 * Eletropaulo Metropolitana Eletricidade de Sao Paulo SA Preference Shares 184,618 875 Via Varejo SA 232,500 872 * Light SA 123,500 850 Arezzo Industria e Comercio SA 72,600 771 Valid Solucoes e Servicos de Seguranca em Meios de Pagamento e Identificacao SA 108,911 770 * Marfrig Global Foods SA 316,012 719 * Minerva SA 223,000 710 Marcopolo SA Preference Shares 929,180 703 Ez Tec Empreendimentos e Participacoes SA 99,205 635 FPC Par Corretora de Seguros SA 103,900 619 * Gol Linhas Aereas Inteligentes SA Preference Shares 186,200 589 Tupy SA 120,731 580 * Magnesita Refratarios SA 61,840 529 SLC Agricola SA 78,400 484 Mahle-Metal Leve SA 72,900 464 * BR Properties SA 153,000 455 * Randon Participacoes SA Preference Shares 307,288 455 Dimed SA Distribuidora da Medicamentos 2,489 455
47
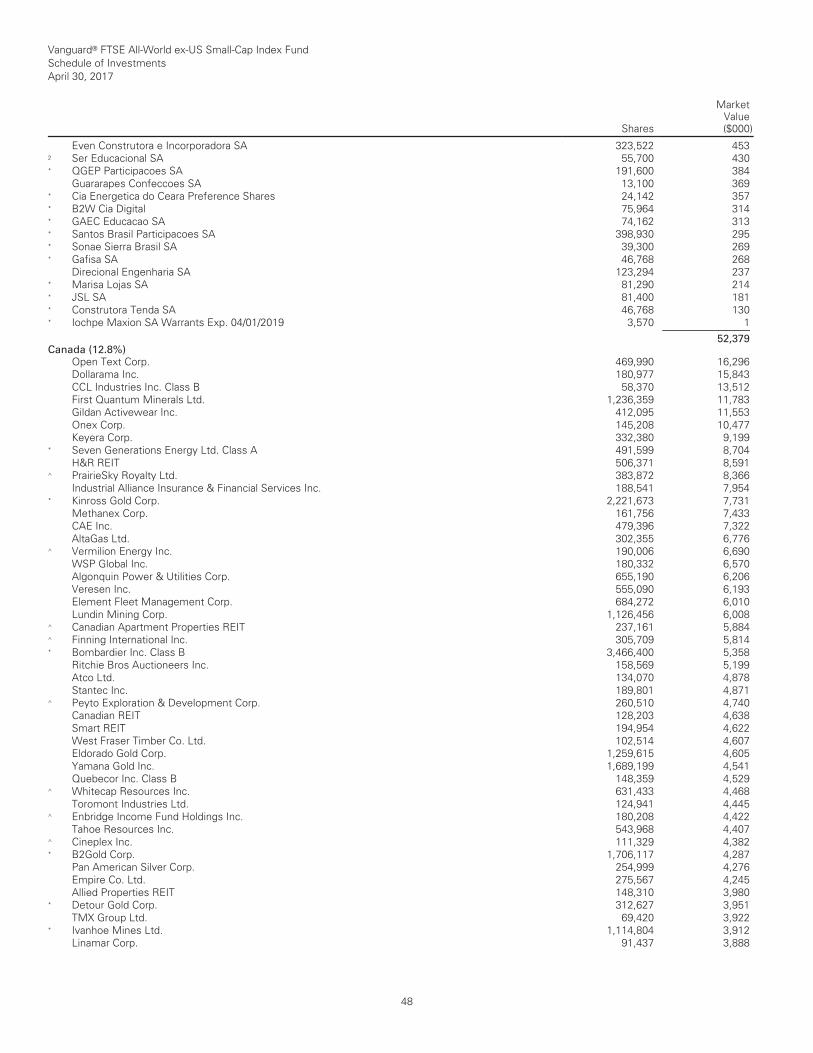
Vanguard® FTSE All-World ex-US Small-Cap Index Fund Schedule of Investments April 30, 2017
Shares
MarketValue($000)
__________________________________________________________________________________________________________________________________________________________________________________________________________________________________________________________________________________________________________________________________________________________________________________________________________________________________________________________________________________________________________________________________________________________________________________________________________________________________________________________________________________________ __________________________________________________________________________________________________________________________________________________________________________________________________________________________________________________________________________________________________________________________________________________________________________________________________________________________________________________________________________________________________________________________________________________________________________________________________________________________________________________________________________________________
Even Construtora e Incorporadora SA 323,522 453 2 Ser Educacional SA 55,700 430 * QGEP Participacoes SA 191,600 384 Guararapes Confeccoes SA 13,100 369 * Cia Energetica do Ceara Preference Shares 24,142 357 * B2W Cia Digital 75,964 314 * GAEC Educacao SA 74,162 313 * Santos Brasil Participacoes SA 398,930 295 * Sonae Sierra Brasil SA 39,300 269 * Gafisa SA 46,768 268 Direcional Engenharia SA 123,294 237 * Marisa Lojas SA 81,290 214 * JSL SA 81,400 181 * Construtora Tenda SA 46,768 130 * Iochpe Maxion SA Warrants Exp. 04/01/2019 3,570 1 ___________ 52,379 Canada (12.8%)
Open Text Corp. 469,990 16,296 Dollarama Inc. 180,977 15,843 CCL Industries Inc. Class B 58,370 13,512 First Quantum Minerals Ltd. 1,236,359 11,783 Gildan Activewear Inc. 412,095 11,553 Onex Corp. 145,208 10,477 Keyera Corp. 332,380 9,199 * Seven Generations Energy Ltd. Class A 491,599 8,704 H&R REIT 506,371 8,591 ^ PrairieSky Royalty Ltd. 383,872 8,366 Industrial Alliance Insurance & Financial Services Inc. 188,541 7,954 * Kinross Gold Corp. 2,221,673 7,731 Methanex Corp. 161,756 7,433 CAE Inc. 479,396 7,322 AltaGas Ltd. 302,355 6,776 ^ Vermilion Energy Inc. 190,006 6,690 WSP Global Inc. 180,332 6,570 Algonquin Power & Utilities Corp. 655,190 6,206 Veresen Inc. 555,090 6,193 Element Fleet Management Corp. 684,272 6,010 Lundin Mining Corp. 1,126,456 6,008 ^ Canadian Apartment Properties REIT 237,161 5,884 ^ Finning International Inc. 305,709 5,814 * Bombardier Inc. Class B 3,466,400 5,358 Ritchie Bros Auctioneers Inc. 158,569 5,199 Atco Ltd. 134,070 4,878 Stantec Inc. 189,801 4,871 ^ Peyto Exploration & Development Corp. 260,510 4,740 Canadian REIT 128,203 4,638 Smart REIT 194,954 4,622 West Fraser Timber Co. Ltd. 102,514 4,607 Eldorado Gold Corp. 1,259,615 4,605 Yamana Gold Inc. 1,689,199 4,541 Quebecor Inc. Class B 148,359 4,529 ^ Whitecap Resources Inc. 631,433 4,468 Toromont Industries Ltd. 124,941 4,445 ^ Enbridge Income Fund Holdings Inc. 180,208 4,422 Tahoe Resources Inc. 543,968 4,407 ^ Cineplex Inc. 111,329 4,382 * B2Gold Corp. 1,706,117 4,287 Pan American Silver Corp. 254,999 4,276 Empire Co. Ltd. 275,567 4,245 Allied Properties REIT 148,310 3,980 * Detour Gold Corp. 312,627 3,951 TMX Group Ltd. 69,420 3,922 * Ivanhoe Mines Ltd. 1,114,804 3,912 Linamar Corp. 91,437 3,888
48
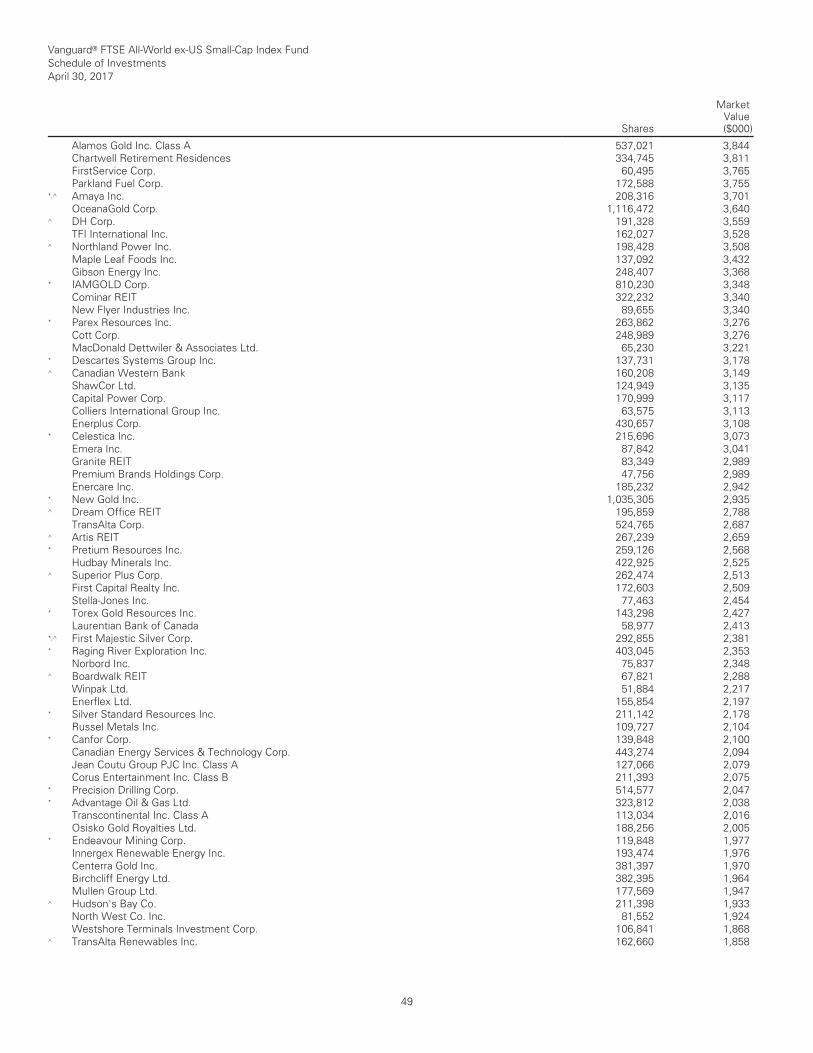
Vanguard® FTSE All-World ex-US Small-Cap Index Fund Schedule of Investments April 30, 2017
Shares
MarketValue($000)
__________________________________________________________________________________________________________________________________________________________________________________________________________________________________________________________________________________________________________________________________________________________________________________________________________________________________________________________________________________________________________________________________________________________________________________________________________________________________________________________________________________________ __________________________________________________________________________________________________________________________________________________________________________________________________________________________________________________________________________________________________________________________________________________________________________________________________________________________________________________________________________________________________________________________________________________________________________________________________________________________________________________________________________________________
Alamos Gold Inc. Class A 537,021 3,844 Chartwell Retirement Residences 334,745 3,811 FirstService Corp. 60,495 3,765 Parkland Fuel Corp. 172,588 3,755 *,^ Amaya Inc. 208,316 3,701 OceanaGold Corp. 1,116,472 3,640 ^ DH Corp. 191,328 3,559 TFI International Inc. 162,027 3,528 ^ Northland Power Inc. 198,428 3,508 Maple Leaf Foods Inc. 137,092 3,432 Gibson Energy Inc. 248,407 3,368 * IAMGOLD Corp. 810,230 3,348 Cominar REIT 322,232 3,340 New Flyer Industries Inc. 89,655 3,340 * Parex Resources Inc. 263,862 3,276 Cott Corp. 248,989 3,276 MacDonald Dettwiler & Associates Ltd. 65,230 3,221 * Descartes Systems Group Inc. 137,731 3,178 ^ Canadian Western Bank 160,208 3,149 ShawCor Ltd. 124,949 3,135 Capital Power Corp. 170,999 3,117 Colliers International Group Inc. 63,575 3,113 Enerplus Corp. 430,657 3,108 * Celestica Inc. 215,696 3,073 Emera Inc. 87,842 3,041 Granite REIT 83,349 2,989 Premium Brands Holdings Corp. 47,756 2,989 Enercare Inc. 185,232 2,942 * New Gold Inc. 1,035,305 2,935 ^ Dream Office REIT 195,859 2,788 TransAlta Corp. 524,765 2,687 ^ Artis REIT 267,239 2,659 * Pretium Resources Inc. 259,126 2,568 Hudbay Minerals Inc. 422,925 2,525 ^ Superior Plus Corp. 262,474 2,513 First Capital Realty Inc. 172,603 2,509 Stella-Jones Inc. 77,463 2,454 * Torex Gold Resources Inc. 143,298 2,427 Laurentian Bank of Canada 58,977 2,413 *,^ First Majestic Silver Corp. 292,855 2,381 * Raging River Exploration Inc. 403,045 2,353 Norbord Inc. 75,837 2,348 ^ Boardwalk REIT 67,821 2,288 Winpak Ltd. 51,884 2,217 Enerflex Ltd. 155,854 2,197 * Silver Standard Resources Inc. 211,142 2,178 Russel Metals Inc. 109,727 2,104 * Canfor Corp. 139,848 2,100 Canadian Energy Services & Technology Corp. 443,274 2,094 Jean Coutu Group PJC Inc. Class A 127,066 2,079 Corus Entertainment Inc. Class B 211,393 2,075 * Precision Drilling Corp. 514,577 2,047 * Advantage Oil & Gas Ltd. 323,812 2,038 Transcontinental Inc. Class A 113,034 2,016 Osisko Gold Royalties Ltd. 188,256 2,005 * Endeavour Mining Corp. 119,848 1,977 Innergex Renewable Energy Inc. 193,474 1,976 Centerra Gold Inc. 381,397 1,970 Birchcliff Energy Ltd. 382,395 1,964 Mullen Group Ltd. 177,569 1,947 ^ Hudson's Bay Co. 211,398 1,933 North West Co. Inc. 81,552 1,924 Westshore Terminals Investment Corp. 106,841 1,868 ^ TransAlta Renewables Inc. 162,660 1,858
49
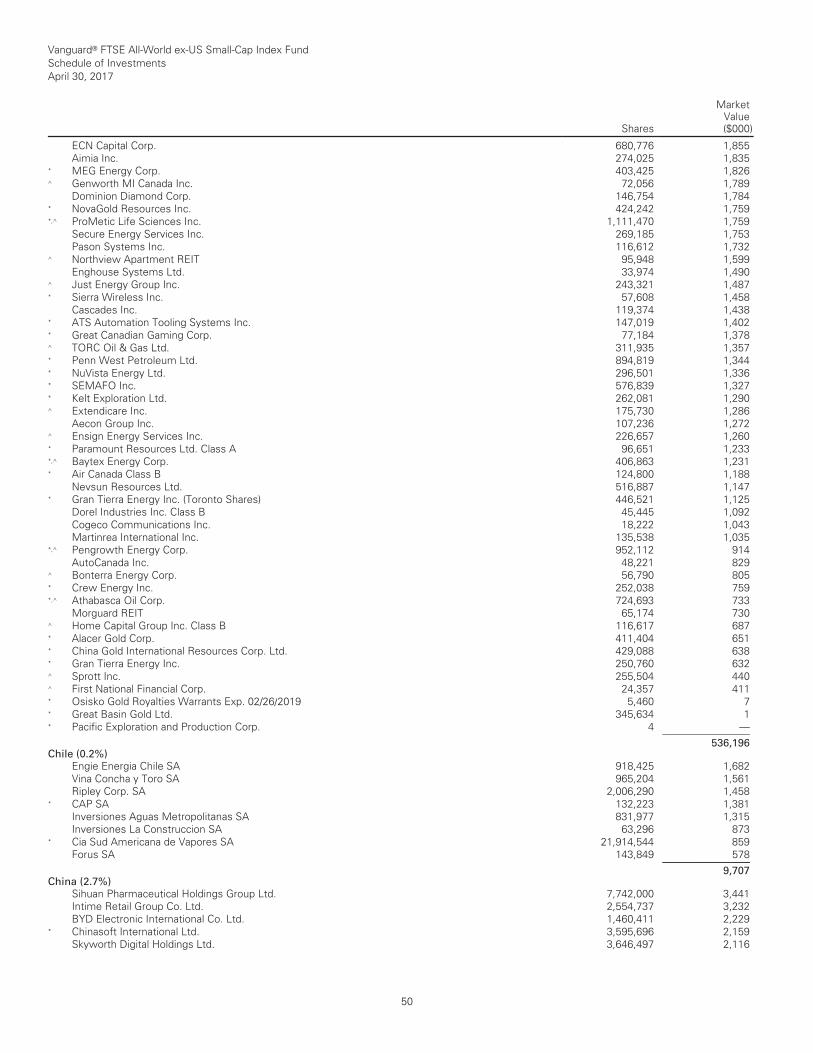
Vanguard® FTSE All-World ex-US Small-Cap Index Fund Schedule of Investments April 30, 2017
Shares
MarketValue($000)
__________________________________________________________________________________________________________________________________________________________________________________________________________________________________________________________________________________________________________________________________________________________________________________________________________________________________________________________________________________________________________________________________________________________________________________________________________________________________________________________________________________________ __________________________________________________________________________________________________________________________________________________________________________________________________________________________________________________________________________________________________________________________________________________________________________________________________________________________________________________________________________________________________________________________________________________________________________________________________________________________________________________________________________________________
ECN Capital Corp. 680,776 1,855 Aimia Inc. 274,025 1,835 * MEG Energy Corp. 403,425 1,826 ^ Genworth MI Canada Inc. 72,056 1,789 Dominion Diamond Corp. 146,754 1,784 * NovaGold Resources Inc. 424,242 1,759 *,^ ProMetic Life Sciences Inc. 1,111,470 1,759 Secure Energy Services Inc. 269,185 1,753 Pason Systems Inc. 116,612 1,732 ^ Northview Apartment REIT 95,948 1,599 Enghouse Systems Ltd. 33,974 1,490 ^ Just Energy Group Inc. 243,321 1,487 * Sierra Wireless Inc. 57,608 1,458 Cascades Inc. 119,374 1,438 * ATS Automation Tooling Systems Inc. 147,019 1,402 * Great Canadian Gaming Corp. 77,184 1,378 ^ TORC Oil & Gas Ltd. 311,935 1,357 * Penn West Petroleum Ltd. 894,819 1,344 * NuVista Energy Ltd. 296,501 1,336 * SEMAFO Inc. 576,839 1,327 * Kelt Exploration Ltd. 262,081 1,290 ^ Extendicare Inc. 175,730 1,286 Aecon Group Inc. 107,236 1,272 ^ Ensign Energy Services Inc. 226,657 1,260 * Paramount Resources Ltd. Class A 96,651 1,233 *,^ Baytex Energy Corp. 406,863 1,231 * Air Canada Class B 124,800 1,188 Nevsun Resources Ltd. 516,887 1,147 * Gran Tierra Energy Inc. (Toronto Shares) 446,521 1,125 Dorel Industries Inc. Class B 45,445 1,092 Cogeco Communications Inc. 18,222 1,043 Martinrea International Inc. 135,538 1,035 *,^ Pengrowth Energy Corp. 952,112 914 AutoCanada Inc. 48,221 829 ^ Bonterra Energy Corp. 56,790 805 * Crew Energy Inc. 252,038 759 *,^ Athabasca Oil Corp. 724,693 733 Morguard REIT 65,174 730 ^ Home Capital Group Inc. Class B 116,617 687 * Alacer Gold Corp. 411,404 651 * China Gold International Resources Corp. Ltd. 429,088 638 * Gran Tierra Energy Inc. 250,760 632 ^ Sprott Inc. 255,504 440 ^ First National Financial Corp. 24,357 411 * Osisko Gold Royalties Warrants Exp. 02/26/2019 5,460 7 * Great Basin Gold Ltd. 345,634 1 * Pacific Exploration and Production Corp. 4 — ___________ 536,196 Chile (0.2%)
Engie Energia Chile SA 918,425 1,682 Vina Concha y Toro SA 965,204 1,561 Ripley Corp. SA 2,006,290 1,458 * CAP SA 132,223 1,381 Inversiones Aguas Metropolitanas SA 831,977 1,315 Inversiones La Construccion SA 63,296 873 * Cia Sud Americana de Vapores SA 21,914,544 859 Forus SA 143,849 578 ___________ 9,707 China (2.7%)
Sihuan Pharmaceutical Holdings Group Ltd. 7,742,000 3,441 Intime Retail Group Co. Ltd. 2,554,737 3,232 BYD Electronic International Co. Ltd. 1,460,411 2,229 * Chinasoft International Ltd. 3,595,696 2,159 Skyworth Digital Holdings Ltd. 3,646,497 2,116
50
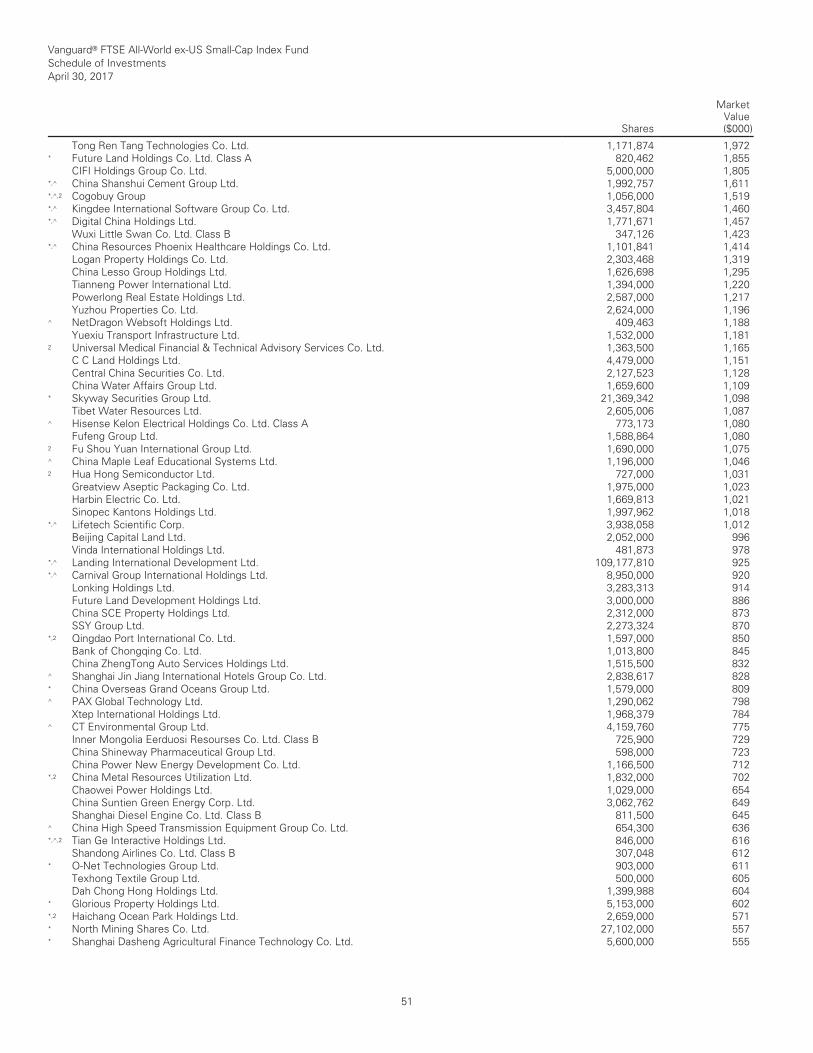
Vanguard® FTSE All-World ex-US Small-Cap Index Fund Schedule of Investments April 30, 2017
Shares
MarketValue($000)
__________________________________________________________________________________________________________________________________________________________________________________________________________________________________________________________________________________________________________________________________________________________________________________________________________________________________________________________________________________________________________________________________________________________________________________________________________________________________________________________________________________________ __________________________________________________________________________________________________________________________________________________________________________________________________________________________________________________________________________________________________________________________________________________________________________________________________________________________________________________________________________________________________________________________________________________________________________________________________________________________________________________________________________________________
Tong Ren Tang Technologies Co. Ltd. 1,171,874 1,972 * Future Land Holdings Co. Ltd. Class A 820,462 1,855 CIFI Holdings Group Co. Ltd. 5,000,000 1,805 *,^ China Shanshui Cement Group Ltd. 1,992,757 1,611 *,^,2 Cogobuy Group 1,056,000 1,519 *,^ Kingdee International Software Group Co. Ltd. 3,457,804 1,460 *,^ Digital China Holdings Ltd. 1,771,671 1,457 Wuxi Little Swan Co. Ltd. Class B 347,126 1,423 *,^ China Resources Phoenix Healthcare Holdings Co. Ltd. 1,101,841 1,414 Logan Property Holdings Co. Ltd. 2,303,468 1,319 China Lesso Group Holdings Ltd. 1,626,698 1,295 Tianneng Power International Ltd. 1,394,000 1,220 Powerlong Real Estate Holdings Ltd. 2,587,000 1,217 Yuzhou Properties Co. Ltd. 2,624,000 1,196 ^ NetDragon Websoft Holdings Ltd. 409,463 1,188 Yuexiu Transport Infrastructure Ltd. 1,532,000 1,181 2 Universal Medical Financial & Technical Advisory Services Co. Ltd. 1,363,500 1,165 C C Land Holdings Ltd. 4,479,000 1,151 Central China Securities Co. Ltd. 2,127,523 1,128 China Water Affairs Group Ltd. 1,659,600 1,109 * Skyway Securities Group Ltd. 21,369,342 1,098 Tibet Water Resources Ltd. 2,605,006 1,087 ^ Hisense Kelon Electrical Holdings Co. Ltd. Class A 773,173 1,080 Fufeng Group Ltd. 1,588,864 1,080 2 Fu Shou Yuan International Group Ltd. 1,690,000 1,075 ^ China Maple Leaf Educational Systems Ltd. 1,196,000 1,046 2 Hua Hong Semiconductor Ltd. 727,000 1,031 Greatview Aseptic Packaging Co. Ltd. 1,975,000 1,023 Harbin Electric Co. Ltd. 1,669,813 1,021 Sinopec Kantons Holdings Ltd. 1,997,962 1,018 *,^ Lifetech Scientific Corp. 3,938,058 1,012 Beijing Capital Land Ltd. 2,052,000 996 Vinda International Holdings Ltd. 481,873 978 *,^ Landing International Development Ltd. 109,177,810 925 *,^ Carnival Group International Holdings Ltd. 8,950,000 920 Lonking Holdings Ltd. 3,283,313 914 Future Land Development Holdings Ltd. 3,000,000 886 China SCE Property Holdings Ltd. 2,312,000 873 SSY Group Ltd. 2,273,324 870 *,2 Qingdao Port International Co. Ltd. 1,597,000 850 Bank of Chongqing Co. Ltd. 1,013,800 845 China ZhengTong Auto Services Holdings Ltd. 1,515,500 832 ^ Shanghai Jin Jiang International Hotels Group Co. Ltd. 2,838,617 828 * China Overseas Grand Oceans Group Ltd. 1,579,000 809 ^ PAX Global Technology Ltd. 1,290,062 798 Xtep International Holdings Ltd. 1,968,379 784 ^ CT Environmental Group Ltd. 4,159,760 775 Inner Mongolia Eerduosi Resourses Co. Ltd. Class B 725,900 729 China Shineway Pharmaceutical Group Ltd. 598,000 723 China Power New Energy Development Co. Ltd. 1,166,500 712 *,2 China Metal Resources Utilization Ltd. 1,832,000 702 Chaowei Power Holdings Ltd. 1,029,000 654 China Suntien Green Energy Corp. Ltd. 3,062,762 649 Shanghai Diesel Engine Co. Ltd. Class B 811,500 645 ^ China High Speed Transmission Equipment Group Co. Ltd. 654,300 636 *,^,2 Tian Ge Interactive Holdings Ltd. 846,000 616 Shandong Airlines Co. Ltd. Class B 307,048 612 * O-Net Technologies Group Ltd. 903,000 611 Texhong Textile Group Ltd. 500,000 605 Dah Chong Hong Holdings Ltd. 1,399,988 604 * Glorious Property Holdings Ltd. 5,153,000 602 *,2 Haichang Ocean Park Holdings Ltd. 2,659,000 571 * North Mining Shares Co. Ltd. 27,102,000 557 * Shanghai Dasheng Agricultural Finance Technology Co. Ltd. 5,600,000 555
51
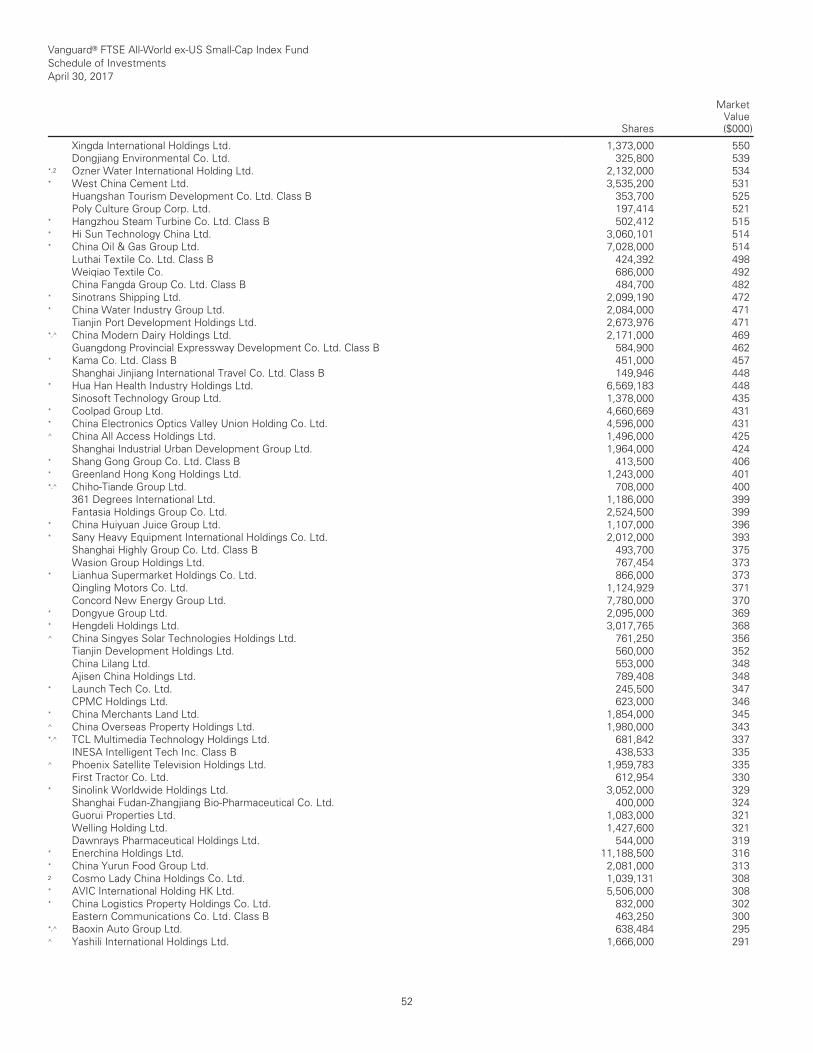
Vanguard® FTSE All-World ex-US Small-Cap Index Fund Schedule of Investments April 30, 2017
Shares
MarketValue($000)
__________________________________________________________________________________________________________________________________________________________________________________________________________________________________________________________________________________________________________________________________________________________________________________________________________________________________________________________________________________________________________________________________________________________________________________________________________________________________________________________________________________________ __________________________________________________________________________________________________________________________________________________________________________________________________________________________________________________________________________________________________________________________________________________________________________________________________________________________________________________________________________________________________________________________________________________________________________________________________________________________________________________________________________________________
Xingda International Holdings Ltd. 1,373,000 550 Dongjiang Environmental Co. Ltd. 325,800 539 *,2 Ozner Water International Holding Ltd. 2,132,000 534 * West China Cement Ltd. 3,535,200 531 Huangshan Tourism Development Co. Ltd. Class B 353,700 525 Poly Culture Group Corp. Ltd. 197,414 521 * Hangzhou Steam Turbine Co. Ltd. Class B 502,412 515 * Hi Sun Technology China Ltd. 3,060,101 514 * China Oil & Gas Group Ltd. 7,028,000 514 Luthai Textile Co. Ltd. Class B 424,392 498 Weiqiao Textile Co. 686,000 492 China Fangda Group Co. Ltd. Class B 484,700 482 * Sinotrans Shipping Ltd. 2,099,190 472 * China Water Industry Group Ltd. 2,084,000 471 Tianjin Port Development Holdings Ltd. 2,673,976 471 *,^ China Modern Dairy Holdings Ltd. 2,171,000 469 Guangdong Provincial Expressway Development Co. Ltd. Class B 584,900 462 * Kama Co. Ltd. Class B 451,000 457 Shanghai Jinjiang International Travel Co. Ltd. Class B 149,946 448 * Hua Han Health Industry Holdings Ltd. 6,569,183 448 Sinosoft Technology Group Ltd. 1,378,000 435 * Coolpad Group Ltd. 4,660,669 431 * China Electronics Optics Valley Union Holding Co. Ltd. 4,596,000 431 ^ China All Access Holdings Ltd. 1,496,000 425 Shanghai Industrial Urban Development Group Ltd. 1,964,000 424 * Shang Gong Group Co. Ltd. Class B 413,500 406 * Greenland Hong Kong Holdings Ltd. 1,243,000 401 *,^ Chiho-Tiande Group Ltd. 708,000 400 361 Degrees International Ltd. 1,186,000 399 Fantasia Holdings Group Co. Ltd. 2,524,500 399 * China Huiyuan Juice Group Ltd. 1,107,000 396 * Sany Heavy Equipment International Holdings Co. Ltd. 2,012,000 393 Shanghai Highly Group Co. Ltd. Class B 493,700 375 Wasion Group Holdings Ltd. 767,454 373 * Lianhua Supermarket Holdings Co. Ltd. 866,000 373 Qingling Motors Co. Ltd. 1,124,929 371 Concord New Energy Group Ltd. 7,780,000 370 * Dongyue Group Ltd. 2,095,000 369 * Hengdeli Holdings Ltd. 3,017,765 368 ^ China Singyes Solar Technologies Holdings Ltd. 761,250 356 Tianjin Development Holdings Ltd. 560,000 352 China Lilang Ltd. 553,000 348 Ajisen China Holdings Ltd. 789,408 348 * Launch Tech Co. Ltd. 245,500 347 CPMC Holdings Ltd. 623,000 346 * China Merchants Land Ltd. 1,854,000 345 ^ China Overseas Property Holdings Ltd. 1,980,000 343 *,^ TCL Multimedia Technology Holdings Ltd. 681,842 337 INESA Intelligent Tech Inc. Class B 438,533 335 ^ Phoenix Satellite Television Holdings Ltd. 1,959,783 335 First Tractor Co. Ltd. 612,954 330 * Sinolink Worldwide Holdings Ltd. 3,052,000 329 Shanghai Fudan-Zhangjiang Bio-Pharmaceutical Co. Ltd. 400,000 324 Guorui Properties Ltd. 1,083,000 321 Welling Holding Ltd. 1,427,600 321 Dawnrays Pharmaceutical Holdings Ltd. 544,000 319 * Enerchina Holdings Ltd. 11,188,500 316 * China Yurun Food Group Ltd. 2,081,000 313 2 Cosmo Lady China Holdings Co. Ltd. 1,039,131 308 * AVIC International Holding HK Ltd. 5,506,000 308 * China Logistics Property Holdings Co. Ltd. 832,000 302 Eastern Communications Co. Ltd. Class B 463,250 300 *,^ Baoxin Auto Group Ltd. 638,484 295 ^ Yashili International Holdings Ltd. 1,666,000 291
52

Vanguard® FTSE All-World ex-US Small-Cap Index Fund Schedule of Investments April 30, 2017
Shares
MarketValue($000)
__________________________________________________________________________________________________________________________________________________________________________________________________________________________________________________________________________________________________________________________________________________________________________________________________________________________________________________________________________________________________________________________________________________________________________________________________________________________________________________________________________________________ __________________________________________________________________________________________________________________________________________________________________________________________________________________________________________________________________________________________________________________________________________________________________________________________________________________________________________________________________________________________________________________________________________________________________________________________________________________________________________________________________________________________
* Shanghai Phoenix Enterprise Group Co. Ltd. Class B 281,100 288 Comba Telecom Systems Holdings Ltd. 1,953,959 286 * Shanghai Zhongyida Co. Ltd. Class B 618,000 283 * PW Medtech Group Ltd. 1,151,000 273 Huaxin Cement Co. Ltd. Class B 341,160 272 * China Chengtong Development Group Ltd. 4,216,000 262 Zhonglu Co. Ltd. Class B 144,600 261 * Shanghai Greencourt Investment Group Co. Ltd. Class B 432,900 250 2 Beijing Urban Construction Design & Development Group Co. Ltd. 406,000 247 *,^ National Agricultural Holdings Ltd. 1,560,000 239 Colour Life Services Group Co. Ltd. 404,000 239 Xiamen International Port Co. Ltd. 1,177,000 234 Minmetals Land Ltd. 1,918,000 234 Xinhua Winshare Publishing and Media Co. Ltd. 261,600 232 Tiangong International Co. Ltd. 2,289,478 226 ^ China Electronics Corp. Holdings Co. Ltd. 1,202,000 225 * Mingfa Group International Co. Ltd. 915,541 222 Hilong Holding Ltd. 1,009,000 220 Chongqing Machinery & Electric Co. Ltd. 1,612,000 211 * Shougang Concord International Enterprises Co. Ltd. 6,497,116 206 * Capital Environment Holdings Ltd. 6,830,000 201 * MIE Holdings Corp. 2,088,000 201 * China Fiber Optic Network System Group Ltd. 2,215,200 199 * SRE Group Ltd. 8,228,302 199 2 Kangda International Environmental Co. Ltd. 827,111 192 * China Minsheng Drawin Technology Group Ltd. 5,460,000 173 * Loudong General Nice Resources China Holdings Ltd. 3,378,000 172 * Xinjiang Xinxin Mining Industry Co. Ltd. 1,379,000 168 * China Rare Earth Holdings Ltd. 2,300,548 165 Foshan Huaxin Packaging Co. Ltd. Class B 135,000 164 * Daphne International Holdings Ltd. 1,641,996 162 Dalian Refrigeration Co. Ltd. Class B 194,900 154 * Shanghai Potevio Co. Ltd. Class B 188,700 154 * V1 Group Ltd. 4,985,484 154 * China Soft Power Technology Holdings Ltd. 5,152,000 152 Hefei Meiling Co. Ltd. Class B 267,360 152 *,^ Wisdom Sports Group 694,000 144 *,^ China Dynamics Holdings Ltd. 4,458,752 142 *,^ Maoye International Holdings Ltd. 1,298,459 140 Real Nutriceutical Group Ltd. 2,323,000 136 *,^ Munsun Capital Group Ltd. 14,046,936 135 Changchai Co. Ltd. Class B 238,200 134 * Tech Pro Technology Development Ltd. 7,954,800 133 *,^ Boer Power Holdings Ltd. 389,000 133 * Anxin-China Holdings Ltd. 2,621,200 130 *,^ Chongqing Iron & Steel Co. Ltd. 813,500 130 * Shenzhen Wongtee International Enterprise Co. Ltd. Class B 223,180 129 Fiyta Holdings Ltd. Class B 130,809 117 ^ E-Commodities Holdings Ltd. 863,487 113 Shenguan Holdings Group Ltd. 1,484,000 112 * Qinqin Foodstuffs Group Cayman Co. Ltd. 311,323 111 * Boshiwa International Holding Ltd. 469,000 101 * Chengde Nanjiang Co. Ltd. Class B 271,700 101 * Global Bio-Chem Technology Group Co. Ltd. 3,772,000 75 *,^ China Lumena New Materials Corp. 3,950,000 63 * China Public Procurement Ltd. 13,132,000 62 * Real Gold Mining Ltd. 239,476 26 * China High Precision Automation Group Ltd. 401,000 — *,^ China Metal Recycling Holdings Ltd. 332,400 — ___________ 112,759 Colombia (0.1%)
Banco Davivienda SA Preference Shares 199,956 2,107
53
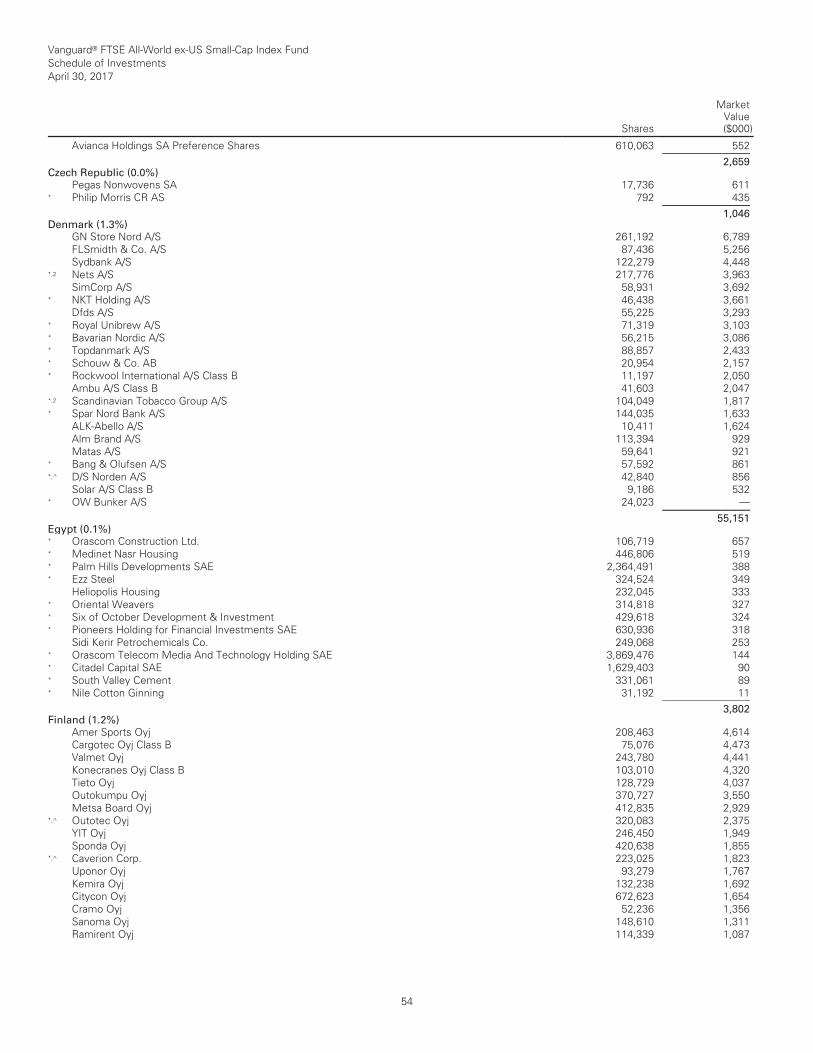
Vanguard® FTSE All-World ex-US Small-Cap Index Fund Schedule of Investments April 30, 2017
Shares
MarketValue($000)
__________________________________________________________________________________________________________________________________________________________________________________________________________________________________________________________________________________________________________________________________________________________________________________________________________________________________________________________________________________________________________________________________________________________________________________________________________________________________________________________________________________________ __________________________________________________________________________________________________________________________________________________________________________________________________________________________________________________________________________________________________________________________________________________________________________________________________________________________________________________________________________________________________________________________________________________________________________________________________________________________________________________________________________________________
Avianca Holdings SA Preference Shares 610,063 552 ___________ 2,659 Czech Republic (0.0%)
Pegas Nonwovens SA 17,736 611 * Philip Morris CR AS 792 435 ___________ 1,046 Denmark (1.3%)
GN Store Nord A/S 261,192 6,789 FLSmidth & Co. A/S 87,436 5,256 Sydbank A/S 122,279 4,448 *,2 Nets A/S 217,776 3,963 SimCorp A/S 58,931 3,692 * NKT Holding A/S 46,438 3,661 Dfds A/S 55,225 3,293 * Royal Unibrew A/S 71,319 3,103 * Bavarian Nordic A/S 56,215 3,086 * Topdanmark A/S 88,857 2,433 * Schouw & Co. AB 20,954 2,157 * Rockwool International A/S Class B 11,197 2,050 Ambu A/S Class B 41,603 2,047 *,2 Scandinavian Tobacco Group A/S 104,049 1,817 * Spar Nord Bank A/S 144,035 1,633 ALK-Abello A/S 10,411 1,624 Alm Brand A/S 113,394 929 Matas A/S 59,641 921 * Bang & Olufsen A/S 57,592 861 *,^ D/S Norden A/S 42,840 856 Solar A/S Class B 9,186 532 * OW Bunker A/S 24,023 — ___________ 55,151 Egypt (0.1%)
* Orascom Construction Ltd. 106,719 657 * Medinet Nasr Housing 446,806 519 * Palm Hills Developments SAE 2,364,491 388 * Ezz Steel 324,524 349 Heliopolis Housing 232,045 333 * Oriental Weavers 314,818 327 * Six of October Development & Investment 429,618 324 * Pioneers Holding for Financial Investments SAE 630,936 318 Sidi Kerir Petrochemicals Co. 249,068 253 * Orascom Telecom Media And Technology Holding SAE 3,869,476 144 * Citadel Capital SAE 1,629,403 90 * South Valley Cement 331,061 89 * Nile Cotton Ginning 31,192 11 ___________ 3,802 Finland (1.2%)
Amer Sports Oyj 208,463 4,614 Cargotec Oyj Class B 75,076 4,473 Valmet Oyj 243,780 4,441 Konecranes Oyj Class B 103,010 4,320 Tieto Oyj 128,729 4,037 Outokumpu Oyj 370,727 3,550 Metsa Board Oyj 412,835 2,929 *,^ Outotec Oyj 320,083 2,375 YIT Oyj 246,450 1,949 Sponda Oyj 420,638 1,855 *,^ Caverion Corp. 223,025 1,823 Uponor Oyj 93,279 1,767 Kemira Oyj 132,238 1,692 Citycon Oyj 672,623 1,654 Cramo Oyj 52,236 1,356 Sanoma Oyj 148,610 1,311 Ramirent Oyj 114,339 1,087
54
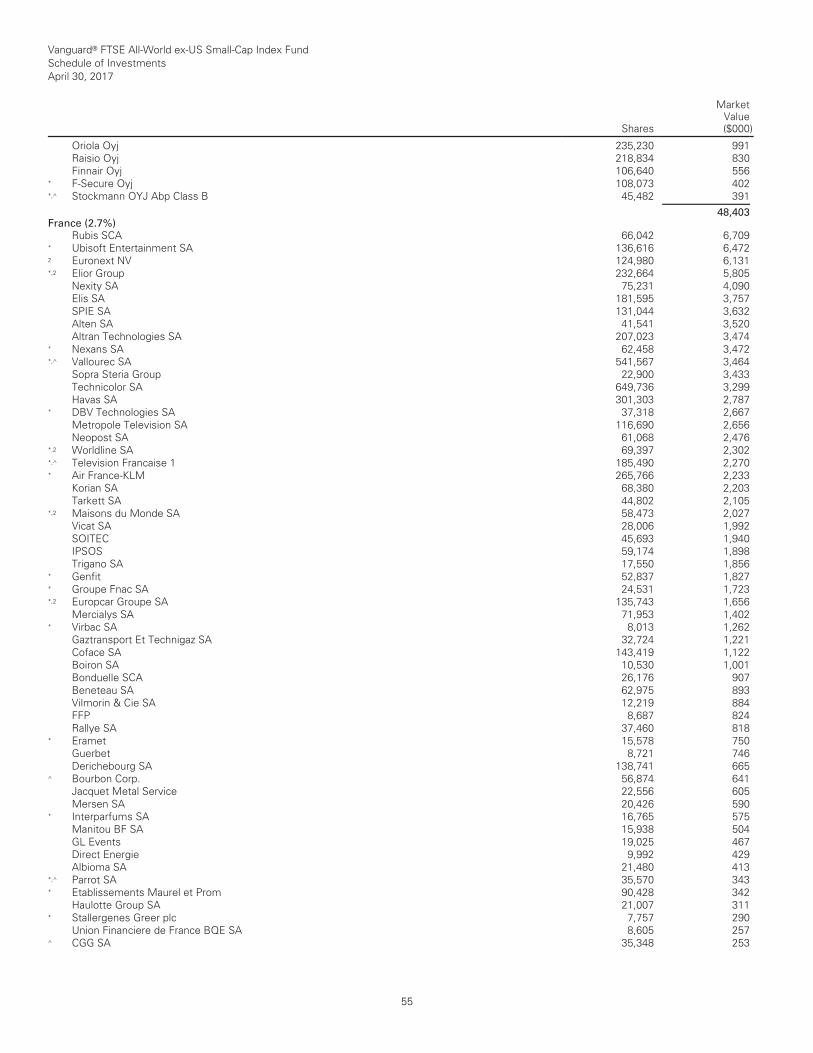
Vanguard® FTSE All-World ex-US Small-Cap Index Fund Schedule of Investments April 30, 2017
Shares
MarketValue($000)
__________________________________________________________________________________________________________________________________________________________________________________________________________________________________________________________________________________________________________________________________________________________________________________________________________________________________________________________________________________________________________________________________________________________________________________________________________________________________________________________________________________________ __________________________________________________________________________________________________________________________________________________________________________________________________________________________________________________________________________________________________________________________________________________________________________________________________________________________________________________________________________________________________________________________________________________________________________________________________________________________________________________________________________________________
Oriola Oyj 235,230 991 Raisio Oyj 218,834 830 Finnair Oyj 106,640 556 * F-Secure Oyj 108,073 402 *,^ Stockmann OYJ Abp Class B 45,482 391 ___________ 48,403 France (2.7%)
Rubis SCA 66,042 6,709 * Ubisoft Entertainment SA 136,616 6,472 2 Euronext NV 124,980 6,131 *,2 Elior Group 232,664 5,805 Nexity SA 75,231 4,090 Elis SA 181,595 3,757 SPIE SA 131,044 3,632 Alten SA 41,541 3,520 Altran Technologies SA 207,023 3,474 * Nexans SA 62,458 3,472 *,^ Vallourec SA 541,567 3,464 Sopra Steria Group 22,900 3,433 Technicolor SA 649,736 3,299 Havas SA 301,303 2,787 * DBV Technologies SA 37,318 2,667 Metropole Television SA 116,690 2,656 Neopost SA 61,068 2,476 *,2 Worldline SA 69,397 2,302 *,^ Television Francaise 1 185,490 2,270 * Air France-KLM 265,766 2,233 Korian SA 68,380 2,203 Tarkett SA 44,802 2,105 *,2 Maisons du Monde SA 58,473 2,027 Vicat SA 28,006 1,992 SOITEC 45,693 1,940 IPSOS 59,174 1,898 Trigano SA 17,550 1,856 * Genfit 52,837 1,827 * Groupe Fnac SA 24,531 1,723 *,2 Europcar Groupe SA 135,743 1,656 Mercialys SA 71,953 1,402 * Virbac SA 8,013 1,262 Gaztransport Et Technigaz SA 32,724 1,221 Coface SA 143,419 1,122 Boiron SA 10,530 1,001 Bonduelle SCA 26,176 907 Beneteau SA 62,975 893 Vilmorin & Cie SA 12,219 884 FFP 8,687 824 Rallye SA 37,460 818 * Eramet 15,578 750 Guerbet 8,721 746 Derichebourg SA 138,741 665 ^ Bourbon Corp. 56,874 641 Jacquet Metal Service 22,556 605 Mersen SA 20,426 590 * Interparfums SA 16,765 575 Manitou BF SA 15,938 504 GL Events 19,025 467 Direct Energie 9,992 429 Albioma SA 21,480 413 *,^ Parrot SA 35,570 343 * Etablissements Maurel et Prom 90,428 342 Haulotte Group SA 21,007 311 * Stallergenes Greer plc 7,757 290 Union Financiere de France BQE SA 8,605 257 ^ CGG SA 35,348 253
55
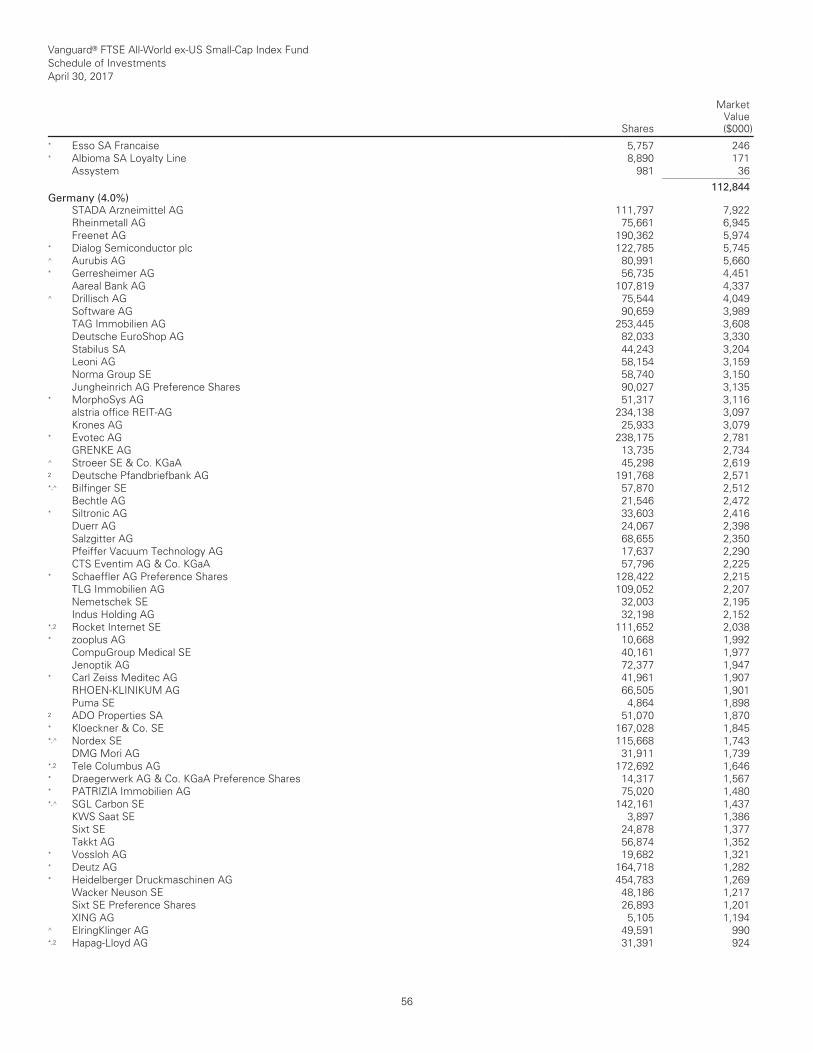
Vanguard® FTSE All-World ex-US Small-Cap Index Fund Schedule of Investments April 30, 2017
Shares
MarketValue($000)
__________________________________________________________________________________________________________________________________________________________________________________________________________________________________________________________________________________________________________________________________________________________________________________________________________________________________________________________________________________________________________________________________________________________________________________________________________________________________________________________________________________________ __________________________________________________________________________________________________________________________________________________________________________________________________________________________________________________________________________________________________________________________________________________________________________________________________________________________________________________________________________________________________________________________________________________________________________________________________________________________________________________________________________________________
* Esso SA Francaise 5,757 246 * Albioma SA Loyalty Line 8,890 171 Assystem 981 36 ___________ 112,844 Germany (4.0%)
STADA Arzneimittel AG 111,797 7,922 Rheinmetall AG 75,661 6,945 Freenet AG 190,362 5,974 * Dialog Semiconductor plc 122,785 5,745 ^ Aurubis AG 80,991 5,660 * Gerresheimer AG 56,735 4,451 Aareal Bank AG 107,819 4,337 ^ Drillisch AG 75,544 4,049 Software AG 90,659 3,989 TAG Immobilien AG 253,445 3,608 Deutsche EuroShop AG 82,033 3,330 Stabilus SA 44,243 3,204 Leoni AG 58,154 3,159 Norma Group SE 58,740 3,150 Jungheinrich AG Preference Shares 90,027 3,135 * MorphoSys AG 51,317 3,116 alstria office REIT-AG 234,138 3,097 Krones AG 25,933 3,079 * Evotec AG 238,175 2,781 GRENKE AG 13,735 2,734 ^ Stroeer SE & Co. KGaA 45,298 2,619 2 Deutsche Pfandbriefbank AG 191,768 2,571 *,^ Bilfinger SE 57,870 2,512 Bechtle AG 21,546 2,472 * Siltronic AG 33,603 2,416 Duerr AG 24,067 2,398 Salzgitter AG 68,655 2,350 Pfeiffer Vacuum Technology AG 17,637 2,290 CTS Eventim AG & Co. KGaA 57,796 2,225 * Schaeffler AG Preference Shares 128,422 2,215 TLG Immobilien AG 109,052 2,207 Nemetschek SE 32,003 2,195 Indus Holding AG 32,198 2,152 *,2 Rocket Internet SE 111,652 2,038 * zooplus AG 10,668 1,992 CompuGroup Medical SE 40,161 1,977 Jenoptik AG 72,377 1,947 * Carl Zeiss Meditec AG 41,961 1,907 RHOEN-KLINIKUM AG 66,505 1,901 Puma SE 4,864 1,898 2 ADO Properties SA 51,070 1,870 * Kloeckner & Co. SE 167,028 1,845 *,^ Nordex SE 115,668 1,743 DMG Mori AG 31,911 1,739 *,2 Tele Columbus AG 172,692 1,646 * Draegerwerk AG & Co. KGaA Preference Shares 14,317 1,567 * PATRIZIA Immobilien AG 75,020 1,480 *,^ SGL Carbon SE 142,161 1,437 KWS Saat SE 3,897 1,386 Sixt SE 24,878 1,377 Takkt AG 56,874 1,352 * Vossloh AG 19,682 1,321 * Deutz AG 164,718 1,282 * Heidelberger Druckmaschinen AG 454,783 1,269 Wacker Neuson SE 48,186 1,217 Sixt SE Preference Shares 26,893 1,201 XING AG 5,105 1,194 ^ ElringKlinger AG 49,591 990 *,2 Hapag-Lloyd AG 31,391 924
56
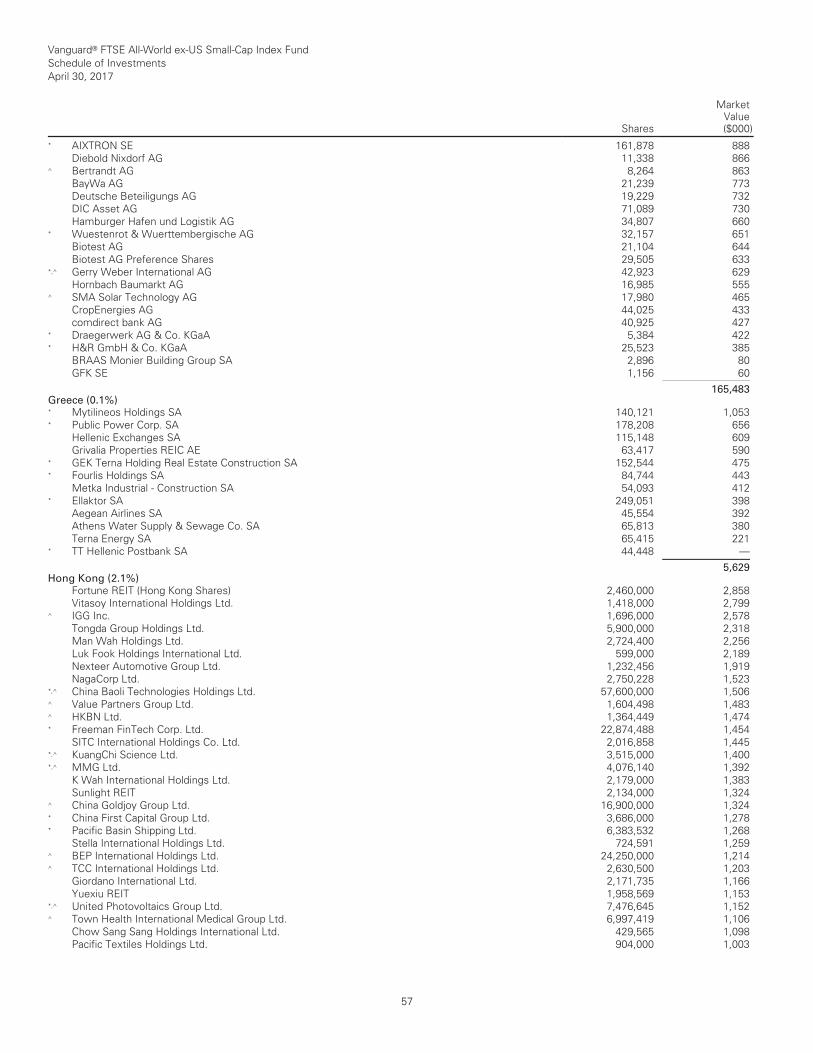
Vanguard® FTSE All-World ex-US Small-Cap Index Fund Schedule of Investments April 30, 2017
Shares
MarketValue($000)
__________________________________________________________________________________________________________________________________________________________________________________________________________________________________________________________________________________________________________________________________________________________________________________________________________________________________________________________________________________________________________________________________________________________________________________________________________________________________________________________________________________________ __________________________________________________________________________________________________________________________________________________________________________________________________________________________________________________________________________________________________________________________________________________________________________________________________________________________________________________________________________________________________________________________________________________________________________________________________________________________________________________________________________________________
* AIXTRON SE 161,878 888 Diebold Nixdorf AG 11,338 866 ^ Bertrandt AG 8,264 863 BayWa AG 21,239 773 Deutsche Beteiligungs AG 19,229 732 DIC Asset AG 71,089 730 Hamburger Hafen und Logistik AG 34,807 660 * Wuestenrot & Wuerttembergische AG 32,157 651 Biotest AG 21,104 644 Biotest AG Preference Shares 29,505 633 *,^ Gerry Weber International AG 42,923 629 Hornbach Baumarkt AG 16,985 555 ^ SMA Solar Technology AG 17,980 465 CropEnergies AG 44,025 433 comdirect bank AG 40,925 427 * Draegerwerk AG & Co. KGaA 5,384 422 * H&R GmbH & Co. KGaA 25,523 385 BRAAS Monier Building Group SA 2,896 80 GFK SE 1,156 60 ___________ 165,483 Greece (0.1%)
* Mytilineos Holdings SA 140,121 1,053 * Public Power Corp. SA 178,208 656 Hellenic Exchanges SA 115,148 609 Grivalia Properties REIC AE 63,417 590 * GEK Terna Holding Real Estate Construction SA 152,544 475 * Fourlis Holdings SA 84,744 443 Metka Industrial - Construction SA 54,093 412 * Ellaktor SA 249,051 398 Aegean Airlines SA 45,554 392 Athens Water Supply & Sewage Co. SA 65,813 380 Terna Energy SA 65,415 221 * TT Hellenic Postbank SA 44,448 — ___________ 5,629 Hong Kong (2.1%)
Fortune REIT (Hong Kong Shares) 2,460,000 2,858 Vitasoy International Holdings Ltd. 1,418,000 2,799 ^ IGG Inc. 1,696,000 2,578 Tongda Group Holdings Ltd. 5,900,000 2,318 Man Wah Holdings Ltd. 2,724,400 2,256 Luk Fook Holdings International Ltd. 599,000 2,189 Nexteer Automotive Group Ltd. 1,232,456 1,919 NagaCorp Ltd. 2,750,228 1,523 *,^ China Baoli Technologies Holdings Ltd. 57,600,000 1,506 ^ Value Partners Group Ltd. 1,604,498 1,483 ^ HKBN Ltd. 1,364,449 1,474 * Freeman FinTech Corp. Ltd. 22,874,488 1,454 SITC International Holdings Co. Ltd. 2,016,858 1,445 *,^ KuangChi Science Ltd. 3,515,000 1,400 *,^ MMG Ltd. 4,076,140 1,392 K Wah International Holdings Ltd. 2,179,000 1,383 Sunlight REIT 2,134,000 1,324 ^ China Goldjoy Group Ltd. 16,900,000 1,324 * China First Capital Group Ltd. 3,686,000 1,278 * Pacific Basin Shipping Ltd. 6,383,532 1,268 Stella International Holdings Ltd. 724,591 1,259 ^ BEP International Holdings Ltd. 24,250,000 1,214 ^ TCC International Holdings Ltd. 2,630,500 1,203 Giordano International Ltd. 2,171,735 1,166 Yuexiu REIT 1,958,569 1,153 *,^ United Photovoltaics Group Ltd. 7,476,645 1,152 ^ Town Health International Medical Group Ltd. 6,997,419 1,106 Chow Sang Sang Holdings International Ltd. 429,565 1,098 Pacific Textiles Holdings Ltd. 904,000 1,003
57
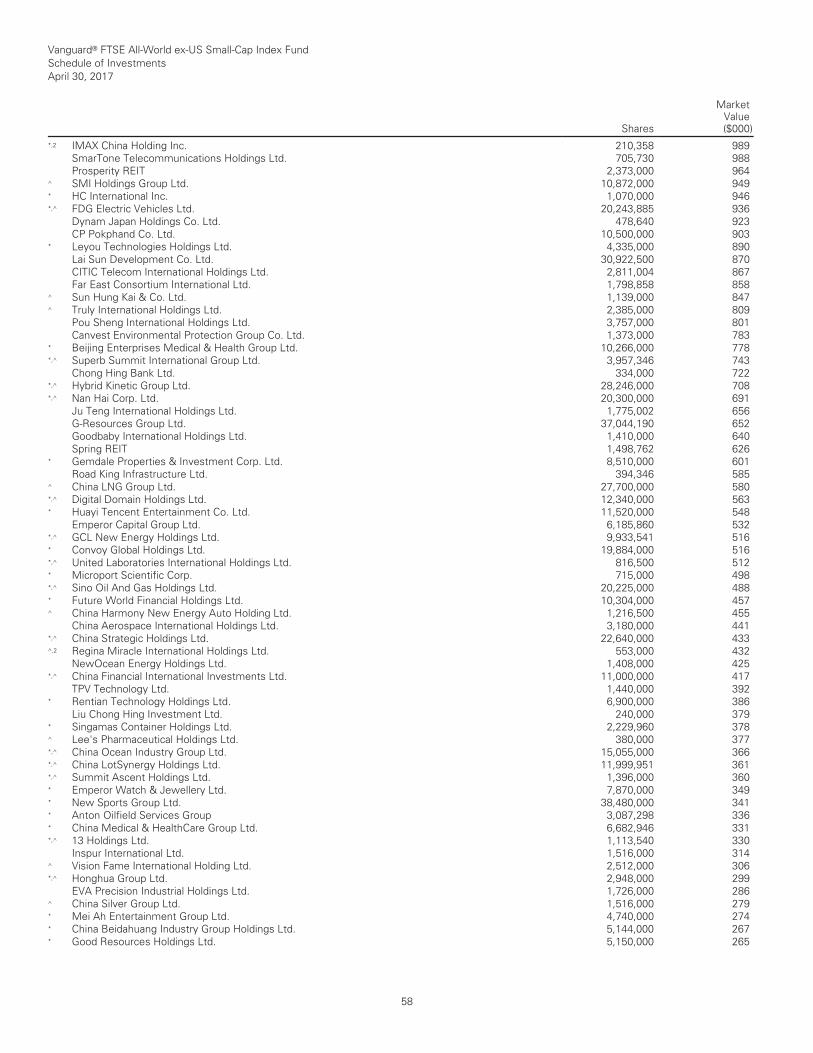
Vanguard® FTSE All-World ex-US Small-Cap Index Fund Schedule of Investments April 30, 2017
Shares
MarketValue($000)
__________________________________________________________________________________________________________________________________________________________________________________________________________________________________________________________________________________________________________________________________________________________________________________________________________________________________________________________________________________________________________________________________________________________________________________________________________________________________________________________________________________________ __________________________________________________________________________________________________________________________________________________________________________________________________________________________________________________________________________________________________________________________________________________________________________________________________________________________________________________________________________________________________________________________________________________________________________________________________________________________________________________________________________________________
*,2 IMAX China Holding Inc. 210,358 989 SmarTone Telecommunications Holdings Ltd. 705,730 988 Prosperity REIT 2,373,000 964 ^ SMI Holdings Group Ltd. 10,872,000 949 * HC International Inc. 1,070,000 946 *,^ FDG Electric Vehicles Ltd. 20,243,885 936 Dynam Japan Holdings Co. Ltd. 478,640 923 CP Pokphand Co. Ltd. 10,500,000 903 * Leyou Technologies Holdings Ltd. 4,335,000 890 Lai Sun Development Co. Ltd. 30,922,500 870 CITIC Telecom International Holdings Ltd. 2,811,004 867 Far East Consortium International Ltd. 1,798,858 858 ^ Sun Hung Kai & Co. Ltd. 1,139,000 847 ^ Truly International Holdings Ltd. 2,385,000 809 Pou Sheng International Holdings Ltd. 3,757,000 801 Canvest Environmental Protection Group Co. Ltd. 1,373,000 783 * Beijing Enterprises Medical & Health Group Ltd. 10,266,000 778 *,^ Superb Summit International Group Ltd. 3,957,346 743 Chong Hing Bank Ltd. 334,000 722 *,^ Hybrid Kinetic Group Ltd. 28,246,000 708 *,^ Nan Hai Corp. Ltd. 20,300,000 691 Ju Teng International Holdings Ltd. 1,775,002 656 G-Resources Group Ltd. 37,044,190 652 Goodbaby International Holdings Ltd. 1,410,000 640 Spring REIT 1,498,762 626 * Gemdale Properties & Investment Corp. Ltd. 8,510,000 601 Road King Infrastructure Ltd. 394,346 585 ^ China LNG Group Ltd. 27,700,000 580 *,^ Digital Domain Holdings Ltd. 12,340,000 563 * Huayi Tencent Entertainment Co. Ltd. 11,520,000 548 Emperor Capital Group Ltd. 6,185,860 532 *,^ GCL New Energy Holdings Ltd. 9,933,541 516 * Convoy Global Holdings Ltd. 19,884,000 516 *,^ United Laboratories International Holdings Ltd. 816,500 512 * Microport Scientific Corp. 715,000 498 *,^ Sino Oil And Gas Holdings Ltd. 20,225,000 488 * Future World Financial Holdings Ltd. 10,304,000 457 ^ China Harmony New Energy Auto Holding Ltd. 1,216,500 455 China Aerospace International Holdings Ltd. 3,180,000 441 *,^ China Strategic Holdings Ltd. 22,640,000 433 ^,2 Regina Miracle International Holdings Ltd. 553,000 432 NewOcean Energy Holdings Ltd. 1,408,000 425 *,^ China Financial International Investments Ltd. 11,000,000 417 TPV Technology Ltd. 1,440,000 392 * Rentian Technology Holdings Ltd. 6,900,000 386 Liu Chong Hing Investment Ltd. 240,000 379 * Singamas Container Holdings Ltd. 2,229,960 378 ^ Lee's Pharmaceutical Holdings Ltd. 380,000 377 *,^ China Ocean Industry Group Ltd. 15,055,000 366 *,^ China LotSynergy Holdings Ltd. 11,999,951 361 *,^ Summit Ascent Holdings Ltd. 1,396,000 360 * Emperor Watch & Jewellery Ltd. 7,870,000 349 * New Sports Group Ltd. 38,480,000 341 * Anton Oilfield Services Group 3,087,298 336 * China Medical & HealthCare Group Ltd. 6,682,946 331 *,^ 13 Holdings Ltd. 1,113,540 330 Inspur International Ltd. 1,516,000 314 ^ Vision Fame International Holding Ltd. 2,512,000 306 *,^ Honghua Group Ltd. 2,948,000 299 EVA Precision Industrial Holdings Ltd. 1,726,000 286 ^ China Silver Group Ltd. 1,516,000 279 * Mei Ah Entertainment Group Ltd. 4,740,000 274 * China Beidahuang Industry Group Holdings Ltd. 5,144,000 267 * Good Resources Holdings Ltd. 5,150,000 265
58
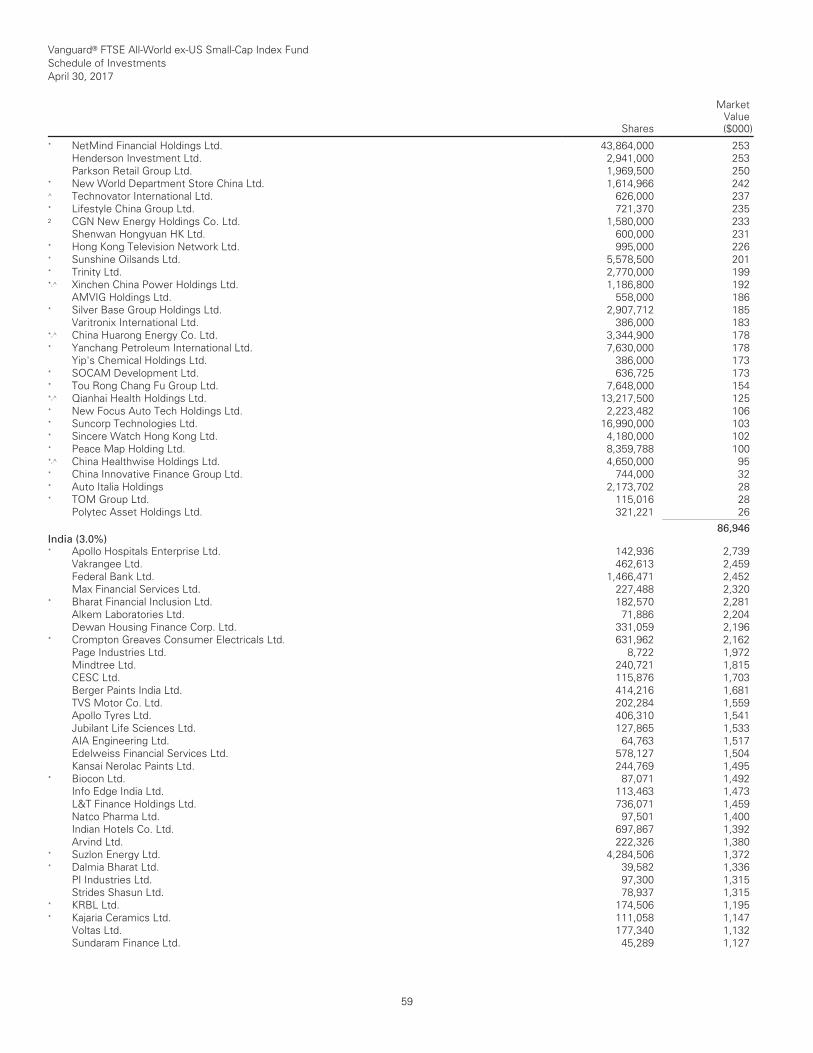
Vanguard® FTSE All-World ex-US Small-Cap Index Fund Schedule of Investments April 30, 2017
Shares
MarketValue($000)
__________________________________________________________________________________________________________________________________________________________________________________________________________________________________________________________________________________________________________________________________________________________________________________________________________________________________________________________________________________________________________________________________________________________________________________________________________________________________________________________________________________________ __________________________________________________________________________________________________________________________________________________________________________________________________________________________________________________________________________________________________________________________________________________________________________________________________________________________________________________________________________________________________________________________________________________________________________________________________________________________________________________________________________________________
* NetMind Financial Holdings Ltd. 43,864,000 253 Henderson Investment Ltd. 2,941,000 253 Parkson Retail Group Ltd. 1,969,500 250 * New World Department Store China Ltd. 1,614,966 242 ^ Technovator International Ltd. 626,000 237 * Lifestyle China Group Ltd. 721,370 235 2 CGN New Energy Holdings Co. Ltd. 1,580,000 233 Shenwan Hongyuan HK Ltd. 600,000 231 * Hong Kong Television Network Ltd. 995,000 226 * Sunshine Oilsands Ltd. 5,578,500 201 * Trinity Ltd. 2,770,000 199 *,^ Xinchen China Power Holdings Ltd. 1,186,800 192 AMVIG Holdings Ltd. 558,000 186 * Silver Base Group Holdings Ltd. 2,907,712 185 Varitronix International Ltd. 386,000 183 *,^ China Huarong Energy Co. Ltd. 3,344,900 178 * Yanchang Petroleum International Ltd. 7,630,000 178 Yip's Chemical Holdings Ltd. 386,000 173 * SOCAM Development Ltd. 636,725 173 * Tou Rong Chang Fu Group Ltd. 7,648,000 154 *,^ Qianhai Health Holdings Ltd. 13,217,500 125 * New Focus Auto Tech Holdings Ltd. 2,223,482 106 * Suncorp Technologies Ltd. 16,990,000 103 * Sincere Watch Hong Kong Ltd. 4,180,000 102 * Peace Map Holding Ltd. 8,359,788 100 *,^ China Healthwise Holdings Ltd. 4,650,000 95 * China Innovative Finance Group Ltd. 744,000 32 * Auto Italia Holdings 2,173,702 28 * TOM Group Ltd. 115,016 28 Polytec Asset Holdings Ltd. 321,221 26 ___________ 86,946 India (3.0%)
* Apollo Hospitals Enterprise Ltd. 142,936 2,739 Vakrangee Ltd. 462,613 2,459 Federal Bank Ltd. 1,466,471 2,452 Max Financial Services Ltd. 227,488 2,320 * Bharat Financial Inclusion Ltd. 182,570 2,281 Alkem Laboratories Ltd. 71,886 2,204 Dewan Housing Finance Corp. Ltd. 331,059 2,196 * Crompton Greaves Consumer Electricals Ltd. 631,962 2,162 Page Industries Ltd. 8,722 1,972 Mindtree Ltd. 240,721 1,815 CESC Ltd. 115,876 1,703 Berger Paints India Ltd. 414,216 1,681 TVS Motor Co. Ltd. 202,284 1,559 Apollo Tyres Ltd. 406,310 1,541 Jubilant Life Sciences Ltd. 127,865 1,533 AIA Engineering Ltd. 64,763 1,517 Edelweiss Financial Services Ltd. 578,127 1,504 Kansai Nerolac Paints Ltd. 244,769 1,495 * Biocon Ltd. 87,071 1,492 Info Edge India Ltd. 113,463 1,473 L&T Finance Holdings Ltd. 736,071 1,459 Natco Pharma Ltd. 97,501 1,400 Indian Hotels Co. Ltd. 697,867 1,392 Arvind Ltd. 222,326 1,380 * Suzlon Energy Ltd. 4,284,506 1,372 * Dalmia Bharat Ltd. 39,582 1,336 PI Industries Ltd. 97,300 1,315 Strides Shasun Ltd. 78,937 1,315 * KRBL Ltd. 174,506 1,195 * Kajaria Ceramics Ltd. 111,058 1,147 Voltas Ltd. 177,340 1,132 Sundaram Finance Ltd. 45,289 1,127
59
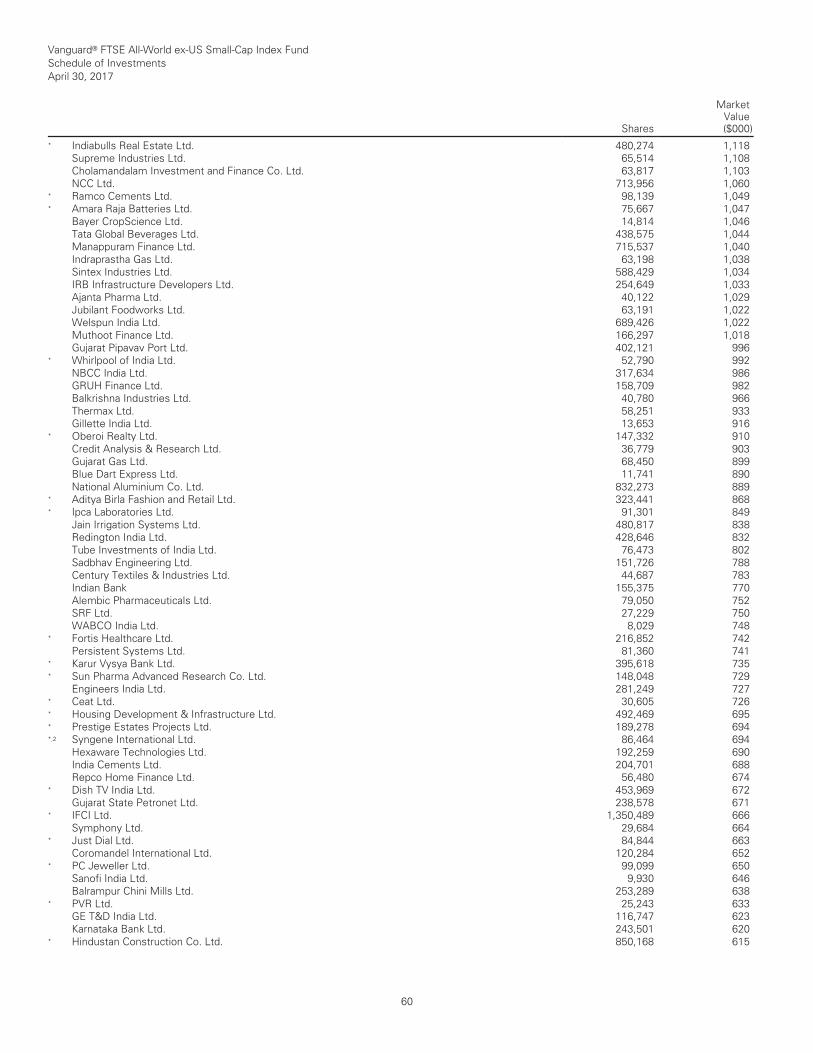
Vanguard® FTSE All-World ex-US Small-Cap Index Fund Schedule of Investments April 30, 2017
Shares
MarketValue($000)
__________________________________________________________________________________________________________________________________________________________________________________________________________________________________________________________________________________________________________________________________________________________________________________________________________________________________________________________________________________________________________________________________________________________________________________________________________________________________________________________________________________________ __________________________________________________________________________________________________________________________________________________________________________________________________________________________________________________________________________________________________________________________________________________________________________________________________________________________________________________________________________________________________________________________________________________________________________________________________________________________________________________________________________________________
* Indiabulls Real Estate Ltd. 480,274 1,118 Supreme Industries Ltd. 65,514 1,108 Cholamandalam Investment and Finance Co. Ltd. 63,817 1,103 NCC Ltd. 713,956 1,060 * Ramco Cements Ltd. 98,139 1,049 * Amara Raja Batteries Ltd. 75,667 1,047 Bayer CropScience Ltd. 14,814 1,046 Tata Global Beverages Ltd. 438,575 1,044 Manappuram Finance Ltd. 715,537 1,040 Indraprastha Gas Ltd. 63,198 1,038 Sintex Industries Ltd. 588,429 1,034 IRB Infrastructure Developers Ltd. 254,649 1,033 Ajanta Pharma Ltd. 40,122 1,029 Jubilant Foodworks Ltd. 63,191 1,022 Welspun India Ltd. 689,426 1,022 Muthoot Finance Ltd. 166,297 1,018 Gujarat Pipavav Port Ltd. 402,121 996 * Whirlpool of India Ltd. 52,790 992 NBCC India Ltd. 317,634 986 GRUH Finance Ltd. 158,709 982 Balkrishna Industries Ltd. 40,780 966 Thermax Ltd. 58,251 933 Gillette India Ltd. 13,653 916 * Oberoi Realty Ltd. 147,332 910 Credit Analysis & Research Ltd. 36,779 903 Gujarat Gas Ltd. 68,450 899 Blue Dart Express Ltd. 11,741 890 National Aluminium Co. Ltd. 832,273 889 * Aditya Birla Fashion and Retail Ltd. 323,441 868 * Ipca Laboratories Ltd. 91,301 849 Jain Irrigation Systems Ltd. 480,817 838 Redington India Ltd. 428,646 832 Tube Investments of India Ltd. 76,473 802 Sadbhav Engineering Ltd. 151,726 788 Century Textiles & Industries Ltd. 44,687 783 Indian Bank 155,375 770 Alembic Pharmaceuticals Ltd. 79,050 752 SRF Ltd. 27,229 750 WABCO India Ltd. 8,029 748 * Fortis Healthcare Ltd. 216,852 742 Persistent Systems Ltd. 81,360 741 * Karur Vysya Bank Ltd. 395,618 735 * Sun Pharma Advanced Research Co. Ltd. 148,048 729 Engineers India Ltd. 281,249 727 * Ceat Ltd. 30,605 726 * Housing Development & Infrastructure Ltd. 492,469 695 * Prestige Estates Projects Ltd. 189,278 694 *,2 Syngene International Ltd. 86,464 694 Hexaware Technologies Ltd. 192,259 690 India Cements Ltd. 204,701 688 Repco Home Finance Ltd. 56,480 674 * Dish TV India Ltd. 453,969 672 Gujarat State Petronet Ltd. 238,578 671 * IFCI Ltd. 1,350,489 666 Symphony Ltd. 29,684 664 * Just Dial Ltd. 84,844 663 Coromandel International Ltd. 120,284 652 * PC Jeweller Ltd. 99,099 650 Sanofi India Ltd. 9,930 646 Balrampur Chini Mills Ltd. 253,289 638 * PVR Ltd. 25,243 633 GE T&D India Ltd. 116,747 623 Karnataka Bank Ltd. 243,501 620 * Hindustan Construction Co. Ltd. 850,168 615
60

Vanguard® FTSE All-World ex-US Small-Cap Index Fund Schedule of Investments April 30, 2017
Shares
MarketValue($000)
__________________________________________________________________________________________________________________________________________________________________________________________________________________________________________________________________________________________________________________________________________________________________________________________________________________________________________________________________________________________________________________________________________________________________________________________________________________________________________________________________________________________ __________________________________________________________________________________________________________________________________________________________________________________________________________________________________________________________________________________________________________________________________________________________________________________________________________________________________________________________________________________________________________________________________________________________________________________________________________________________________________________________________________________________
* Central Bank of India 370,837 610 * RattanIndia Power Ltd. 4,503,385 609 eClerx Services Ltd. 28,890 583 * Mahindra CIE Automotive Ltd. 151,870 577 Cox & Kings Ltd. 159,249 564 VA Tech Wabag Ltd. 53,308 557 PTC India Ltd. 372,920 552 KPIT Technologies Ltd. 274,247 547 * Syndicate Bank 413,785 532 * Gujarat Fluorochemicals Ltd. 44,063 531 Gateway Distriparks Ltd. 126,179 524 Bajaj Corp. Ltd. 83,915 513 2 Dr Lal PathLabs Ltd. 34,269 511 Multi Commodity Exchange of India Ltd. 26,912 509 Srei Infrastructure Finance Ltd. 356,515 501 Pfizer Ltd. 18,463 499 South Indian Bank Ltd. 1,180,924 472 * Jaiprakash Associates Ltd. 2,176,270 461 * TV18 Broadcast Ltd. 704,032 457 * Kaveri Seed Co. Ltd. 50,705 445 * Vijaya Bank 348,543 443 Jammu & Kashmir Bank Ltd. 349,581 441 * Bajaj Hindusthan Sugar Ltd. 1,687,054 436 * Indian Overseas Bank 845,308 381 * Equitas Holdings Ltd. 147,173 380 Sobha Ltd. 64,958 374 Jindal Saw Ltd. 277,147 348 * Shipping Corp. of India Ltd. 270,846 340 Raymond Ltd. 26,494 306 * DEN Networks Ltd. 202,065 300 Marksans Pharma Ltd. 367,253 297 * Unitech Ltd. 3,343,633 293 * Jet Airways India Ltd. 35,377 285 Chambal Fertilizers and Chemicals Ltd. 174,569 272 Radico Khaitan Ltd. 136,987 262 Welspun Corp. Ltd. 203,488 261 * Allahabad Bank 196,738 252 * GE Power India Ltd. 24,317 251 * Amtek Auto Ltd. 405,081 247 Andhra Bank 227,254 243 Gujarat Mineral Development Corp. Ltd. 119,672 232 * UCO Bank 334,748 216 McLeod Russel India Ltd. 66,186 197 * Videocon Industries Ltd. 121,343 196 * Shree Renuka Sugars Ltd. 647,265 148 * Reliance Defence and Engineering Ltd. 142,038 143 * Rolta India Ltd. 145,734 137 * Arvind SmartSpaces Ltd. 19,641 32 * JITF Infralogistics Ltd. 21,890 23 * Chennai Super Kings Cricket Ltd. 176,674 — ___________ 125,759 Indonesia (0.7%)
Ciputra Development Tbk PT 25,762,755 2,471 Pakuwon Jati Tbk PT 42,424,834 1,984 * Lippo Karawaci Tbk PT 33,343,118 1,975 Summarecon Agung Tbk PT 19,310,468 1,965 AKR Corporindo Tbk PT 3,135,100 1,591 Waskita Karya Persero Tbk PT 7,477,679 1,339 Pembangunan Perumahan Persero Tbk PT 5,078,300 1,211 Bank Tabungan Negara Persero Tbk PT 6,914,570 1,190 Ace Hardware Indonesia Tbk PT 14,365,400 1,008 Indo Tambangraya Megah Tbk PT 677,100 971 Wijaya Karya Persero Tbk PT 5,375,133 953 * Aneka Tambang Persero Tbk PT 15,732,919 820
61
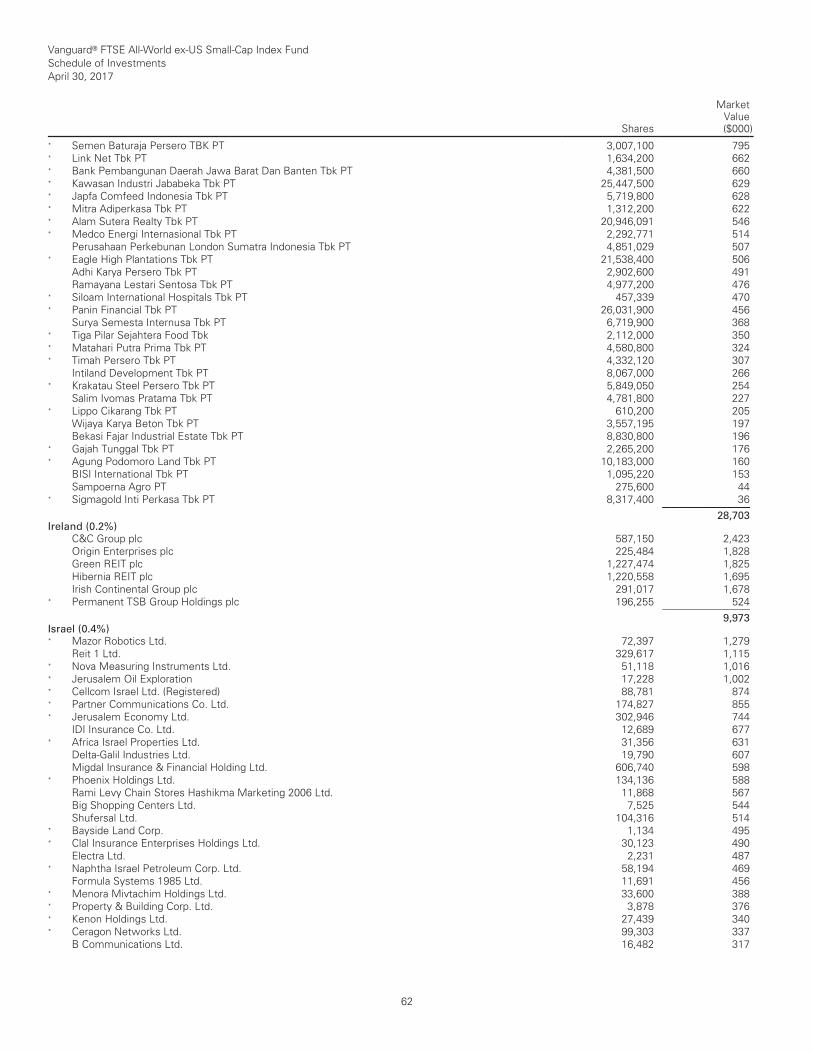
Vanguard® FTSE All-World ex-US Small-Cap Index Fund Schedule of Investments April 30, 2017
Shares
MarketValue($000)
__________________________________________________________________________________________________________________________________________________________________________________________________________________________________________________________________________________________________________________________________________________________________________________________________________________________________________________________________________________________________________________________________________________________________________________________________________________________________________________________________________________________ __________________________________________________________________________________________________________________________________________________________________________________________________________________________________________________________________________________________________________________________________________________________________________________________________________________________________________________________________________________________________________________________________________________________________________________________________________________________________________________________________________________________
* Semen Baturaja Persero TBK PT 3,007,100 795 * Link Net Tbk PT 1,634,200 662 * Bank Pembangunan Daerah Jawa Barat Dan Banten Tbk PT 4,381,500 660 * Kawasan Industri Jababeka Tbk PT 25,447,500 629 * Japfa Comfeed Indonesia Tbk PT 5,719,800 628 * Mitra Adiperkasa Tbk PT 1,312,200 622 * Alam Sutera Realty Tbk PT 20,946,091 546 * Medco Energi Internasional Tbk PT 2,292,771 514 Perusahaan Perkebunan London Sumatra Indonesia Tbk PT 4,851,029 507 * Eagle High Plantations Tbk PT 21,538,400 506 Adhi Karya Persero Tbk PT 2,902,600 491 Ramayana Lestari Sentosa Tbk PT 4,977,200 476 * Siloam International Hospitals Tbk PT 457,339 470 * Panin Financial Tbk PT 26,031,900 456 Surya Semesta Internusa Tbk PT 6,719,900 368 * Tiga Pilar Sejahtera Food Tbk 2,112,000 350 * Matahari Putra Prima Tbk PT 4,580,800 324 * Timah Persero Tbk PT 4,332,120 307 Intiland Development Tbk PT 8,067,000 266 * Krakatau Steel Persero Tbk PT 5,849,050 254 Salim Ivomas Pratama Tbk PT 4,781,800 227 * Lippo Cikarang Tbk PT 610,200 205 Wijaya Karya Beton Tbk PT 3,557,195 197 Bekasi Fajar Industrial Estate Tbk PT 8,830,800 196 * Gajah Tunggal Tbk PT 2,265,200 176 * Agung Podomoro Land Tbk PT 10,183,000 160 BISI International Tbk PT 1,095,220 153 Sampoerna Agro PT 275,600 44 * Sigmagold Inti Perkasa Tbk PT 8,317,400 36 ___________ 28,703 Ireland (0.2%)
C&C Group plc 587,150 2,423 Origin Enterprises plc 225,484 1,828 Green REIT plc 1,227,474 1,825 Hibernia REIT plc 1,220,558 1,695 Irish Continental Group plc 291,017 1,678 * Permanent TSB Group Holdings plc 196,255 524 ___________ 9,973 Israel (0.4%)
* Mazor Robotics Ltd. 72,397 1,279 Reit 1 Ltd. 329,617 1,115 * Nova Measuring Instruments Ltd. 51,118 1,016 * Jerusalem Oil Exploration 17,228 1,002 * Cellcom Israel Ltd. (Registered) 88,781 874 * Partner Communications Co. Ltd. 174,827 855 * Jerusalem Economy Ltd. 302,946 744 IDI Insurance Co. Ltd. 12,689 677 * Africa Israel Properties Ltd. 31,356 631 Delta-Galil Industries Ltd. 19,790 607 Migdal Insurance & Financial Holding Ltd. 606,740 598 * Phoenix Holdings Ltd. 134,136 588 Rami Levy Chain Stores Hashikma Marketing 2006 Ltd. 11,868 567 Big Shopping Centers Ltd. 7,525 544 Shufersal Ltd. 104,316 514 * Bayside Land Corp. 1,134 495 * Clal Insurance Enterprises Holdings Ltd. 30,123 490 Electra Ltd. 2,231 487 * Naphtha Israel Petroleum Corp. Ltd. 58,194 469 Formula Systems 1985 Ltd. 11,691 456 * Menora Mivtachim Holdings Ltd. 33,600 388 * Property & Building Corp. Ltd. 3,878 376 * Kenon Holdings Ltd. 27,439 340 * Ceragon Networks Ltd. 99,303 337 B Communications Ltd. 16,482 317
62
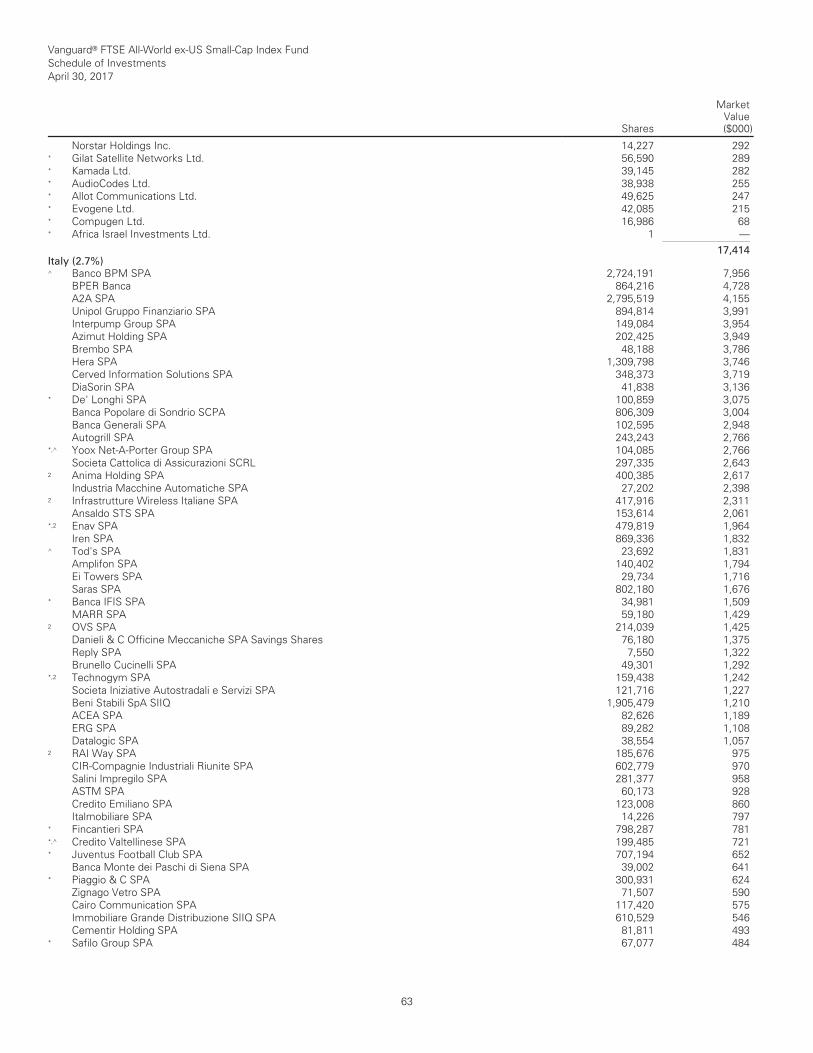
Vanguard® FTSE All-World ex-US Small-Cap Index Fund Schedule of Investments April 30, 2017
Shares
MarketValue($000)
__________________________________________________________________________________________________________________________________________________________________________________________________________________________________________________________________________________________________________________________________________________________________________________________________________________________________________________________________________________________________________________________________________________________________________________________________________________________________________________________________________________________ __________________________________________________________________________________________________________________________________________________________________________________________________________________________________________________________________________________________________________________________________________________________________________________________________________________________________________________________________________________________________________________________________________________________________________________________________________________________________________________________________________________________
Norstar Holdings Inc. 14,227 292 * Gilat Satellite Networks Ltd. 56,590 289 * Kamada Ltd. 39,145 282 * AudioCodes Ltd. 38,938 255 * Allot Communications Ltd. 49,625 247 * Evogene Ltd. 42,085 215 * Compugen Ltd. 16,986 68 * Africa Israel Investments Ltd. 1 — ___________ 17,414 Italy (2.7%)
^ Banco BPM SPA 2,724,191 7,956 BPER Banca 864,216 4,728 A2A SPA 2,795,519 4,155 Unipol Gruppo Finanziario SPA 894,814 3,991 Interpump Group SPA 149,084 3,954 Azimut Holding SPA 202,425 3,949 Brembo SPA 48,188 3,786 Hera SPA 1,309,798 3,746 Cerved Information Solutions SPA 348,373 3,719 DiaSorin SPA 41,838 3,136 * De' Longhi SPA 100,859 3,075 Banca Popolare di Sondrio SCPA 806,309 3,004 Banca Generali SPA 102,595 2,948 Autogrill SPA 243,243 2,766 *,^ Yoox Net-A-Porter Group SPA 104,085 2,766 Societa Cattolica di Assicurazioni SCRL 297,335 2,643 2 Anima Holding SPA 400,385 2,617 Industria Macchine Automatiche SPA 27,202 2,398 2 Infrastrutture Wireless Italiane SPA 417,916 2,311 Ansaldo STS SPA 153,614 2,061 *,2 Enav SPA 479,819 1,964 Iren SPA 869,336 1,832 ^ Tod's SPA 23,692 1,831 Amplifon SPA 140,402 1,794 Ei Towers SPA 29,734 1,716 Saras SPA 802,180 1,676 * Banca IFIS SPA 34,981 1,509 MARR SPA 59,180 1,429 2 OVS SPA 214,039 1,425 Danieli & C Officine Meccaniche SPA Savings Shares 76,180 1,375 Reply SPA 7,550 1,322 Brunello Cucinelli SPA 49,301 1,292 *,2 Technogym SPA 159,438 1,242 Societa Iniziative Autostradali e Servizi SPA 121,716 1,227 Beni Stabili SpA SIIQ 1,905,479 1,210 ACEA SPA 82,626 1,189 ERG SPA 89,282 1,108 Datalogic SPA 38,554 1,057 2 RAI Way SPA 185,676 975 CIR-Compagnie Industriali Riunite SPA 602,779 970 Salini Impregilo SPA 281,377 958 ASTM SPA 60,173 928 Credito Emiliano SPA 123,008 860 Italmobiliare SPA 14,226 797 * Fincantieri SPA 798,287 781 *,^ Credito Valtellinese SPA 199,485 721 * Juventus Football Club SPA 707,194 652 Banca Monte dei Paschi di Siena SPA 39,002 641 * Piaggio & C SPA 300,931 624 Zignago Vetro SPA 71,507 590 Cairo Communication SPA 117,420 575 Immobiliare Grande Distribuzione SIIQ SPA 610,529 546 Cementir Holding SPA 81,811 493 * Safilo Group SPA 67,077 484
63
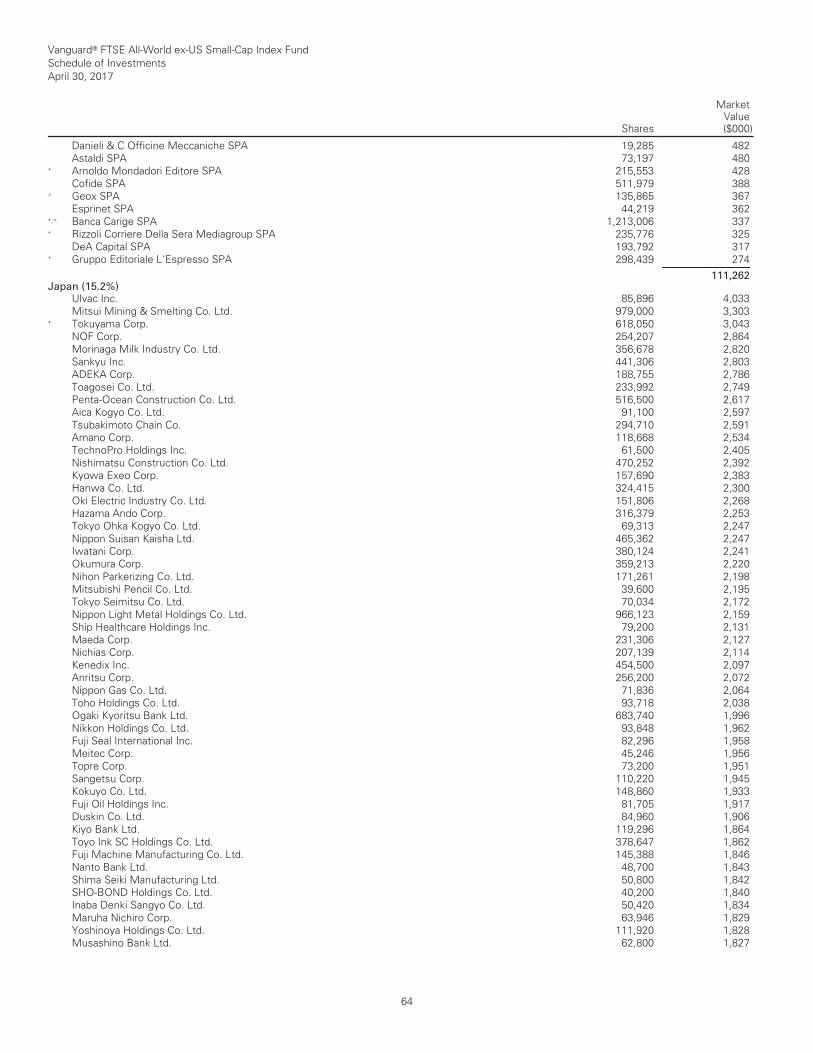
Vanguard® FTSE All-World ex-US Small-Cap Index Fund Schedule of Investments April 30, 2017
Shares
MarketValue($000)
__________________________________________________________________________________________________________________________________________________________________________________________________________________________________________________________________________________________________________________________________________________________________________________________________________________________________________________________________________________________________________________________________________________________________________________________________________________________________________________________________________________________ __________________________________________________________________________________________________________________________________________________________________________________________________________________________________________________________________________________________________________________________________________________________________________________________________________________________________________________________________________________________________________________________________________________________________________________________________________________________________________________________________________________________
Danieli & C Officine Meccaniche SPA 19,285 482 Astaldi SPA 73,197 480 * Arnoldo Mondadori Editore SPA 215,553 428 Cofide SPA 511,979 388 ^ Geox SPA 135,865 367 Esprinet SPA 44,219 362 *,^ Banca Carige SPA 1,213,006 337 * Rizzoli Corriere Della Sera Mediagroup SPA 235,776 325 DeA Capital SPA 193,792 317 * Gruppo Editoriale L'Espresso SPA 298,439 274 ___________ 111,262 Japan (15.2%)
Ulvac Inc. 85,896 4,033 Mitsui Mining & Smelting Co. Ltd. 979,000 3,303 * Tokuyama Corp. 618,050 3,043 NOF Corp. 254,207 2,864 Morinaga Milk Industry Co. Ltd. 356,678 2,820 Sankyu Inc. 441,306 2,803 ADEKA Corp. 188,755 2,786 Toagosei Co. Ltd. 233,992 2,749 Penta-Ocean Construction Co. Ltd. 516,500 2,617 Aica Kogyo Co. Ltd. 91,100 2,597 Tsubakimoto Chain Co. 294,710 2,591 Amano Corp. 118,668 2,534 TechnoPro Holdings Inc. 61,500 2,405 Nishimatsu Construction Co. Ltd. 470,252 2,392 Kyowa Exeo Corp. 157,690 2,383 Hanwa Co. Ltd. 324,415 2,300 Oki Electric Industry Co. Ltd. 151,806 2,268 Hazama Ando Corp. 316,379 2,253 Tokyo Ohka Kogyo Co. Ltd. 69,313 2,247 Nippon Suisan Kaisha Ltd. 465,362 2,247 Iwatani Corp. 380,124 2,241 Okumura Corp. 359,213 2,220 Nihon Parkerizing Co. Ltd. 171,261 2,198 Mitsubishi Pencil Co. Ltd. 39,600 2,195 Tokyo Seimitsu Co. Ltd. 70,034 2,172 Nippon Light Metal Holdings Co. Ltd. 966,123 2,159 Ship Healthcare Holdings Inc. 79,200 2,131 Maeda Corp. 231,306 2,127 Nichias Corp. 207,139 2,114 Kenedix Inc. 454,500 2,097 Anritsu Corp. 256,200 2,072 Nippon Gas Co. Ltd. 71,836 2,064 Toho Holdings Co. Ltd. 93,718 2,038 Ogaki Kyoritsu Bank Ltd. 683,740 1,996 Nikkon Holdings Co. Ltd. 93,848 1,962 Fuji Seal International Inc. 82,296 1,958 Meitec Corp. 45,246 1,956 Topre Corp. 73,200 1,951 Sangetsu Corp. 110,220 1,945 Kokuyo Co. Ltd. 148,860 1,933 Fuji Oil Holdings Inc. 81,705 1,917 Duskin Co. Ltd. 84,960 1,906 Kiyo Bank Ltd. 119,296 1,864 Toyo Ink SC Holdings Co. Ltd. 378,647 1,862 Fuji Machine Manufacturing Co. Ltd. 145,388 1,846 Nanto Bank Ltd. 48,700 1,843 Shima Seiki Manufacturing Ltd. 50,800 1,842 SHO-BOND Holdings Co. Ltd. 40,200 1,840 Inaba Denki Sangyo Co. Ltd. 50,420 1,834 Maruha Nichiro Corp. 63,946 1,829 Yoshinoya Holdings Co. Ltd. 111,920 1,828 Musashino Bank Ltd. 62,800 1,827
64
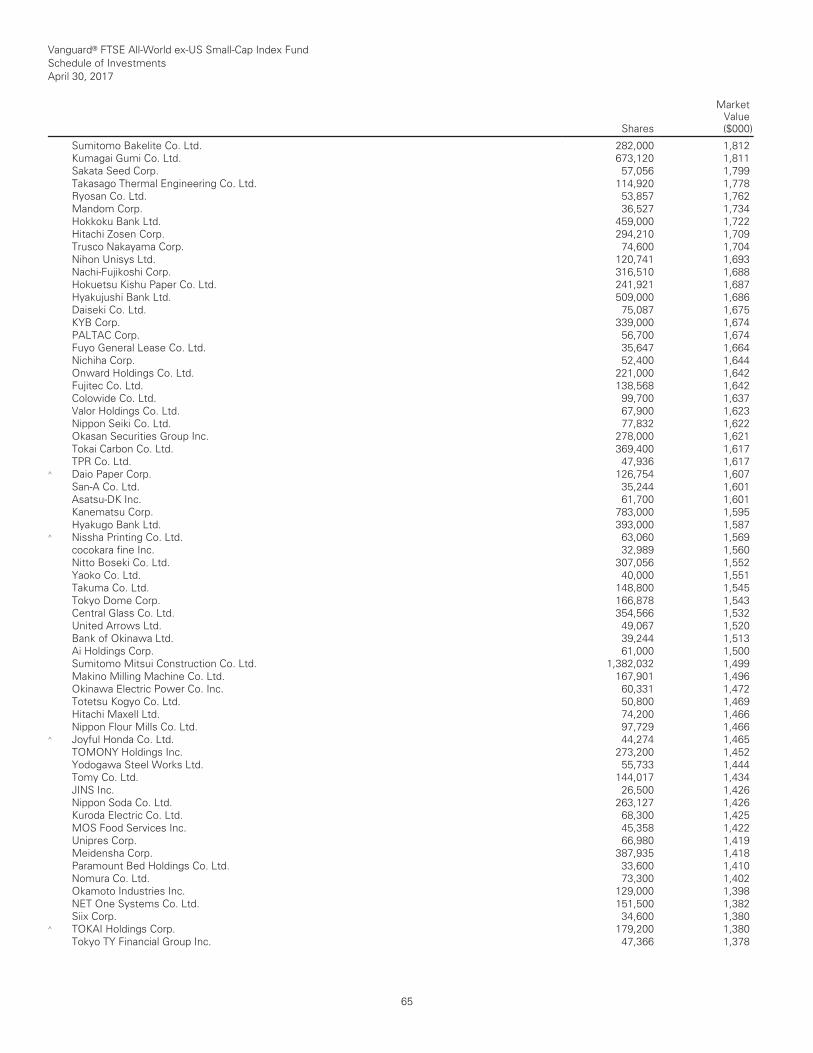
Vanguard® FTSE All-World ex-US Small-Cap Index Fund Schedule of Investments April 30, 2017
Shares
MarketValue($000)
__________________________________________________________________________________________________________________________________________________________________________________________________________________________________________________________________________________________________________________________________________________________________________________________________________________________________________________________________________________________________________________________________________________________________________________________________________________________________________________________________________________________ __________________________________________________________________________________________________________________________________________________________________________________________________________________________________________________________________________________________________________________________________________________________________________________________________________________________________________________________________________________________________________________________________________________________________________________________________________________________________________________________________________________________
Sumitomo Bakelite Co. Ltd. 282,000 1,812 Kumagai Gumi Co. Ltd. 673,120 1,811 Sakata Seed Corp. 57,056 1,799 Takasago Thermal Engineering Co. Ltd. 114,920 1,778 Ryosan Co. Ltd. 53,857 1,762 Mandom Corp. 36,527 1,734 Hokkoku Bank Ltd. 459,000 1,722 Hitachi Zosen Corp. 294,210 1,709 Trusco Nakayama Corp. 74,600 1,704 Nihon Unisys Ltd. 120,741 1,693 Nachi-Fujikoshi Corp. 316,510 1,688 Hokuetsu Kishu Paper Co. Ltd. 241,921 1,687 Hyakujushi Bank Ltd. 509,000 1,686 Daiseki Co. Ltd. 75,087 1,675 KYB Corp. 339,000 1,674 PALTAC Corp. 56,700 1,674 Fuyo General Lease Co. Ltd. 35,647 1,664 Nichiha Corp. 52,400 1,644 Onward Holdings Co. Ltd. 221,000 1,642 Fujitec Co. Ltd. 138,568 1,642 Colowide Co. Ltd. 99,700 1,637 Valor Holdings Co. Ltd. 67,900 1,623 Nippon Seiki Co. Ltd. 77,832 1,622 Okasan Securities Group Inc. 278,000 1,621 Tokai Carbon Co. Ltd. 369,400 1,617 TPR Co. Ltd. 47,936 1,617 ^ Daio Paper Corp. 126,754 1,607 San-A Co. Ltd. 35,244 1,601 Asatsu-DK Inc. 61,700 1,601 Kanematsu Corp. 783,000 1,595 Hyakugo Bank Ltd. 393,000 1,587 ^ Nissha Printing Co. Ltd. 63,060 1,569 cocokara fine Inc. 32,989 1,560 Nitto Boseki Co. Ltd. 307,056 1,552 Yaoko Co. Ltd. 40,000 1,551 Takuma Co. Ltd. 148,800 1,545 Tokyo Dome Corp. 166,878 1,543 Central Glass Co. Ltd. 354,566 1,532 United Arrows Ltd. 49,067 1,520 Bank of Okinawa Ltd. 39,244 1,513 Ai Holdings Corp. 61,000 1,500 Sumitomo Mitsui Construction Co. Ltd. 1,382,032 1,499 Makino Milling Machine Co. Ltd. 167,901 1,496 Okinawa Electric Power Co. Inc. 60,331 1,472 Totetsu Kogyo Co. Ltd. 50,800 1,469 Hitachi Maxell Ltd. 74,200 1,466 Nippon Flour Mills Co. Ltd. 97,729 1,466 ^ Joyful Honda Co. Ltd. 44,274 1,465 TOMONY Holdings Inc. 273,200 1,452 Yodogawa Steel Works Ltd. 55,733 1,444 Tomy Co. Ltd. 144,017 1,434 JINS Inc. 26,500 1,426 Nippon Soda Co. Ltd. 263,127 1,426 Kuroda Electric Co. Ltd. 68,300 1,425 MOS Food Services Inc. 45,358 1,422 Unipres Corp. 66,980 1,419 Meidensha Corp. 387,935 1,418 Paramount Bed Holdings Co. Ltd. 33,600 1,410 Nomura Co. Ltd. 73,300 1,402 Okamoto Industries Inc. 129,000 1,398 NET One Systems Co. Ltd. 151,500 1,382 Siix Corp. 34,600 1,380 ^ TOKAI Holdings Corp. 179,200 1,380 Tokyo TY Financial Group Inc. 47,366 1,378
65
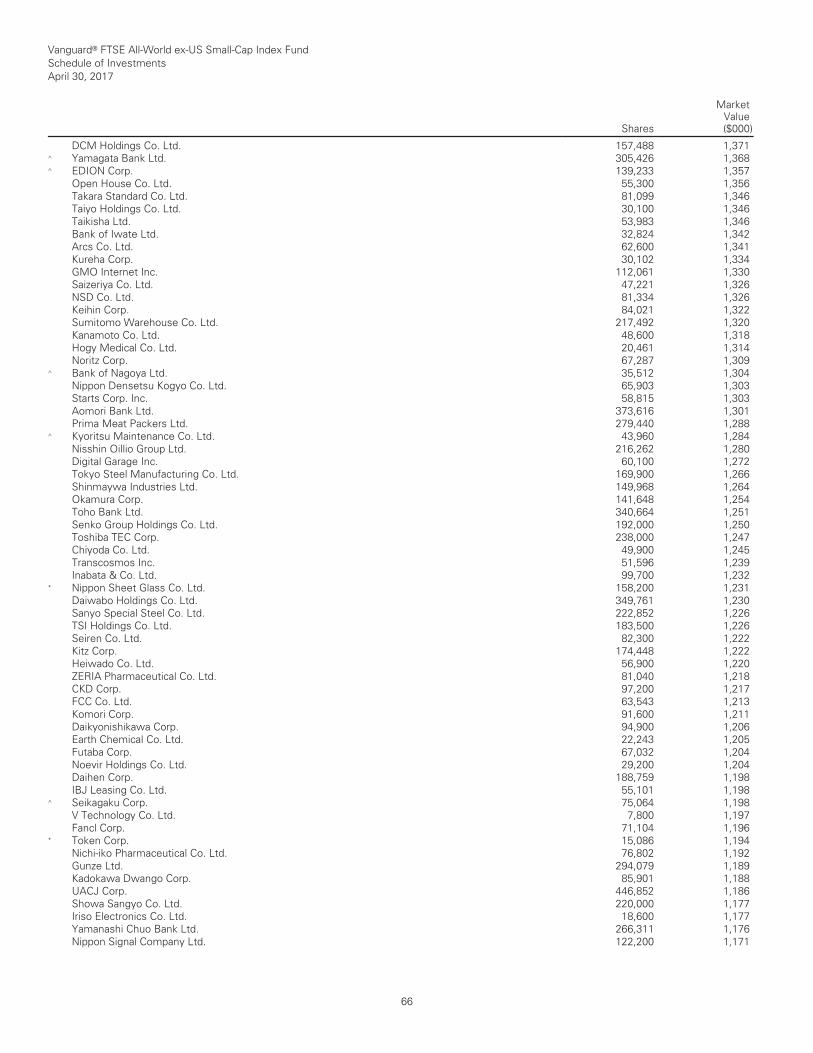
Vanguard® FTSE All-World ex-US Small-Cap Index Fund Schedule of Investments April 30, 2017
Shares
MarketValue($000)
__________________________________________________________________________________________________________________________________________________________________________________________________________________________________________________________________________________________________________________________________________________________________________________________________________________________________________________________________________________________________________________________________________________________________________________________________________________________________________________________________________________________ __________________________________________________________________________________________________________________________________________________________________________________________________________________________________________________________________________________________________________________________________________________________________________________________________________________________________________________________________________________________________________________________________________________________________________________________________________________________________________________________________________________________
DCM Holdings Co. Ltd. 157,488 1,371 ^ Yamagata Bank Ltd. 305,426 1,368 ^ EDION Corp. 139,233 1,357 Open House Co. Ltd. 55,300 1,356 Takara Standard Co. Ltd. 81,099 1,346 Taiyo Holdings Co. Ltd. 30,100 1,346 Taikisha Ltd. 53,983 1,346 Bank of Iwate Ltd. 32,824 1,342 Arcs Co. Ltd. 62,600 1,341 Kureha Corp. 30,102 1,334 GMO Internet Inc. 112,061 1,330 Saizeriya Co. Ltd. 47,221 1,326 NSD Co. Ltd. 81,334 1,326 Keihin Corp. 84,021 1,322 Sumitomo Warehouse Co. Ltd. 217,492 1,320 Kanamoto Co. Ltd. 48,600 1,318 Hogy Medical Co. Ltd. 20,461 1,314 Noritz Corp. 67,287 1,309 ^ Bank of Nagoya Ltd. 35,512 1,304 Nippon Densetsu Kogyo Co. Ltd. 65,903 1,303 Starts Corp. Inc. 58,815 1,303 Aomori Bank Ltd. 373,616 1,301 Prima Meat Packers Ltd. 279,440 1,288 ^ Kyoritsu Maintenance Co. Ltd. 43,960 1,284 Nisshin Oillio Group Ltd. 216,262 1,280 Digital Garage Inc. 60,100 1,272 Tokyo Steel Manufacturing Co. Ltd. 169,900 1,266 Shinmaywa Industries Ltd. 149,968 1,264 Okamura Corp. 141,648 1,254 Toho Bank Ltd. 340,664 1,251 Senko Group Holdings Co. Ltd. 192,000 1,250 Toshiba TEC Corp. 238,000 1,247 Chiyoda Co. Ltd. 49,900 1,245 Transcosmos Inc. 51,596 1,239 Inabata & Co. Ltd. 99,700 1,232 * Nippon Sheet Glass Co. Ltd. 158,200 1,231 Daiwabo Holdings Co. Ltd. 349,761 1,230 Sanyo Special Steel Co. Ltd. 222,852 1,226 TSI Holdings Co. Ltd. 183,500 1,226 Seiren Co. Ltd. 82,300 1,222 Kitz Corp. 174,448 1,222 Heiwado Co. Ltd. 56,900 1,220 ZERIA Pharmaceutical Co. Ltd. 81,040 1,218 CKD Corp. 97,200 1,217 FCC Co. Ltd. 63,543 1,213 Komori Corp. 91,600 1,211 Daikyonishikawa Corp. 94,900 1,206 Earth Chemical Co. Ltd. 22,243 1,205 Futaba Corp. 67,032 1,204 Noevir Holdings Co. Ltd. 29,200 1,204 Daihen Corp. 188,759 1,198 IBJ Leasing Co. Ltd. 55,101 1,198 ^ Seikagaku Corp. 75,064 1,198 V Technology Co. Ltd. 7,800 1,197 Fancl Corp. 71,104 1,196 * Token Corp. 15,086 1,194 Nichi-iko Pharmaceutical Co. Ltd. 76,802 1,192 Gunze Ltd. 294,079 1,189 Kadokawa Dwango Corp. 85,901 1,188 UACJ Corp. 446,852 1,186 Showa Sangyo Co. Ltd. 220,000 1,177 Iriso Electronics Co. Ltd. 18,600 1,177 Yamanashi Chuo Bank Ltd. 266,311 1,176 Nippon Signal Company Ltd. 122,200 1,171
66
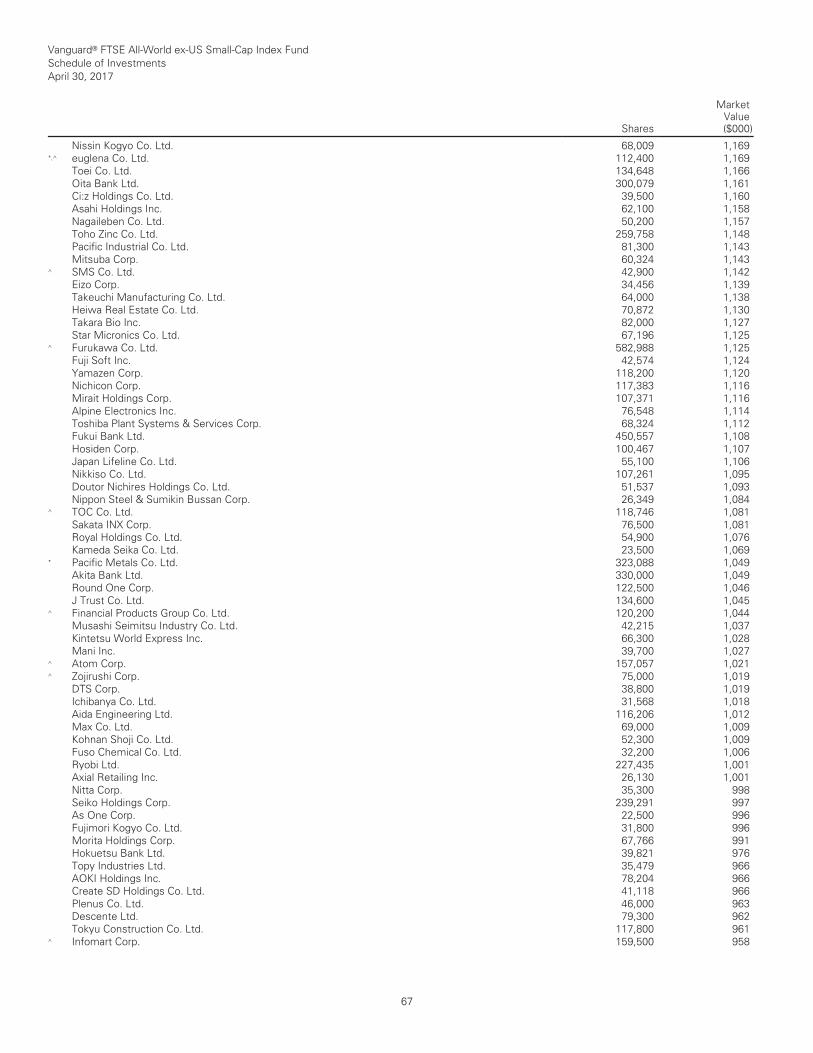
Vanguard® FTSE All-World ex-US Small-Cap Index Fund Schedule of Investments April 30, 2017
Shares
MarketValue($000)
__________________________________________________________________________________________________________________________________________________________________________________________________________________________________________________________________________________________________________________________________________________________________________________________________________________________________________________________________________________________________________________________________________________________________________________________________________________________________________________________________________________________ __________________________________________________________________________________________________________________________________________________________________________________________________________________________________________________________________________________________________________________________________________________________________________________________________________________________________________________________________________________________________________________________________________________________________________________________________________________________________________________________________________________________
Nissin Kogyo Co. Ltd. 68,009 1,169 *,^ euglena Co. Ltd. 112,400 1,169 Toei Co. Ltd. 134,648 1,166 Oita Bank Ltd. 300,079 1,161 Ci:z Holdings Co. Ltd. 39,500 1,160 Asahi Holdings Inc. 62,100 1,158 Nagaileben Co. Ltd. 50,200 1,157 Toho Zinc Co. Ltd. 259,758 1,148 Pacific Industrial Co. Ltd. 81,300 1,143 Mitsuba Corp. 60,324 1,143 ^ SMS Co. Ltd. 42,900 1,142 Eizo Corp. 34,456 1,139 Takeuchi Manufacturing Co. Ltd. 64,000 1,138 Heiwa Real Estate Co. Ltd. 70,872 1,130 Takara Bio Inc. 82,000 1,127 Star Micronics Co. Ltd. 67,196 1,125 ^ Furukawa Co. Ltd. 582,988 1,125 Fuji Soft Inc. 42,574 1,124 Yamazen Corp. 118,200 1,120 Nichicon Corp. 117,383 1,116 Mirait Holdings Corp. 107,371 1,116 Alpine Electronics Inc. 76,548 1,114 Toshiba Plant Systems & Services Corp. 68,324 1,112 Fukui Bank Ltd. 450,557 1,108 Hosiden Corp. 100,467 1,107 Japan Lifeline Co. Ltd. 55,100 1,106 Nikkiso Co. Ltd. 107,261 1,095 Doutor Nichires Holdings Co. Ltd. 51,537 1,093 Nippon Steel & Sumikin Bussan Corp. 26,349 1,084 ^ TOC Co. Ltd. 118,746 1,081 Sakata INX Corp. 76,500 1,081 Royal Holdings Co. Ltd. 54,900 1,076 Kameda Seika Co. Ltd. 23,500 1,069 * Pacific Metals Co. Ltd. 323,088 1,049 Akita Bank Ltd. 330,000 1,049 Round One Corp. 122,500 1,046 J Trust Co. Ltd. 134,600 1,045 ^ Financial Products Group Co. Ltd. 120,200 1,044 Musashi Seimitsu Industry Co. Ltd. 42,215 1,037 Kintetsu World Express Inc. 66,300 1,028 Mani Inc. 39,700 1,027 ^ Atom Corp. 157,057 1,021 ^ Zojirushi Corp. 75,000 1,019 DTS Corp. 38,800 1,019 Ichibanya Co. Ltd. 31,568 1,018 Aida Engineering Ltd. 116,206 1,012 Max Co. Ltd. 69,000 1,009 Kohnan Shoji Co. Ltd. 52,300 1,009 Fuso Chemical Co. Ltd. 32,200 1,006 Ryobi Ltd. 227,435 1,001 Axial Retailing Inc. 26,130 1,001 Nitta Corp. 35,300 998 Seiko Holdings Corp. 239,291 997 As One Corp. 22,500 996 Fujimori Kogyo Co. Ltd. 31,800 996 Morita Holdings Corp. 67,766 991 Hokuetsu Bank Ltd. 39,821 976 Topy Industries Ltd. 35,479 966 AOKI Holdings Inc. 78,204 966 Create SD Holdings Co. Ltd. 41,118 966 Plenus Co. Ltd. 46,000 963 Descente Ltd. 79,300 962 Tokyu Construction Co. Ltd. 117,800 961 ^ Infomart Corp. 159,500 958
67
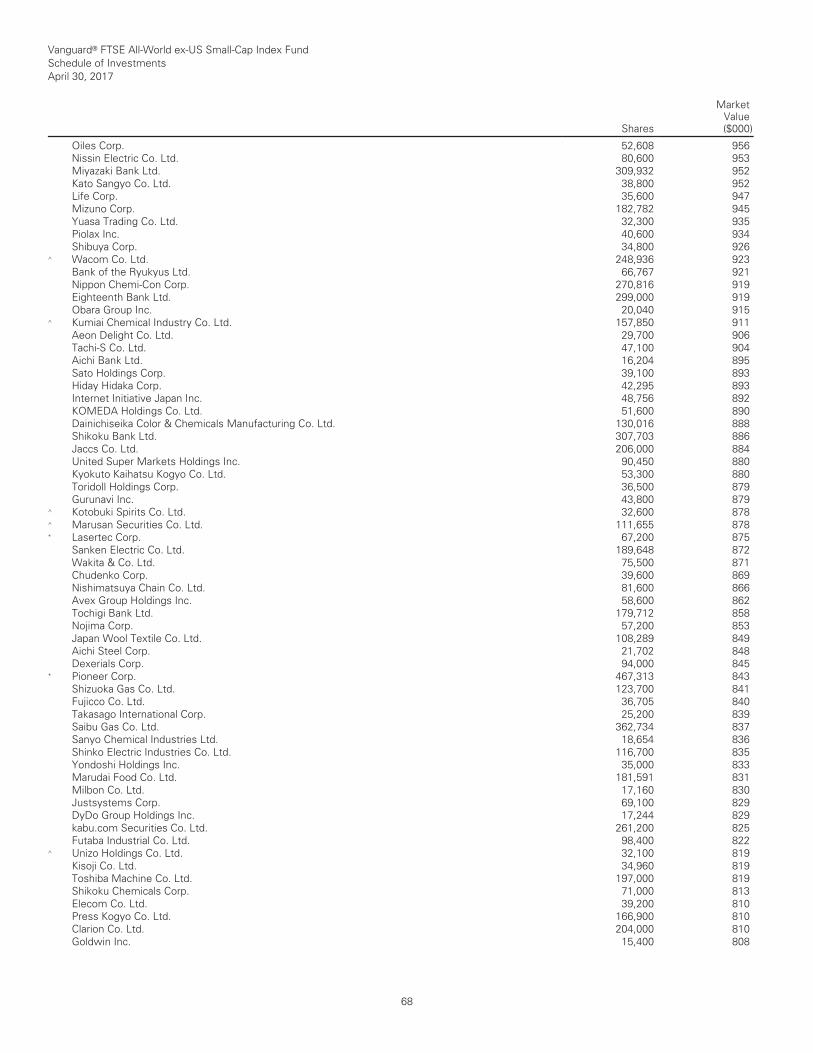
Vanguard® FTSE All-World ex-US Small-Cap Index Fund Schedule of Investments April 30, 2017
Shares
MarketValue($000)
__________________________________________________________________________________________________________________________________________________________________________________________________________________________________________________________________________________________________________________________________________________________________________________________________________________________________________________________________________________________________________________________________________________________________________________________________________________________________________________________________________________________ __________________________________________________________________________________________________________________________________________________________________________________________________________________________________________________________________________________________________________________________________________________________________________________________________________________________________________________________________________________________________________________________________________________________________________________________________________________________________________________________________________________________
Oiles Corp. 52,608 956 Nissin Electric Co. Ltd. 80,600 953 Miyazaki Bank Ltd. 309,932 952 Kato Sangyo Co. Ltd. 38,800 952 Life Corp. 35,600 947 Mizuno Corp. 182,782 945 Yuasa Trading Co. Ltd. 32,300 935 Piolax Inc. 40,600 934 Shibuya Corp. 34,800 926 ^ Wacom Co. Ltd. 248,936 923 Bank of the Ryukyus Ltd. 66,767 921 Nippon Chemi-Con Corp. 270,816 919 Eighteenth Bank Ltd. 299,000 919 Obara Group Inc. 20,040 915 ^ Kumiai Chemical Industry Co. Ltd. 157,850 911 Aeon Delight Co. Ltd. 29,700 906 Tachi-S Co. Ltd. 47,100 904 Aichi Bank Ltd. 16,204 895 Sato Holdings Corp. 39,100 893 Hiday Hidaka Corp. 42,295 893 Internet Initiative Japan Inc. 48,756 892 KOMEDA Holdings Co. Ltd. 51,600 890 Dainichiseika Color & Chemicals Manufacturing Co. Ltd. 130,016 888 Shikoku Bank Ltd. 307,703 886 Jaccs Co. Ltd. 206,000 884 United Super Markets Holdings Inc. 90,450 880 Kyokuto Kaihatsu Kogyo Co. Ltd. 53,300 880 Toridoll Holdings Corp. 36,500 879 Gurunavi Inc. 43,800 879 ^ Kotobuki Spirits Co. Ltd. 32,600 878 ^ Marusan Securities Co. Ltd. 111,655 878 * Lasertec Corp. 67,200 875 Sanken Electric Co. Ltd. 189,648 872 Wakita & Co. Ltd. 75,500 871 Chudenko Corp. 39,600 869 Nishimatsuya Chain Co. Ltd. 81,600 866 Avex Group Holdings Inc. 58,600 862 Tochigi Bank Ltd. 179,712 858 Nojima Corp. 57,200 853 Japan Wool Textile Co. Ltd. 108,289 849 Aichi Steel Corp. 21,702 848 Dexerials Corp. 94,000 845 * Pioneer Corp. 467,313 843 Shizuoka Gas Co. Ltd. 123,700 841 Fujicco Co. Ltd. 36,705 840 Takasago International Corp. 25,200 839 Saibu Gas Co. Ltd. 362,734 837 Sanyo Chemical Industries Ltd. 18,654 836 Shinko Electric Industries Co. Ltd. 116,700 835 Yondoshi Holdings Inc. 35,000 833 Marudai Food Co. Ltd. 181,591 831 Milbon Co. Ltd. 17,160 830 Justsystems Corp. 69,100 829 DyDo Group Holdings Inc. 17,244 829 kabu.com Securities Co. Ltd. 261,200 825 Futaba Industrial Co. Ltd. 98,400 822 ^ Unizo Holdings Co. Ltd. 32,100 819 Kisoji Co. Ltd. 34,960 819 Toshiba Machine Co. Ltd. 197,000 819 Shikoku Chemicals Corp. 71,000 813 Elecom Co. Ltd. 39,200 810 Press Kogyo Co. Ltd. 166,900 810 Clarion Co. Ltd. 204,000 810 Goldwin Inc. 15,400 808
68
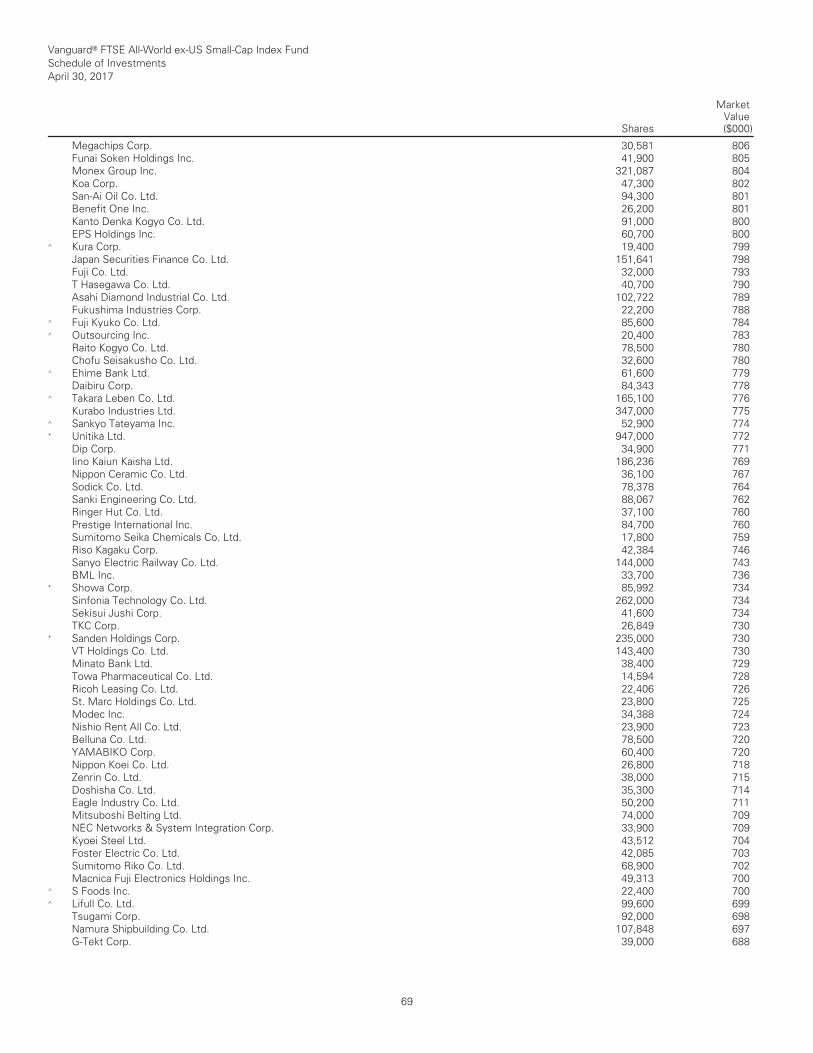
Vanguard® FTSE All-World ex-US Small-Cap Index Fund Schedule of Investments April 30, 2017
Shares
MarketValue($000)
__________________________________________________________________________________________________________________________________________________________________________________________________________________________________________________________________________________________________________________________________________________________________________________________________________________________________________________________________________________________________________________________________________________________________________________________________________________________________________________________________________________________ __________________________________________________________________________________________________________________________________________________________________________________________________________________________________________________________________________________________________________________________________________________________________________________________________________________________________________________________________________________________________________________________________________________________________________________________________________________________________________________________________________________________
Megachips Corp. 30,581 806 Funai Soken Holdings Inc. 41,900 805 Monex Group Inc. 321,087 804 Koa Corp. 47,300 802 San-Ai Oil Co. Ltd. 94,300 801 Benefit One Inc. 26,200 801 Kanto Denka Kogyo Co. Ltd. 91,000 800 EPS Holdings Inc. 60,700 800 ^ Kura Corp. 19,400 799 Japan Securities Finance Co. Ltd. 151,641 798 Fuji Co. Ltd. 32,000 793 T Hasegawa Co. Ltd. 40,700 790 Asahi Diamond Industrial Co. Ltd. 102,722 789 Fukushima Industries Corp. 22,200 788 ^ Fuji Kyuko Co. Ltd. 85,600 784 ^ Outsourcing Inc. 20,400 783 Raito Kogyo Co. Ltd. 78,500 780 Chofu Seisakusho Co. Ltd. 32,600 780 ^ Ehime Bank Ltd. 61,600 779 Daibiru Corp. 84,343 778 ^ Takara Leben Co. Ltd. 165,100 776 Kurabo Industries Ltd. 347,000 775 ^ Sankyo Tateyama Inc. 52,900 774 * Unitika Ltd. 947,000 772 Dip Corp. 34,900 771 Iino Kaiun Kaisha Ltd. 186,236 769 Nippon Ceramic Co. Ltd. 36,100 767 Sodick Co. Ltd. 78,378 764 Sanki Engineering Co. Ltd. 88,067 762 Ringer Hut Co. Ltd. 37,100 760 Prestige International Inc. 84,700 760 Sumitomo Seika Chemicals Co. Ltd. 17,800 759 Riso Kagaku Corp. 42,384 746 Sanyo Electric Railway Co. Ltd. 144,000 743 BML Inc. 33,700 736 * Showa Corp. 85,992 734 Sinfonia Technology Co. Ltd. 262,000 734 Sekisui Jushi Corp. 41,600 734 TKC Corp. 26,849 730 * Sanden Holdings Corp. 235,000 730 VT Holdings Co. Ltd. 143,400 730 Minato Bank Ltd. 38,400 729 Towa Pharmaceutical Co. Ltd. 14,594 728 Ricoh Leasing Co. Ltd. 22,406 726 St. Marc Holdings Co. Ltd. 23,800 725 Modec Inc. 34,388 724 Nishio Rent All Co. Ltd. 23,900 723 Belluna Co. Ltd. 78,500 720 YAMABIKO Corp. 60,400 720 Nippon Koei Co. Ltd. 26,800 718 Zenrin Co. Ltd. 38,000 715 Doshisha Co. Ltd. 35,300 714 Eagle Industry Co. Ltd. 50,200 711 Mitsuboshi Belting Ltd. 74,000 709 NEC Networks & System Integration Corp. 33,900 709 Kyoei Steel Ltd. 43,512 704 Foster Electric Co. Ltd. 42,085 703 Sumitomo Riko Co. Ltd. 68,900 702 Macnica Fuji Electronics Holdings Inc. 49,313 700 ^ S Foods Inc. 22,400 700 ^ Lifull Co. Ltd. 99,600 699 Tsugami Corp. 92,000 698 Namura Shipbuilding Co. Ltd. 107,848 697 G-Tekt Corp. 39,000 688
69
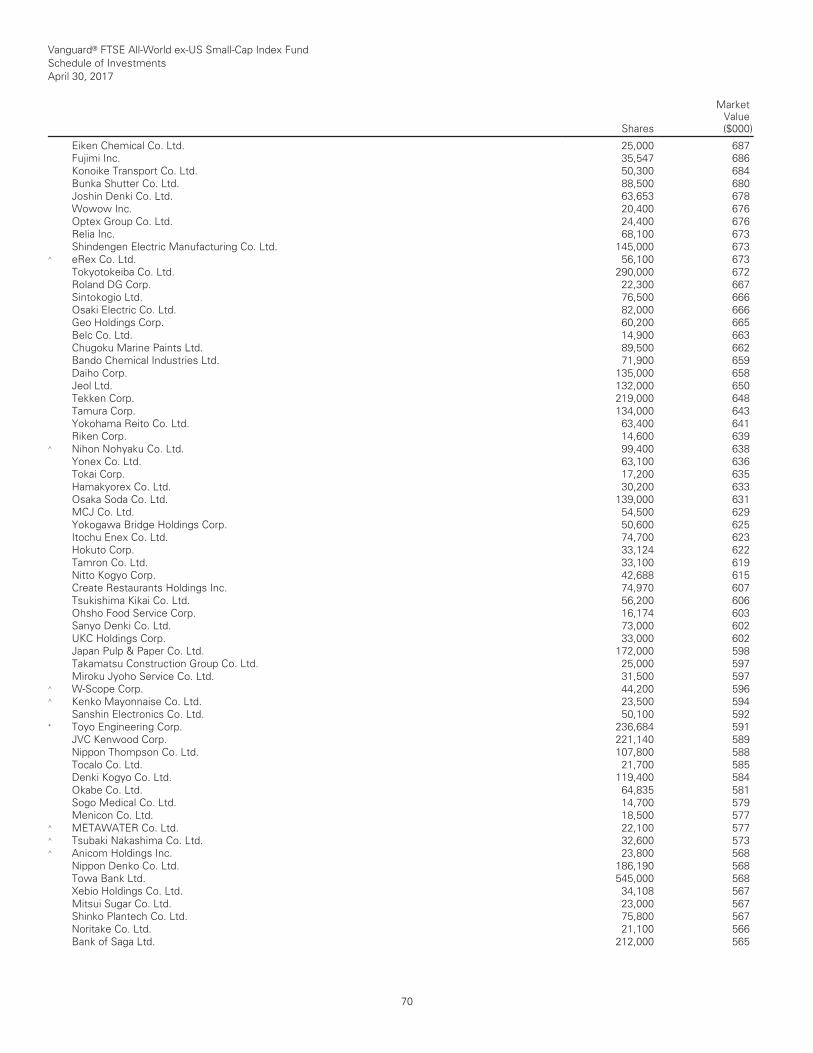
Vanguard® FTSE All-World ex-US Small-Cap Index Fund Schedule of Investments April 30, 2017
Shares
MarketValue($000)
__________________________________________________________________________________________________________________________________________________________________________________________________________________________________________________________________________________________________________________________________________________________________________________________________________________________________________________________________________________________________________________________________________________________________________________________________________________________________________________________________________________________ __________________________________________________________________________________________________________________________________________________________________________________________________________________________________________________________________________________________________________________________________________________________________________________________________________________________________________________________________________________________________________________________________________________________________________________________________________________________________________________________________________________________
Eiken Chemical Co. Ltd. 25,000 687 Fujimi Inc. 35,547 686 Konoike Transport Co. Ltd. 50,300 684 Bunka Shutter Co. Ltd. 88,500 680 Joshin Denki Co. Ltd. 63,653 678 Wowow Inc. 20,400 676 Optex Group Co. Ltd. 24,400 676 Relia Inc. 68,100 673 Shindengen Electric Manufacturing Co. Ltd. 145,000 673 ^ eRex Co. Ltd. 56,100 673 Tokyotokeiba Co. Ltd. 290,000 672 Roland DG Corp. 22,300 667 Sintokogio Ltd. 76,500 666 Osaki Electric Co. Ltd. 82,000 666 Geo Holdings Corp. 60,200 665 Belc Co. Ltd. 14,900 663 Chugoku Marine Paints Ltd. 89,500 662 Bando Chemical Industries Ltd. 71,900 659 Daiho Corp. 135,000 658 Jeol Ltd. 132,000 650 Tekken Corp. 219,000 648 Tamura Corp. 134,000 643 Yokohama Reito Co. Ltd. 63,400 641 Riken Corp. 14,600 639 ^ Nihon Nohyaku Co. Ltd. 99,400 638 Yonex Co. Ltd. 63,100 636 Tokai Corp. 17,200 635 Hamakyorex Co. Ltd. 30,200 633 Osaka Soda Co. Ltd. 139,000 631 MCJ Co. Ltd. 54,500 629 Yokogawa Bridge Holdings Corp. 50,600 625 Itochu Enex Co. Ltd. 74,700 623 Hokuto Corp. 33,124 622 Tamron Co. Ltd. 33,100 619 Nitto Kogyo Corp. 42,688 615 Create Restaurants Holdings Inc. 74,970 607 Tsukishima Kikai Co. Ltd. 56,200 606 Ohsho Food Service Corp. 16,174 603 Sanyo Denki Co. Ltd. 73,000 602 UKC Holdings Corp. 33,000 602 Japan Pulp & Paper Co. Ltd. 172,000 598 Takamatsu Construction Group Co. Ltd. 25,000 597 Miroku Jyoho Service Co. Ltd. 31,500 597 ^ W-Scope Corp. 44,200 596 ^ Kenko Mayonnaise Co. Ltd. 23,500 594 Sanshin Electronics Co. Ltd. 50,100 592 * Toyo Engineering Corp. 236,684 591 JVC Kenwood Corp. 221,140 589 Nippon Thompson Co. Ltd. 107,800 588 Tocalo Co. Ltd. 21,700 585 Denki Kogyo Co. Ltd. 119,400 584 Okabe Co. Ltd. 64,835 581 Sogo Medical Co. Ltd. 14,700 579 Menicon Co. Ltd. 18,500 577 ^ METAWATER Co. Ltd. 22,100 577 ^ Tsubaki Nakashima Co. Ltd. 32,600 573 ^ Anicom Holdings Inc. 23,800 568 Nippon Denko Co. Ltd. 186,190 568 Towa Bank Ltd. 545,000 568 Xebio Holdings Co. Ltd. 34,108 567 Mitsui Sugar Co. Ltd. 23,000 567 Shinko Plantech Co. Ltd. 75,800 567 Noritake Co. Ltd. 21,100 566 Bank of Saga Ltd. 212,000 565
70
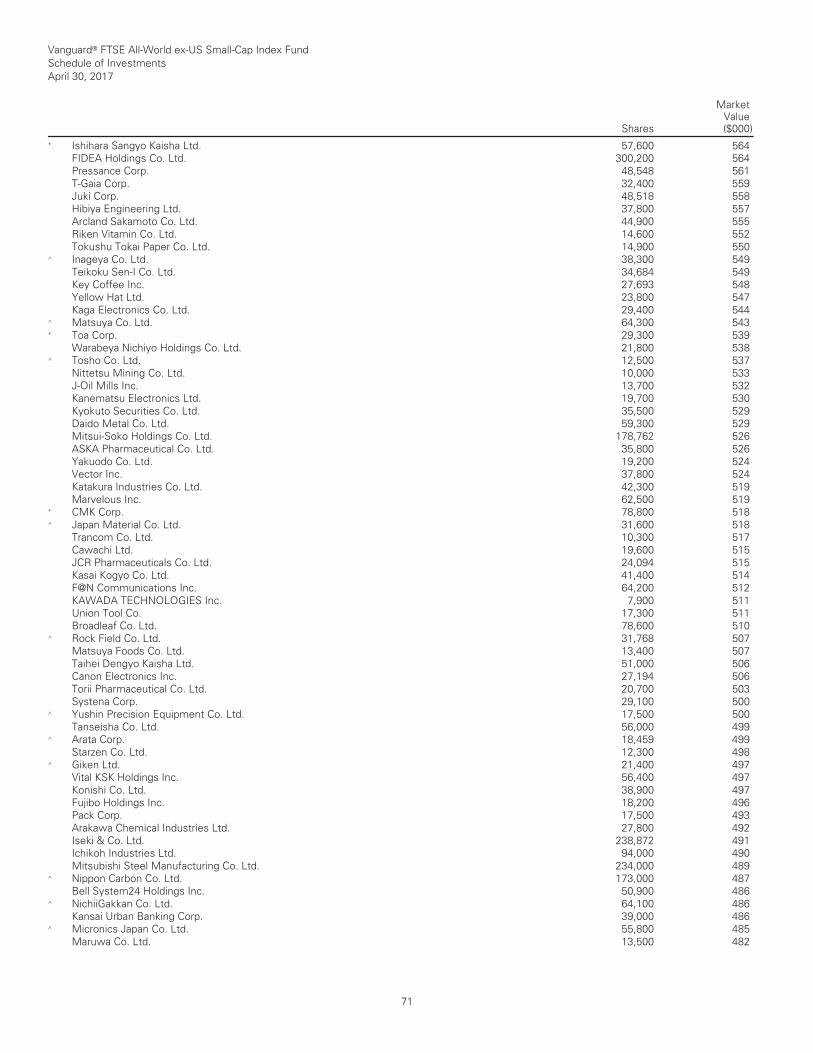
Vanguard® FTSE All-World ex-US Small-Cap Index Fund Schedule of Investments April 30, 2017
Shares
MarketValue($000)
__________________________________________________________________________________________________________________________________________________________________________________________________________________________________________________________________________________________________________________________________________________________________________________________________________________________________________________________________________________________________________________________________________________________________________________________________________________________________________________________________________________________ __________________________________________________________________________________________________________________________________________________________________________________________________________________________________________________________________________________________________________________________________________________________________________________________________________________________________________________________________________________________________________________________________________________________________________________________________________________________________________________________________________________________
* Ishihara Sangyo Kaisha Ltd. 57,600 564 FIDEA Holdings Co. Ltd. 300,200 564 Pressance Corp. 48,548 561 T-Gaia Corp. 32,400 559 Juki Corp. 48,518 558 Hibiya Engineering Ltd. 37,800 557 Arcland Sakamoto Co. Ltd. 44,900 555 Riken Vitamin Co. Ltd. 14,600 552 Tokushu Tokai Paper Co. Ltd. 14,900 550 ^ Inageya Co. Ltd. 38,300 549 Teikoku Sen-I Co. Ltd. 34,684 549 Key Coffee Inc. 27,693 548 Yellow Hat Ltd. 23,800 547 Kaga Electronics Co. Ltd. 29,400 544 ^ Matsuya Co. Ltd. 64,300 543 * Toa Corp. 29,300 539 Warabeya Nichiyo Holdings Co. Ltd. 21,800 538 ^ Tosho Co. Ltd. 12,500 537 Nittetsu Mining Co. Ltd. 10,000 533 J-Oil Mills Inc. 13,700 532 Kanematsu Electronics Ltd. 19,700 530 Kyokuto Securities Co. Ltd. 35,500 529 Daido Metal Co. Ltd. 59,300 529 Mitsui-Soko Holdings Co. Ltd. 178,762 526 ASKA Pharmaceutical Co. Ltd. 35,800 526 Yakuodo Co. Ltd. 19,200 524 Vector Inc. 37,800 524 Katakura Industries Co. Ltd. 42,300 519 Marvelous Inc. 62,500 519 * CMK Corp. 78,800 518 ^ Japan Material Co. Ltd. 31,600 518 Trancom Co. Ltd. 10,300 517 Cawachi Ltd. 19,600 515 JCR Pharmaceuticals Co. Ltd. 24,094 515 Kasai Kogyo Co. Ltd. 41,400 514 F@N Communications Inc. 64,200 512 KAWADA TECHNOLOGIES Inc. 7,900 511 Union Tool Co. 17,300 511 Broadleaf Co. Ltd. 78,600 510 ^ Rock Field Co. Ltd. 31,768 507 Matsuya Foods Co. Ltd. 13,400 507 Taihei Dengyo Kaisha Ltd. 51,000 506 Canon Electronics Inc. 27,194 506 Torii Pharmaceutical Co. Ltd. 20,700 503 Systena Corp. 29,100 500 ^ Yushin Precision Equipment Co. Ltd. 17,500 500 Tanseisha Co. Ltd. 56,000 499 ^ Arata Corp. 18,459 499 Starzen Co. Ltd. 12,300 498 ^ Giken Ltd. 21,400 497 Vital KSK Holdings Inc. 56,400 497 Konishi Co. Ltd. 38,900 497 Fujibo Holdings Inc. 18,200 496 Pack Corp. 17,500 493 Arakawa Chemical Industries Ltd. 27,800 492 Iseki & Co. Ltd. 238,872 491 Ichikoh Industries Ltd. 94,000 490 Mitsubishi Steel Manufacturing Co. Ltd. 234,000 489 ^ Nippon Carbon Co. Ltd. 173,000 487 Bell System24 Holdings Inc. 50,900 486 ^ NichiiGakkan Co. Ltd. 64,100 486 Kansai Urban Banking Corp. 39,000 486 ^ Micronics Japan Co. Ltd. 55,800 485 Maruwa Co. Ltd. 13,500 482
71
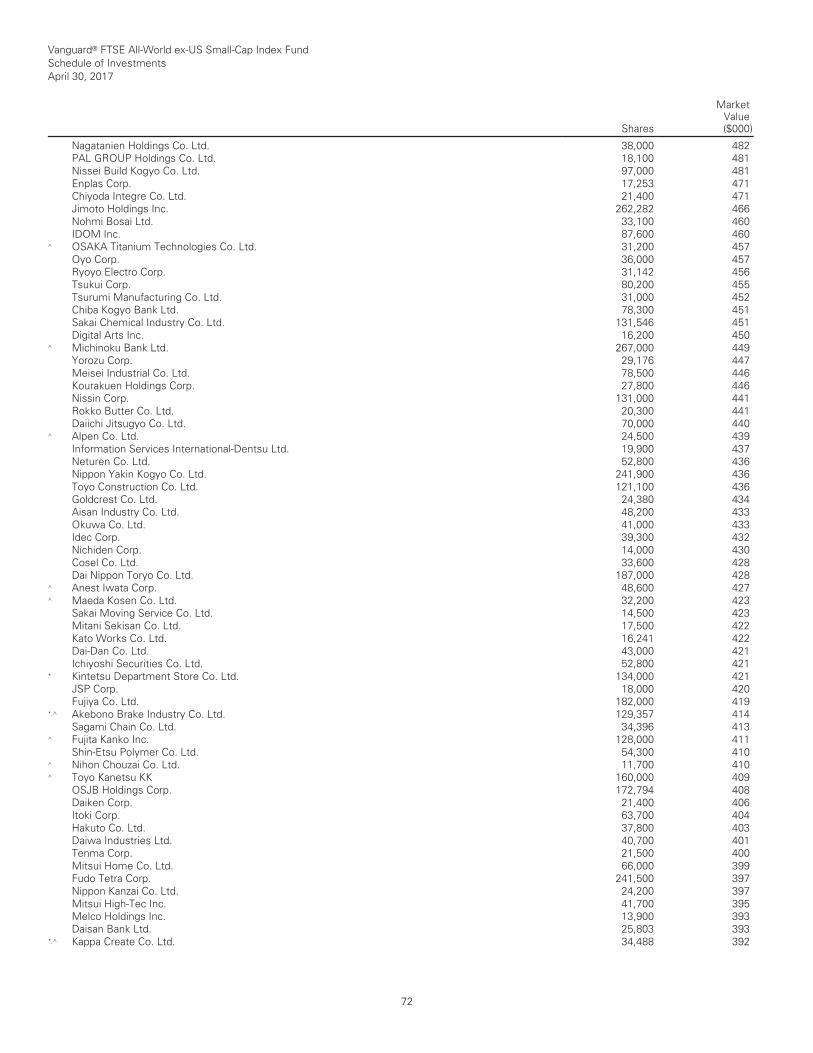
Vanguard® FTSE All-World ex-US Small-Cap Index Fund Schedule of Investments April 30, 2017
Shares
MarketValue($000)
__________________________________________________________________________________________________________________________________________________________________________________________________________________________________________________________________________________________________________________________________________________________________________________________________________________________________________________________________________________________________________________________________________________________________________________________________________________________________________________________________________________________ __________________________________________________________________________________________________________________________________________________________________________________________________________________________________________________________________________________________________________________________________________________________________________________________________________________________________________________________________________________________________________________________________________________________________________________________________________________________________________________________________________________________
Nagatanien Holdings Co. Ltd. 38,000 482 PAL GROUP Holdings Co. Ltd. 18,100 481 Nissei Build Kogyo Co. Ltd. 97,000 481 Enplas Corp. 17,253 471 Chiyoda Integre Co. Ltd. 21,400 471 Jimoto Holdings Inc. 262,282 466 Nohmi Bosai Ltd. 33,100 460 IDOM Inc. 87,600 460 ^ OSAKA Titanium Technologies Co. Ltd. 31,200 457 Oyo Corp. 36,000 457 Ryoyo Electro Corp. 31,142 456 Tsukui Corp. 80,200 455 Tsurumi Manufacturing Co. Ltd. 31,000 452 Chiba Kogyo Bank Ltd. 78,300 451 Sakai Chemical Industry Co. Ltd. 131,546 451 Digital Arts Inc. 16,200 450 ^ Michinoku Bank Ltd. 267,000 449 Yorozu Corp. 29,176 447 Meisei Industrial Co. Ltd. 78,500 446 Kourakuen Holdings Corp. 27,800 446 Nissin Corp. 131,000 441 Rokko Butter Co. Ltd. 20,300 441 Daiichi Jitsugyo Co. Ltd. 70,000 440 ^ Alpen Co. Ltd. 24,500 439 Information Services International-Dentsu Ltd. 19,900 437 Neturen Co. Ltd. 52,800 436 Nippon Yakin Kogyo Co. Ltd. 241,900 436 Toyo Construction Co. Ltd. 121,100 436 Goldcrest Co. Ltd. 24,380 434 Aisan Industry Co. Ltd. 48,200 433 Okuwa Co. Ltd. 41,000 433 Idec Corp. 39,300 432 Nichiden Corp. 14,000 430 Cosel Co. Ltd. 33,600 428 Dai Nippon Toryo Co. Ltd. 187,000 428 ^ Anest Iwata Corp. 48,600 427 ^ Maeda Kosen Co. Ltd. 32,200 423 Sakai Moving Service Co. Ltd. 14,500 423 Mitani Sekisan Co. Ltd. 17,500 422 Kato Works Co. Ltd. 16,241 422 Dai-Dan Co. Ltd. 43,000 421 Ichiyoshi Securities Co. Ltd. 52,800 421 * Kintetsu Department Store Co. Ltd. 134,000 421 JSP Corp. 18,000 420 Fujiya Co. Ltd. 182,000 419 *,^ Akebono Brake Industry Co. Ltd. 129,357 414 Sagami Chain Co. Ltd. 34,396 413 ^ Fujita Kanko Inc. 128,000 411 Shin-Etsu Polymer Co. Ltd. 54,300 410 ^ Nihon Chouzai Co. Ltd. 11,700 410 ^ Toyo Kanetsu KK 160,000 409 OSJB Holdings Corp. 172,794 408 Daiken Corp. 21,400 406 Itoki Corp. 63,700 404 Hakuto Co. Ltd. 37,800 403 Daiwa Industries Ltd. 40,700 401 Tenma Corp. 21,500 400 Mitsui Home Co. Ltd. 66,000 399 Fudo Tetra Corp. 241,500 397 Nippon Kanzai Co. Ltd. 24,200 397 Mitsui High-Tec Inc. 41,700 395 Melco Holdings Inc. 13,900 393 Daisan Bank Ltd. 25,803 393 *,^ Kappa Create Co. Ltd. 34,488 392
72
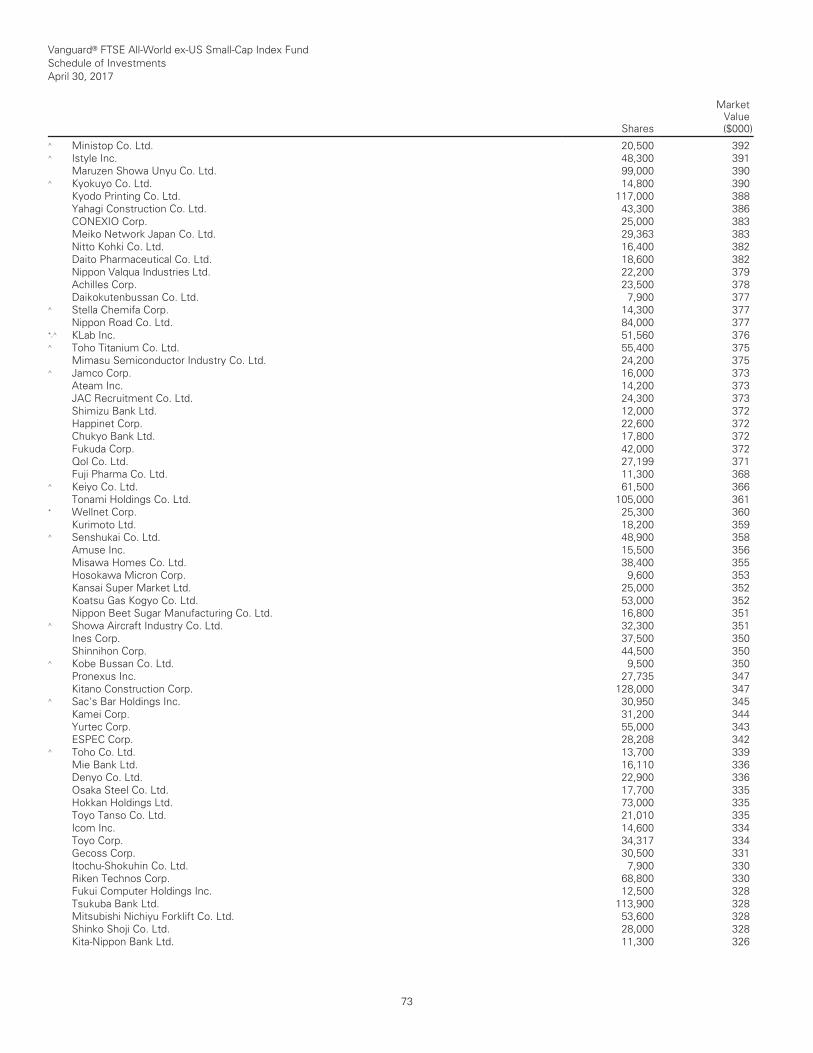
Vanguard® FTSE All-World ex-US Small-Cap Index Fund Schedule of Investments April 30, 2017
Shares
MarketValue($000)
__________________________________________________________________________________________________________________________________________________________________________________________________________________________________________________________________________________________________________________________________________________________________________________________________________________________________________________________________________________________________________________________________________________________________________________________________________________________________________________________________________________________ __________________________________________________________________________________________________________________________________________________________________________________________________________________________________________________________________________________________________________________________________________________________________________________________________________________________________________________________________________________________________________________________________________________________________________________________________________________________________________________________________________________________
^ Ministop Co. Ltd. 20,500 392 ^ Istyle Inc. 48,300 391 Maruzen Showa Unyu Co. Ltd. 99,000 390 ^ Kyokuyo Co. Ltd. 14,800 390 Kyodo Printing Co. Ltd. 117,000 388 Yahagi Construction Co. Ltd. 43,300 386 CONEXIO Corp. 25,000 383 Meiko Network Japan Co. Ltd. 29,363 383 Nitto Kohki Co. Ltd. 16,400 382 Daito Pharmaceutical Co. Ltd. 18,600 382 Nippon Valqua Industries Ltd. 22,200 379 Achilles Corp. 23,500 378 Daikokutenbussan Co. Ltd. 7,900 377 ^ Stella Chemifa Corp. 14,300 377 Nippon Road Co. Ltd. 84,000 377 *,^ KLab Inc. 51,560 376 ^ Toho Titanium Co. Ltd. 55,400 375 Mimasu Semiconductor Industry Co. Ltd. 24,200 375 ^ Jamco Corp. 16,000 373 Ateam Inc. 14,200 373 JAC Recruitment Co. Ltd. 24,300 373 Shimizu Bank Ltd. 12,000 372 Happinet Corp. 22,600 372 Chukyo Bank Ltd. 17,800 372 Fukuda Corp. 42,000 372 Qol Co. Ltd. 27,199 371 Fuji Pharma Co. Ltd. 11,300 368 ^ Keiyo Co. Ltd. 61,500 366 Tonami Holdings Co. Ltd. 105,000 361 * Wellnet Corp. 25,300 360 Kurimoto Ltd. 18,200 359 ^ Senshukai Co. Ltd. 48,900 358 Amuse Inc. 15,500 356 Misawa Homes Co. Ltd. 38,400 355 Hosokawa Micron Corp. 9,600 353 Kansai Super Market Ltd. 25,000 352 Koatsu Gas Kogyo Co. Ltd. 53,000 352 Nippon Beet Sugar Manufacturing Co. Ltd. 16,800 351 ^ Showa Aircraft Industry Co. Ltd. 32,300 351 Ines Corp. 37,500 350 Shinnihon Corp. 44,500 350 ^ Kobe Bussan Co. Ltd. 9,500 350 Pronexus Inc. 27,735 347 Kitano Construction Corp. 128,000 347 ^ Sac's Bar Holdings Inc. 30,950 345 Kamei Corp. 31,200 344 Yurtec Corp. 55,000 343 ESPEC Corp. 28,208 342 ^ Toho Co. Ltd. 13,700 339 Mie Bank Ltd. 16,110 336 Denyo Co. Ltd. 22,900 336 Osaka Steel Co. Ltd. 17,700 335 Hokkan Holdings Ltd. 73,000 335 Toyo Tanso Co. Ltd. 21,010 335 Icom Inc. 14,600 334 Toyo Corp. 34,317 334 Gecoss Corp. 30,500 331 Itochu-Shokuhin Co. Ltd. 7,900 330 Riken Technos Corp. 68,800 330 Fukui Computer Holdings Inc. 12,500 328 Tsukuba Bank Ltd. 113,900 328 Mitsubishi Nichiyu Forklift Co. Ltd. 53,600 328 Shinko Shoji Co. Ltd. 28,000 328 Kita-Nippon Bank Ltd. 11,300 326
73
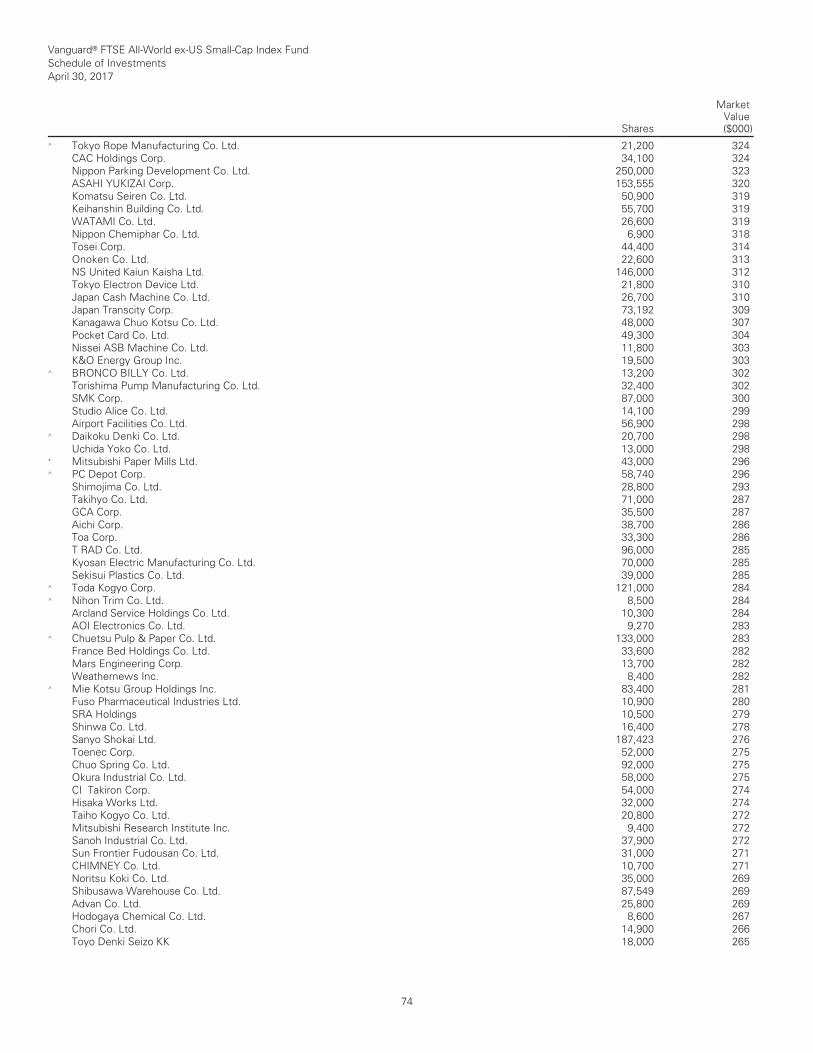
Vanguard® FTSE All-World ex-US Small-Cap Index Fund Schedule of Investments April 30, 2017
Shares
MarketValue($000)
__________________________________________________________________________________________________________________________________________________________________________________________________________________________________________________________________________________________________________________________________________________________________________________________________________________________________________________________________________________________________________________________________________________________________________________________________________________________________________________________________________________________ __________________________________________________________________________________________________________________________________________________________________________________________________________________________________________________________________________________________________________________________________________________________________________________________________________________________________________________________________________________________________________________________________________________________________________________________________________________________________________________________________________________________
^ Tokyo Rope Manufacturing Co. Ltd. 21,200 324 CAC Holdings Corp. 34,100 324 Nippon Parking Development Co. Ltd. 250,000 323 ASAHI YUKIZAI Corp. 153,555 320 Komatsu Seiren Co. Ltd. 50,900 319 Keihanshin Building Co. Ltd. 55,700 319 WATAMI Co. Ltd. 26,600 319 Nippon Chemiphar Co. Ltd. 6,900 318 Tosei Corp. 44,400 314 Onoken Co. Ltd. 22,600 313 NS United Kaiun Kaisha Ltd. 146,000 312 Tokyo Electron Device Ltd. 21,800 310 Japan Cash Machine Co. Ltd. 26,700 310 Japan Transcity Corp. 73,192 309 Kanagawa Chuo Kotsu Co. Ltd. 48,000 307 Pocket Card Co. Ltd. 49,300 304 Nissei ASB Machine Co. Ltd. 11,800 303 K&O Energy Group Inc. 19,500 303 ^ BRONCO BILLY Co. Ltd. 13,200 302 Torishima Pump Manufacturing Co. Ltd. 32,400 302 SMK Corp. 87,000 300 Studio Alice Co. Ltd. 14,100 299 Airport Facilities Co. Ltd. 56,900 298 ^ Daikoku Denki Co. Ltd. 20,700 298 Uchida Yoko Co. Ltd. 13,000 298 * Mitsubishi Paper Mills Ltd. 43,000 296 ^ PC Depot Corp. 58,740 296 Shimojima Co. Ltd. 28,800 293 Takihyo Co. Ltd. 71,000 287 GCA Corp. 35,500 287 Aichi Corp. 38,700 286 Toa Corp. 33,300 286 T RAD Co. Ltd. 96,000 285 Kyosan Electric Manufacturing Co. Ltd. 70,000 285 Sekisui Plastics Co. Ltd. 39,000 285 ^ Toda Kogyo Corp. 121,000 284 ^ Nihon Trim Co. Ltd. 8,500 284 Arcland Service Holdings Co. Ltd. 10,300 284 AOI Electronics Co. Ltd. 9,270 283 ^ Chuetsu Pulp & Paper Co. Ltd. 133,000 283 France Bed Holdings Co. Ltd. 33,600 282 Mars Engineering Corp. 13,700 282 Weathernews Inc. 8,400 282 ^ Mie Kotsu Group Holdings Inc. 83,400 281 Fuso Pharmaceutical Industries Ltd. 10,900 280 SRA Holdings 10,500 279 Shinwa Co. Ltd. 16,400 278 Sanyo Shokai Ltd. 187,423 276 Toenec Corp. 52,000 275 Chuo Spring Co. Ltd. 92,000 275 Okura Industrial Co. Ltd. 58,000 275 CI Takiron Corp. 54,000 274 Hisaka Works Ltd. 32,000 274 Taiho Kogyo Co. Ltd. 20,800 272 Mitsubishi Research Institute Inc. 9,400 272 Sanoh Industrial Co. Ltd. 37,900 272 Sun Frontier Fudousan Co. Ltd. 31,000 271 CHIMNEY Co. Ltd. 10,700 271 Noritsu Koki Co. Ltd. 35,000 269 Shibusawa Warehouse Co. Ltd. 87,549 269 Advan Co. Ltd. 25,800 269 Hodogaya Chemical Co. Ltd. 8,600 267 Chori Co. Ltd. 14,900 266 Toyo Denki Seizo KK 18,000 265
74
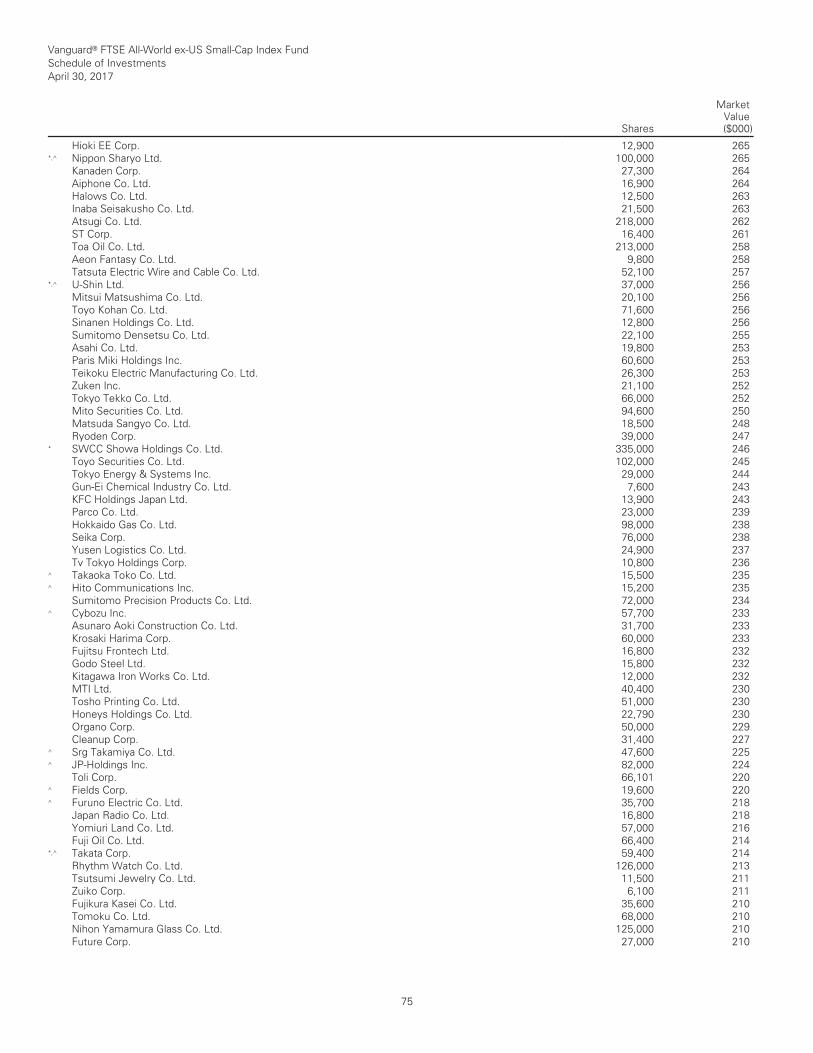
Vanguard® FTSE All-World ex-US Small-Cap Index Fund Schedule of Investments April 30, 2017
Shares
MarketValue($000)
__________________________________________________________________________________________________________________________________________________________________________________________________________________________________________________________________________________________________________________________________________________________________________________________________________________________________________________________________________________________________________________________________________________________________________________________________________________________________________________________________________________________ __________________________________________________________________________________________________________________________________________________________________________________________________________________________________________________________________________________________________________________________________________________________________________________________________________________________________________________________________________________________________________________________________________________________________________________________________________________________________________________________________________________________
Hioki EE Corp. 12,900 265 *,^ Nippon Sharyo Ltd. 100,000 265 Kanaden Corp. 27,300 264 Aiphone Co. Ltd. 16,900 264 Halows Co. Ltd. 12,500 263 Inaba Seisakusho Co. Ltd. 21,500 263 Atsugi Co. Ltd. 218,000 262 ST Corp. 16,400 261 Toa Oil Co. Ltd. 213,000 258 Aeon Fantasy Co. Ltd. 9,800 258 Tatsuta Electric Wire and Cable Co. Ltd. 52,100 257 *,^ U-Shin Ltd. 37,000 256 Mitsui Matsushima Co. Ltd. 20,100 256 Toyo Kohan Co. Ltd. 71,600 256 Sinanen Holdings Co. Ltd. 12,800 256 Sumitomo Densetsu Co. Ltd. 22,100 255 Asahi Co. Ltd. 19,800 253 Paris Miki Holdings Inc. 60,600 253 Teikoku Electric Manufacturing Co. Ltd. 26,300 253 Zuken Inc. 21,100 252 Tokyo Tekko Co. Ltd. 66,000 252 Mito Securities Co. Ltd. 94,600 250 Matsuda Sangyo Co. Ltd. 18,500 248 Ryoden Corp. 39,000 247 * SWCC Showa Holdings Co. Ltd. 335,000 246 Toyo Securities Co. Ltd. 102,000 245 Tokyo Energy & Systems Inc. 29,000 244 Gun-Ei Chemical Industry Co. Ltd. 7,600 243 KFC Holdings Japan Ltd. 13,900 243 Parco Co. Ltd. 23,000 239 Hokkaido Gas Co. Ltd. 98,000 238 Seika Corp. 76,000 238 Yusen Logistics Co. Ltd. 24,900 237 Tv Tokyo Holdings Corp. 10,800 236 ^ Takaoka Toko Co. Ltd. 15,500 235 ^ Hito Communications Inc. 15,200 235 Sumitomo Precision Products Co. Ltd. 72,000 234 ^ Cybozu Inc. 57,700 233 Asunaro Aoki Construction Co. Ltd. 31,700 233 Krosaki Harima Corp. 60,000 233 Fujitsu Frontech Ltd. 16,800 232 Godo Steel Ltd. 15,800 232 Kitagawa Iron Works Co. Ltd. 12,000 232 MTI Ltd. 40,400 230 Tosho Printing Co. Ltd. 51,000 230 Honeys Holdings Co. Ltd. 22,790 230 Organo Corp. 50,000 229 Cleanup Corp. 31,400 227 ^ Srg Takamiya Co. Ltd. 47,600 225 ^ JP-Holdings Inc. 82,000 224 Toli Corp. 66,101 220 ^ Fields Corp. 19,600 220 ^ Furuno Electric Co. Ltd. 35,700 218 Japan Radio Co. Ltd. 16,800 218 Yomiuri Land Co. Ltd. 57,000 216 Fuji Oil Co. Ltd. 66,400 214 *,^ Takata Corp. 59,400 214 Rhythm Watch Co. Ltd. 126,000 213 Tsutsumi Jewelry Co. Ltd. 11,500 211 Zuiko Corp. 6,100 211 Fujikura Kasei Co. Ltd. 35,600 210 Tomoku Co. Ltd. 68,000 210 Nihon Yamamura Glass Co. Ltd. 125,000 210 Future Corp. 27,000 210
75
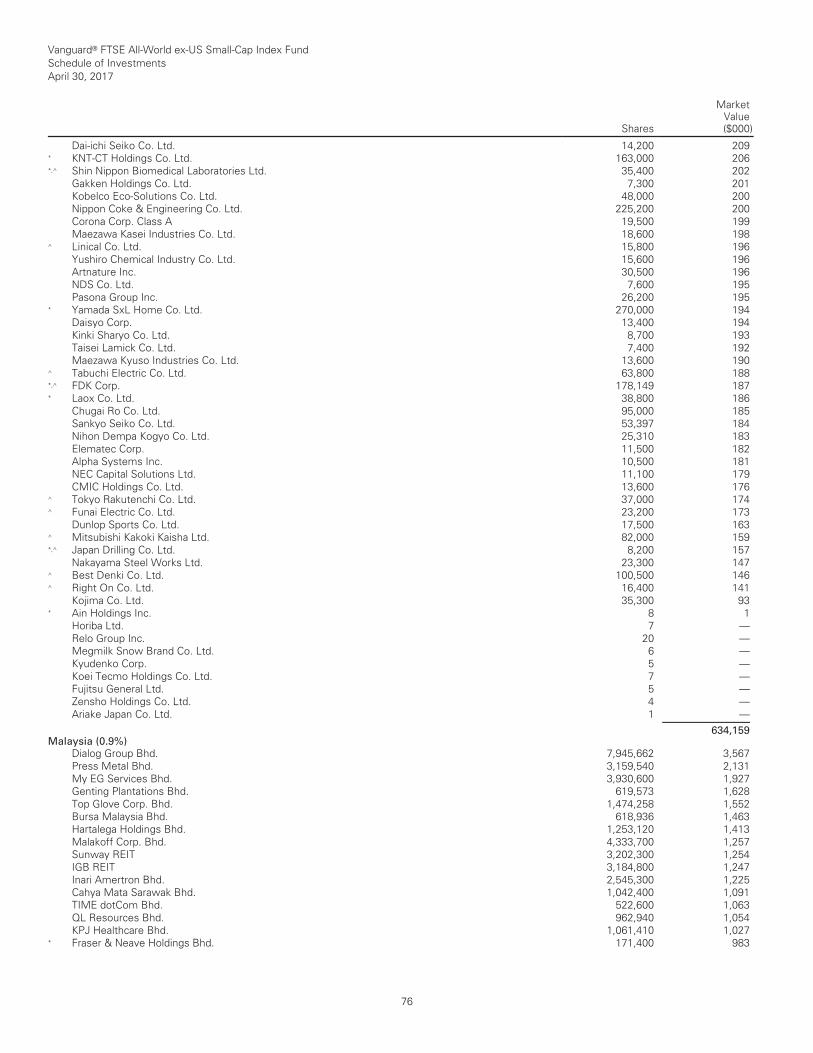
Vanguard® FTSE All-World ex-US Small-Cap Index Fund Schedule of Investments April 30, 2017
Shares
MarketValue($000)
__________________________________________________________________________________________________________________________________________________________________________________________________________________________________________________________________________________________________________________________________________________________________________________________________________________________________________________________________________________________________________________________________________________________________________________________________________________________________________________________________________________________ __________________________________________________________________________________________________________________________________________________________________________________________________________________________________________________________________________________________________________________________________________________________________________________________________________________________________________________________________________________________________________________________________________________________________________________________________________________________________________________________________________________________
Dai-ichi Seiko Co. Ltd. 14,200 209 * KNT-CT Holdings Co. Ltd. 163,000 206 *,^ Shin Nippon Biomedical Laboratories Ltd. 35,400 202 Gakken Holdings Co. Ltd. 7,300 201 Kobelco Eco-Solutions Co. Ltd. 48,000 200 Nippon Coke & Engineering Co. Ltd. 225,200 200 Corona Corp. Class A 19,500 199 Maezawa Kasei Industries Co. Ltd. 18,600 198 ^ Linical Co. Ltd. 15,800 196 Yushiro Chemical Industry Co. Ltd. 15,600 196 Artnature Inc. 30,500 196 NDS Co. Ltd. 7,600 195 Pasona Group Inc. 26,200 195 * Yamada SxL Home Co. Ltd. 270,000 194 Daisyo Corp. 13,400 194 Kinki Sharyo Co. Ltd. 8,700 193 Taisei Lamick Co. Ltd. 7,400 192 Maezawa Kyuso Industries Co. Ltd. 13,600 190 ^ Tabuchi Electric Co. Ltd. 63,800 188 *,^ FDK Corp. 178,149 187 * Laox Co. Ltd. 38,800 186 Chugai Ro Co. Ltd. 95,000 185 Sankyo Seiko Co. Ltd. 53,397 184 Nihon Dempa Kogyo Co. Ltd. 25,310 183 Elematec Corp. 11,500 182 Alpha Systems Inc. 10,500 181 NEC Capital Solutions Ltd. 11,100 179 CMIC Holdings Co. Ltd. 13,600 176 ^ Tokyo Rakutenchi Co. Ltd. 37,000 174 ^ Funai Electric Co. Ltd. 23,200 173 Dunlop Sports Co. Ltd. 17,500 163 ^ Mitsubishi Kakoki Kaisha Ltd. 82,000 159 *,^ Japan Drilling Co. Ltd. 8,200 157 Nakayama Steel Works Ltd. 23,300 147 ^ Best Denki Co. Ltd. 100,500 146 ^ Right On Co. Ltd. 16,400 141 Kojima Co. Ltd. 35,300 93 * Ain Holdings Inc. 8 1 Horiba Ltd. 7 — Relo Group Inc. 20 — Megmilk Snow Brand Co. Ltd. 6 — Kyudenko Corp. 5 — Koei Tecmo Holdings Co. Ltd. 7 — Fujitsu General Ltd. 5 — Zensho Holdings Co. Ltd. 4 — Ariake Japan Co. Ltd. 1 — ___________ 634,159 Malaysia (0.9%)
Dialog Group Bhd. 7,945,662 3,567 Press Metal Bhd. 3,159,540 2,131 My EG Services Bhd. 3,930,600 1,927 Genting Plantations Bhd. 619,573 1,628 Top Glove Corp. Bhd. 1,474,258 1,552 Bursa Malaysia Bhd. 618,936 1,463 Hartalega Holdings Bhd. 1,253,120 1,413 Malakoff Corp. Bhd. 4,333,700 1,257 Sunway REIT 3,202,300 1,254 IGB REIT 3,184,800 1,247 Inari Amertron Bhd. 2,545,300 1,225 Cahya Mata Sarawak Bhd. 1,042,400 1,091 TIME dotCom Bhd. 522,600 1,063 QL Resources Bhd. 962,940 1,054 KPJ Healthcare Bhd. 1,061,410 1,027 * Fraser & Neave Holdings Bhd. 171,400 983
76
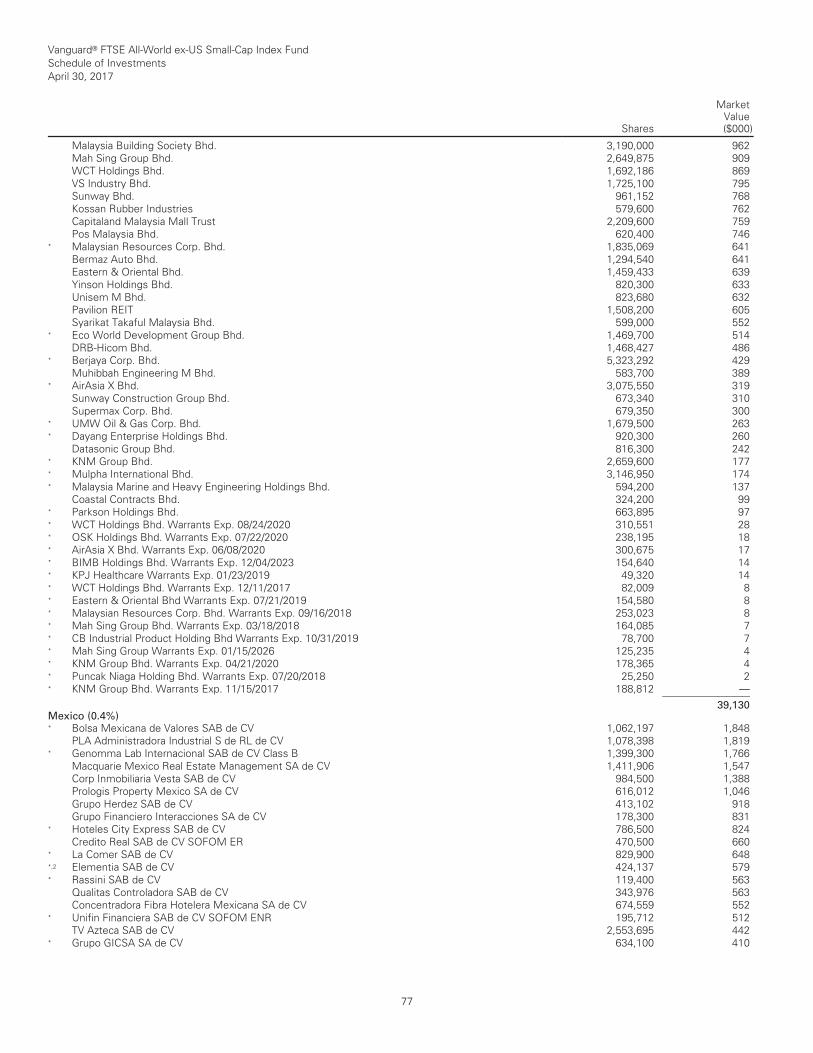
Vanguard® FTSE All-World ex-US Small-Cap Index Fund Schedule of Investments April 30, 2017
Shares
MarketValue($000)
__________________________________________________________________________________________________________________________________________________________________________________________________________________________________________________________________________________________________________________________________________________________________________________________________________________________________________________________________________________________________________________________________________________________________________________________________________________________________________________________________________________________ __________________________________________________________________________________________________________________________________________________________________________________________________________________________________________________________________________________________________________________________________________________________________________________________________________________________________________________________________________________________________________________________________________________________________________________________________________________________________________________________________________________________
Malaysia Building Society Bhd. 3,190,000 962 Mah Sing Group Bhd. 2,649,875 909 WCT Holdings Bhd. 1,692,186 869 VS Industry Bhd. 1,725,100 795 Sunway Bhd. 961,152 768 Kossan Rubber Industries 579,600 762 Capitaland Malaysia Mall Trust 2,209,600 759 Pos Malaysia Bhd. 620,400 746 * Malaysian Resources Corp. Bhd. 1,835,069 641 Bermaz Auto Bhd. 1,294,540 641 Eastern & Oriental Bhd. 1,459,433 639 Yinson Holdings Bhd. 820,300 633 Unisem M Bhd. 823,680 632 Pavilion REIT 1,508,200 605 Syarikat Takaful Malaysia Bhd. 599,000 552 * Eco World Development Group Bhd. 1,469,700 514 DRB-Hicom Bhd. 1,468,427 486 * Berjaya Corp. Bhd. 5,323,292 429 Muhibbah Engineering M Bhd. 583,700 389 * AirAsia X Bhd. 3,075,550 319 Sunway Construction Group Bhd. 673,340 310 Supermax Corp. Bhd. 679,350 300 * UMW Oil & Gas Corp. Bhd. 1,679,500 263 * Dayang Enterprise Holdings Bhd. 920,300 260 Datasonic Group Bhd. 816,300 242 * KNM Group Bhd. 2,659,600 177 * Mulpha International Bhd. 3,146,950 174 * Malaysia Marine and Heavy Engineering Holdings Bhd. 594,200 137 Coastal Contracts Bhd. 324,200 99 * Parkson Holdings Bhd. 663,895 97 * WCT Holdings Bhd. Warrants Exp. 08/24/2020 310,551 28 * OSK Holdings Bhd. Warrants Exp. 07/22/2020 238,195 18 * AirAsia X Bhd. Warrants Exp. 06/08/2020 300,675 17 * BIMB Holdings Bhd. Warrants Exp. 12/04/2023 154,640 14 * KPJ Healthcare Warrants Exp. 01/23/2019 49,320 14 * WCT Holdings Bhd. Warrants Exp. 12/11/2017 82,009 8 * Eastern & Oriental Bhd Warrants Exp. 07/21/2019 154,580 8 * Malaysian Resources Corp. Bhd. Warrants Exp. 09/16/2018 253,023 8 * Mah Sing Group Bhd. Warrants Exp. 03/18/2018 164,085 7 * CB Industrial Product Holding Bhd Warrants Exp. 10/31/2019 78,700 7 * Mah Sing Group Warrants Exp. 01/15/2026 125,235 4 * KNM Group Bhd. Warrants Exp. 04/21/2020 178,365 4 * Puncak Niaga Holding Bhd. Warrants Exp. 07/20/2018 25,250 2 * KNM Group Bhd. Warrants Exp. 11/15/2017 188,812 — ___________ 39,130 Mexico (0.4%)
* Bolsa Mexicana de Valores SAB de CV 1,062,197 1,848 PLA Administradora Industrial S de RL de CV 1,078,398 1,819 * Genomma Lab Internacional SAB de CV Class B 1,399,300 1,766 Macquarie Mexico Real Estate Management SA de CV 1,411,906 1,547 Corp Inmobiliaria Vesta SAB de CV 984,500 1,388 Prologis Property Mexico SA de CV 616,012 1,046 Grupo Herdez SAB de CV 413,102 918 Grupo Financiero Interacciones SA de CV 178,300 831 * Hoteles City Express SAB de CV 786,500 824 Credito Real SAB de CV SOFOM ER 470,500 660 * La Comer SAB de CV 829,900 648 *,2 Elementia SAB de CV 424,137 579 * Rassini SAB de CV 119,400 563 Qualitas Controladora SAB de CV 343,976 563 Concentradora Fibra Hotelera Mexicana SA de CV 674,559 552 * Unifin Financiera SAB de CV SOFOM ENR 195,712 512 TV Azteca SAB de CV 2,553,695 442 * Grupo GICSA SA de CV 634,100 410
77
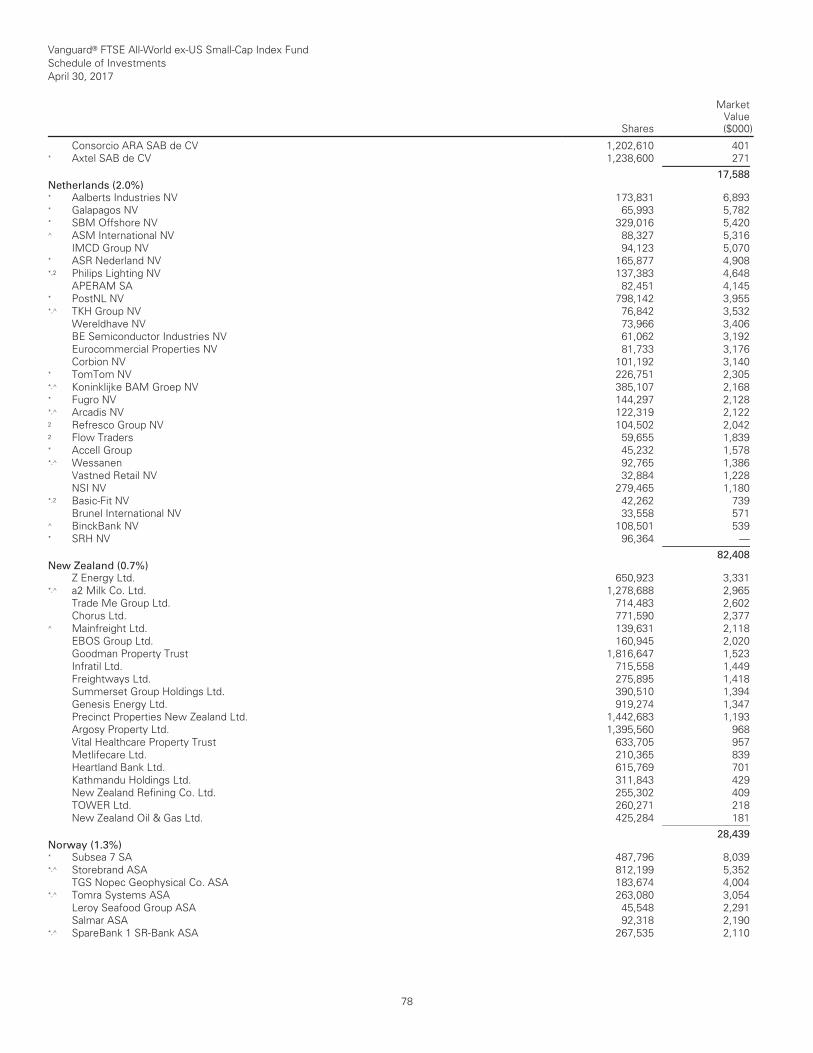
Vanguard® FTSE All-World ex-US Small-Cap Index Fund Schedule of Investments April 30, 2017
Shares
MarketValue($000)
__________________________________________________________________________________________________________________________________________________________________________________________________________________________________________________________________________________________________________________________________________________________________________________________________________________________________________________________________________________________________________________________________________________________________________________________________________________________________________________________________________________________ __________________________________________________________________________________________________________________________________________________________________________________________________________________________________________________________________________________________________________________________________________________________________________________________________________________________________________________________________________________________________________________________________________________________________________________________________________________________________________________________________________________________
Consorcio ARA SAB de CV 1,202,610 401 * Axtel SAB de CV 1,238,600 271 ___________ 17,588 Netherlands (2.0%)
* Aalberts Industries NV 173,831 6,893 * Galapagos NV 65,993 5,782 * SBM Offshore NV 329,016 5,420 ^ ASM International NV 88,327 5,316 IMCD Group NV 94,123 5,070 * ASR Nederland NV 165,877 4,908 *,2 Philips Lighting NV 137,383 4,648 APERAM SA 82,451 4,145 * PostNL NV 798,142 3,955 *,^ TKH Group NV 76,842 3,532 Wereldhave NV 73,966 3,406 BE Semiconductor Industries NV 61,062 3,192 Eurocommercial Properties NV 81,733 3,176 Corbion NV 101,192 3,140 * TomTom NV 226,751 2,305 *,^ Koninklijke BAM Groep NV 385,107 2,168 * Fugro NV 144,297 2,128 *,^ Arcadis NV 122,319 2,122 2 Refresco Group NV 104,502 2,042 2 Flow Traders 59,655 1,839 * Accell Group 45,232 1,578 *,^ Wessanen 92,765 1,386 Vastned Retail NV 32,884 1,228 NSI NV 279,465 1,180 *,2 Basic-Fit NV 42,262 739 Brunel International NV 33,558 571 ^ BinckBank NV 108,501 539 * SRH NV 96,364 — ___________ 82,408 New Zealand (0.7%)
Z Energy Ltd. 650,923 3,331 *,^ a2 Milk Co. Ltd. 1,278,688 2,965 Trade Me Group Ltd. 714,483 2,602 Chorus Ltd. 771,590 2,377 ^ Mainfreight Ltd. 139,631 2,118 EBOS Group Ltd. 160,945 2,020 Goodman Property Trust 1,816,647 1,523 Infratil Ltd. 715,558 1,449 Freightways Ltd. 275,895 1,418 Summerset Group Holdings Ltd. 390,510 1,394 Genesis Energy Ltd. 919,274 1,347 Precinct Properties New Zealand Ltd. 1,442,683 1,193 Argosy Property Ltd. 1,395,560 968 Vital Healthcare Property Trust 633,705 957 Metlifecare Ltd. 210,365 839 Heartland Bank Ltd. 615,769 701 Kathmandu Holdings Ltd. 311,843 429 New Zealand Refining Co. Ltd. 255,302 409 TOWER Ltd. 260,271 218 New Zealand Oil & Gas Ltd. 425,284 181 ___________ 28,439 Norway (1.3%)
* Subsea 7 SA 487,796 8,039 *,^ Storebrand ASA 812,199 5,352 TGS Nopec Geophysical Co. ASA 183,674 4,004 *,^ Tomra Systems ASA 263,080 3,054 Leroy Seafood Group ASA 45,548 2,291 Salmar ASA 92,318 2,190 *,^ SpareBank 1 SR-Bank ASA 267,535 2,110
78
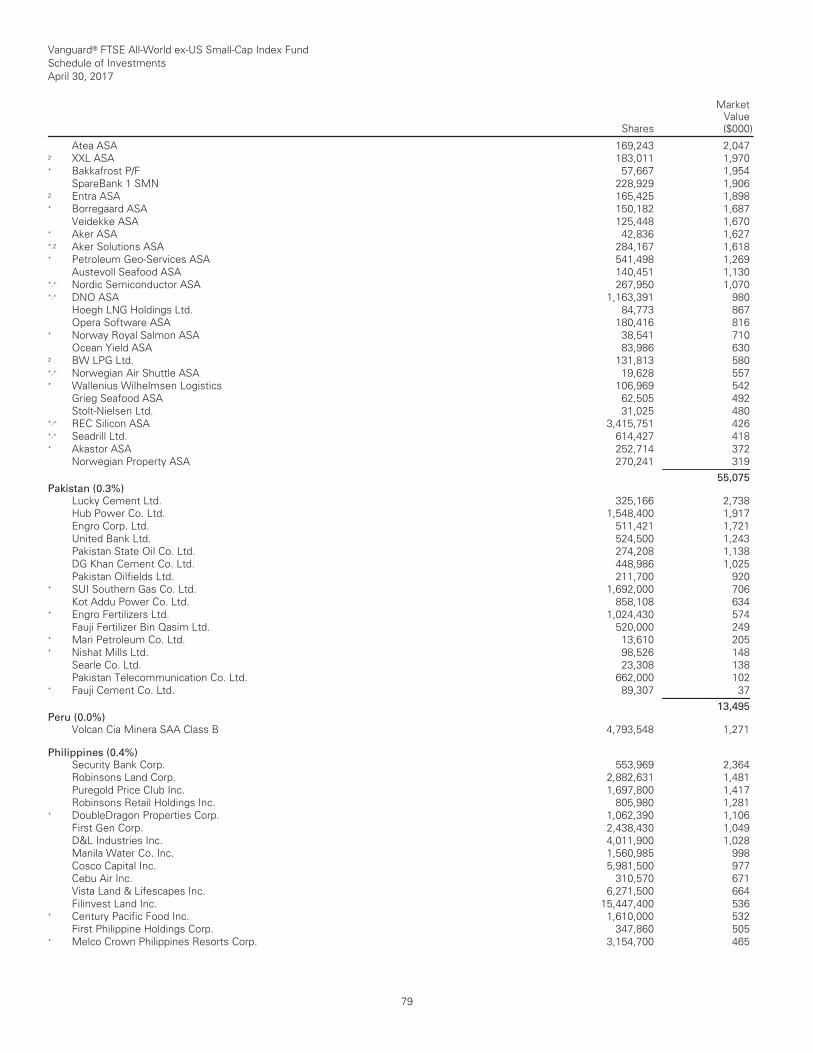
Vanguard® FTSE All-World ex-US Small-Cap Index Fund Schedule of Investments April 30, 2017
Shares
MarketValue($000)
__________________________________________________________________________________________________________________________________________________________________________________________________________________________________________________________________________________________________________________________________________________________________________________________________________________________________________________________________________________________________________________________________________________________________________________________________________________________________________________________________________________________ __________________________________________________________________________________________________________________________________________________________________________________________________________________________________________________________________________________________________________________________________________________________________________________________________________________________________________________________________________________________________________________________________________________________________________________________________________________________________________________________________________________________
Atea ASA 169,243 2,047 2 XXL ASA 183,011 1,970 * Bakkafrost P/F 57,667 1,954 SpareBank 1 SMN 228,929 1,906 2 Entra ASA 165,425 1,898 * Borregaard ASA 150,182 1,687 Veidekke ASA 125,448 1,670 * Aker ASA 42,836 1,627 *,2 Aker Solutions ASA 284,167 1,618 * Petroleum Geo-Services ASA 541,498 1,269 Austevoll Seafood ASA 140,451 1,130 *,^ Nordic Semiconductor ASA 267,950 1,070 *,^ DNO ASA 1,163,391 980 Hoegh LNG Holdings Ltd. 84,773 867 Opera Software ASA 180,416 816 * Norway Royal Salmon ASA 38,541 710 Ocean Yield ASA 83,986 630 2 BW LPG Ltd. 131,813 580 *,^ Norwegian Air Shuttle ASA 19,628 557 * Wallenius Wilhelmsen Logistics 106,969 542 Grieg Seafood ASA 62,505 492 Stolt-Nielsen Ltd. 31,025 480 *,^ REC Silicon ASA 3,415,751 426 *,^ Seadrill Ltd. 614,427 418 * Akastor ASA 252,714 372 Norwegian Property ASA 270,241 319 ___________ 55,075 Pakistan (0.3%)
Lucky Cement Ltd. 325,166 2,738 Hub Power Co. Ltd. 1,548,400 1,917 Engro Corp. Ltd. 511,421 1,721 United Bank Ltd. 524,500 1,243 Pakistan State Oil Co. Ltd. 274,208 1,138 DG Khan Cement Co. Ltd. 448,986 1,025 Pakistan Oilfields Ltd. 211,700 920 * SUI Southern Gas Co. Ltd. 1,692,000 706 Kot Addu Power Co. Ltd. 858,108 634 * Engro Fertilizers Ltd. 1,024,430 574 Fauji Fertilizer Bin Qasim Ltd. 520,000 249 * Mari Petroleum Co. Ltd. 13,610 205 * Nishat Mills Ltd. 98,526 148 Searle Co. Ltd. 23,308 138 Pakistan Telecommunication Co. Ltd. 662,000 102 * Fauji Cement Co. Ltd. 89,307 37 ___________ 13,495 Peru (0.0%)
Volcan Cia Minera SAA Class B 4,793,548 1,271 Philippines (0.4%)
Security Bank Corp. 553,969 2,364 Robinsons Land Corp. 2,882,631 1,481 Puregold Price Club Inc. 1,697,800 1,417 Robinsons Retail Holdings Inc. 805,980 1,281 * DoubleDragon Properties Corp. 1,062,390 1,106 First Gen Corp. 2,438,430 1,049 D&L Industries Inc. 4,011,900 1,028 Manila Water Co. Inc. 1,560,985 998 Cosco Capital Inc. 5,981,500 977 Cebu Air Inc. 310,570 671 Vista Land & Lifescapes Inc. 6,271,500 664 Filinvest Land Inc. 15,447,400 536 * Century Pacific Food Inc. 1,610,000 532 First Philippine Holdings Corp. 347,860 505 * Melco Crown Philippines Resorts Corp. 3,154,700 465
79
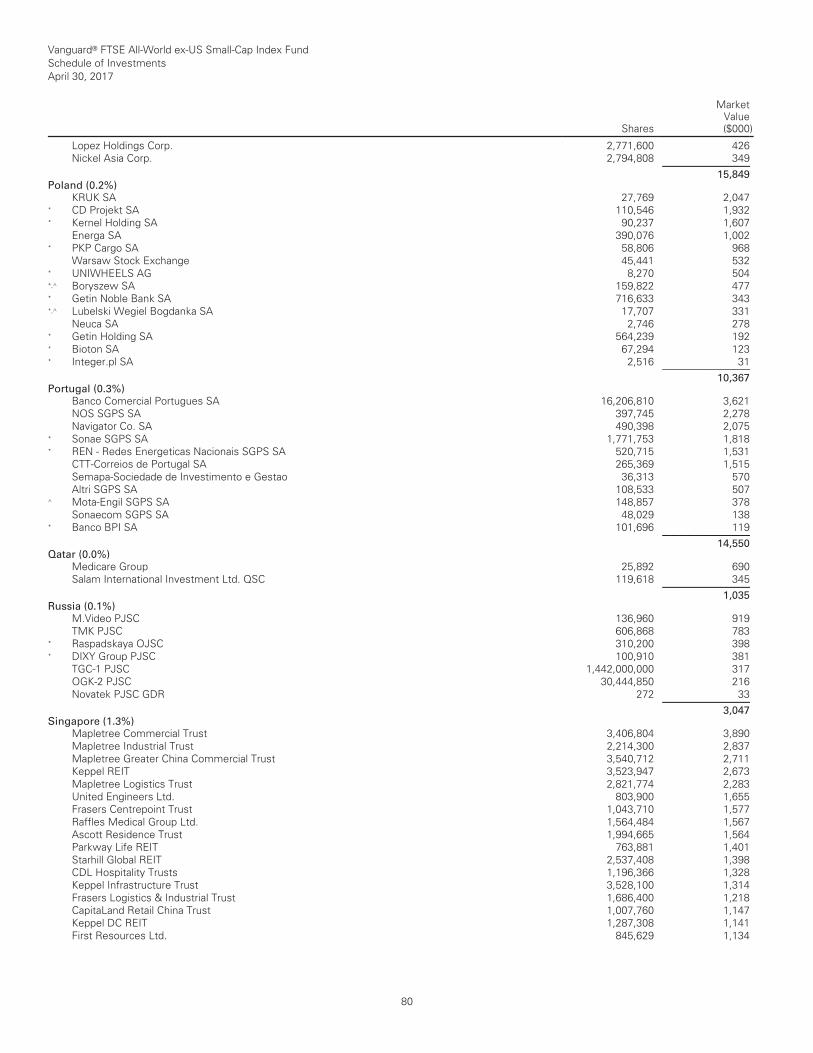
Vanguard® FTSE All-World ex-US Small-Cap Index Fund Schedule of Investments April 30, 2017
Shares
MarketValue($000)
__________________________________________________________________________________________________________________________________________________________________________________________________________________________________________________________________________________________________________________________________________________________________________________________________________________________________________________________________________________________________________________________________________________________________________________________________________________________________________________________________________________________ __________________________________________________________________________________________________________________________________________________________________________________________________________________________________________________________________________________________________________________________________________________________________________________________________________________________________________________________________________________________________________________________________________________________________________________________________________________________________________________________________________________________
Lopez Holdings Corp. 2,771,600 426 Nickel Asia Corp. 2,794,808 349 ___________ 15,849 Poland (0.2%)
KRUK SA 27,769 2,047 * CD Projekt SA 110,546 1,932 * Kernel Holding SA 90,237 1,607 Energa SA 390,076 1,002 * PKP Cargo SA 58,806 968 Warsaw Stock Exchange 45,441 532 * UNIWHEELS AG 8,270 504 *,^ Boryszew SA 159,822 477 * Getin Noble Bank SA 716,633 343 *,^ Lubelski Wegiel Bogdanka SA 17,707 331 Neuca SA 2,746 278 * Getin Holding SA 564,239 192 * Bioton SA 67,294 123 * Integer.pl SA 2,516 31 ___________ 10,367 Portugal (0.3%)
Banco Comercial Portugues SA 16,206,810 3,621 NOS SGPS SA 397,745 2,278 Navigator Co. SA 490,398 2,075 * Sonae SGPS SA 1,771,753 1,818 * REN - Redes Energeticas Nacionais SGPS SA 520,715 1,531 CTT-Correios de Portugal SA 265,369 1,515 Semapa-Sociedade de Investimento e Gestao 36,313 570 Altri SGPS SA 108,533 507 ^ Mota-Engil SGPS SA 148,857 378 Sonaecom SGPS SA 48,029 138 * Banco BPI SA 101,696 119 ___________ 14,550 Qatar (0.0%)
Medicare Group 25,892 690 Salam International Investment Ltd. QSC 119,618 345 ___________ 1,035 Russia (0.1%)
M.Video PJSC 136,960 919 TMK PJSC 606,868 783 * Raspadskaya OJSC 310,200 398 * DIXY Group PJSC 100,910 381 TGC-1 PJSC 1,442,000,000 317 OGK-2 PJSC 30,444,850 216 Novatek PJSC GDR 272 33 ___________ 3,047 Singapore (1.3%)
Mapletree Commercial Trust 3,406,804 3,890 Mapletree Industrial Trust 2,214,300 2,837 Mapletree Greater China Commercial Trust 3,540,712 2,711 Keppel REIT 3,523,947 2,673 Mapletree Logistics Trust 2,821,774 2,283 United Engineers Ltd. 803,900 1,655 Frasers Centrepoint Trust 1,043,710 1,577 Raffles Medical Group Ltd. 1,564,484 1,567 Ascott Residence Trust 1,994,665 1,564 Parkway Life REIT 763,881 1,401 Starhill Global REIT 2,537,408 1,398 CDL Hospitality Trusts 1,196,366 1,328 Keppel Infrastructure Trust 3,528,100 1,314 Frasers Logistics & Industrial Trust 1,686,400 1,218 CapitaLand Retail China Trust 1,007,760 1,147 Keppel DC REIT 1,287,308 1,141 First Resources Ltd. 845,629 1,134
80
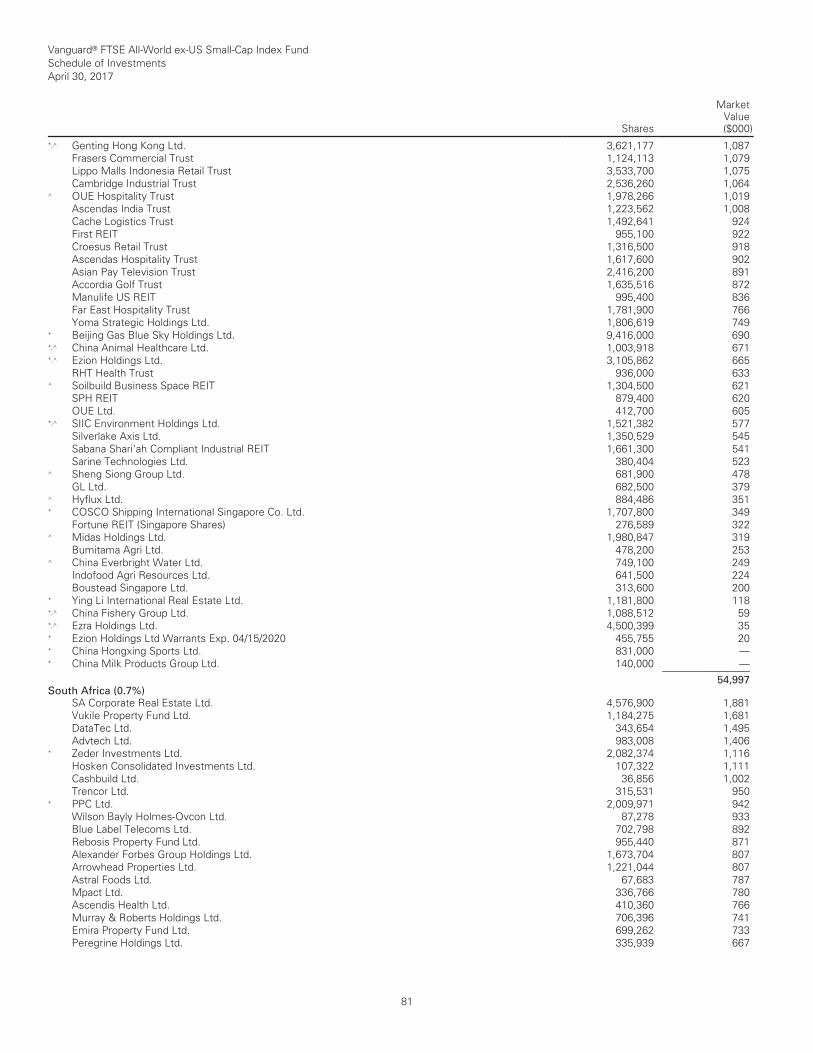
Vanguard® FTSE All-World ex-US Small-Cap Index Fund Schedule of Investments April 30, 2017
Shares
MarketValue($000)
__________________________________________________________________________________________________________________________________________________________________________________________________________________________________________________________________________________________________________________________________________________________________________________________________________________________________________________________________________________________________________________________________________________________________________________________________________________________________________________________________________________________ __________________________________________________________________________________________________________________________________________________________________________________________________________________________________________________________________________________________________________________________________________________________________________________________________________________________________________________________________________________________________________________________________________________________________________________________________________________________________________________________________________________________
*,^ Genting Hong Kong Ltd. 3,621,177 1,087 Frasers Commercial Trust 1,124,113 1,079 Lippo Malls Indonesia Retail Trust 3,533,700 1,075 Cambridge Industrial Trust 2,536,260 1,064 ^ OUE Hospitality Trust 1,978,266 1,019 Ascendas India Trust 1,223,562 1,008 Cache Logistics Trust 1,492,641 924 First REIT 955,100 922 Croesus Retail Trust 1,316,500 918 Ascendas Hospitality Trust 1,617,600 902 Asian Pay Television Trust 2,416,200 891 Accordia Golf Trust 1,635,516 872 Manulife US REIT 995,400 836 Far East Hospitality Trust 1,781,900 766 Yoma Strategic Holdings Ltd. 1,806,619 749 * Beijing Gas Blue Sky Holdings Ltd. 9,416,000 690 *,^ China Animal Healthcare Ltd. 1,003,918 671 *,^ Ezion Holdings Ltd. 3,105,862 665 RHT Health Trust 936,000 633 ^ Soilbuild Business Space REIT 1,304,500 621 SPH REIT 879,400 620 OUE Ltd. 412,700 605 *,^ SIIC Environment Holdings Ltd. 1,521,382 577 Silverlake Axis Ltd. 1,350,529 545 Sabana Shari'ah Compliant Industrial REIT 1,661,300 541 Sarine Technologies Ltd. 380,404 523 ^ Sheng Siong Group Ltd. 681,900 478 GL Ltd. 682,500 379 ^ Hyflux Ltd. 884,486 351 * COSCO Shipping International Singapore Co. Ltd. 1,707,800 349 Fortune REIT (Singapore Shares) 276,589 322 ^ Midas Holdings Ltd. 1,980,847 319 Bumitama Agri Ltd. 478,200 253 ^ China Everbright Water Ltd. 749,100 249 Indofood Agri Resources Ltd. 641,500 224 Boustead Singapore Ltd. 313,600 200 * Ying Li International Real Estate Ltd. 1,181,800 118 *,^ China Fishery Group Ltd. 1,088,512 59 *,^ Ezra Holdings Ltd. 4,500,399 35 * Ezion Holdings Ltd Warrants Exp. 04/15/2020 455,755 20 * China Hongxing Sports Ltd. 831,000 — * China Milk Products Group Ltd. 140,000 — ___________ 54,997 South Africa (0.7%)
SA Corporate Real Estate Ltd. 4,576,900 1,881 Vukile Property Fund Ltd. 1,184,275 1,681 DataTec Ltd. 343,654 1,495 Advtech Ltd. 983,008 1,406 * Zeder Investments Ltd. 2,082,374 1,116 Hosken Consolidated Investments Ltd. 107,322 1,111 Cashbuild Ltd. 36,856 1,002 Trencor Ltd. 315,531 950 * PPC Ltd. 2,009,971 942 Wilson Bayly Holmes-Ovcon Ltd. 87,278 933 Blue Label Telecoms Ltd. 702,798 892 Rebosis Property Fund Ltd. 955,440 871 Alexander Forbes Group Holdings Ltd. 1,673,704 807 Arrowhead Properties Ltd. 1,221,044 807 Astral Foods Ltd. 67,683 787 Mpact Ltd. 336,766 780 Ascendis Health Ltd. 410,360 766 Murray & Roberts Holdings Ltd. 706,396 741 Emira Property Fund Ltd. 699,262 733 Peregrine Holdings Ltd. 335,939 667
81
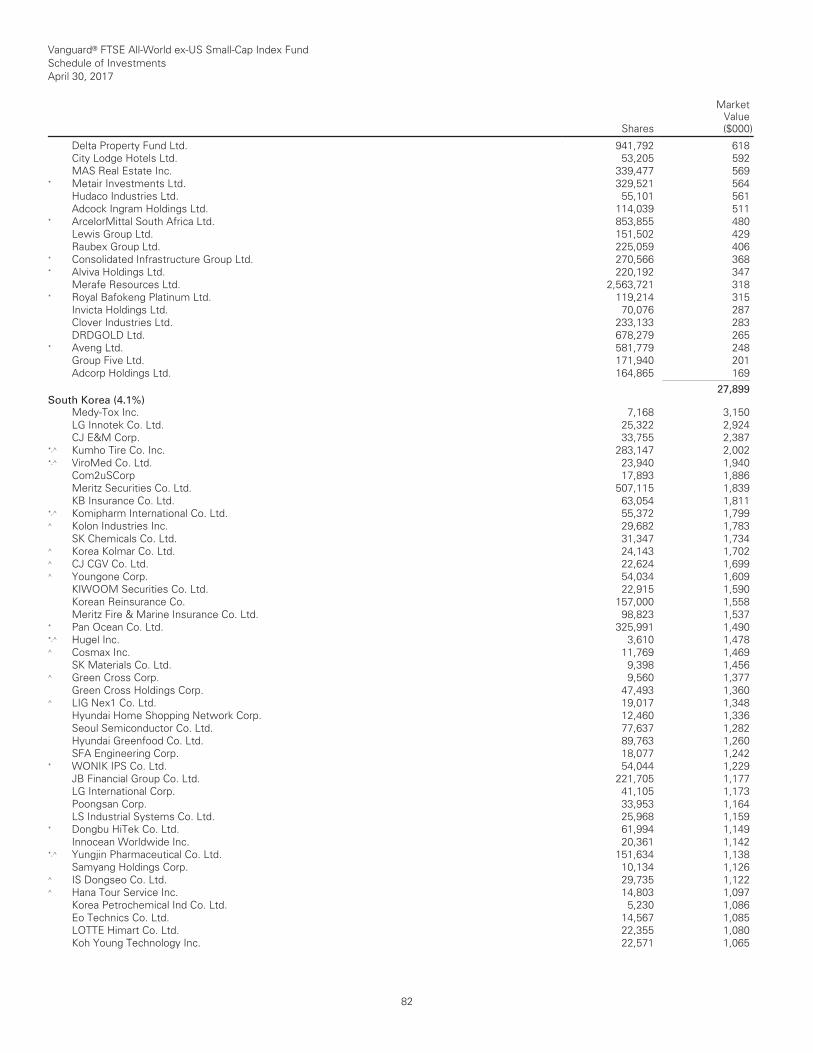
Vanguard® FTSE All-World ex-US Small-Cap Index Fund Schedule of Investments April 30, 2017
Shares
MarketValue($000)
__________________________________________________________________________________________________________________________________________________________________________________________________________________________________________________________________________________________________________________________________________________________________________________________________________________________________________________________________________________________________________________________________________________________________________________________________________________________________________________________________________________________ __________________________________________________________________________________________________________________________________________________________________________________________________________________________________________________________________________________________________________________________________________________________________________________________________________________________________________________________________________________________________________________________________________________________________________________________________________________________________________________________________________________________
Delta Property Fund Ltd. 941,792 618 City Lodge Hotels Ltd. 53,205 592 MAS Real Estate Inc. 339,477 569 * Metair Investments Ltd. 329,521 564 Hudaco Industries Ltd. 55,101 561 Adcock Ingram Holdings Ltd. 114,039 511 * ArcelorMittal South Africa Ltd. 853,855 480 Lewis Group Ltd. 151,502 429 Raubex Group Ltd. 225,059 406 * Consolidated Infrastructure Group Ltd. 270,566 368 * Alviva Holdings Ltd. 220,192 347 Merafe Resources Ltd. 2,563,721 318 * Royal Bafokeng Platinum Ltd. 119,214 315 Invicta Holdings Ltd. 70,076 287 Clover Industries Ltd. 233,133 283 DRDGOLD Ltd. 678,279 265 * Aveng Ltd. 581,779 248 Group Five Ltd. 171,940 201 Adcorp Holdings Ltd. 164,865 169 ___________ 27,899 South Korea (4.1%)
Medy-Tox Inc. 7,168 3,150 LG Innotek Co. Ltd. 25,322 2,924 CJ E&M Corp. 33,755 2,387 *,^ Kumho Tire Co. Inc. 283,147 2,002 *,^ ViroMed Co. Ltd. 23,940 1,940 Com2uSCorp 17,893 1,886 Meritz Securities Co. Ltd. 507,115 1,839 KB Insurance Co. Ltd. 63,054 1,811 *,^ Komipharm International Co. Ltd. 55,372 1,799 ^ Kolon Industries Inc. 29,682 1,783 SK Chemicals Co. Ltd. 31,347 1,734 ^ Korea Kolmar Co. Ltd. 24,143 1,702 ^ CJ CGV Co. Ltd. 22,624 1,699 ^ Youngone Corp. 54,034 1,609 KIWOOM Securities Co. Ltd. 22,915 1,590 Korean Reinsurance Co. 157,000 1,558 Meritz Fire & Marine Insurance Co. Ltd. 98,823 1,537 * Pan Ocean Co. Ltd. 325,991 1,490 *,^ Hugel Inc. 3,610 1,478 ^ Cosmax Inc. 11,769 1,469 SK Materials Co. Ltd. 9,398 1,456 ^ Green Cross Corp. 9,560 1,377 Green Cross Holdings Corp. 47,493 1,360 ^ LIG Nex1 Co. Ltd. 19,017 1,348 Hyundai Home Shopping Network Corp. 12,460 1,336 Seoul Semiconductor Co. Ltd. 77,637 1,282 Hyundai Greenfood Co. Ltd. 89,763 1,260 SFA Engineering Corp. 18,077 1,242 * WONIK IPS Co. Ltd. 54,044 1,229 JB Financial Group Co. Ltd. 221,705 1,177 LG International Corp. 41,105 1,173 Poongsan Corp. 33,953 1,164 LS Industrial Systems Co. Ltd. 25,968 1,159 * Dongbu HiTek Co. Ltd. 61,994 1,149 Innocean Worldwide Inc. 20,361 1,142 *,^ Yungjin Pharmaceutical Co. Ltd. 151,634 1,138 Samyang Holdings Corp. 10,134 1,126 ^ IS Dongseo Co. Ltd. 29,735 1,122 ^ Hana Tour Service Inc. 14,803 1,097 Korea Petrochemical Ind Co. Ltd. 5,230 1,086 Eo Technics Co. Ltd. 14,567 1,085 LOTTE Himart Co. Ltd. 22,355 1,080 Koh Young Technology Inc. 22,571 1,065
82
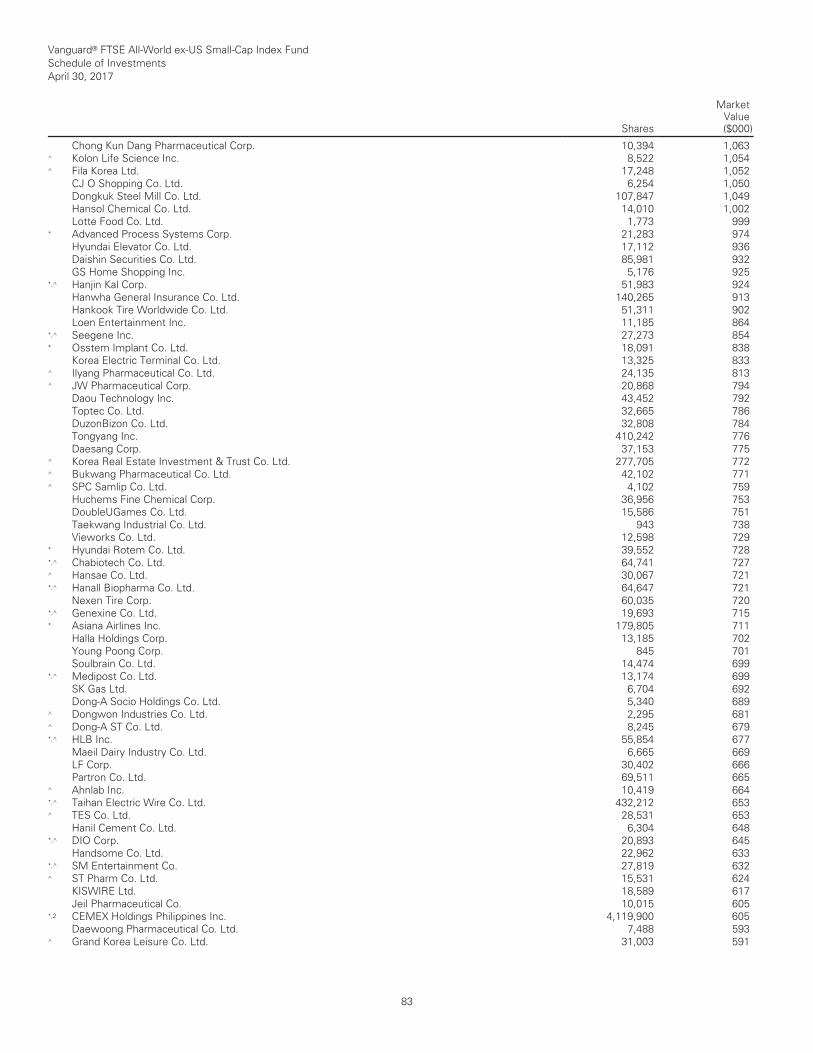
Vanguard® FTSE All-World ex-US Small-Cap Index Fund Schedule of Investments April 30, 2017
Shares
MarketValue($000)
__________________________________________________________________________________________________________________________________________________________________________________________________________________________________________________________________________________________________________________________________________________________________________________________________________________________________________________________________________________________________________________________________________________________________________________________________________________________________________________________________________________________ __________________________________________________________________________________________________________________________________________________________________________________________________________________________________________________________________________________________________________________________________________________________________________________________________________________________________________________________________________________________________________________________________________________________________________________________________________________________________________________________________________________________
Chong Kun Dang Pharmaceutical Corp. 10,394 1,063 ^ Kolon Life Science Inc. 8,522 1,054 ^ Fila Korea Ltd. 17,248 1,052 CJ O Shopping Co. Ltd. 6,254 1,050 Dongkuk Steel Mill Co. Ltd. 107,847 1,049 Hansol Chemical Co. Ltd. 14,010 1,002 Lotte Food Co. Ltd. 1,773 999 * Advanced Process Systems Corp. 21,283 974 Hyundai Elevator Co. Ltd. 17,112 936 Daishin Securities Co. Ltd. 85,981 932 GS Home Shopping Inc. 5,176 925 *,^ Hanjin Kal Corp. 51,983 924 Hanwha General Insurance Co. Ltd. 140,265 913 Hankook Tire Worldwide Co. Ltd. 51,311 902 Loen Entertainment Inc. 11,185 864 *,^ Seegene Inc. 27,273 854 * Osstem Implant Co. Ltd. 18,091 838 Korea Electric Terminal Co. Ltd. 13,325 833 ^ Ilyang Pharmaceutical Co. Ltd. 24,135 813 ^ JW Pharmaceutical Corp. 20,868 794 Daou Technology Inc. 43,452 792 Toptec Co. Ltd. 32,665 786 DuzonBizon Co. Ltd. 32,808 784 Tongyang Inc. 410,242 776 Daesang Corp. 37,153 775 ^ Korea Real Estate Investment & Trust Co. Ltd. 277,705 772 ^ Bukwang Pharmaceutical Co. Ltd. 42,102 771 ^ SPC Samlip Co. Ltd. 4,102 759 Huchems Fine Chemical Corp. 36,956 753 DoubleUGames Co. Ltd. 15,586 751 Taekwang Industrial Co. Ltd. 943 738 Vieworks Co. Ltd. 12,598 729 * Hyundai Rotem Co. Ltd. 39,552 728 *,^ Chabiotech Co. Ltd. 64,741 727 ^ Hansae Co. Ltd. 30,067 721 *,^ Hanall Biopharma Co. Ltd. 64,647 721 Nexen Tire Corp. 60,035 720 *,^ Genexine Co. Ltd. 19,693 715 * Asiana Airlines Inc. 179,805 711 Halla Holdings Corp. 13,185 702 Young Poong Corp. 845 701 Soulbrain Co. Ltd. 14,474 699 *,^ Medipost Co. Ltd. 13,174 699 SK Gas Ltd. 6,704 692 Dong-A Socio Holdings Co. Ltd. 5,340 689 ^ Dongwon Industries Co. Ltd. 2,295 681 ^ Dong-A ST Co. Ltd. 8,245 679 *,^ HLB Inc. 55,854 677 Maeil Dairy Industry Co. Ltd. 6,665 669 LF Corp. 30,402 666 Partron Co. Ltd. 69,511 665 ^ Ahnlab Inc. 10,419 664 *,^ Taihan Electric Wire Co. Ltd. 432,212 653 ^ TES Co. Ltd. 28,531 653 Hanil Cement Co. Ltd. 6,304 648 *,^ DIO Corp. 20,893 645 Handsome Co. Ltd. 22,962 633 *,^ SM Entertainment Co. 27,819 632 ^ ST Pharm Co. Ltd. 15,531 624 KISWIRE Ltd. 18,589 617 Jeil Pharmaceutical Co. 10,015 605 *,2 CEMEX Holdings Philippines Inc. 4,119,900 605 Daewoong Pharmaceutical Co. Ltd. 7,488 593 ^ Grand Korea Leisure Co. Ltd. 31,003 591
83
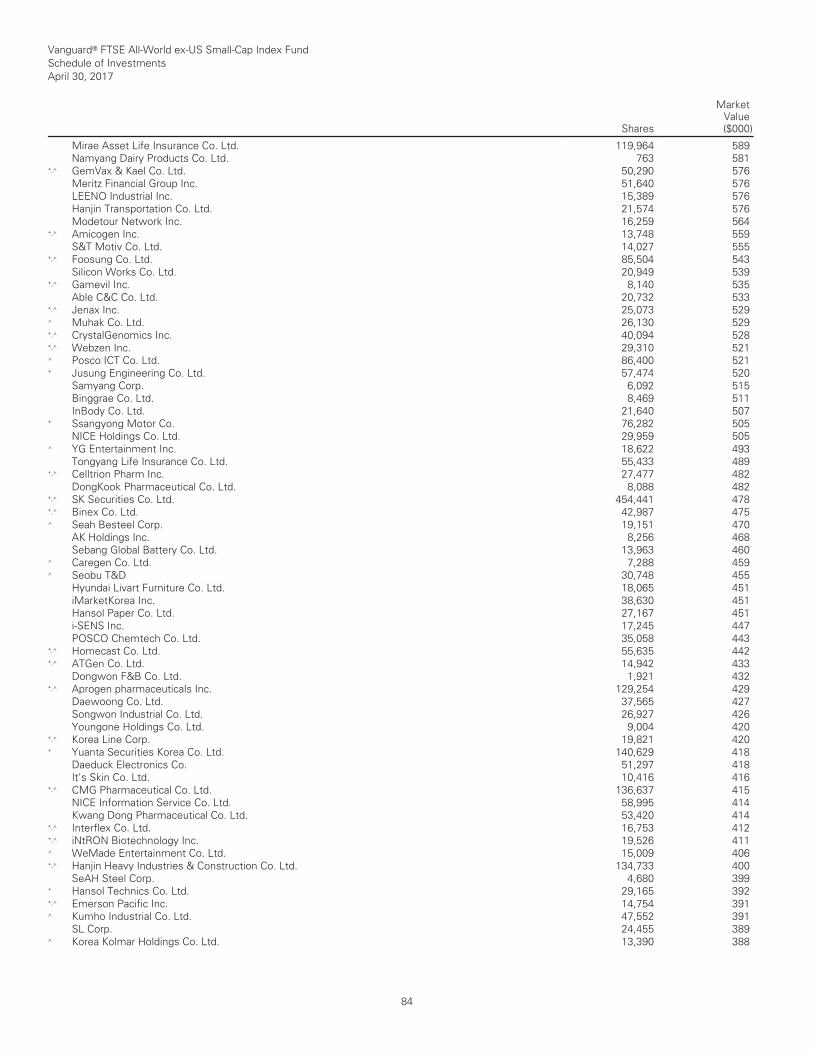
Vanguard® FTSE All-World ex-US Small-Cap Index Fund Schedule of Investments April 30, 2017
Shares
MarketValue($000)
__________________________________________________________________________________________________________________________________________________________________________________________________________________________________________________________________________________________________________________________________________________________________________________________________________________________________________________________________________________________________________________________________________________________________________________________________________________________________________________________________________________________ __________________________________________________________________________________________________________________________________________________________________________________________________________________________________________________________________________________________________________________________________________________________________________________________________________________________________________________________________________________________________________________________________________________________________________________________________________________________________________________________________________________________
Mirae Asset Life Insurance Co. Ltd. 119,964 589 Namyang Dairy Products Co. Ltd. 763 581 *,^ GemVax & Kael Co. Ltd. 50,290 576 Meritz Financial Group Inc. 51,640 576 LEENO Industrial Inc. 15,389 576 Hanjin Transportation Co. Ltd. 21,574 576 Modetour Network Inc. 16,259 564 *,^ Amicogen Inc. 13,748 559 S&T Motiv Co. Ltd. 14,027 555 *,^ Foosung Co. Ltd. 85,504 543 Silicon Works Co. Ltd. 20,949 539 *,^ Gamevil Inc. 8,140 535 Able C&C Co. Ltd. 20,732 533 *,^ Jenax Inc. 25,073 529 ^ Muhak Co. Ltd. 26,130 529 *,^ CrystalGenomics Inc. 40,094 528 *,^ Webzen Inc. 29,310 521 ^ Posco ICT Co. Ltd. 86,400 521 * Jusung Engineering Co. Ltd. 57,474 520 Samyang Corp. 6,092 515 Binggrae Co. Ltd. 8,469 511 InBody Co. Ltd. 21,640 507 * Ssangyong Motor Co. 76,282 505 NICE Holdings Co. Ltd. 29,959 505 ^ YG Entertainment Inc. 18,622 493 Tongyang Life Insurance Co. Ltd. 55,433 489 *,^ Celltrion Pharm Inc. 27,477 482 DongKook Pharmaceutical Co. Ltd. 8,088 482 *,^ SK Securities Co. Ltd. 454,441 478 *,^ Binex Co. Ltd. 42,987 475 ^ Seah Besteel Corp. 19,151 470 AK Holdings Inc. 8,256 468 Sebang Global Battery Co. Ltd. 13,963 460 ^ Caregen Co. Ltd. 7,288 459 ^ Seobu T&D 30,748 455 Hyundai Livart Furniture Co. Ltd. 18,065 451 iMarketKorea Inc. 38,630 451 Hansol Paper Co. Ltd. 27,167 451 i-SENS Inc. 17,245 447 POSCO Chemtech Co. Ltd. 35,058 443 *,^ Homecast Co. Ltd. 55,635 442 *,^ ATGen Co. Ltd. 14,942 433 Dongwon F&B Co. Ltd. 1,921 432 *,^ Aprogen pharmaceuticals Inc. 129,254 429 Daewoong Co. Ltd. 37,565 427 Songwon Industrial Co. Ltd. 26,927 426 Youngone Holdings Co. Ltd. 9,004 420 *,^ Korea Line Corp. 19,821 420 * Yuanta Securities Korea Co. Ltd. 140,629 418 Daeduck Electronics Co. 51,297 418 It's Skin Co. Ltd. 10,416 416 *,^ CMG Pharmaceutical Co. Ltd. 136,637 415 NICE Information Service Co. Ltd. 58,995 414 Kwang Dong Pharmaceutical Co. Ltd. 53,420 414 *,^ Interflex Co. Ltd. 16,753 412 *,^ iNtRON Biotechnology Inc. 19,526 411 ^ WeMade Entertainment Co. Ltd. 15,009 406 *,^ Hanjin Heavy Industries & Construction Co. Ltd. 134,733 400 SeAH Steel Corp. 4,680 399 * Hansol Technics Co. Ltd. 29,165 392 *,^ Emerson Pacific Inc. 14,754 391 ^ Kumho Industrial Co. Ltd. 47,552 391 SL Corp. 24,455 389 ^ Korea Kolmar Holdings Co. Ltd. 13,390 388
84
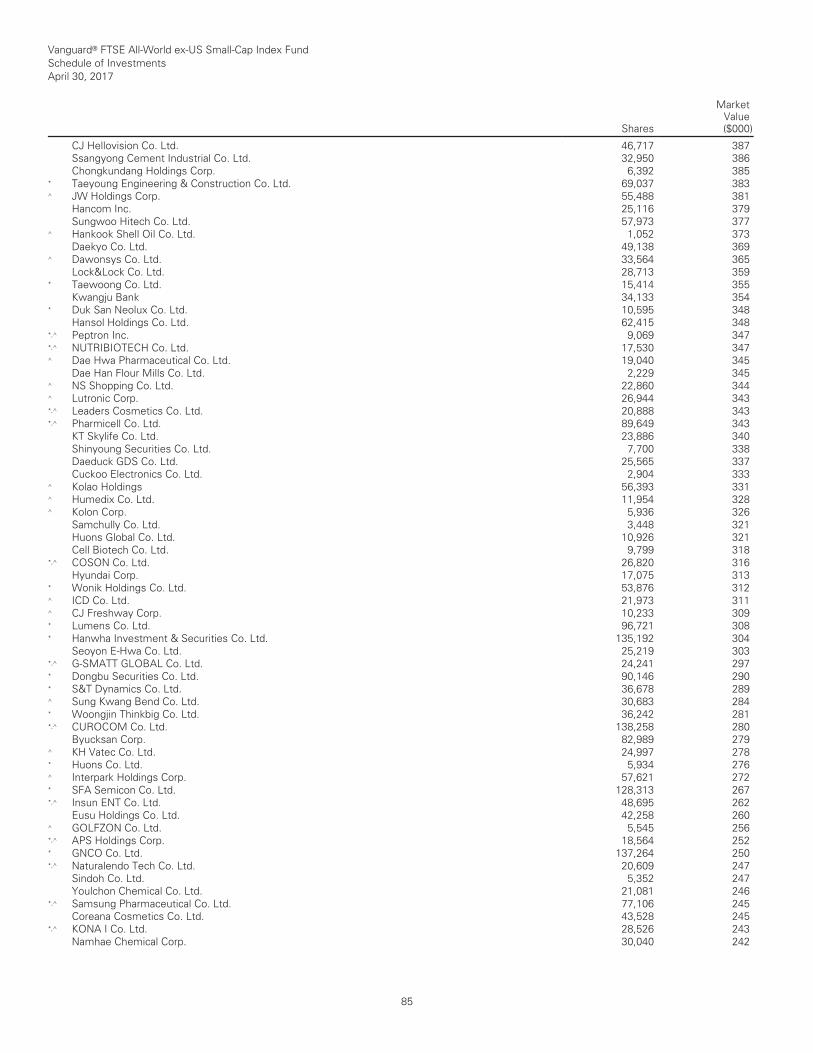
Vanguard® FTSE All-World ex-US Small-Cap Index Fund Schedule of Investments April 30, 2017
Shares
MarketValue($000)
__________________________________________________________________________________________________________________________________________________________________________________________________________________________________________________________________________________________________________________________________________________________________________________________________________________________________________________________________________________________________________________________________________________________________________________________________________________________________________________________________________________________ __________________________________________________________________________________________________________________________________________________________________________________________________________________________________________________________________________________________________________________________________________________________________________________________________________________________________________________________________________________________________________________________________________________________________________________________________________________________________________________________________________________________
CJ Hellovision Co. Ltd. 46,717 387 Ssangyong Cement Industrial Co. Ltd. 32,950 386 Chongkundang Holdings Corp. 6,392 385 * Taeyoung Engineering & Construction Co. Ltd. 69,037 383 ^ JW Holdings Corp. 55,488 381 Hancom Inc. 25,116 379 Sungwoo Hitech Co. Ltd. 57,973 377 ^ Hankook Shell Oil Co. Ltd. 1,052 373 Daekyo Co. Ltd. 49,138 369 ^ Dawonsys Co. Ltd. 33,564 365 Lock&Lock Co. Ltd. 28,713 359 * Taewoong Co. Ltd. 15,414 355 Kwangju Bank 34,133 354 * Duk San Neolux Co. Ltd. 10,595 348 Hansol Holdings Co. Ltd. 62,415 348 *,^ Peptron Inc. 9,069 347 *,^ NUTRIBIOTECH Co. Ltd. 17,530 347 ^ Dae Hwa Pharmaceutical Co. Ltd. 19,040 345 Dae Han Flour Mills Co. Ltd. 2,229 345 ^ NS Shopping Co. Ltd. 22,860 344 ^ Lutronic Corp. 26,944 343 *,^ Leaders Cosmetics Co. Ltd. 20,888 343 *,^ Pharmicell Co. Ltd. 89,649 343 KT Skylife Co. Ltd. 23,886 340 Shinyoung Securities Co. Ltd. 7,700 338 Daeduck GDS Co. Ltd. 25,565 337 Cuckoo Electronics Co. Ltd. 2,904 333 ^ Kolao Holdings 56,393 331 ^ Humedix Co. Ltd. 11,954 328 ^ Kolon Corp. 5,936 326 Samchully Co. Ltd. 3,448 321 Huons Global Co. Ltd. 10,926 321 Cell Biotech Co. Ltd. 9,799 318 *,^ COSON Co. Ltd. 26,820 316 Hyundai Corp. 17,075 313 * Wonik Holdings Co. Ltd. 53,876 312 ^ ICD Co. Ltd. 21,973 311 ^ CJ Freshway Corp. 10,233 309 * Lumens Co. Ltd. 96,721 308 * Hanwha Investment & Securities Co. Ltd. 135,192 304 Seoyon E-Hwa Co. Ltd. 25,219 303 *,^ G-SMATT GLOBAL Co. Ltd. 24,241 297 * Dongbu Securities Co. Ltd. 90,146 290 * S&T Dynamics Co. Ltd. 36,678 289 ^ Sung Kwang Bend Co. Ltd. 30,683 284 * Woongjin Thinkbig Co. Ltd. 36,242 281 *,^ CUROCOM Co. Ltd. 138,258 280 Byucksan Corp. 82,989 279 ^ KH Vatec Co. Ltd. 24,997 278 * Huons Co. Ltd. 5,934 276 ^ Interpark Holdings Corp. 57,621 272 * SFA Semicon Co. Ltd. 128,313 267 *,^ Insun ENT Co. Ltd. 48,695 262 Eusu Holdings Co. Ltd. 42,258 260 ^ GOLFZON Co. Ltd. 5,545 256 *,^ APS Holdings Corp. 18,564 252 * GNCO Co. Ltd. 137,264 250 *,^ Naturalendo Tech Co. Ltd. 20,609 247 Sindoh Co. Ltd. 5,352 247 Youlchon Chemical Co. Ltd. 21,081 246 *,^ Samsung Pharmaceutical Co. Ltd. 77,106 245 Coreana Cosmetics Co. Ltd. 43,528 245 *,^ KONA I Co. Ltd. 28,526 243 Namhae Chemical Corp. 30,040 242
85
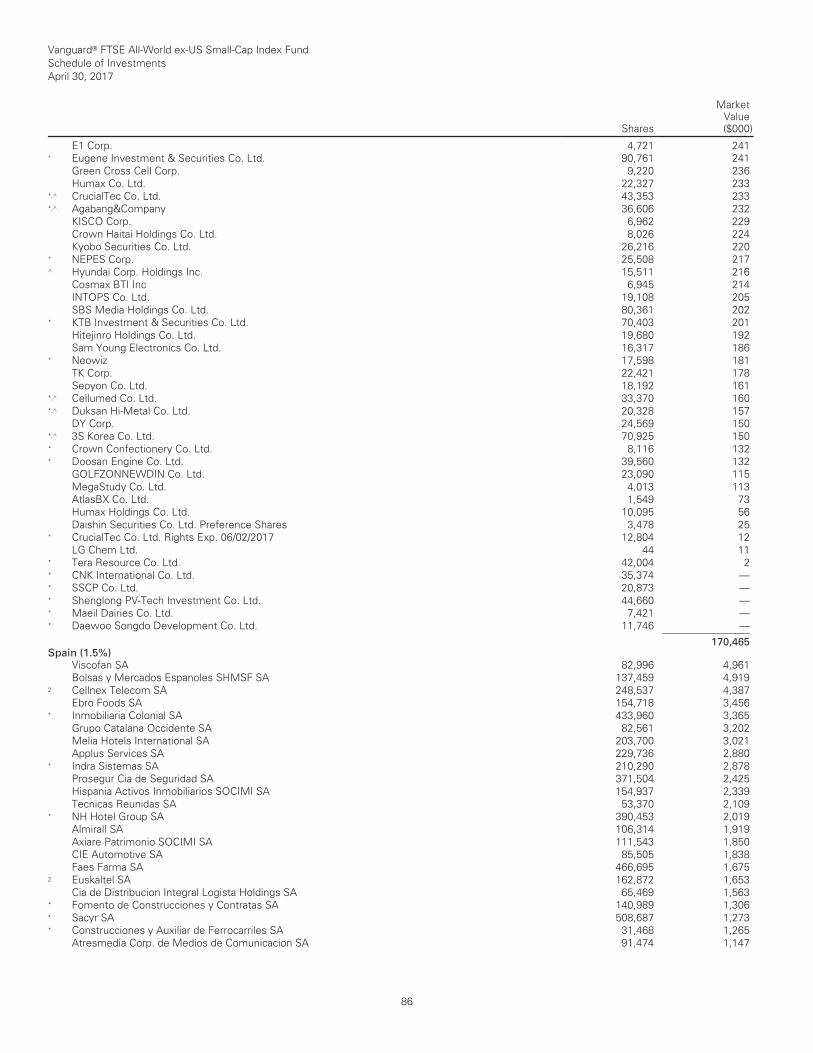
Vanguard® FTSE All-World ex-US Small-Cap Index Fund Schedule of Investments April 30, 2017
Shares
MarketValue($000)
__________________________________________________________________________________________________________________________________________________________________________________________________________________________________________________________________________________________________________________________________________________________________________________________________________________________________________________________________________________________________________________________________________________________________________________________________________________________________________________________________________________________ __________________________________________________________________________________________________________________________________________________________________________________________________________________________________________________________________________________________________________________________________________________________________________________________________________________________________________________________________________________________________________________________________________________________________________________________________________________________________________________________________________________________
E1 Corp. 4,721 241 * Eugene Investment & Securities Co. Ltd. 90,761 241 Green Cross Cell Corp. 9,220 236 Humax Co. Ltd. 22,327 233 *,^ CrucialTec Co. Ltd. 43,353 233 *,^ Agabang&Company 36,606 232 KISCO Corp. 6,962 229 Crown Haitai Holdings Co. Ltd. 8,026 224 Kyobo Securities Co. Ltd. 26,216 220 * NEPES Corp. 25,508 217 ^ Hyundai Corp. Holdings Inc. 15,511 216 Cosmax BTI Inc 6,945 214 INTOPS Co. Ltd. 19,108 205 SBS Media Holdings Co. Ltd. 80,361 202 * KTB Investment & Securities Co. Ltd. 70,403 201 Hitejinro Holdings Co. Ltd. 19,680 192 Sam Young Electronics Co. Ltd. 16,317 186 * Neowiz 17,598 181 TK Corp. 22,421 178 Seoyon Co. Ltd. 18,192 161 *,^ Cellumed Co. Ltd. 33,370 160 *,^ Duksan Hi-Metal Co. Ltd. 20,328 157 DY Corp. 24,569 150 *,^ 3S Korea Co. Ltd. 70,925 150 * Crown Confectionery Co. Ltd. 8,116 132 * Doosan Engine Co. Ltd. 39,560 132 GOLFZONNEWDIN Co. Ltd. 23,090 115 MegaStudy Co. Ltd. 4,013 113 AtlasBX Co. Ltd. 1,549 73 Humax Holdings Co. Ltd. 10,095 56 Daishin Securities Co. Ltd. Preference Shares 3,478 25 * CrucialTec Co. Ltd. Rights Exp. 06/02/2017 12,804 12 LG Chem Ltd. 44 11 * Tera Resource Co. Ltd. 42,004 2 * CNK International Co. Ltd. 35,374 — * SSCP Co. Ltd. 20,873 — * Shenglong PV-Tech Investment Co. Ltd. 44,660 — * Maeil Dairies Co. Ltd. 7,421 — * Daewoo Songdo Development Co. Ltd. 11,746 — ___________ 170,465 Spain (1.5%)
Viscofan SA 82,996 4,961 Bolsas y Mercados Espanoles SHMSF SA 137,459 4,919 2 Cellnex Telecom SA 248,537 4,387 Ebro Foods SA 154,718 3,456 * Inmobiliaria Colonial SA 433,960 3,365 Grupo Catalana Occidente SA 82,561 3,202 Melia Hotels International SA 203,700 3,021 Applus Services SA 229,736 2,880 * Indra Sistemas SA 210,290 2,878 Prosegur Cia de Seguridad SA 371,504 2,425 Hispania Activos Inmobiliarios SOCIMI SA 154,937 2,339 Tecnicas Reunidas SA 53,370 2,109 * NH Hotel Group SA 390,453 2,019 Almirall SA 106,314 1,919 Axiare Patrimonio SOCIMI SA 111,543 1,850 CIE Automotive SA 85,505 1,838 Faes Farma SA 466,695 1,675 2 Euskaltel SA 162,872 1,653 Cia de Distribucion Integral Logista Holdings SA 65,469 1,563 * Fomento de Construcciones y Contratas SA 140,989 1,306 * Sacyr SA 508,687 1,273 * Construcciones y Auxiliar de Ferrocarriles SA 31,468 1,265 Atresmedia Corp. de Medios de Comunicacion SA 91,474 1,147
86
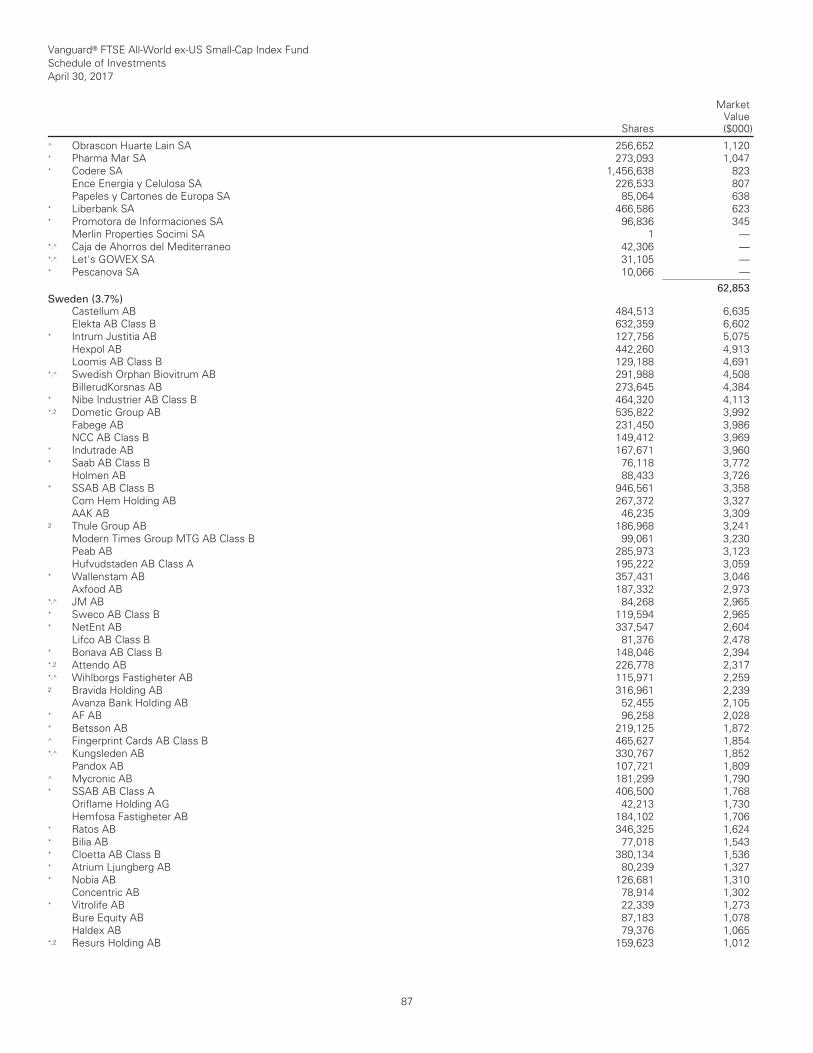
Vanguard® FTSE All-World ex-US Small-Cap Index Fund Schedule of Investments April 30, 2017
Shares
MarketValue($000)
__________________________________________________________________________________________________________________________________________________________________________________________________________________________________________________________________________________________________________________________________________________________________________________________________________________________________________________________________________________________________________________________________________________________________________________________________________________________________________________________________________________________ __________________________________________________________________________________________________________________________________________________________________________________________________________________________________________________________________________________________________________________________________________________________________________________________________________________________________________________________________________________________________________________________________________________________________________________________________________________________________________________________________________________________
^ Obrascon Huarte Lain SA 256,652 1,120 * Pharma Mar SA 273,093 1,047 * Codere SA 1,456,638 823 Ence Energia y Celulosa SA 226,533 807 Papeles y Cartones de Europa SA 85,064 638 * Liberbank SA 466,586 623 * Promotora de Informaciones SA 96,836 345 Merlin Properties Socimi SA 1 — *,^ Caja de Ahorros del Mediterraneo 42,306 — *,^ Let's GOWEX SA 31,105 — * Pescanova SA 10,066 — ___________ 62,853 Sweden (3.7%)
Castellum AB 484,513 6,635 Elekta AB Class B 632,359 6,602 * Intrum Justitia AB 127,756 5,075 Hexpol AB 442,260 4,913 Loomis AB Class B 129,188 4,691 *,^ Swedish Orphan Biovitrum AB 291,988 4,508 BillerudKorsnas AB 273,645 4,384 * Nibe Industrier AB Class B 464,320 4,113 *,2 Dometic Group AB 535,822 3,992 Fabege AB 231,450 3,986 NCC AB Class B 149,412 3,969 * Indutrade AB 167,671 3,960 * Saab AB Class B 76,118 3,772 Holmen AB 88,433 3,726 * SSAB AB Class B 946,561 3,358 Com Hem Holding AB 267,372 3,327 AAK AB 46,235 3,309 2 Thule Group AB 186,968 3,241 Modern Times Group MTG AB Class B 99,061 3,230 Peab AB 285,973 3,123 Hufvudstaden AB Class A 195,222 3,059 * Wallenstam AB 357,431 3,046 Axfood AB 187,332 2,973 *,^ JM AB 84,268 2,965 * Sweco AB Class B 119,594 2,965 * NetEnt AB 337,547 2,604 Lifco AB Class B 81,376 2,478 * Bonava AB Class B 148,046 2,394 *,2 Attendo AB 226,778 2,317 *,^ Wihlborgs Fastigheter AB 115,971 2,259 2 Bravida Holding AB 316,961 2,239 Avanza Bank Holding AB 52,455 2,105 * AF AB 96,258 2,028 * Betsson AB 219,125 1,872 ^ Fingerprint Cards AB Class B 465,627 1,854 *,^ Kungsleden AB 330,767 1,852 Pandox AB 107,721 1,809 ^ Mycronic AB 181,299 1,790 * SSAB AB Class A 406,500 1,768 Oriflame Holding AG 42,213 1,730 Hemfosa Fastigheter AB 184,102 1,706 * Ratos AB 346,325 1,624 * Bilia AB 77,018 1,543 * Cloetta AB Class B 380,134 1,536 * Atrium Ljungberg AB 80,239 1,327 * Nobia AB 126,681 1,310 Concentric AB 78,914 1,302 * Vitrolife AB 22,339 1,273 Bure Equity AB 87,183 1,078 Haldex AB 79,376 1,065 *,2 Resurs Holding AB 159,623 1,012
87
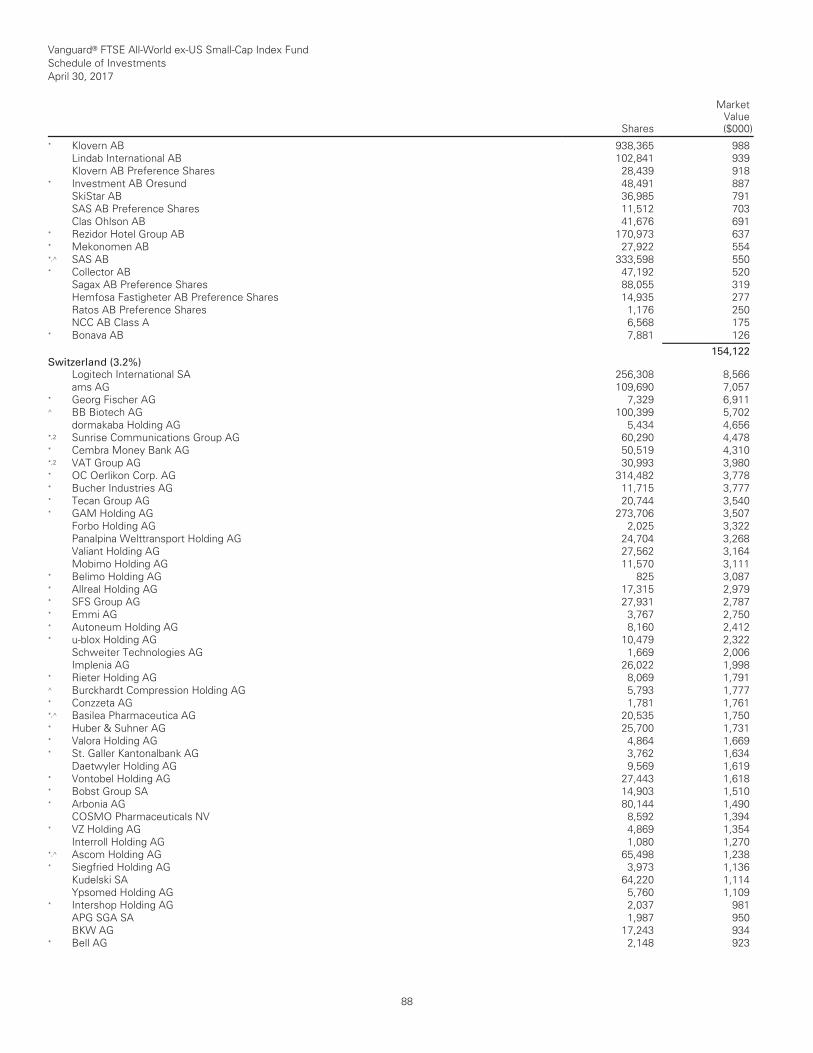
Vanguard® FTSE All-World ex-US Small-Cap Index Fund Schedule of Investments April 30, 2017
Shares
MarketValue($000)
__________________________________________________________________________________________________________________________________________________________________________________________________________________________________________________________________________________________________________________________________________________________________________________________________________________________________________________________________________________________________________________________________________________________________________________________________________________________________________________________________________________________ __________________________________________________________________________________________________________________________________________________________________________________________________________________________________________________________________________________________________________________________________________________________________________________________________________________________________________________________________________________________________________________________________________________________________________________________________________________________________________________________________________________________
* Klovern AB 938,365 988 Lindab International AB 102,841 939 Klovern AB Preference Shares 28,439 918 * Investment AB Oresund 48,491 887 SkiStar AB 36,985 791 SAS AB Preference Shares 11,512 703 Clas Ohlson AB 41,676 691 * Rezidor Hotel Group AB 170,973 637 * Mekonomen AB 27,922 554 *,^ SAS AB 333,598 550 * Collector AB 47,192 520 Sagax AB Preference Shares 88,055 319 Hemfosa Fastigheter AB Preference Shares 14,935 277 Ratos AB Preference Shares 1,176 250 NCC AB Class A 6,568 175 * Bonava AB 7,881 126 ___________ 154,122 Switzerland (3.2%)
Logitech International SA 256,308 8,566 ams AG 109,690 7,057 * Georg Fischer AG 7,329 6,911 ^ BB Biotech AG 100,399 5,702 dormakaba Holding AG 5,434 4,656 *,2 Sunrise Communications Group AG 60,290 4,478 * Cembra Money Bank AG 50,519 4,310 *,2 VAT Group AG 30,993 3,980 * OC Oerlikon Corp. AG 314,482 3,778 * Bucher Industries AG 11,715 3,777 * Tecan Group AG 20,744 3,540 * GAM Holding AG 273,706 3,507 Forbo Holding AG 2,025 3,322 Panalpina Welttransport Holding AG 24,704 3,268 Valiant Holding AG 27,562 3,164 Mobimo Holding AG 11,570 3,111 * Belimo Holding AG 825 3,087 * Allreal Holding AG 17,315 2,979 * SFS Group AG 27,931 2,787 * Emmi AG 3,767 2,750 * Autoneum Holding AG 8,160 2,412 * u-blox Holding AG 10,479 2,322 Schweiter Technologies AG 1,669 2,006 Implenia AG 26,022 1,998 * Rieter Holding AG 8,069 1,791 ^ Burckhardt Compression Holding AG 5,793 1,777 * Conzzeta AG 1,781 1,761 *,^ Basilea Pharmaceutica AG 20,535 1,750 * Huber & Suhner AG 25,700 1,731 * Valora Holding AG 4,864 1,669 * St. Galler Kantonalbank AG 3,762 1,634 Daetwyler Holding AG 9,569 1,619 * Vontobel Holding AG 27,443 1,618 * Bobst Group SA 14,903 1,510 * Arbonia AG 80,144 1,490 COSMO Pharmaceuticals NV 8,592 1,394 * VZ Holding AG 4,869 1,354 Interroll Holding AG 1,080 1,270 *,^ Ascom Holding AG 65,498 1,238 * Siegfried Holding AG 3,973 1,136 Kudelski SA 64,220 1,114 Ypsomed Holding AG 5,760 1,109 * Intershop Holding AG 2,037 981 APG SGA SA 1,987 950 BKW AG 17,243 934 * Bell AG 2,148 923
88

Vanguard® FTSE All-World ex-US Small-Cap Index Fund Schedule of Investments April 30, 2017
Shares
MarketValue($000)
__________________________________________________________________________________________________________________________________________________________________________________________________________________________________________________________________________________________________________________________________________________________________________________________________________________________________________________________________________________________________________________________________________________________________________________________________________________________________________________________________________________________ __________________________________________________________________________________________________________________________________________________________________________________________________________________________________________________________________________________________________________________________________________________________________________________________________________________________________________________________________________________________________________________________________________________________________________________________________________________________________________________________________________________________
Vetropack Holding AG 433 857 LEM Holding SA 836 855 *,^ Meyer Burger Technology AG 997,415 822 * Schmolz & Bickenbach AG 886,336 812 ^ EFG International AG 126,899 806 *,^ Leonteq AG 13,949 616 * Zehnder Group AG 17,624 597 ALSO Holding AG 4,493 565 * Bachem Holding AG 4,465 532 Plazza AG 2,102 487 CS Real Estate Fund LivingPlus 3,504 482 Swissquote Group Holding SA 16,477 454 * Alpiq Holding AG 4,169 310 * Orascom Development Holding AG 1,230 7 * Petroplus Holdings AG 36,495 — ___________ 132,423 Taiwan (6.3%)
Chailease Holding Co. Ltd. 1,865,214 4,752 Powertech Technology Inc. 1,258,662 3,949 WPG Holdings Ltd. 2,689,889 3,410 Win Semiconductors Corp. 685,969 3,055 Yageo Corp. 845,028 2,983 Airtac International Group 246,229 2,815 Phison Electronics Corp. 287,962 2,711 Winbond Electronics Corp. 4,732,000 2,671 Highwealth Construction Corp. 1,531,341 2,581 Hiwin Technologies Corp. 399,304 2,544 Nien Made Enterprise Co. Ltd. 247,000 2,498 Tripod Technology Corp. 875,327 2,474 Micro-Star International Co. Ltd. 1,224,000 2,452 Merida Industry Co. Ltd. 440,055 2,362 * Ruentex Development Co. Ltd. 1,924,142 2,348 CTCI Corp. 1,214,667 2,127 Accton Technology Corp. 910,467 2,065 * TaiMed Biologics Inc. 341,000 2,050 Ruentex Industries Ltd. 1,269,160 2,041 Chroma ATE Inc. 644,040 2,013 Elite Material Co. Ltd. 499,519 1,992 Standard Foods Corp. 777,258 1,918 Zhen Ding Technology Holding Ltd. 790,400 1,848 Kenda Rubber Industrial Co. Ltd. 1,145,016 1,843 King Yuan Electronics Co. Ltd. 2,022,963 1,826 Poya International Co. Ltd. 133,085 1,818 Merry Electronics Co. Ltd. 306,910 1,817 Walsin Technology Corp. 948,958 1,815 FLEXium Interconnect Inc. 480,376 1,783 Silergy Corp. 98,000 1,772 King Slide Works Co. Ltd. 113,675 1,750 LCY Chemical Corp. 1,203,255 1,730 Simplo Technology Co. Ltd. 506,053 1,693 eMemory Technology Inc. 122,000 1,680 King's Town Bank Co. Ltd. 1,723,193 1,656 Qisda Corp. 2,588,000 1,647 Radiant Opto-Electronics Corp. 787,147 1,641 E Ink Holdings Inc. 1,607,708 1,640 Hota Industrial Manufacturing Co. Ltd. 368,323 1,622 St. Shine Optical Co. Ltd. 83,419 1,615 Chipbond Technology Corp. 1,060,852 1,582 * Genius Electronic Optical Co. Ltd. 134,732 1,574 * China Petrochemical Development Corp. 4,168,077 1,574 Globalwafers Co. Ltd. 218,000 1,556 General Interface Solution Holding Ltd. 278,000 1,550 Compeq Manufacturing Co. Ltd. 2,044,471 1,504 TSRC Corp. 1,296,046 1,483
89
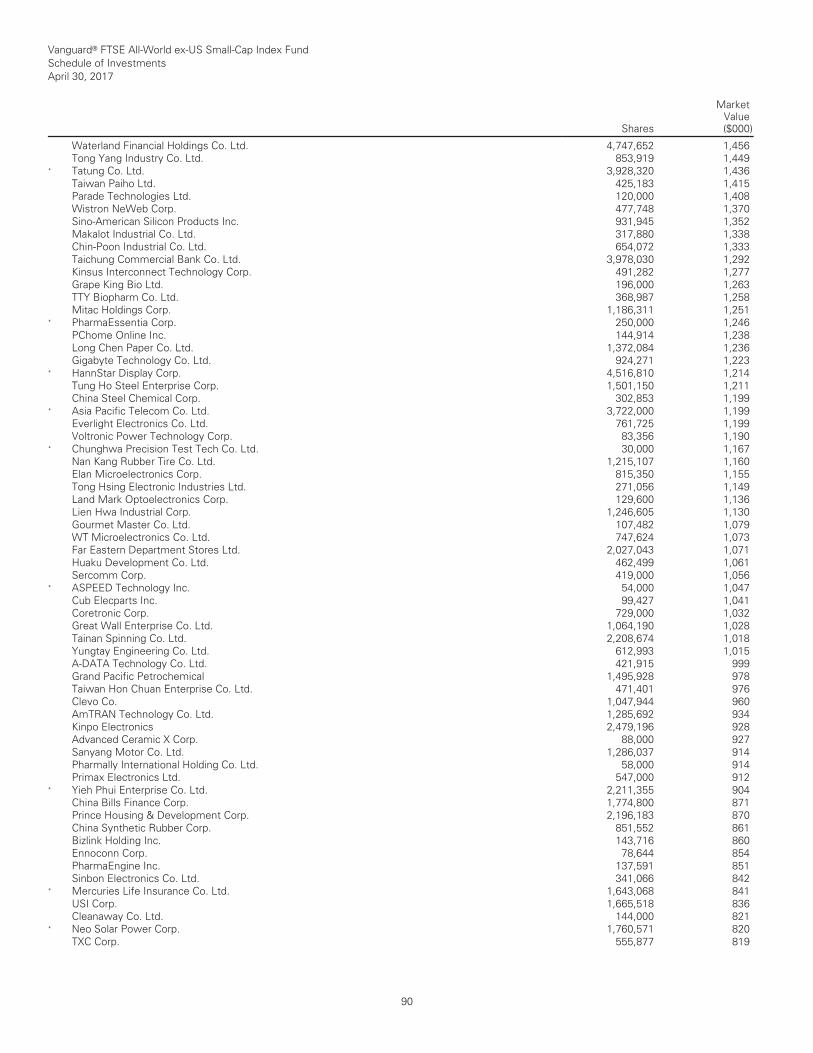
Vanguard® FTSE All-World ex-US Small-Cap Index Fund Schedule of Investments April 30, 2017
Shares
MarketValue($000)
__________________________________________________________________________________________________________________________________________________________________________________________________________________________________________________________________________________________________________________________________________________________________________________________________________________________________________________________________________________________________________________________________________________________________________________________________________________________________________________________________________________________ __________________________________________________________________________________________________________________________________________________________________________________________________________________________________________________________________________________________________________________________________________________________________________________________________________________________________________________________________________________________________________________________________________________________________________________________________________________________________________________________________________________________
Waterland Financial Holdings Co. Ltd. 4,747,652 1,456 Tong Yang Industry Co. Ltd. 853,919 1,449 * Tatung Co. Ltd. 3,928,320 1,436 Taiwan Paiho Ltd. 425,183 1,415 Parade Technologies Ltd. 120,000 1,408 Wistron NeWeb Corp. 477,748 1,370 Sino-American Silicon Products Inc. 931,945 1,352 Makalot Industrial Co. Ltd. 317,880 1,338 Chin-Poon Industrial Co. Ltd. 654,072 1,333 Taichung Commercial Bank Co. Ltd. 3,978,030 1,292 Kinsus Interconnect Technology Corp. 491,282 1,277 Grape King Bio Ltd. 196,000 1,263 TTY Biopharm Co. Ltd. 368,987 1,258 Mitac Holdings Corp. 1,186,311 1,251 * PharmaEssentia Corp. 250,000 1,246 PChome Online Inc. 144,914 1,238 Long Chen Paper Co. Ltd. 1,372,084 1,236 Gigabyte Technology Co. Ltd. 924,271 1,223 * HannStar Display Corp. 4,516,810 1,214 Tung Ho Steel Enterprise Corp. 1,501,150 1,211 China Steel Chemical Corp. 302,853 1,199 * Asia Pacific Telecom Co. Ltd. 3,722,000 1,199 Everlight Electronics Co. Ltd. 761,725 1,199 Voltronic Power Technology Corp. 83,356 1,190 * Chunghwa Precision Test Tech Co. Ltd. 30,000 1,167 Nan Kang Rubber Tire Co. Ltd. 1,215,107 1,160 Elan Microelectronics Corp. 815,350 1,155 Tong Hsing Electronic Industries Ltd. 271,056 1,149 Land Mark Optoelectronics Corp. 129,600 1,136 Lien Hwa Industrial Corp. 1,246,605 1,130 Gourmet Master Co. Ltd. 107,482 1,079 WT Microelectronics Co. Ltd. 747,624 1,073 Far Eastern Department Stores Ltd. 2,027,043 1,071 Huaku Development Co. Ltd. 462,499 1,061 Sercomm Corp. 419,000 1,056 * ASPEED Technology Inc. 54,000 1,047 Cub Elecparts Inc. 99,427 1,041 Coretronic Corp. 729,000 1,032 Great Wall Enterprise Co. Ltd. 1,064,190 1,028 Tainan Spinning Co. Ltd. 2,208,674 1,018 Yungtay Engineering Co. Ltd. 612,993 1,015 A-DATA Technology Co. Ltd. 421,915 999 Grand Pacific Petrochemical 1,495,928 978 Taiwan Hon Chuan Enterprise Co. Ltd. 471,401 976 Clevo Co. 1,047,944 960 AmTRAN Technology Co. Ltd. 1,285,692 934 Kinpo Electronics 2,479,196 928 Advanced Ceramic X Corp. 88,000 927 Sanyang Motor Co. Ltd. 1,286,037 914 Pharmally International Holding Co. Ltd. 58,000 914 Primax Electronics Ltd. 547,000 912 * Yieh Phui Enterprise Co. Ltd. 2,211,355 904 China Bills Finance Corp. 1,774,800 871 Prince Housing & Development Corp. 2,196,183 870 China Synthetic Rubber Corp. 851,552 861 Bizlink Holding Inc. 143,716 860 Ennoconn Corp. 78,644 854 PharmaEngine Inc. 137,591 851 Sinbon Electronics Co. Ltd. 341,066 842 * Mercuries Life Insurance Co. Ltd. 1,643,068 841 USI Corp. 1,665,518 836 Cleanaway Co. Ltd. 144,000 821 * Neo Solar Power Corp. 1,760,571 820 TXC Corp. 555,877 819
90
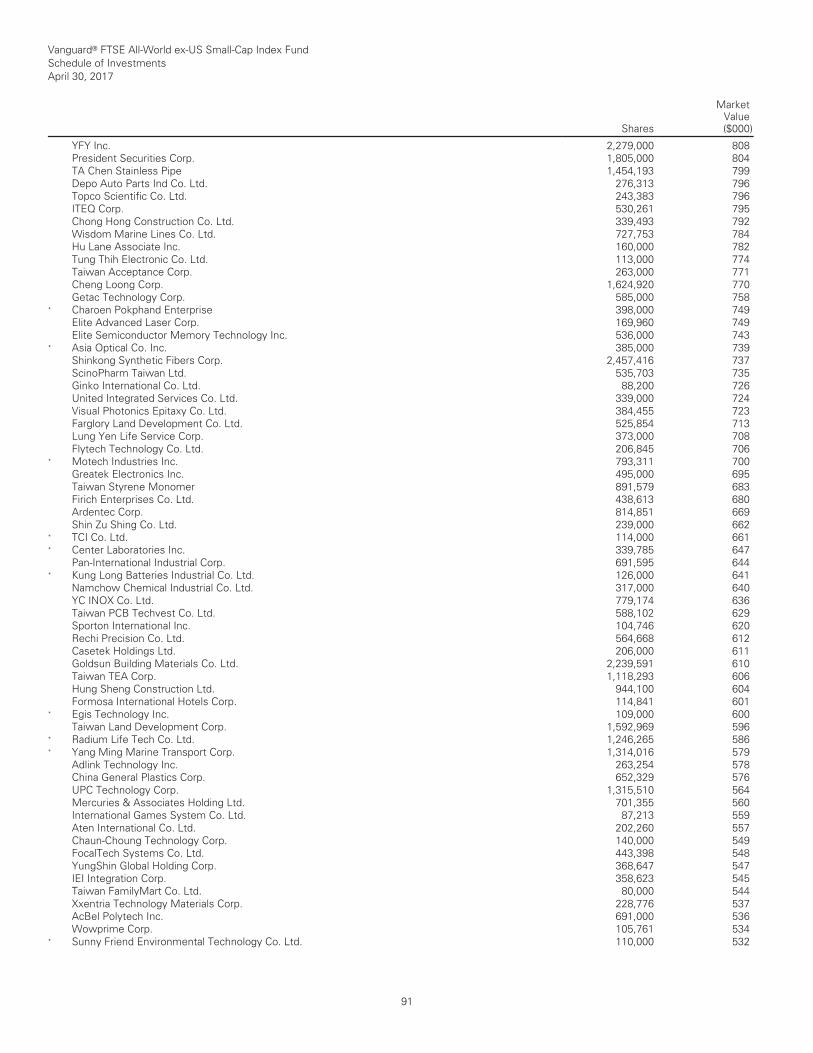
Vanguard® FTSE All-World ex-US Small-Cap Index Fund Schedule of Investments April 30, 2017
Shares
MarketValue($000)
__________________________________________________________________________________________________________________________________________________________________________________________________________________________________________________________________________________________________________________________________________________________________________________________________________________________________________________________________________________________________________________________________________________________________________________________________________________________________________________________________________________________ __________________________________________________________________________________________________________________________________________________________________________________________________________________________________________________________________________________________________________________________________________________________________________________________________________________________________________________________________________________________________________________________________________________________________________________________________________________________________________________________________________________________
YFY Inc. 2,279,000 808 President Securities Corp. 1,805,000 804 TA Chen Stainless Pipe 1,454,193 799 Depo Auto Parts Ind Co. Ltd. 276,313 796 Topco Scientific Co. Ltd. 243,383 796 ITEQ Corp. 530,261 795 Chong Hong Construction Co. Ltd. 339,493 792 Wisdom Marine Lines Co. Ltd. 727,753 784 Hu Lane Associate Inc. 160,000 782 Tung Thih Electronic Co. Ltd. 113,000 774 Taiwan Acceptance Corp. 263,000 771 Cheng Loong Corp. 1,624,920 770 Getac Technology Corp. 585,000 758 * Charoen Pokphand Enterprise 398,000 749 Elite Advanced Laser Corp. 169,960 749 Elite Semiconductor Memory Technology Inc. 536,000 743 * Asia Optical Co. Inc. 385,000 739 Shinkong Synthetic Fibers Corp. 2,457,416 737 ScinoPharm Taiwan Ltd. 535,703 735 Ginko International Co. Ltd. 88,200 726 United Integrated Services Co. Ltd. 339,000 724 Visual Photonics Epitaxy Co. Ltd. 384,455 723 Farglory Land Development Co. Ltd. 525,854 713 Lung Yen Life Service Corp. 373,000 708 Flytech Technology Co. Ltd. 206,845 706 * Motech Industries Inc. 793,311 700 Greatek Electronics Inc. 495,000 695 Taiwan Styrene Monomer 891,579 683 Firich Enterprises Co. Ltd. 438,613 680 Ardentec Corp. 814,851 669 Shin Zu Shing Co. Ltd. 239,000 662 * TCI Co. Ltd. 114,000 661 * Center Laboratories Inc. 339,785 647 Pan-International Industrial Corp. 691,595 644 * Kung Long Batteries Industrial Co. Ltd. 126,000 641 Namchow Chemical Industrial Co. Ltd. 317,000 640 YC INOX Co. Ltd. 779,174 636 Taiwan PCB Techvest Co. Ltd. 588,102 629 Sporton International Inc. 104,746 620 Rechi Precision Co. Ltd. 564,668 612 Casetek Holdings Ltd. 206,000 611 Goldsun Building Materials Co. Ltd. 2,239,591 610 Taiwan TEA Corp. 1,118,293 606 Hung Sheng Construction Ltd. 944,100 604 Formosa International Hotels Corp. 114,841 601 * Egis Technology Inc. 109,000 600 Taiwan Land Development Corp. 1,592,969 596 * Radium Life Tech Co. Ltd. 1,246,265 586 * Yang Ming Marine Transport Corp. 1,314,016 579 Adlink Technology Inc. 263,254 578 China General Plastics Corp. 652,329 576 UPC Technology Corp. 1,315,510 564 Mercuries & Associates Holding Ltd. 701,355 560 International Games System Co. Ltd. 87,213 559 Aten International Co. Ltd. 202,260 557 Chaun-Choung Technology Corp. 140,000 549 FocalTech Systems Co. Ltd. 443,398 548 YungShin Global Holding Corp. 368,647 547 IEI Integration Corp. 358,623 545 Taiwan FamilyMart Co. Ltd. 80,000 544 Xxentria Technology Materials Corp. 228,776 537 AcBel Polytech Inc. 691,000 536 Wowprime Corp. 105,761 534 * Sunny Friend Environmental Technology Co. Ltd. 110,000 532
91
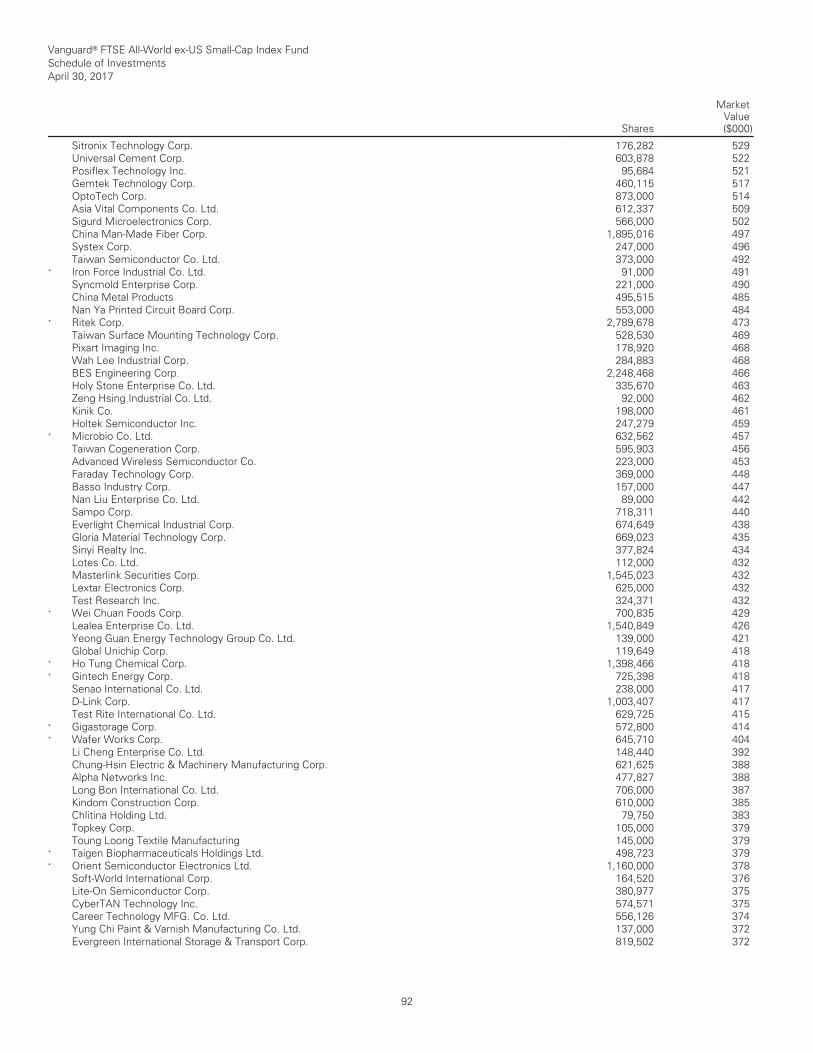
Vanguard® FTSE All-World ex-US Small-Cap Index Fund Schedule of Investments April 30, 2017
Shares
MarketValue($000)
__________________________________________________________________________________________________________________________________________________________________________________________________________________________________________________________________________________________________________________________________________________________________________________________________________________________________________________________________________________________________________________________________________________________________________________________________________________________________________________________________________________________ __________________________________________________________________________________________________________________________________________________________________________________________________________________________________________________________________________________________________________________________________________________________________________________________________________________________________________________________________________________________________________________________________________________________________________________________________________________________________________________________________________________________
Sitronix Technology Corp. 176,282 529 Universal Cement Corp. 603,878 522 Posiflex Technology Inc. 95,684 521 Gemtek Technology Corp. 460,115 517 OptoTech Corp. 873,000 514 Asia Vital Components Co. Ltd. 612,337 509 Sigurd Microelectronics Corp. 566,000 502 China Man-Made Fiber Corp. 1,895,016 497 Systex Corp. 247,000 496 Taiwan Semiconductor Co. Ltd. 373,000 492 * Iron Force Industrial Co. Ltd. 91,000 491 Syncmold Enterprise Corp. 221,000 490 China Metal Products 495,515 485 Nan Ya Printed Circuit Board Corp. 553,000 484 * Ritek Corp. 2,789,678 473 Taiwan Surface Mounting Technology Corp. 528,530 469 Pixart Imaging Inc. 178,920 468 Wah Lee Industrial Corp. 284,883 468 BES Engineering Corp. 2,248,468 466 Holy Stone Enterprise Co. Ltd. 335,670 463 Zeng Hsing Industrial Co. Ltd. 92,000 462 Kinik Co. 198,000 461 Holtek Semiconductor Inc. 247,279 459 * Microbio Co. Ltd. 632,562 457 Taiwan Cogeneration Corp. 595,903 456 Advanced Wireless Semiconductor Co. 223,000 453 Faraday Technology Corp. 369,000 448 Basso Industry Corp. 157,000 447 Nan Liu Enterprise Co. Ltd. 89,000 442 Sampo Corp. 718,311 440 Everlight Chemical Industrial Corp. 674,649 438 Gloria Material Technology Corp. 669,023 435 Sinyi Realty Inc. 377,824 434 Lotes Co. Ltd. 112,000 432 Masterlink Securities Corp. 1,545,023 432 Lextar Electronics Corp. 625,000 432 Test Research Inc. 324,371 432 * Wei Chuan Foods Corp. 700,835 429 Lealea Enterprise Co. Ltd. 1,540,849 426 Yeong Guan Energy Technology Group Co. Ltd. 139,000 421 Global Unichip Corp. 119,649 418 * Ho Tung Chemical Corp. 1,398,466 418 * Gintech Energy Corp. 725,398 418 Senao International Co. Ltd. 238,000 417 D-Link Corp. 1,003,407 417 Test Rite International Co. Ltd. 629,725 415 * Gigastorage Corp. 572,800 414 * Wafer Works Corp. 645,710 404 Li Cheng Enterprise Co. Ltd. 148,440 392 Chung-Hsin Electric & Machinery Manufacturing Corp. 621,625 388 Alpha Networks Inc. 477,827 388 Long Bon International Co. Ltd. 706,000 387 Kindom Construction Corp. 610,000 385 Chlitina Holding Ltd. 79,750 383 Topkey Corp. 105,000 379 Toung Loong Textile Manufacturing 145,000 379 * Taigen Biopharmaceuticals Holdings Ltd. 498,723 379 * Orient Semiconductor Electronics Ltd. 1,160,000 378 Soft-World International Corp. 164,520 376 Lite-On Semiconductor Corp. 380,977 375 CyberTAN Technology Inc. 574,571 375 Career Technology MFG. Co. Ltd. 556,126 374 Yung Chi Paint & Varnish Manufacturing Co. Ltd. 137,000 372 Evergreen International Storage & Transport Corp. 819,502 372
92
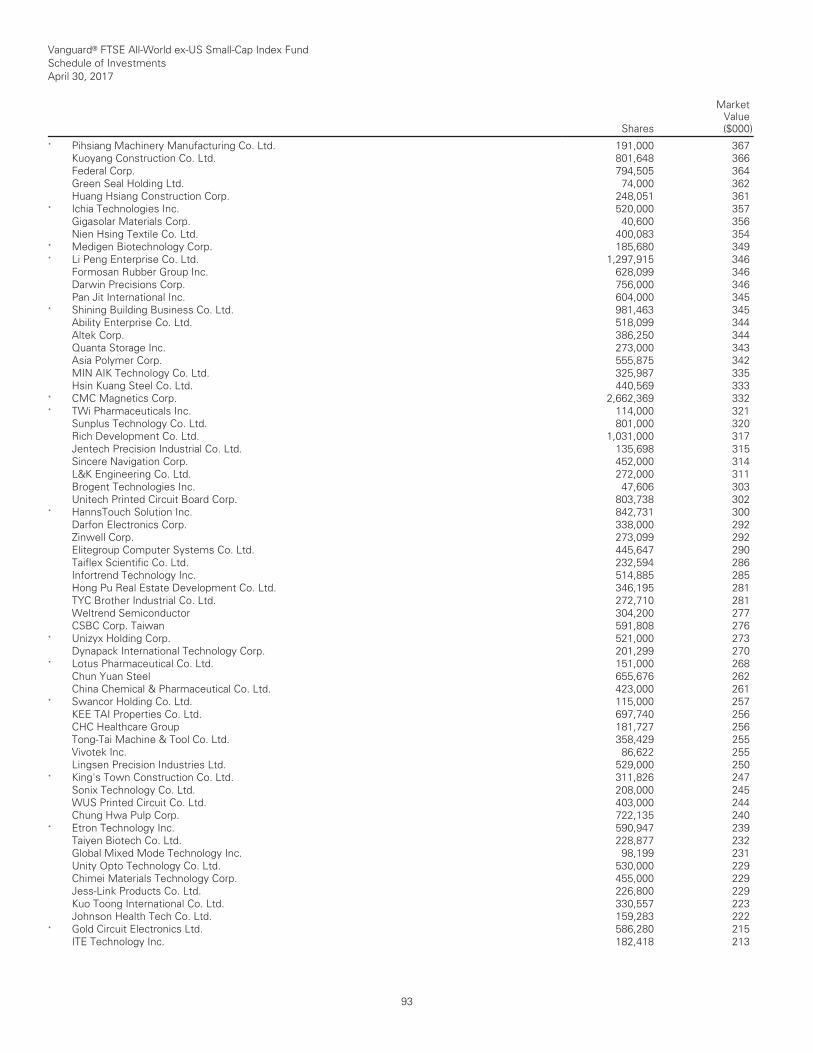
Vanguard® FTSE All-World ex-US Small-Cap Index Fund Schedule of Investments April 30, 2017
Shares
MarketValue($000)
__________________________________________________________________________________________________________________________________________________________________________________________________________________________________________________________________________________________________________________________________________________________________________________________________________________________________________________________________________________________________________________________________________________________________________________________________________________________________________________________________________________________ __________________________________________________________________________________________________________________________________________________________________________________________________________________________________________________________________________________________________________________________________________________________________________________________________________________________________________________________________________________________________________________________________________________________________________________________________________________________________________________________________________________________
* Pihsiang Machinery Manufacturing Co. Ltd. 191,000 367 Kuoyang Construction Co. Ltd. 801,648 366 Federal Corp. 794,505 364 Green Seal Holding Ltd. 74,000 362 Huang Hsiang Construction Corp. 248,051 361 * Ichia Technologies Inc. 520,000 357 Gigasolar Materials Corp. 40,600 356 Nien Hsing Textile Co. Ltd. 400,083 354 * Medigen Biotechnology Corp. 185,680 349 * Li Peng Enterprise Co. Ltd. 1,297,915 346 Formosan Rubber Group Inc. 628,099 346 Darwin Precisions Corp. 756,000 346 Pan Jit International Inc. 604,000 345 * Shining Building Business Co. Ltd. 981,463 345 Ability Enterprise Co. Ltd. 518,099 344 Altek Corp. 386,250 344 Quanta Storage Inc. 273,000 343 Asia Polymer Corp. 555,875 342 MIN AIK Technology Co. Ltd. 325,987 335 Hsin Kuang Steel Co. Ltd. 440,569 333 * CMC Magnetics Corp. 2,662,369 332 * TWi Pharmaceuticals Inc. 114,000 321 Sunplus Technology Co. Ltd. 801,000 320 Rich Development Co. Ltd. 1,031,000 317 Jentech Precision Industrial Co. Ltd. 135,698 315 Sincere Navigation Corp. 452,000 314 L&K Engineering Co. Ltd. 272,000 311 Brogent Technologies Inc. 47,606 303 Unitech Printed Circuit Board Corp. 803,738 302 * HannsTouch Solution Inc. 842,731 300 Darfon Electronics Corp. 338,000 292 Zinwell Corp. 273,099 292 Elitegroup Computer Systems Co. Ltd. 445,647 290 Taiflex Scientific Co. Ltd. 232,594 286 Infortrend Technology Inc. 514,885 285 Hong Pu Real Estate Development Co. Ltd. 346,195 281 TYC Brother Industrial Co. Ltd. 272,710 281 Weltrend Semiconductor 304,200 277 CSBC Corp. Taiwan 591,808 276 * Unizyx Holding Corp. 521,000 273 Dynapack International Technology Corp. 201,299 270 * Lotus Pharmaceutical Co. Ltd. 151,000 268 Chun Yuan Steel 655,676 262 China Chemical & Pharmaceutical Co. Ltd. 423,000 261 * Swancor Holding Co. Ltd. 115,000 257 KEE TAI Properties Co. Ltd. 697,740 256 CHC Healthcare Group 181,727 256 Tong-Tai Machine & Tool Co. Ltd. 358,429 255 Vivotek Inc. 86,622 255 Lingsen Precision Industries Ltd. 529,000 250 * King's Town Construction Co. Ltd. 311,826 247 Sonix Technology Co. Ltd. 208,000 245 WUS Printed Circuit Co. Ltd. 403,000 244 Chung Hwa Pulp Corp. 722,135 240 * Etron Technology Inc. 590,947 239 Taiyen Biotech Co. Ltd. 228,877 232 Global Mixed Mode Technology Inc. 98,199 231 Unity Opto Technology Co. Ltd. 530,000 229 Chimei Materials Technology Corp. 455,000 229 Jess-Link Products Co. Ltd. 226,800 229 Kuo Toong International Co. Ltd. 330,557 223 Johnson Health Tech Co. Ltd. 159,283 222 * Gold Circuit Electronics Ltd. 586,280 215 ITE Technology Inc. 182,418 213
93
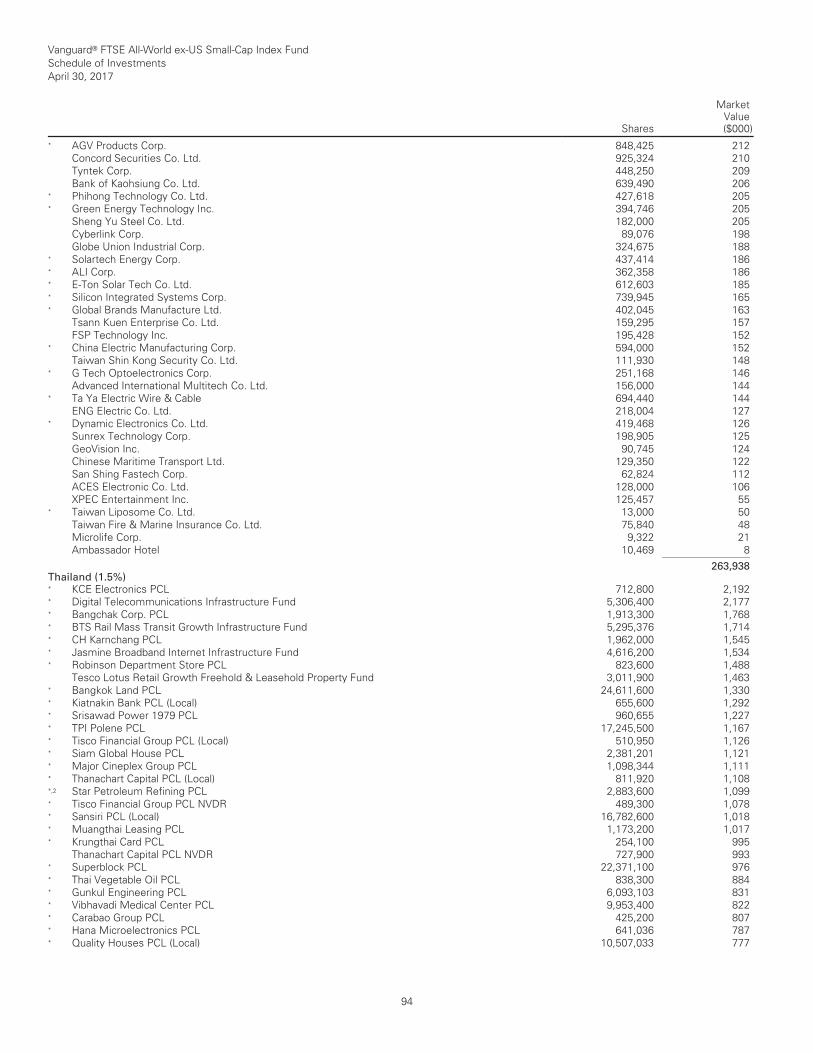
Vanguard® FTSE All-World ex-US Small-Cap Index Fund Schedule of Investments April 30, 2017
Shares
MarketValue($000)
__________________________________________________________________________________________________________________________________________________________________________________________________________________________________________________________________________________________________________________________________________________________________________________________________________________________________________________________________________________________________________________________________________________________________________________________________________________________________________________________________________________________ __________________________________________________________________________________________________________________________________________________________________________________________________________________________________________________________________________________________________________________________________________________________________________________________________________________________________________________________________________________________________________________________________________________________________________________________________________________________________________________________________________________________
* AGV Products Corp. 848,425 212 Concord Securities Co. Ltd. 925,324 210 Tyntek Corp. 448,250 209 Bank of Kaohsiung Co. Ltd. 639,490 206 * Phihong Technology Co. Ltd. 427,618 205 * Green Energy Technology Inc. 394,746 205 Sheng Yu Steel Co. Ltd. 182,000 205 Cyberlink Corp. 89,076 198 Globe Union Industrial Corp. 324,675 188 * Solartech Energy Corp. 437,414 186 * ALI Corp. 362,358 186 * E-Ton Solar Tech Co. Ltd. 612,603 185 * Silicon Integrated Systems Corp. 739,945 165 * Global Brands Manufacture Ltd. 402,045 163 Tsann Kuen Enterprise Co. Ltd. 159,295 157 FSP Technology Inc. 195,428 152 * China Electric Manufacturing Corp. 594,000 152 Taiwan Shin Kong Security Co. Ltd. 111,930 148 * G Tech Optoelectronics Corp. 251,168 146 Advanced International Multitech Co. Ltd. 156,000 144 * Ta Ya Electric Wire & Cable 694,440 144 ENG Electric Co. Ltd. 218,004 127 * Dynamic Electronics Co. Ltd. 419,468 126 Sunrex Technology Corp. 198,905 125 GeoVision Inc. 90,745 124 Chinese Maritime Transport Ltd. 129,350 122 San Shing Fastech Corp. 62,824 112 ACES Electronic Co. Ltd. 128,000 106 XPEC Entertainment Inc. 125,457 55 * Taiwan Liposome Co. Ltd. 13,000 50 Taiwan Fire & Marine Insurance Co. Ltd. 75,840 48 Microlife Corp. 9,322 21 Ambassador Hotel 10,469 8 ___________ 263,938 Thailand (1.5%)
* KCE Electronics PCL 712,800 2,192 * Digital Telecommunications Infrastructure Fund 5,306,400 2,177 * Bangchak Corp. PCL 1,913,300 1,768 * BTS Rail Mass Transit Growth Infrastructure Fund 5,295,376 1,714 * CH Karnchang PCL 1,962,000 1,545 * Jasmine Broadband Internet Infrastructure Fund 4,616,200 1,534 * Robinson Department Store PCL 823,600 1,488 Tesco Lotus Retail Growth Freehold & Leasehold Property Fund 3,011,900 1,463 * Bangkok Land PCL 24,611,600 1,330 * Kiatnakin Bank PCL (Local) 655,600 1,292 * Srisawad Power 1979 PCL 960,655 1,227 * TPI Polene PCL 17,245,500 1,167 * Tisco Financial Group PCL (Local) 510,950 1,126 * Siam Global House PCL 2,381,201 1,121 * Major Cineplex Group PCL 1,098,344 1,111 * Thanachart Capital PCL (Local) 811,920 1,108 *,2 Star Petroleum Refining PCL 2,883,600 1,099 * Tisco Financial Group PCL NVDR 489,300 1,078 * Sansiri PCL (Local) 16,782,600 1,018 * Muangthai Leasing PCL 1,173,200 1,017 * Krungthai Card PCL 254,100 995 Thanachart Capital PCL NVDR 727,900 993 * Superblock PCL 22,371,100 976 * Thai Vegetable Oil PCL 838,300 884 * Gunkul Engineering PCL 6,093,103 831 * Vibhavadi Medical Center PCL 9,953,400 822 * Carabao Group PCL 425,200 807 * Hana Microelectronics PCL 641,036 787 * Quality Houses PCL (Local) 10,507,033 777
94
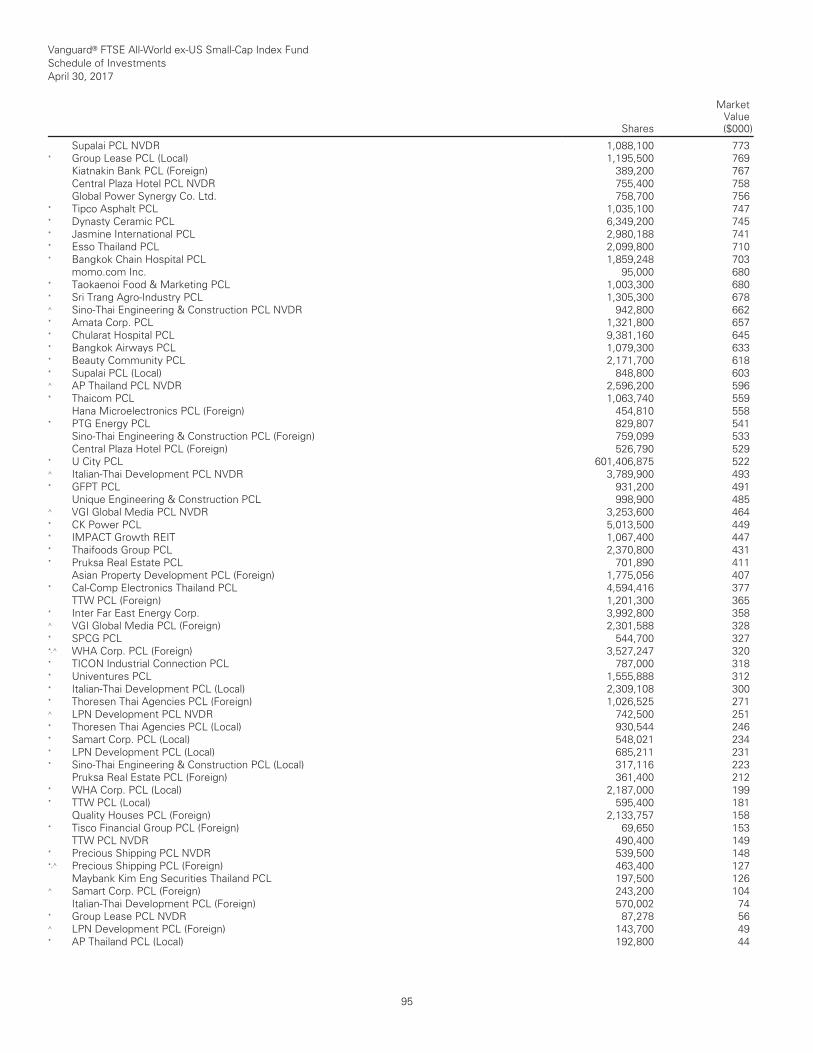
Vanguard® FTSE All-World ex-US Small-Cap Index Fund Schedule of Investments April 30, 2017
Shares
MarketValue($000)
__________________________________________________________________________________________________________________________________________________________________________________________________________________________________________________________________________________________________________________________________________________________________________________________________________________________________________________________________________________________________________________________________________________________________________________________________________________________________________________________________________________________ __________________________________________________________________________________________________________________________________________________________________________________________________________________________________________________________________________________________________________________________________________________________________________________________________________________________________________________________________________________________________________________________________________________________________________________________________________________________________________________________________________________________
Supalai PCL NVDR 1,088,100 773 * Group Lease PCL (Local) 1,195,500 769 Kiatnakin Bank PCL (Foreign) 389,200 767 Central Plaza Hotel PCL NVDR 755,400 758 Global Power Synergy Co. Ltd. 758,700 756 * Tipco Asphalt PCL 1,035,100 747 * Dynasty Ceramic PCL 6,349,200 745 * Jasmine International PCL 2,980,188 741 * Esso Thailand PCL 2,099,800 710 * Bangkok Chain Hospital PCL 1,859,248 703 momo.com Inc. 95,000 680 * Taokaenoi Food & Marketing PCL 1,003,300 680 * Sri Trang Agro-Industry PCL 1,305,300 678 ^ Sino-Thai Engineering & Construction PCL NVDR 942,800 662 * Amata Corp. PCL 1,321,800 657 * Chularat Hospital PCL 9,381,160 645 * Bangkok Airways PCL 1,079,300 633 * Beauty Community PCL 2,171,700 618 * Supalai PCL (Local) 848,800 603 ^ AP Thailand PCL NVDR 2,596,200 596 * Thaicom PCL 1,063,740 559 Hana Microelectronics PCL (Foreign) 454,810 558 * PTG Energy PCL 829,807 541 Sino-Thai Engineering & Construction PCL (Foreign) 759,099 533 Central Plaza Hotel PCL (Foreign) 526,790 529 * U City PCL 601,406,875 522 ^ Italian-Thai Development PCL NVDR 3,789,900 493 * GFPT PCL 931,200 491 Unique Engineering & Construction PCL 998,900 485 ^ VGI Global Media PCL NVDR 3,253,600 464 * CK Power PCL 5,013,500 449 * IMPACT Growth REIT 1,067,400 447 * Thaifoods Group PCL 2,370,800 431 * Pruksa Real Estate PCL 701,890 411 Asian Property Development PCL (Foreign) 1,775,056 407 * Cal-Comp Electronics Thailand PCL 4,594,416 377 TTW PCL (Foreign) 1,201,300 365 * Inter Far East Energy Corp. 3,992,800 358 ^ VGI Global Media PCL (Foreign) 2,301,588 328 * SPCG PCL 544,700 327 *,^ WHA Corp. PCL (Foreign) 3,527,247 320 * TICON Industrial Connection PCL 787,000 318 * Univentures PCL 1,555,888 312 * Italian-Thai Development PCL (Local) 2,309,108 300 * Thoresen Thai Agencies PCL (Foreign) 1,026,525 271 ^ LPN Development PCL NVDR 742,500 251 * Thoresen Thai Agencies PCL (Local) 930,544 246 * Samart Corp. PCL (Local) 548,021 234 * LPN Development PCL (Local) 685,211 231 * Sino-Thai Engineering & Construction PCL (Local) 317,116 223 Pruksa Real Estate PCL (Foreign) 361,400 212 * WHA Corp. PCL (Local) 2,187,000 199 * TTW PCL (Local) 595,400 181 Quality Houses PCL (Foreign) 2,133,757 158 * Tisco Financial Group PCL (Foreign) 69,650 153 TTW PCL NVDR 490,400 149 * Precious Shipping PCL NVDR 539,500 148 *,^ Precious Shipping PCL (Foreign) 463,400 127 Maybank Kim Eng Securities Thailand PCL 197,500 126 ^ Samart Corp. PCL (Foreign) 243,200 104 Italian-Thai Development PCL (Foreign) 570,002 74 * Group Lease PCL NVDR 87,278 56 ^ LPN Development PCL (Foreign) 143,700 49 * AP Thailand PCL (Local) 192,800 44
95
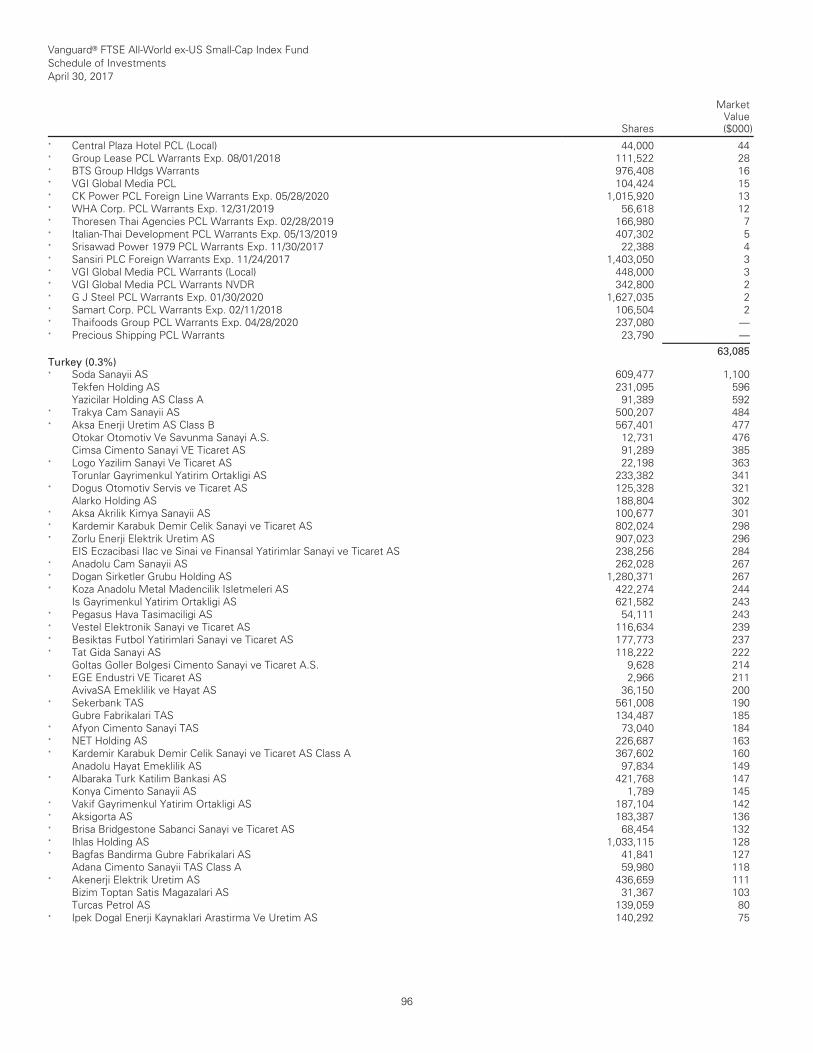
Vanguard® FTSE All-World ex-US Small-Cap Index Fund Schedule of Investments April 30, 2017
Shares
MarketValue($000)
__________________________________________________________________________________________________________________________________________________________________________________________________________________________________________________________________________________________________________________________________________________________________________________________________________________________________________________________________________________________________________________________________________________________________________________________________________________________________________________________________________________________ __________________________________________________________________________________________________________________________________________________________________________________________________________________________________________________________________________________________________________________________________________________________________________________________________________________________________________________________________________________________________________________________________________________________________________________________________________________________________________________________________________________________
* Central Plaza Hotel PCL (Local) 44,000 44 * Group Lease PCL Warrants Exp. 08/01/2018 111,522 28 * BTS Group Hldgs Warrants 976,408 16 * VGI Global Media PCL 104,424 15 * CK Power PCL Foreign Line Warrants Exp. 05/28/2020 1,015,920 13 * WHA Corp. PCL Warrants Exp. 12/31/2019 56,618 12 * Thoresen Thai Agencies PCL Warrants Exp. 02/28/2019 166,980 7 * Italian-Thai Development PCL Warrants Exp. 05/13/2019 407,302 5 * Srisawad Power 1979 PCL Warrants Exp. 11/30/2017 22,388 4 * Sansiri PLC Foreign Warrants Exp. 11/24/2017 1,403,050 3 * VGI Global Media PCL Warrants (Local) 448,000 3 * VGI Global Media PCL Warrants NVDR 342,800 2 * G J Steel PCL Warrants Exp. 01/30/2020 1,627,035 2 * Samart Corp. PCL Warrants Exp. 02/11/2018 106,504 2 * Thaifoods Group PCL Warrants Exp. 04/28/2020 237,080 — * Precious Shipping PCL Warrants 23,790 — ___________ 63,085 Turkey (0.3%)
* Soda Sanayii AS 609,477 1,100 Tekfen Holding AS 231,095 596 Yazicilar Holding AS Class A 91,389 592 * Trakya Cam Sanayii AS 500,207 484 * Aksa Enerji Uretim AS Class B 567,401 477 Otokar Otomotiv Ve Savunma Sanayi A.S. 12,731 476 Cimsa Cimento Sanayi VE Ticaret AS 91,289 385 * Logo Yazilim Sanayi Ve Ticaret AS 22,198 363 Torunlar Gayrimenkul Yatirim Ortakligi AS 233,382 341 * Dogus Otomotiv Servis ve Ticaret AS 125,328 321 Alarko Holding AS 188,804 302 * Aksa Akrilik Kimya Sanayii AS 100,677 301 * Kardemir Karabuk Demir Celik Sanayi ve Ticaret AS 802,024 298 * Zorlu Enerji Elektrik Uretim AS 907,023 296 EIS Eczacibasi Ilac ve Sinai ve Finansal Yatirimlar Sanayi ve Ticaret AS 238,256 284 * Anadolu Cam Sanayii AS 262,028 267 * Dogan Sirketler Grubu Holding AS 1,280,371 267 * Koza Anadolu Metal Madencilik Isletmeleri AS 422,274 244 Is Gayrimenkul Yatirim Ortakligi AS 621,582 243 * Pegasus Hava Tasimaciligi AS 54,111 243 * Vestel Elektronik Sanayi ve Ticaret AS 116,634 239 * Besiktas Futbol Yatirimlari Sanayi ve Ticaret AS 177,773 237 * Tat Gida Sanayi AS 118,222 222 Goltas Goller Bolgesi Cimento Sanayi ve Ticaret A.S. 9,628 214 * EGE Endustri VE Ticaret AS 2,966 211 AvivaSA Emeklilik ve Hayat AS 36,150 200 * Sekerbank TAS 561,008 190 Gubre Fabrikalari TAS 134,487 185 * Afyon Cimento Sanayi TAS 73,040 184 * NET Holding AS 226,687 163 * Kardemir Karabuk Demir Celik Sanayi ve Ticaret AS Class A 367,602 160 Anadolu Hayat Emeklilik AS 97,834 149 * Albaraka Turk Katilim Bankasi AS 421,768 147 Konya Cimento Sanayii AS 1,789 145 * Vakif Gayrimenkul Yatirim Ortakligi AS 187,104 142 * Aksigorta AS 183,387 136 * Brisa Bridgestone Sabanci Sanayi ve Ticaret AS 68,454 132 * Ihlas Holding AS 1,033,115 128 * Bagfas Bandirma Gubre Fabrikalari AS 41,841 127 Adana Cimento Sanayii TAS Class A 59,980 118 * Akenerji Elektrik Uretim AS 436,659 111 Bizim Toptan Satis Magazalari AS 31,367 103 Turcas Petrol AS 139,059 80 * Ipek Dogal Enerji Kaynaklari Arastirma Ve Uretim AS 140,292 75
96
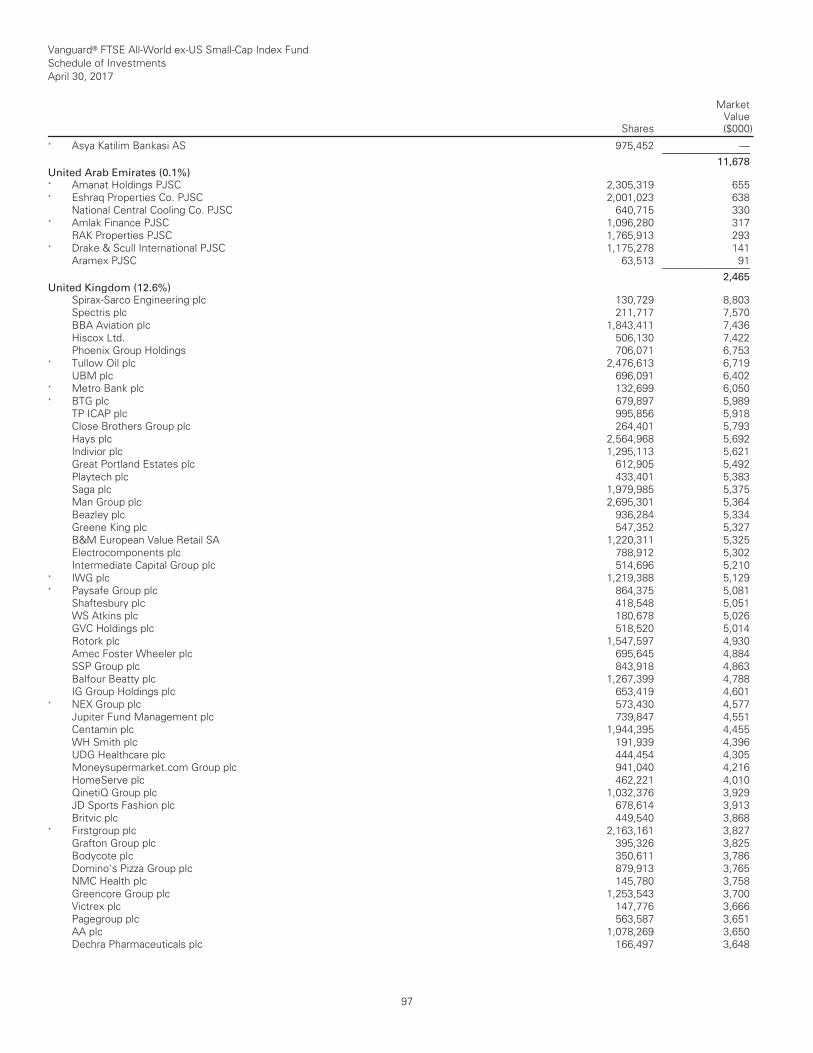
Vanguard® FTSE All-World ex-US Small-Cap Index Fund Schedule of Investments April 30, 2017
Shares
MarketValue($000)
__________________________________________________________________________________________________________________________________________________________________________________________________________________________________________________________________________________________________________________________________________________________________________________________________________________________________________________________________________________________________________________________________________________________________________________________________________________________________________________________________________________________ __________________________________________________________________________________________________________________________________________________________________________________________________________________________________________________________________________________________________________________________________________________________________________________________________________________________________________________________________________________________________________________________________________________________________________________________________________________________________________________________________________________________
* Asya Katilim Bankasi AS 975,452 — ___________ 11,678 United Arab Emirates (0.1%)
* Amanat Holdings PJSC 2,305,319 655 * Eshraq Properties Co. PJSC 2,001,023 638 National Central Cooling Co. PJSC 640,715 330 * Amlak Finance PJSC 1,096,280 317 RAK Properties PJSC 1,765,913 293 * Drake & Scull International PJSC 1,175,278 141 Aramex PJSC 63,513 91 ___________ 2,465 United Kingdom (12.6%)
Spirax-Sarco Engineering plc 130,729 8,803 Spectris plc 211,717 7,570 BBA Aviation plc 1,843,411 7,436 Hiscox Ltd. 506,130 7,422 Phoenix Group Holdings 706,071 6,753 * Tullow Oil plc 2,476,613 6,719 UBM plc 696,091 6,402 * Metro Bank plc 132,699 6,050 * BTG plc 679,897 5,989 TP ICAP plc 995,856 5,918 Close Brothers Group plc 264,401 5,793 Hays plc 2,564,968 5,692 Indivior plc 1,295,113 5,621 Great Portland Estates plc 612,905 5,492 Playtech plc 433,401 5,383 Saga plc 1,979,985 5,375 Man Group plc 2,695,301 5,364 Beazley plc 936,284 5,334 Greene King plc 547,352 5,327 B&M European Value Retail SA 1,220,311 5,325 Electrocomponents plc 788,912 5,302 Intermediate Capital Group plc 514,696 5,210 * IWG plc 1,219,388 5,129 * Paysafe Group plc 864,375 5,081 Shaftesbury plc 418,548 5,051 WS Atkins plc 180,678 5,026 GVC Holdings plc 518,520 5,014 Rotork plc 1,547,597 4,930 Amec Foster Wheeler plc 695,645 4,884 SSP Group plc 843,918 4,863 Balfour Beatty plc 1,267,399 4,788 IG Group Holdings plc 653,419 4,601 * NEX Group plc 573,430 4,577 Jupiter Fund Management plc 739,847 4,551 Centamin plc 1,944,395 4,455 WH Smith plc 191,939 4,396 UDG Healthcare plc 444,454 4,305 Moneysupermarket.com Group plc 941,040 4,216 HomeServe plc 462,221 4,010 QinetiQ Group plc 1,032,376 3,929 JD Sports Fashion plc 678,614 3,913 Britvic plc 449,540 3,868 * Firstgroup plc 2,163,161 3,827 Grafton Group plc 395,326 3,825 Bodycote plc 350,611 3,786 Domino's Pizza Group plc 879,913 3,765 NMC Health plc 145,780 3,758 Greencore Group plc 1,253,543 3,700 Victrex plc 147,776 3,666 Pagegroup plc 563,587 3,651 AA plc 1,078,269 3,650 Dechra Pharmaceuticals plc 166,497 3,648
97
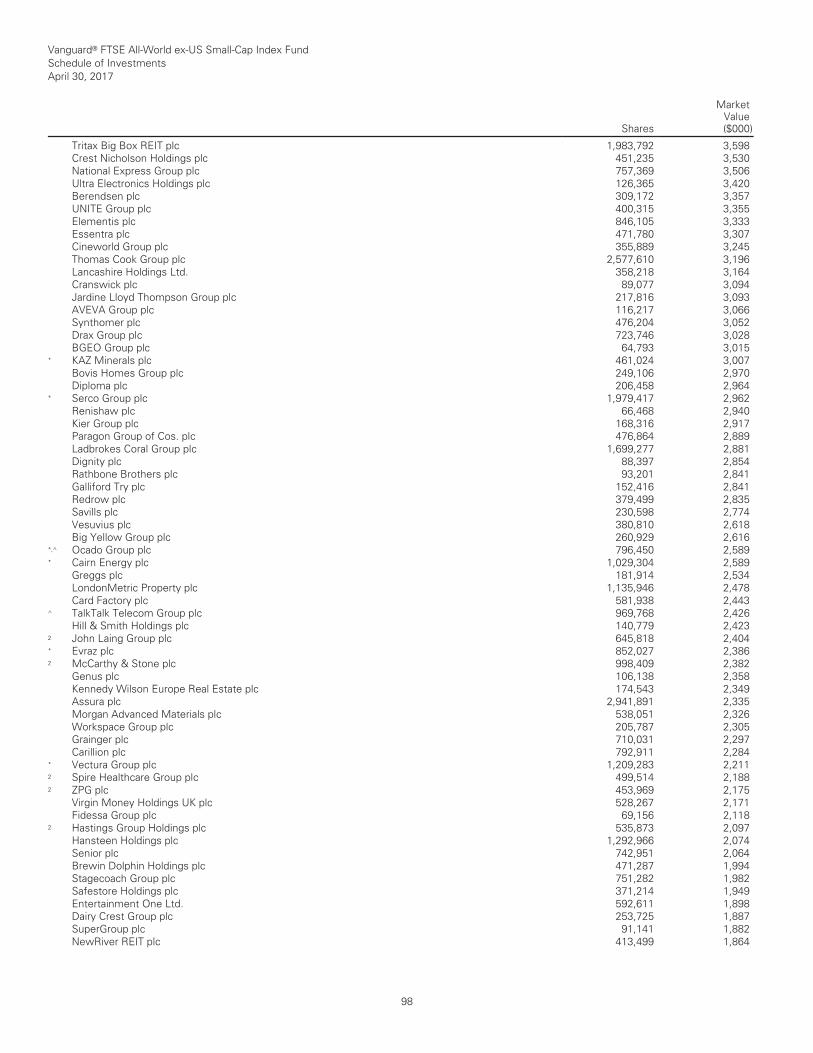
Vanguard® FTSE All-World ex-US Small-Cap Index Fund Schedule of Investments April 30, 2017
Shares
MarketValue($000)
__________________________________________________________________________________________________________________________________________________________________________________________________________________________________________________________________________________________________________________________________________________________________________________________________________________________________________________________________________________________________________________________________________________________________________________________________________________________________________________________________________________________ __________________________________________________________________________________________________________________________________________________________________________________________________________________________________________________________________________________________________________________________________________________________________________________________________________________________________________________________________________________________________________________________________________________________________________________________________________________________________________________________________________________________
Tritax Big Box REIT plc 1,983,792 3,598 Crest Nicholson Holdings plc 451,235 3,530 National Express Group plc 757,369 3,506 Ultra Electronics Holdings plc 126,365 3,420 Berendsen plc 309,172 3,357 UNITE Group plc 400,315 3,355 Elementis plc 846,105 3,333 Essentra plc 471,780 3,307 Cineworld Group plc 355,889 3,245 Thomas Cook Group plc 2,577,610 3,196 Lancashire Holdings Ltd. 358,218 3,164 Cranswick plc 89,077 3,094 Jardine Lloyd Thompson Group plc 217,816 3,093 AVEVA Group plc 116,217 3,066 Synthomer plc 476,204 3,052 Drax Group plc 723,746 3,028 BGEO Group plc 64,793 3,015 * KAZ Minerals plc 461,024 3,007 Bovis Homes Group plc 249,106 2,970 Diploma plc 206,458 2,964 * Serco Group plc 1,979,417 2,962 Renishaw plc 66,468 2,940 Kier Group plc 168,316 2,917 Paragon Group of Cos. plc 476,864 2,889 Ladbrokes Coral Group plc 1,699,277 2,881 Dignity plc 88,397 2,854 Rathbone Brothers plc 93,201 2,841 Galliford Try plc 152,416 2,841 Redrow plc 379,499 2,835 Savills plc 230,598 2,774 Vesuvius plc 380,810 2,618 Big Yellow Group plc 260,929 2,616 *,^ Ocado Group plc 796,450 2,589 * Cairn Energy plc 1,029,304 2,589 Greggs plc 181,914 2,534 LondonMetric Property plc 1,135,946 2,478 Card Factory plc 581,938 2,443 ^ TalkTalk Telecom Group plc 969,768 2,426 Hill & Smith Holdings plc 140,779 2,423 2 John Laing Group plc 645,818 2,404 * Evraz plc 852,027 2,386 2 McCarthy & Stone plc 998,409 2,382 Genus plc 106,138 2,358 Kennedy Wilson Europe Real Estate plc 174,543 2,349 Assura plc 2,941,891 2,335 Morgan Advanced Materials plc 538,051 2,326 Workspace Group plc 205,787 2,305 Grainger plc 710,031 2,297 Carillion plc 792,911 2,284 * Vectura Group plc 1,209,283 2,211 2 Spire Healthcare Group plc 499,514 2,188 2 ZPG plc 453,969 2,175 Virgin Money Holdings UK plc 528,267 2,171 Fidessa Group plc 69,156 2,118 2 Hastings Group Holdings plc 535,873 2,097 Hansteen Holdings plc 1,292,966 2,074 Senior plc 742,951 2,064 Brewin Dolphin Holdings plc 471,287 1,994 Stagecoach Group plc 751,282 1,982 Safestore Holdings plc 371,214 1,949 Entertainment One Ltd. 592,611 1,898 Dairy Crest Group plc 253,725 1,887 SuperGroup plc 91,141 1,882 NewRiver REIT plc 413,499 1,864
98
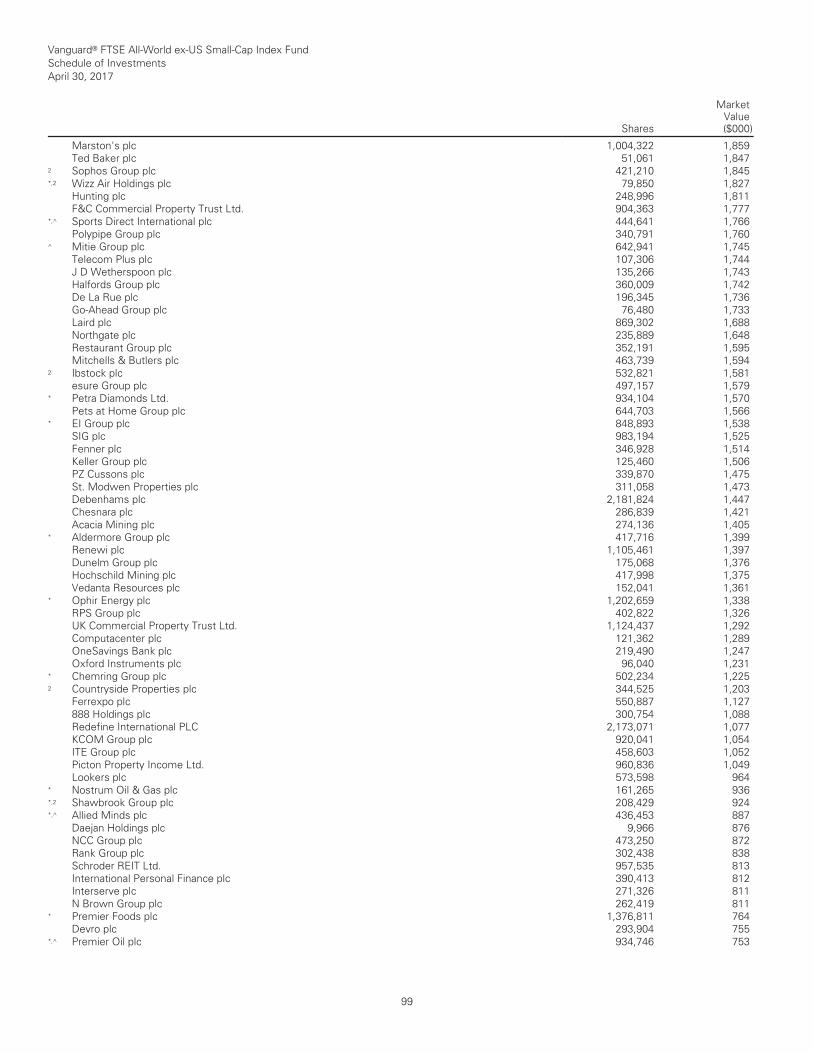
Vanguard® FTSE All-World ex-US Small-Cap Index Fund Schedule of Investments April 30, 2017
Shares
MarketValue($000)
__________________________________________________________________________________________________________________________________________________________________________________________________________________________________________________________________________________________________________________________________________________________________________________________________________________________________________________________________________________________________________________________________________________________________________________________________________________________________________________________________________________________ __________________________________________________________________________________________________________________________________________________________________________________________________________________________________________________________________________________________________________________________________________________________________________________________________________________________________________________________________________________________________________________________________________________________________________________________________________________________________________________________________________________________
Marston's plc 1,004,322 1,859 Ted Baker plc 51,061 1,847 2 Sophos Group plc 421,210 1,845 *,2 Wizz Air Holdings plc 79,850 1,827 Hunting plc 248,996 1,811 F&C Commercial Property Trust Ltd. 904,363 1,777 *,^ Sports Direct International plc 444,641 1,766 Polypipe Group plc 340,791 1,760 ^ Mitie Group plc 642,941 1,745 Telecom Plus plc 107,306 1,744 J D Wetherspoon plc 135,266 1,743 Halfords Group plc 360,009 1,742 De La Rue plc 196,345 1,736 Go-Ahead Group plc 76,480 1,733 Laird plc 869,302 1,688 Northgate plc 235,889 1,648 Restaurant Group plc 352,191 1,595 Mitchells & Butlers plc 463,739 1,594 2 Ibstock plc 532,821 1,581 esure Group plc 497,157 1,579 * Petra Diamonds Ltd. 934,104 1,570 Pets at Home Group plc 644,703 1,566 * EI Group plc 848,893 1,538 SIG plc 983,194 1,525 Fenner plc 346,928 1,514 Keller Group plc 125,460 1,506 PZ Cussons plc 339,870 1,475 St. Modwen Properties plc 311,058 1,473 Debenhams plc 2,181,824 1,447 Chesnara plc 286,839 1,421 Acacia Mining plc 274,136 1,405 * Aldermore Group plc 417,716 1,399 Renewi plc 1,105,461 1,397 Dunelm Group plc 175,068 1,376 Hochschild Mining plc 417,998 1,375 Vedanta Resources plc 152,041 1,361 * Ophir Energy plc 1,202,659 1,338 RPS Group plc 402,822 1,326 UK Commercial Property Trust Ltd. 1,124,437 1,292 Computacenter plc 121,362 1,289 OneSavings Bank plc 219,490 1,247 Oxford Instruments plc 96,040 1,231 * Chemring Group plc 502,234 1,225 2 Countryside Properties plc 344,525 1,203 Ferrexpo plc 550,887 1,127 888 Holdings plc 300,754 1,088 Redefine International PLC 2,173,071 1,077 KCOM Group plc 920,041 1,054 ITE Group plc 458,603 1,052 Picton Property Income Ltd. 960,836 1,049 Lookers plc 573,598 964 * Nostrum Oil & Gas plc 161,265 936 *,2 Shawbrook Group plc 208,429 924 *,^ Allied Minds plc 436,453 887 Daejan Holdings plc 9,966 876 NCC Group plc 473,250 872 Rank Group plc 302,438 838 Schroder REIT Ltd. 957,535 813 International Personal Finance plc 390,413 812 Interserve plc 271,326 811 N Brown Group plc 262,419 811 * Premier Foods plc 1,376,811 764 Devro plc 293,904 755 *,^ Premier Oil plc 934,746 753
99
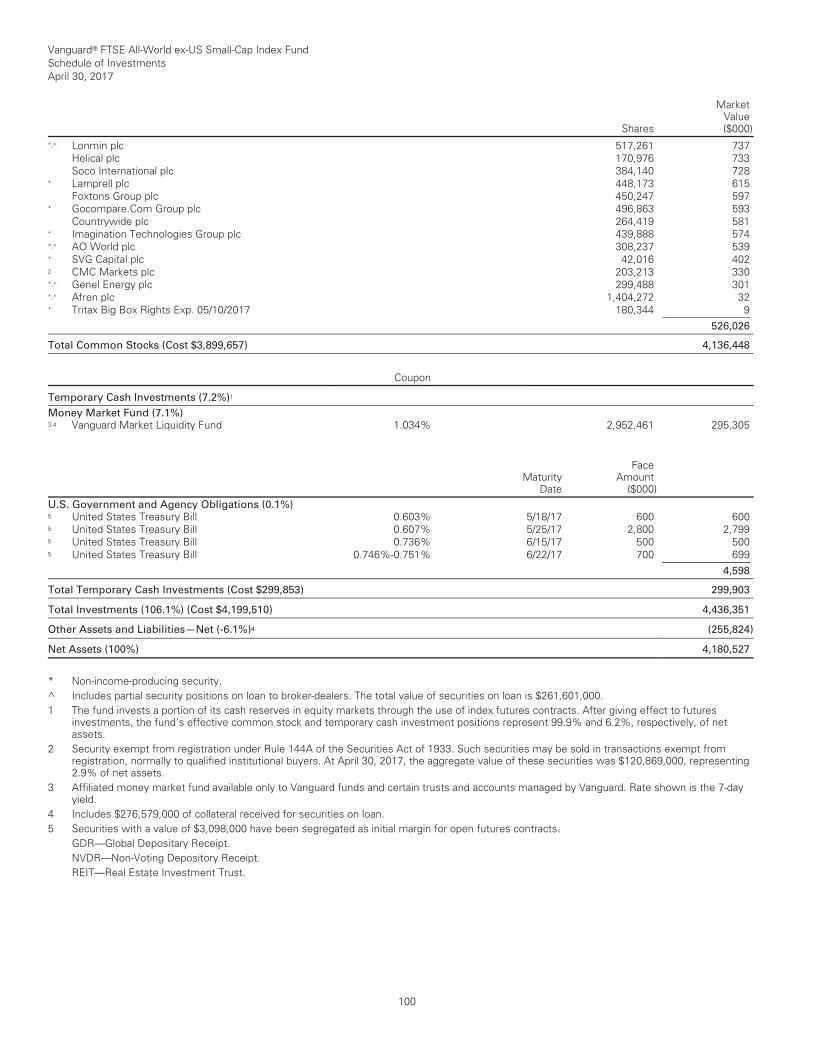
Vanguard® FTSE All-World ex-US Small-Cap Index Fund Schedule of Investments April 30, 2017
Shares
MarketValue($000)
__________________________________________________________________________________________________________________________________________________________________________________________________________________________________________________________________________________________________________________________________________________________________________________________________________________________________________________________________________________________________________________________________________________________________________________________________________________________________________________________________________________________ __________________________________________________________________________________________________________________________________________________________________________________________________________________________________________________________________________________________________________________________________________________________________________________________________________________________________________________________________________________________________________________________________________________________________________________________________________________________________________________________________________________________
*,^ Lonmin plc 517,261 737Helical plc 170,976 733Soco International plc 384,140 728
* Lamprell plc 448,173 615Foxtons Group plc 450,247 597
* Gocompare.Com Group plc 496,863 593 Countrywide plc 264,419 581
* Imagination Technologies Group plc 439,888 574 *,^ AO World plc 308,237 539* SVG Capital plc 42,016 4022 CMC Markets plc 203,213 330*,^ Genel Energy plc 299,488 301*,^ Afren plc 1,404,272 32* Tritax Big Box Rights Exp. 05/10/2017 180,344 9 ___________
526,026 __________________________________________________________________________________________________________________________________________________________________________________________________________________________________________________________________________________________________________________________________________________________________________________________________________________________________________________________________________________________________________________________________________________________________________________________________________________________________________________________________________________________ __________________________________________________________________________________________________________________________________________________________________________________________________________________________________________________________________________________________________________________________________________________________________________________________________________________________________________________________________________________________________________________________________________________________________________________________________________________________________________________________________________________________
Total Common Stocks (Cost $3,899,657) 4,136,448 __________________________________________________________________________________________________________________________________________________________________________________________________________________________________________________________________________________________________________________________________________________________________________________________________________________________________________________________________________________________________________________________________________________________________________________________________________________________________________________________________________________________ __________________________________________________________________________________________________________________________________________________________________________________________________________________________________________________________________________________________________________________________________________________________________________________________________________________________________________________________________________________________________________________________________________________________________________________________________________________________________________________________________________________________
Coupon __________________________________________________________________________________________________________________________________________________________________________________________________________________________________________________________________________________________________________________________________________________________________________________________________________________________________________________________________________________________________________________________________________________________________________________________________________________________________________________________________________________________ __________________________________________________________________________________________________________________________________________________________________________________________________________________________________________________________________________________________________________________________________________________________________________________________________________________________________________________________________________________________________________________________________________________________________________________________________________________________________________________________________________________________
Temporary Cash Investments (7.2%)1 __________________________________________________________________________________________________________________________________________________________________________________________________________________________________________________________________________________________________________________________________________________________________________________________________________________________________________________________________________________________________________________________________________________________________________________________________________________________________________________________________________________________ __________________________________________________________________________________________________________________________________________________________________________________________________________________________________________________________________________________________________________________________________________________________________________________________________________________________________________________________________________________________________________________________________________________________________________________________________________________________________________________________________________________________
Money Market Fund (7.1%)3,4 Vanguard Market Liquidity Fund 1.034% 2,952,461 295,305
MaturityDate
FaceAmount
($000) __________________________________________________________________________________________________________________________________________________________________________________________________________________________________________________________________________________________________________________________________________________________________________________________________________________________________________________________________________________________________________________________________________________________________________________________________________________________________________________________________________________________ __________________________________________________________________________________________________________________________________________________________________________________________________________________________________________________________________________________________________________________________________________________________________________________________________________________________________________________________________________________________________________________________________________________________________________________________________________________________________________________________________________________________
U.S. Government and Agency Obligations (0.1%)5 United States Treasury Bill 0.603% 5/18/17 600 600 5 United States Treasury Bill 0.607% 5/25/17 2,800 2,799 5 United States Treasury Bill 0.736% 6/15/17 500 500 5 United States Treasury Bill 0.746%-0.751% 6/22/17 700 699___________
4,598 __________________________________________________________________________________________________________________________________________________________________________________________________________________________________________________________________________________________________________________________________________________________________________________________________________________________________________________________________________________________________________________________________________________________________________________________________________________________________________________________________________________________ __________________________________________________________________________________________________________________________________________________________________________________________________________________________________________________________________________________________________________________________________________________________________________________________________________________________________________________________________________________________________________________________________________________________________________________________________________________________________________________________________________________________
Total Temporary Cash Investments (Cost $299,853) 299,903 __________________________________________________________________________________________________________________________________________________________________________________________________________________________________________________________________________________________________________________________________________________________________________________________________________________________________________________________________________________________________________________________________________________________________________________________________________________________________________________________________________________________ __________________________________________________________________________________________________________________________________________________________________________________________________________________________________________________________________________________________________________________________________________________________________________________________________________________________________________________________________________________________________________________________________________________________________________________________________________________________________________________________________________________________
Total Investments (106.1%) (Cost $4,199,510) 4,436,351 __________________________________________________________________________________________________________________________________________________________________________________________________________________________________________________________________________________________________________________________________________________________________________________________________________________________________________________________________________________________________________________________________________________________________________________________________________________________________________________________________________________________ __________________________________________________________________________________________________________________________________________________________________________________________________________________________________________________________________________________________________________________________________________________________________________________________________________________________________________________________________________________________________________________________________________________________________________________________________________________________________________________________________________________________
Other Assets and Liabilities—Net (-6.1%)4 (255,824) __________________________________________________________________________________________________________________________________________________________________________________________________________________________________________________________________________________________________________________________________________________________________________________________________________________________________________________________________________________________________________________________________________________________________________________________________________________________________________________________________________________________ __________________________________________________________________________________________________________________________________________________________________________________________________________________________________________________________________________________________________________________________________________________________________________________________________________________________________________________________________________________________________________________________________________________________________________________________________________________________________________________________________________________________
Net Assets (100%) 4,180,527 __________________________________________________________________________________________________________________________________________________________________________________________________________________________________________________________________________________________________________________________________________________________________________________________________________________________________________________________________________________________________________________________________________________________________________________________________________________________________________________________________________________________ __________________________________________________________________________________________________________________________________________________________________________________________________________________________________________________________________________________________________________________________________________________________________________________________________________________________________________________________________________________________________________________________________________________________________________________________________________________________________________________________________________________________
* Non-income-producing security.^ Includes partial security positions on loan to broker-dealers. The total value of securities on loan is $261,601,000. 1 The fund invests a portion of its cash reserves in equity markets through the use of index futures contracts. After giving effect to futures
investments, the fund's effective common stock and temporary cash investment positions represent 99.9% and 6.2%, respectively, of net assets.
2 Security exempt from registration under Rule 144A of the Securities Act of 1933. Such securities may be sold in transactions exempt from registration, normally to qualified institutional buyers. At April 30, 2017, the aggregate value of these securities was $120,869,000, representing 2.9% of net assets.
3 Affiliated money market fund available only to Vanguard funds and certain trusts and accounts managed by Vanguard. Rate shown is the 7-day yield.
4 Includes $276,579,000 of collateral received for securities on loan. 5 Securities with a value of $3,098,000 have been segregated as initial margin for open futures contracts.
GDR—Global Depositary Receipt. NVDR—Non-Voting Depository Receipt. REIT—Real Estate Investment Trust.
__________________________________________________________________________________________________________________________________________________________________________________________________________________________________________________________________________________________________________________________________________________________________________________________________________________________________________________________________________________________________________________________________________________________________________________________________________________________________________________________________________________________ __________________________________________________________________________________________________________________________________________________________________________________________________________________________________________________________________________________________________________________________________________________________________________________________________________________________________________________________________________________________________________________________________________________________________________________________________________________________________________________________________________________________
100

© 2017 The Vanguard Group, Inc. All rights reserved. Vanguard Marketing Corporation, Distributor.
SNA7702 062017