vanguard high dividend yield index fund fund’s performance at a glance 1 total returns: six months...
TRANSCRIPT
Vanguard High Dividend Yield Index Fund
Semiannual Report | April 30, 2017
Contents
Please note: The opinions expressed in this report are just that—informed opinions. They should not be considered promises or advice.Also, please keep in mind that the information and opinions cover the period through the date on the front of this report. Of course, therisks of investing in your fund are spelled out in the prospectus.
See the Glossary for definitions of investment terms used in this report.About the cover: No matter what language you speak, Vanguard has one consistent message and set of principles. Our primary focus is on you, our clients. We conduct our business with integrity as a faithful steward of your assets. This message is showntranslated into seven languages, reflecting our expanding global presence.
A new format, unwavering commitment
As you begin reading this report, you’ll notice that we’ve made some improvementsto the opening sections—based on feedback from you, our clients.
Page 1 starts with a new ”Your Fund’s Performance at a Glance,” a concise, handysummary of how your fund performed during the period.
In the renamed ”Chairman’s Perspective,” Bill McNabb will focus on enduringprinciples and investment insights.
We’ve modified some tables, and eliminated some redundancy, but we haven’tremoved any information.
At Vanguard, we’re always looking for better ways to communicate and to help youmake sound investment decisions. Thank you for entrusting your assets to us.
Your Fund’s Performance at a Glance. . . . . . . . . . . . . . . . . . 1
Chairman’s Perspective. . . . . . . . . . . . . . . . . . . . . . . . . . . . . 3
Fund Profile. . . . . . . . . . . . . . . . . . . . . . . . . . . . . . . . . . . . . . .7
Performance Summary. . . . . . . . . . . . . . . . . . . . . . . . . . . . . .8
Financial Statements. . . . . . . . . . . . . . . . . . . . . . . . . . . . . . . 9
About Your Fund’s Expenses. . . . . . . . . . . . . . . . . . . . . . . . 25
Trustees Approve Advisory Arrangement. . . . . . . . . . . . . . 27
Glossary. . . . . . . . . . . . . . . . . . . . . . . . . . . . . . . . . . . . . . . . 29
Your Fund’s Performance at a Glance
1
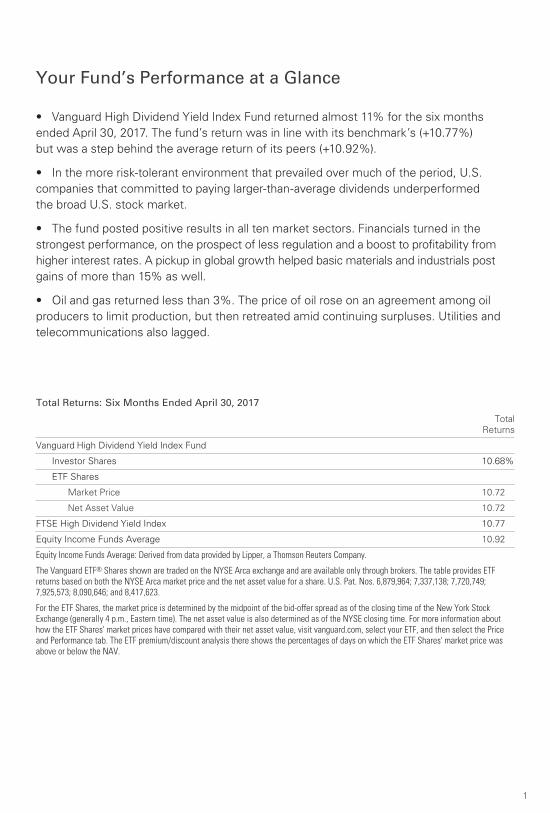
Total Returns: Six Months Ended April 30, 2017
TotalReturns
Vanguard High Dividend Yield Index Fund
Investor Shares 10.68%
ETF Shares
Market Price 10.72
Net Asset Value 10.72
FTSE High Dividend Yield Index 10.77
Equity Income Funds Average 10.92
Equity Income Funds Average: Derived from data provided by Lipper, a Thomson Reuters Company.
The Vanguard ETF® Shares shown are traded on the NYSE Arca exchange and are available only through brokers. The table provides ETFreturns based on both the NYSE Arca market price and the net asset value for a share. U.S. Pat. Nos. 6,879,964; 7,337,138; 7,720,749;7,925,573; 8,090,646; and 8,417,623.
For the ETF Shares, the market price is determined by the midpoint of the bid-offer spread as of the closing time of the New York Stock Exchange (generally 4 p.m., Eastern time). The net asset value is also determined as of the NYSE closing time. For more information about how the ETF Shares' market prices have compared with their net asset value, visit vanguard.com, select your ETF, and then select the Price and Performance tab. The ETF premium/discount analysis there shows the percentages of days on which the ETF Shares' market price was above or below the NAV.
• Vanguard High Dividend Yield Index Fund returned almost 11% for the six months
ended April 30, 2017. The fund’s return was in line with its benchmark’s (+10.77%)
but was a step behind the average return of its peers (+10.92%).
• In the more risk-tolerant environment that prevailed over much of the period, U.S.
companies that committed to paying larger-than-average dividends underperformed
the broad U.S. stock market.
• The fund posted positive results in all ten market sectors. Financials turned in the
strongest performance, on the prospect of less regulation and a boost to profitability from
higher interest rates. A pickup in global growth helped basic materials and industrials post
gains of more than 15% as well.
• Oil and gas returned less than 3%. The price of oil rose on an agreement among oil
producers to limit production, but then retreated amid continuing surpluses. Utilities and
telecommunications also lagged.
2
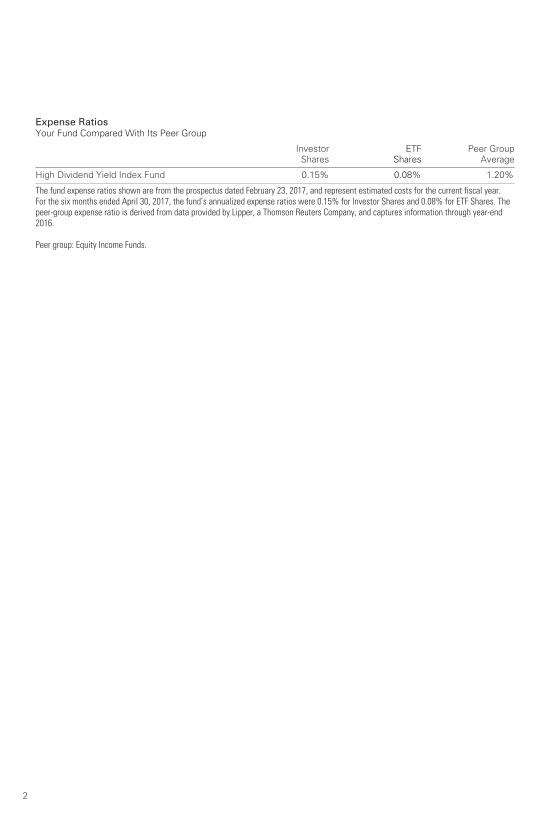
Expense RatiosYour Fund Compared With Its Peer Group
Investor
Shares
ETF
Shares
Peer Group
Average
High Dividend Yield Index Fund 0.15% 0.08% 1.20%
The fund expense ratios shown are from the prospectus dated February 23, 2017, and represent estimated costs for the current fiscal year.For the six months ended April 30, 2017, the fund’s annualized expense ratios were 0.15% for Investor Shares and 0.08% for ETF Shares. Thepeer-group expense ratio is derived from data provided by Lipper, a Thomson Reuters Company, and captures information through year-end2016.
Peer group: Equity Income Funds.
Dear Shareholder,
“Buy what you know.”
It’s one of the adages of investing, and it
has plenty of intuitive appeal. After all, the
familiar seems inherently less risky. It’s
no wonder that many investors heavily
tilt their portfolios toward the stocks and
bonds of their home country. This is known
in investing parlance as “home bias.”
U.S. investors sometimes think they
can get all the global diversification they
need by owning shares of U.S.-based
multinational companies. And that may
seem like the best of both worlds:
international diversification without ever
leaving the friendly confines of home.
The potential pitfall is that, as Vanguard
research has suggested, the performance
of a company’s shares tends to be highly
correlated to its domestic market, regardless
of where that company conducts most of
its business.
Americans aren’t alone in being portfolio
homebodies. Vanguard has found that in
a range of developed countries—Australia,
Canada, Japan, and the United Kingdom,
as well as the United States—investors
held a greater percentage of domestic
stocks than would be indicated if they
had taken their cues from a globally
diversified, market-weighted benchmark.
(You can see this tendency in the chart
later in this letter.)
Chairman’s Perspective
Bill McNabbChairman and Chief Executive Officer
3
Why home bias exists Vanguard’s Investment Strategy Group
identified a range of reasons why investors
might not embrace global diversification,
including concerns about currency risk and
an expectation that their home country will
deliver outsized returns.
One factor we identified—preference for
the familiar—seems particularly relevant.
With so much global uncertainty about
geopolitics, monetary policy, and the
economic outlook, it’s understandable
why investors may not want to stray
too far from home.
But in their aversion to the unknown,
investors can end up increasing, rather
than lessening, their risks. That’s
because they’re sacrificing broad global
diversification—one of the best ways
I know of to help control risk.
In many cases, individual country markets
are much less diversified than the global
market in total. Global investing, then, can
be an answer for investors who want to
reduce concentration risk. That can include
overconcentration in a particular country,
region, or industry.
And the good news is that global investing
is easier than ever, thanks to the wide
availability of low-cost, internationally
diversified stock and bond funds. It’s
possible, in a sense, to own the whole
world with just a couple of funds.
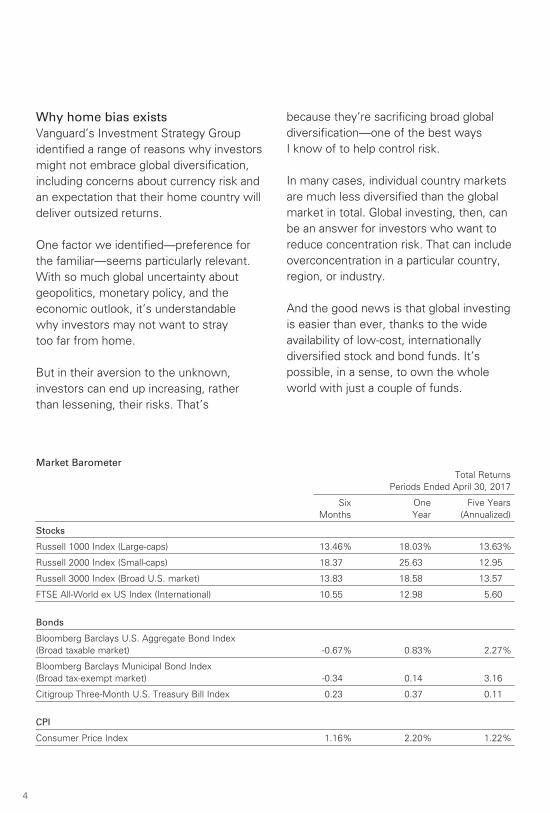
Market Barometer Total Returns
Periods Ended April 30, 2017
Six One Five Years
Months Year (Annualized)
Stocks
Russell 1000 Index (Large-caps) 13.46% 18.03% 13.63%
Russell 2000 Index (Small-caps) 18.37 25.63 12.95
Russell 3000 Index (Broad U.S. market) 13.83 18.58 13.57
FTSE All-World ex US Index (International) 10.55 12.98 5.60
Bonds
Bloomberg Barclays U.S. Aggregate Bond Index
(Broad taxable market) -0.67% 0.83% 2.27%
Bloomberg Barclays Municipal Bond Index
(Broad tax-exempt market) -0.34 0.14 3.16
Citigroup Three-Month U.S. Treasury Bill Index 0.23 0.37 0.11
CPI
Consumer Price Index 1.16% 2.20% 1.22%
4
Expanding our opportunitiesA key to overcoming home bias is
reframing the way we look at investing
outside our home countries. Take, for
example, automakers or pharmaceutical
companies. There are well-regarded firms
in both industries located throughout the
world. Over the next five years, nobody
can know for sure whether a Japanese
or U.S. or European company will produce
a popular new sedan that outsells the
competition or come up with new treat-
ments to combat illness. So why not own
them all? And that includes their bonds
along with their stocks.
Full global diversification also allows
you to capitalize on opportunities in both
developed and emerging economies.
Betting on which individual country—let
alone company—will be the next market
darling can be a fool’s errand.
A better choice can be to harness the
potential of all markets. In my personal
investment account, I have an emerging
markets position that complements my
developed-market holdings. Not only can
global diversification help control risk, but
it can also expand our set of opportunities
among stocks and bonds.
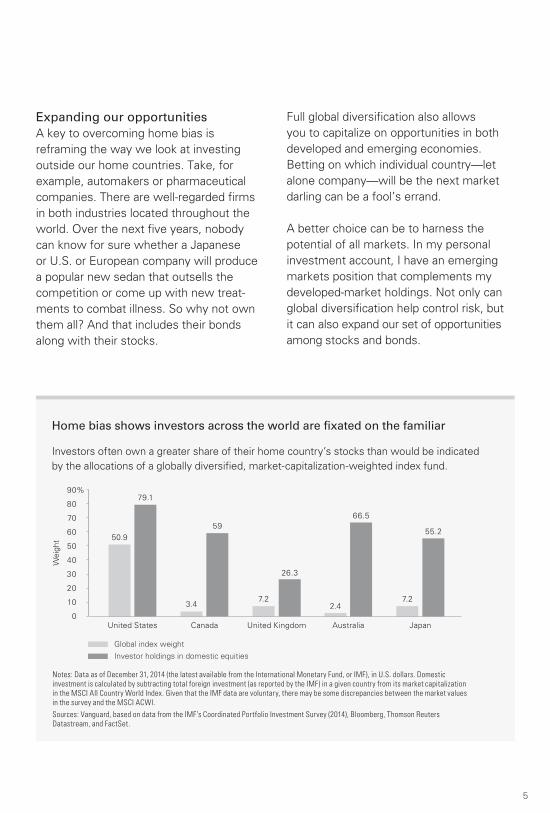
Home bias shows investors across the world are fixated on the familiar
Investors often own a greater share of their home country’s stocks than would be indicated
by the allocations of a globally diversified, market-capitalization-weighted index fund.
Weig
ht
Notes: Data as of December 31, 2014 (the latest available from the International Monetary Fund, or IMF), in U.S. dollars. Domestic
investment is calculated by subtracting total foreign investment (as reported by the IMF) in a given country from its market capitalization
in the MSCI All Country World Index. Given that the IMF data are voluntary, there may be some discrepancies between the market values
in the survey and the MSCI ACWI.
Sources: Vanguard, based on data from the IMF’s Coordinated Portfolio Investment Survey (2014), Bloomberg, Thomson Reuters
Datastream, and FactSet.
0
80
70
60
50
40
30
20
10
90%
United States Canada United Kingdom Australia Japan
50.9
79.1
3.4
59
7.2
26.3
2.4
66.5
7.2
55.2
Global index weight
Investor holdings in domestic equities
5

Ultimately, I believe we have the best
chance for investment success by giving
ourselves more opportunities, not fewer.
Own the whole haystack and you never
have to worry about finding the needle.
Thank you for entrusting your assets
to Vanguard.
Sincerely,
F. William McNabb III
Chairman and Chief Executive Officer
May 12, 2017
6
1 The expense ratios shown are from the prospectus dated February 23, 2017, and represent estimated costs for the current fiscal year. For the six months ended April 30, 2017, the annualized expense ratios were 0.15% for Investor Shares and 0.08% for ETF Shares.
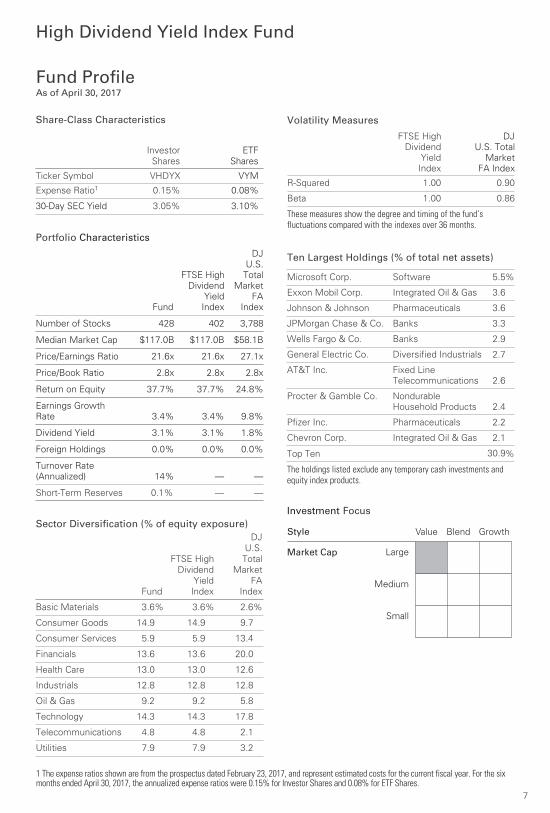
Fund ProfileAs of April 30, 2017
High Dividend Yield Index Fund
Share-Class Characteristics
InvestorShares
ETF Shares
Ticker Symbol VHDYX VYM
Expense Ratio1 0.15% 0.08%
30-Day SEC Yield 3.05% 3.10%
7
Volatility Measures
FTSE High
Dividend
Yield
Index
DJ
U.S. Total
Market
FA Index
R-Squared 1.00 0.90
Beta 1.00 0.86
These measures show the degree and timing of the fund’s fluctuations compared with the indexes over 36 months.
Ten Largest Holdings (% of total net assets)
Microsoft Corp. Software 5.5%
Exxon Mobil Corp. Integrated Oil & Gas 3.6
Johnson & Johnson Pharmaceuticals 3.6
JPMorgan Chase & Co. Banks 3.3
Wells Fargo & Co. Banks 2.9
General Electric Co. Diversified Industrials 2.7
AT&T Inc. Fixed Line
Telecommunications 2.6
Procter & Gamble Co. Nondurable
Household Products 2.4
Pfizer Inc. Pharmaceuticals 2.2
Chevron Corp. Integrated Oil & Gas 2.1
Top Ten 30.9%
The holdings listed exclude any temporary cash investments andequity index products.
Investment Focus
Market Cap
Value
Large
Medium
Small
Blend Growth Style
Portfolio Characteristics
Fund
FTSE High
Dividend
Yield
Index
DJ
U.S.
Total
Market
FA
Index
Number of Stocks 428 402 3,788
Median Market Cap $117.0B $117.0B $58.1B
Price/Earnings Ratio 21.6x 21.6x 27.1x
Price/Book Ratio 2.8x 2.8x 2.8x
Return on Equity 37.7% 37.7% 24.8%
Earnings Growth
Rate 3.4% 3.4% 9.8%
Dividend Yield 3.1% 3.1% 1.8%
Foreign Holdings 0.0% 0.0% 0.0%
Turnover Rate
(Annualized) 14% — —
Short-Term Reserves 0.1% — —
Sector Diversification (% of equity exposure)
Fund
FTSE HighDividend
YieldIndex
DJU.S.Total
MarketFA
Index
Basic Materials 3.6% 3.6% 2.6%
Consumer Goods 14.9 14.9 9.7
Consumer Services 5.9 5.9 13.4
Financials 13.6 13.6 20.0
Health Care 13.0 13.0 12.6
Industrials 12.8 12.8 12.8
Oil & Gas 9.2 9.2 5.8
Technology 14.3 14.3 17.8
Telecommunications 4.8 4.8 2.1
Utilities 7.9 7.9 3.2
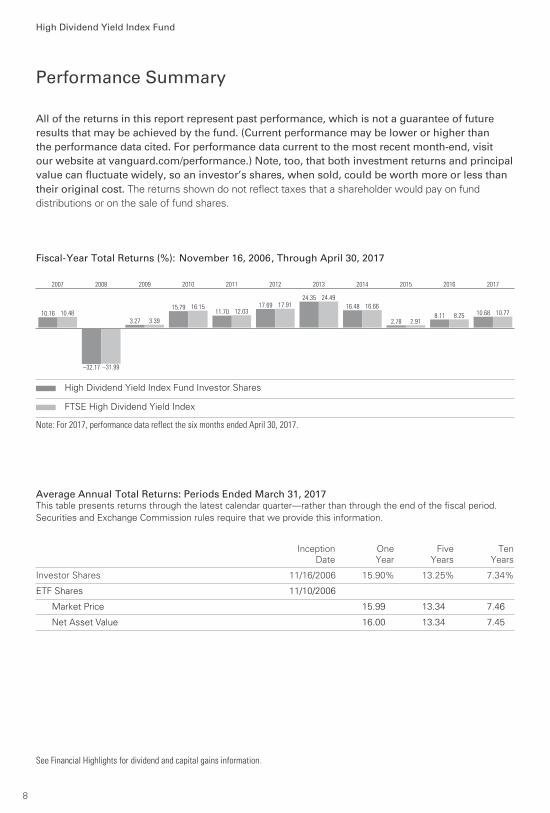
All of the returns in this report represent past performance, which is not a guarantee of future results that may be achieved by the fund. (Current performance may be lower or higher thanthe performance data cited. For performance data current to the most recent month-end, visitour website at vanguard.com/performance.) Note, too, that both investment returns and principalvalue can fluctuate widely, so an investor’s shares, when sold, could be worth more or less than their original cost. The returns shown do not reflect taxes that a shareholder would pay on fund
distributions or on the sale of fund shares.
See Financial Highlights for dividend and capital gains information.
Performance Summary
High Dividend Yield Index Fund
8
Fiscal-Year Total Returns (%): November 16, 2006, Through April 30, 2017
10.16 10.48
2007
–32.17 –31.99
2008
3.27 3.39
2009
15.79 16.15
2010
11.70 12.03
2011
17.69 17.91
2012
24.35 24.49
2013
16.48 16.66
2014
2.78 2.91
2015
8.11 8.25
2016
10.68 10.77
2017
High Dividend Yield Index Fund Investor Shares
FTSE High Dividend Yield Index
Note: For 2017, performance data reflect the six months ended April 30, 2017.
Average Annual Total Returns: Periods Ended March 31, 2017This table presents returns through the latest calendar quarter—rather than through the end of the fiscal period.Securities and Exchange Commission rules require that we provide this information.
InceptionDate
OneYear
FiveYears
TenYears
Investor Shares 11/16/2006 15.90% 13.25% 7.34%
ETF Shares 11/10/2006
Market Price 15.99 13.34 7.46
Net Asset Value 16.00 13.34 7.45
Market
Value•
Shares ($000)
Market
Value•
Shares ($000)
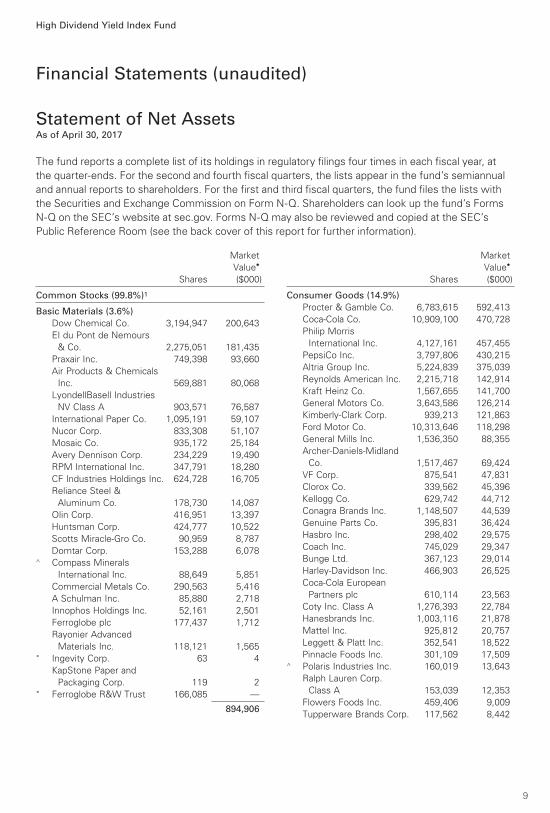
Common Stocks (99.8%)1
Basic Materials (3.6%)
Dow Chemical Co. 3,194,947 200,643
EI du Pont de Nemours
& Co. 2,275,051 181,435
Praxair Inc. 749,398 93,660
Air Products & Chemicals
Inc. 569,881 80,068
LyondellBasell Industries
NV Class A 903,571 76,587
International Paper Co. 1,095,191 59,107
Nucor Corp. 833,308 51,107
Mosaic Co. 935,172 25,184
Avery Dennison Corp. 234,229 19,490
RPM International Inc. 347,791 18,280
CF Industries Holdings Inc. 624,728 16,705
Reliance Steel &
Aluminum Co. 178,730 14,087
Olin Corp. 416,951 13,397
Huntsman Corp. 424,777 10,522
Scotts Miracle-Gro Co. 90,959 8,787
Domtar Corp. 153,288 6,078^ Compass Minerals
International Inc. 88,649 5,851
Commercial Metals Co. 290,563 5,416
A Schulman Inc. 85,880 2,718
Innophos Holdings Inc. 52,161 2,501
Ferroglobe plc 177,437 1,712
Rayonier Advanced
Materials Inc. 118,121 1,565* Ingevity Corp. 63 4
KapStone Paper and
Packaging Corp. 119 2* Ferroglobe R&W Trust 166,085 —
894,906
Consumer Goods (14.9%)
Procter & Gamble Co. 6,783,615 592,413
Coca-Cola Co. 10,909,100 470,728
Philip Morris
International Inc. 4,127,161 457,455
PepsiCo Inc. 3,797,806 430,215
Altria Group Inc. 5,224,839 375,039
Reynolds American Inc. 2,215,718 142,914
Kraft Heinz Co. 1,567,655 141,700
General Motors Co. 3,643,586 126,214
Kimberly-Clark Corp. 939,213 121,863
Ford Motor Co. 10,313,646 118,298
General Mills Inc. 1,536,350 88,355
Archer-Daniels-Midland
Co. 1,517,467 69,424
VF Corp. 875,541 47,831
Clorox Co. 339,562 45,396
Kellogg Co. 629,742 44,712
Conagra Brands Inc. 1,148,507 44,539
Genuine Parts Co. 395,831 36,424
Hasbro Inc. 298,402 29,575
Coach Inc. 745,029 29,347
Bunge Ltd. 367,123 29,014
Harley-Davidson Inc. 466,903 26,525
Coca-Cola European
Partners plc 610,114 23,563
Coty Inc. Class A 1,276,393 22,784
Hanesbrands Inc. 1,003,116 21,878
Mattel Inc. 925,812 20,757
Leggett & Platt Inc. 352,541 18,522
Pinnacle Foods Inc. 301,109 17,509^ Polaris Industries Inc. 160,019 13,643
Ralph Lauren Corp.
Class A 153,039 12,353
Flowers Foods Inc. 459,406 9,009
Tupperware Brands Corp. 117,562 8,442
Financial Statements (unaudited)
Statement of Net AssetsAs of April 30, 2017
The fund reports a complete list of its holdings in regulatory filings four times in each fiscal year, at
the quarter-ends. For the second and fourth fiscal quarters, the lists appear in the fund’s semiannual
and annual reports to shareholders. For the first and third fiscal quarters, the fund files the lists with
the Securities and Exchange Commission on Form N-Q. Shareholders can look up the fund’s Forms
N-Q on the SEC’s website at sec.gov. Forms N-Q may also be reviewed and copied at the SEC’s
Public Reference Room (see the back cover of this report for further information).
High Dividend Yield Index Fund
9
High Dividend Yield Index Fund
Market
Value•
Shares ($000)
Market
Value•
Shares ($000)
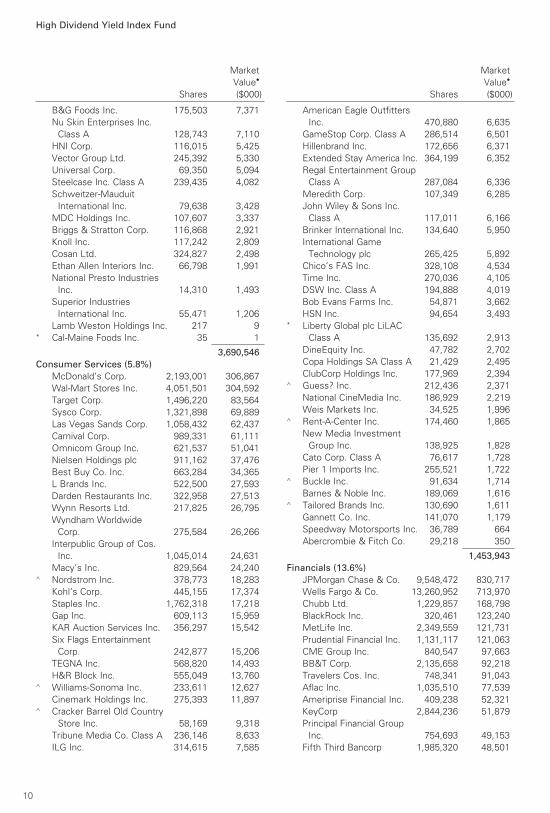
B&G Foods Inc. 175,503 7,371
Nu Skin Enterprises Inc.
Class A 128,743 7,110
HNI Corp. 116,015 5,425
Vector Group Ltd. 245,392 5,330
Universal Corp. 69,350 5,094
Steelcase Inc. Class A 239,435 4,082
Schweitzer-Mauduit
International Inc. 79,638 3,428
MDC Holdings Inc. 107,607 3,337
Briggs & Stratton Corp. 116,868 2,921
Knoll Inc. 117,242 2,809
Cosan Ltd. 324,827 2,498
Ethan Allen Interiors Inc. 66,798 1,991
National Presto Industries
Inc. 14,310 1,493
Superior Industries
International Inc. 55,471 1,206
Lamb Weston Holdings Inc. 217 9* Cal-Maine Foods Inc. 35 1
3,690,546
Consumer Services (5.8%)
McDonald’s Corp. 2,193,001 306,867
Wal-Mart Stores Inc. 4,051,501 304,592
Target Corp. 1,496,220 83,564
Sysco Corp. 1,321,898 69,889
Las Vegas Sands Corp. 1,058,432 62,437
Carnival Corp. 989,331 61,111
Omnicom Group Inc. 621,537 51,041
Nielsen Holdings plc 911,162 37,476
Best Buy Co. Inc. 663,284 34,365
L Brands Inc. 522,500 27,593
Darden Restaurants Inc. 322,958 27,513
Wynn Resorts Ltd. 217,825 26,795
Wyndham Worldwide
Corp. 275,584 26,266
Interpublic Group of Cos.
Inc. 1,045,014 24,631
Macy’s Inc. 829,564 24,240^ Nordstrom Inc. 378,773 18,283
Kohl’s Corp. 445,155 17,374
Staples Inc. 1,762,318 17,218
Gap Inc. 609,113 15,959
KAR Auction Services Inc. 356,297 15,542
Six Flags Entertainment
Corp. 242,877 15,206
TEGNA Inc. 568,820 14,493
H&R Block Inc. 555,049 13,760^ Williams-Sonoma Inc. 233,611 12,627
Cinemark Holdings Inc. 275,393 11,897^ Cracker Barrel Old Country
Store Inc. 58,169 9,318
Tribune Media Co. Class A 236,146 8,633
ILG Inc. 314,615 7,585
American Eagle Outfitters
Inc. 470,880 6,635
GameStop Corp. Class A 286,514 6,501
Hillenbrand Inc. 172,656 6,371
Extended Stay America Inc. 364,199 6,352
Regal Entertainment Group
Class A 287,084 6,336
Meredith Corp. 107,349 6,285
John Wiley & Sons Inc.
Class A 117,011 6,166
Brinker International Inc. 134,640 5,950
International Game
Technology plc 265,425 5,892
Chico’s FAS Inc. 328,108 4,534
Time Inc. 270,036 4,105
DSW Inc. Class A 194,888 4,019
Bob Evans Farms Inc. 54,871 3,662
HSN Inc. 94,654 3,493* Liberty Global plc LiLAC
Class A 135,692 2,913
DineEquity Inc. 47,782 2,702
Copa Holdings SA Class A 21,429 2,495
ClubCorp Holdings Inc. 177,969 2,394^ Guess? Inc. 212,436 2,371
National CineMedia Inc. 186,929 2,219
Weis Markets Inc. 34,525 1,996^ Rent-A-Center Inc. 174,460 1,865
New Media Investment
Group Inc. 138,925 1,828
Cato Corp. Class A 76,617 1,728
Pier 1 Imports Inc. 255,521 1,722^ Buckle Inc. 91,634 1,714
Barnes & Noble Inc. 189,069 1,616^ Tailored Brands Inc. 130,690 1,611
Gannett Co. Inc. 141,070 1,179
Speedway Motorsports Inc. 36,789 664
Abercrombie & Fitch Co. 29,218 350
1,453,943
Financials (13.6%)
JPMorgan Chase & Co. 9,548,472 830,717
Wells Fargo & Co. 13,260,952 713,970
Chubb Ltd. 1,229,857 168,798
BlackRock Inc. 320,461 123,240
MetLife Inc. 2,349,559 121,731
Prudential Financial Inc. 1,131,117 121,063
CME Group Inc. 840,547 97,663
BB&T Corp. 2,135,658 92,218
Travelers Cos. Inc. 748,341 91,043
Aflac Inc. 1,035,510 77,539
Ameriprise Financial Inc. 409,238 52,321
KeyCorp 2,844,236 51,879
Principal Financial Group
Inc. 754,693 49,153
Fifth Third Bancorp 1,985,320 48,501
10
High Dividend Yield Index Fund
Market
Value•
Shares ($000)
Market
Value•
Shares ($000)
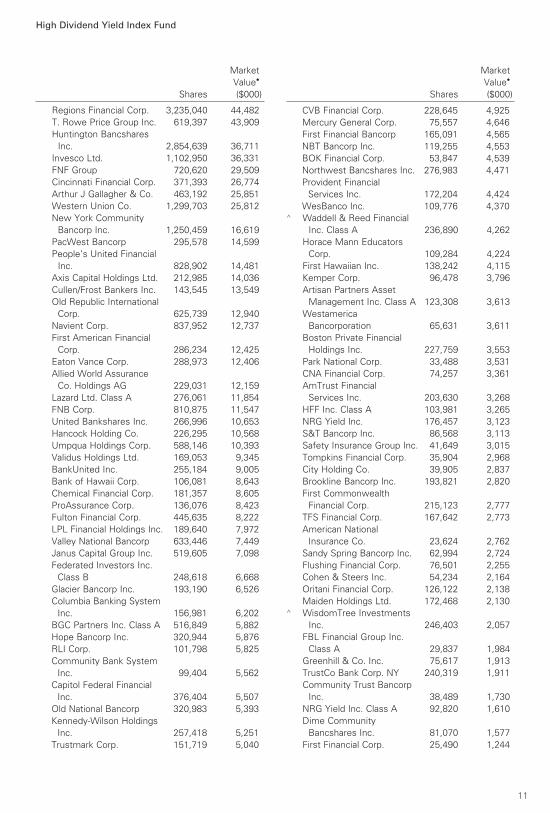
Regions Financial Corp. 3,235,040 44,482
T. Rowe Price Group Inc. 619,397 43,909
Huntington Bancshares
Inc. 2,854,639 36,711
Invesco Ltd. 1,102,950 36,331
FNF Group 720,620 29,509
Cincinnati Financial Corp. 371,393 26,774
Arthur J Gallagher & Co. 463,192 25,851
Western Union Co. 1,299,703 25,812
New York Community
Bancorp Inc. 1,250,459 16,619
PacWest Bancorp 295,578 14,599
People’s United Financial
Inc. 828,902 14,481
Axis Capital Holdings Ltd. 212,985 14,036
Cullen/Frost Bankers Inc. 143,545 13,549
Old Republic International
Corp. 625,739 12,940
Navient Corp. 837,952 12,737
First American Financial
Corp. 286,234 12,425
Eaton Vance Corp. 288,973 12,406
Allied World Assurance
Co. Holdings AG 229,031 12,159
Lazard Ltd. Class A 276,061 11,854
FNB Corp. 810,875 11,547
United Bankshares Inc. 266,996 10,653
Hancock Holding Co. 226,295 10,568
Umpqua Holdings Corp. 588,146 10,393
Validus Holdings Ltd. 169,053 9,345
BankUnited Inc. 255,184 9,005
Bank of Hawaii Corp. 106,081 8,643
Chemical Financial Corp. 181,357 8,605
ProAssurance Corp. 136,076 8,423
Fulton Financial Corp. 445,635 8,222
LPL Financial Holdings Inc. 189,640 7,972
Valley National Bancorp 633,446 7,449
Janus Capital Group Inc. 519,605 7,098
Federated Investors Inc.
Class B 248,618 6,668
Glacier Bancorp Inc. 193,190 6,526
Columbia Banking System
Inc. 156,981 6,202
BGC Partners Inc. Class A 516,849 5,882
Hope Bancorp Inc. 320,944 5,876
RLI Corp. 101,798 5,825
Community Bank System
Inc. 99,404 5,562
Capitol Federal Financial
Inc. 376,404 5,507
Old National Bancorp 320,983 5,393
Kennedy-Wilson Holdings
Inc. 257,418 5,251
Trustmark Corp. 151,719 5,040
CVB Financial Corp. 228,645 4,925
Mercury General Corp. 75,557 4,646
First Financial Bancorp 165,091 4,565
NBT Bancorp Inc. 119,255 4,553
BOK Financial Corp. 53,847 4,539
Northwest Bancshares Inc. 276,983 4,471
Provident Financial
Services Inc. 172,204 4,424
WesBanco Inc. 109,776 4,370^ Waddell & Reed Financial
Inc. Class A 236,890 4,262
Horace Mann Educators
Corp. 109,284 4,224
First Hawaiian Inc. 138,242 4,115
Kemper Corp. 96,478 3,796
Artisan Partners Asset
Management Inc. Class A 123,308 3,613
Westamerica
Bancorporation 65,631 3,611
Boston Private Financial
Holdings Inc. 227,759 3,553
Park National Corp. 33,488 3,531
CNA Financial Corp. 74,257 3,361
AmTrust Financial
Services Inc. 203,630 3,268
HFF Inc. Class A 103,981 3,265
NRG Yield Inc. 176,457 3,123
S&T Bancorp Inc. 86,568 3,113
Safety Insurance Group Inc. 41,649 3,015
Tompkins Financial Corp. 35,904 2,968
City Holding Co. 39,905 2,837
Brookline Bancorp Inc. 193,821 2,820
First Commonwealth
Financial Corp. 215,123 2,777
TFS Financial Corp. 167,642 2,773
American National
Insurance Co. 23,624 2,762
Sandy Spring Bancorp Inc. 62,994 2,724
Flushing Financial Corp. 76,501 2,255
Cohen & Steers Inc. 54,234 2,164
Oritani Financial Corp. 126,122 2,138
Maiden Holdings Ltd. 172,468 2,130^ WisdomTree Investments
Inc. 246,403 2,057
FBL Financial Group Inc.
Class A 29,837 1,984
Greenhill & Co. Inc. 75,617 1,913
TrustCo Bank Corp. NY 240,319 1,911
Community Trust Bancorp
Inc. 38,489 1,730
NRG Yield Inc. Class A 92,820 1,610
Dime Community
Bancshares Inc. 81,070 1,577
First Financial Corp. 25,490 1,244
11
High Dividend Yield Index Fund
Market
Value•
Shares ($000)
Market
Value•
Shares ($000)
Republic Bancorp Inc.
Class A 26,711 961
Washington Trust Bancorp
Inc. 9,320 459
BancFirst Corp. 259 25
Independent Bank
Corp./Rockland 393 25
LegacyTexas Financial
Group Inc. 181 7
IBERIABANK Corp. 63 5
Willis Towers Watson plc 8 1
1st Source Corp. 21 1
3,368,876
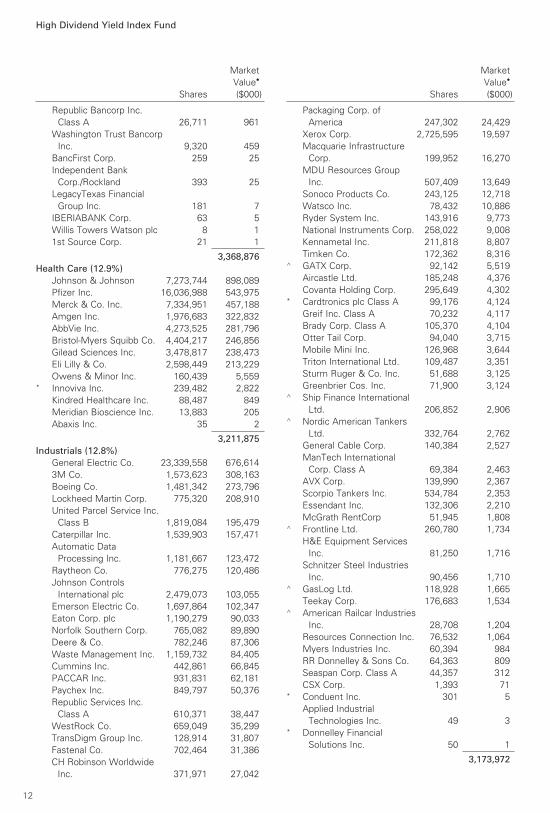
Health Care (12.9%)
Johnson & Johnson 7,273,744 898,089
Pfizer Inc. 16,036,988 543,975
Merck & Co. Inc. 7,334,951 457,188
Amgen Inc. 1,976,683 322,832
AbbVie Inc. 4,273,525 281,796
Bristol-Myers Squibb Co. 4,404,217 246,856
Gilead Sciences Inc. 3,478,817 238,473
Eli Lilly & Co. 2,598,449 213,229
Owens & Minor Inc. 160,439 5,559* Innoviva Inc. 239,482 2,822
Kindred Healthcare Inc. 88,487 849
Meridian Bioscience Inc. 13,883 205
Abaxis Inc. 35 2
3,211,875
Industrials (12.8%)
General Electric Co. 23,339,558 676,614
3M Co. 1,573,623 308,163
Boeing Co. 1,481,342 273,796
Lockheed Martin Corp. 775,320 208,910
United Parcel Service Inc.
Class B 1,819,084 195,479
Caterpillar Inc. 1,539,903 157,471
Automatic Data
Processing Inc. 1,181,667 123,472
Raytheon Co. 776,275 120,486
Johnson Controls
International plc 2,479,073 103,055
Emerson Electric Co. 1,697,864 102,347
Eaton Corp. plc 1,190,279 90,033
Norfolk Southern Corp. 765,082 89,890
Deere & Co. 782,246 87,306
Waste Management Inc. 1,159,732 84,405
Cummins Inc. 442,861 66,845
PACCAR Inc. 931,831 62,181
Paychex Inc. 849,797 50,376
Republic Services Inc.
Class A 610,371 38,447
WestRock Co. 659,049 35,299
TransDigm Group Inc. 128,914 31,807
Fastenal Co. 702,464 31,386
CH Robinson Worldwide
Inc. 371,971 27,042
Packaging Corp. of
America 247,302 24,429
Xerox Corp. 2,725,595 19,597
Macquarie Infrastructure
Corp. 199,952 16,270
MDU Resources Group
Inc. 507,409 13,649
Sonoco Products Co. 243,125 12,718
Watsco Inc. 78,432 10,886
Ryder System Inc. 143,916 9,773
National Instruments Corp. 258,022 9,008
Kennametal Inc. 211,818 8,807
Timken Co. 172,362 8,316^ GATX Corp. 92,142 5,519
Aircastle Ltd. 185,248 4,376
Covanta Holding Corp. 295,649 4,302* Cardtronics plc Class A 99,176 4,124
Greif Inc. Class A 70,232 4,117
Brady Corp. Class A 105,370 4,104
Otter Tail Corp. 94,040 3,715
Mobile Mini Inc. 126,968 3,644
Triton International Ltd. 109,487 3,351
Sturm Ruger & Co. Inc. 51,688 3,125
Greenbrier Cos. Inc. 71,900 3,124^ Ship Finance International
Ltd. 206,852 2,906^ Nordic American Tankers
Ltd. 332,764 2,762
General Cable Corp. 140,384 2,527
ManTech International
Corp. Class A 69,384 2,463
AVX Corp. 139,990 2,367
Scorpio Tankers Inc. 534,784 2,353
Essendant Inc. 132,306 2,210
McGrath RentCorp 51,945 1,808^ Frontline Ltd. 260,780 1,734
H&E Equipment Services
Inc. 81,250 1,716
Schnitzer Steel Industries
Inc. 90,456 1,710^ GasLog Ltd. 118,928 1,665
Teekay Corp. 176,683 1,534^ American Railcar Industries
Inc. 28,708 1,204
Resources Connection Inc. 76,532 1,064
Myers Industries Inc. 60,394 984
RR Donnelley & Sons Co. 64,363 809
Seaspan Corp. Class A 44,357 312
CSX Corp. 1,393 71* Conduent Inc. 301 5
Applied Industrial
Technologies Inc. 49 3* Donnelley Financial
Solutions Inc. 50 1
3,173,972
12
High Dividend Yield Index Fund
Market
Value•
Shares ($000)
Market
Value•
Shares ($000)
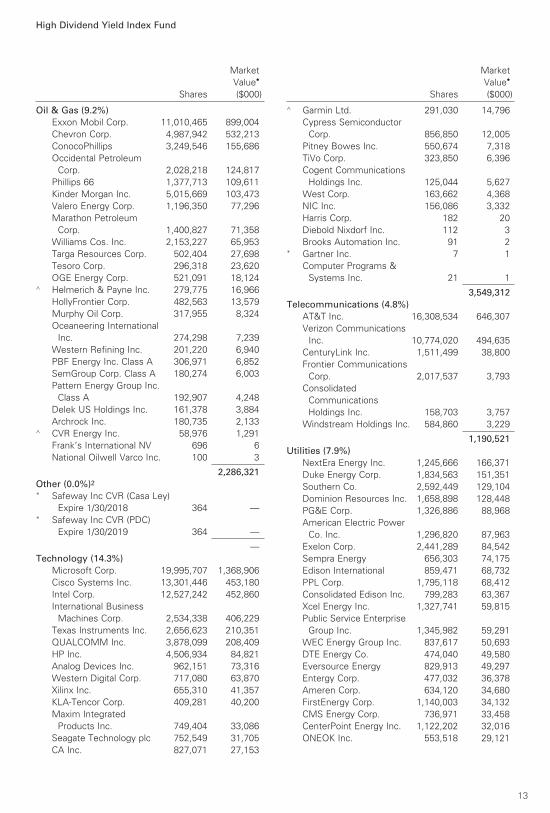
Oil & Gas (9.2%)
Exxon Mobil Corp. 11,010,465 899,004
Chevron Corp. 4,987,942 532,213
ConocoPhillips 3,249,546 155,686
Occidental Petroleum
Corp. 2,028,218 124,817
Phillips 66 1,377,713 109,611
Kinder Morgan Inc. 5,015,669 103,473
Valero Energy Corp. 1,196,350 77,296
Marathon Petroleum
Corp. 1,400,827 71,358
Williams Cos. Inc. 2,153,227 65,953
Targa Resources Corp. 502,404 27,698
Tesoro Corp. 296,318 23,620
OGE Energy Corp. 521,091 18,124^ Helmerich & Payne Inc. 279,775 16,966
HollyFrontier Corp. 482,563 13,579
Murphy Oil Corp. 317,955 8,324
Oceaneering International
Inc. 274,298 7,239
Western Refining Inc. 201,220 6,940
PBF Energy Inc. Class A 306,971 6,852
SemGroup Corp. Class A 180,274 6,003
Pattern Energy Group Inc.
Class A 192,907 4,248
Delek US Holdings Inc. 161,378 3,884
Archrock Inc. 180,735 2,133^ CVR Energy Inc. 58,976 1,291
Frank’s International NV 696 6
National Oilwell Varco Inc. 100 3
2,286,321
Other (0.0%)2 * Safeway Inc CVR (Casa Ley)
Expire 1/30/2018 364 —* Safeway Inc CVR (PDC)
Expire 1/30/2019 364 —
—
Technology (14.3%)
Microsoft Corp. 19,995,707 1,368,906
Cisco Systems Inc. 13,301,446 453,180
Intel Corp. 12,527,242 452,860
International Business
Machines Corp. 2,534,338 406,229
Texas Instruments Inc. 2,656,623 210,351
QUALCOMM Inc. 3,878,099 208,409
HP Inc. 4,506,934 84,821
Analog Devices Inc. 962,151 73,316
Western Digital Corp. 717,080 63,870
Xilinx Inc. 655,310 41,357
KLA-Tencor Corp. 409,281 40,200
Maxim Integrated
Products Inc. 749,404 33,086
Seagate Technology plc 752,549 31,705
CA Inc. 827,071 27,153
^ Garmin Ltd. 291,030 14,796
Cypress Semiconductor
Corp. 856,850 12,005
Pitney Bowes Inc. 550,674 7,318
TiVo Corp. 323,850 6,396
Cogent Communications
Holdings Inc. 125,044 5,627
West Corp. 163,662 4,368
NIC Inc. 156,086 3,332
Harris Corp. 182 20
Diebold Nixdorf Inc. 112 3
Brooks Automation Inc. 91 2* Gartner Inc. 7 1
Computer Programs &
Systems Inc. 21 1
3,549,312
Telecommunications (4.8%)
AT&T Inc. 16,308,534 646,307
Verizon Communications
Inc. 10,774,020 494,635
CenturyLink Inc. 1,511,499 38,800
Frontier Communications
Corp. 2,017,537 3,793
Consolidated
Communications
Holdings Inc. 158,703 3,757
Windstream Holdings Inc. 584,860 3,229
1,190,521
Utilities (7.9%)
NextEra Energy Inc. 1,245,666 166,371
Duke Energy Corp. 1,834,563 151,351
Southern Co. 2,592,449 129,104
Dominion Resources Inc. 1,658,898 128,448
PG&E Corp. 1,326,886 88,968
American Electric Power
Co. Inc. 1,296,820 87,963
Exelon Corp. 2,441,289 84,542
Sempra Energy 656,303 74,175
Edison International 859,471 68,732
PPL Corp. 1,795,118 68,412
Consolidated Edison Inc. 799,283 63,367
Xcel Energy Inc. 1,327,741 59,815
Public Service Enterprise
Group Inc. 1,345,982 59,291
WEC Energy Group Inc. 837,617 50,693
DTE Energy Co. 474,040 49,580
Eversource Energy 829,913 49,297
Entergy Corp. 477,032 36,378
Ameren Corp. 634,120 34,680
FirstEnergy Corp. 1,140,003 34,132
CMS Energy Corp. 736,971 33,458
CenterPoint Energy Inc. 1,122,202 32,016
ONEOK Inc. 553,518 29,121
13
High Dividend Yield Index Fund
Market
Value•
Shares ($000)
Face Market
Amount Value•
($000) ($000)
Pinnacle West Capital
Corp. 289,999 24,676
Alliant Energy Corp. 590,540 23,220
UGI Corp. 455,900 22,868
SCANA Corp. 341,162 22,622
Atmos Energy Corp. 276,770 22,424
NiSource Inc. 861,970 20,903
AES Corp. 1,778,249 20,112
Westar Energy Inc.
Class A 371,388 19,323
Great Plains Energy Inc. 546,326 16,166
Aqua America Inc. 459,366 15,200
Vectren Corp. 215,150 12,784
National Fuel Gas Co. 200,745 11,117
WGL Holdings Inc. 133,706 11,025
IDACORP Inc. 129,010 10,904
Portland General Electric
Co. 228,700 10,369
Southwest Gas Holdings
Inc. 122,040 10,222
Black Hills Corp. 137,630 9,362
ONE Gas Inc. 135,903 9,354
Hawaiian Electric
Industries Inc. 277,909 9,316
New Jersey Resources
Corp. 224,738 9,068
ALLETE Inc. 118,786 8,304
Spire Inc. 116,114 7,960
NorthWestern Corp. 131,591 7,867
South Jersey Industries
Inc. 203,784 7,646
PNM Resources Inc. 204,213 7,607
Avista Corp. 175,025 7,061
Avangrid Inc. 151,276 6,581
El Paso Electric Co. 109,662 5,659
Northwest Natural Gas Co. 76,935 4,585* TerraForm Power Inc.
Class A 232,780 2,931
Atlantica Yield plc 130,422 2,718
California Water Service
Group 340 12
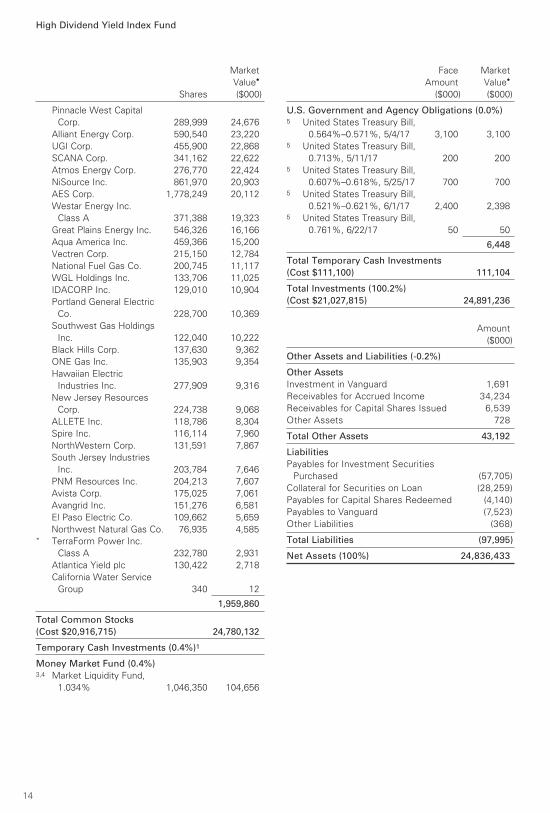
1,959,860
Total Common Stocks
(Cost $20,916,715) 24,780,132
Temporary Cash Investments (0.4%)1
Money Market Fund (0.4%)3,4 Market Liquidity Fund,
1.034% 1,046,350 104,656
U.S. Government and Agency Obligations (0.0%) 5 United States Treasury Bill,
0.564%–0.571%, 5/4/17 3,100 3,1005 United States Treasury Bill,
0.713%, 5/11/17 200 2005 United States Treasury Bill,
0.607%–0.618%, 5/25/17 700 7005 United States Treasury Bill,
0.521%–0.621%, 6/1/17 2,400 2,3985 United States Treasury Bill,
0.761%, 6/22/17 50 50
6,448
Total Temporary Cash Investments
(Cost $111,100) 111,104
Total Investments (100.2%)
(Cost $21,027,815) 24,891,236
Amount
($000)
Other Assets and Liabilities (-0.2%)
Other Assets
Investment in Vanguard 1,691
Receivables for Accrued Income 34,234
Receivables for Capital Shares Issued 6,539
Other Assets 728
Total Other Assets 43,192
Liabilities
Payables for Investment Securities
Purchased (57,705)
Collateral for Securities on Loan (28,259)
Payables for Capital Shares Redeemed (4,140)
Payables to Vanguard (7,523)
Other Liabilities (368)
Total Liabilities (97,995)
Net Assets (100%) 24,836,433
14
High Dividend Yield Index Fund
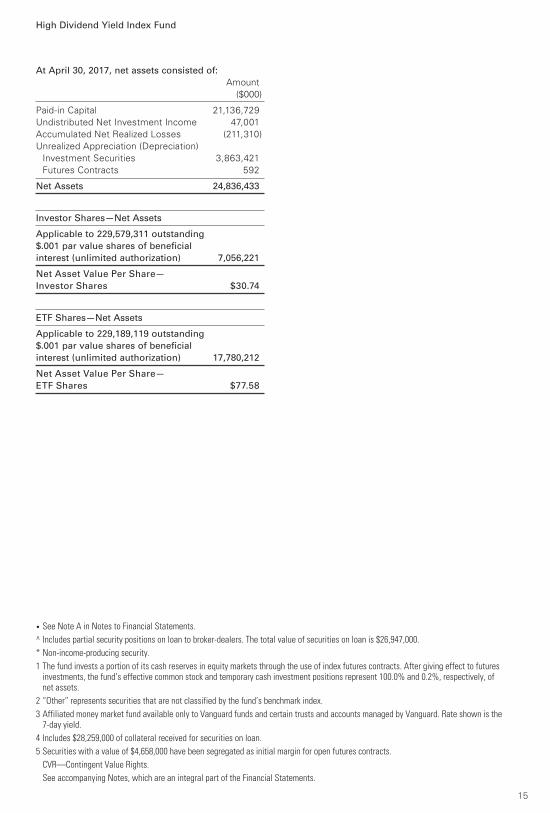
At April 30, 2017, net assets consisted of:
Amount
($000)
Paid-in Capital 21,136,729
Undistributed Net Investment Income 47,001
Accumulated Net Realized Losses (211,310)
Unrealized Appreciation (Depreciation)
Investment Securities 3,863,421
Futures Contracts 592
Net Assets 24,836,433
Investor Shares—Net Assets
Applicable to 229,579,311 outstanding
$.001 par value shares of beneficial
interest (unlimited authorization) 7,056,221
Net Asset Value Per Share—
Investor Shares $30.74
ETF Shares—Net Assets
Applicable to 229,189,119 outstanding
$.001 par value shares of beneficial
interest (unlimited authorization) 17,780,212
Net Asset Value Per Share—
ETF Shares $77.58
• See Note A in Notes to Financial Statements.
^ Includes partial security positions on loan to broker-dealers. The total value of securities on loan is $26,947,000.
* Non-income-producing security.
1 The fund invests a portion of its cash reserves in equity markets through the use of index futures contracts. After giving effect to futures investments, the fund’s effective common stock and temporary cash investment positions represent 100.0% and 0.2%, respectively, of net assets.
2 “Other” represents securities that are not classified by the fund’s benchmark index.
3 Affiliated money market fund available only to Vanguard funds and certain trusts and accounts managed by Vanguard. Rate shown is the 7-day yield.
4 Includes $28,259,000 of collateral received for securities on loan.
5 Securities with a value of $4,658,000 have been segregated as initial margin for open futures contracts.
CVR—Contingent Value Rights.
See accompanying Notes, which are an integral part of the Financial Statements.
15
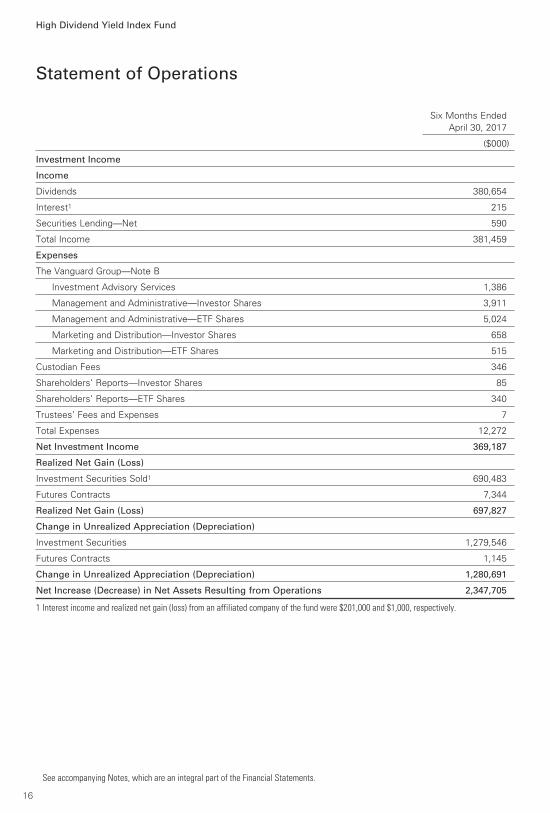
Six Months Ended
April 30, 2017
($000)
Investment Income
Income
Dividends 380,654
Interest1 215
Securities Lending—Net 590
Total Income 381,459
Expenses
The Vanguard Group—Note B
Investment Advisory Services 1,386
Management and Administrative—Investor Shares 3,911
Management and Administrative—ETF Shares 5,024
Marketing and Distribution—Investor Shares 658
Marketing and Distribution—ETF Shares 515
Custodian Fees 346
Shareholders’ Reports—Investor Shares 85
Shareholders’ Reports—ETF Shares 340
Trustees’ Fees and Expenses 7
Total Expenses 12,272
Net Investment Income 369,187
Realized Net Gain (Loss)
Investment Securities Sold1 690,483
Futures Contracts 7,344
Realized Net Gain (Loss) 697,827
Change in Unrealized Appreciation (Depreciation)
Investment Securities 1,279,546
Futures Contracts 1,145
Change in Unrealized Appreciation (Depreciation) 1,280,691
Net Increase (Decrease) in Net Assets Resulting from Operations 2,347,705
1 Interest income and realized net gain (loss) from an affiliated company of the fund were $201,000 and $1,000, respectively.
Statement of Operations
High Dividend Yield Index Fund
See accompanying Notes, which are an integral part of the Financial Statements.
16
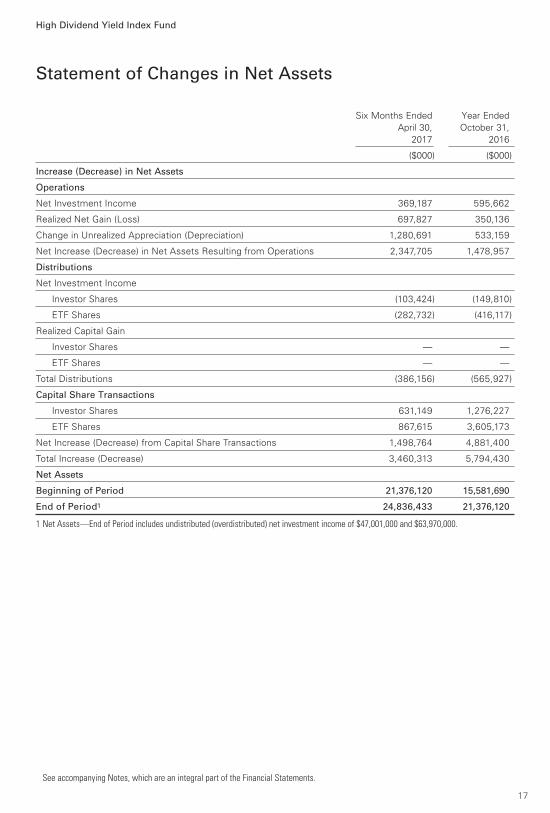
Statement of Changes in Net Assets
High Dividend Yield Index Fund
See accompanying Notes, which are an integral part of the Financial Statements.
Six Months Ended Year Ended
April 30, October 31,
2017 2016
($000) ($000)
Increase (Decrease) in Net Assets
Operations
Net Investment Income 369,187 595,662
Realized Net Gain (Loss) 697,827 350,136
Change in Unrealized Appreciation (Depreciation) 1,280,691 533,159
Net Increase (Decrease) in Net Assets Resulting from Operations 2,347,705 1,478,957
Distributions
Net Investment Income
Investor Shares (103,424) (149,810)
ETF Shares (282,732) (416,117)
Realized Capital Gain
Investor Shares — —
ETF Shares — —
Total Distributions (386,156) (565,927)
Capital Share Transactions
Investor Shares 631,149 1,276,227
ETF Shares 867,615 3,605,173
Net Increase (Decrease) from Capital Share Transactions 1,498,764 4,881,400
Total Increase (Decrease) 3,460,313 5,794,430
Net Assets
Beginning of Period 21,376,120 15,581,690
End of Period1 24,836,433 21,376,120
1 Net Assets—End of Period includes undistributed (overdistributed) net investment income of $47,001,000 and $63,970,000.
17
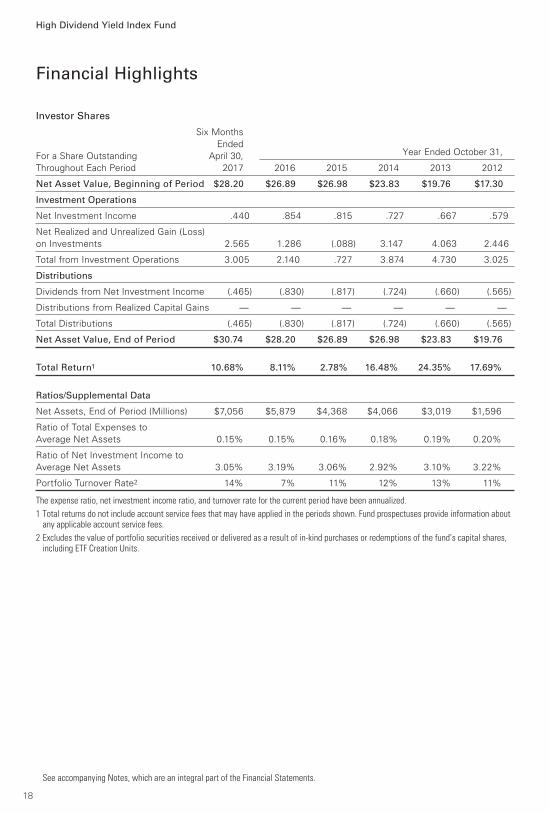
Investor Shares
Six Months
Ended
For a Share Outstanding April 30, Year Ended October 31,
Throughout Each Period 2017 2016 2015 2014 2013 2012
Net Asset Value, Beginning of Period $28.20 $26.89 $26.98 $23.83 $19.76 $17.30
Investment Operations
Net Investment Income .440 .854 .815 .727 .667 .579
Net Realized and Unrealized Gain (Loss)
on Investments 2.565 1.286 (.088) 3.147 4.063 2.446
Total from Investment Operations 3.005 2.140 .727 3.874 4.730 3.025
Distributions
Dividends from Net Investment Income (.465) (.830) (.817) (.724) (.660) (.565)
Distributions from Realized Capital Gains — — — — — —
Total Distributions (.465) (.830) (.817) (.724) (.660) (.565)
Net Asset Value, End of Period $30.74 $28.20 $26.89 $26.98 $23.83 $19.76
Total Return1 10.68% 8.11% 2.78% 16.48% 24.35% 17.69%
Ratios/Supplemental Data
Net Assets, End of Period (Millions) $7,056 $5,879 $4,368 $4,066 $3,019 $1,596
Ratio of Total Expenses to
Average Net Assets 0.15% 0.15% 0.16% 0.18% 0.19% 0.20%
Ratio of Net Investment Income to
Average Net Assets 3.05% 3.19% 3.06% 2.92% 3.10% 3.22%
Portfolio Turnover Rate2 14% 7% 11% 12% 13% 11%
The expense ratio, net investment income ratio, and turnover rate for the current period have been annualized.
1 Total returns do not include account service fees that may have applied in the periods shown. Fund prospectuses provide information about any applicable account service fees.
2 Excludes the value of portfolio securities received or delivered as a result of in-kind purchases or redemptions of the fund’s capital shares, including ETF Creation Units.
Financial Highlights
See accompanying Notes, which are an integral part of the Financial Statements.
High Dividend Yield Index Fund
18
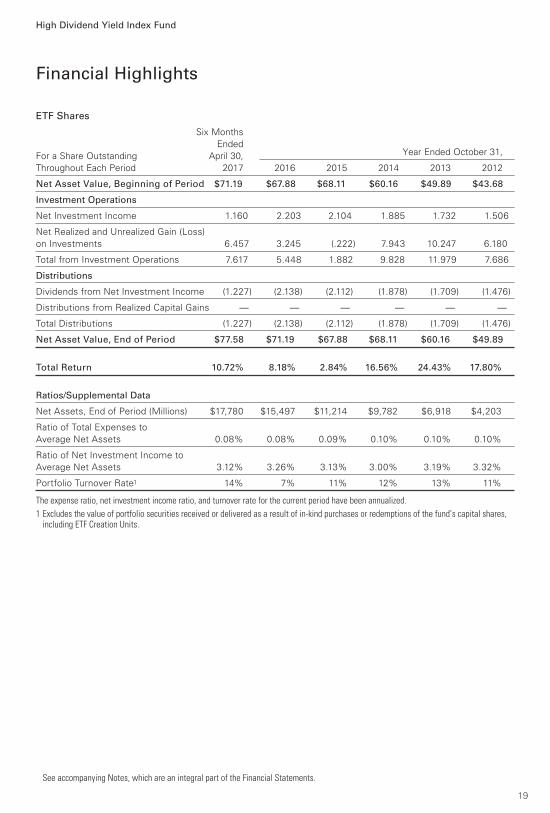
ETF Shares
Six Months
Ended
For a Share Outstanding April 30, Year Ended October 31,
Throughout Each Period 2017 2016 2015 2014 2013 2012
Net Asset Value, Beginning of Period $71.19 $67.88 $68.11 $60.16 $49.89 $43.68
Investment Operations
Net Investment Income 1.160 2.203 2.104 1.885 1.732 1.506
Net Realized and Unrealized Gain (Loss)
on Investments 6.457 3.245 (.222) 7.943 10.247 6.180
Total from Investment Operations 7.617 5.448 1.882 9.828 11.979 7.686
Distributions
Dividends from Net Investment Income (1.227) (2.138) (2.112) (1.878) (1.709) (1.476)
Distributions from Realized Capital Gains — — — — — —
Total Distributions (1.227) (2.138) (2.112) (1.878) (1.709) (1.476)
Net Asset Value, End of Period $77.58 $71.19 $67.88 $68.11 $60.16 $49.89
Total Return 10.72% 8.18% 2.84% 16.56% 24.43% 17.80%
Ratios/Supplemental Data
Net Assets, End of Period (Millions) $17,780 $15,497 $11,214 $9,782 $6,918 $4,203
Ratio of Total Expenses to
Average Net Assets 0.08% 0.08% 0.09% 0.10% 0.10% 0.10%
Ratio of Net Investment Income to
Average Net Assets 3.12% 3.26% 3.13% 3.00% 3.19% 3.32%
Portfolio Turnover Rate1 14% 7% 11% 12% 13% 11%
The expense ratio, net investment income ratio, and turnover rate for the current period have been annualized.
1 Excludes the value of portfolio securities received or delivered as a result of in-kind purchases or redemptions of the fund’s capital shares, including ETF Creation Units.
Financial Highlights
See accompanying Notes, which are an integral part of the Financial Statements.
High Dividend Yield Index Fund
19
Notes to Financial Statements
High Dividend Yield Index Fund
Vanguard High Dividend Yield Index Fund is registered under the Investment Company Act of 1940
as an open-end investment company, or mutual fund. The fund offers two classes of shares: Investor
Shares and ETF Shares. Investor Shares are available to any investor who meets the fund’s minimum
purchase requirements. ETF Shares are listed for trading on NYSE Arca; they can be purchased and
sold through a broker.
A. The following significant accounting policies conform to generally accepted accounting principles
for U.S. investment companies. The fund consistently follows such policies in preparing its financial
statements.
1. Security Valuation: Securities are valued as of the close of trading on the New York Stock Exchange
(generally 4 p.m., Eastern time) on the valuation date. Equity securities are valued at the latest quoted
sales prices or official closing prices taken from the primary market in which each security trades;
such securities not traded on the valuation date are valued at the mean of the latest quoted bid and
asked prices. Securities for which market quotations are not readily available, or whose values have
been materially affected by events occurring before the fund’s pricing time but after the close of the
securities’ primary markets, are valued by methods deemed by the board of trustees to represent
fair value. Investments in Vanguard Market Liquidity Fund are valued at that fund’s net asset value.
Temporary cash investments are valued using the latest bid prices or using valuations based on a
matrix system (which considers such factors as security prices, yields, maturities, and ratings),
both as furnished by independent pricing services.
2. Futures Contracts: The fund uses index futures contracts to a limited extent, with the objectives of
maintaining full exposure to the stock market, enhancing returns, maintaining liquidity, and minimizing
transaction costs. The fund may purchase futures contracts to immediately invest incoming cash in
the market, or sell futures in response to cash outflows, thereby simulating a fully invested position
in the underlying index while maintaining a cash balance for liquidity. The fund may seek to enhance
returns by using futures contracts instead of the underlying securities when futures are believed to be
priced more attractively than the underlying securities. The primary risks associated with the use of
futures contracts are imperfect correlation between changes in market values of stocks held by the
fund and the prices of futures contracts, and the possibility of an illiquid market. Counterparty risk
involving futures is mitigated because a regulated clearinghouse is the counterparty instead of
the clearing broker. To further mitigate counterparty risk, the fund trades futures contracts on
an exchange, monitors the financial strength of its clearing brokers and clearinghouse, and has
entered into clearing agreements with its clearing brokers. The clearinghouse imposes initial
margin requirements to secure the fund’s performance and requires daily settlement of
variation margin representing changes in the market value of each contract.
Futures contracts are valued at their quoted daily settlement prices. The aggregate settlement values
of the contracts are not recorded in the Statement of Net Assets. Fluctuations in the value of the
contracts are recorded in the Statement of Net Assets as an asset (liability) and in the Statement
of Operations as unrealized appreciation (depreciation) until the contracts are closed, when they
are recorded as realized futures gains (losses).
During the six months ended April 30, 2017, the fund’s average investments in long and short futures
contracts represented less than 1% and 0% of net assets, respectively, based on the average of
aggregate settlement values at each quarter-end during the period.
20
High Dividend Yield Index Fund
3. Federal Income Taxes: The fund intends to continue to qualify as a regulated investment company
and distribute all of its taxable income. Management has analyzed the fund’s tax positions taken for all
open federal income tax years (October 31, 2013–2016), and for the period ended April 30, 2017, and
has concluded that no provision for federal income tax is required in the fund’s financial statements.
4. Distributions: Distributions to shareholders are recorded on the ex-dividend date.
5. Securities Lending: To earn additional income, the fund lends its securities to qualified institutional
borrowers. Security loans are subject to termination by the fund at any time, and are required to be
secured at all times by collateral in an amount at least equal to the market value of securities loaned.
Daily market fluctuations could cause the value of loaned securities to be more or less than the value
of the collateral received. When this occurs, the collateral is adjusted and settled on the next business
day. The fund further mitigates its counterparty risk by entering into securities lending transactions
only with a diverse group of prequalified counterparties, monitoring their financial strength, and
entering into master securities lending agreements with its counterparties. The master securities
lending agreements provide that, in the event of a counterparty’s default (including bankruptcy), the
fund may terminate any loans with that borrower, determine the net amount owed, and sell or retain
the collateral up to the net amount owed to the fund; however, such actions may be subject to legal
proceedings. While collateral mitigates counterparty risk, in the event of a default, the fund may
experience delays and costs in recovering the securities loaned. The fund invests cash collateral
received in Vanguard Market Liquidity Fund, and records a liability in the Statement of Net Assets
for the return of the collateral, during the period the securities are on loan. Securities lending income
represents fees charged to borrowers plus income earned on invested cash collateral, less expenses
associated with the loan. During the term of the loan, the fund is entitled to all distributions made on
or in respect of the loaned securities.
6. Credit Facility: The fund and certain other funds managed by The Vanguard Group (“Vanguard”)
participate in a $3.1 billion committed credit facility provided by a syndicate of lenders pursuant to a
credit agreement that may be renewed annually; each fund is individually liable for its borrowings, if
any, under the credit facility. Borrowings may be utilized for temporary and emergency purposes, and
are subject to the fund’s regulatory and contractual borrowing restrictions. The participating funds are
charged administrative fees and an annual commitment fee of 0.10% of the undrawn amount of the
facility; these fees are allocated to the funds based on a method approved by the fund’s board of
trustees and included in Management and Administrative expenses on the fund’s Statement of
Operations. Any borrowings under this facility bear interest at a rate based upon the higher of the
one-month London Interbank Offered Rate, federal funds effective rate, or overnight bank funding
rate plus an agreed-upon spread.
The fund had no borrowings outstanding at April 30, 2017, or at any time during the period
then ended.
7. Other: Dividend income is recorded on the ex-dividend date. Interest income includes income
distributions received from Vanguard Market Liquidity Fund and is accrued daily. Premiums and
discounts on debt securities purchased are amortized and accreted, respectively, to interest income
over the lives of the respective securities. Security transactions are accounted for on the date
securities are bought or sold. Costs used to determine realized gains (losses) on the sale of
investment securities are those of the specific securities sold.
Each class of shares has equal rights as to assets and earnings, except that each class separately
bears certain class-specific expenses related to maintenance of shareholder accounts (included in
Management and Administrative expenses) and shareholder reporting. Marketing and distribution
21
High Dividend Yield Index Fund
expenses are allocated to each class of shares based on a method approved by the board of trustees.
Income, other non-class-specific expenses, and gains and losses on investments are allocated to
each class of shares based on its relative net assets.
B. In accordance with the terms of a Funds’ Service Agreement (the “FSA”) between Vanguard and
the fund, Vanguard furnishes to the fund investment advisory, corporate management, administrative,
marketing, and distribution services at Vanguard’s cost of operations (as defined by the FSA). These
costs of operations are allocated to the fund based on methods and guidelines approved by the board
of trustees. Vanguard does not require reimbursement in the current period for certain costs of
operations (such as deferred compensation/benefits and risk/insurance costs); the fund’s liability
for these costs of operations is included in Payables to Vanguard on the Statement of Net Assets.
Upon the request of Vanguard, the fund may invest up to 0.40% of its net assets as capital
in Vanguard. At April 30, 2017, the fund had contributed to Vanguard capital in the amount of
$1,691,000, representing 0.01% of the fund’s net assets and 0.68% of Vanguard’s capitalization.
The fund’s trustees and officers are also directors and employees, respectively, of Vanguard.
C. Various inputs may be used to determine the value of the fund’s investments. These inputs are
summarized in three broad levels for financial statement purposes. The inputs or methodologies
used to value securities are not necessarily an indication of the risk associated with investing in
those securities.
Level 1—Quoted prices in active markets for identical securities.
Level 2—Other significant observable inputs (including quoted prices for similar securities, interest
rates, prepayment speeds, credit risk, etc.).
Level 3—Significant unobservable inputs (including the fund’s own assumptions used to determine
the fair value of investments).
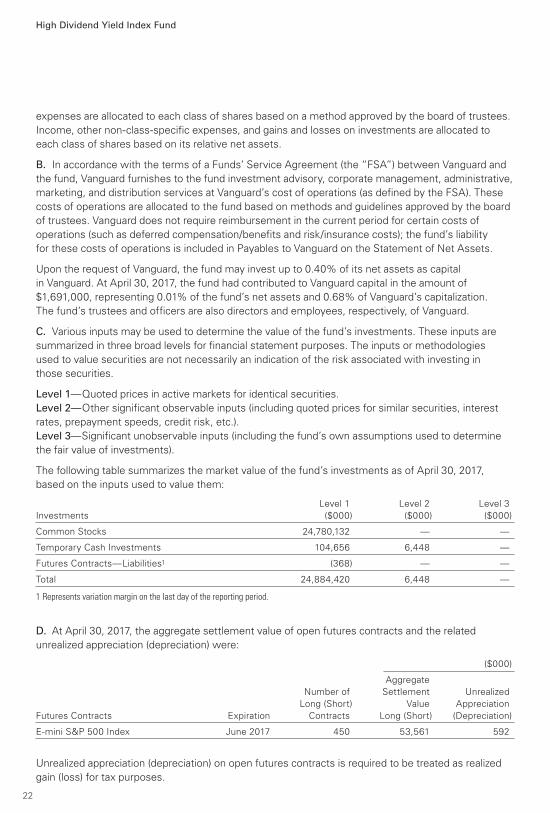
The following table summarizes the market value of the fund’s investments as of April 30, 2017,
based on the inputs used to value them:
Level 1 Level 2 Level 3
Investments ($000) ($000) ($000)
Common Stocks 24,780,132 — —
Temporary Cash Investments 104,656 6,448 —
Futures Contracts—Liabilities1 (368) — —
Total 24,884,420 6,448 —
1 Represents variation margin on the last day of the reporting period.
D. At April 30, 2017, the aggregate settlement value of open futures contracts and the related
unrealized appreciation (depreciation) were:
($000)
Aggregate
Number of Settlement Unrealized
Long (Short) Value Appreciation
Futures Contracts Expiration Contracts Long (Short) (Depreciation)
E-mini S&P 500 Index June 2017 450 53,561 592
Unrealized appreciation (depreciation) on open futures contracts is required to be treated as realized
gain (loss) for tax purposes.
22
23
High Dividend Yield Index Fund
E. Distributions are determined on a tax basis and may differ from net investment income and
realized capital gains for financial reporting purposes. Differences may be permanent or temporary.
Permanent differences are reclassified among capital accounts in the financial statements to reflect
their tax character. Temporary differences arise when certain items of income, expense, gain, or loss
are recognized in different periods for financial statement and tax purposes. These differences will
reverse at some time in the future. Differences in classification may also result from the treatment
of short-term gains as ordinary income for tax purposes.
During the six months ended April 30, 2017, the fund realized $698,364,000 of net capital gains
resulting from in-kind redemptions—in which shareholders exchanged fund shares for securities
held by the fund rather than for cash. Because such gains are not taxable to the fund, and are not
distributed to shareholders, they have been reclassified from accumulated net realized losses to
paid-in capital.
The fund’s tax-basis capital gains and losses are determined only at the end of each fiscal year. For
tax purposes, at October 31, 2016, the fund had available capital losses totaling $211,326,000 to
offset future net capital gains. Of this amount, $18,315,000 is subject to expiration on October 31,
2018. Capital losses of $193,011,000 realized beginning in fiscal 2012 may be carried forward
indefinitely under the Regulated Investment Company Modernization Act of 2010, but must be used
before any expiring loss carryforwards. The fund will use these capital losses to offset net taxable
capital gains, if any, realized during the year ending October 31, 2017; should the fund realize net
capital losses for the year, the losses will be added to the loss carryforward balance above.
At April 30, 2017, the cost of investment securities for tax purposes was $21,028,467,000. Net
unrealized appreciation of investment securities for tax purposes was $3,862,769,000, consisting
of unrealized gains of $4,293,608,000 on securities that had risen in value since their purchase
and $430,839,000 in unrealized losses on securities that had fallen in value since their purchase.
F. During the six months ended April 30, 2017, the fund purchased $5,099,368,000 of investment
securities and sold $3,585,405,000 of investment securities, other than temporary cash investments.
Purchases and sales include $2,726,456,000 and $1,947,772,000, respectively, in connection with
in-kind purchases and redemptions of the fund’s capital shares.
The fund purchased securities from and sold securities to other Vanguard funds or accounts managed
by Vanguard or its affiliates, in accordance with procedures adopted by the board of trustees in
compliance with Rule 17a-7 of the Investment Company Act of 1940. For the six months ended
April 30, 2017, such purchases and sales were $365,900,000 and $412,894,000, respectively;
these amounts are included in the purchases and sales of investment securities noted above.
Untitled-1 1 6/9/17 3:29 PM
High Dividend Yield Index Fund
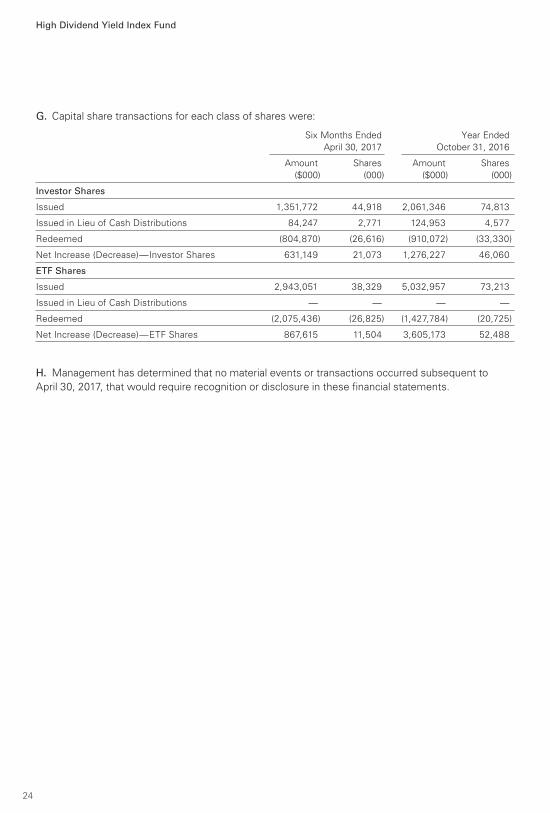
G. Capital share transactions for each class of shares were:
Six Months Ended Year Ended
April 30, 2017 October 31, 2016
Amount Shares Amount Shares
($000) (000) ($000) (000)
Investor Shares
Issued 1,351,772 44,918 2,061,346 74,813
Issued in Lieu of Cash Distributions 84,247 2,771 124,953 4,577
Redeemed (804,870) (26,616) (910,072) (33,330)
Net Increase (Decrease)—Investor Shares 631,149 21,073 1,276,227 46,060
ETF Shares
Issued 2,943,051 38,329 5,032,957 73,213
Issued in Lieu of Cash Distributions — — — —
Redeemed (2,075,436) (26,825) (1,427,784) (20,725)
Net Increase (Decrease)—ETF Shares 867,615 11,504 3,605,173 52,488
H. Management has determined that no material events or transactions occurred subsequent to
April 30, 2017, that would require recognition or disclosure in these financial statements.
24
About Your Fund’s Expenses
As a shareholder of the fund, you incur ongoing costs, which include costs for portfolio management,
administrative services, and shareholder reports (like this one), among others. Operating expenses,
which are deducted from a fund’s gross income, directly reduce the investment return of the fund.
A fund’s expenses are expressed as a percentage of its average net assets. This figure is known as the
expense ratio. The following examples are intended to help you understand the ongoing costs (in
dollars) of investing in your fund and to compare these costs with those of other mutual funds. The
examples are based on an investment of $1,000 made at the beginning of the period shown and held
for the entire period.
The accompanying table illustrates your fund’s costs in two ways:
• Based on actual fund return. This section helps you to estimate the actual expenses that you paid
over the period. The ”Ending Account Value“ shown is derived from the fund‘s actual return, and the
third column shows the dollar amount that would have been paid by an investor who started with
$1,000 in the fund. You may use the information here, together with the amount you invested, to
estimate the expenses that you paid over the period.
To do so, simply divide your account value by $1,000 (for example, an $8,600 account value divided by
$1,000 = 8.6), then multiply the result by the number given for your fund under the heading ”Expenses
Paid During Period.“
• Based on hypothetical 5% yearly return. This section is intended to help you compare your fund‘s
costs with those of other mutual funds. It assumes that the fund had a yearly return of 5% before
expenses, but that the expense ratio is unchanged. In this case—because the return used is not the
fund’s actual return—the results do not apply to your investment. The example is useful in making
comparisons because the Securities and Exchange Commission requires all mutual funds to calculate
expenses based on a 5% return. You can assess your fund’s costs by comparing this hypothetical
example with the hypothetical examples that appear in shareholder reports of other funds.
Note that the expenses shown in the table are meant to highlight and help you compare ongoingcosts only and do not reflect transaction costs incurred by the fund for buying and selling securities.Further, the expenses do not include any purchase, redemption, or account service fees described inthe fund prospectus. If such fees were applied to your account, your costs would be higher. Yourfund does not carry a “sales load.”
The calculations assume no shares were bought or sold during the period. Your actual costs may
have been higher or lower, depending on the amount of your investment and the timing of any
purchases or redemptions.
You can find more information about the fund’s expenses, including annual expense ratios, in the
Financial Statements section of this report. For additional information on operating expenses and
other shareholder costs, please refer to your fund’s current prospectus.
25
26
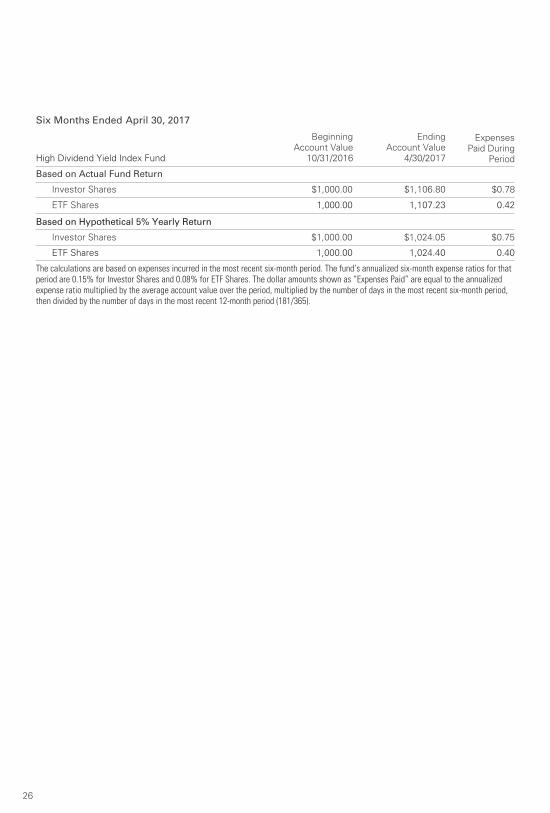
Six Months Ended April 30, 2017
High Dividend Yield Index Fund
Beginning
Account Value
10/31/2016
Ending
Account Value
4/30/2017
Expenses
Paid During
Period
Based on Actual Fund Return
Investor Shares $1,000.00 $1,106.80 $0.78
ETF Shares 1,000.00 1,107.23 0.42
Based on Hypothetical 5% Yearly Return
Investor Shares $1,000.00 $1,024.05 $0.75
ETF Shares 1,000.00 1,024.40 0.40
The calculations are based on expenses incurred in the most recent six-month period. The fund’s annualized six-month expense ratios for thatperiod are 0.15% for Investor Shares and 0.08% for ETF Shares. The dollar amounts shown as “Expenses Paid” are equal to the annualizedexpense ratio multiplied by the average account value over the period, multiplied by the number of days in the most recent six-month period,then divided by the number of days in the most recent 12-month period (181/365).
The board of trustees of Vanguard High Dividend Yield Index Fund has renewed the fund’s investment
advisory arrangement with The Vanguard Group, Inc. (Vanguard)—through its Equity Index Group.
The board determined that continuing the fund’s internalized management structure was in the best
interests of the fund and its shareholders.
The board based its decision upon an evaluation of the advisor’s investment staff, portfolio
management process, and performance. This evaluation included information provided to the board
by Vanguard’s Portfolio Review Department, which is responsible for fund and advisor oversight and
product management. The Portfolio Review Department met regularly with the advisor and made
monthly presentations to the board during the fiscal year that directed the board’s focus to relevant
information and topics.
The board, or an investment committee made up of board members, also received information
throughout the year during advisor presentations. For each advisor presentation, the board was
provided with letters and reports that included information about, among other things, the advisory
firm and the advisor’s assessment of the investment environment, portfolio performance, and
portfolio characteristics.
In addition, the board received monthly reports, which included a Market and Economic Report, a
Fund Dashboard Monthly Summary, and a Fund Performance Report.
Prior to their meeting, the trustees were provided with a memo and materials that summarized the
information they received over the course of the year. They also considered the factors discussed
below, among others. However, no single factor determined whether the board approved the
arrangement. Rather, it was the totality of the circumstances that drove the board’s decision.
Nature, extent, and quality of services
The board reviewed the quality of the fund’s investment management services over both the short
and long term, and took into account the organizational depth and stability of the advisor. The board
considered that Vanguard has been managing investments for more than three decades. The Equity
Index Group adheres to a sound, disciplined investment management process; the team has
considerable experience, stability, and depth.
The board concluded that Vanguard’s experience, stability, depth, and performance, among other
factors, warranted continuation of the advisory arrangement.
Investment performance
The board considered the short- and long-term performance of the fund, including any periods of
outperformance or underperformance compared with its target index and peer group. The board
concluded that the performance was such that the advisory arrangement should continue.
Information about the fund’s most recent performance can be found in the Performance
Summary section of this report.
Cost
The board concluded that the fund’s expense ratio was well below the average expense ratio charged
by funds in its peer group and that the fund’s advisory expenses were also well below its peer-group
average. Information about the fund’s expenses appears in the About Your Fund’s Expenses section
of this report as well as in the Financial Statements section.
Trustees Approve Advisory Arrangement
27
The board does not conduct a profitability analysis of Vanguard because of Vanguard’s unique “at-cost”
structure. Unlike most other mutual fund management companies, Vanguard is owned by the funds it
oversees and produces “profits” only in the form of reduced expenses for fund shareholders.
The benefit of economies of scale
The board concluded that the fund’s at-cost arrangement with Vanguard ensures that the fund
will realize economies of scale as it grows, with the cost to shareholders declining as the fund’s
assets increase.
The board will consider whether to renew the advisory arrangement again after a one-year period.
28
Glossary
29
30-Day SEC Yield. A fund’s 30-day SEC yield is derived using a formula specified by the U.S.
Securities and Exchange Commission. Under the formula, data related to the fund’s security
holdings in the previous 30 days are used to calculate the fund’s hypothetical net income for that
period, which is then annualized and divided by the fund’s estimated average net assets over the
calculation period. For the purposes of this calculation, a security’s income is based on its current
market yield to maturity (for bonds), its actual income (for asset-backed securities), or its projected
dividend yield (for stocks). Because the SEC yield represents hypothetical annualized income, it will
differ—at times significantly—from the fund’s actual experience. As a result, the fund’s income
distributions may be higher or lower than implied by the SEC yield.
Beta. A measure of the magnitude of a fund’s past share-price fluctuations in relation to the ups and
downs of a given market index. The index is assigned a beta of 1.00. Compared with a given index,
a fund with a beta of 1.20 typically would have seen its share price rise or fall by 12% when the
index rose or fell by 10%. For this report, beta is based on returns over the past 36 months for both
the fund and the index. Note that a fund’s beta should be reviewed in conjunction with its R-squared
(see definition). The lower the R-squared, the less correlation there is between the fund and the
index, and the less reliable beta is as an indicator of volatility.
Dividend Yield. Dividend income earned by stocks, expressed as a percentage of the aggregate
market value (or of net asset value, for a fund). The yield is determined by dividing the amount of the
annual dividends by the aggregate value (or net asset value) at the end of the period. For a fund, the
dividend yield is based solely on stock holdings and does not include any income produced by other
investments.
Earnings Growth Rate. The average annual rate of growth in earnings over the past five years for
the stocks now in a fund.
Equity Exposure. A measure that reflects a fund’s investments in stocks and stock futures. Any
holdings in short-term reserves are excluded.
Expense Ratio. A fund’s total annual operating expenses expressed as a percentage of the fund’s
average net assets. The expense ratio includes management and administrative expenses, but does
not include the transaction costs of buying and selling portfolio securities.
Foreign Holdings. The percentage of a fund represented by securities or depositary receipts of
companies based outside the United States.
Inception Date. The date on which the assets of a fund (or one of its share classes) are first
invested in accordance with the fund’s investment objective. For funds with a subscription period,
the inception date is the day after that period ends. Investment performance is measured from the
inception date.
Median Market Cap. An indicator of the size of companies in which a fund invests; the midpoint of
market capitalization (market price x shares outstanding) of a fund’s stocks, weighted by the
proportion of the fund’s assets invested in each stock. Stocks representing half of the fund’s assets
have market capitalizations above the median, and the rest are below it.
Price/Book Ratio. The share price of a stock divided by its net worth, or book value, per share. For a
fund, the weighted average price/book ratio of the stocks it holds.
30
Price/Earnings Ratio. The ratio of a stock’s current price to its per-share earnings over the past
year. For a fund, the weighted average P/E of the stocks it holds. P/E is an indicator of market
expectations about corporate prospects; the higher the P/E, the greater the expectations for a
company’s future growth.
R-Squared. A measure of how much of a fund’s past returns can be explained by the returns from
the market in general, as measured by a given index. If a fund’s total returns were precisely
synchronized with an index’s returns, its R-squared would be 1.00. If the fund’s returns bore no
relationship to the index’s returns, its R-squared would be 0. For this report, R-squared is based on
returns over the past 36 months for both the fund and the index.
Return on Equity. The annual average rate of return generated by a company during the past five
years for each dollar of shareholder’s equity (net income divided by shareholder’s equity). For a fund,
the weighted average return on equity for the companies whose stocks it holds.
Short-Term Reserves. The percentage of a fund invested in highly liquid, short-term securities that
can be readily converted to cash.
Turnover Rate. An indication of the fund’s trading activity. Funds with high turnover rates incur
higher transaction costs and may be more likely to distribute capital gains (which may be taxable to
investors). The turnover rate excludes in-kind transactions, which have minimal impact on costs.
The People Who Govern Your Fund
The trustees of your mutual fund are there to see that the fund is operated and managed in your best
interests since, as a shareholder, you are a part owner of the fund. Your fund’s trustees also serve on
the board of directors of The Vanguard Group, Inc., which is owned by the Vanguard funds and
provides services to them on an at-cost basis.
A majority of Vanguard’s board members are independent, meaning that they have no affiliation with
Vanguard or the funds they oversee, apart from the sizable personal investments they have made as
private individuals. The independent board members have distinguished backgrounds in business,
academia, and public service. Each of the trustees and executive officers oversees 197 Vanguard funds.
The following table provides information for each trustee and executive officer of the fund. The mailing
address of the trustees and officers is P.O. Box 876, Valley Forge, PA 19482. More information about
the trustees is in the Statement of Additional Information, which can be obtained, without charge, by
contacting Vanguard at 800-662-7447, or online at vanguard.com.
Interested Trustee1
F. William McNabb III
Born 1957. Trustee Since July 2009. Chairman of
the Board. Principal Occupation(s) During the Past
Five Years and Other Experience: Chairman of the
Board of The Vanguard Group, Inc., and of each of the
investment companies served by The Vanguard Group,
since January 2010; Director of The Vanguard Group
since 2008; Chief Executive Officer and President of
The Vanguard Group, and of each of the investment
companies served by The Vanguard Group, since 2008;
Director of Vanguard Marketing Corporation; Managing
Director of The Vanguard Group (1995–2008).
Independent Trustees
Emerson U. Fullwood
Born 1948. Trustee Since January 2008. Principal
Occupation(s) During the Past Five Years and Other
Experience: Executive Chief Staff and Marketing
Officer for North America and Corporate Vice President
(retired 2008) of Xerox Corporation (document manage-
ment products and services); Executive in Residence
and 2009–2010 Distinguished Minett Professor at
the Rochester Institute of Technology; Lead Director
of SPX FLOW, Inc. (multi-industry manufacturing);
Director of the United Way of Rochester, the
University of Rochester Medical Center, Monroe
Community College Foundation, North Carolina
A&T University, and Roberts Wesleyan College.
Rajiv L. Gupta
Born 1945. Trustee Since December 2001.2 Principal
Occupation(s) During the Past Five Years and Other
Experience: Chairman and Chief Executive Officer
(retired 2009) and President (2006–2008) of Rohm
and Haas Co. (chemicals); Director of Arconic Inc.
(diversified manufacturer), HP Inc. (printer and personal
computer manufacturing), and Delphi Automotive plc
(automotive components); Senior Advisor at New
Mountain Capital.
Amy Gutmann
Born 1949. Trustee Since June 2006. Principal
Occupation(s) During the Past Five Years and Other
Experience: President of the University of Pennsylvania;
Christopher H. Browne Distinguished Professor of
Political Science, School of Arts and Sciences, and
Professor of Communication, Annenberg School for
Communication, with secondary faculty appointments
in the Department of Philosophy, School of Arts and
Sciences, and at the Graduate School of Education,
University of Pennsylvania; Trustee of the National
Constitution Center; Chair of the Presidential
Commission for the Study of Bioethical Issues.
JoAnn Heffernan Heisen
Born 1950. Trustee Since July 1998. Principal
Occupation(s) During the Past Five Years and Other
Experience: Corporate Vice President and Member of
the Executive Committee (1997–2008), Chief Global
Diversity Officer (retired 2008), Vice President and
Chief Information Officer (1997–2005), Controller
(1995–1997), Treasurer (1991–1995), and Assistant
Treasurer (1989–1991) of Johnson & Johnson
(pharmaceuticals/medical devices/consumer products);
Director of Skytop Lodge Corporation (hotels) and the
Robert Wood Johnson Foundation; Member of the
Advisory Board of the Institute for Women’s Leadership
at Rutgers University.
F. Joseph Loughrey
Born 1949. Trustee Since October 2009. Principal
Occupation(s) During the Past Five Years and Other
Experience: President and Chief Operating Officer
(retired 2009) of Cummins Inc. (industrial machinery);
Chairman of the Board of Hillenbrand, Inc. (specialized
consumer services), Oxfam America, and the Lumina
Foundation for Education; Director of SKF AB
(industrial machinery), Hyster-Yale Materials Handling,
Inc. (forklift trucks), and the V Foundation for Cancer
Research; Member of the Advisory Council for the
College of Arts and Letters and Chair of the Advisory
Board to the Kellogg Institute for International Studies,
both at the University of Notre Dame.
Mark Loughridge
Born 1953. Trustee Since March 2012. Principal
Occupation(s) During the Past Five Years and Other
Experience: Senior Vice President and Chief Financial
Officer (retired 2013) at IBM (information technology
services); Fiduciary Member of IBM’s Retirement Plan
Committee (2004–2013); Director of the Dow Chemical
Company; Member of the Council on Chicago Booth.
Scott C. Malpass
Born 1962. Trustee Since March 2012. Principal
Occupation(s) During the Past Five Years and Other
Experience: Chief Investment Officer and Vice
President at the University of Notre Dame; Assistant
Professor of Finance at the Mendoza College of
Business at Notre Dame; Member of the Notre Dame
403(b) Investment Committee, the Board of Advisors
for Spruceview Capital Partners, and the Investment
Advisory Committee of Major League Baseball; Board
Member of TIFF Advisory Services, Inc., and Catholic
Investment Services, Inc. (investment advisors);
Member of the Board of Superintendence of the
Institute for the Works of Religion.
André F. Perold
Born 1952. Trustee Since December 2004.
Principal Occupation(s) During the Past Five Years
and Other Experience: George Gund Professor
of Finance and Banking, Emeritus at the Harvard
Business School (retired 2011); Chief Investment
Officer and Co-Managing Partner of HighVista
Strategies LLC (private investment firm);
Overseer of the Museum of Fine Arts Boston.
Peter F. Volanakis
Born 1955. Trustee Since July 2009. Principal
Occupation(s) During the Past Five Years and Other
Experience: President and Chief Operating Officer
(retired 2010) of Corning Incorporated (communications
equipment); Chairman of the Board of Trustees of
Colby-Sawyer College; Member of the Board of
Hypertherm, Inc. (industrial cutting systems,
software, and consumables).
Executive Officers
Glenn Booraem
Born 1967. Investment Stewardship Officer Since
February 2017. Principal Occupation(s) During the
Past Five Years and Other Experience: Principal of
The Vanguard Group, Inc.; Treasurer (2015–2017),
Controller (2010–2015), and Assistant Controller
(2001–2010) of each of the investment companies
served by The Vanguard Group.
Thomas J. Higgins
Born 1957. Chief Financial Officer Since September
2008. Principal Occupation(s) During the Past Five
Years and Other Experience: Principal of The Vanguard
Group, Inc.; Chief Financial Officer of each of the
investment companies served by The Vanguard Group;
Treasurer of each of the investment companies served
by The Vanguard Group (1998–2008).
Peter Mahoney
Born 1974. Controller Since May 2015. Principal
Occupation(s) During the Past Five Years and Other
Experience: Principal of The Vanguard Group, Inc.;
Controller of each of the investment companies served
by The Vanguard Group; Head of International Fund
Services at The Vanguard Group (2008–2014).
Anne E. Robinson
Born 1970. Secretary Since September 2016. Principal
Occupation(s) During the Past Five Years and Other
Experience: Managing Director of The Vanguard Group,
Inc.; General Counsel of The Vanguard Group; Secretary
of The Vanguard Group and of each of the investment
companies served by The Vanguard Group; Director
and Senior Vice President of Vanguard Marketing
Corporation; Managing Director and General Counsel
of Global Cards and Consumer Services at Citigroup
(2014–2016); Counsel at American Express
(2003–2014).
Michael Rollings
Born 1963. Treasurer Since February 2017. Principal
Occupation(s) During the Past Five Years and Other
Experience: Managing Director of The Vanguard Group,
Inc.; Treasurer of each of the investment companies
served by The Vanguard Group; Executive Vice
President and Chief Financial Officer of MassMutual
Financial Group (2006–2016).
Vanguard Senior Management Team
Mortimer J. Buckley James M. Norris
John James Thomas M. Rampulla
Martha G. King Glenn W. Reed
John T. Marcante Karin A. Risi
Chris D. McIsaac
Chairman Emeritus and Senior Advisor
John J. Brennan
Chairman, 1996–2009
Chief Executive Officer and President, 1996–2008
Founder
John C. Bogle
Chairman and Chief Executive Officer, 1974–1996
1 Mr. McNabb is considered an “interested person,” as defined in the Investment Company Act of 1940, because he is an officer of the Vanguard funds.
2 December 2002 for Vanguard Equity Income Fund, the Vanguard Municipal Bond Funds, and the Vanguard State Tax-Exempt Funds.
P.O. Box 2600
Valley Forge, PA 19482-2600
Connect with Vanguard® > vanguard.com
Fund Information > 800-662-7447
Direct Investor Account Services > 800-662-2739
Institutional Investor Services > 800-523-1036
Text Telephone for PeopleWho Are Deaf or Hard of Hearing > 800-749-7273
This material may be used in conjunctionwith the offering of shares of any Vanguardfund only if preceded or accompanied bythe fund’s current prospectus.
All comparative mutual fund data are from Lipper, aThomson Reuters Company, or Morningstar, Inc., unlessotherwise noted.
You can obtain a free copy of Vanguard’s proxy votingguidelines by visiting vanguard.com/proxyreporting or bycalling Vanguard at 800-662-2739. The guidelines arealso available from the SEC’s website, sec.gov. Inaddition, you may obtain a free report on how your fundvoted the proxies for securities it owned during the 12months ended June 30. To get the report, visit eithervanguard.com/proxyreporting or sec.gov.
You can review and copy information about your fund atthe SEC’s Public Reference Room in Washington, D.C. Tofind out more about this public service, call the SEC at202-551-8090. Information about your fund is alsoavailable on the SEC’s website, and you can receivecopies of this information, for a fee, by sending arequest in either of two ways: via email addressed [email protected] or via regular mail addressed to thePublic Reference Section, Securities and ExchangeCommission, Washington, DC 20549-1520.
London Stock Exchange Group companies include FTSEInternational Limited (”FTSE”), Frank Russell Company(”Russell”), MTS Next Limited (”MTS”), and FTSE TMXGlobal Debt Capital Markets Inc. (”FTSE TMX”). Allrights reserved. ”FTSE®”, ”Russell®”, ”MTS®”, ”FTSETMX®” and ”FTSE Russell” and other service marksand trademarks related to the FTSE or Russell indexesare trademarks of the London Stock Exchange Groupcompanies and are used by FTSE, MTS, FTSE TMX andRussell under licence. All information is provided forinformation purposes only. No responsibility or liabilitycan be accepted by the London Stock Exchange Groupcompanies nor its licensors for any errors or for anyloss from use of this publication. Neither the LondonStock Exchange Group companies nor any of itslicensors make any claim, prediction, warranty orrepresentation whatsoever, expressly or impliedly,either as to the results to be obtained from the use ofthe FTSE Indexes or the fitness or suitability of theIndexes for any particular purpose to which they mightbe put.
© 2017 The Vanguard Group, Inc.All rights reserved.Vanguard Marketing Corporation, Distributor.
Q6232 062017