variation in fusarium andaustrian wheat breeding … · variation in fusarium head...
TRANSCRIPT

(Aus dem Insti~ut für Pflanzenbau und Pflanzenzüchtung der Universität für Bodenkultur.WIen, Vorstand: em. o. Univ.-Prof. Dipl.-Ing. Dr. P.Ruckenbauer)
Variation in Fusarium head blight susceptibility of internationaland Austrian wheat breeding material!
By M. LEMMENS, H. BÜRSTMAYR and P. RUCKENBAUER
(With 3 Figures)
Summary
International and Austrian Triticum aestivum L. and Triticum durum Desf,genotypes were investigated on their head blight sensitivity after artificial inoculation with one Fusarium culmorum and two Fusariutti graminearum inocula.The spread of the disease was evaluated four to five times, The area under thedisease progressing curve (AUDPC) was calculated and standardized (SAUDPC) ..Determination of relative ear weight and relative grain yield compared to uninoculated controls were carried out. The analyses of the data of these field parameters revealed the presence of significant quantitative differences in head blightsusceptibility among the investigated genotypes (means of the SAUDPC of thevarieties ranging from 0.10 (high sensitivity) up to 0..74 (low sensitivity) with LSD5 % = 0.06). All Triticum dumm genotypes were very susceptible. 'Significantinteractions occurred between genotypes and isolates. The correlation betweenthe visual evaluation data at the 14t h day after inoculation and SAUDPC was- 0.95. Highly significant correlations were also detected between the data forSAUDPC and relative yield (r=0.75) and between the data of relative ear weightand relative yield (r=0~91) (for all r: P<O.l%). Significant correlations werefound between the field data of the individual inocula.
Key-words: Fusarium, head blight, wheat, resistance breeding.
Zusammenfassung
Ein internationales (25 Prüfglieder) und ein österreichisches (47 Prüfglieder)Sortiment von Winterweizen- (Triticum aestivum La) und Durumweizen- (Triticum durum Desf.) Genotypen wurden nach künstlicher Inokulation mit einemFusarium culmorum und zwei Fusarium graminearum Inokula auf Toleranzgegen Ährenfusariose geprüft. Die Ausbreitung der Krankheit wurde vier- bisfünfmal bonitiert und die Fläche unter der knankheitsverlaufenden Kurve(AUDPC) berechnet und standardisiert (SAUDPC). Neben diesen Parametern
1 This project has been financed by the Ministry of Agriculture and Forestry, Austria(Forschungsprojekt Nr. L687/91)..
65

zur Erfassung der Fusarienresistenz ermittelte man durch den Vergleich mit denunbehandelten Kontrollen das relative Ährengewicht (REW) und den relativenKornertrag (RY) aller Prüfglieder. Die Analyse der Daten dieser Merkmalesignifikante quantitative Differenzen in der Anfälligkeit der Weizengenotypen auf.Die SAUDPC variierte von 0.10 (hochanfällig) bis 0.74 (wenig anfällig), bei einerGrenzdifferenz von P<5 % = 0.06. Alle Durumweizen-Genotypen waren sehranfällig. Zwischen den Genotypen und den verwendeten Isolaten konntenkante Wechselwirkungen gefunden werden. Die signifikanten Korrelationen zwischen den visuellen Bonituren am 14. nach der Inokulation und den Flächender krankheitsverlaufenden Kurve betrugen im Durchschnitt - 0.95. Zwischenden Daten dieser Kurven (SAUDPC) und den relativen Kornerträgen (RY) konntensignifikante Korrelationen gefunden werden 0.75); das ebenfalls für dieBeziehungen zwischen den relativen Ährengewichten (REW) und den relativenKornerträgen (RY), r=0.91. Auch zwischen den Daten aus unterschiedlichen Inokulum-Behandlungen waren hohe Korrelationen feststellbar .
Schlüsselworte: Fusarium, Ährenfusariose, Weizen, Resistenzzüchtung.
1. Introduction
An increase in the incidence of Fusarium head blight (scab) on wheat has beenobserved during the last years in Austria. One of the major reasons is the increasing part of wheat cultivation in the crop rotation, combined with cropping ofmaize and intensive nitrogen application (ZWATZ 1987). Nine different Fusariumspecies have been isolated from wheat in Austria: F. culrnorum, F. aoenaceum, F.graminearum, F. poae, F. equiseti, F. sambucinum; Gerlachia nivalis, F. oxysporum and F. solanaceum (ADLER et a1. 1990, ZWATZ 1987). The most importantpathogens of head blight of wheat are Fusarium graminearum (ADLER et al, 1990)and Fusarium culmorum (ZWATZ 1987).
Infestation of the ear has several consequences: 1. yield reduction, 2. starch,proteins and cell walls of infected are destroyed causing reduction of bak-
quality, 3. infestation of the embryo leading to reduction of seed quality and4. produetion of mycotoxins (ZWATZ 1987, MIEDANER and WALTHER 1987). SeveralFusarium spp. produce mycotoxins which have toxic effects on humans and domestic anirnals, Fusarium culmorum and Fusariurri graminearum are the mainproducers of deoxynivalenoI (DON, vomitoxin) on wheat et al, 1990,MILLER and GREENHALGH 1988). DON belongs to the class of trichothecenes B.Biochemically, trichothecenes, including DON, are Inhibitors of protein and DNAsynthesis. DON affects the immunesystem of animals (WORLD HEALTH ORGANIZATION 1990). Decreased feed intake and weight gain, vomiting and feed refusal ofdomestic animals due to DON contamination of the fodder have been reported. Ithas been suggested that trichothecenes promote human esophageal carcinogenesis (Luo et al. 1990). Fusarium culmorutti and Fusarium graminearum also produce zearalenon which has an oestrogenie mode of action on animals. The presence of Fusarium. texins- in naturally contaminated wheat in Austria has beendemonstrated (APLER etal, 1990).
At present thepossibikties for chemical control of head blight are Iimited,because an effective fungicide is not available, The above mentioned Fusariurnspp.are polyphageous and attack wheat as weIl as other important crops (ZWATZ1987). Headblight and .the production of rnycotoxins can possibly be controlledby cultivation of resistant wheat varieties. A wide range of resistance amongwheat genotypes has been observed (MIELKE 1988, SAUR :L99l, SNIJDERS 1990 a,ZWATZ 1987, 1988). Although highly resistant varieties such as "Nobeokabozu"
66

(Japan), "Sumey-3" (China) and "Frontana" (Brazil) have been described (TEICH1989, ZHONG and MILLER 1987, MESTERHAZY 1989), complete resistance was notfound (NAITO et aL 1984, MIELKE 1988). Several mechanisms for genetic resistancehave been reported (TEICH 1989). A cultivar may be resistant to Initial infection,to hyphal spread and/or to the mycotoxins. The number of genes governingresistance varies from 2 to 3 (3 dominant genes in cultivar "Shinchunaga": Nakag~wa 1955; 2 to 3 genes in cultivar "Sumey-3": ZHOU et aL 1987) up to 6 (in 10 SVPwinter wheat cultivars: SNIJDERS 1990b) and more (polygenie; GOCHO 1985, Gu1983). Several reports demonstrated that resistant varieties can be used successfully in breeding programmes to improve head blight resistance (MESTERHAZY1987, 1989, TOMASOVIC 1989, ZHOU et al. 1987).
Based on the data described above, it was decided to start a Fusarium resistance breeding programme in cooperation with Austrian breeders to improve thehead blight resistance of their breeding materiaL In this article the first resultsare presented. Austrian and international Triticum aestivum and Triticumdumm breeding lines were tested for head blight resistance after artificial inoculation with Austrian Fusarium isolates.
2. Material and Methods
2.1 Wheat breeding material
In 1990 research institutes from five European countries (Hungary, The Netherlands, France, Germany and Austria) formed a winter wheat nursery of 25 Triticum aestivum genotypes (five genotypes per country) which were tested ineach country. In Austria this material was sown in 10 m2 plots at the experimental station in Groß-Enzersdorf near Vienna.
For the evaluation of the level of resistance of the national breeding material, 40Austrian wheat breeding genotypes (23winter Triticum aestivum and 17 Triticumdururn) as weIl as seven control varieties (commercial Austrian varieties) wereinvestigated. Theywere cultivated in 10 to 15 m- plots in Probstdorf near Vienna,
All data presented originate from field trials in 1991.
2.2 Production o f single spore isolates
Fusarium isolates were obtained as described (NELSON et al. 1986) from visiblyinfected wheat kernels harvested in Austria in 1990. Single spore isolates wereobtained as folIows: sterile water drops were put on a sterile cover glass. Dilutionof a Fusarium suspension was performed by dipping the point of a sterile needlein a droplet containing Fusarium suspension and transferring part of thissuspension to the next sterile water droplet. This procedure was repeated untilthe last drop contained one macroconidium as controlled with a microscope. Alldrops but the last one were disinfected with ethanol (95 0/0) and the cover glasswas incubated upside down on potato dextrose agar (20 gr/l) at 25°C. The isolates were identified according to NELSON et al. (1986). The identity of the isolateswas confirmed by Dr. MESTERHAZY (Cereal Research Institute, Szeged, Hungary).
2.3 Production o f inoculum
The required amount of inoculum for the experiments was prepared with thebubble breeding method (MESTERHAZY 1977). A liquid modified Czapek-Doxmedium (up to 10 1) was inoculated with the desired Fusarium isolate and continuously aerated with sterile air. After one week at room temperature, the suspension was homogenized with a blender (10 s) and was ready for use.
67

2.4 Determination o f the number of colony forming units/ml
Inocula were diluted (1 : 10 to 1: 100000) and 1 ml was plated out in Petri-dishes(diameter 15 cm) filled with Nash-Snyder-PCNB medium (NELSON et al. 1986) inthree replications. After three days at 25 0 C the colony forming units werecounted.
(1)
2.5 The Petri-dish test
The Petri-dish test (MESTERHAZY 1978, 1984) was carried out to 1) find outwhether the inocula used in the field tests are pathogenic and 2) determine thevirulences of these inocula. Filter paper was laid out in Petri-dishes and 8 rnl ofinoculum was added. Twenty five seeds per wheat genetype were placed withtheir embryo upwards on the paper. The dishes were incubated in the dark at25 "C, On the 2nd day after inoculation the number of germinated kernels wascounted, and this number was taken as the control (100 0/0). Frorn the 3rd up to the6th day the number of healthy seedlings was daily counted and expressed as fraction of the control.
Data processing was carried out as foliows. The percentage of healthy seedlings was plotted against the days after inoculation. The data were connectedwith straight lines and the area (X) under the curve from the 2nd day to the 6th daywas calculated and standardized according to formula (1).
SA = X % x day - 50 °/0 x day400 % xday - 50 % x day
SA =standardized area,x= area under the curve (in %x day) ,50 = area under the curve if all seedlings were diseased at the 3th day after inoculation (in
e x day),400 =area under the curve when all seedlings would remain healthy (in % x day).
The SA varies from 0 to 1: a low SA indicates a high virulence of the inoculum.
2.6 Properties of the inocula used in the field experiments
Inocula were prepared from three different single spore isolates (see table 1):Fusarium graminearum nr. 91031 and 91047 (isolated from Triticum durum kernels) and Fusarium culmorum nr. 91401 (from Triticum aestivum). The numberof colony forming units/rnl was determined as described above. An assortment of30 different Austrian commercial wheatvarieties was used to determine the virulence of the inocula applicated in the field tests. This was carried out with thePetri-dish test as described before. The mean of the SA values for the 30 varieties was taken as a measure for the virulence of an inoculum. The virulence ofthe inocula was tested before and after the field inoculation period and proved toremain constant during this period.
Table 1
Characteristics 0/ the inocula 0/ Fusariurn culmorum and Fusariutri graminearum,describeä by source, colony jorming units and virulence
Isolatenumber
Inoculum Fusarium.number species Source
Colonyformingunits/ml
Virulencebefore and afterfield inoculation
910319104791401
123
F.gram.F. gram.F. culm.
T. durumT. durumT. aestivum
54 X 104
69 X 104
138 X 104
0.610.060.66
0.650.080.67
68
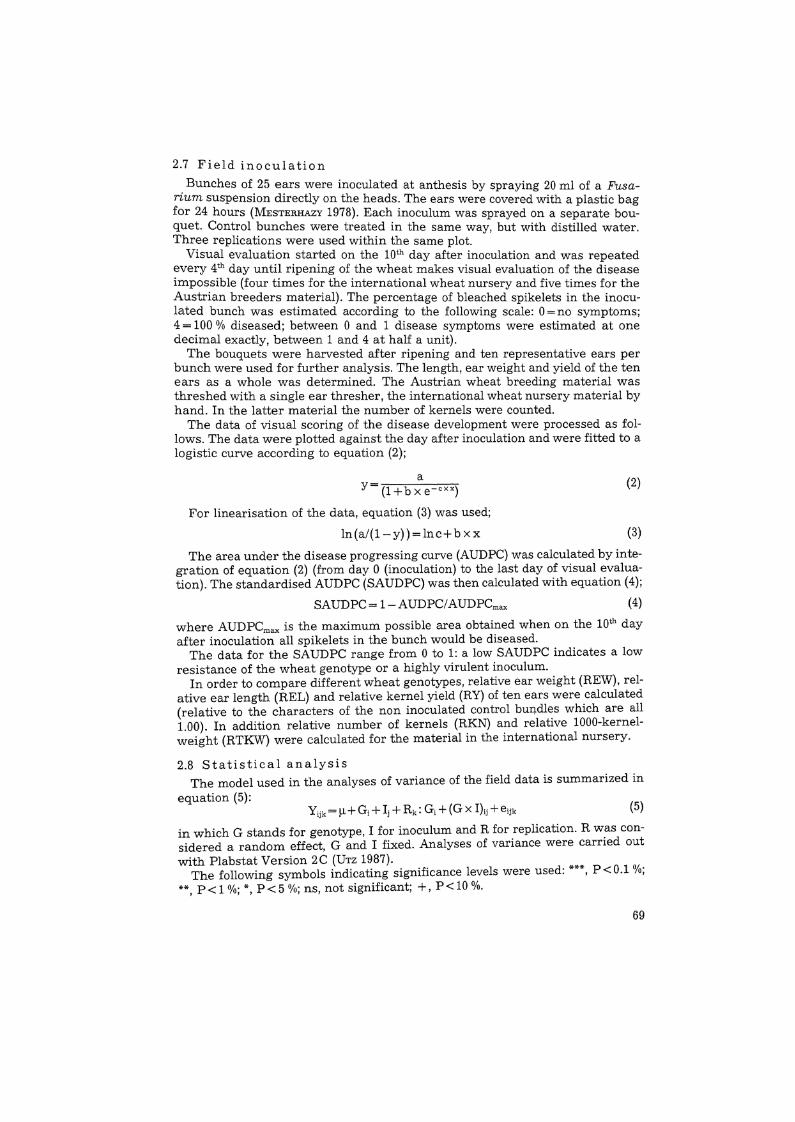
2.7 Field inoculation
Bunches of 25 ears were inoculated at anthesis by spraying 20 ml of a Fusarium suspension directly on the heads. The ears were covered with a plastic bagfor 24 hours (MESTERHAZY 1978). Each inoculum was sprayed on a separate bouquet. Control bunches were treated in the same way, but with distilled water.Three replications were used within the same plot.
Visual evaluation started on the 10th day after inoculation and was repeatedevery 4t h day until ripening of the wheat makes visual evaluation of the diseaseimpossible (four times for the international wheat nursery and five times for theAustrian breeders material). The percentage of bleached spikelets in the inoculated bunch was estimated according to the following scale: 0 = no symptoms;4 = 100 % diseased; between 0 and 1 disease symptoms were estimated at onedecimal exactly, between 1 and 4 at half a unit).
The bouquets were harvested after ripening and ten representative ears perbunch were used for further analysis. The length, ear weight and yield of the tenears as a whole was determined. The Austrian wheat breeding material wasthreshed with a single ear thresher, the international wheat nursery material byhand, In the latter material the number of kernels were counted.
The data of visual scoring of the disease development were processed as follows. The data were plotted against the day after inoculation and were fitted to alogistic curve according to equation (2);
(2)ay= (1+b x e- C X X)
For linearisation of the data, equation (3) was used;
ln(a/(l-y»=lnc+bxx (3)
The area under the disease progressing curve (AUDPC) was calculated by integration of equation (2) (from day 0 (inoculation) to the last day of visual evaluation). The standardised AUDPC (SAUDPC) was then calculated with equation (4);
SAUDPC= l-AUDPC/AUDPCmax (4)
where AUDPCmax is the maximum possible area obtained when on the 10th dayafter inoculation all spikelets in the bunch would be diseased.
The data for the SAUDPC range from 0 to 1: a low SAUDPC indicates a lowresistance of the wheat genotype or a highly virulent inoculum.
In order to compare different wheat genotypes, relative ear weight (REW), relative ear length (REL) and relative kernel yield (RY) of ten ears were calculated(relative to the characters of the non inoculated control bundlas which are all1.00). In addition relative number of kernels (RKN) and relative 1000-kernelweight (RTKW) were calculated for the material in the international nursery.
Yiik=J.L+Gi+Ij+Rk: Gi+(Gx I)ij (5)
in which G stands for genotype, I for inoculum and R for replication. R was considered a random effect, G and I fixed, Analyses of variance were carried outwith Plabstat Version 2C (UTZ 1987).
The following symbols indicating significance levels were used: ***, P< 0.1 0/0;**, P< 1 °/0; *', P< 5 0/0; ns, not significant; +, P< 10 %.
2.8 Statistical analysisThe model used in the analyses of variance of the field data is summarized in
equation (5):
69

List 01AbbreviationsA:AUDPC:DON:F:G:Ge:H:I:N:PCNB:R:REL:REW:RKN:RTKW:RY:SA:SAUDPC:
Austriaarea under the disease progressing curvedeoxynivalenolFrancegenotypeGermanyHungaryisolateThe Netherlandspentachloronitrobenzenereplicationrelative ear lengthrelative ear weightrelative kernel numberrelative 1000-kernel-weightrelative kernel yieldstandardized areastandardized area under the disease progressing curve
3. Results
3.1 International wheat nursery
The spread of head blight disease in artificially inoculated bunches is illustrated in fig. 1 with two examples of winter wheat genotypes with different resistance. Für the genotype Bence the percentage of diseased spikelets for inoculum1 at the 14th day after inoculation was about 5 % (fig. lA) while it was 50 % in thecase of the variety SL 8/80-28 (fig. 1B). All three inocula were pathogenic and different in their virulence as shown by their virulence order 2> 3> 1 for both genotypes.
The infestation score (SAUDPC) of the field trials with the three inocula andthe results of the analysis of variance are illustrated in table 2. Significant differences were detected between the wheat genotypes. The best genotypes wereBence, Arina and 81 F 3 79. The investigated Austrian genotypes showed moderate (NR 172/90) to high sensitivity (SL 8/80-28). A significant interaction occurredbetween genotypes and isolates. This effect was however small in comparison
o 0o 2 4 6 8 10 22
dayafterinoculation
LINE SL8/80-28100
CI) 3.5~15 80
~ 15~ :s:.
"0.. 8 2,5 60 "Ci.(/) (f)
i cn im ~ 40
(f)
CI) 1,5 !Cf) :>15 15~
20~
0,5
0 00 2 4 6 8 1'0 1'2 14 1'6 1'8 20 22
day afterinoculation
20
60
80
0.5
1"
~§ 2.5
~:5 1,5
VARIETY BENCE
3.5-
--- lnoculum 1 Inoculum2 lnoculum3 --- inecuium 1 lnoculum 2 -*-- lnoculum3
1: Spread oj head blight symptoms in the genotype Bence (jig. JA) and the genotypeSL8/80-28 (fig. 1B) after artijicial inoculation with three isolates
70

Table 2
Data and analysis 0/ variance table JOT SAUDPC data 0/ the international wheat nursery.The genotypes were sorted in descending order 0/ resistance. The country 0/ origin 0/ thegenotype is indicated between brackets. 1) mean oj three replications; 2) overall mean oj
three replications and three inocula
SAUDPCInoculum
Genotype
BENCE (H) 0.90 0.66 0.68 0.75ARINA(N) 0.79 0.61 0.69 0.7081 F3 79 (F) 0.88 0.56 0.67 0.7082 F3 28 (F) 0.88 0.52 0.67 0.69SVP 75059-28 (N) 0.83 0.55 0.66 0.68SVP 72017-17 (N) 0.81 0.52 0.58 0.6485-92 (H) 0.76 0.51 0.61 0.62204/81/03 (Ge) 0.71 0.59 0.57 0.6225/83/02 (Ge) 0.74 0.44 0.65 0.61SVP 72005-20 (N) 0.77 0.52 0.54 0.61NR 172/90 (A) 0.75 0.50 0.56 0.60SGV/GT-Pdj*Ohr (H) 0.73 0.48 0.55 0.59P4?.71.88 (A) 0.74 0.41 0.57 0.58SZOKE (H) 0.73 0.48 0.50 0.57COPAIN (F) 0.76 0.41 0.54 0.5747/83/02 (Ge) 0.72 0.43 0.53 0.56RC 103 (F) 0.73 0.41 0.48 0.54163/81/01 (Ge) 0.76 0.34 0.44 0.51P2119.89 (A) 0.75 0.37 0.36 0.49SL 34/81-21 (A) 0.72 0.34 0.35 0.4777/82/01 (Ge) 0.68 0.35 0.35 0.46SVP 75059-32 (N) 0.58 0.28 0.41 0.42ZOMBOR(H) 0.50 0.29 0.35 0.38RESCLER (F) 0.55 0.24 0.28 0.36SL 8/80-28 (A) 0.60 0.15 0.20 0.32
Mean 0.73 0.44 0.51 0.56
Analysis of Variance TableSource DF SS MS F LSD5 DF-DN
G 24 2.72 0.113 25.05** 0.06 50I 2 3.56 1.789 454.47** 0.02 100R:G 50 0.23 0.005 1.16ns 0.10 100I*G 48 0.38 0.008 2.01** 0.10 100REST 100 0.39 0.004TOTAL 224 7.27
with the effects of genotype and isolate. The field virulences of the inocula weresignificantly different (LSD 5 = 0.02) and was the highest for inoculum 2, the lowest for inoculum 1.
A summary of the results as weIl as of the analysis of variance of the otherfield parameters are presented in table 3.. Significant differences between wheatgenotypes and between inocula were found for all parameters tested except forrelative ear length (results not shown). This parameter was apparently not influenced by the disease. Significant differences between replications within thegenotypes for the REW, RY, RKN and REL (result not shown) were detected. Significant interactions between genotype and isolate occurred for the relativevalues of kernel yield, kernel number and 1000 kernel weight, but the effect issmall in each case.
71
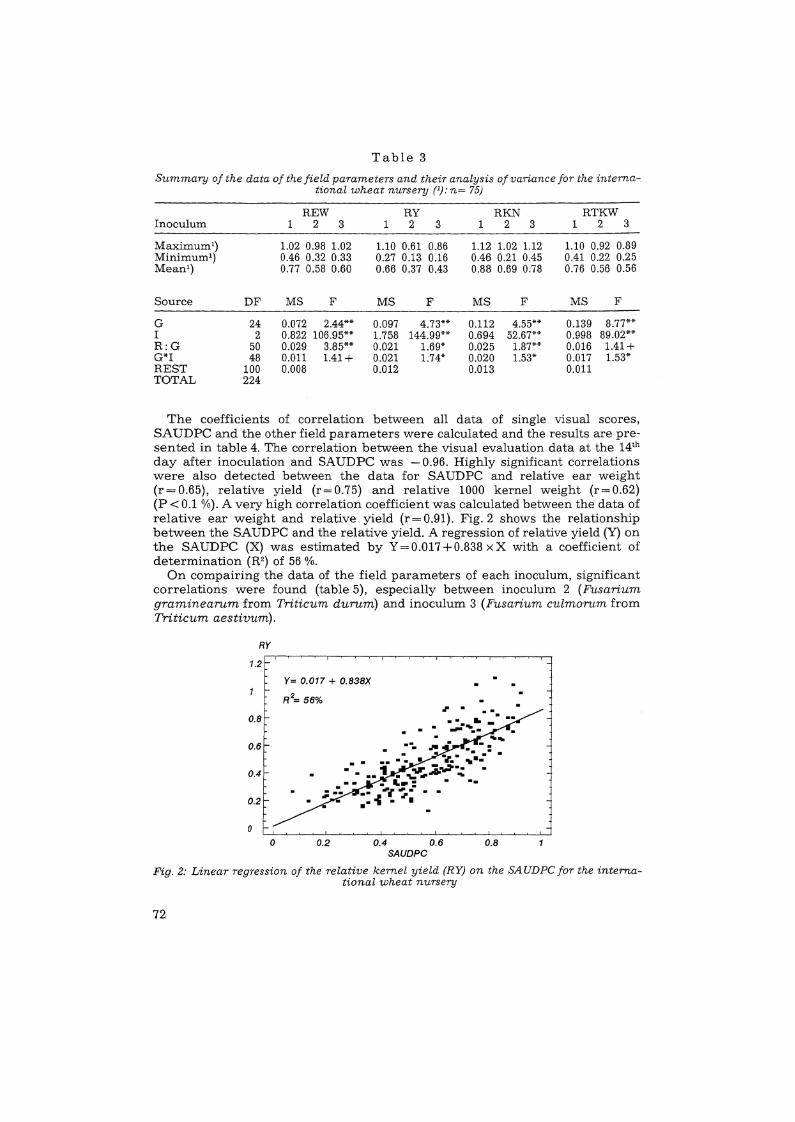
Table 3
Summary 0/ the data of the field parameters and their analysis 0/ variance for the international wheat nursery (1): n= 75)
REW RY RKN RTKWInoculum 1 2 3 1 2 3 1 2 3 1 2 3
Maximum') 1.02 0.98 1.02 1.10 0.61 0.86 1.12 1.02 1.12 1.10 0.92 0.89Minimum-) 0.46 0.32 0.33 0.27 0.13 0.16 0.46 0.21 0.45 0.41 0.22 0.25Mean1) 0.77 0.58 0.60 0.66 0.37 0.43 0.88 0.69 0.78 0.76 0.56 0.56
Source DF MS F MS F MS F MS F
G 24 0.072 2.44** 0.097 4.73** 0.112 4.55** 0.139 8.77**I 2 0.822 106.95** 1.758 144.99** 0.694 52.67** 0.998 89.02**R:G 50 0.029 3.85** 0.021 1.69* 0.025 1.87** 0.016 1.41+G*I 48 0.011 1.41+ 0.021 1.74* 0.020 1.53* 0.017 1.53*REST 100 0.008 0.012 0.013 0.011TOTAL 224
The coefficients of correlation between all data of single visual scores,SAUDPC and the other field parameters were calculated and the results are presented in table 4. The correlation between the visual evaluation data at the 14th
day after inoculation and SAUDPC was - 0.96. Highly significant correlationswere also detected between the data for SAUDPC and relative ear weight(r=0.65), relative yield (r=0.75) and relative 1000 kernel weight (r=0.62)(P< 0.1 0/0). A very high correlation coefficient was calculated between the data ofrelative ear weight and relative yield (r=O.91). Fig.2 shows the relationshipbetween the SAUDPC and the relative yield. A regression of relative yield (Y) onthe SAUDPC (X) was estimated by Y= 0.017 +0.838 x X with a coefficient ofdetermination (R2) of 56 %.
On compairing the data of the field parameters of each inoculum, significantcorrelations were found (table 5), especially between inoculum 2 (Fusariumgraminearum from Triticum durum) and inoculum 3 (Fusarium culmorum fromTriticum aestivum).
RY
1.2
Y= 0.017 + 0.838X
R2=56%
r1' •0.8
0.6
0.4
0.2
o
. . .......,. :.. .. - .•• 1 "t1I" "..,;:i'.. •.. ........ ...•• • IL.: ••
•• .Pt~·•. -c. •
o 0.2 0.4 0.6 0.8SAUDPC
Fig.2: Linear regression 0/ the relative kernet yield (RY) on the SAUDPC for the international wheat nursery
72

Table 4
Table 0/ correlations between the data 0/ single visual scores (VS), SA UDPC and other jieldparameters in the experiment 0/ the international wheat nursery. For all correlation coeffi
cients P< 0.1 % except between RTKW and RKN
VS 14 VS 18 VS 22 SAUDPC REW RY RKN RTKW
VSlO 0.83 0.71 0.63 -0.90 -0.54 -0.64 -0.52 -0.45VS14 0.86 0.79 -0.96 -0.62 -0.73 -0.45 -0.62VS 18 0.88 -0.91 -0.65 -0.72 -0.39 -0.64VS22 -0.84 -0.65 -0.71 -0.34 -0.66SAUDPC 0.65 0.75 0.48 0.62REW 0.91 0.55 0.75RY 0.65 0.79RKN 0.08 ns
Table 5
Results 0/ a correlatioti analysis between the data 0/ the field parameters 0/ the international nursery jor the individual inocula
InoculaSAUDPC1 2
REW1 2
RY2
RTKW1 2
23
0.63*** 0.55*** 0.28* 0.41***0.74*** 0.73*** 0.51*** 0.72*** 0.38*** 0.62*** 0.51*** 0.64***
3.2 Austrian wheat breeding material
The means of the SAUDPC and other field parameters as well as the results ofthe analysis of variance for SAUDPC are summarized in table 6. A large variability in head blight sensitivity was present with the mean of the SAUDPC rangingfrom 0.83 for the genotype WW2 down to 0.18 in the case of DW10 (LSD5=0.06).
Some genotypes were significantly better than the best standard Martin. All Triticum dumm genotypes were very susceptible. Significant differences betweenthe replications and a significant genotype-isolate interaction occurred in thisexperiment. The field virulencies of the inocula were significantly different(LSD5 = 0.01). The order of the virulence of the inocula was identical to the onefound for the international wheat nursery.
Table 6
Summary oj the data for SAUDPC, REYV: and RY and analysis oj variance table forSA UDPC oj the Austrian wheat breeding material. The Triticum aestivum (WVV) and Triticum durum (DVVJ genotypes teere separated and sorted in descending order 0/ resistance.Martin, Perlo, Capo, Bonadur, Grandur, Goldur and Astrodur are commercial Austrianvarieties used as standard, 1) mean oj three replications, 2) overall mean 0/ three replica-
tions and three isolates
SAUDPC REW RYInoculum
Genotype 11) 21) 31) Mean-) Mean-) Mean")
WW2 0.90 0.78 0.80 0.83 0.76 0.74WW3 0.96 0.68 0.70 0.78 0.71 0.58WW1 0.81 0.64 0.74 0.73 0.69 0.59WW7 (MARTIN) 0.84 0.64 0.65 0.71 0.60 0.46WW24 0.84 0.63 0.66 0.71 0.57 0.39WW6 (PERLO) 0.83 0.55 0.67 0.68 0.62 0.53WW5 0.78 0.57 0.64 0.66 0.56 0.43WW20 0.78 0.49 0.55 0.61 0.50 0.34
73

InoculumMean")Genotype 11) 21) 31) Mean2) Mean")
WW4 0.76 0.43 0.62 0.60 0.56 0.44
WW8 (CAPO) 0.71 0.50 0.52 0.57 0.48 0.31
WW23 0.81 0.44 0.47 0.57 0.63 0.54WW25 0.74 0.44 0.52 0.57 0.66 0.52WW10 0.73 0.44 0.51 0.56 0.65 0.46WW9 0.73 0.47 0.47 0.55 0.53 0.36WW14 0.64 0.49 0.47 0.53 0.41 0.21WW18 0.64 0.43 0.48 0.52 0.46 0.24WW16 0.63 0.41 0.49 0.51 0.44 0.25WW21 0.65 0.46 0.43 0.51 0.54 0.33WW22 0.69 0.41 0.44 0.51 0.62 0.44WW11 0.61 0.40 0.46 0.49 0.54 0.38WW13 0.59 0.40 0.48 0.49 0.41 0.27WW12 0.58 0.36 0.44 0.46 0.40 0.22WW17 0.55 0.33 0.42 0.43 0.51 0.36WW19 0.53 0.32 0.42 0.42 0.59 0.45WW26 0.65 0.21 0.36 0.41 0.43 0.28WW15 0.53 0.29 0.36 0.39 0.34 0.15
DW18 0.64 0.38 0.37 0.47 0.52 0.34DW15 0.56 0.33 0.36 0.42 0.54 0.35DW 12 (BONADUR) 0.58 0.29 0.37 0.41 0.44 0.27DW14 0.61 0.32 0.27 0.40 0.46 0.31DW19 (GRANDUR) 0.55 0.24 0.33 0.37 0.36 0.16DW5 0.63 0.22 0.27 0.37 0.40 0.24DW11 0.51 0.27 0.29 0.36 0.36 0.24DWI 0.54 0.20 0.30 0.35 0.50 0.35DW7 0.57 0.14 0.32 0.34 0.52 0.32DW13 0.51 0.21 0.23 0.32 0.38 0.21DW4 0.54 0.20 0.19 0.31 0.41 0.24DW20 0.62 0.09 0.13 0.28 0.46 0.25DW16 0.46 0.19 0.21 0.28 0.38 0.13DW17 0.47 0.08 0.25 0.27 0.47 0.19DW6 0.48 0.10 0.19 0.25 0.41 0.21DW9 0.40 0.15 0.13 0.22 0.36 0.14DW2 (GOLDUR) 0.43 0.09 0.11 0.21 0.42 0.20DW8 0.43 0.03 0.17 0.21 0.39 0.14DW21 0.45 0.06 0.11 0.20 0.31 0.13DW3 (A8TRODUR) 0.35 0.09 0.17 0.20 0.34 0.15DW10 0.29 0.07 0.18 0.18 0.33 0.10
Mean 0.62 0.34 0.40 0.45 0.49 0.32
Analysis of variance tableSource DF 58 M8 F L8D5 DF-DN
G 46 11.55 0.251 3.83** 0.06 94I 2 6.20 3.101 1182.61** 0.01 186R:W 94 0.44 0.005 1.78** 0.08 186G*I 92 0.79 0.009 3.27** 0.08 186REST 186 0.49 0.003TOTAL 420 19.47
A summary of the data and the results of the analyses of variance of the otherfield parameters is presented in table 7. Differences between wheat genotypes,between inocula and between replications were significant for all parameterstested except for relative ear length. In the latter case no significant differencesbetween genotypes were detected. A significant but small G*I interactionoccurred for the RY and for REW.
74

Table 7
Summary 01 the d~ta 01.the field parameters and of the analysis oj variance of theseparameters for the imuestiqated Austrian wheat breeding material, 1) n= 138; 47 genotypes
x 3 replications - 3 missing values
REL REW RYInoculum 2 3 1 2 3 1 2 3
Maximum") 1.23 1.24 1.20 1.13 0.88 0.91 1.09 0.86 0.85Minimum') 0.86 0.90 0.82 0.31 0.20 0.18 0.09 0.02 0.03Meari') 1.01 1.02 1.01 0.59 0.42 0.45 0.44 0.23 0.28
Source DF MS F MS F MS F
G 46 0.011 1.20 ns 0.110 6.59** 0.184 11.95**I 2 0.008 3.62* 1.081 215.66** 1.651 232.61**R:W 94 0.009 4.27** 0.017 3.34** 0.015 2.16**G*I 92 0.003 1.28+ 0.009 1.69** 0.013 1.86**REST 185 0.002 0.005 0.007TOTAL 419
REW
1.2Y =0.24 + 0.78X
R2 = 91%
0.8
0.6
0.4
0.2
0
0 0.2 0.4 0.6RY
•• rtfIl
0.8 1.2
Fig. 3: Regression oj the data of REW on RY for Austriare wheat breeding genotypes
Table 8
Table of correlation analysis between the data 01 single visual scores (VS), SAUDPC andother field parameters for the Austriart wheat breeding material. For all correlation coeffi
cients P< 0.1 %
VS 14 VS 18 VS 22 VS 26 SAUDPC REW RY
VS 10 0.82 0.70 0.61 0.57 -0.88 -0.59 -0.63VS 14 0.90 0.80 0.72 -0.95 -0.73 -0.78VS 18 0.90 0.82 -0.93 -0.76 -0.81VS 22 0.90 -0.88 -0.72 -0.76VS 26 -0.82 -0.67 -0.70SAUDPC 0.76 0.80REW 0.96
The correlations between single visual evaluation data and SAUDPC as well asfield parameters were calculated and the results are presented in table 8. Highcorrelation coefficients were detected between the data für SAUDPC and relative
75
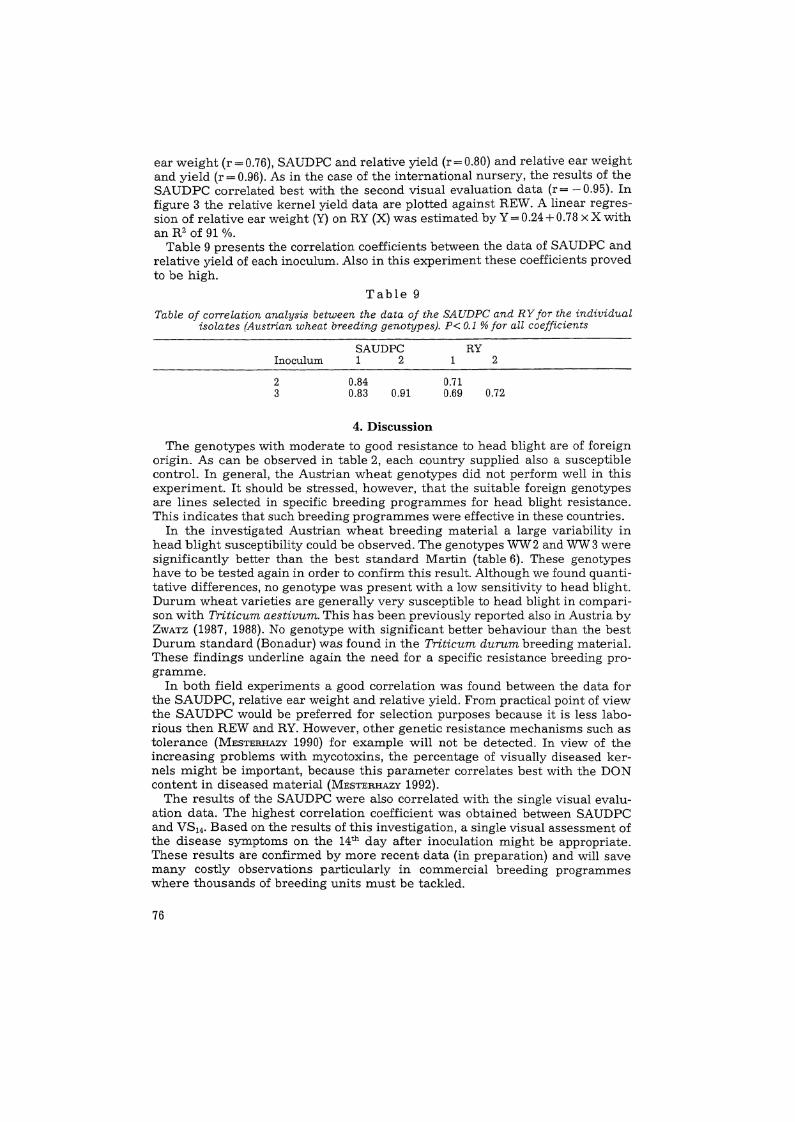
ear weight (r=O.76), SAUDPC and relative yield (r=0.80) and relative ear weightand yield (r = 0.96). As in the case of the international nursery, the results of theSAUDPC correlated best with the second visual evaluation data (r = - 0.95). Infigure 3 the relative kerne1yield data are plotted against REW. A linear regression of relative ear weight (Y) on RY (X) was estimated by Y = 0.24+0.78 x X withan R2 of 91 0/0.
Table 9 presents the correlation coefficients between the data of SAUDPC andrelative yield of each inoculum. Also in this experiment these coefficients provedto be high.
Table 9
Table 0/ correlation analysis between the data 01 the SAUDPC and RY for the individualisolates (Austrian wheat breeding genotypes). P< 0.1 % jor all coejjicients
InoculumSAUDPC1 2
RY2
23
0.840.83 0.91
0.710.69 0.72
4. Discussion
The genotypes with moderate to good resistance to head blight are of foreignorigin. As can be observed in table 2, each country supplied also a susceptiblecontroL In general, the Austrian wheat genotypes did not perform well in thisexperiment. It should be stressed, however, that the suitable foreign genotypesare lines selected in specific breeding programmes for head blight resistance.This indicates that such breeding programmes were effective in these countries.
In the investigated Austrian wheat breeding material a large variability inhead blight susceptibility could be observed. The genotypes WW2 and WW3 weresignificantly better than the best standard Martin (table 6). These genotypeshave to be tested again in order to confirm this result. Although we found quantitative differences, no genotype was present with a low sensitivity to head blight.Durum wheat varieties are generally very susceptible to head blight in comparison with Triticum aestivum. This has been previously reported also in Austria byZWATZ (1987, 1988). No genotype with significant better behaviour than the bestDurum standard (Bonadur) was found in the Triticumtiurum. breeding material.These findings underline again the need for a specific resistance breeding programme.
In both field experiments a good correlation was found between the data forthe SAUDPC, relative ear weight and relative yield. From practical point of viewthe SAUDPC would be preferred for selection purposes because it is less laborious then REW and RY. However, other genetic resistance mechanisms such astolerance (MESTERHAZY 1990) for example will not be detected. In view of theincreasing problems with mycotoxins, the percentage of visually diseased kernels might be important, because this parameter correlates best with the DONcontent in diseased material (MESTERHAZY 1992).
The results of the SAUDPC were also correlated with the single visual evaluation data. The highest correlation coefficient was obtained between SAUDPCand VS14• Based on the results of this investigation, a single visual assessment ofthe disease symptoms on the 14t h day after inoculation might be appropriate.These results are confirmed by more recentdata (in preparation) and will savemany costly observations particularly in commercial breeding programmeswhere thousands of breeding units must be tackled.
76

The inocula used in the field experiments showed variation in the field virulences. The disease reaction of wheat genotypes depends on the aggressiveness ofthe inocula used for infection. No differences between genotypes will be detectedat very low or at very high virulence level. In the first case no or only slight disease symptoms would be observed, in the latter case all genotypes would be completely diseased. Therefore inocula with different aggressiveness were used inthe head blight tests. Inoculum 2 was the most aggressive while inoculum 1induced the weakest head blight symptoms. If we examine the data more closely,it is observed that this sequence does not remain constant for each individualgenotype. An example is DW 14 in table 6. Such inversions explain the significantgenotype*isolate interaction. This interaction has been described before. It is,however, not stable and therefore no indication for race specific resistance(MESTERHAZY 1983a, SNIJDERS et al. 1991). The use of different inocula provides amore accurate estimate of the head blight resistance.
The severities of the disease reaction of the wheat genotypes to different Fusariuni spp. are correlated. A genotype which was more sensitive to Fusariumculmorum was also more susceptible to Fusarium graminearum. This observation has been reported previously (MESTERHAZY 1983b, 1987). Selection for headblight resistance against one species resulted also in an increase of resistanceagainst those Fusarium spp. not involved in the programme. The genetic background for head blight resistance to different Fusarium spp. is presumably identical. As a consequence a breeding programme for head blight resistance can besimplified. Using one or two of the most common Austrian head blight causingspecies should be sufficient in resistance tests!
As mentioned above, no genotype was present in the investigated native breeding material with a low sensitivity to head blight. A next step in the Fusariumresistance breeding programme would be the introduction of more resistantmaterial. Such lines (Nobeokabozu, Sumey-3, Frontana) have been collected,were sown and tested as described. Their outstanding (but not complete) resistance has been confirmed by our results. These varieties will be used in thebreeding programme planned for future activities.
AcknowledgementsWe like to thank Dr. A. MESTERHAZY for the identification of the Fusarium isolates, his cri
tical remarks and interesting discussions. We are also grateful to Miss A. BLAIMAUER andMr. E. VAVRA for their technical assistance.
ReferencesADLER, A., H. LEW and W. EDLINGER, 1990: Vorkommen und Toxigenität von Fusarien auf
Getreide und Mais aus Österreich. Bodenkultur 41, 145-152.GOCHO, H., 1985: Wheat breeding for scab resistance. Wheat Information Service 60,4l.Gu, J. Q., 1983: Study of the genetics of resistance of wheat scab. Scientia Agricultura
Sinica 6, 61-64.Luo, Y., T. YOSHIZAWA and T. KATAYAMA, 1990: Comparative Study on the Natural Occurrence
of Fusarium Mycotoxins (Trichothecenes and Zearalenone) in Corn and Wheat fromHigh- and Low-Risk Areas for Human Esophageal Cancer in China. Applied and Environmental Microbiology 56, 3723-3726.
MESTERHAZY, A., 1977: Analysis of symptoms caused by Fusarium graminearum Schwa andits relation to powdery mildew infection in wheat. Acta Phytopathologica AcademiaeScientiarum Hungaricae 12, 289-30l.
MEsTERHAZY, A., 1978: Comparative analysis of artificial inoculation methods with Fusariumspp. on winter wheat varieties. Phytopath. Z. 93, 12-25.
MESTERHAZY, A., 1983 a: Importance of the isolate-genotype interaction in resistance tests withnecrotrophic pathogens. Tag.-Ber., Akad. Landwirtsch.-Wiss. DDR, Berlin 216,561-566.
MESTERHAZY, A., 1983 b: Breeding wheat for resistance to Fusarium graminearum and Fusarium culmorum. Z. Pflanzenzüchtung 91, 295-311.
77
MESTERHAZY, A., 1984: A labo~atory method to predict pathogenicity of Fus.arium graminearum in field and resistance to wheat scab. Acta Phytopath. Acad. SCl. Hung. 19,
MES~,8Ä.., 1987:Selection of head blight resistant wheats through improved seedlingresistance. Plant Breeding 98, 29-36.
MESTERHAZY, A., 1989:Progress in b~eeding of w~eat and corn genotypes .n?t ~usceptible t~infection by Fusaria. In "Fusarium, mycotoxins, taxonomy, pathogenicity . ChelkowsklJ Ed. Elsevier Amsterdam pp. 357-386.
MES~RHAZY,A., 1990:Factors of resistance to wheat s?~b. In "Second European Semir:a:- 0;:;Fusarium, Mycotoxins, Taxonomy, Pathogenicity and Alternarie Metabolitres ,Poznan, Poland. Ed. Szebictko K. . . ....
MESTERHAZY A. 1992:Resistance, pathogenlclty and Fusarium. spp. influencing toxin (DON)contamination of wheat varieties. In "Third European Seminar. Fusarium, Mycotoxins,Taxonomy, Pathogenicity and Host Resistance". Eds. Arseniuk E. and Goral T., Radzi-kow, Poland,
MIEDANER, T. and H. WALTHER, 1987: Ermittlung der Fusarium-Resistenz von Weizen imÄhrenstadium. Zeitschrift für Pflanzenkrankheiten und Pflanzenschutz 337-347.
MIELKE H. 1988: Untersuchungen über Fusarium. culmorum (W. G. Sm.) Sacc. Fuß- undÄh~enkrankheitserregerbeim Weizen. Mitteilungen aus der Biologischen Bundesanstalt für Land- und Forstwirtschaft. Berlin-Dahlern. Heft 238. Kommissionsverlag PaulParey, Berlin und Harnburg.
MILLER J. D. and R. GREENHALGH, 1988: Metabolites of Fungal Pathogens and Plant Resista~ce. In "Biotechnology for Crop rotation", Eds. Hedin P. A., Menn J. J. and Hollingworth R. M., 117-129.
NAITO, H., S. MOGI, H. GOCHO and T. HlRAI, 1984: A Simple Method for Evaluation of VarietalResistance to Scab Caused by Gibberella Zeae Petch in Wheat. Bull. Kyushu Natl.Agric, Exp. Stn. 23, 355-386.
NAKAGAWA, M. 0., 1955:Genetic factors affecting ear scab resistance of wheat plants. JapanJ. Breeding 5, 32-38.
NELSON, P. E., T. A. TOUSSOUN and W. F. O. MAMSAS, 1986: Fusarium Species: an illustratedmanual for identification. Pennsylv, State Univ. Press. University Park and London.
SAUR, L., 1991: Recherche de geniteurs de resistance a la fusariose de l'epi causee par Fusariuni culmorum chez le ble et les especes voisines. Agronomie 11, 535-541.
SNIJDERS, C. H. A., 1990a: Genetic variation for resistance to Fusarium head blight in breadwheat. Euphytica 50,171-179.
SNIJDERS, C. H. A., 1990b: The inheritance of resistance to head blight caused by Fusariumculmorum in winter wheat. Euphytica 50, 9-17.
SNIJDERS, C. H. A. and F. A. VAN EEUWIJK, 1991: Genotype x strain interactions for resistanceto Fusarium head blight caused by Fusariurn culmorum. in winter wheat. Theor. Appl.Genet. 81, 239-244.
TEICH, A. H., 1989: Epidemiology of wheat (Triticum aestivum L.) scab caused by Fusariu.mspp. In "Fusarium Mycotoxins, Taxonomy and Pathogenicity" Ed. Chelkowski J. Elsevier Amsterdarn, 269-282.
TOMASOVIC, S., 1989:Wheat breeding for resistance to Fusarium diseases, especially to Fusariuni graminearum Schw. Wheat information Service 69, 13-17.
UTZ, H. F., 1987: Plabstat, a computer program for statistical analysis of plant breedingexperiments. Inst. f. Pflanzenztg. Saatgutforsch. u. Populationsgenetik. Univ, Hohenheim.
WORLD HEALTH ORGANlZATION, 1990: Environmental Health Criteria 105. Selected Mycotoxins: Ochratoxins, Trichothecenes, Ergot. World Health Organization, Geneva. 263 pp.
ZHONG, W. Y. and MILLER, J. D., 1987: Screening Techniques and Sources of Resistance toFusariutri Head Blight. In "Wheat Production Constraints in Tropical Environments".Proceedings of the International Conference, Chiang Mai, Thailand. Eds. Hettel, G.and J. Keyser, 239-.250.
ZHOU, C., S. XIA, C. QIAN, G. YAO and J. SHEN, 1987: On the Problem of Wheat Breeding forScab Resistanee. Scientia Agricultura Sinica 20, 19-25.
ZWATZ, B., 1987:Ahrenfusariose an Weizen - Bemerkungen und Untersuchungen. Der Förderungsdienst 11, 331-333.
ZWATZ,'B., 1988: Ahrenfusariose an Sommerweizen. Pflanzenschutz, 4, 2-3.
(Manuskript eingelangt am 16. November 1992, angenommen am 18. Jänner 1993)
Anschrift der Verfasser:Dr. Mare LEMMENS, Univ.-Ass. Dipl.-Ing. Herman BÜRSTMAYR und o. Univ.-Prof. Dr. PeterRUCKENBAUER, Institut für Pflanzenbau und Pflanzenzüchtung, Universität für Bodenkultur
Gregor-Mendel-Straße 33, A-1180 Wien '
78