vega-lite: a grammar of interactive graphics · vega-lite: a grammar of interactive graphics arvind...
TRANSCRIPT
Vega-Lite: A Grammar of Interactive GraphicsArvind Satyanarayan, Dominik Moritz, Kanit Wongsuphasawat, and Jeffrey Heer
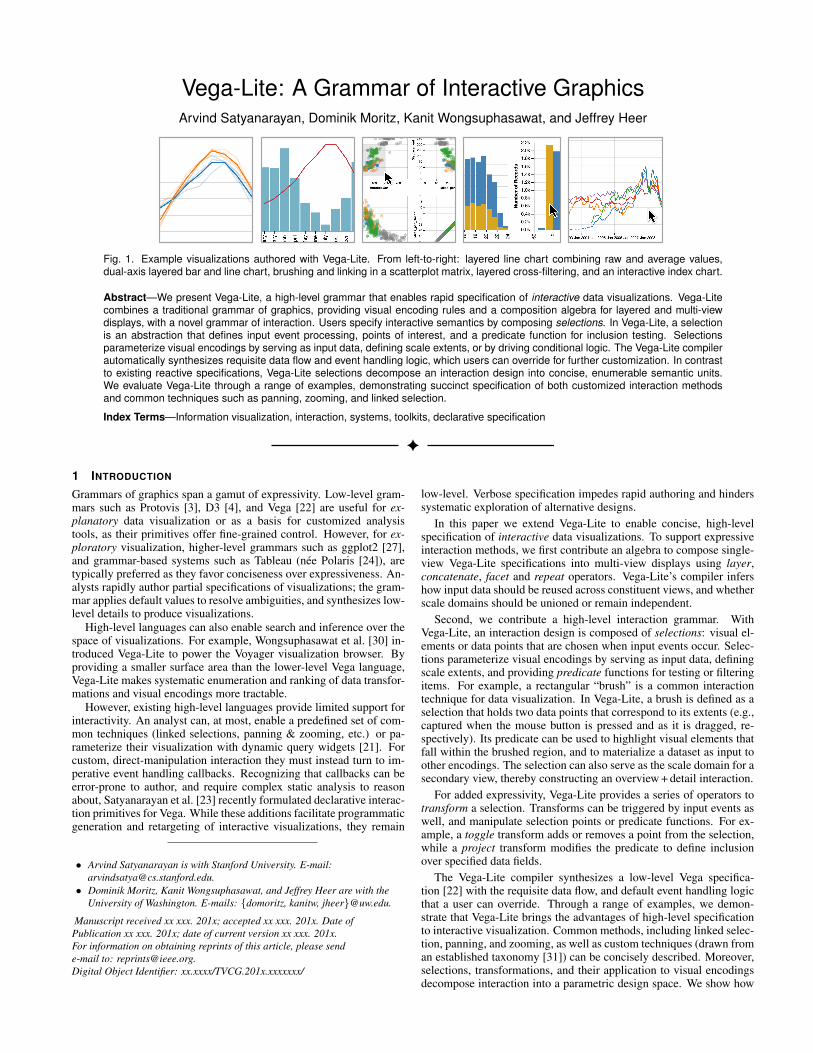
Fig. 1. Example visualizations authored with Vega-Lite. From left-to-right: layered line chart combining raw and average values,dual-axis layered bar and line chart, brushing and linking in a scatterplot matrix, layered cross-filtering, and an interactive index chart.
Abstract—We present Vega-Lite, a high-level grammar that enables rapid specification of interactive data visualizations. Vega-Litecombines a traditional grammar of graphics, providing visual encoding rules and a composition algebra for layered and multi-viewdisplays, with a novel grammar of interaction. Users specify interactive semantics by composing selections. In Vega-Lite, a selectionis an abstraction that defines input event processing, points of interest, and a predicate function for inclusion testing. Selectionsparameterize visual encodings by serving as input data, defining scale extents, or by driving conditional logic. The Vega-Lite compilerautomatically synthesizes requisite data flow and event handling logic, which users can override for further customization. In contrastto existing reactive specifications, Vega-Lite selections decompose an interaction design into concise, enumerable semantic units.We evaluate Vega-Lite through a range of examples, demonstrating succinct specification of both customized interaction methodsand common techniques such as panning, zooming, and linked selection.
Index Terms—Information visualization, interaction, systems, toolkits, declarative specification
1 INTRODUCTION
Grammars of graphics span a gamut of expressivity. Low-level gram-mars such as Protovis [3], D3 [4], and Vega [22] are useful for ex-planatory data visualization or as a basis for customized analysistools, as their primitives offer fine-grained control. However, for ex-ploratory visualization, higher-level grammars such as ggplot2 [27],and grammar-based systems such as Tableau (nee Polaris [24]), aretypically preferred as they favor conciseness over expressiveness. An-alysts rapidly author partial specifications of visualizations; the gram-mar applies default values to resolve ambiguities, and synthesizes low-level details to produce visualizations.
High-level languages can also enable search and inference over thespace of visualizations. For example, Wongsuphasawat et al. [30] in-troduced Vega-Lite to power the Voyager visualization browser. Byproviding a smaller surface area than the lower-level Vega language,Vega-Lite makes systematic enumeration and ranking of data transfor-mations and visual encodings more tractable.
However, existing high-level languages provide limited support forinteractivity. An analyst can, at most, enable a predefined set of com-mon techniques (linked selections, panning & zooming, etc.) or pa-rameterize their visualization with dynamic query widgets [21]. Forcustom, direct-manipulation interaction they must instead turn to im-perative event handling callbacks. Recognizing that callbacks can beerror-prone to author, and require complex static analysis to reasonabout, Satyanarayan et al. [23] recently formulated declarative interac-tion primitives for Vega. While these additions facilitate programmaticgeneration and retargeting of interactive visualizations, they remain
• Arvind Satyanarayan is with Stanford University. E-mail:[email protected].
• Dominik Moritz, Kanit Wongsuphasawat, and Jeffrey Heer are with theUniversity of Washington. E-mails: {domoritz, kanitw, jheer}@uw.edu.
Manuscript received xx xxx. 201x; accepted xx xxx. 201x. Date ofPublication xx xxx. 201x; date of current version xx xxx. 201x.For information on obtaining reprints of this article, please sende-mail to: [email protected] Object Identifier: xx.xxxx/TVCG.201x.xxxxxxx/
low-level. Verbose specification impedes rapid authoring and hinderssystematic exploration of alternative designs.
In this paper we extend Vega-Lite to enable concise, high-levelspecification of interactive data visualizations. To support expressiveinteraction methods, we first contribute an algebra to compose single-view Vega-Lite specifications into multi-view displays using layer,concatenate, facet and repeat operators. Vega-Lite’s compiler infershow input data should be reused across constituent views, and whetherscale domains should be unioned or remain independent.
Second, we contribute a high-level interaction grammar. WithVega-Lite, an interaction design is composed of selections: visual el-ements or data points that are chosen when input events occur. Selec-tions parameterize visual encodings by serving as input data, definingscale extents, and providing predicate functions for testing or filteringitems. For example, a rectangular “brush” is a common interactiontechnique for data visualization. In Vega-Lite, a brush is defined as aselection that holds two data points that correspond to its extents (e.g.,captured when the mouse button is pressed and as it is dragged, re-spectively). Its predicate can be used to highlight visual elements thatfall within the brushed region, and to materialize a dataset as input toother encodings. The selection can also serve as the scale domain for asecondary view, thereby constructing an overview + detail interaction.
For added expressivity, Vega-Lite provides a series of operators totransform a selection. Transforms can be triggered by input events aswell, and manipulate selection points or predicate functions. For ex-ample, a toggle transform adds or removes a point from the selection,while a project transform modifies the predicate to define inclusionover specified data fields.
The Vega-Lite compiler synthesizes a low-level Vega specifica-tion [22] with the requisite data flow, and default event handling logicthat a user can override. Through a range of examples, we demon-strate that Vega-Lite brings the advantages of high-level specificationto interactive visualization. Common methods, including linked selec-tion, panning, and zooming, as well as custom techniques (drawn froman established taxonomy [31]) can be concisely described. Moreover,selections, transformations, and their application to visual encodingsdecompose interaction into a parametric design space. We show how
each of these parameters can be systematically varied to generate al-ternate interaction techniques for a given set of visual encodings. Suchenumeration can be useful to explore alternative designs, and can aidhigher-level reasoning about interaction — for example, recommend-ing suitable interaction techniques as part of a design tool.
2 RELATED WORK
Vega-Lite builds on prior work on grammars of graphics, visualizationsystems, and techniques for interactive selection and querying.
2.1 Grammar-Based Visual EncodingSince the initial publication of Wilkinson’s The Grammar of Graph-ics [29] in 1999, formal grammars for statistical graphics have grownincreasingly popular as a way to succinctly specify visualizations.Wilkinson’s work was quickly followed by the Stanford Polaris sys-tem [24], later commercialized as Tableau. Hadley Wickham’s popularggplot2 [27] and ggvis [20] packages implement variants of Wilkin-son’s model in the R statistical language. These tools eschew charttemplates, which offer limited means of customization, in favor ofcombinatorial building blocks. Abstracting data models, graphicalmarks, visual encoding channels, scales and guides (i.e., axes and leg-ends) yields a more expressive design space, and allows analysts torapidly construct graphics for exploratory analysis [13]. Concise spec-ification is achieved in part through ambiguity: users may omit detailssuch as scale transforms (e.g., linear or log) or color palettes, whichare then filled in using a rule-based system of smart defaults. Moreexpressive lower-level (and thus more verbose) grammars, includingthose of Protovis [3], D3 [4], and Vega [22], have been widely usedfor creating explanatory and highly-customized graphics.
The design of Vega-Lite is heavily influenced by these works.Drawing from Wilkinson’s grammar and Polaris/Tableau, Vega-Litesimilarly represents basic plots using a set of encoding definitions thatmap data attributes to visual channels such as position, color, shape,and size, and may include common data transformations such as bin-ning, aggregation, sorting, and filtering. Drawing from Vega, Vega-Lite uses a portable JSON (JavaScript Object Notation) syntax thatpermits generation from a variety of programming languages. Vega-Lite specifications are compiled to full Vega specifications, hence theexpressive gamut of Vega-Lite is a strict subset of that of Vega. As wewill later demonstrate, Vega-Lite sacrifices some expressiveness fordramatic gains in the conciseness and clarity of specification.
In terms of visual encoding, Vega-Lite differs most from other high-level grammars in its approach to multiple view displays. Each ofthese grammars supports faceting (or nesting) to construct trellis plotsin which each cell similarly visualizes a different partition of the data.Both Wilkinson’s grammar and Polaris/Tableau achieve this through atable algebra over data fields, which in turn determines spatial sub-divisions. Tableau additionally supports the construction of multi-view dashboards via a different mechanism, with each view backedby a separate specification. In contrast, we contribute a view alge-bra: starting with unit specifications that define a single plot, Vega-Lite expresses composite views using operators for layering, horizon-tal or vertical concatenation, faceting, and parameterized repetition.When applicable, these operators will merge scale domains and prop-erly align constituent views. Disparate views can also be combinedinto arbitrary dashboards, all within a unified algebraic model.
2.2 Specifying Interactions in Visualization SystemsDespite the central role of interaction in effective data visualization[13, 19], little work has been done to develop a grammar for specify-ing interaction techniques. Wilkinson’s grammar includes no notionof interaction. Tableau supports common interaction techniques, butrelies on mechanisms external to the visual encoding grammar. Earlysystems like GGobi [25] support common techniques as well, and pro-vide imperative APIs for custom methods. However, such APIs makeeasy tasks needlessly complex, burdening developers with learninglow-level execution details. More recent systems, including Protovis,D3, and VisDock [7], offer a typology of common techniques that canbe applied to a visualization. Such top-down approaches, however,
limit customization and composition. For example, D3’s interactorsencapsulate event processing, making it difficult to combine them iftheir events conflict (e.g., if dragging triggers brushing and panning).
The prior work perhaps most closely related to Vega-Lite is the Re-active Vega language [23]. Reactive Vega draws on Functional Reac-tive Programming techniques to formulate composable, declarative in-teraction primitives for data visualization. Reactive Vega models inputevents as continuous data streams. To succinctly define event streamsof interest, Vega employs an event selector syntax, which Vega-Litealso uses for customized event logic. Event streams, in turn, drivedynamic variables called signals. Signals parameterize the remainderof the visualization specification, endowing it with reactive semantics.When a new event fires, it propagates to dependent signals; visual en-codings that use them are automatically re-evaluated and re-rendered.This reactive approach is not only capable of expressing a diverse setof interactions [23], it is performant as well [22], with interactive per-formance at least twice as fast as the equivalent D3 program.
However, the resulting reactive specifications are low-level and ver-bose. Specifying common techniques can be time-consuming, requir-ing tens of lines of JSON, and it is difficult to know how to adapttechniques in pursuit of alternative designs. In contrast, Vega-Lite isa higher-level specification language, with primitives that decomposeinteraction design into a parametric space. Common methods requiretypically 1-2 lines of code, and design variations can be explored bysystematically enumerating defined properties. Nevertheless, Reac-tive Vega provides a performant runtime and an “assembly language”to which Vega-Lite specifications are compiled.
2.3 Interactive Selection and QueryingSelection, often in the form of users clicking or lassoing visual itemsof interest, is a fundamental operation in user interfaces and hasbeen well-studied in the context of data visualization. For example,in Snap-Together Visualization [17], multiple views are coordinatedvia “primary-” and “foreign-key actions,” which propagate selecteddata tuples from one view to the others. Wilhelm [28] describes theneed for such “indirect object manipulation” methods as an axiomof interactive data displays. Chen’s compound brushing [6] providesa visual dataflow language for specifying a rich space of transfor-mations of brush selections. More recently, Brunel [5] provides aspecial #selection data field that is dynamically populated withthe elements a user interacts with, and can be used to link multi-ple views or filter input data. Similarly, RStudio’s Shiny [21], animperative web application layer, provides brushedPoints andnearestPoints functions which can be used throughout an Rscript to operate on selected elements.
Other systems have studied formally representing selections as dataqueries [28]. For example, brushing interactions in VQE [9] generateextensional queries that enumerate all items of interest; a form-basedinterface enables specification of intensional (declarative) queries. In-dividual point and brush selections in DEVise [15], known as visualqueries, map to a declarative structure and are used to link togethermultiple views. With VIQING [18], rectangular “rubber band” selec-tions are modeled as range extents, and views can be dropped on topof each other to join their underlying datasets. Heer et al. [12] demon-strate that by modeling a selection as a declarative query, interactive“query relaxation” can successively capture more items of interest.
Vega-Lite builds on this work by richly integrating an interactiveselection abstraction with the primitives of visual encoding grammars.Vega-Lite selections are populated with one or more points of interest,in response to user interaction. Extensible predicate functions map se-lections to declarative queries, and allow a minimal set of “backing”points to represent the full space of selected points. Additional op-erators can transform a selection’s predicate or backing points (e.g.,offseting them to translate a brush selection or perform panning). Se-lections then parameterize visual encodings by serving as input data,defining scale extents, or using predicates to test or filter items. Theend result is an enumerable, combinatorial design space of interac-tive statistical graphics, with concise specification of not only linkinginteractions, but panning, zooming, and custom techniques as well.
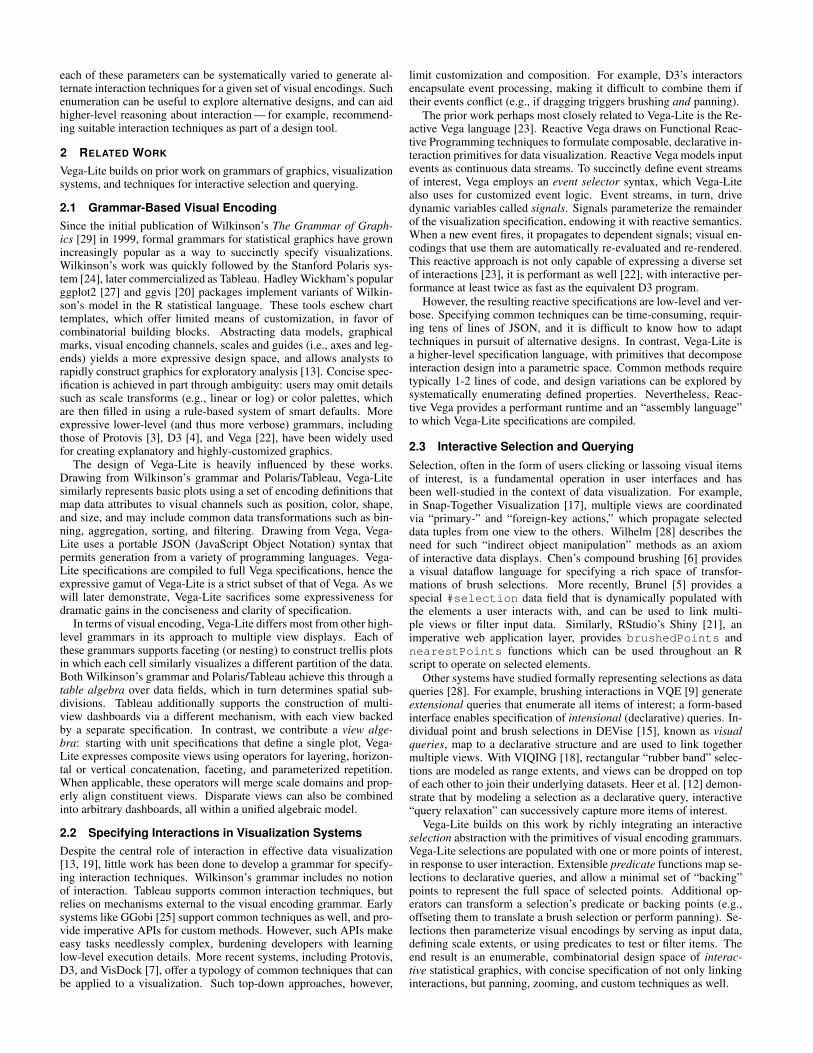
(b) Correlation between wind and temperature{ "data": { "url": "data/weather.csv", "formatType": "csv" }, "mark": "line", "encoding": { "x": { "field": "date", "type": "temporal", "timeUnit": "month" }, "y": { "field": "temp_max", "type": "quantitative", "aggregate": "mean" }, "color": { "field": "location", "type": "nominal" } } }
{ "data": { "url": "data/weather.csv", "formatType": "csv" }, "mark": "point", "encoding": { "x": { "field": "temp_max", "type": "quantitative", "bin": true }, "y": { "field": "wind", "type": "quantitative", "bin": true }, "size": { "field": "*", "aggregate": "count" }, "color": { "field": "location", "type": "nominal" } } }
{ "data": { "url": "data/weather.csv", "formatType": "csv" }, "mark": "bar", "encoding": { "x": { "field": "location", "type": "nominal" }, "y": { "field": "*", "type": "quantitative", "aggregate": "count" }, "color": { "field": "weather", "type": "nominal" } } }
(a) Line chart with aggregation (c) Stacked bar chart of weather types
Fig. 2. Vega-Lite unit specifications visualizing weather data. These examples demonstrate varied mark types and data transformations.
3 THE VEGA-LITE GRAMMAR OF GRAPHICS
Vega-Lite combines a grammar of graphics with a novel grammar ofinteraction. In this section, we describe Vega-Lite’s basic visual en-coding constructs and an algebra for view composition. In prior work,Wongsuphasawat et al. [30] introduced the simplest Vega-Lite speci-fication — here referred to as a unit specification — that defines a sin-gle Cartesian plot with a specific mark type to encode data (e.g., bars,lines, plotting symbols). Given multiple unit plots, we introduce layer,concat, facet, and repeat operators to provide an algebra for construct-ing composite views. This algebra can express layered plots, trellisplots, and arbitrary multiple view displays. Each operator is responsi-ble for combining or aligning underlying scales and axes as needed.
3.1 Unit SpecificationA unit specification describes a single Cartesian plot, with a backingdata set, a given mark-type, and a set of one or more encoding def-initions for visual channels such as position (x, y), color, size, etc.Formally, a unit view consists of a four-tuple:
unit := (data, transforms, mark-type, encodings)The data definition identifies a data source, a relational table con-
sisting of records (rows) with named attributes (columns). This data ta-ble can be subject to a set of transforms, including filtering and addingderived fields via formulas. The mark-type specifies the geometric ob-ject used to visually encode the data records. Legal values include bar,line, area, text, rule for reference lines, and plotting symbols (point &tick). The encodings determine how data attributes map to the proper-ties of visual marks. Formally, an encoding is a seven-tuple:encoding := (channel, field, data-type, value, functions, scale, guide)
Available visual encoding channels include spatial position (x, y),color, shape, size, and text. An order channel controls sorting ofstacked elements (e.g., for stacked bar charts and the layering order ofline charts). A path order channel determines the sequence in whichpoints of a line or area mark are connected to each other. A detailchannel includes additional group-by fields in aggregate plots.
The field string denotes a data attribute to visualize, along with agiven data-type (one of nominal, ordinal, quantitative or temporal).Alternatively, one can specify a constant literal value to serve as thedata field. The data field can additionally be transformed using func-tions such as binning, aggregation (sum, average, etc.), and sorting.
An encoding may also specify properties of a scale that maps fromthe data domain to a visual range, and a guide (axis or legend) forvisualizing the scale. If not specified, Vega-Lite will automaticallypopulate default properties based on the channel and data-type. For xand y channels, either a linear scale (for quantitative data) or an ordinalscale (for ordinal and nominal data) is instantiated, along with an axis.For color, size, and shape channels, suitable palettes and legends aregenerated. For example, quantitative color encodings use a single-hue luminance ramp, while nominal color encodings use a categoricalpalette with varied hues. Our default assignments largely follow themodel of prior systems [24, 30].
Unit specifications are capable of expressing a variety of com-mon, useful plots of both raw and aggregated data. Examples includebar charts, histograms, dot plots, scatter plots, line graphs, and areagraphs. Our formal definitions are instantiated in a JSON (JavaScriptObject Notation) syntax, as shown in Fig. 2.
3.2 View Composition AlgebraGiven multiple unit specifications, composite views can be created us-ing a set of composition operators. Here we describe the set of sup-ported operators. We use the term view to refer to any Vega-Lite spec-ification, whether it is a unit or composite specification.
3.2.1 LayerThe layer operator accepts multiple unit specifications to produce aview in which subsequent charts are plotted on top of each other. Forexample, a layered view could consist of one layer showing a his-togram of a full data set, and another overlaying a histogram of a fil-tered subset (Fig. 11). The signature of the operator is:
layer([unit1, unit2, ...], resolve)To create a layered view, we produce shared scales (if their types
match) and merge guides by default. For example, we compute theunion of the data domains for the x or y channel, for which we thengenerate a single scale. We believe this is a useful default for pro-ducing coherent and comparable layers. However, Vega-Lite can notenforce that a unioned domain is semantically meaningful. To prohibitlayering of composite views with incongruent internal structures, thelayer operator restricts its operands to be unit views.
To override the default behavior, users can specify strategies to re-solve scales and guides using tuples of the form (channel, scale|guide,
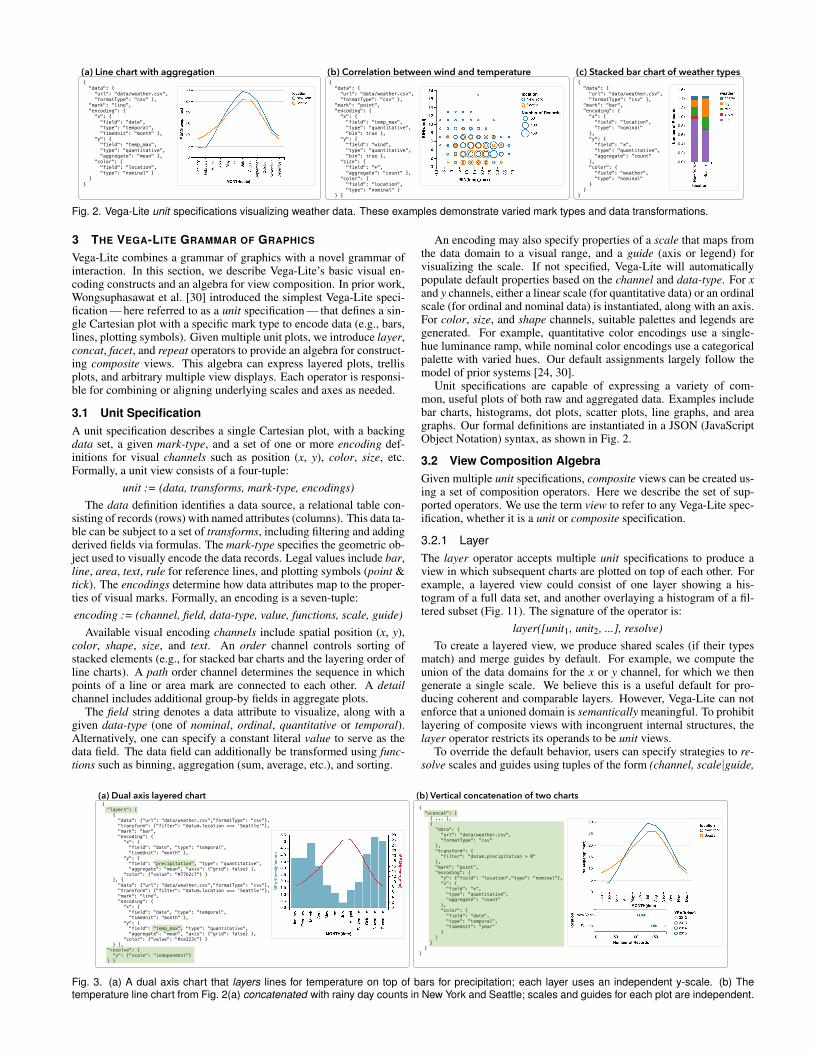
{ "layers": [ { "data": {"url": "data/weather.csv","formatType": "csv"}, "transform": {"filter": "datum.location === 'Seattle'"}, "mark": "bar", "encoding": { "x": { "field": "date", "type": "temporal", "timeUnit": "month" }, "y": { "field": "precipitation", "type": "quantitative", "aggregate": "mean", "axis": {"grid": false} }, "color": {"value": "#77b2c7"} } }, { "data": {"url": "data/weather.csv","formatType": "csv"}, "transform": {"filter": "datum.location === 'Seattle'"}, "mark": "line", "encoding": { "x": { "field": "date", "type": "temporal", "timeUnit": "month" }, "y": { "field": "temp_max", "type": "quantitative", "aggregate": "mean", "axis": {"grid": false} }, "color": {"value": "#ce323c"} } } ], "resolve": { "y": {"scale": "independent"} } }
(a) Dual axis layered chart{ "vconcat": [ { ... }, { "data": { "url": "data/weather.csv", "formatType": "csv" }, "transform": { "filter": "datum.precipitation > 0" }, "mark": "point", "encoding": { "y": {"field": "location","type": "nominal"}, "x": { "field": "*", "type": "quantitative", "aggregate": "count" }, "color": { "field": "date", "type": "temporal", "timeUnit": "year" } } } ] }
(b) Vertical concatenation of two charts
Fig. 3. (a) A dual axis chart that layers lines for temperature on top of bars for precipitation; each layer uses an independent y-scale. (b) Thetemperature line chart from Fig. 2(a) concatenated with rainy day counts in New York and Seattle; scales and guides for each plot are independent.
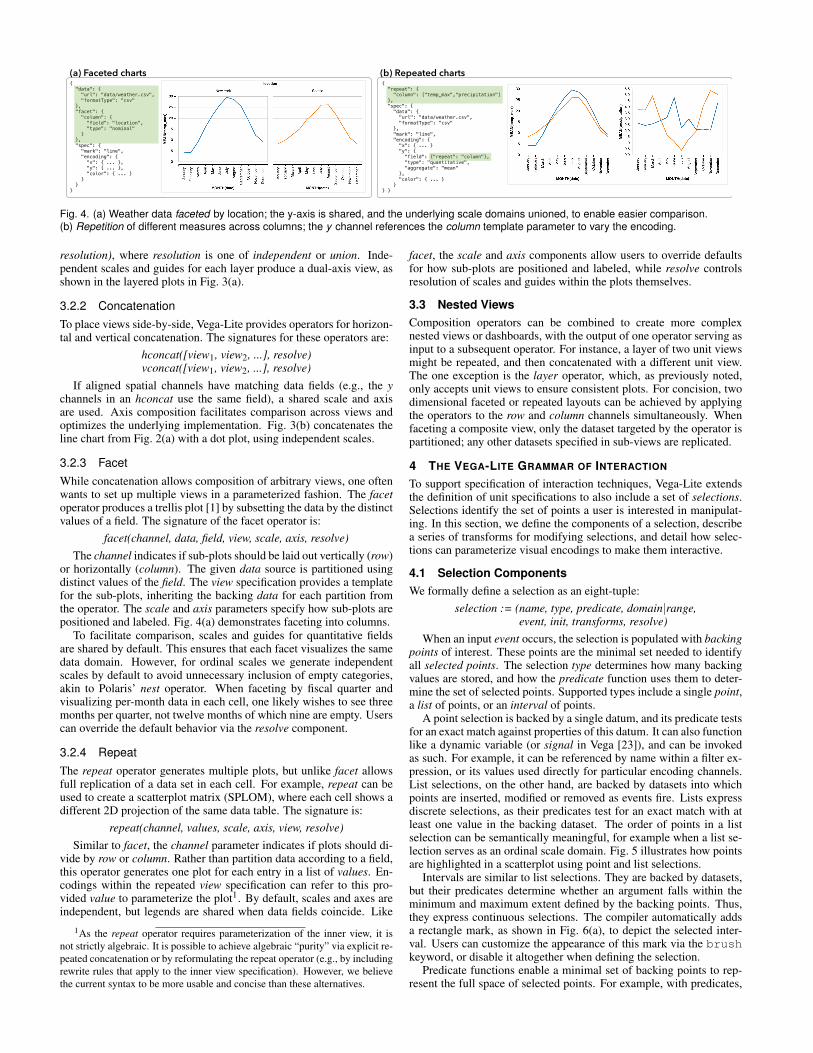
(a) Faceted charts (b) Repeated charts { "data": { "url": "data/weather.csv", "formatType": "csv" }, "facet": { "column": { "field": "location", "type": "nominal" } }, "spec": { "mark": "line", "encoding": { "x": { ... }, "y": { ... }, "color": { ... } } } }
{ "repeat": { "column": ["temp_max","precipitation"] }, "spec": { "data": { "url": "data/weather.csv", "formatType": "csv" }, "mark": "line", "encoding": { "x": { ... } "y": { "field": {"repeat": "column"}, "type": "quantitative", "aggregate": "mean" }, "color": { ... } } } }
Fig. 4. (a) Weather data faceted by location; the y-axis is shared, and the underlying scale domains unioned, to enable easier comparison.(b) Repetition of different measures across columns; the y channel references the column template parameter to vary the encoding.
resolution), where resolution is one of independent or union. Inde-pendent scales and guides for each layer produce a dual-axis view, asshown in the layered plots in Fig. 3(a).
3.2.2 ConcatenationTo place views side-by-side, Vega-Lite provides operators for horizon-tal and vertical concatenation. The signatures for these operators are:
hconcat([view1, view2, ...], resolve)vconcat([view1, view2, ...], resolve)
If aligned spatial channels have matching data fields (e.g., the ychannels in an hconcat use the same field), a shared scale and axisare used. Axis composition facilitates comparison across views andoptimizes the underlying implementation. Fig. 3(b) concatenates theline chart from Fig. 2(a) with a dot plot, using independent scales.
3.2.3 FacetWhile concatenation allows composition of arbitrary views, one oftenwants to set up multiple views in a parameterized fashion. The facetoperator produces a trellis plot [1] by subsetting the data by the distinctvalues of a field. The signature of the facet operator is:
facet(channel, data, field, view, scale, axis, resolve)The channel indicates if sub-plots should be laid out vertically (row)
or horizontally (column). The given data source is partitioned usingdistinct values of the field. The view specification provides a templatefor the sub-plots, inheriting the backing data for each partition fromthe operator. The scale and axis parameters specify how sub-plots arepositioned and labeled. Fig. 4(a) demonstrates faceting into columns.
To facilitate comparison, scales and guides for quantitative fieldsare shared by default. This ensures that each facet visualizes the samedata domain. However, for ordinal scales we generate independentscales by default to avoid unnecessary inclusion of empty categories,akin to Polaris’ nest operator. When faceting by fiscal quarter andvisualizing per-month data in each cell, one likely wishes to see threemonths per quarter, not twelve months of which nine are empty. Userscan override the default behavior via the resolve component.
3.2.4 RepeatThe repeat operator generates multiple plots, but unlike facet allowsfull replication of a data set in each cell. For example, repeat can beused to create a scatterplot matrix (SPLOM), where each cell shows adifferent 2D projection of the same data table. The signature is:
repeat(channel, values, scale, axis, view, resolve)Similar to facet, the channel parameter indicates if plots should di-
vide by row or column. Rather than partition data according to a field,this operator generates one plot for each entry in a list of values. En-codings within the repeated view specification can refer to this pro-vided value to parameterize the plot1. By default, scales and axes areindependent, but legends are shared when data fields coincide. Like
1As the repeat operator requires parameterization of the inner view, it isnot strictly algebraic. It is possible to achieve algebraic “purity” via explicit re-peated concatenation or by reformulating the repeat operator (e.g., by includingrewrite rules that apply to the inner view specification). However, we believethe current syntax to be more usable and concise than these alternatives.
facet, the scale and axis components allow users to override defaultsfor how sub-plots are positioned and labeled, while resolve controlsresolution of scales and guides within the plots themselves.
3.3 Nested ViewsComposition operators can be combined to create more complexnested views or dashboards, with the output of one operator serving asinput to a subsequent operator. For instance, a layer of two unit viewsmight be repeated, and then concatenated with a different unit view.The one exception is the layer operator, which, as previously noted,only accepts unit views to ensure consistent plots. For concision, twodimensional faceted or repeated layouts can be achieved by applyingthe operators to the row and column channels simultaneously. Whenfaceting a composite view, only the dataset targeted by the operator ispartitioned; any other datasets specified in sub-views are replicated.
4 THE VEGA-LITE GRAMMAR OF INTERACTION
To support specification of interaction techniques, Vega-Lite extendsthe definition of unit specifications to also include a set of selections.Selections identify the set of points a user is interested in manipulat-ing. In this section, we define the components of a selection, describea series of transforms for modifying selections, and detail how selec-tions can parameterize visual encodings to make them interactive.
4.1 Selection ComponentsWe formally define a selection as an eight-tuple:
selection := (name, type, predicate, domain|range,event, init, transforms, resolve)
When an input event occurs, the selection is populated with backingpoints of interest. These points are the minimal set needed to identifyall selected points. The selection type determines how many backingvalues are stored, and how the predicate function uses them to deter-mine the set of selected points. Supported types include a single point,a list of points, or an interval of points.
A point selection is backed by a single datum, and its predicate testsfor an exact match against properties of this datum. It can also functionlike a dynamic variable (or signal in Vega [23]), and can be invokedas such. For example, it can be referenced by name within a filter ex-pression, or its values used directly for particular encoding channels.List selections, on the other hand, are backed by datasets into whichpoints are inserted, modified or removed as events fire. Lists expressdiscrete selections, as their predicates test for an exact match with atleast one value in the backing dataset. The order of points in a listselection can be semantically meaningful, for example when a list se-lection serves as an ordinal scale domain. Fig. 5 illustrates how pointsare highlighted in a scatterplot using point and list selections.
Intervals are similar to list selections. They are backed by datasets,but their predicates determine whether an argument falls within theminimum and maximum extent defined by the backing points. Thus,they express continuous selections. The compiler automatically addsa rectangle mark, as shown in Fig. 6(a), to depict the selected inter-val. Users can customize the appearance of this mark via the brushkeyword, or disable it altogether when defining the selection.
Predicate functions enable a minimal set of backing points to rep-resent the full space of selected points. For example, with predicates,
{ "data": {"url": "data/cars.json"}, "mark": "circle", "select": { "id": {"type": "point"} }, "encoding": { "x": {"field": "Horsepower", "type": "Q"}, "y": {"field": "MPG", "type": "Q"}, "color": [ {"if": "id", "field": "Origin", "type": "N"}, {"value": "grey"} ], "size": {"value": 100} }
(a) Highlight a single point on click
"id": {"type": "point", "project": {"fields": ["Origin"]}}
(d) Highlight a single Origin
"id": {"type": "list", "toggle": true}
(b) Highlight a list of individual points
"select": { "id": {"type": "list", "toggle": true, "project": {"fields": ["Origin"]}}}, ...
(e) Highlight a list of Origins(c) "Paintbrush": highlight multiple points on hover"id": {"type": "list", "on": "mouseover", "toggle": true}
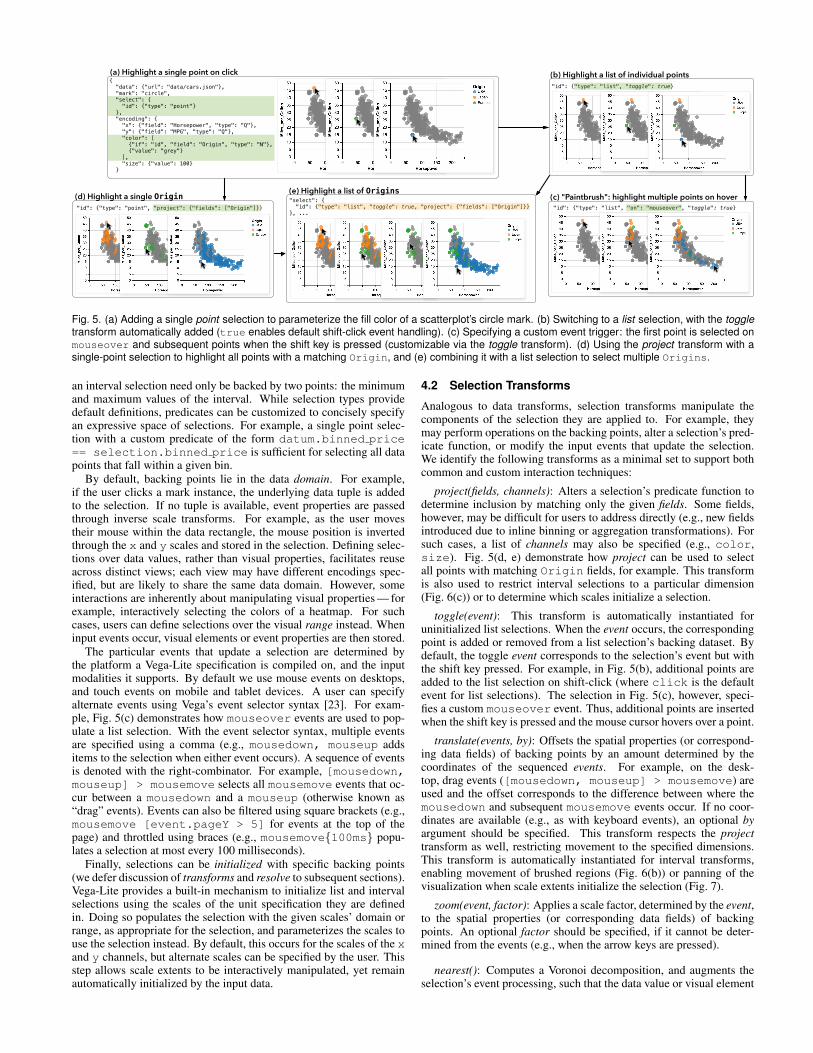
Fig. 5. (a) Adding a single point selection to parameterize the fill color of a scatterplot’s circle mark. (b) Switching to a list selection, with the toggletransform automatically added (true enables default shift-click event handling). (c) Specifying a custom event trigger: the first point is selected onmouseover and subsequent points when the shift key is pressed (customizable via the toggle transform). (d) Using the project transform with asingle-point selection to highlight all points with a matching Origin, and (e) combining it with a list selection to select multiple Origins.
an interval selection need only be backed by two points: the minimumand maximum values of the interval. While selection types providedefault definitions, predicates can be customized to concisely specifyan expressive space of selections. For example, a single point selec-tion with a custom predicate of the form datum.binned price== selection.binned price is sufficient for selecting all datapoints that fall within a given bin.
By default, backing points lie in the data domain. For example,if the user clicks a mark instance, the underlying data tuple is addedto the selection. If no tuple is available, event properties are passedthrough inverse scale transforms. For example, as the user movestheir mouse within the data rectangle, the mouse position is invertedthrough the x and y scales and stored in the selection. Defining selec-tions over data values, rather than visual properties, facilitates reuseacross distinct views; each view may have different encodings spec-ified, but are likely to share the same data domain. However, someinteractions are inherently about manipulating visual properties — forexample, interactively selecting the colors of a heatmap. For suchcases, users can define selections over the visual range instead. Wheninput events occur, visual elements or event properties are then stored.
The particular events that update a selection are determined bythe platform a Vega-Lite specification is compiled on, and the inputmodalities it supports. By default we use mouse events on desktops,and touch events on mobile and tablet devices. A user can specifyalternate events using Vega’s event selector syntax [23]. For exam-ple, Fig. 5(c) demonstrates how mouseover events are used to pop-ulate a list selection. With the event selector syntax, multiple eventsare specified using a comma (e.g., mousedown, mouseup addsitems to the selection when either event occurs). A sequence of eventsis denoted with the right-combinator. For example, [mousedown,mouseup] > mousemove selects all mousemove events that oc-cur between a mousedown and a mouseup (otherwise known as“drag” events). Events can also be filtered using square brackets (e.g.,mousemove [event.pageY > 5] for events at the top of thepage) and throttled using braces (e.g., mousemove{100ms} popu-lates a selection at most every 100 milliseconds).
Finally, selections can be initialized with specific backing points(we defer discussion of transforms and resolve to subsequent sections).Vega-Lite provides a built-in mechanism to initialize list and intervalselections using the scales of the unit specification they are definedin. Doing so populates the selection with the given scales’ domain orrange, as appropriate for the selection, and parameterizes the scales touse the selection instead. By default, this occurs for the scales of the xand y channels, but alternate scales can be specified by the user. Thisstep allows scale extents to be interactively manipulated, yet remainautomatically initialized by the input data.
4.2 Selection Transforms
Analogous to data transforms, selection transforms manipulate thecomponents of the selection they are applied to. For example, theymay perform operations on the backing points, alter a selection’s pred-icate function, or modify the input events that update the selection.We identify the following transforms as a minimal set to support bothcommon and custom interaction techniques:
project(fields, channels): Alters a selection’s predicate function todetermine inclusion by matching only the given fields. Some fields,however, may be difficult for users to address directly (e.g., new fieldsintroduced due to inline binning or aggregation transformations). Forsuch cases, a list of channels may also be specified (e.g., color,size). Fig. 5(d, e) demonstrate how project can be used to selectall points with matching Origin fields, for example. This transformis also used to restrict interval selections to a particular dimension(Fig. 6(c)) or to determine which scales initialize a selection.
toggle(event): This transform is automatically instantiated foruninitialized list selections. When the event occurs, the correspondingpoint is added or removed from a list selection’s backing dataset. Bydefault, the toggle event corresponds to the selection’s event but withthe shift key pressed. For example, in Fig. 5(b), additional points areadded to the list selection on shift-click (where click is the defaultevent for list selections). The selection in Fig. 5(c), however, speci-fies a custom mouseover event. Thus, additional points are insertedwhen the shift key is pressed and the mouse cursor hovers over a point.
translate(events, by): Offsets the spatial properties (or correspond-ing data fields) of backing points by an amount determined by thecoordinates of the sequenced events. For example, on the desk-top, drag events ([mousedown, mouseup] > mousemove) areused and the offset corresponds to the difference between where themousedown and subsequent mousemove events occur. If no coor-dinates are available (e.g., as with keyboard events), an optional byargument should be specified. This transform respects the projecttransform as well, restricting movement to the specified dimensions.This transform is automatically instantiated for interval transforms,enabling movement of brushed regions (Fig. 6(b)) or panning of thevisualization when scale extents initialize the selection (Fig. 7).
zoom(event, factor): Applies a scale factor, determined by the event,to the spatial properties (or corresponding data fields) of backingpoints. An optional factor should be specified, if it cannot be deter-mined from the events (e.g., when the arrow keys are pressed).
nearest(): Computes a Voronoi decomposition, and augments theselection’s event processing, such that the data value or visual element
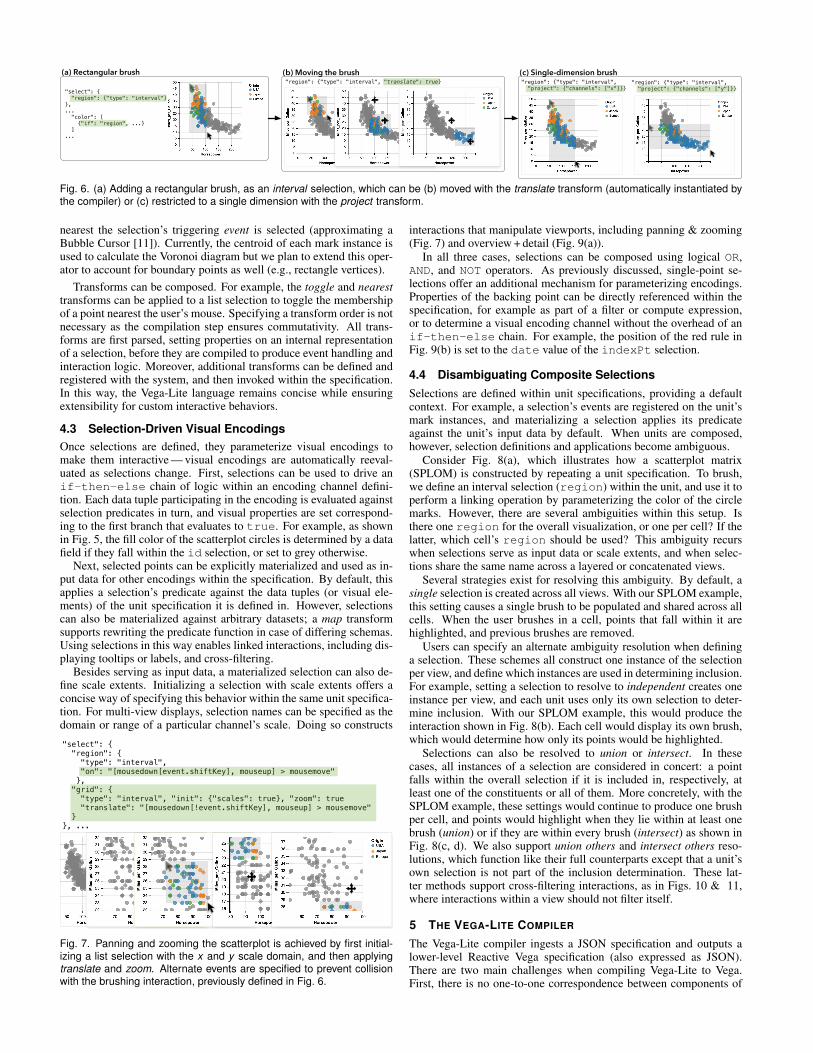
"region": {"type": "interval", "project": {"channels": ["x"]}}
"region": {"type": "interval", "project": {"channels": ["y"]}}
(c) Single-dimension brush"region": {"type": "interval", "translate": true}
(b) Moving the brush
"select": { "region": {"type": "interval"}},... "color": [ {"if": "region", ...} ]...
(a) Rectangular brush
Fig. 6. (a) Adding a rectangular brush, as an interval selection, which can be (b) moved with the translate transform (automatically instantiated bythe compiler) or (c) restricted to a single dimension with the project transform.
nearest the selection’s triggering event is selected (approximating aBubble Cursor [11]). Currently, the centroid of each mark instance isused to calculate the Voronoi diagram but we plan to extend this oper-ator to account for boundary points as well (e.g., rectangle vertices).
Transforms can be composed. For example, the toggle and nearesttransforms can be applied to a list selection to toggle the membershipof a point nearest the user’s mouse. Specifying a transform order is notnecessary as the compilation step ensures commutativity. All trans-forms are first parsed, setting properties on an internal representationof a selection, before they are compiled to produce event handling andinteraction logic. Moreover, additional transforms can be defined andregistered with the system, and then invoked within the specification.In this way, the Vega-Lite language remains concise while ensuringextensibility for custom interactive behaviors.
4.3 Selection-Driven Visual EncodingsOnce selections are defined, they parameterize visual encodings tomake them interactive — visual encodings are automatically reeval-uated as selections change. First, selections can be used to drive anif-then-else chain of logic within an encoding channel defini-tion. Each data tuple participating in the encoding is evaluated againstselection predicates in turn, and visual properties are set correspond-ing to the first branch that evaluates to true. For example, as shownin Fig. 5, the fill color of the scatterplot circles is determined by a datafield if they fall within the id selection, or set to grey otherwise.
Next, selected points can be explicitly materialized and used as in-put data for other encodings within the specification. By default, thisapplies a selection’s predicate against the data tuples (or visual ele-ments) of the unit specification it is defined in. However, selectionscan also be materialized against arbitrary datasets; a map transformsupports rewriting the predicate function in case of differing schemas.Using selections in this way enables linked interactions, including dis-playing tooltips or labels, and cross-filtering.
Besides serving as input data, a materialized selection can also de-fine scale extents. Initializing a selection with scale extents offers aconcise way of specifying this behavior within the same unit specifica-tion. For multi-view displays, selection names can be specified as thedomain or range of a particular channel’s scale. Doing so constructs
"select": { "region": { "type": "interval", "on": "[mousedown[event.shiftKey], mouseup] > mousemove" }, "grid": { "type": "interval", "init": {"scales": true}, "zoom": true "translate": "[mousedown[!event.shiftKey], mouseup] > mousemove" }}, ......
Fig. 7. Panning and zooming the scatterplot is achieved by first initial-izing a list selection with the x and y scale domain, and then applyingtranslate and zoom. Alternate events are specified to prevent collisionwith the brushing interaction, previously defined in Fig. 6.
interactions that manipulate viewports, including panning & zooming(Fig. 7) and overview + detail (Fig. 9(a)).
In all three cases, selections can be composed using logical OR,AND, and NOT operators. As previously discussed, single-point se-lections offer an additional mechanism for parameterizing encodings.Properties of the backing point can be directly referenced within thespecification, for example as part of a filter or compute expression,or to determine a visual encoding channel without the overhead of anif-then-else chain. For example, the position of the red rule inFig. 9(b) is set to the date value of the indexPt selection.
4.4 Disambiguating Composite SelectionsSelections are defined within unit specifications, providing a defaultcontext. For example, a selection’s events are registered on the unit’smark instances, and materializing a selection applies its predicateagainst the unit’s input data by default. When units are composed,however, selection definitions and applications become ambiguous.
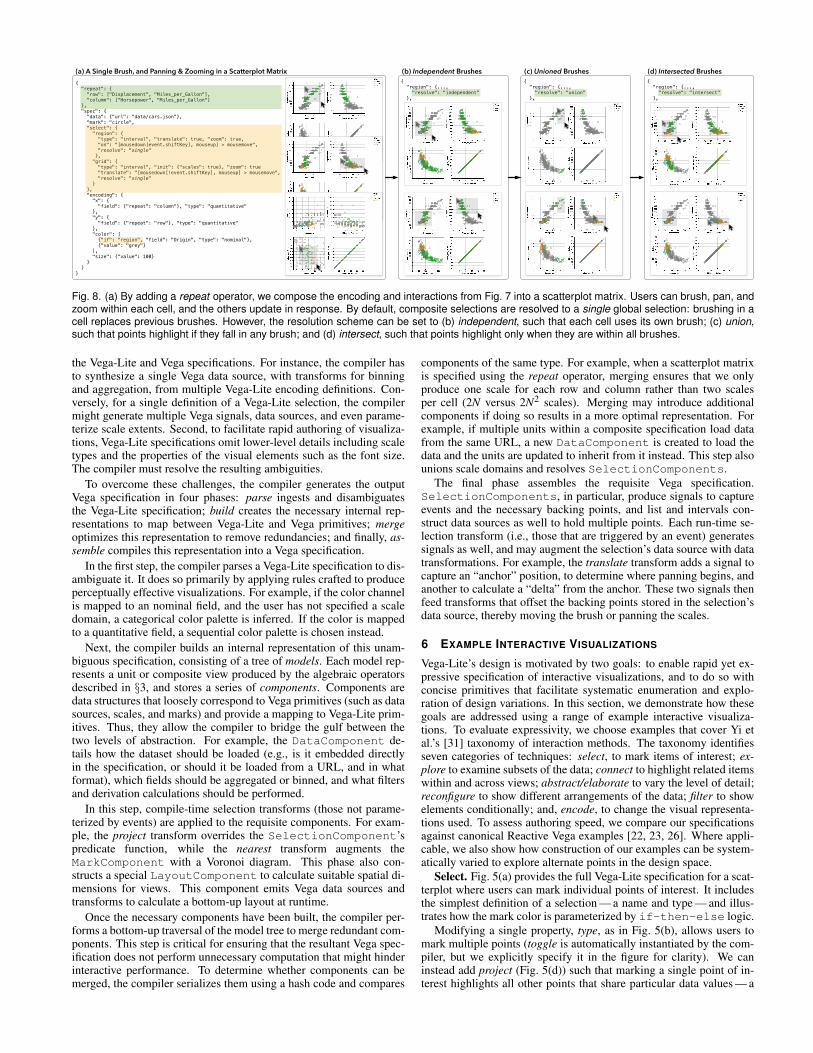
Consider Fig. 8(a), which illustrates how a scatterplot matrix(SPLOM) is constructed by repeating a unit specification. To brush,we define an interval selection (region) within the unit, and use it toperform a linking operation by parameterizing the color of the circlemarks. However, there are several ambiguities within this setup. Isthere one region for the overall visualization, or one per cell? If thelatter, which cell’s region should be used? This ambiguity recurswhen selections serve as input data or scale extents, and when selec-tions share the same name across a layered or concatenated views.
Several strategies exist for resolving this ambiguity. By default, asingle selection is created across all views. With our SPLOM example,this setting causes a single brush to be populated and shared across allcells. When the user brushes in a cell, points that fall within it arehighlighted, and previous brushes are removed.
Users can specify an alternate ambiguity resolution when defininga selection. These schemes all construct one instance of the selectionper view, and define which instances are used in determining inclusion.For example, setting a selection to resolve to independent creates oneinstance per view, and each unit uses only its own selection to deter-mine inclusion. With our SPLOM example, this would produce theinteraction shown in Fig. 8(b). Each cell would display its own brush,which would determine how only its points would be highlighted.
Selections can also be resolved to union or intersect. In thesecases, all instances of a selection are considered in concert: a pointfalls within the overall selection if it is included in, respectively, atleast one of the constituents or all of them. More concretely, with theSPLOM example, these settings would continue to produce one brushper cell, and points would highlight when they lie within at least onebrush (union) or if they are within every brush (intersect) as shown inFig. 8(c, d). We also support union others and intersect others reso-lutions, which function like their full counterparts except that a unit’sown selection is not part of the inclusion determination. These lat-ter methods support cross-filtering interactions, as in Figs. 10 & 11,where interactions within a view should not filter itself.
5 THE VEGA-LITE COMPILER
The Vega-Lite compiler ingests a JSON specification and outputs alower-level Reactive Vega specification (also expressed as JSON).There are two main challenges when compiling Vega-Lite to Vega.First, there is no one-to-one correspondence between components of
{ "region": {..., "resolve": "union" },
(c) Unioned Brushes{ "region": {..., "resolve": "independent" },
(b) Independent Brushes{ "repeat": { "row": ["Displacement", "Miles_per_Gallon"], "column": ["Horsepower", "Miles_per_Gallon"] }, "spec": { "data": {"url": "data/cars.json"}, "mark": "circle", "select": { "region": { "type": "interval", "translate": true, "zoom": true, "on": "[mousedown[event.shiftKey], mouseup] > mousemove", "resolve": "single" }, "grid": { "type": "interval", "init": {"scales": true}, "zoom": true "translate": "[mousedown[!event.shiftKey], mouseup] > mousemove", "resolve": "single" } }, "encoding": { "x": { "field": {"repeat": "column"}, "type": "quantitative" }, "y": { "field": {"repeat": "row"}, "type": "quantitative" }, "color": [ {"if": "region", "field": "Origin", "type": "nominal"}, {"value": "grey"} ], "size": {"value": 100} } }}
(a) A Single Brush, and Panning & Zooming in a Scatterplot Matrix{ "region": {..., "resolve": "intersect" },
(d) Intersected Brushes
Fig. 8. (a) By adding a repeat operator, we compose the encoding and interactions from Fig. 7 into a scatterplot matrix. Users can brush, pan, andzoom within each cell, and the others update in response. By default, composite selections are resolved to a single global selection: brushing in acell replaces previous brushes. However, the resolution scheme can be set to (b) independent, such that each cell uses its own brush; (c) union,such that points highlight if they fall in any brush; and (d) intersect, such that points highlight only when they are within all brushes.
the Vega-Lite and Vega specifications. For instance, the compiler hasto synthesize a single Vega data source, with transforms for binningand aggregation, from multiple Vega-Lite encoding definitions. Con-versely, for a single definition of a Vega-Lite selection, the compilermight generate multiple Vega signals, data sources, and even parame-terize scale extents. Second, to facilitate rapid authoring of visualiza-tions, Vega-Lite specifications omit lower-level details including scaletypes and the properties of the visual elements such as the font size.The compiler must resolve the resulting ambiguities.
To overcome these challenges, the compiler generates the outputVega specification in four phases: parse ingests and disambiguatesthe Vega-Lite specification; build creates the necessary internal rep-resentations to map between Vega-Lite and Vega primitives; mergeoptimizes this representation to remove redundancies; and finally, as-semble compiles this representation into a Vega specification.
In the first step, the compiler parses a Vega-Lite specification to dis-ambiguate it. It does so primarily by applying rules crafted to produceperceptually effective visualizations. For example, if the color channelis mapped to an nominal field, and the user has not specified a scaledomain, a categorical color palette is inferred. If the color is mappedto a quantitative field, a sequential color palette is chosen instead.
Next, the compiler builds an internal representation of this unam-biguous specification, consisting of a tree of models. Each model rep-resents a unit or composite view produced by the algebraic operatorsdescribed in §3, and stores a series of components. Components aredata structures that loosely correspond to Vega primitives (such as datasources, scales, and marks) and provide a mapping to Vega-Lite prim-itives. Thus, they allow the compiler to bridge the gulf between thetwo levels of abstraction. For example, the DataComponent de-tails how the dataset should be loaded (e.g., is it embedded directlyin the specification, or should it be loaded from a URL, and in whatformat), which fields should be aggregated or binned, and what filtersand derivation calculations should be performed.
In this step, compile-time selection transforms (those not parame-terized by events) are applied to the requisite components. For exam-ple, the project transform overrides the SelectionComponent’spredicate function, while the nearest transform augments theMarkComponent with a Voronoi diagram. This phase also con-structs a special LayoutComponent to calculate suitable spatial di-mensions for views. This component emits Vega data sources andtransforms to calculate a bottom-up layout at runtime.
Once the necessary components have been built, the compiler per-forms a bottom-up traversal of the model tree to merge redundant com-ponents. This step is critical for ensuring that the resultant Vega spec-ification does not perform unnecessary computation that might hinderinteractive performance. To determine whether components can bemerged, the compiler serializes them using a hash code and compares
components of the same type. For example, when a scatterplot matrixis specified using the repeat operator, merging ensures that we onlyproduce one scale for each row and column rather than two scalesper cell (2N versus 2N2 scales). Merging may introduce additionalcomponents if doing so results in a more optimal representation. Forexample, if multiple units within a composite specification load datafrom the same URL, a new DataComponent is created to load thedata and the units are updated to inherit from it instead. This step alsounions scale domains and resolves SelectionComponents.
The final phase assembles the requisite Vega specification.SelectionComponents, in particular, produce signals to captureevents and the necessary backing points, and list and intervals con-struct data sources as well to hold multiple points. Each run-time se-lection transform (i.e., those that are triggered by an event) generatessignals as well, and may augment the selection’s data source with datatransformations. For example, the translate transform adds a signal tocapture an “anchor” position, to determine where panning begins, andanother to calculate a “delta” from the anchor. These two signals thenfeed transforms that offset the backing points stored in the selection’sdata source, thereby moving the brush or panning the scales.
6 EXAMPLE INTERACTIVE VISUALIZATIONS
Vega-Lite’s design is motivated by two goals: to enable rapid yet ex-pressive specification of interactive visualizations, and to do so withconcise primitives that facilitate systematic enumeration and explo-ration of design variations. In this section, we demonstrate how thesegoals are addressed using a range of example interactive visualiza-tions. To evaluate expressivity, we choose examples that cover Yi etal.’s [31] taxonomy of interaction methods. The taxonomy identifiesseven categories of techniques: select, to mark items of interest; ex-plore to examine subsets of the data; connect to highlight related itemswithin and across views; abstract/elaborate to vary the level of detail;reconfigure to show different arrangements of the data; filter to showelements conditionally; and, encode, to change the visual representa-tions used. To assess authoring speed, we compare our specificationsagainst canonical Reactive Vega examples [22, 23, 26]. Where appli-cable, we also show how construction of our examples can be system-atically varied to explore alternate points in the design space.
Select. Fig. 5(a) provides the full Vega-Lite specification for a scat-terplot where users can mark individual points of interest. It includesthe simplest definition of a selection — a name and type — and illus-trates how the mark color is parameterized by if-then-else logic.
Modifying a single property, type, as in Fig. 5(b), allows users tomark multiple points (toggle is automatically instantiated by the com-piler, but we explicitly specify it in the figure for clarity). We caninstead add project (Fig. 5(d)) such that marking a single point of in-terest highlights all other points that share particular data values — a
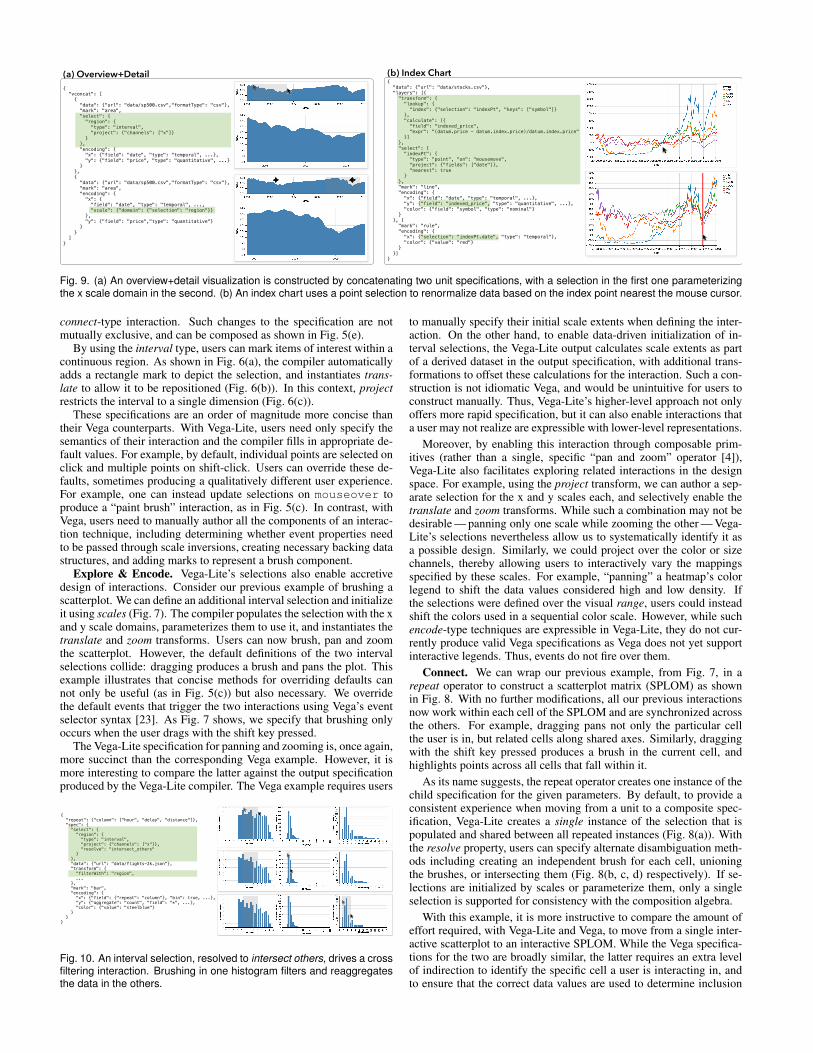
{ "data": {"url": "data/stocks.csv"}, "layers": [{ "transform": { "lookup": { "index": {"selection": "indexPt", "keys": ["symbol"]} }, "calculate": [{ "field": "indexed_price", "expr": "(datum.price - datum.index.price)/datum.index.price" }] }, "select": { "indexPt": { "type": "point", "on": "mousemove", "project": {"fields": ["date"]}, "nearest": true } }, "mark": "line", "encoding": { "x": {"field": "date", "type": "temporal", ...}, "y": {"field": "indexed_price", "type": "quantitative", ...}, "color": {"field": "symbol", "type": "nominal"} } }, { "mark": "rule", "encoding": { "x": {"selection": "indexPt.date", "type": "temporal"}, "color": {"value": "red"} } }]}
{ "vconcat": [ { "data": {"url": "data/sp500.csv","formatType": "csv"}, "mark": "area", "select": { "region": { "type": "interval", "project": {"channels": ["x"]} } }, "encoding": { "x": {"field": "date", "type": "temporal", ...}, "y": {"field": "price", "type": "quantitative", ...} } }, { "data": {"url": "data/sp500.csv","formatType": "csv"}, "mark": "area", "encoding": { "x": { "field": "date", "type": "temporal", ..., "scale": {"domain": {"selection": "region"}} }, "y": {"field": "price","type": "quantitative"} } } ]}
(a) Overview+Detail (b) Index Chart
Fig. 9. (a) An overview+detail visualization is constructed by concatenating two unit specifications, with a selection in the first one parameterizingthe x scale domain in the second. (b) An index chart uses a point selection to renormalize data based on the index point nearest the mouse cursor.
connect-type interaction. Such changes to the specification are notmutually exclusive, and can be composed as shown in Fig. 5(e).
By using the interval type, users can mark items of interest within acontinuous region. As shown in Fig. 6(a), the compiler automaticallyadds a rectangle mark to depict the selection, and instantiates trans-late to allow it to be repositioned (Fig. 6(b)). In this context, projectrestricts the interval to a single dimension (Fig. 6(c)).
These specifications are an order of magnitude more concise thantheir Vega counterparts. With Vega-Lite, users need only specify thesemantics of their interaction and the compiler fills in appropriate de-fault values. For example, by default, individual points are selected onclick and multiple points on shift-click. Users can override these de-faults, sometimes producing a qualitatively different user experience.For example, one can instead update selections on mouseover toproduce a “paint brush” interaction, as in Fig. 5(c). In contrast, withVega, users need to manually author all the components of an interac-tion technique, including determining whether event properties needto be passed through scale inversions, creating necessary backing datastructures, and adding marks to represent a brush component.
Explore & Encode. Vega-Lite’s selections also enable accretivedesign of interactions. Consider our previous example of brushing ascatterplot. We can define an additional interval selection and initializeit using scales (Fig. 7). The compiler populates the selection with the xand y scale domains, parameterizes them to use it, and instantiates thetranslate and zoom transforms. Users can now brush, pan and zoomthe scatterplot. However, the default definitions of the two intervalselections collide: dragging produces a brush and pans the plot. Thisexample illustrates that concise methods for overriding defaults cannot only be useful (as in Fig. 5(c)) but also necessary. We overridethe default events that trigger the two interactions using Vega’s eventselector syntax [23]. As Fig. 7 shows, we specify that brushing onlyoccurs when the user drags with the shift key pressed.
The Vega-Lite specification for panning and zooming is, once again,more succinct than the corresponding Vega example. However, it ismore interesting to compare the latter against the output specificationproduced by the Vega-Lite compiler. The Vega example requires users
{ "repeat": {"column": ["hour", "delay", "distance"]}, "spec": { "select": { "region": { "type": "interval", "project": {"channels": ["x"]}, "resolve": "intersect_others" } }, "data": {"url": "data/flights-2k.json"}, "transform": { "filterWith": "region", ... }, "mark": "bar", "encoding": { "x": {"field": {"repeat": "column"}, "bin": true, ...}, "y": {"aggregate": "count", "field": "*", ...}, "color": {"value": "steelblue"} } }}
Fig. 10. An interval selection, resolved to intersect others, drives a crossfiltering interaction. Brushing in one histogram filters and reaggregatesthe data in the others.
to manually specify their initial scale extents when defining the inter-action. On the other hand, to enable data-driven initialization of in-terval selections, the Vega-Lite output calculates scale extents as partof a derived dataset in the output specification, with additional trans-formations to offset these calculations for the interaction. Such a con-struction is not idiomatic Vega, and would be unintuitive for users toconstruct manually. Thus, Vega-Lite’s higher-level approach not onlyoffers more rapid specification, but it can also enable interactions thata user may not realize are expressible with lower-level representations.
Moreover, by enabling this interaction through composable prim-itives (rather than a single, specific “pan and zoom” operator [4]),Vega-Lite also facilitates exploring related interactions in the designspace. For example, using the project transform, we can author a sep-arate selection for the x and y scales each, and selectively enable thetranslate and zoom transforms. While such a combination may not bedesirable — panning only one scale while zooming the other — Vega-Lite’s selections nevertheless allow us to systematically identify it asa possible design. Similarly, we could project over the color or sizechannels, thereby allowing users to interactively vary the mappingsspecified by these scales. For example, “panning” a heatmap’s colorlegend to shift the data values considered high and low density. Ifthe selections were defined over the visual range, users could insteadshift the colors used in a sequential color scale. However, while suchencode-type techniques are expressible in Vega-Lite, they do not cur-rently produce valid Vega specifications as Vega does not yet supportinteractive legends. Thus, events do not fire over them.
Connect. We can wrap our previous example, from Fig. 7, in arepeat operator to construct a scatterplot matrix (SPLOM) as shownin Fig. 8. With no further modifications, all our previous interactionsnow work within each cell of the SPLOM and are synchronized acrossthe others. For example, dragging pans not only the particular cellthe user is in, but related cells along shared axes. Similarly, draggingwith the shift key pressed produces a brush in the current cell, andhighlights points across all cells that fall within it.
As its name suggests, the repeat operator creates one instance of thechild specification for the given parameters. By default, to provide aconsistent experience when moving from a unit to a composite spec-ification, Vega-Lite creates a single instance of the selection that ispopulated and shared between all repeated instances (Fig. 8(a)). Withthe resolve property, users can specify alternate disambiguation meth-ods including creating an independent brush for each cell, unioningthe brushes, or intersecting them (Fig. 8(b, c, d) respectively). If se-lections are initialized by scales or parameterize them, only a singleselection is supported for consistency with the composition algebra.
With this example, it is more instructive to compare the amount ofeffort required, with Vega-Lite and Vega, to move from a single inter-active scatterplot to an interactive SPLOM. While the Vega specifica-tions for the two are broadly similar, the latter requires an extra levelof indirection to identify the specific cell a user is interacting in, andto ensure that the correct data values are used to determine inclusion
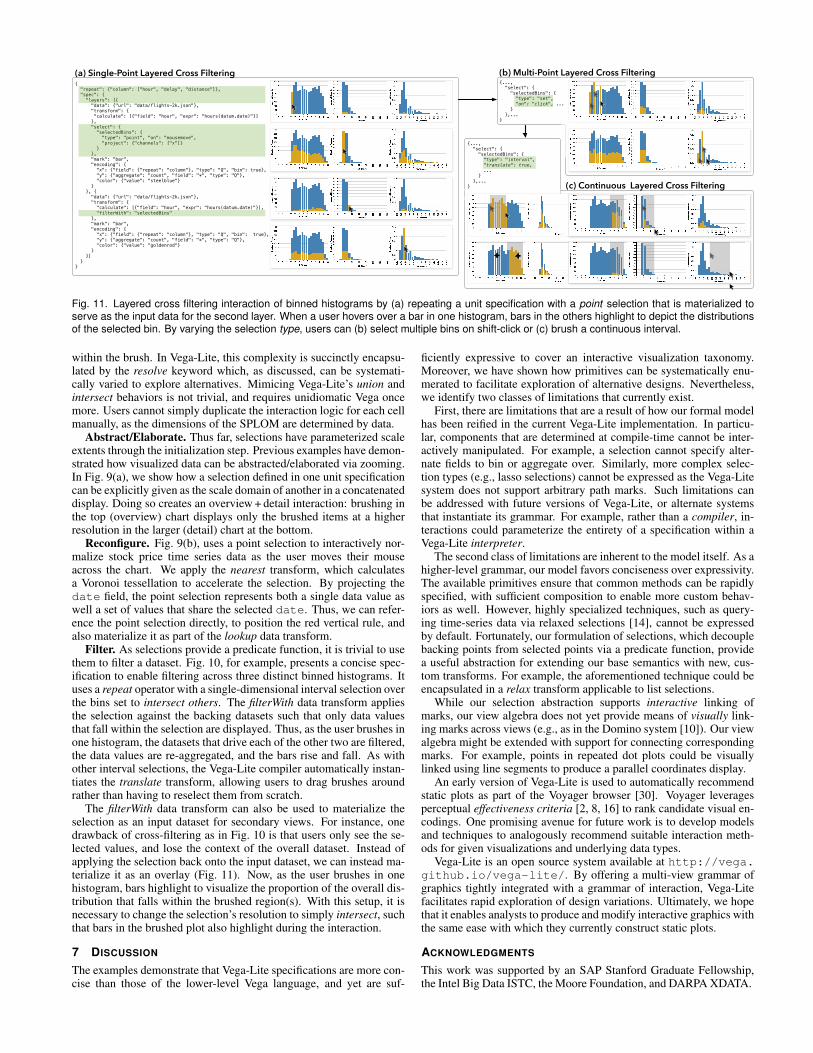
{ "repeat": {"column": ["hour", "delay", "distance"]}, "spec": { "layers": [{ "data": {"url": "data/flights-2k.json"}, "transform": { "calculate": [{"field": "hour", "expr": "hours(datum.date)"}] }, "select": { "selectedBins": { "type": "point", "on": "mousemove", "project": {"channels": ["x"]} } }, "mark": "bar", "encoding": { "x": {"field": {"repeat": "column"}, "type": "Q", "bin": true}, "y": {"aggregate": "count", "field": "*", "type": "Q"}, "color": {"value": "steelblue"} } }, { "data": {"url": "data/flights-2k.json"}, "transform": { "calculate": [{"field": "hour", "expr": "hours(datum.date)"}], "filterWith": "selectedBins" }, "mark": "bar", "encoding": { "x": {"field": {"repeat": "column"}, "type": "Q", "bin": true}, "y": {"aggregate": "count", "field": "*", "type": "Q"}, "color": {"value": "goldenrod"} } }] }}
(a) Single-Point Layered Cross Filtering{..., "select": { "selectedBins": { "type": "set", "on": "click", ... } },...}
(b) Multi-Point Layered Cross Filtering
{..., "select": { "selectedBins": { "type": "interval", "translate": true, ... } },...} (c) Continuous Layered Cross Filtering
Fig. 11. Layered cross filtering interaction of binned histograms by (a) repeating a unit specification with a point selection that is materialized toserve as the input data for the second layer. When a user hovers over a bar in one histogram, bars in the others highlight to depict the distributionsof the selected bin. By varying the selection type, users can (b) select multiple bins on shift-click or (c) brush a continuous interval.
within the brush. In Vega-Lite, this complexity is succinctly encapsu-lated by the resolve keyword which, as discussed, can be systemati-cally varied to explore alternatives. Mimicing Vega-Lite’s union andintersect behaviors is not trivial, and requires unidiomatic Vega oncemore. Users cannot simply duplicate the interaction logic for each cellmanually, as the dimensions of the SPLOM are determined by data.
Abstract/Elaborate. Thus far, selections have parameterized scaleextents through the initialization step. Previous examples have demon-strated how visualized data can be abstracted/elaborated via zooming.In Fig. 9(a), we show how a selection defined in one unit specificationcan be explicitly given as the scale domain of another in a concatenateddisplay. Doing so creates an overview + detail interaction: brushing inthe top (overview) chart displays only the brushed items at a higherresolution in the larger (detail) chart at the bottom.
Reconfigure. Fig. 9(b), uses a point selection to interactively nor-malize stock price time series data as the user moves their mouseacross the chart. We apply the nearest transform, which calculatesa Voronoi tessellation to accelerate the selection. By projecting thedate field, the point selection represents both a single data value aswell a set of values that share the selected date. Thus, we can refer-ence the point selection directly, to position the red vertical rule, andalso materialize it as part of the lookup data transform.
Filter. As selections provide a predicate function, it is trivial to usethem to filter a dataset. Fig. 10, for example, presents a concise spec-ification to enable filtering across three distinct binned histograms. Ituses a repeat operator with a single-dimensional interval selection overthe bins set to intersect others. The filterWith data transform appliesthe selection against the backing datasets such that only data valuesthat fall within the selection are displayed. Thus, as the user brushes inone histogram, the datasets that drive each of the other two are filtered,the data values are re-aggregated, and the bars rise and fall. As withother interval selections, the Vega-Lite compiler automatically instan-tiates the translate transform, allowing users to drag brushes aroundrather than having to reselect them from scratch.
The filterWith data transform can also be used to materialize theselection as an input dataset for secondary views. For instance, onedrawback of cross-filtering as in Fig. 10 is that users only see the se-lected values, and lose the context of the overall dataset. Instead ofapplying the selection back onto the input dataset, we can instead ma-terialize it as an overlay (Fig. 11). Now, as the user brushes in onehistogram, bars highlight to visualize the proportion of the overall dis-tribution that falls within the brushed region(s). With this setup, it isnecessary to change the selection’s resolution to simply intersect, suchthat bars in the brushed plot also highlight during the interaction.
7 DISCUSSION
The examples demonstrate that Vega-Lite specifications are more con-cise than those of the lower-level Vega language, and yet are suf-
ficiently expressive to cover an interactive visualization taxonomy.Moreover, we have shown how primitives can be systematically enu-merated to facilitate exploration of alternative designs. Nevertheless,we identify two classes of limitations that currently exist.
First, there are limitations that are a result of how our formal modelhas been reified in the current Vega-Lite implementation. In particu-lar, components that are determined at compile-time cannot be inter-actively manipulated. For example, a selection cannot specify alter-nate fields to bin or aggregate over. Similarly, more complex selec-tion types (e.g., lasso selections) cannot be expressed as the Vega-Litesystem does not support arbitrary path marks. Such limitations canbe addressed with future versions of Vega-Lite, or alternate systemsthat instantiate its grammar. For example, rather than a compiler, in-teractions could parameterize the entirety of a specification within aVega-Lite interpreter.
The second class of limitations are inherent to the model itself. As ahigher-level grammar, our model favors conciseness over expressivity.The available primitives ensure that common methods can be rapidlyspecified, with sufficient composition to enable more custom behav-iors as well. However, highly specialized techniques, such as query-ing time-series data via relaxed selections [14], cannot be expressedby default. Fortunately, our formulation of selections, which decouplebacking points from selected points via a predicate function, providea useful abstraction for extending our base semantics with new, cus-tom transforms. For example, the aforementioned technique could beencapsulated in a relax transform applicable to list selections.
While our selection abstraction supports interactive linking ofmarks, our view algebra does not yet provide means of visually link-ing marks across views (e.g., as in the Domino system [10]). Our viewalgebra might be extended with support for connecting correspondingmarks. For example, points in repeated dot plots could be visuallylinked using line segments to produce a parallel coordinates display.
An early version of Vega-Lite is used to automatically recommendstatic plots as part of the Voyager browser [30]. Voyager leveragesperceptual effectiveness criteria [2, 8, 16] to rank candidate visual en-codings. One promising avenue for future work is to develop modelsand techniques to analogously recommend suitable interaction meth-ods for given visualizations and underlying data types.
Vega-Lite is an open source system available at http://vega.github.io/vega-lite/. By offering a multi-view grammar ofgraphics tightly integrated with a grammar of interaction, Vega-Litefacilitates rapid exploration of design variations. Ultimately, we hopethat it enables analysts to produce and modify interactive graphics withthe same ease with which they currently construct static plots.
ACKNOWLEDGMENTS
This work was supported by an SAP Stanford Graduate Fellowship,the Intel Big Data ISTC, the Moore Foundation, and DARPA XDATA.
REFERENCES
[1] R. A. Becker, W. S. Cleveland, and M.-J. Shyu. The visual design andcontrol of trellis display. Journal of computational and Graphical Statis-tics, 5(2):123–155, 1996.
[2] J. Bertin. Semiology of graphics: diagrams, networks, maps. Universityof Wisconsin press, 1983.
[3] M. Bostock and J. Heer. Protovis: A graphical toolkit for visualization.IEEE Trans. Visualization & Comp. Graphics, 15(6):1121–1128, 2009.
[4] M. Bostock, V. Ogievetsky, and J. Heer. D3: Data-Driven Documents.IEEE Trans. Visualization & Comp. Graphics, 17(12):2301–2309, 2011.
[5] Brunel Visualization. https://developer.ibm.com/open/brunel-visualization/, June 2016.
[6] H. Chen. Compound brushing [dynamic data visualization]. In Infor-mation Visualization, 2003. INFOVIS 2003. IEEE Symposium on, pages181–188. IEEE, 2003.
[7] J. Choi, D. G. Park, Y. L. Wong, E. Fisher, and N. Elmqvist. Visdock:A toolkit for cross-cutting interactions in visualization. Visualization andComputer Graphics, IEEE Transactions on, 21(9):1087–1100, 2015.
[8] W. S. Cleveland and R. McGill. Graphical perception: Theory, exper-imentation, and application to the development of graphical methods.Journal of the American Statistical Association, 79(387):531–554, 1984.
[9] M. Derthick, J. Kolojejchick, and S. F. Roth. An interactive visual queryenvironment for exploring data. In Proceedings of the 10th annual ACMsymposium on User interface software and technology, pages 189–198.ACM, 1997.
[10] S. Gratzl, N. Gehlenborg, A. Lex, H. Pfister, and M. Streit. Domino:Extracting, comparing, and manipulating subsets across multiple tabulardatasets. IEEE Transactions on Visualization and Computer Graphics,20(12):2023–2032, 2014.
[11] T. Grossman and R. Balakrishnan. The bubble cursor: Enhancing tar-get acquisition by dynamic resizing of the cursor’s activation area. InProceedings of the SIGCHI Conference on Human Factors in ComputingSystems, pages 281–290. ACM, 2005.
[12] J. Heer, M. Agrawala, and W. Willett. Generalized selection via inter-active query relaxation. In Proceedings of the SIGCHI Conference onHuman Factors in Computing Systems, pages 959–968. ACM, 2008.
[13] J. Heer and B. Shneiderman. Interactive dynamics for visual analysis.Communications of the ACM, 55(4):45–54, 2012.
[14] C. Holz and S. Feiner. Relaxed selection techniques for querying time-series graphs. In Proceedings of the 22nd annual ACM symposium onUser interface software and technology, pages 213–222. ACM, 2009.
[15] M. Livny, R. Ramakrishnan, K. Beyer, G. Chen, D. Donjerkovic,S. Lawande, J. Myllymaki, and K. Wenger. Devise: integrated query-ing and visual exploration of large datasets. ACM SIGMOD Record,26(2):301–312, 1997.
[16] J. Mackinlay. Automating the design of graphical presentations of rela-tional information. Acm Transactions On Graphics (Tog), 5(2):110–141,1986.
[17] C. North and B. Shneiderman. Snap-together visualization: a user in-terface for coordinating visualizations via relational schemata. In Pro-ceedings of the working conference on Advanced visual interfaces, pages128–135. ACM, 2000.
[18] C. Olsten, M. Stonebraker, A. Aiken, and J. M. Hellerstein. Viqing: Vi-sual interactive querying. In Visual Languages, 1998. Proceedings. 1998IEEE Symposium on, pages 162–169. IEEE, 1998.
[19] W. A. Pike, J. Stasko, R. Chang, and T. A. O’Connell. The science ofinteraction. Information Visualization, 8(4):263–274, 2009.
[20] ggvis 0.4 overview. http://ggvis.rstudio.com, June 2016.[21] Shiny by RStudio. http://shiny.rstudio.com, June 2016.[22] A. Satyanarayan, R. Russell, J. Hoffswell, and J. Heer. Reactive Vega: A
streaming dataflow architecture for declarative interactive visualization.IEEE Trans. Visualization & Comp. Graphics (Proc. InfoVis), 2016.
[23] A. Satyanarayan, K. Wongsuphasawat, and J. Heer. Declarative inter-action design for data visualization. In Proceedings of the 27th annualACM symposium on User interface software and technology, pages 669–678. ACM, 2014.
[24] C. Stolte, D. Tang, and P. Hanrahan. Polaris: A system for query, analysis,and visualization of multidimensional relational databases. IEEE Trans.Visualization & Comp. Graphics, 8(1):52–65, 2002.
[25] D. F. Swayne, D. T. Lang, A. Buja, and D. Cook. Ggobi: evolvingfrom xgobi into an extensible framework for interactive data visualiza-tion. Computational Statistics & Data Analysis, 43(4):423–444, 2003.
[26] Online Vega Editor. http://vega.github.io/vega-editor/,June 2016.
[27] H. Wickham. A layered grammar of graphics. Journal of Computationaland Graphical Statistics, 19(1):3–28, 2010.
[28] A. Wilhelm. User interaction at various levels of data displays. Compu-tational statistics & data analysis, 43(4):471–494, 2003.
[29] L. Wilkinson. The Grammar of Graphics. Springer, 2 edition, 2005.[30] K. Wongsuphasawat, D. Moritz, A. Anand, J. Mackinlay, B. Howe, and
J. Heer. Voyager: Exploratory Analysis via Faceted Browsing of Visual-ization Recommendations. IEEE Trans. Visualization & Comp. Graphics,2015.
[31] J. S. Yi, Y. ah Kang, J. T. Stasko, and J. A. Jacko. Toward a deeper un-derstanding of the role of interaction in information visualization. IEEETransactions on Visualization and Computer Graphics, 13(6):1224–1231, 2007.