velocity 2015 linux perf tools
TRANSCRIPT

Linux Performance Tools
Brendan Gregg Senior Performance Architect Performance Engineering Team
[email protected] @brendangregg

This Tutorial • A tour of many Linux performance tools
– To show you what can be done – With guidance for how to do it
• This includes objectives, discussion, live demos – See the video of this tutorial
Observability Benchmarking Tuning Sta<c Tuning

• Massive AWS EC2 Linux cloud – 10s of thousands of cloud instances
• FreeBSD for content delivery – ~33% of US Internet traffic at night
• Over 50M subscribers – Recently launched in ANZ
• Use Linux server tools as needed – After cloud monitoring (Atlas, etc.) and
instance monitoring (Vector) tools

Agenda • Methodologies • Tools • Tool Types:
– Observability – Benchmarking – Tuning – Static
• Profiling • Tracing

Methodologies

Methodologies • Objectives:
– Recognize the Streetlight Anti-Method – Perform the Workload Characterization Method – Perform the USE Method – Learn how to start with the questions, before using tools – Be aware of other methodologies

My system is slow…
DEMO
& DISCUSSION

Methodologies • There are dozens of performance tools for Linux
– Packages: sysstat, procps, coreutils, … – Commercial products
• Methodologies can provide guidance for choosing and using tools effectively
• A starting point, a process, and an ending point

An#-‐Methodologies • The lack of a deliberate methodology…

Street Light An<-‐Method 1. Pick observability tools that are:
– Familiar – Found on the Internet – Found at random
2. Run tools 3. Look for obvious issues

Drunk Man An<-‐Method • Tune things at random until the problem goes away

Blame Someone Else An<-‐Method 1. Find a system or environment component you are not
responsible for 2. Hypothesize that the issue is with that component 3. Redirect the issue to the responsible team 4. When proven wrong, go to 1

Actual Methodologies • Problem Statement Method • Workload Characterization Method • USE Method • Off-CPU Analysis • CPU Profile Method • RTFM Method • Active Benchmarking (covered later) • Static Performance Tuning (covered later) • …

Problem Statement Method 1. What makes you think there is a performance problem? 2. Has this system ever performed well? 3. What has changed recently? (Software? Hardware?
Load?) 4. Can the performance degradation be expressed in
terms of latency or run time? 5. Does the problem affect other people or applications (or
is it just you)? 6. What is the environment? Software, hardware,
instance types? Versions? Configuration?
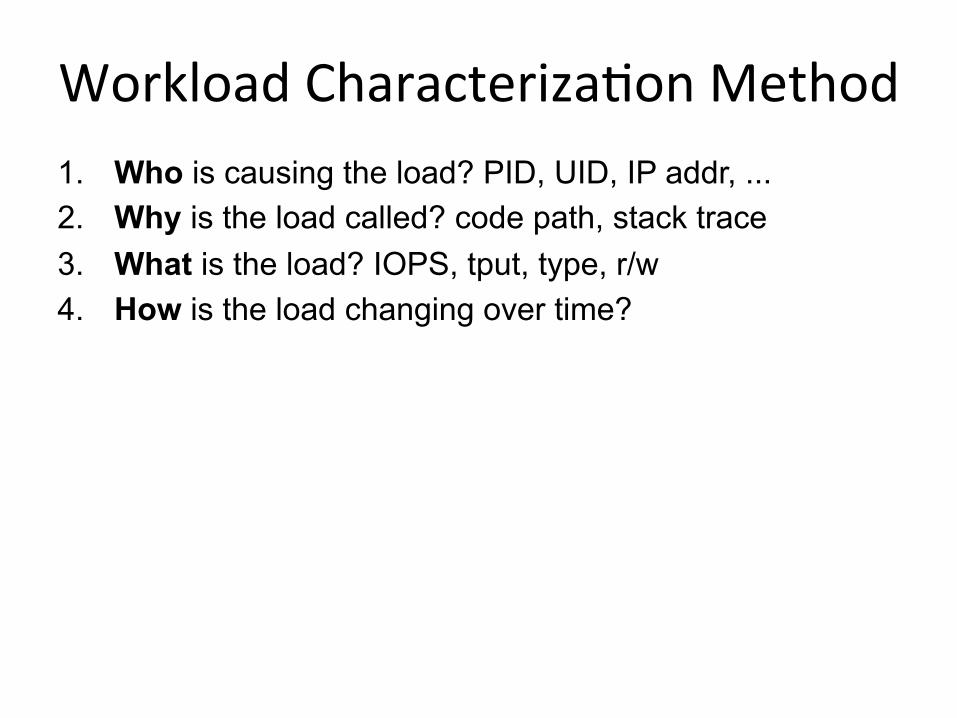
Workload Characteriza<on Method 1. Who is causing the load? PID, UID, IP addr, ... 2. Why is the load called? code path, stack trace 3. What is the load? IOPS, tput, type, r/w 4. How is the load changing over time?

The USE Method • For every resource, check:
1. Utilization 2. Saturation 3. Errors
• Definitions: – Utilization: busy time – Saturation: queue length or queued time – Errors: easy to interpret (objective)
• Helps if you have a functional (block) diagram of your system / software / environment, showing all resources
Start with the questions, then find the tools
Resource U<liza<on
(%) X
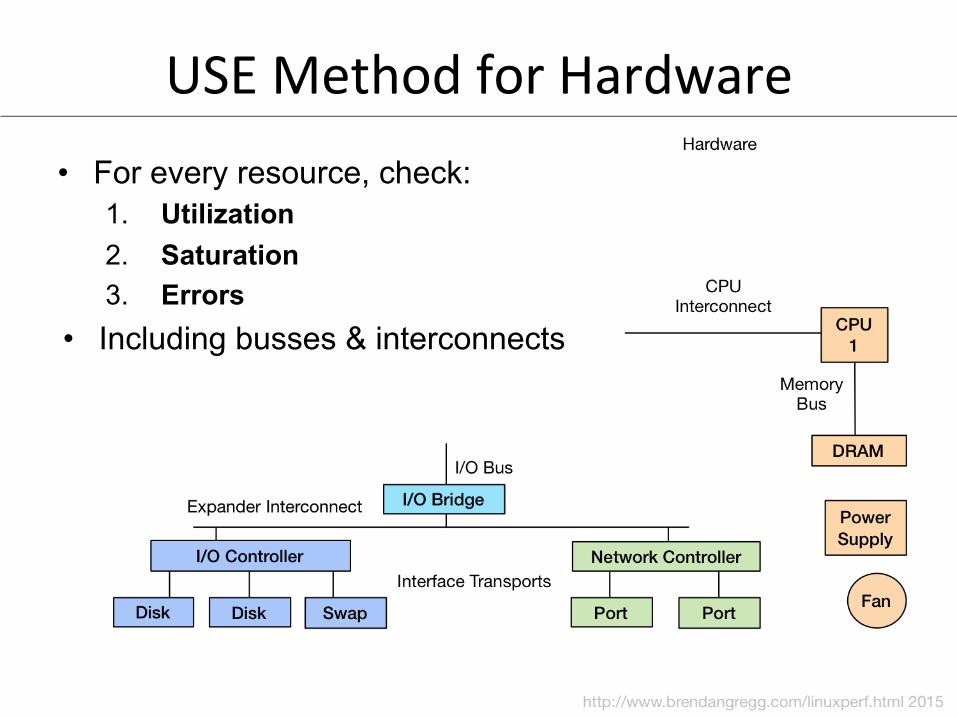
USE Method for Hardware • For every resource, check:
1. Utilization 2. Saturation 3. Errors
• Including busses & interconnects

Linux USE Method Example
hOp://www.brendangregg.com/USEmethod/use-‐linux.html

Off-‐CPU Analysis
On-‐CPU Profiling
Thread State Transi<on Diagram
Off-‐CPU Profiling (everything else)
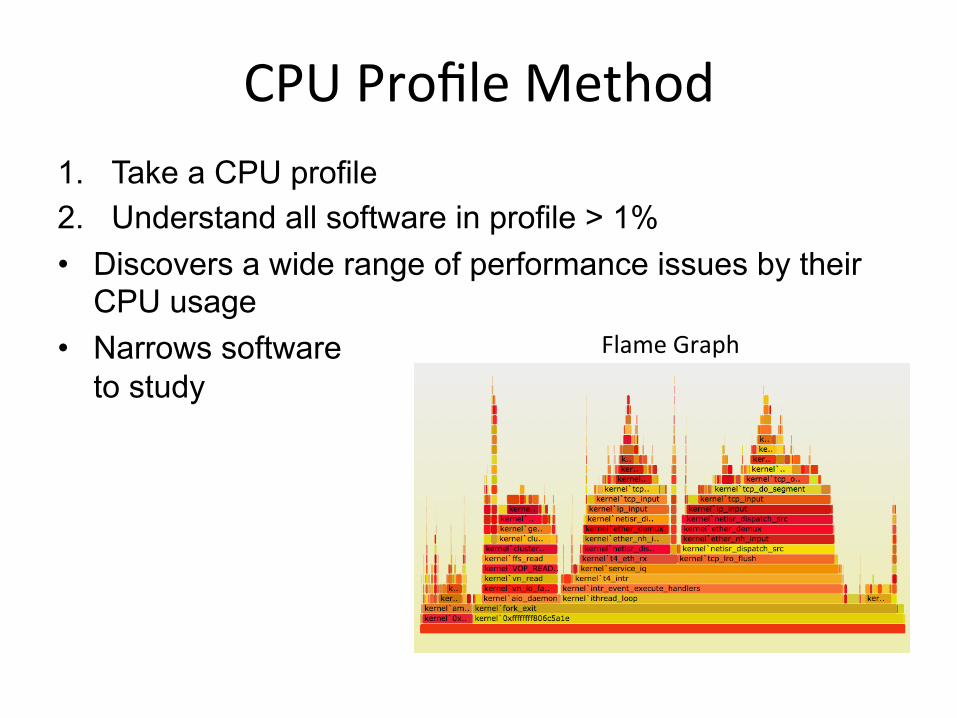
CPU Profile Method 1. Take a CPU profile 2. Understand all software in profile > 1% • Discovers a wide range of performance issues by their
CPU usage • Narrows software
to study Flame Graph
RTFM Method • How to understand performance tools or metrics:
1. Man pages 2. Books 3. Web search 4. Co-workers 5. Prior talk slides/video (this one!) 6. Support services 7. Source code 8. Experimentation 9. Social
Tools

Tools • Objectives:
– Perform the USE Method for resource utilization – Perform Workload Characterization for disks, network – Perform the CPU Profile Method using flame graphs – Have exposure to various observability tools:
• Basic: vmstat, iostat, mpstat, ps, top, … • Intermediate: tcpdump, netstat, nicstat, pidstat, sar, … • Advanced: ss, slaptop, perf_events, …
– Perform Active Benchmarking – Understand tuning risks – Perform Static Performance Tuning

Command Line Tools • Useful to study even if you never use them: GUIs and
commercial products often use the same interfaces
$ vmstat 1!procs -----------memory---------- ---swap-- …! r b swpd free buff cache si so …! 9 0 0 29549320 29252 9299060 0 …! 2 0 0 29547876 29252 9299332 0 …! 4 0 0 29548124 29252 9299460 0 …! 5 0 0 29548840 29252 9299592 0 …!
/proc, /sys, …
Kernel
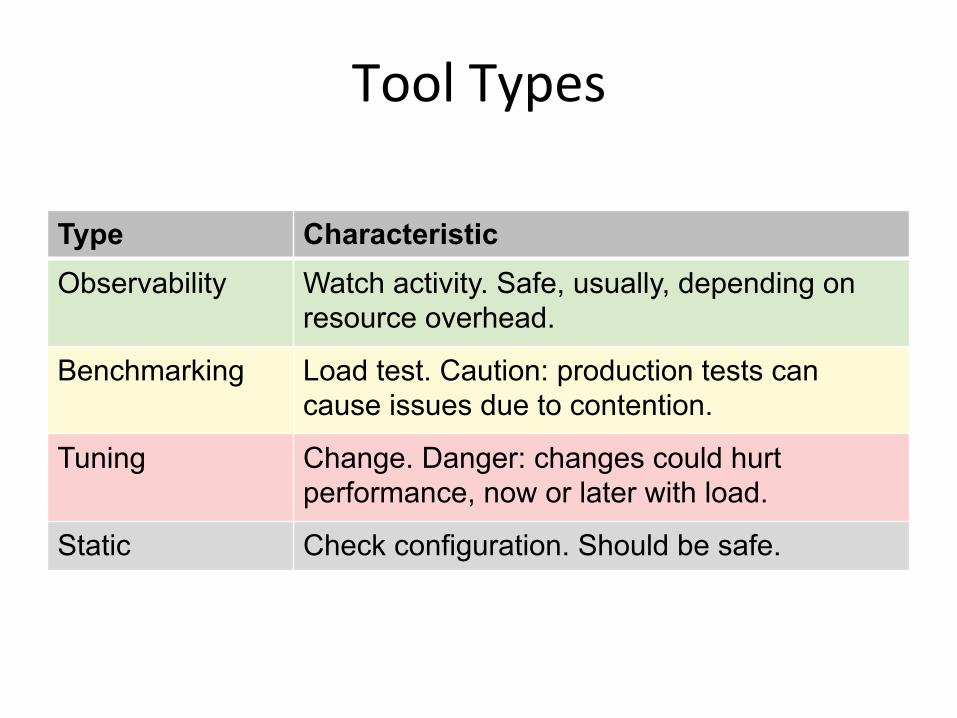
Tool Types
Type Characteristic Observability Watch activity. Safe, usually, depending on
resource overhead.
Benchmarking Load test. Caution: production tests can cause issues due to contention.
Tuning Change. Danger: changes could hurt performance, now or later with load.
Static Check configuration. Should be safe.

Observability Tools
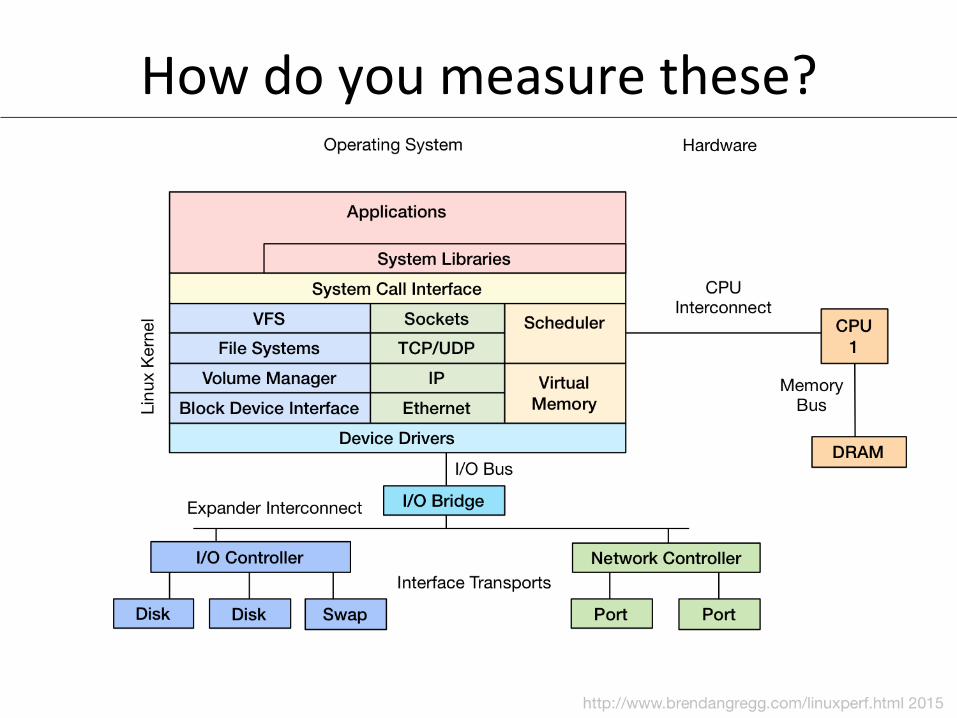
How do you measure these?

Observability Tools: Basic • uptime • top (or htop) • ps • vmstat • iostat • mpstat • free
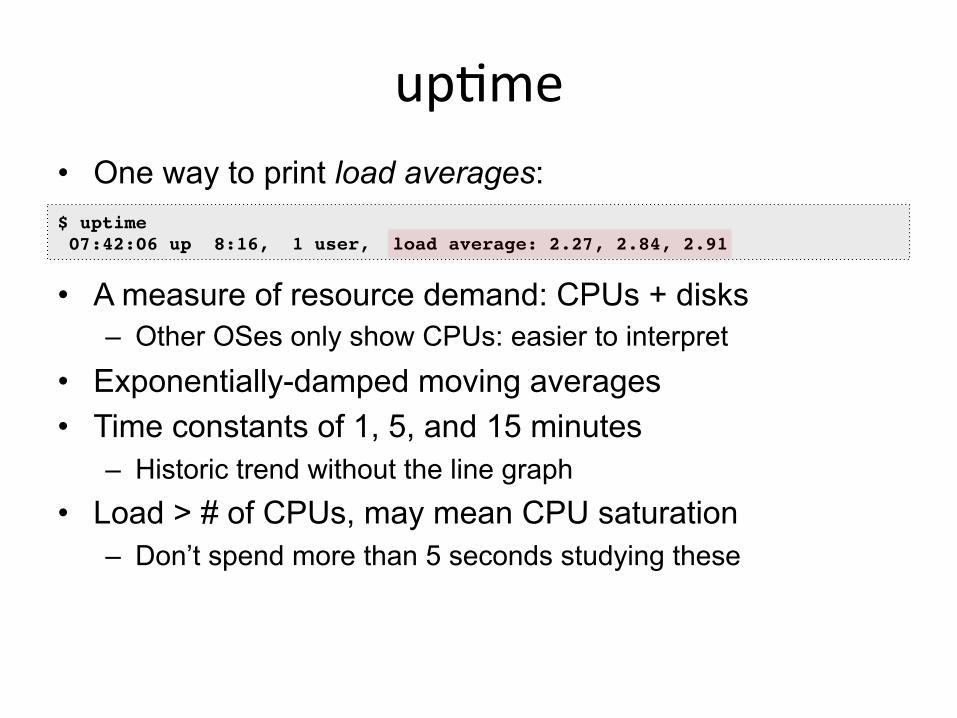
up<me • One way to print load averages: • A measure of resource demand: CPUs + disks
– Other OSes only show CPUs: easier to interpret • Exponentially-damped moving averages • Time constants of 1, 5, and 15 minutes
– Historic trend without the line graph • Load > # of CPUs, may mean CPU saturation
– Don’t spend more than 5 seconds studying these
$ uptime! 07:42:06 up 8:16, 1 user, load average: 2.27, 2.84, 2.91!

top (or htop) • System and per-process interval summary:
• %CPU is summed across all CPUs • Can miss short-lived processes (atop won’t) • Can consume noticeable CPU to read /proc
$ top - 18:50:26 up 7:43, 1 user, load average: 4.11, 4.91, 5.22!Tasks: 209 total, 1 running, 206 sleeping, 0 stopped, 2 zombie!Cpu(s): 47.1%us, 4.0%sy, 0.0%ni, 48.4%id, 0.0%wa, 0.0%hi, 0.3%si, 0.2%st!Mem: 70197156k total, 44831072k used, 25366084k free, 36360k buffers!Swap: 0k total, 0k used, 0k free, 11873356k cached!! PID USER PR NI VIRT RES SHR S %CPU %MEM TIME+ COMMAND ! 5738 apiprod 20 0 62.6g 29g 352m S 417 44.2 2144:15 java ! 1386 apiprod 20 0 17452 1388 964 R 0 0.0 0:00.02 top ! 1 root 20 0 24340 2272 1340 S 0 0.0 0:01.51 init ! 2 root 20 0 0 0 0 S 0 0.0 0:00.00 kthreadd ![…]!

htop

ps • Process status listing (eg, “ASCII art forest”):
• Custom fields:
$ ps -ef f!UID PID PPID C STIME TTY STAT TIME CMD![…]!root 4546 1 0 11:08 ? Ss 0:00 /usr/sbin/sshd -D!root 28261 4546 0 17:24 ? Ss 0:00 \_ sshd: prod [priv]!prod 28287 28261 0 17:24 ? S 0:00 \_ sshd: prod@pts/0 !prod 28288 28287 0 17:24 pts/0 Ss 0:00 \_ -bash!prod 3156 28288 0 19:15 pts/0 R+ 0:00 \_ ps -ef f!root 4965 1 0 11:08 ? Ss 0:00 /bin/sh /usr/bin/svscanboot!root 4969 4965 0 11:08 ? S 0:00 \_ svscan /etc/service![…]!
$ ps -eo user,sz,rss,minflt,majflt,pcpu,args!USER SZ RSS MINFLT MAJFLT %CPU COMMAND!root 6085 2272 11928 24 0.0 /sbin/init![…]!
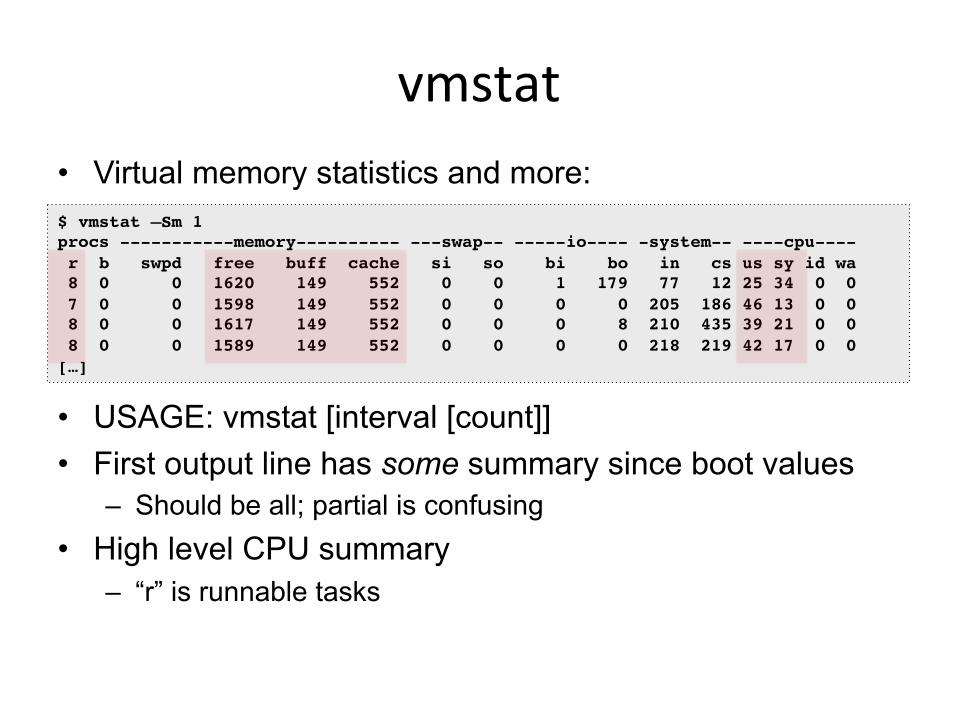
vmstat • Virtual memory statistics and more:
• USAGE: vmstat [interval [count]] • First output line has some summary since boot values
– Should be all; partial is confusing • High level CPU summary
– “r” is runnable tasks
$ vmstat –Sm 1!procs -----------memory---------- ---swap-- -----io---- -system-- ----cpu----! r b swpd free buff cache si so bi bo in cs us sy id wa! 8 0 0 1620 149 552 0 0 1 179 77 12 25 34 0 0! 7 0 0 1598 149 552 0 0 0 0 205 186 46 13 0 0! 8 0 0 1617 149 552 0 0 0 8 210 435 39 21 0 0! 8 0 0 1589 149 552 0 0 0 0 218 219 42 17 0 0![…]!

iostat • Block I/O (disk) stats. 1st output is since boot.
• Very useful set of stats
$ iostat -xmdz 1!!Linux 3.13.0-29 (db001-eb883efa) 08/18/2014 _x86_64_ (16 CPU)!!Device: rrqm/s wrqm/s r/s w/s rMB/s wMB/s \ ...!xvda 0.00 0.00 0.00 0.00 0.00 0.00 / ...!xvdb 213.00 0.00 15299.00 0.00 338.17 0.00 \ ...!xvdc 129.00 0.00 15271.00 3.00 336.65 0.01 / ...!md0 0.00 0.00 31082.00 3.00 678.45 0.01 \ ...!
... \ avgqu-sz await r_await w_await svctm %util! ... / 0.00 0.00 0.00 0.00 0.00 0.00! ... \ 126.09 8.22 8.22 0.00 0.06 86.40! ... / 99.31 6.47 6.47 0.00 0.06 86.00! ... \ 0.00 0.00 0.00 0.00 0.00 0.00!
Workload
Resul<ng Performance

mpstat • Multi-processor statistics, per-CPU:
• Look for unbalanced workloads, hot CPUs.
$ mpstat –P ALL 1![…]!08:06:43 PM CPU %usr %nice %sys %iowait %irq %soft %steal %guest %idle!08:06:44 PM all 53.45 0.00 3.77 0.00 0.00 0.39 0.13 0.00 42.26!08:06:44 PM 0 49.49 0.00 3.03 0.00 0.00 1.01 1.01 0.00 45.45!08:06:44 PM 1 51.61 0.00 4.30 0.00 0.00 2.15 0.00 0.00 41.94!08:06:44 PM 2 58.16 0.00 7.14 0.00 0.00 0.00 1.02 0.00 33.67!08:06:44 PM 3 54.55 0.00 5.05 0.00 0.00 0.00 0.00 0.00 40.40!08:06:44 PM 4 47.42 0.00 3.09 0.00 0.00 0.00 0.00 0.00 49.48!08:06:44 PM 5 65.66 0.00 3.03 0.00 0.00 0.00 0.00 0.00 31.31!08:06:44 PM 6 50.00 0.00 2.08 0.00 0.00 0.00 0.00 0.00 47.92![…]!
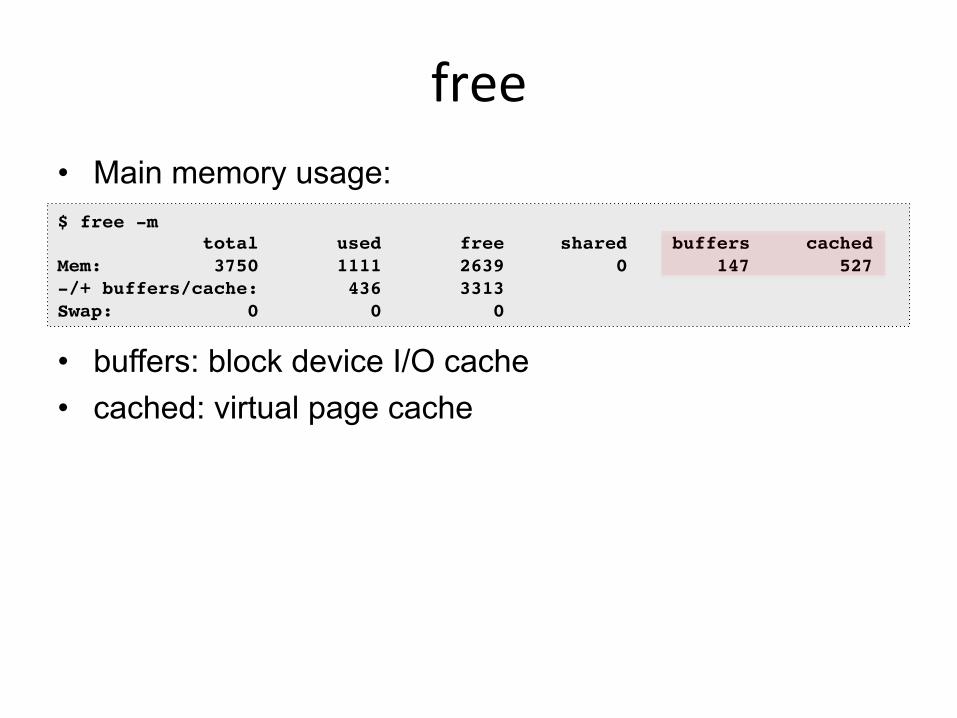
free • Main memory usage:
• buffers: block device I/O cache • cached: virtual page cache
$ free -m! total used free shared buffers cached!Mem: 3750 1111 2639 0 147 527!-/+ buffers/cache: 436 3313!Swap: 0 0 0!

Latency is now much higher…
DEMO
& DISCUSSION

Observability Tools: Basic

Observability Tools: Intermediate • strace • tcpdump • netstat • nicstat • pidstat • swapon • lsof • sar (and collectl, dstat, etc.)
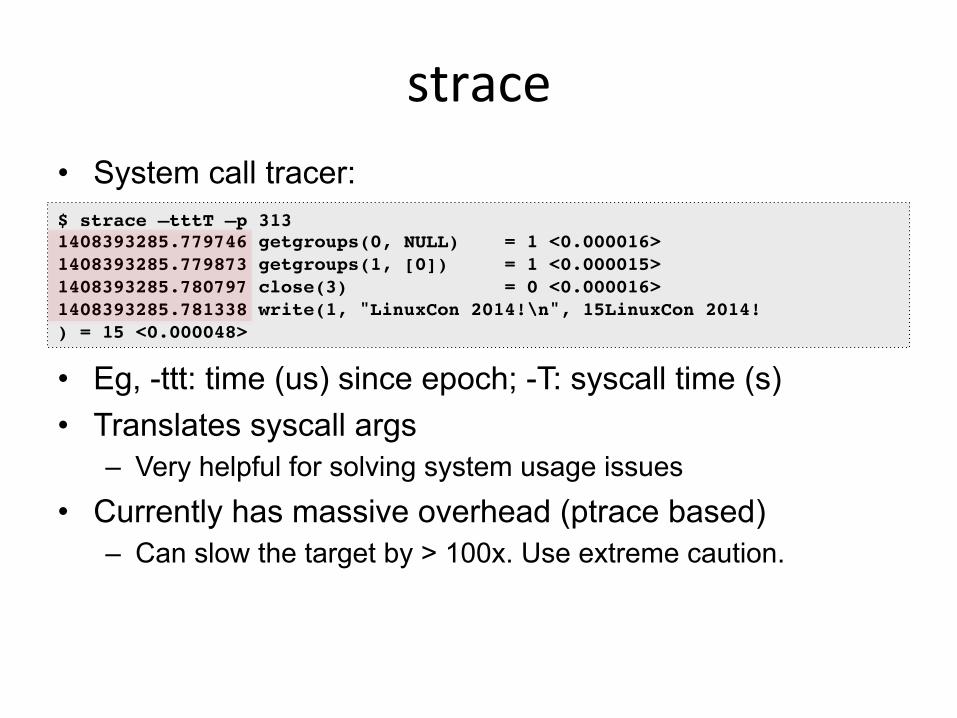
strace • System call tracer:
• Eg, -ttt: time (us) since epoch; -T: syscall time (s) • Translates syscall args
– Very helpful for solving system usage issues • Currently has massive overhead (ptrace based)
– Can slow the target by > 100x. Use extreme caution.
$ strace –tttT –p 313!1408393285.779746 getgroups(0, NULL) = 1 <0.000016>!1408393285.779873 getgroups(1, [0]) = 1 <0.000015>!1408393285.780797 close(3) = 0 <0.000016>!1408393285.781338 write(1, "LinuxCon 2014!\n", 15LinuxCon 2014!!) = 15 <0.000048>!

tcpdump • Sniff network packets for post analysis:
• Study packet sequences with timestamps (us) • CPU overhead optimized (socket ring buffers), but can
still be significant. Use caution.
$ tcpdump -i eth0 -w /tmp/out.tcpdump!tcpdump: listening on eth0, link-type EN10MB (Ethernet), capture size 65535 bytes!^C7985 packets captured!8996 packets received by filter!1010 packets dropped by kernel!# tcpdump -nr /tmp/out.tcpdump | head !reading from file /tmp/out.tcpdump, link-type EN10MB (Ethernet) !20:41:05.038437 IP 10.44.107.151.22 > 10.53.237.72.46425: Flags [P.], seq 18...!20:41:05.038533 IP 10.44.107.151.22 > 10.53.237.72.46425: Flags [P.], seq 48...!20:41:05.038584 IP 10.44.107.151.22 > 10.53.237.72.46425: Flags [P.], seq 96...![…]!

netstat • Various network protocol statistics using -s: • A multi-tool:
-i: interface stats -r: route table default: list conns
• netstat -p: shows process details!
• Per-second interval with -c
$ netstat –s![…]!Tcp:! 736455 active connections openings! 176887 passive connection openings! 33 failed connection attempts! 1466 connection resets received! 3311 connections established! 91975192 segments received! 180415763 segments send out! 223685 segments retransmited! 2 bad segments received.! 39481 resets sent![…]!TcpExt:! 12377 invalid SYN cookies received! 2982 delayed acks sent![…]!

nicstat • Network interface stats, iostat-like output:
• Check network throughput and interface %util • I wrote this years ago; Tim Cook ported to Linux
$ ./nicstat 1! Time Int rKB/s wKB/s rPk/s wPk/s rAvs wAvs %Util Sat!21:21:43 lo 823.0 823.0 171.5 171.5 4915.4 4915.4 0.00 0.00!21:21:43 eth0 5.53 1.74 15.11 12.72 374.5 139.8 0.00 0.00! Time Int rKB/s wKB/s rPk/s wPk/s rAvs wAvs %Util Sat!21:21:44 lo 0.00 0.00 0.00 0.00 0.00 0.00 0.00 0.00!21:21:44 eth0 20.42 3394.1 355.8 85.94 58.76 40441.3 0.00 0.00! Time Int rKB/s wKB/s rPk/s wPk/s rAvs wAvs %Util Sat!21:21:45 lo 1409.1 1409.1 327.9 327.9 4400.8 4400.8 0.00 0.00!21:21:45 eth0 75.12 4402.3 1398.9 1513.2 54.99 2979.1 0.00 0.00![…]!
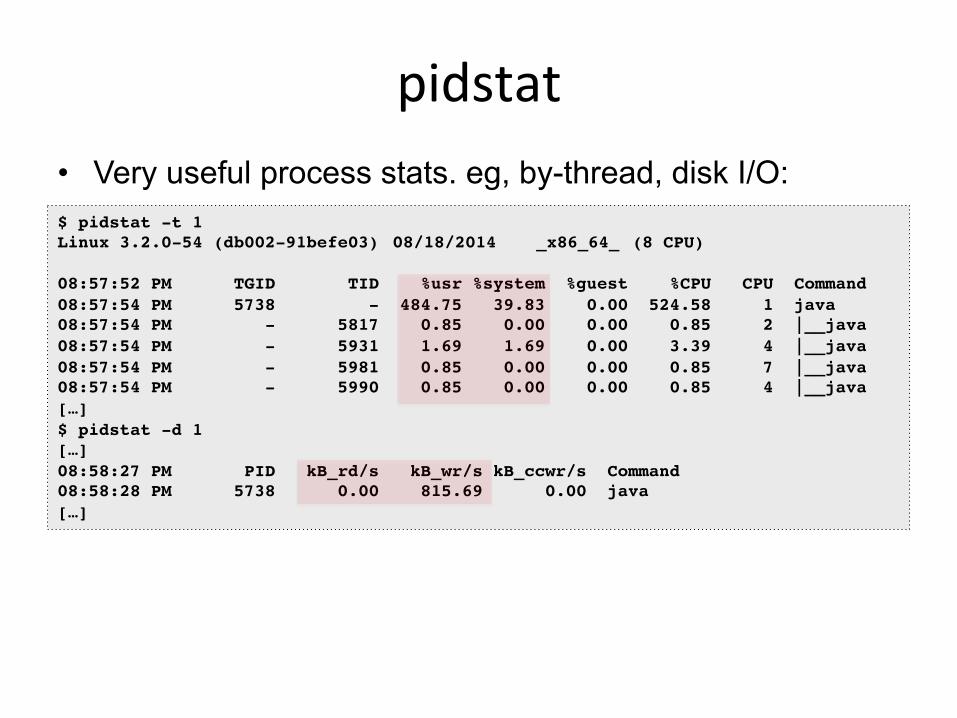
pidstat • Very useful process stats. eg, by-thread, disk I/O:
• I usually prefer this over top(1)
$ pidstat -t 1!Linux 3.2.0-54 (db002-91befe03) !08/18/2014 !_x86_64_!(8 CPU)!!08:57:52 PM TGID TID %usr %system %guest %CPU CPU Command!08:57:54 PM 5738 - 484.75 39.83 0.00 524.58 1 java!08:57:54 PM - 5817 0.85 0.00 0.00 0.85 2 |__java!08:57:54 PM - 5931 1.69 1.69 0.00 3.39 4 |__java!08:57:54 PM - 5981 0.85 0.00 0.00 0.85 7 |__java!08:57:54 PM - 5990 0.85 0.00 0.00 0.85 4 |__java![…]!$ pidstat -d 1![…]!08:58:27 PM PID kB_rd/s kB_wr/s kB_ccwr/s Command!08:58:28 PM 5738 0.00 815.69 0.00 java![…]!
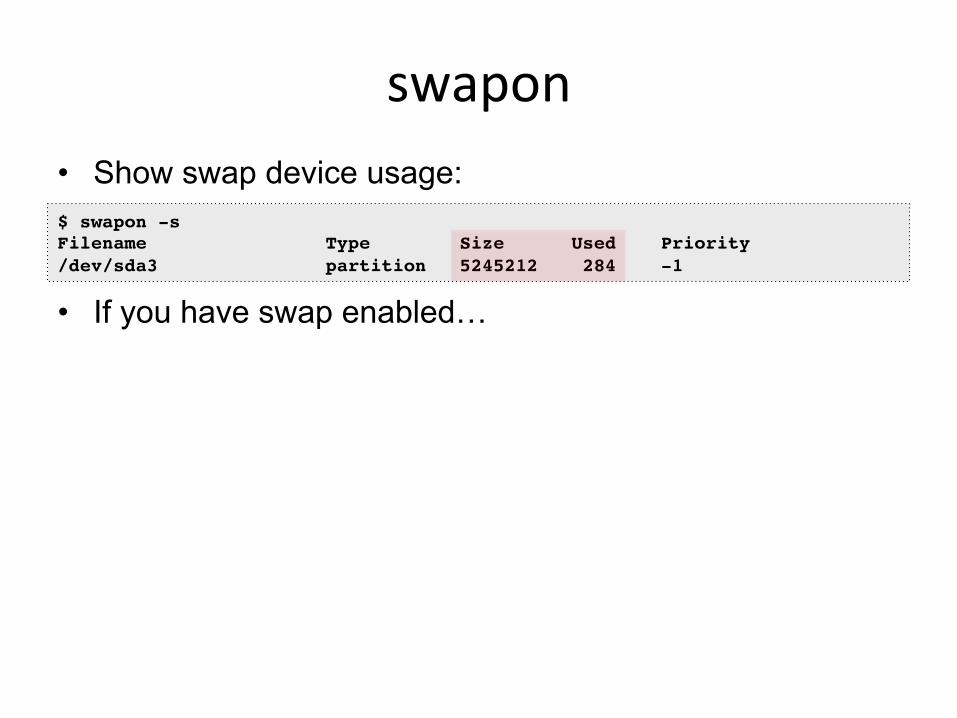
swapon • Show swap device usage:
• If you have swap enabled…
$ swapon -s!Filename Type Size Used Priority!/dev/sda3 partition 5245212 284 -1!

lsof • More a debug tool, lsof(8) shows file descriptor usage,
which for some apps, equals current active network connections:
• I’d prefer to: echo /proc/PID/fd | wc -l!
# lsof -iTCP -sTCP:ESTABLISHED!COMMAND PID USER FD TYPE DEVICE SIZE/OFF NODE NAME!sshd 755 root 3r IPv4 13576887 0t0 TCP bgregg-test-i-f106:ssh->prod100.netflix.com:15241 (ESTABLISHED)!platforms 2614 app1 8u IPv4 14618 0t0 TCP localhost:33868->localhost:5433 (ESTABLISHED)!postgres 2648 app1 7u IPv4 14619 0t0 TCP localhost:5433->localhost:33868 (ESTABLISHED)!epic_plug 2857 app1 7u IPv4 15678 0t0 TCP localhost:33885->localhost:5433 (ESTABLISHED)!postgres 2892 app1 7u IPv4 15679 0t0 TCP localhost:5433->localhost:33885 (ESTABLISHED)![…]!

sar • System Activity Reporter. Many stats, eg:
• Archive or live mode: (interval [count]) • Well designed. Header naming convention, logical
groups: TCP, ETCP, DEV, EDEV, …
$ sar -n TCP,ETCP,DEV 1!Linux 3.2.55 (test-e4f1a80b) !08/18/2014 !_x86_64_!(8 CPU)!!09:10:43 PM IFACE rxpck/s txpck/s rxkB/s txkB/s rxcmp/s txcmp/s rxmcst/s!09:10:44 PM lo 14.00 14.00 1.34 1.34 0.00 0.00 0.00!09:10:44 PM eth0 4114.00 4186.00 4537.46 28513.24 0.00 0.00 0.00!!09:10:43 PM active/s passive/s iseg/s oseg/s!09:10:44 PM 21.00 4.00 4107.00 22511.00!!09:10:43 PM atmptf/s estres/s retrans/s isegerr/s orsts/s!09:10:44 PM 0.00 0.00 36.00 0.00 1.00![…]!
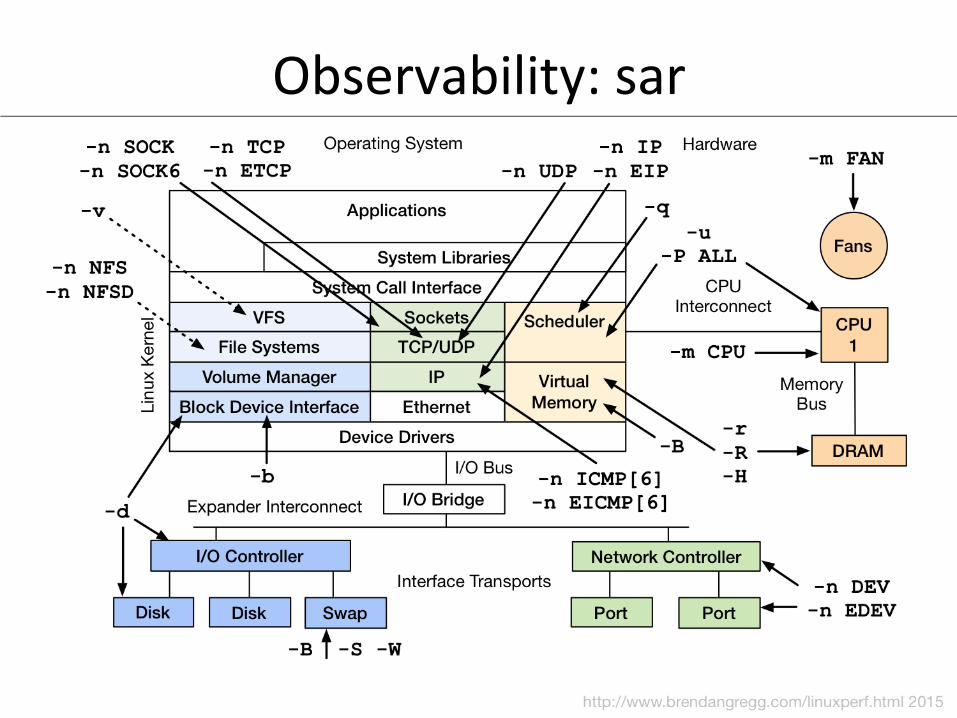
Observability: sar

Other Tools • You may also use collectl, atop, dstat, or another
measure-all tool • The tool isn’t important – it’s important to have a way to
measure everything • In cloud environments, you are probably using a
monitoring product, developed in-house or commercial. – We develop Atlas for cloud-wide monitoring, and Vector for
instance-level analysis (both NetflixOSS) – Same method applies…

How does your monitoring tool measure these?

App is taking forever…
DEMO
& DISCUSSION

Observability Tools: Intermediate

Advanced Observability Tools • Misc:
– ltrace, ss, iptraf, ethtool, snmpget, lldptool, iotop, blktrace, slabtop, /proc, pcstat
• CPU Performance Counters: – perf_events, tiptop, rdmsr
• Advanced Tracers: – perf_events, ftrace, eBPF, SystemTap, ktap, LTTng,
dtrace4linux, sysdig • Some selected demos…

ss • More socket statistics: $ ss -mop!State Recv-Q Send-Q Local Address:Port Peer Address:Port !CLOSE-WAIT 1 0 127.0.0.1:42295 127.0.0.1:28527 users:(("apacheLogParser",2702,3))!
! mem:(r1280,w0,f2816,t0)!ESTAB 0 0 127.0.0.1:5433 127.0.0.1:41312 timer:(keepalive,36min,0) users:(("postgres",2333,7))!
! mem:(r0,w0,f0,t0)![…]!$ ss –i!State Recv-Q Send-Q Local Address:Port Peer Address:Port !CLOSE-WAIT 1 0 127.0.0.1:42295 127.0.0.1:28527 ! cubic wscale:6,6 rto:208 rtt:9/6 ato:40 cwnd:10 send 145.6Mbps rcv_space:32792!ESTAB 0 0 10.144.107.101:ssh 10.53.237.72:4532 ! cubic wscale:4,6 rto:268 rtt:71.5/3 ato:40 cwnd:10 send 1.5Mbps rcv_rtt:72 rcv_space:14480![…]!

iptraf

iotop • Block device I/O (disk) by process:
• Needs kernel support enabled – CONFIG_TASK_IO_ACCOUNTING
$ iotop! Total DISK READ: 50.47 M/s | Total DISK WRITE: 59.21 M/s! TID PRIO USER DISK READ DISK WRITE SWAPIN IO> COMMAND ! 959 be/4 root 0.00 B/s 0.00 B/s 0.00 % 99.99 % [flush-202:1]! 6641 be/4 root 50.47 M/s 82.60 M/s 0.00 % 32.51 % java –Dnop –X! 1 be/4 root 0.00 B/s 0.00 B/s 0.00 % 0.00 % init! 2 be/4 root 0.00 B/s 0.00 B/s 0.00 % 0.00 % [kthreadd]! 3 be/4 root 0.00 B/s 0.00 B/s 0.00 % 0.00 % [ksoftirqd/0]! 4 be/4 root 0.00 B/s 0.00 B/s 0.00 % 0.00 % [kworker/0:0]! 5 be/4 root 0.00 B/s 0.00 B/s 0.00 % 0.00 % [kworker/u:0]! 6 rt/4 root 0.00 B/s 0.00 B/s 0.00 % 0.00 % [migration/0]![…]!

slabtop • Kernel slab allocator memory usage: $ slabtop! Active / Total Objects (% used) : 4692768 / 4751161 (98.8%)! Active / Total Slabs (% used) : 129083 / 129083 (100.0%)! Active / Total Caches (% used) : 71 / 109 (65.1%)! Active / Total Size (% used) : 729966.22K / 738277.47K (98.9%)! Minimum / Average / Maximum Object : 0.01K / 0.16K / 8.00K!! OBJS ACTIVE USE OBJ SIZE SLABS OBJ/SLAB CACHE SIZE NAME !3565575 3565575 100% 0.10K 91425 39 365700K buffer_head!314916 314066 99% 0.19K 14996 21 59984K dentry!184192 183751 99% 0.06K 2878 64 11512K kmalloc-64!138618 138618 100% 0.94K 4077 34 130464K xfs_inode!138602 138602 100% 0.21K 3746 37 29968K xfs_ili!102116 99012 96% 0.55K 3647 28 58352K radix_tree_node! 97482 49093 50% 0.09K 2321 42 9284K kmalloc-96! 22695 20777 91% 0.05K 267 85 1068K shared_policy_node! 21312 21312 100% 0.86K 576 37 18432K ext4_inode_cache! 16288 14601 89% 0.25K 509 32 4072K kmalloc-256![…]!
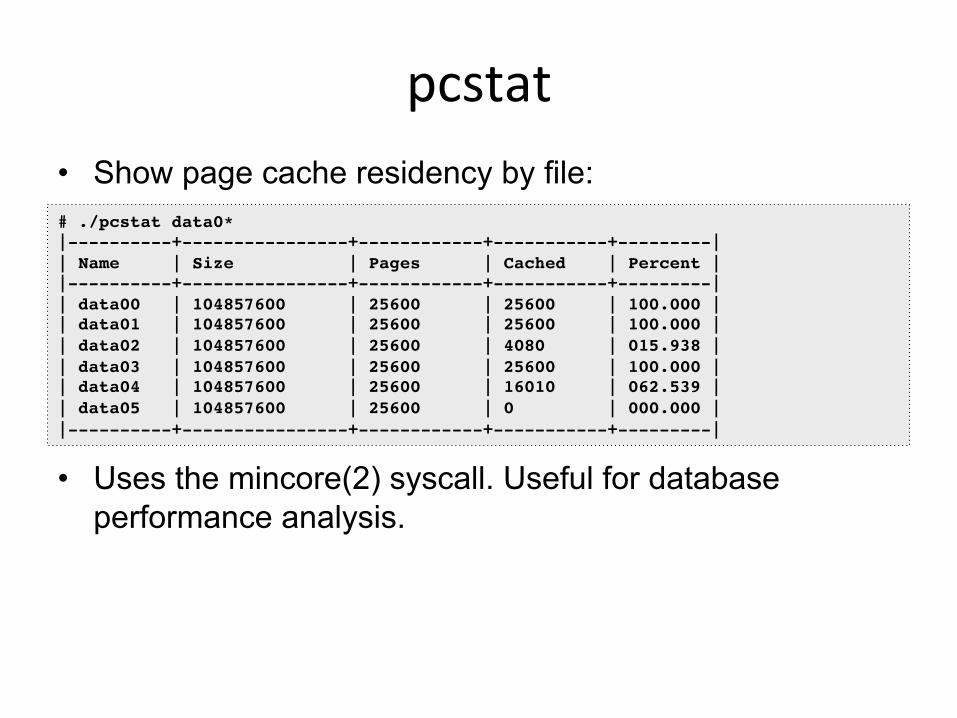
pcstat • Show page cache residency by file:
• Uses the mincore(2) syscall. Useful for database performance analysis.
# ./pcstat data0*!|----------+----------------+------------+-----------+---------|!| Name | Size | Pages | Cached | Percent |!|----------+----------------+------------+-----------+---------|!| data00 | 104857600 | 25600 | 25600 | 100.000 |!| data01 | 104857600 | 25600 | 25600 | 100.000 |!| data02 | 104857600 | 25600 | 4080 | 015.938 |!| data03 | 104857600 | 25600 | 25600 | 100.000 |!| data04 | 104857600 | 25600 | 16010 | 062.539 |!| data05 | 104857600 | 25600 | 0 | 000.000 |!|----------+----------------+------------+-----------+---------|!

perf_events • Provides the "perf" command • In Linux source code: tools/perf
– Usually pkg added by linux-tools-common, etc. • Multi-tool with many capabilities
– CPU profiling – PMC profiling – Static & dynamic tracing
• Covered later in Profiling & Tracing

<ptop
• IPC by process, %MISS, %BUS • Needs some love. perfmon2 library integration? • Still can’t use it in clouds yet (needs PMCs enabled)

rdmsr • Model Specific Registers (MSRs), unlike PMCs, can be
read by default in Xen guests – Timestamp clock, temp, power, … – Use rdmsr(1) from the msr-tools package to read them – From https://github.com/brendangregg/msr-cloud-tools:
ec2-guest# ./showboost![...]!TIME C0_MCYC C0_ACYC UTIL RATIO MHz!06:11:35 6428553166 7457384521 51% 116% 2900!06:11:40 6349881107 7365764152 50% 115% 2899!06:11:45 6240610655 7239046277 49% 115% 2899![...]!ec2-guest# ./cputemp 1!CPU1 CPU2 CPU3 CPU4!61 61 60 59!60 61 60 60![...]!
Real CPU MHz
CPU Temperature

More Advanced Tools… • Some others worth mentioning:
Tool Descrip-on ltrace Library call tracer ethtool Mostly interface tuning; some stats snmpget SNMP network host sta<s<cs lldptool Can get LLDP broadcast stats blktrace Block I/O event tracer /proc Many raw kernel counters pmu-‐tools On-‐ and off-‐core CPU counter tools

Advanced Tracers • Many options on Linux:
– perf_events, ftrace, eBPF, SystemTap, ktap, LTTng, dtrace4linux, sysdig
• Most can do static and dynamic tracing – Static: pre-defined events (tracepoints) – Dynamic: instrument any software (kprobes, uprobes).
Custom metrics on-demand. Catch all. • Many are in-development

Linux Observability Tools
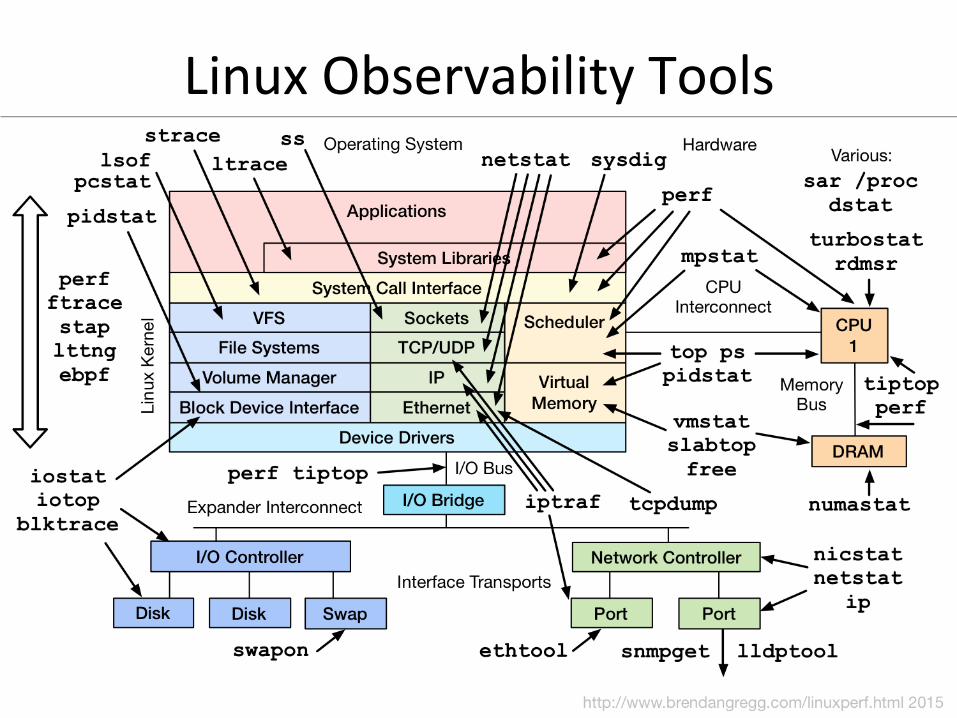
Linux Observability Tools
Benchmarking Tools

Benchmarking Tools • Multi:
– UnixBench, lmbench, sysbench, perf bench • FS/disk:
– dd, hdparm, fio • App/lib:
– ab, wrk, jmeter, openssl • Networking:
– ping, hping3, iperf, ttcp, traceroute, mtr, pchar

Benchmarking • ~100% of benchmarks are wrong • Results are usually misleading:
you benchmark A, but actually measure B, and conclude you measured C
• Common mistakes: – Testing the wrong target: eg, FS cache instead of disk – Choosing the wrong target: eg, disk instead of FS cache
… doesn’t resemble real world usage – Invalid results: eg, bugs
• The energy needed to refute benchmarks is multiple orders of magnitude bigger than to run them

Ac<ve Benchmarking (Method) 1. Run the benchmark for hours 2. While running, analyze and confirm the performance
limiter using observability tools – Disk benchmark: run iostat, … – CPU benchmark: run pidstat, perf, flame graphs, … – …
• Answer the question: why isn't the result 10x?
We just covered the observability tools – use them!

lmbench • CPU, memory, and kernel micro-benchmarks • Eg, memory latency by stride size: $ lat_mem_rd 100m 128 > out.latencies!some R processing…!
L1 cache
L2 cache Main Memory
L3 cache

fio • FS or disk I/O micro-benchmarks $ fio --name=seqwrite --rw=write --bs=128k --size=122374m![…]!seqwrite: (groupid=0, jobs=1): err= 0: pid=22321! write: io=122374MB, bw=840951KB/s, iops=6569 , runt=149011msec! clat (usec): min=41 , max=133186 , avg=148.26, stdev=1287.17! lat (usec): min=44 , max=133188 , avg=151.11, stdev=1287.21! bw (KB/s) : min=10746, max=1983488, per=100.18%, avg=842503.94, stdev=262774.35! cpu : usr=2.67%, sys=43.46%, ctx=14284, majf=1, minf=24! IO depths : 1=100.0%, 2=0.0%, 4=0.0%, 8=0.0%, 16=0.0%, 32=0.0%, >=64=0.0%! submit : 0=0.0%, 4=100.0%, 8=0.0%, 16=0.0%, 32=0.0%, 64=0.0%, >=64=0.0%! complete : 0=0.0%, 4=100.0%, 8=0.0%, 16=0.0%, 32=0.0%, 64=0.0%, >=64=0.0%! issued r/w/d: total=0/978992/0, short=0/0/0! lat (usec): 50=0.02%, 100=98.30%, 250=1.06%, 500=0.01%, 750=0.01%! lat (usec): 1000=0.01%! lat (msec): 2=0.01%, 4=0.01%, 10=0.25%, 20=0.29%, 50=0.06%! lat (msec): 100=0.01%, 250=0.01%!
• Results include basic latency distribution
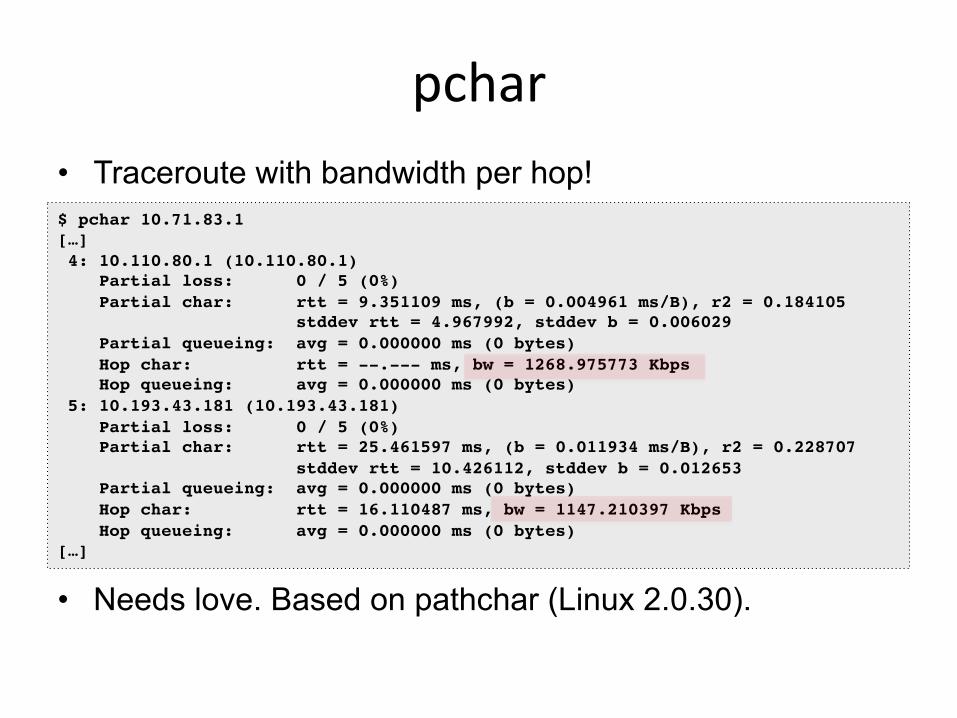
pchar • Traceroute with bandwidth per hop! $ pchar 10.71.83.1![…]! 4: 10.110.80.1 (10.110.80.1)! Partial loss: 0 / 5 (0%)! Partial char: rtt = 9.351109 ms, (b = 0.004961 ms/B), r2 = 0.184105! stddev rtt = 4.967992, stddev b = 0.006029! Partial queueing: avg = 0.000000 ms (0 bytes)! Hop char: rtt = --.--- ms, bw = 1268.975773 Kbps! Hop queueing: avg = 0.000000 ms (0 bytes)! 5: 10.193.43.181 (10.193.43.181)! Partial loss: 0 / 5 (0%)! Partial char: rtt = 25.461597 ms, (b = 0.011934 ms/B), r2 = 0.228707! stddev rtt = 10.426112, stddev b = 0.012653! Partial queueing: avg = 0.000000 ms (0 bytes)! Hop char: rtt = 16.110487 ms, bw = 1147.210397 Kbps! Hop queueing: avg = 0.000000 ms (0 bytes)![…]!
• Needs love. Based on pathchar (Linux 2.0.30).

Benchmarking Tools

Tuning Tools

Tuning Tools • Generic interfaces:
– sysctl, /sys • Many areas have custom tuning tools:
– Applications: their own config – CPU/scheduler: nice, renice, taskset, ulimit, chcpu – Storage I/O: tune2fs, ionice, hdparm, blockdev, … – Network: ethtool, tc, ip, route – Dynamic patching: stap, kpatch

Tuning Methods • Scientific Method:
1. Question 2. Hypothesis 3. Prediction 4. Test 5. Analysis
• Any observational or benchmarking tests you can try before tuning?
• Consider risks, and see previous tools

Tuning Tools

Sta<c Tools

Sta<c Tools • Static Performance Tuning: check the static state and
configuration of the system – CPU types & flags – CPU frequency scaling config – Storage devices – File system capacity – File system and volume configuration – Route table – State of hardware – etc.
• What can be checked on a system without load • Methodology by Richard Elling (2000)

CPU Types & Flags $ more /proc/cpuinfo !processor! !: 0!vendor_id! !: GenuineIntel!cpu family !: 6!model ! !: 42!model name !: Intel(R) Core(TM) i5-2400 CPU @ 3.10GHz!stepping ! !: 7!microcode! !: 0x1a!cpu MHz ! !: 1600.000!cache size !: 6144 KB!physical id !: 0!siblings ! !: 4!core id ! !: 0!cpu cores! !: 4!apicid ! !: 0!initial apicid!: 0!fpu ! ! !: yes!fpu_exception !: yes!cpuid level !: 13!wp ! ! !: yes!flags ! !: fpu vme de pse tsc msr pae mce cx8 apic sep mtrr pge mca cmov pat pse36 clflush dts acpi mmx fxsr sse sse2 ss ht tm pbe syscall nx rdtscp lm constant_tsc ar!ch_perfmon pebs bts rep_good nopl xtopology nonstop_tsc aperfmperf eagerfpu pni pclmulqdq dtes64 monitor ds_cpl vmx smx est tm2 ssse3 cx16 xtpr pdcm pcid sse4_1 sse4_2 x2apic popcnt tsc_deadline_timer aes xsave avx lahf_lm ida arat epb xsaveopt pln pts dtherm tpr_shadow vnmi flexpriority ept vpid![…]!
CPU speed s<ll maOers
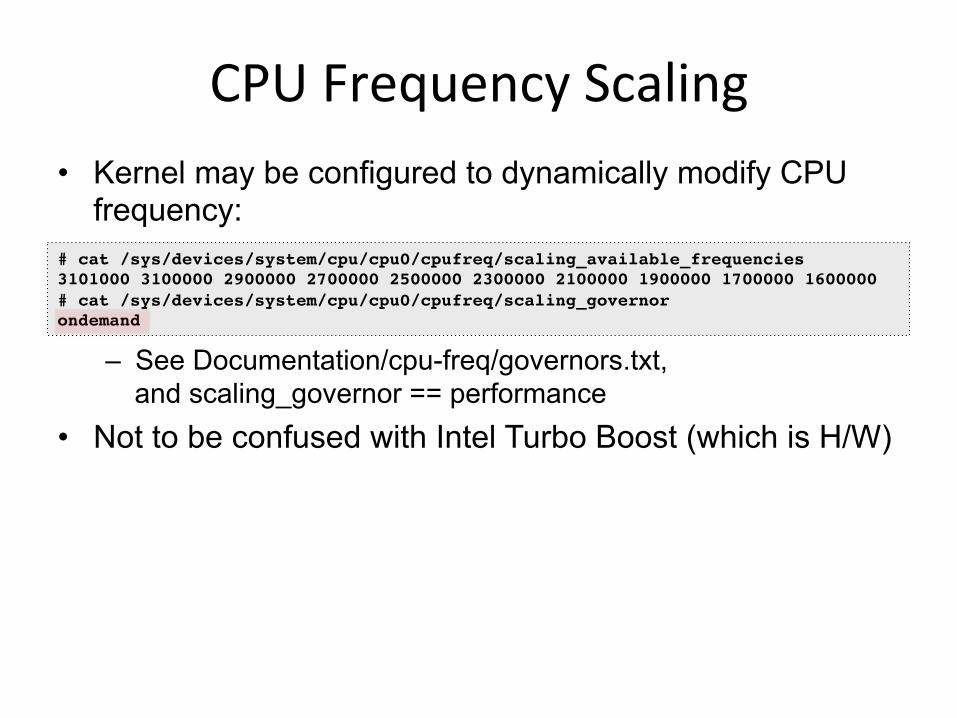
CPU Frequency Scaling • Kernel may be configured to dynamically modify CPU
frequency:
– See Documentation/cpu-freq/governors.txt,
and scaling_governor == performance • Not to be confused with Intel Turbo Boost (which is H/W)
# cat /sys/devices/system/cpu/cpu0/cpufreq/scaling_available_frequencies !3101000 3100000 2900000 2700000 2500000 2300000 2100000 1900000 1700000 1600000 !# cat /sys/devices/system/cpu/cpu0/cpufreq/scaling_governor !ondemand!

Storage Devices
• Micro-benchmarking disks (not file systems!) is also useful for understanding their characteristics
# cat /proc/scsi/scsi!Attached devices:!Host: scsi0 Channel: 00 Id: 00 Lun: 00! Vendor: ATA Model: ST3320413AS Rev: JC65! Type: Direct-Access ANSI SCSI revision: 05!Host: scsi1 Channel: 00 Id: 00 Lun: 00! Vendor: PLDS Model: DVD-RW DH16ABSH Rev: YL32! Type: CD-ROM ANSI SCSI revision: 05!!# lsscsi![0:0:0:0] disk ATA ST3320413AS JC65 /dev/sda ![1:0:0:0] cd/dvd PLDS DVD-RW DH16ABSH YL32 /dev/sr0 !
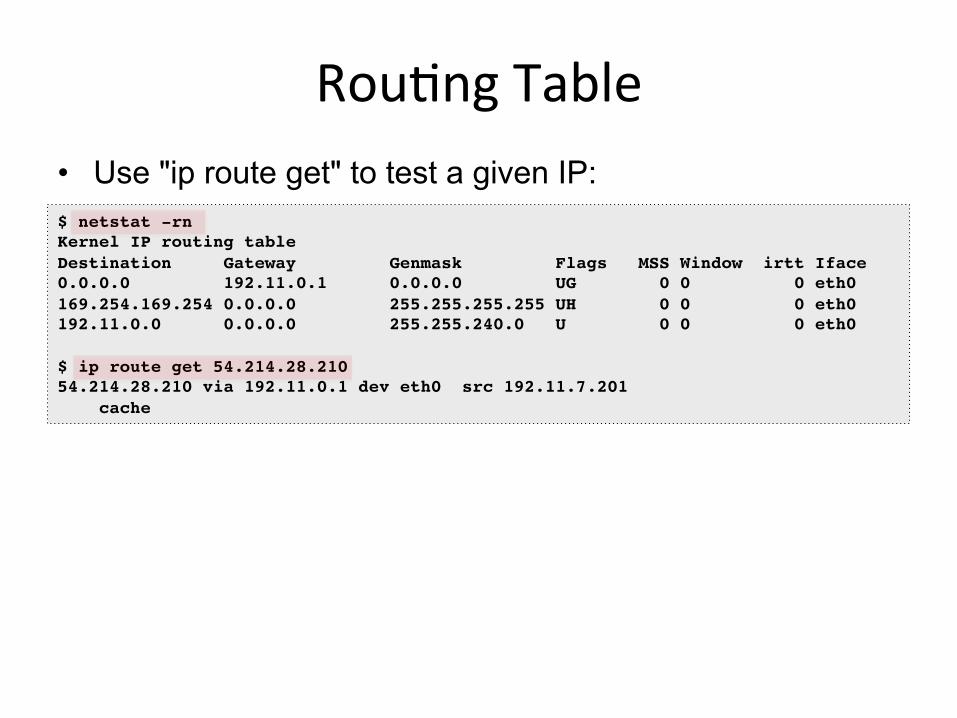
Rou<ng Table • Use "ip route get" to test a given IP: $ netstat -rn!Kernel IP routing table!Destination Gateway Genmask Flags MSS Window irtt Iface!0.0.0.0 192.11.0.1 0.0.0.0 UG 0 0 0 eth0!169.254.169.254 0.0.0.0 255.255.255.255 UH 0 0 0 eth0!192.11.0.0 0.0.0.0 255.255.240.0 U 0 0 0 eth0!!$ ip route get 54.214.28.210!54.214.28.210 via 192.11.0.1 dev eth0 src 192.11.7.201 ! cache !

etc… • System messages: dmesg!• Network interface config: ifconfig –a; ip link • File system capacity: df -h!• Volume config: mdadm --misc -D /dev/md0 !• Storage device info: smartctl!• NUMA config: numactl -s; numactl -H!• PCI info: lspci • Installed kernel modules: lsmod!• Root crontab config: crontab –l!• Services: service --status-all!• …

Sta<c Tools

Profiling

Profiling • Objectives:
– Profile CPU usage by stack sampling – Generate CPU flame graphs – Understand gotchas with stacks & symbols
CPU Profiling
A!B!
block interrupt
on-‐CPU off-‐CPU
A!B!A! A!
B!A!
syscall
<me
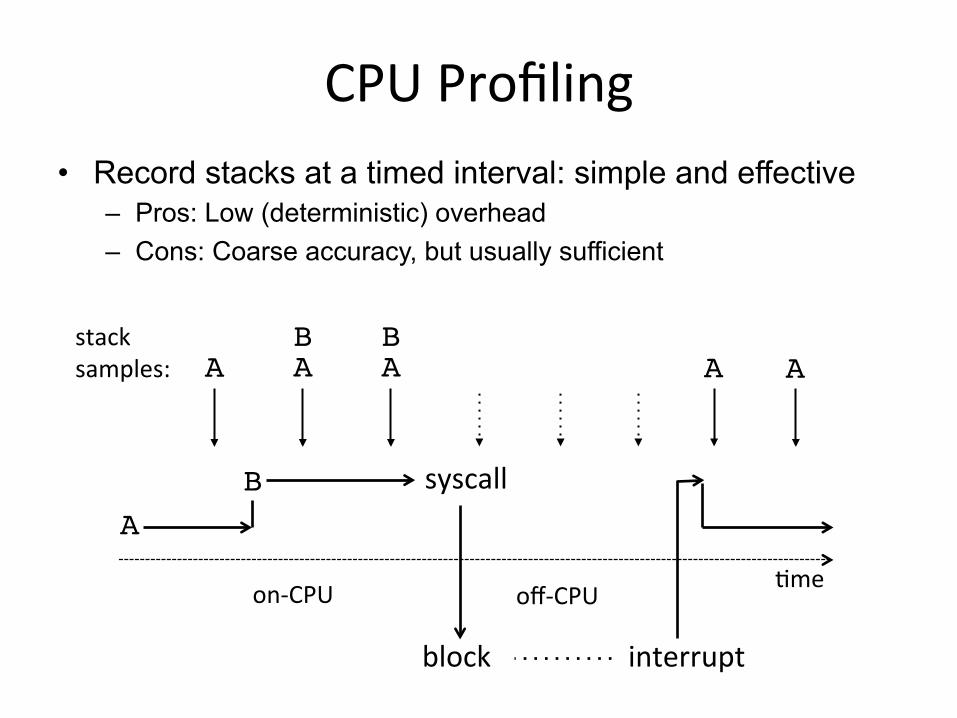
• Record stacks at a timed interval: simple and effective – Pros: Low (deterministic) overhead – Cons: Coarse accuracy, but usually sufficient
stack samples: A!

perf_events • Introduced earlier: multi-tool, profiler. Provides "perf". usage: perf [--version] [--help] [OPTIONS] COMMAND [ARGS]!! The most commonly used perf commands are:! annotate Read perf.data (created by perf record) and display annotated code! archive Create archive with object files with build-ids found in perf.data file! bench General framework for benchmark suites! buildid-cache Manage build-id cache.! buildid-list List the buildids in a perf.data file! data Data file related processing! diff Read perf.data files and display the differential profile! evlist List the event names in a perf.data file! inject Filter to augment the events stream with additional information! kmem Tool to trace/measure kernel memory(slab) properties! kvm Tool to trace/measure kvm guest os! list List all symbolic event types! lock Analyze lock events! mem Profile memory accesses! record Run a command and record its profile into perf.data! report Read perf.data (created by perf record) and display the profile! sched Tool to trace/measure scheduler properties (latencies)! script Read perf.data (created by perf record) and display trace output! stat Run a command and gather performance counter statistics! test Runs sanity tests.! timechart Tool to visualize total system behavior during a workload! top System profiling tool.! trace strace inspired tool! probe Define new dynamic tracepoints!! See 'perf help COMMAND' for more information on a specific command.!

perf_events: CPU profiling • Sampling full stack traces at 99 Hertz, for 30 secs: # perf record -F 99 -ag -- sleep 30![ perf record: Woken up 9 times to write data ]![ perf record: Captured and wrote 2.745 MB perf.data (~119930 samples) ]!# perf report -n --stdio!1.40% 162 java [kernel.kallsyms] [k] _raw_spin_lock ! |! --- _raw_spin_lock! | ! |--63.21%-- try_to_wake_up! | | ! | |--63.91%-- default_wake_function! | | | ! | | |--56.11%-- __wake_up_common! | | | __wake_up_locked! | | | ep_poll_callback! | | | __wake_up_common! | | | __wake_up_sync_key! | | | | ! | | | |--59.19%-- sock_def_readable![…78,000 lines truncated…]!

perf_events: Full "report" Output

… as a Flame Graph

perf_events: Flame Graphs
• Flame Graphs: – x-axis: alphabetical stack sort, to maximize merging – y-axis: stack depth – color: random, or hue can be a dimension (eg, diff)
• Interpretation: – Top edge is on-CPU, beneath it is ancestry
• Currently made from Perl + JavaScript & SVG • Easy to get working
– http://www.brendangregg.com/FlameGraphs/cpuflamegraphs.html
git clone --depth 1 https://github.com/brendangregg/FlameGraph!cd FlameGraph!perf record -F 99 -a –g -- sleep 30!perf script | ./stackcollapse-perf.pl |./flamegraph.pl > perf.svg!

Mysterious CPU consumer…
DEMO
& DISCUSSION

perf_events: Workflow
perf stat! perf record!
perf report! perf script!
count events capture stacks
text UI dump profile
stackcollapse-perf.pl!
flamegraph.pl!
perf.data
flame graph visualiza<on
perf list!
list events
Typical Workflow
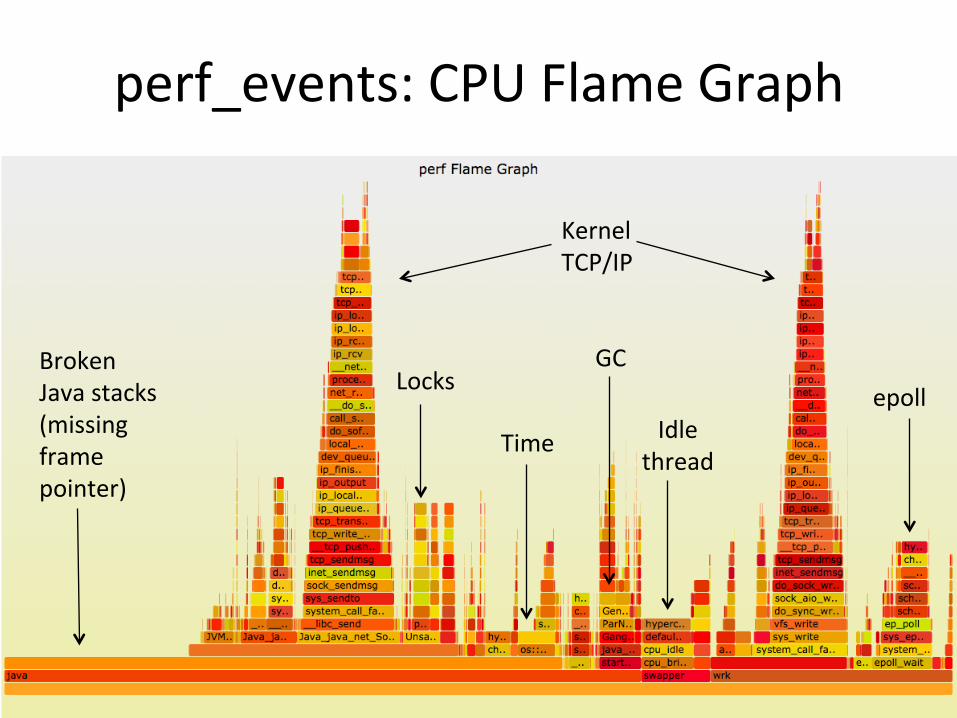
perf_events: CPU Flame Graph
Broken Java stacks (missing frame pointer)
Kernel TCP/IP
GC
Idle thread
Time
Locks epoll

Fixed Java Stacks!
Kernel (C)
JVM (C++)
perf_events: Mixed-Mode CPU Flame Graph

perf_events: Gotchas • Stack traces and symbols often don't work.
– Can be a significant project to fix them. It is worth it! • C:
– stacks: --fno-omit-frame-pointer • Java:
– stacks on x86: -XX:+PreserveFramePointer (JDK-8068945 for JDK9, JDK-8072465 for JDK8)
– symbols: perf-map-agent (other solutions exist) • Node.js:
– symbols: run v8 with --perf_basic_prof
http://www.brendangregg.com/blog/2015-02-27/linux-profiling-at-netflix.html

perf_events: Counters • Performance Monitoring Counters (PMCs):
• Identify CPU cycle breakdowns, esp. stall types • PMCs not enabled by-default in clouds (yet) • Can be time-consuming to use (CPU manuals)
– Please develop front-ends. Eg, tiptop.
$ perf list | grep –i hardware! cpu-cycles OR cycles [Hardware event]! stalled-cycles-frontend OR idle-cycles-frontend [Hardware event]! stalled-cycles-backend OR idle-cycles-backend [Hardware event]! instructions [Hardware event]![…]! branch-misses [Hardware event]! bus-cycles [Hardware event]! L1-dcache-loads [Hardware cache event]! L1-dcache-load-misses [Hardware cache event]![…]! rNNN (see 'perf list --help' on how to encode it) [Raw hardware event … ! mem:<addr>[:access] [Hardware breakpoint]!

Tracing
Tracing • Objectives:
– Understand frameworks: tracepoints, kprobes, uprobes – Understand mainline tracers: ftrace, perf_events, eBPF – Awareness of other tracers: SystemTap, LTTng, ktap, sysdig – Awareness of what tracing can accomplish (eg, perf-tools)

Tracing Frameworks: Tracepoints
• Statically placed at logical places in the kernel • Provides key event details as a “format” string

Tracing Frameworks: + probes
• kprobes: dynamic kernel tracing – function calls, returns, line numbers
• uprobes: dynamic user-level tracing

Linux Tracing Tools
• Many choices (too many?), all still in development
irace perf_events eBPF
LTTng dtrace4linux
SystemTap
ktap OEL DTrace sysdig

Linux Tracing is Magic!
• (Thanks Deirdré Straughan & General Zoi's Pony Creator)
irace perf_events eBPF
LTTng dtrace4linux
SystemTap
ktap OEL DTrace sysdig

Choosing a Tracer • Some companies standardize on one tracer
– eg, SystemTap, LTTng, …

Choosing a Tracer • My approach is: Study what Linux already has built-‐in
(perf_events, irace, eBPF?)
perf_events
irace
eBPF
live tracing, coun<ng
in-‐kernel summaries
PMCs, stack profiling, trace-‐dump-‐ analyze
Purpose?
Y N Is it sufficient?
…
Try SystemTap
Try LTTng

irace

irace • Added by Steven Rostedt and others since 2.6.27 • Already enabled on our servers (3.2+)
– CONFIG_FTRACE, CONFIG_FUNCTION_PROFILER, … – Use directly via /sys/kernel/debug/tracing:
– See Linux source: Documentation/trace/ftrace.txt
linux-4.0.0+# ls /sys/kernel/debug/tracing/!available_events max_graph_depth stack_max_size!available_filter_functions options stack_trace!available_tracers per_cpu stack_trace_filter!buffer_size_kb printk_formats trace!buffer_total_size_kb README trace_clock!current_tracer saved_cmdlines trace_marker!dyn_ftrace_total_info saved_cmdlines_size trace_options!enabled_functions set_event trace_pipe!events set_ftrace_filter trace_stat!free_buffer set_ftrace_notrace tracing_cpumask!function_profile_enabled set_ftrace_pid tracing_max_latency!instances set_graph_function tracing_on!kprobe_events set_graph_notrace tracing_thresh!kprobe_profile snapshot!
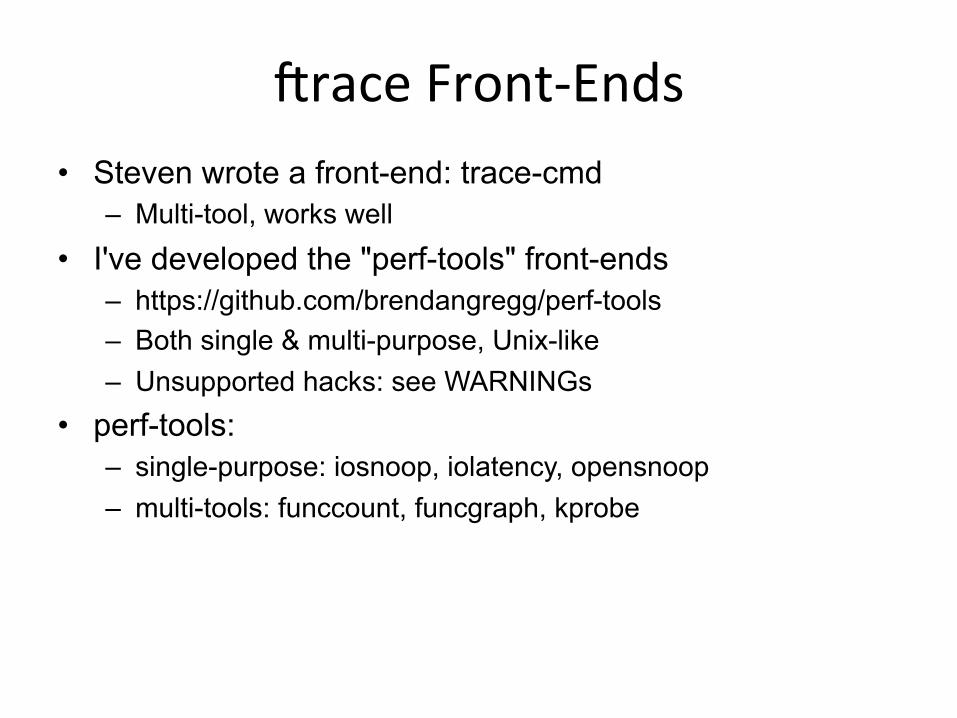
irace Front-‐Ends • Steven wrote a front-end: trace-cmd
– Multi-tool, works well • I've developed the "perf-tools" front-ends
– https://github.com/brendangregg/perf-tools – Both single & multi-purpose, Unix-like – Unsupported hacks: see WARNINGs
• perf-tools: – single-purpose: iosnoop, iolatency, opensnoop – multi-tools: funccount, funcgraph, kprobe

iosnoop • Block I/O (disk) events with latency: # ./iosnoop –ts!Tracing block I/O. Ctrl-C to end.!STARTs ENDs COMM PID TYPE DEV BLOCK BYTES LATms!5982800.302061 5982800.302679 supervise 1809 W 202,1 17039600 4096 0.62!5982800.302423 5982800.302842 supervise 1809 W 202,1 17039608 4096 0.42!5982800.304962 5982800.305446 supervise 1801 W 202,1 17039616 4096 0.48!5982800.305250 5982800.305676 supervise 1801 W 202,1 17039624 4096 0.43![…]!
# ./iosnoop –h!USAGE: iosnoop [-hQst] [-d device] [-i iotype] [-p PID] [-n name] [duration]! -d device # device string (eg, "202,1)! -i iotype # match type (eg, '*R*' for all reads)! -n name # process name to match on I/O issue! -p PID # PID to match on I/O issue! -Q # include queueing time in LATms! -s # include start time of I/O (s)! -t # include completion time of I/O (s)! -h # this usage message! duration # duration seconds, and use buffers![…]!

iolatency • Block I/O (disk) latency distributions: # ./iolatency !Tracing block I/O. Output every 1 seconds. Ctrl-C to end.!! >=(ms) .. <(ms) : I/O |Distribution |! 0 -> 1 : 2104 |######################################|! 1 -> 2 : 280 |###### |! 2 -> 4 : 2 |# |! 4 -> 8 : 0 | |! 8 -> 16 : 202 |#### |!! >=(ms) .. <(ms) : I/O |Distribution |! 0 -> 1 : 1144 |######################################|! 1 -> 2 : 267 |######### |! 2 -> 4 : 10 |# |! 4 -> 8 : 5 |# |! 8 -> 16 : 248 |######### |! 16 -> 32 : 601 |#################### |! 32 -> 64 : 117 |#### |![…]!

opensnoop • Trace open() syscalls showing filenames: # ./opensnoop -t!Tracing open()s. Ctrl-C to end.!TIMEs COMM PID FD FILE!4345768.332626 postgres 23886 0x8 /proc/self/oom_adj!4345768.333923 postgres 23886 0x5 global/pg_filenode.map!4345768.333971 postgres 23886 0x5 global/pg_internal.init!4345768.334813 postgres 23886 0x5 base/16384/PG_VERSION!4345768.334877 postgres 23886 0x5 base/16384/pg_filenode.map!4345768.334891 postgres 23886 0x5 base/16384/pg_internal.init!4345768.335821 postgres 23886 0x5 base/16384/11725!4345768.347911 svstat 24649 0x4 supervise/ok!4345768.347921 svstat 24649 0x4 supervise/status!4345768.350340 stat 24651 0x3 /etc/ld.so.cache!4345768.350372 stat 24651 0x3 /lib/x86_64-linux-gnu/libselinux…!4345768.350460 stat 24651 0x3 /lib/x86_64-linux-gnu/libc.so.6!4345768.350526 stat 24651 0x3 /lib/x86_64-linux-gnu/libdl.so.2!4345768.350981 stat 24651 0x3 /proc/filesystems!4345768.351182 stat 24651 0x3 /etc/nsswitch.conf![…]!
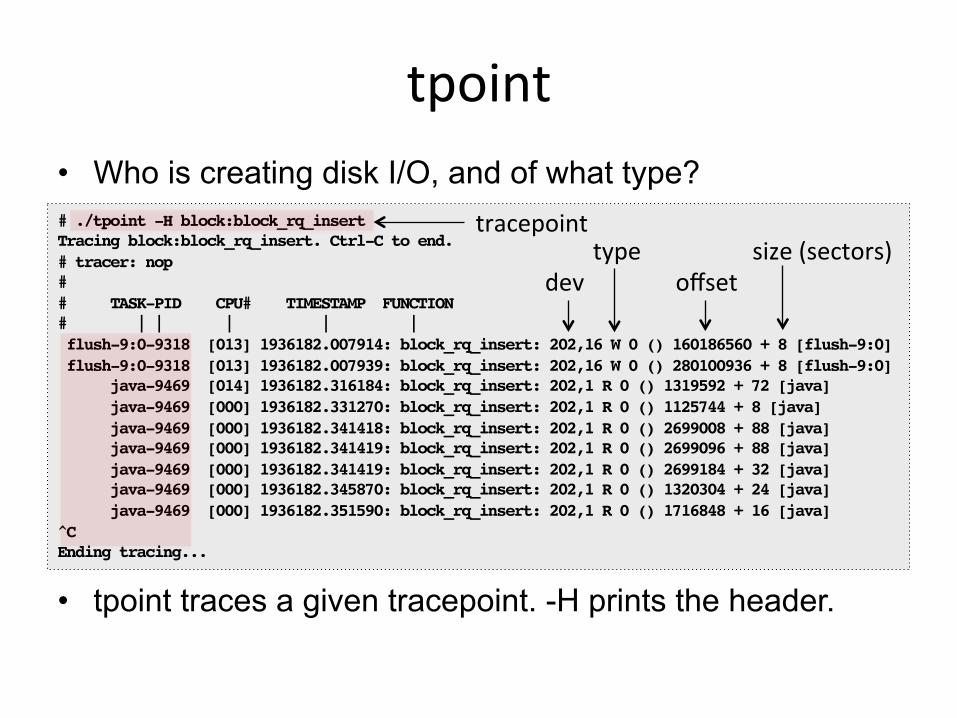
tpoint • Who is creating disk I/O, and of what type?
• tpoint traces a given tracepoint. -H prints the header.
# ./tpoint -H block:block_rq_insert!Tracing block:block_rq_insert. Ctrl-C to end.!# tracer: nop!#!# TASK-PID CPU# TIMESTAMP FUNCTION!# | | | | |! flush-9:0-9318 [013] 1936182.007914: block_rq_insert: 202,16 W 0 () 160186560 + 8 [flush-9:0]! flush-9:0-9318 [013] 1936182.007939: block_rq_insert: 202,16 W 0 () 280100936 + 8 [flush-9:0]! java-9469 [014] 1936182.316184: block_rq_insert: 202,1 R 0 () 1319592 + 72 [java]! java-9469 [000] 1936182.331270: block_rq_insert: 202,1 R 0 () 1125744 + 8 [java]! java-9469 [000] 1936182.341418: block_rq_insert: 202,1 R 0 () 2699008 + 88 [java]! java-9469 [000] 1936182.341419: block_rq_insert: 202,1 R 0 () 2699096 + 88 [java]! java-9469 [000] 1936182.341419: block_rq_insert: 202,1 R 0 () 2699184 + 32 [java]! java-9469 [000] 1936182.345870: block_rq_insert: 202,1 R 0 () 1320304 + 24 [java]! java-9469 [000] 1936182.351590: block_rq_insert: 202,1 R 0 () 1716848 + 16 [java]!C!Ending tracing...!
dev type
offset size (sectors)
tracepoint

tpoint -‐l
• 1,257 tracepoints for this Linux kernel
# ./tpoint -l!block:block_bio_backmerge!block:block_bio_bounce!block:block_bio_complete!block:block_bio_frontmerge!block:block_bio_queue!block:block_bio_remap!block:block_getrq!block:block_plug!block:block_rq_abort!block:block_rq_complete!block:block_rq_insert!block:block_rq_issue!block:block_rq_remap!block:block_rq_requeue![…]!# ./tpoint –l | wc –l!1257!
Lis<ng tracepoints
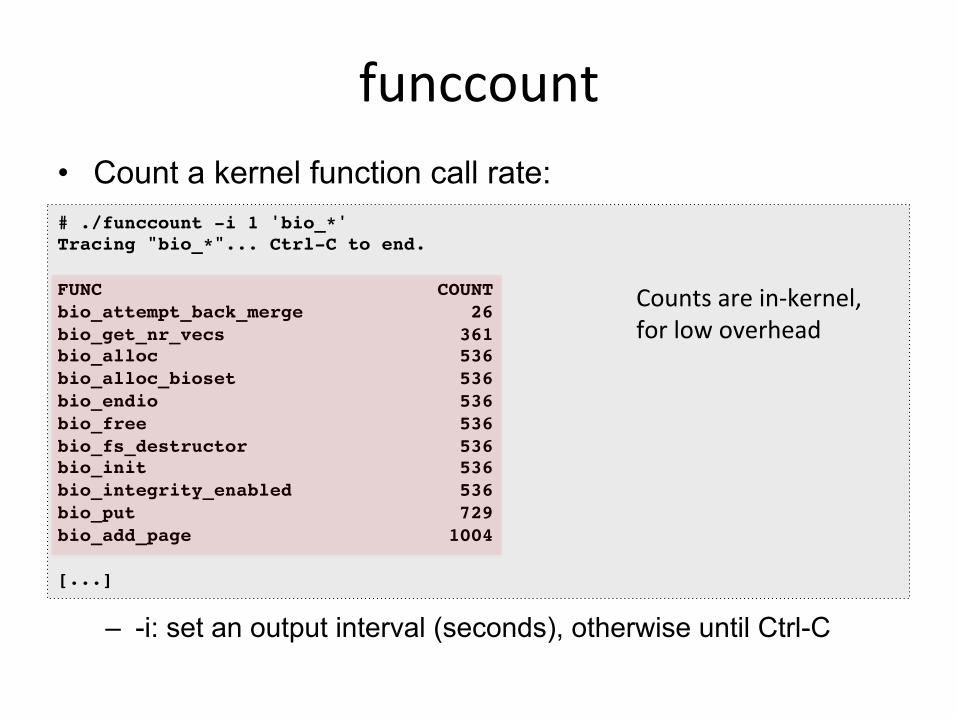
funccount • Count a kernel function call rate:
– -i: set an output interval (seconds), otherwise until Ctrl-C
# ./funccount -i 1 'bio_*'!Tracing "bio_*"... Ctrl-C to end.!!FUNC COUNT!bio_attempt_back_merge 26!bio_get_nr_vecs 361!bio_alloc 536!bio_alloc_bioset 536!bio_endio 536!bio_free 536!bio_fs_destructor 536!bio_init 536!bio_integrity_enabled 536!bio_put 729!bio_add_page 1004!![...]!
Counts are in-‐kernel, for low overhead

funcgraph • Trace a graph of kernel code flow: # ./funcgraph -Htp 5363 vfs_read!Tracing "vfs_read" for PID 5363... Ctrl-C to end.!# tracer: function_graph!#!# TIME CPU DURATION FUNCTION CALLS!# | | | | | | | |!4346366.073832 | 0) | vfs_read() {!4346366.073834 | 0) | rw_verify_area() {!4346366.073834 | 0) | security_file_permission() {!4346366.073834 | 0) | apparmor_file_permission() {!4346366.073835 | 0) 0.153 us | common_file_perm();!4346366.073836 | 0) 0.947 us | }!4346366.073836 | 0) 0.066 us | __fsnotify_parent();!4346366.073836 | 0) 0.080 us | fsnotify();!4346366.073837 | 0) 2.174 us | }!4346366.073837 | 0) 2.656 us | }!4346366.073837 | 0) | tty_read() {!4346366.073837 | 0) 0.060 us | tty_paranoia_check();![…]!

kprobe • Dynamically trace a kernel function call or return, with
variables, and in-kernel filtering: # ./kprobe 'p:open do_sys_open filename=+0(%si):string' 'filename ~ "*stat"'!Tracing kprobe myopen. Ctrl-C to end.! postgres-1172 [000] d... 6594028.787166: open: (do_sys_open+0x0/0x220) filename="pg_stat_tmp/pgstat.stat"! postgres-1172 [001] d... 6594028.797410: open: (do_sys_open+0x0/0x220) filename="pg_stat_tmp/pgstat.stat"! postgres-1172 [001] d... 6594028.797467: open: (do_sys_open+0x0/0x220) filename="pg_stat_tmp/pgstat.stat”!^C!Ending tracing...!
• Add -s for stack traces; -p for PID filter in-kernel. • Quickly confirm kernel behavior; eg: did a tunable take
effect?

perf-‐tools (so far…)

perf-‐tools (so far…)

perf_events
perf_events • Powerful profiler (covered earlier) • … and tracer:
– User-level and kernel dynamic tracing – Kernel line tracing and local variables (debuginfo) – Kernel filtering expressions – Efficient in-kernel counts (perf stat)
• Not very programmable, yet – Limited kernel summaries. Should improve with eBPF.
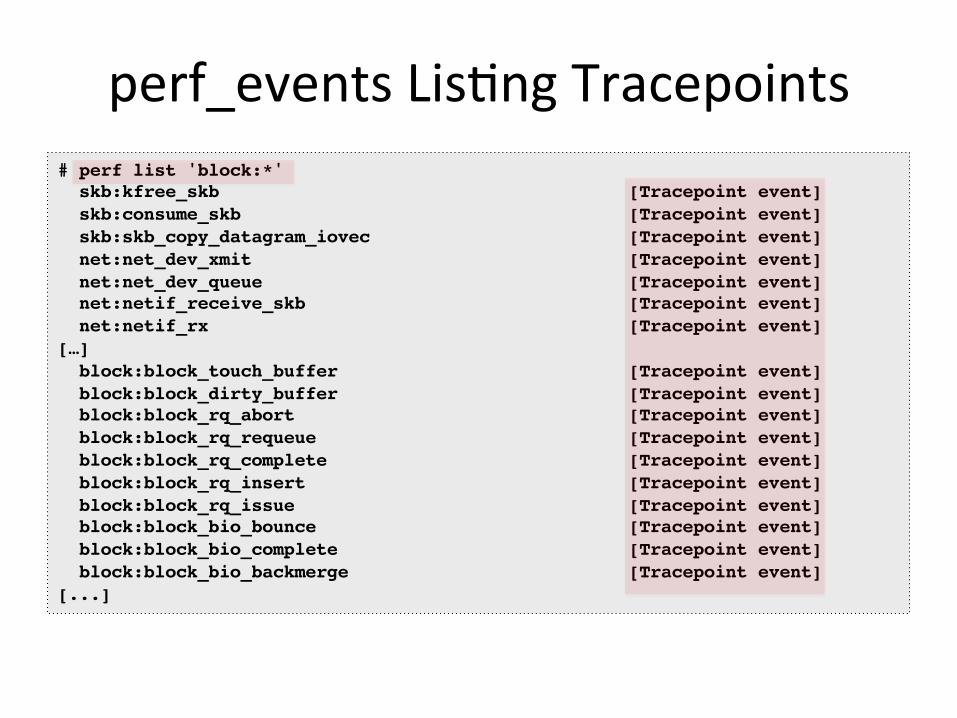
perf_events Lis<ng Tracepoints # perf list 'block:*'! skb:kfree_skb [Tracepoint event]! skb:consume_skb [Tracepoint event]! skb:skb_copy_datagram_iovec [Tracepoint event]! net:net_dev_xmit [Tracepoint event]! net:net_dev_queue [Tracepoint event]! net:netif_receive_skb [Tracepoint event]! net:netif_rx [Tracepoint event]![…] ! block:block_touch_buffer [Tracepoint event]! block:block_dirty_buffer [Tracepoint event]! block:block_rq_abort [Tracepoint event]! block:block_rq_requeue [Tracepoint event]! block:block_rq_complete [Tracepoint event]! block:block_rq_insert [Tracepoint event]! block:block_rq_issue [Tracepoint event]! block:block_bio_bounce [Tracepoint event]! block:block_bio_complete [Tracepoint event]! block:block_bio_backmerge [Tracepoint event]![...]!

Linux Event Sources
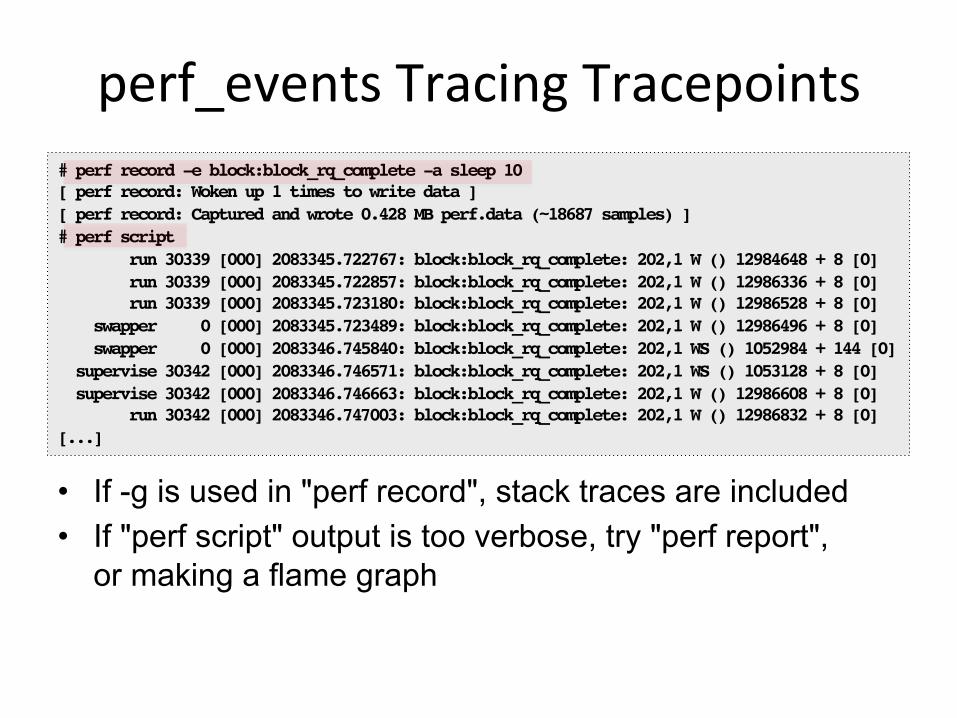
perf_events Tracing Tracepoints
• If -g is used in "perf record", stack traces are included • If "perf script" output is too verbose, try "perf report",
or making a flame graph
# perf record -e block:block_rq_complete -a sleep 10![ perf record: Woken up 1 times to write data ]![ perf record: Captured and wrote 0.428 MB perf.data (~18687 samples) ]!# perf script! run 30339 [000] 2083345.722767: block:block_rq_complete: 202,1 W () 12984648 + 8 [0]! run 30339 [000] 2083345.722857: block:block_rq_complete: 202,1 W () 12986336 + 8 [0]! run 30339 [000] 2083345.723180: block:block_rq_complete: 202,1 W () 12986528 + 8 [0]! swapper 0 [000] 2083345.723489: block:block_rq_complete: 202,1 W () 12986496 + 8 [0]! swapper 0 [000] 2083346.745840: block:block_rq_complete: 202,1 WS () 1052984 + 144 [0]! supervise 30342 [000] 2083346.746571: block:block_rq_complete: 202,1 WS () 1053128 + 8 [0]! supervise 30342 [000] 2083346.746663: block:block_rq_complete: 202,1 W () 12986608 + 8 [0]! run 30342 [000] 2083346.747003: block:block_rq_complete: 202,1 W () 12986832 + 8 [0]![...]!

perf_events Report # perf record –e skb:consume_skb -ag!^C[ perf record: Woken up 1 times to write data ]![ perf record: Captured and wrote 0.065 MB perf.data (~2851 samples) ]!# perf report -n --stdio![...]! 74.42% swapper [kernel.kallsyms] [k] consume_skb! |! --- consume_skb! arp_process! arp_rcv! __netif_receive_skb_core! __netif_receive_skb! netif_receive_skb! virtnet_poll! net_rx_action! __do_softirq! irq_exit! do_IRQ! ret_from_intr! default_idle! cpu_idle! start_secondary![…]!
Summarizing stack traces for a tracepoint
eBPF

eBPF • Extended BPF: programs on tracepoints
– High performance filtering: JIT – In-kernel summaries: maps – Developed by Alexei Starovoitov (Plumgrid)
• Currently being integrated in parts (Linux 3.18, 4.1, …) # ./bitehist!Tracing block device I/O... Interval 5 secs. Ctrl-C to end.!! kbytes : count distribution! 0 -> 1 : 3 | |! 2 -> 3 : 0 | |! 4 -> 7 : 3395 |************************************* |! 8 -> 15 : 1 | |! 16 -> 31 : 2 | |! 32 -> 63 : 738 |******* |! 64 -> 127 : 3 | |! 128 -> 255 : 1 | |!in-‐kernel summary
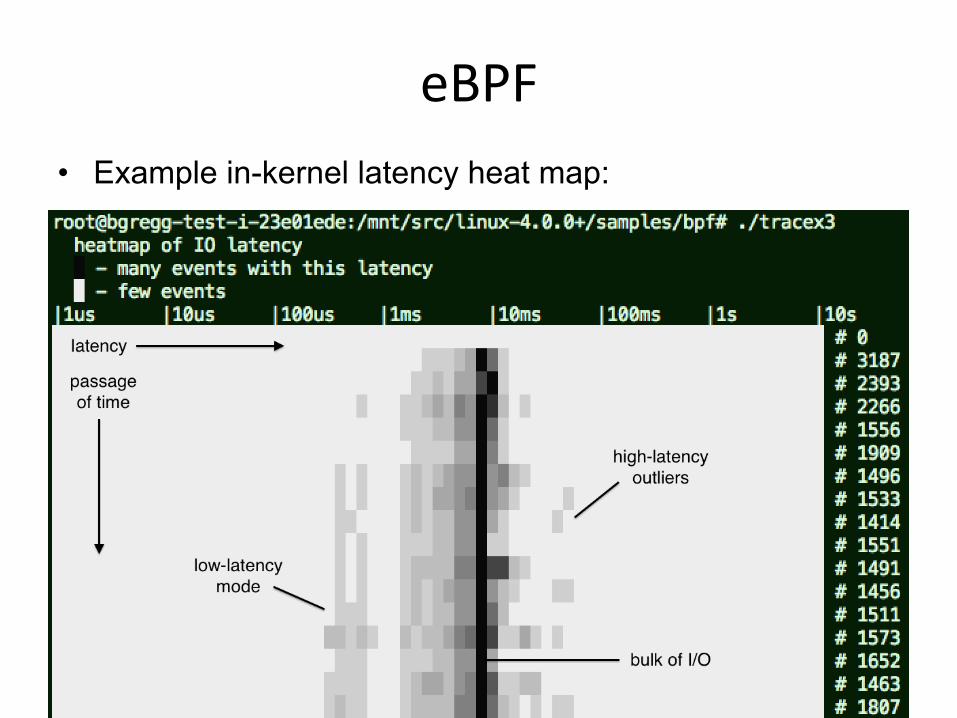
eBPF • Example in-kernel latency heat map:

Other Tracers
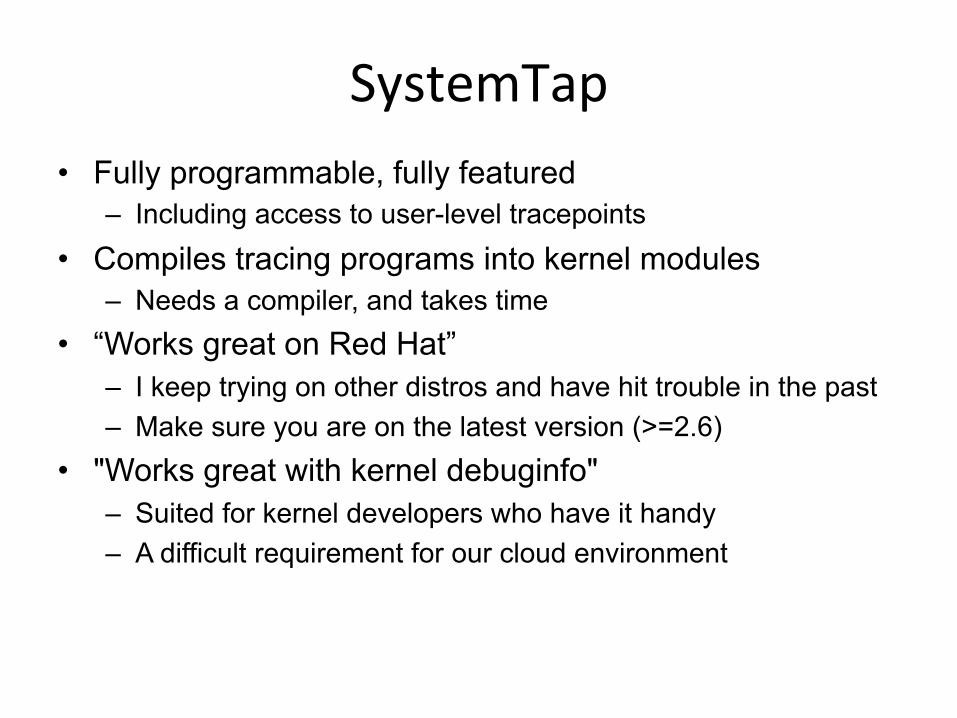
SystemTap • Fully programmable, fully featured
– Including access to user-level tracepoints • Compiles tracing programs into kernel modules
– Needs a compiler, and takes time • “Works great on Red Hat”
– I keep trying on other distros and have hit trouble in the past – Make sure you are on the latest version (>=2.6)
• "Works great with kernel debuginfo" – Suited for kernel developers who have it handy – A difficult requirement for our cloud environment

"Lightweight" SystemTap • SystemTap can be used without kernel debuginfo
– Makes life harder, but some tasks are still possible – providers: nd_syscall, kprobe.function, kernel.trace, … – args via: int_arg(), uint_arg(), pointer_arg(), user_string()
• Something I've experimented with. Examples: – https://github.com/brendangregg/systemtap-lwtools/
# stap -e 'global a; probe nd_syscall.write { a <<< int_arg(3); } probe end { print(@hist_log(a)); }'!^Cvalue |-------------------------------------------------- count![…]! 8 | 0! 16 |@@@@@@@@@@@@@@@@@@@@@@ 22! 32 |@@@@@@@@@@@@@@@ 15! 64 |@@@@@@@@@@@@@@@@@ 17! 128 |@@ 2! 256 |@@ 2! 512 | 0!

ktap • Was a very promising new Linux tracer:
– Sampling, static & dynamic tracing – Lightweight, simple. Uses bytecode. – Suited for embedded devices
• Development suspended while eBPF integrates • Will it restart?
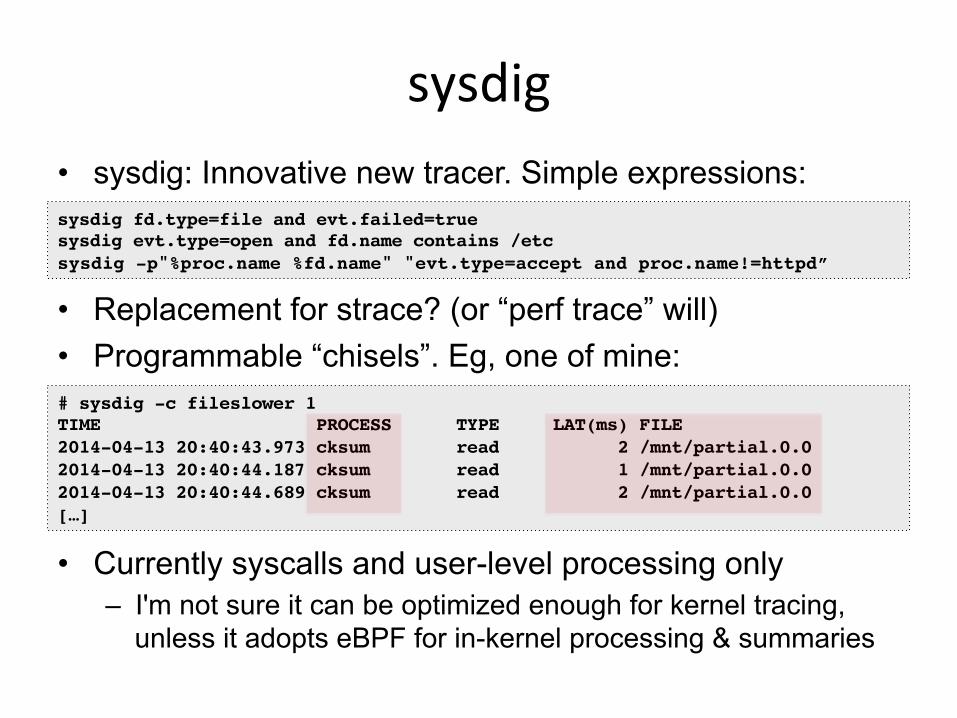
sysdig • sysdig: Innovative new tracer. Simple expressions:
• Replacement for strace? (or “perf trace” will) • Programmable “chisels”. Eg, one of mine:
• Currently syscalls and user-level processing only – I'm not sure it can be optimized enough for kernel tracing,
unless it adopts eBPF for in-kernel processing & summaries
# sysdig -c fileslower 1!TIME PROCESS TYPE LAT(ms) FILE!2014-04-13 20:40:43.973 cksum read 2 /mnt/partial.0.0!2014-04-13 20:40:44.187 cksum read 1 /mnt/partial.0.0!2014-04-13 20:40:44.689 cksum read 2 /mnt/partial.0.0![…]!
sysdig fd.type=file and evt.failed=true!sysdig evt.type=open and fd.name contains /etc!sysdig -p"%proc.name %fd.name" "evt.type=accept and proc.name!=httpd”!
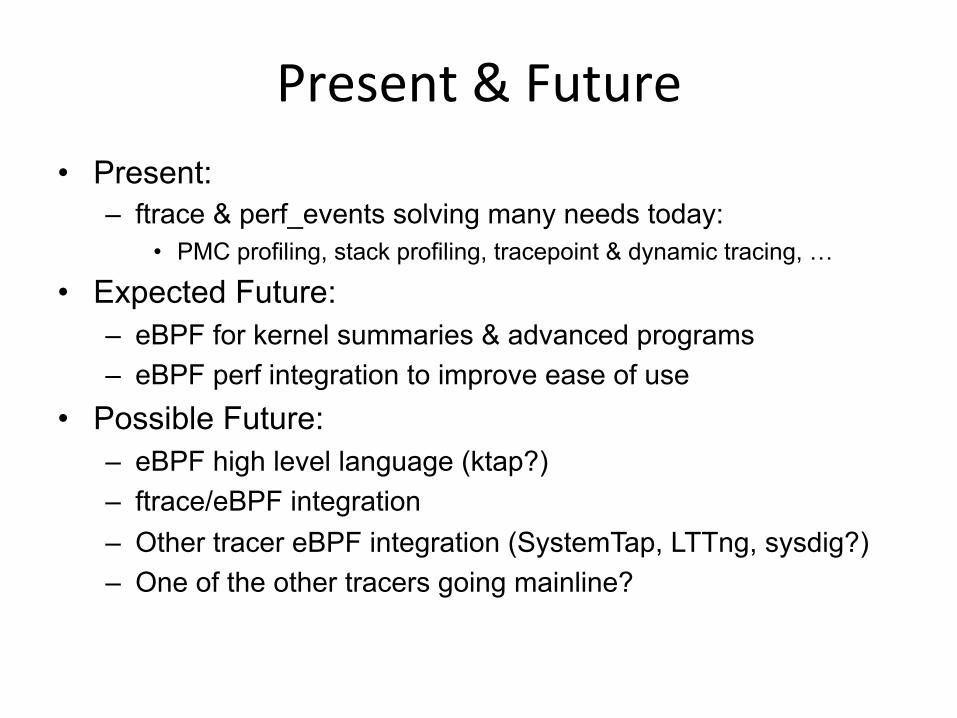
Present & Future • Present:
– ftrace & perf_events solving many needs today: • PMC profiling, stack profiling, tracepoint & dynamic tracing, …
• Expected Future: – eBPF for kernel summaries & advanced programs – eBPF perf integration to improve ease of use
• Possible Future: – eBPF high level language (ktap?) – ftrace/eBPF integration – Other tracer eBPF integration (SystemTap, LTTng, sysdig?) – One of the other tracers going mainline?

The Tracing Landscape, May 2015
Scope & Capability
Ease of u
se sysdig
perf
irace
eBPF
ktap
stap
Stage of Development
(my opinion)
dtrace4L.
(brutal)
(less brutal)
(alpha) (mature)

In Summary…

Methodologies Summary • Objectives:
– Recognize the Streetlight Anti-Method – Perform the Workload Characterization Method – Perform the USE Method – Be aware of other methodologies
Try to start with the questions (methodology), to help guide your use of the tools

Tools Summary • Objectives:
– Perform the USE Method for resource utilization – Perform Workload Characterization for disks, network – Have exposure to various observability tools:
• Basic: vmstat, iostat, mpstat, ps, top, … • Intermediate: tcpdump, netstat, nicstat, pidstat, sar, … • Advanced: ss, slaptop, perf_events, …
– Perform Active Benchmarking – Understand tuning risks – Perform Static Performance Tuning
Print out the tools diagrams for your office wall
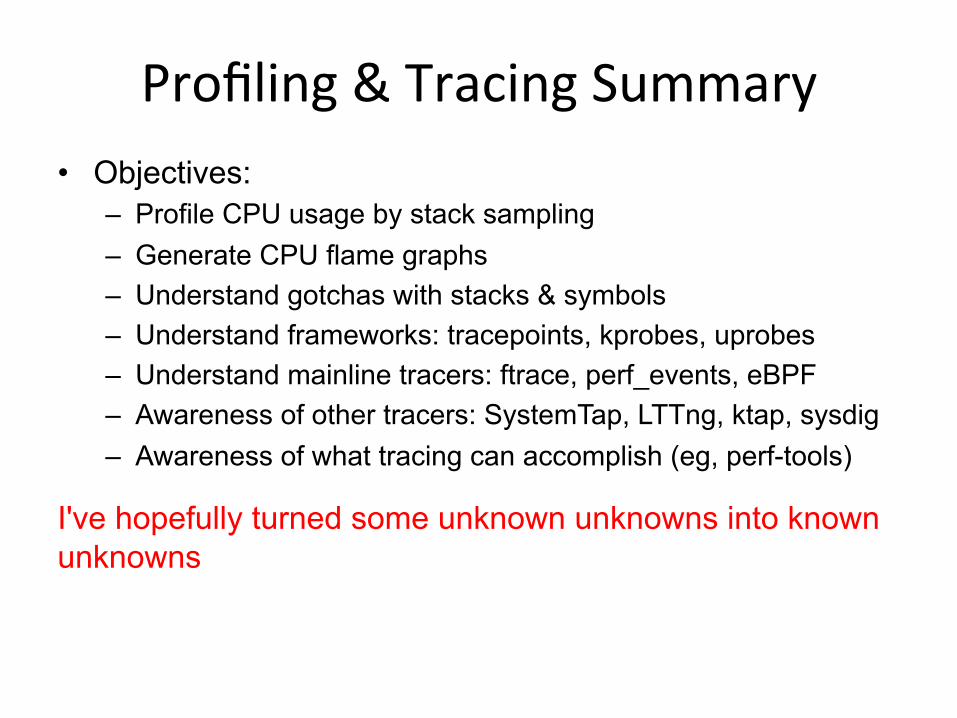
Profiling & Tracing Summary • Objectives:
– Profile CPU usage by stack sampling – Generate CPU flame graphs – Understand gotchas with stacks & symbols – Understand frameworks: tracepoints, kprobes, uprobes – Understand mainline tracers: ftrace, perf_events, eBPF – Awareness of other tracers: SystemTap, LTTng, ktap, sysdig – Awareness of what tracing can accomplish (eg, perf-tools)
I've hopefully turned some unknown unknowns into known unknowns

References & Links – Systems Performance: Enterprise and the Cloud, Pren<ce Hall, 2013 – hOp://www.brendangregg.com/linuxperf.html incl. tools diagrams as PNGs – hOp://www.brendangregg.com/perf.html#FlameGraphs – hOp://www.brendangregg.com/blog/2015-‐02-‐27/linux-‐profiling-‐at-‐neqlix.html – hOp://www.brendangregg.com/blog/2015-‐03-‐17/linux-‐performance-‐analysis-‐perf-‐tools.html – hOp://www.brendangregg.com/blog/2015-‐05-‐15/ebpf-‐one-‐small-‐step.html – nicstat: hOp://sourceforge.net/projects/nicstat/ – <ptop: hOp://<ptop.gforge.inria.fr/
• Tiptop: Hardware Performance Counters for the Masses, Erven Rohou, Inria Research Report 7789, Nov 2011. – irace & perf-‐tools
• hOps://github.com/brendangregg/perf-‐tools • hOp://lwn.net/Ar<cles/608497/ Ftrace: The hidden light switch
– MSR tools: hOps://github.com/brendangregg/msr-‐cloud-‐tools – pcstat: hOps://github.com/tobert/pcstat – eBPF: hOp://lwn.net/Ar<cles/603983/ – ktap: hOp://www.ktap.org/ – SystemTap: hOps://sourceware.org/systemtap/ – sysdig: hOp://www.sysdig.org/ – Tux by Larry Ewing; Linux® is the registered trademark of Linus Torvalds in the U.S.
and other countries.

Thanks
• Questions? • http://slideshare.net/brendangregg • http://www.brendangregg.com • [email protected] • @brendangregg