venous blood gas reference intervals
TRANSCRIPT
Venous Blood Gas
Reference IntervalsThe NSW Health Pathology approach
Andrea Rita Horvath
Department of Clinical Chemistry & Endocrinology
NSW Health Pathology, Prince of Wales Hospital, Sydney
Outline
Background
Methods
Results
Transferability of the VBG RIs
Conclusions

Kirsty Ress NSW Health Pathology
Gus Koerbin NSW Health Pathology
Doug Chesher NSW Health Pathology
Samarina Musaad NZPOCTQAG / ARQAG
Ken Sikaris Melbourne Pathology
David Hughes ACT Pathology
Robert Flatman Sullivan Nicolaides Pathology
Goce Dimeski QLD Pathology
Frank Alvaro NSW Health Pathology
Joshua Ryan NSW Health Pathology
Anthony Diamond NSW Health Pathology
Dorra Arvanitis NSW Health Pathology
Andrew Sargeant NSW Health Pathology
NSWHP Clinical Chemistry Stream and POCT Advisory Group
Acknowledgements
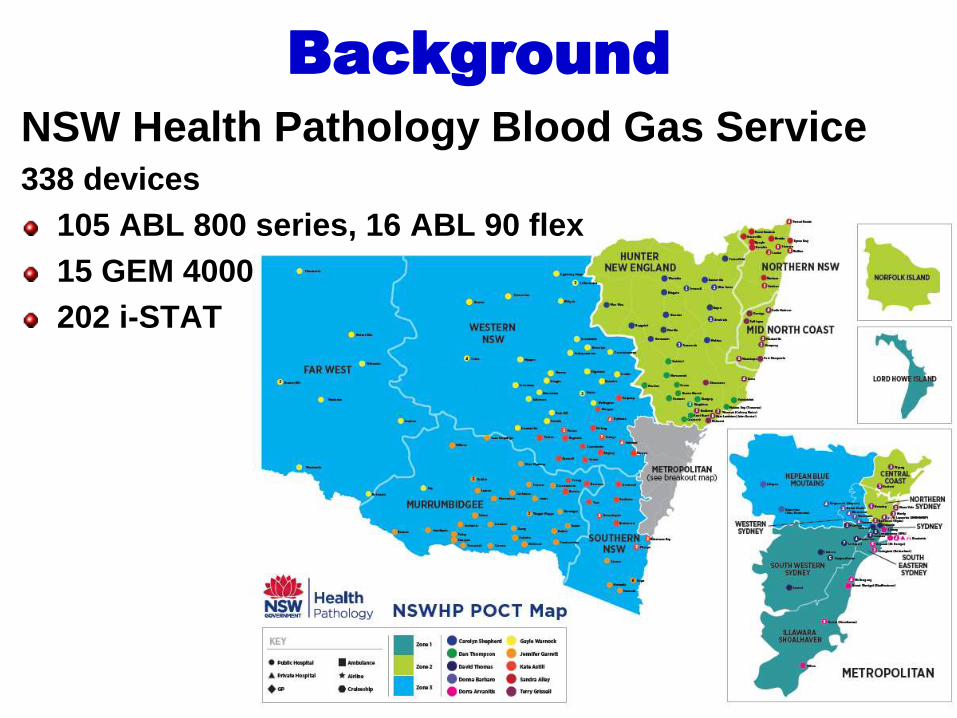
Background
NSW Health Pathology Blood Gas Service338 devices
105 ABL 800 series, 16 ABL 90 flex
15 GEM 4000
202 i-STAT
Outline
Background
Methods
Results
Transferability of the VBG RIs
Conclusions

Methods
Systematic review of the literature
RI study
Survey of laboratory RIs
Consensus of chemical pathologists
Clinical consultation and consensus
Verification and transferability testing
using flag rates and 95 percentile ED
population data

Outline
Background
Methods
Results
Transferability of the VBG RIs
Conclusions
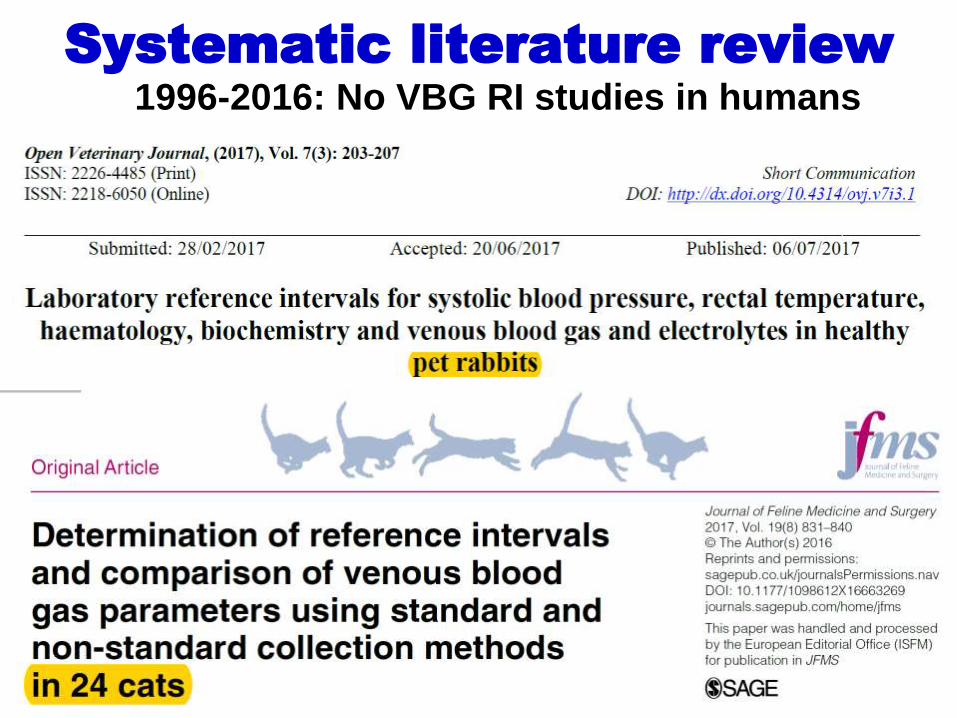
Systematic literature review1996-2016: No VBG RI studies in humans

Systematic literature review
Human studies were only on ABG-VBG differences mostly in
sick patients
Review No. of studies
and disease
states*
Difference (VBG – ABG)
pH HCO3
(mmol/L)
pCO2
(mmHg)
pO2
(mmHg)
Lactate
(mmol/L)
Ress (2016)* 47 (All) -0.032 1.0 5.3 -56.0 0.13
Bloom et al (2014) 3-15 (All) -0.033 1.0 4.4 - 0.25
Bryne et al (2014) 18 (All) -0.030 - 3.9 -36.8 -
Kelly (2013) 13 (ED) -0.034 1.2 6.2 - -
Kelly et al (2010) 3-10 (ED) -0.035 1.4 5.7 - -
Lim et al (2010) 6 (COPD) -0.028 1.3 5.9 -18.7 -
Kelly et al (2006) 3 (DKA) -0.020 - - - -
* Median of all studies
ED – Emergency Department, COPD - Chronic Obstructive Pulmonary Disease, DKA – Diabetic Ketoacidosis
All – No specific disease state included in the study. All disease states were included (e.g. COPD, DKA, healthy, critically ill and
emergency department patients).

NSW VBG RI study
Analyte Median
Average
Deviation
Percentile
(Non-coning)
Tukey
(Non-Para)
Dixon-Reed
(Non-Para)
pH 7.31 – 7.43 7.29 – 7.41 7.29 – 7.41 7.29 – 7.41
pO2 (mmHg) 14 - 54 15 - 64 15 - 49 15 - 64
pCO2 (mmHg) 39 - 61 38 - 61 38 - 60 38 – 61
Bicarbonate (mmol/L) 23.0 – 31.8 23.4 – 30.8 23.4 – 30.7 23.4 – 30.8
Lactate (mmol/L) 0.5 – 2.3 0.5 – 3.1 0.5 – 2.0 0.5 – 3.1
Sodium (mmol/L) 134 - 146 136 - 146 136 - 146 136 – 146
Potassium (mmol/L) 3.6 – 4.7 3.7 – 4.7 3.7 – 4.7 3.7 – 4.7
Chloride (mmol/L) 100 - 112 101 - 110 101 - 109 101 – 110
Ionised Ca (mmol/L) 1.17 – 1.29 1.16 – 1.32 1.16 – 1.29 1.16 – 1.32
n=216 healthy adult volunteers; 2/3 female, 1/3 male; age: 18-70y (80% 26-56y)Radiometer ABL 800 series blood gas analyser in one laboratory location
Safe-PICO syringes for sampling
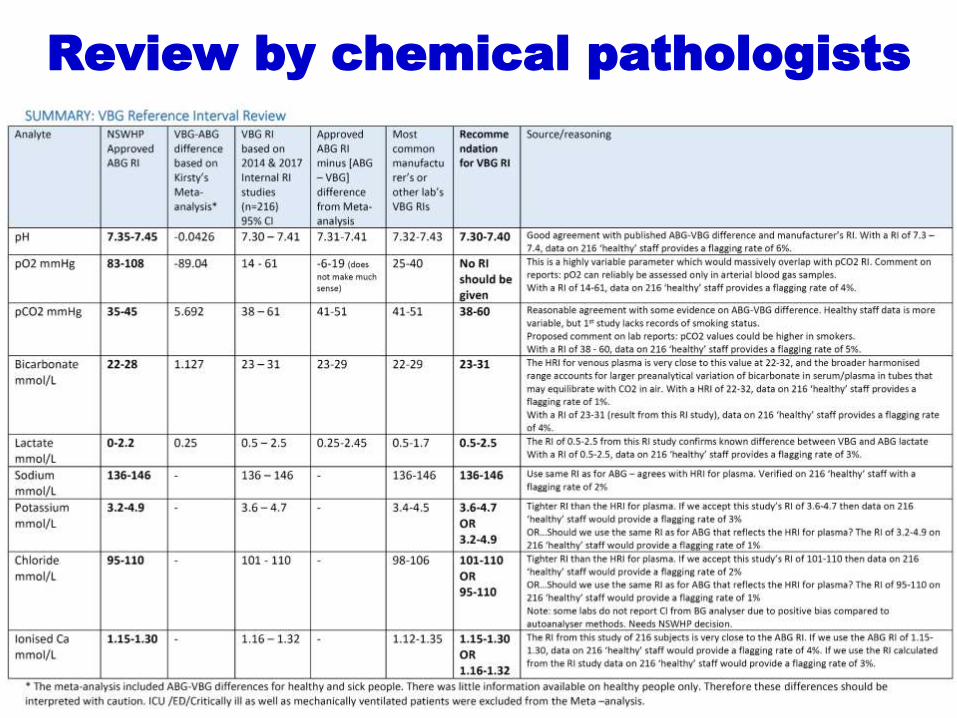
Review by chemical pathologists
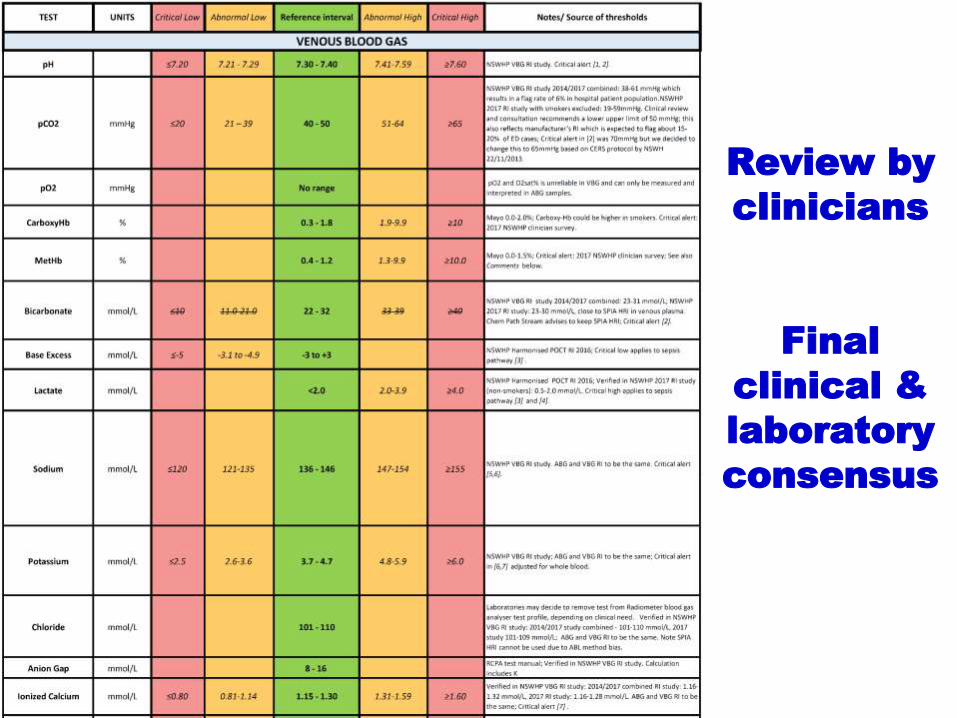
Review by
clinicians
Final
clinical &
laboratory
consensus

Evolution of the NSWHP VBG RI
Analyte RI modelled on
ABG-VBG
differences
NSW RI study NSWHP clin.
chem. stream
consensus
NSWH clinical
and laboratory
consensus
pH 7.32 – 7.42 7.29 – 7.41 7.30 – 7.40 7.30 – 7.40
pO2 (mmHg) 19 – 49 15 – 64 No RI No RI
pCO2 (mmHg) 40 - 50 38 – 61 40 – 60 40 – 50
Bicarbonate (mmol/L) 23 – 29 23 – 31 22 – 32 22 – 32
Lactate (mmol/L) <2.2 0.5 – 3.1 0.5 – 2.5 <2.0
Ionised Ca (mmol/L) NA 1.16 – 1.32 1.15 – 1.30 1.15 – 1.30
Sodium (mmol/L) NA 136 - 146 136 - 146 136 - 146
Potassium (mmol/L) NA 3.7 – 4.7 3.7 – 4.7 3.7 – 4.7
Chloride (mmol/L) NA 101 – 110 101 – 110 101 – 110

“From a consequentialist
standpoint, a morally right act
(or omission from acting) is one
that will produce a good
outcome, or consequence.”
Demosthenes
https://en.wikipedia.org
“Every advantage in the
past is judged in the light
of the final issue”

Outline
Background
Methods
Results
Transferability of the VBG RIs
Conclusions

Transferability: 95% and flag ratesLocation
‒ NSW (public)
‒ ACT (public)
‒ VIC (private)
‒ QLD (public & private)
‒ NZ
Instruments
‒ 65% Radiometer ABL 90 and 800 series
‒ 28% IL/Werfen GEM
‒ 5% Abbott i-STAT
‒ 2% Siemens Rapidpoint 500
N=92,728 adult (>18 yr) inpatient episodes with VBG results
‒ 89% ED (n=82,786)
‒ 8% ED, ICU, CCU mixed population (n=7,814)
‒ 3% non-ED, non-ICU wards (n=2,128)
Limitations of data/data analysis‒ All (not just single) episodes
‒ No age and gender breakdown (but majority is elderly); no exclusion of outliers
‒ Suitable for instrument comparison but not for RI verification
NSW58%
ACT25%
VIC7%
QLD5%
NZ5%

VBG 95% of ED population - pH
7.00
7.10
7.20
7.30
7.40
7.50
7.60
7.70
1 2 3 4 5 6 7 8 9 10 11
Laboratory
pH
7.21-7.497.19-7.50 7.20-7.54 7.22-7.52
ABL 800 series Radiometer GEM ILi-
STA
T A
bb
ott
Rap
idp
oin
tS
iem
en
s

LRL Flagging Rate - pH
0
5
10
15
20
25
30
35
40
45
50
1 2 3 4 5 6 7 8 9 10 11 12
NSWHP FR
Study FR
pH Lower Reference Limit:
NSWHP – 7.3, NSW RI Study – 7.29
Laboratory
% o
fpH
Results F
lagge
d
ABL 800 series Radiometer
i-S
TA
T A
bb
ott
Rap
idp
oin
tS
iem
en
s
GEM ILE
D
ED
&IC
U
No
n-E
D&
ICU
No
n-E
D
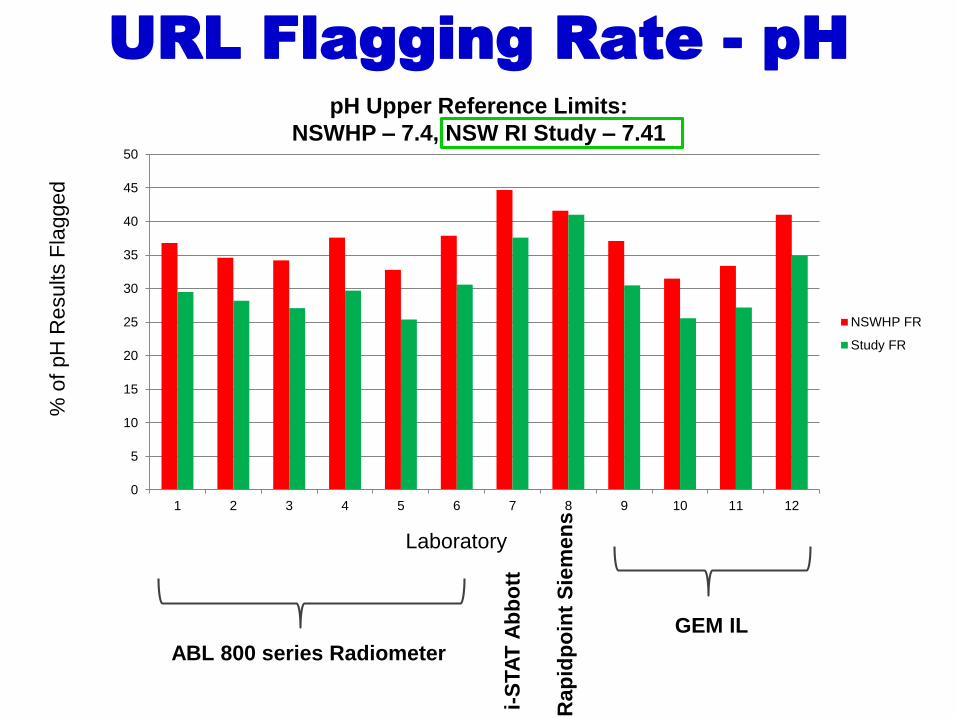
URL Flagging Rate - pH
ABL 800 series Radiometer
i-S
TA
T A
bb
ott
Ra
pid
po
int
Sie
men
s
GEM IL
0
5
10
15
20
25
30
35
40
45
50
1 2 3 4 5 6 7 8 9 10 11 12
NSWHP FR
Study FR
pH Upper Reference Limits:
NSWHP – 7.4, NSW RI Study – 7.41
Laboratory
% o
f pH
Results F
lagge
d

0
10
20
30
40
50
60
70
80
90
1 2 3 4 5 6 7 8 9 10 11
Laboratory
pC
O2
(mm
Hg
)VBG 95% of ED population – pCO2
ABL 800 series Radiometer GEM ILi-S
TA
T A
bb
ott
Ra
pid
po
int
Sie
men
s
27 – 68 24 – 67 28 – 66 30 – 66

LRL Flagging Rate – pCO2
0
5
10
15
20
25
30
35
40
45
50
1 2 3 4 5 6 7 8 9 10 11 12
NSWHP FR
Study FR
Laboratory
% o
f pC
O2
Results F
lagge
d
pCO2 Lower Reference Limit:
NSWHP – 40 mmHg, NSW RI Study – 38 mmHg
ABL 800 series Radiometer
i-S
TA
T A
bb
ott
Ra
pid
po
int
Sie
me
ns
GEM IL

URL Flagging Rate – pCO2
pCO2 Upper Reference Limit:
NSWHP – 50 mmHg, NSW RI Study – 61 mmHg
0
5
10
15
20
25
30
35
40
45
50
1 2 3 4 5 6 7 8 9 10 11 12
NSWHP FR
Study FR
Laboratory
% o
f pC
O2
Results F
lagge
d
ABL 800 series Radiometer GEM IL
i-S
TA
T A
bb
ott
Ra
pid
po
int
Sie
me
ns

VBG 95% of ED population – Bicarbonate
5
10
15
20
25
30
35
40
45
1 2 3 4 5 6 7 8 9 10 11
Laboratory
Bic
arb
onate
(mm
ol/L)
ABL 800 series Radiometer GEM ILi-S
TA
T A
bb
ott
Ra
pid
po
int
Sie
men
s
15 – 3415 – 33 17 – 35 17 – 33

LRL Flagging Rate – Bicarbonate
0
5
10
15
20
25
30
35
40
45
50
1 2 3 4 5 6 7 8 9 10 11 12
NSWHP FR
Study FR
Laboratory
% o
f B
icarb
onate
Results F
lagge
d
Bicarbonate Lower Reference Limit:
NSWHP – 22 mmol/L, NSW RI Study – 23 mmol/L
ABL 800 series Radiometer GEM IL
i-S
TA
T A
bb
ott
Ra
pid
po
int
Sie
me
ns

URL Flagging Rate – BicarbonateBicarbonate Upper Reference Limit:
NSWHP – 32 mmol/L, NSW RI Study – 31 mmol/L
0
5
10
15
20
25
30
35
40
45
50
1 2 3 4 5 6 7 8 9 10 11 12
NSWHP FR
Study FR
Laboratory
% o
f B
ica
rbo
na
te R
esu
lts
Fla
gge
d
ABL 800 series RadiometerGEM IL
i-S
TA
T A
bb
ott
Ra
pid
po
int
Sie
me
ns

-2.0
-1.0
0.0
1.0
2.0
3.0
4.0
5.0
6.0
7.0
8.0
9.0
1 2 3 4 5 6 7 8 9 10 11
Laboratory
Lacta
te(m
mol/L)
VBG 95% of ED population – Lactate
ABL 800 series Radiometer GEM IL
i-S
TA
T A
bb
ott
Ra
pid
po
int
Sie
men
s
0.6-6.50.6-6.1 0.9-5.4 0.7-4.6

0
10
20
30
40
50
60
70
1 2 3 4 5 6 7 8 9 10 11 12
NSWHP FR
Study FR
Laboratory
% o
f Lacta
te R
esults F
lagge
dURL Flagging Rate – Lactate
ABL 800 series Radiometer GEM IL
i-S
TA
T A
bb
ott
Ra
pid
po
int
Sie
me
ns
Lactate Upper Reference Limit:
NSWHP – <2 mmol/L, NSW RI Study – 3.1 mmol/L
0.80
0.90
1.00
1.10
1.20
1.30
1.40
1.50
1 2 3 4 5 6 7 8 9 10 11
Laboratory
Ionis
ed C
a(m
mol/L)
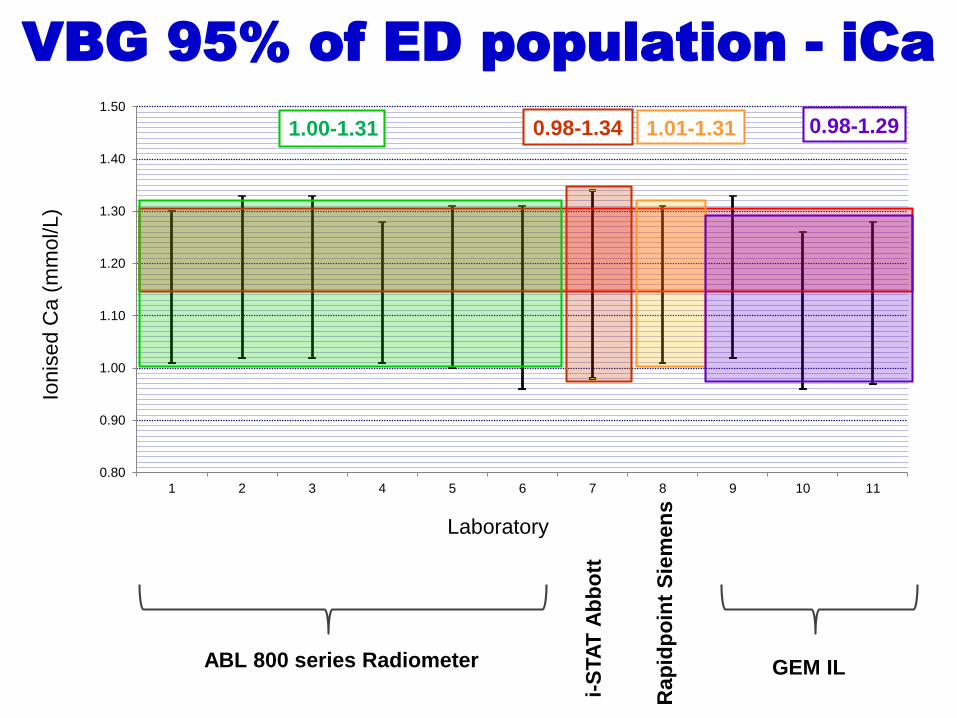
VBG 95% of ED population - iCa
ABL 800 series Radiometer GEM IL
i-S
TA
T A
bb
ott
Ra
pid
po
int
Sie
men
s
0.98-1.341.00-1.31 1.01-1.31 0.98-1.29

LRL Flagging Rate – iCaiCa Lower Reference Limit:
NSWHP – 1.15 mmol/L, NSW RI Study – 1.16 mmol/L
0
10
20
30
40
50
60
70
80
1 2 3 4 5 6 7 8 9 10 11 12
NSWHP FR
Study FR
Laboratory
% o
f Io
nis
ed C
a R
esults
Fla
gge
d
ABL 800 series Radiometer GEM IL
i-S
TA
T A
bb
ott
Ra
pid
po
int
Sie
me
ns

URL Flagging Rate – iCaiCa Upper Reference Limit:
NSWHP – 1.30 mmol/L, NSW RI Study – 1.32 mmol/L
0
5
10
15
20
25
1 2 3 4 5 6 7 8 9 10 11 12
NSWHP FR
Study FR
Laboratory
% o
f Io
nis
ed C
a
Results F
lagge
d
ABL 800 series Radiometer GEM IL
i-S
TA
T A
bb
ott
Ra
pid
po
int
Sie
me
ns
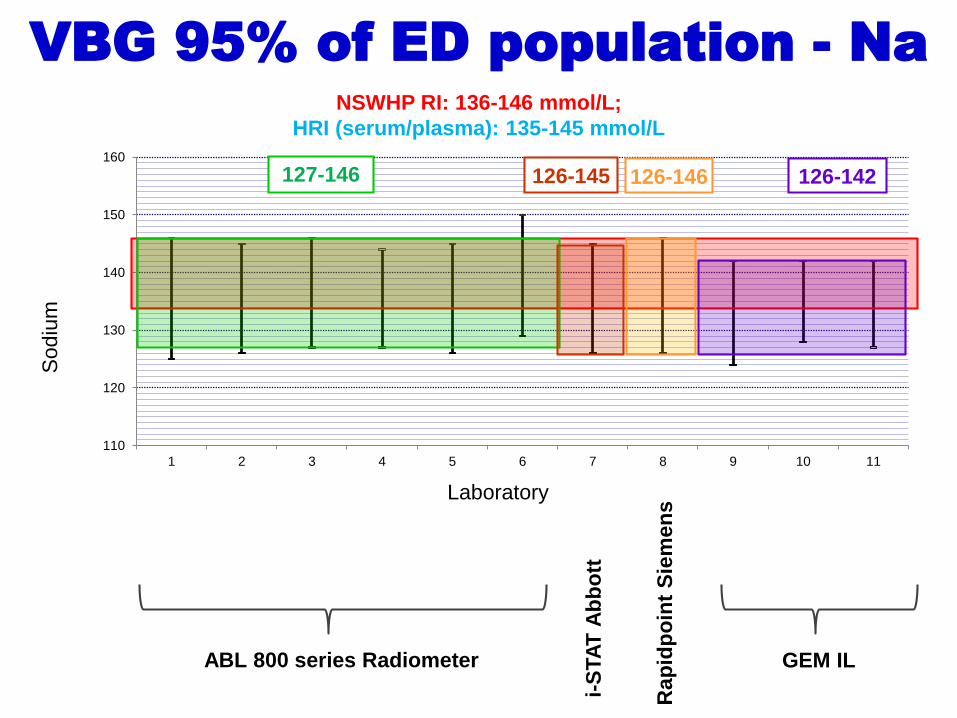
110
120
130
140
150
160
1 2 3 4 5 6 7 8 9 10 11
Laboratory
Sodiu
mVBG 95% of ED population - Na
ABL 800 series Radiometer GEM IL
i-S
TA
T A
bb
ott
Ra
pid
po
int
Sie
men
s
NSWHP RI: 136-146 mmol/L;
HRI (serum/plasma): 135-145 mmol/L
126-145127-146 126-146 126-142
Ra
pid
po
int
Sie
men
sABL 800 series Radiometer
i-S
TA
T A
bb
ott
GEM IL
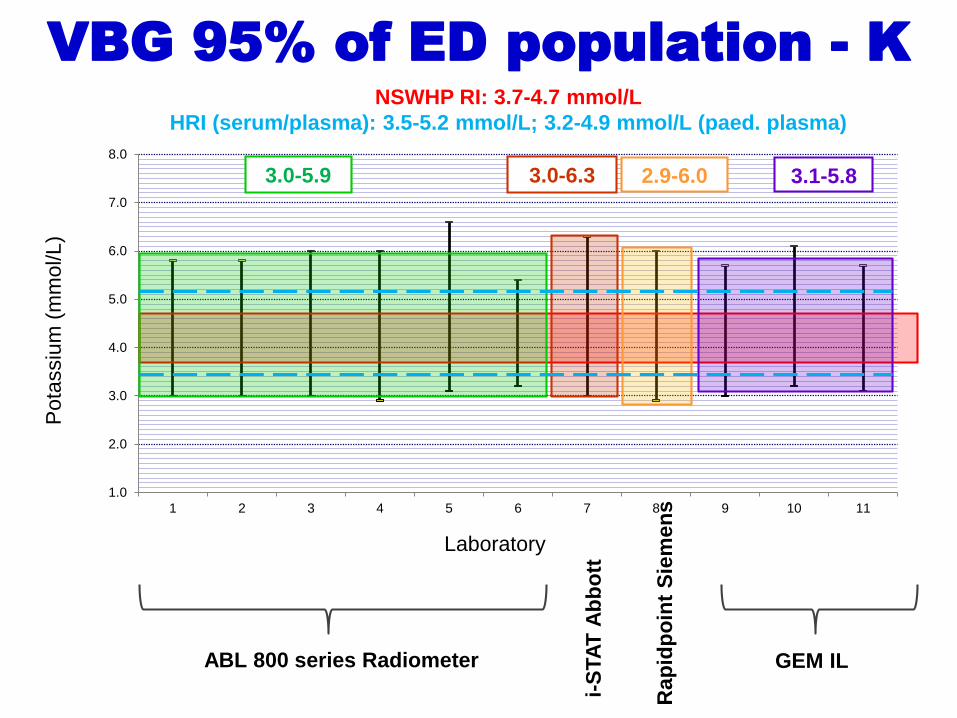
VBG 95% of ED population - K
1.0
2.0
3.0
4.0
5.0
6.0
7.0
8.0
1 2 3 4 5 6 7 8 9 10 11
Laboratory
Pota
ssiu
m(m
mol/L)
NSWHP RI: 3.7-4.7 mmol/L
HRI (serum/plasma): 3.5-5.2 mmol/L; 3.2-4.9 mmol/L (paed. plasma)
3.0-6.33.0-5.9 3.1-5.82.9-6.0
Ra
pid
po
int
Sie
men
sABL 800 series Radiometer
i-S
TA
T A
bb
ott
GEM IL
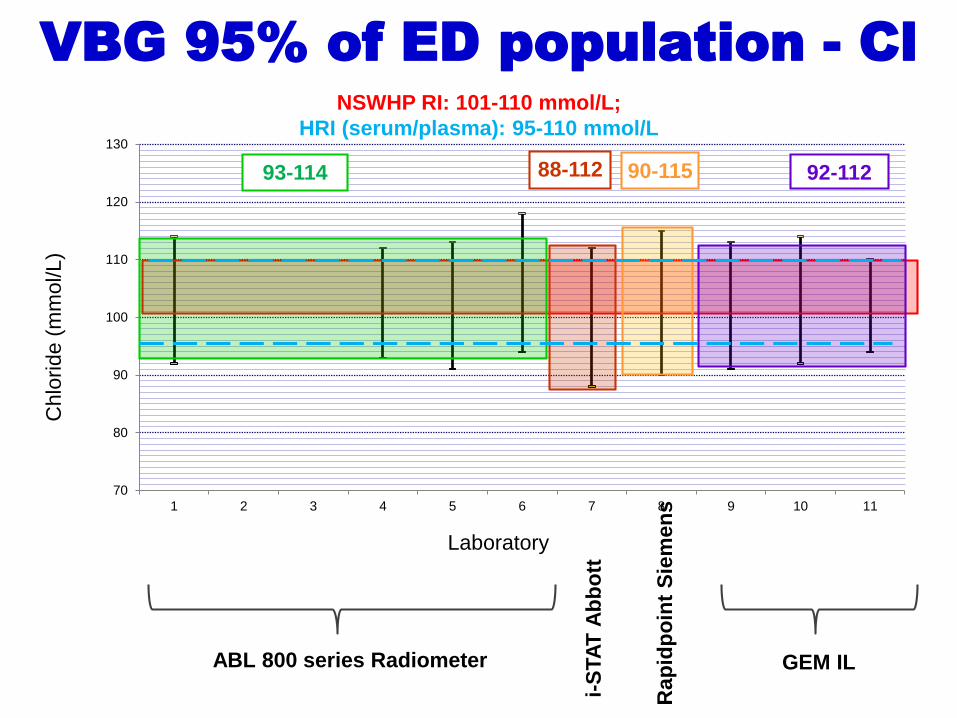
VBG 95% of ED population - Cl
70
80
90
100
110
120
130
1 2 3 4 5 6 7 8 9 10 11
Laboratory
Chlo
ride
(mm
ol/L)
NSWHP RI: 101-110 mmol/L;
HRI (serum/plasma): 95-110 mmol/L
88-11293-114 90-115 92-112
Outline
Background
Methods
Results
Transferability of the VBG RIs
Conclusions

Conclusions
Analyte NSW RI
study
NSWH clinical
and laboratory
consensus
Comments
Harmonisation Meeting
2018
Recommendations
pH 7.29 – 7.41 7.30 – 7.40 High URL flag rate – may
need fine tuningaccepted
pO2 (mmHg) 15 – 64 No RI Recommend ABG accepted
pCO2 (mmHg) 38 – 61 40 – 50 ‘URL’ = decision limit to
detect COPD. It will flag 20-
25% healthy; clinical F/U
accepted, with some arguing
that this is a decision limit and
we should still cite a RI that has
a higher URL of ~60 mmHg
Bicarbonate (mmol/L) 23 – 31 22 – 32 HRI for serum/plasma accepted
Lactate (mmol/L) 0.5 – 3.1 <2.0 Same as ABG RI accepted
Ionised Ca (mmol/L) 1.16 – 1.32 1.15 – 1.30 Investigate high flag rate at
LRL
Suggested to investigate further
and look into sampling issues
that may explain the high flag
rate at the LRL
Sodium (mmol/L) 136 - 146 136 - 146 Notable instrument
differences
?HRI for plasma: 135-145
To be discussed further in the
blood gas working party
Potassium (mmol/L) 3.7 – 4.7 3.7 – 4.7 ?HRI for plasma: 3.2-4.9
(paed) or 3.5-5.2 (adults)
To be discussed further in the
blood gas working party
Chloride (mmol/L) 101 – 110 101 – 110 Notable instrument
differences
?HRI for plasma: 95-110
To be discussed further in the
blood gas working party
The below VBG Reference Intervals are adaptable to all major platforms (ABL, i-STAT,
GEM, Rapidpoint) after local verification. Electrolytes need further investigation.
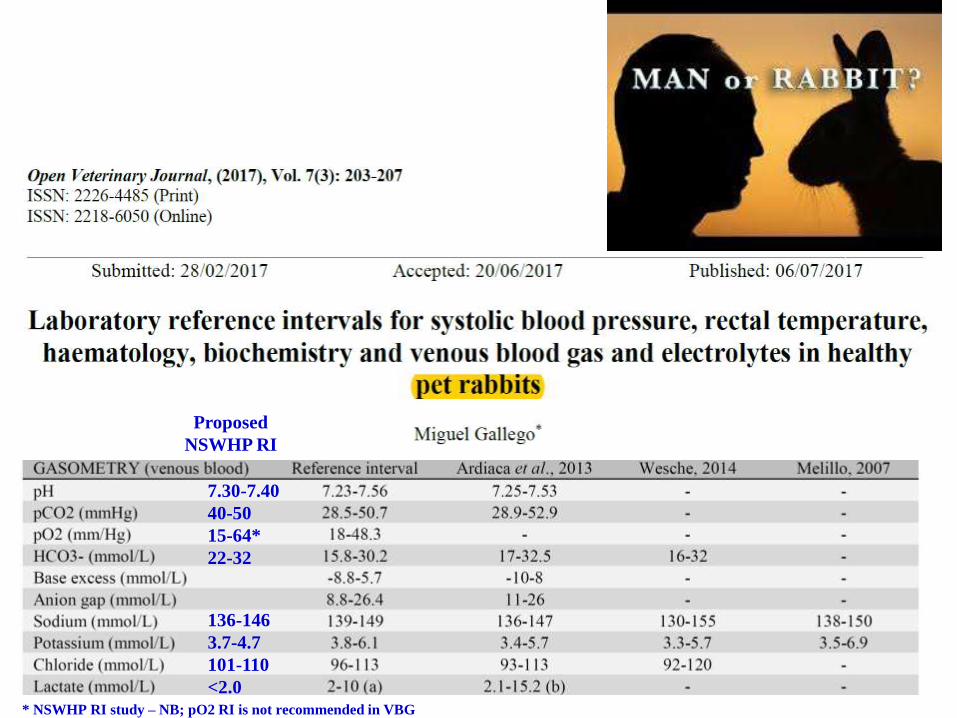
7.30-7.40
40-50
15-64*
22-32
136-146
3.7-4.7
101-110
<2.0
* NSWHP RI study – NB; pO2 RI is not recommended in VBG
Proposed
NSWHP RI

ReferencesKelly AM, McAlpine R, Kyle E. Agreement between bicarbonate measured on arterial and venous blood
gases. Emergency Medicine. 2004;16(5‐6):407-9
Kelly AM. The case for venous rather than arterial blood gases in diabetic ketoacidosis. Emergency
Medicine Australasia. 2006;18(1):64-7
Kelly AM. Review article: Can venous blood gas analysis replace arterial in emergency medical care.
Emergency Medicine Australasia. 2010;22(6):493-8
Lim BL, Kelly A-M. A meta-analysis on the utility of peripheral venous blood gas analyses in
exacerbations of chronic obstructive pulmonary disease in the emergency department. European
Journal of Emergency Medicine. 2010;17(5):246-8
Kelly AM. Agreement between arterial and venous blood gases in emergency medical care: a
systematic review. Hong Kong Journal of Emergency Medicine. 2013;20(3):166.
Bloom BM, Grundlingh J, Bestwick JP, Harris T. The role of venous blood gas in the emergency
department: a systematic review and meta-analysis. European Journal of Emergency Medicine.
2014;21(2):
Byrne AL, Bennett M, Chatterji R, Symons R, Pace NL, Thomas PS. Peripheral venous and arterial
blood gas analysis in adults: are they comparable? A systematic review and meta‐analysis. Respirology.
2014;19(2):168-75 81-8
How to Read a Venous Blood Gas (VBG) - Top 5 Tips - https://acadoodle.com/articles/how-to-read-a-
venous-blood-gas-vbg-top-5-tips