ventilation et rcp de l’arrêt cardiaque · • la ventilation pendant la rcp doit être...
TRANSCRIPT
Ventilation et RCP de l’arrêt cardiaque:
Jean-Christophe M Richard
Pôle SAMU 74 Urgence et Réanimation Centre Hospitalier Annecy Genevois
INSERM UMR 955 Eq13 Créteil
CONFLICTS OF INTEREST
- Air Liquide Medical Systems (part time)
Financial support for research (Genève /Annecy/Angers)
- VYGON (personal fee for lectures)
- SHILLER
- MAQUET (NAVA)
- COVIDIEN (PAV+) (personal fee for lectures)
- DRAGER (SmartCare)
- GE (FRC)

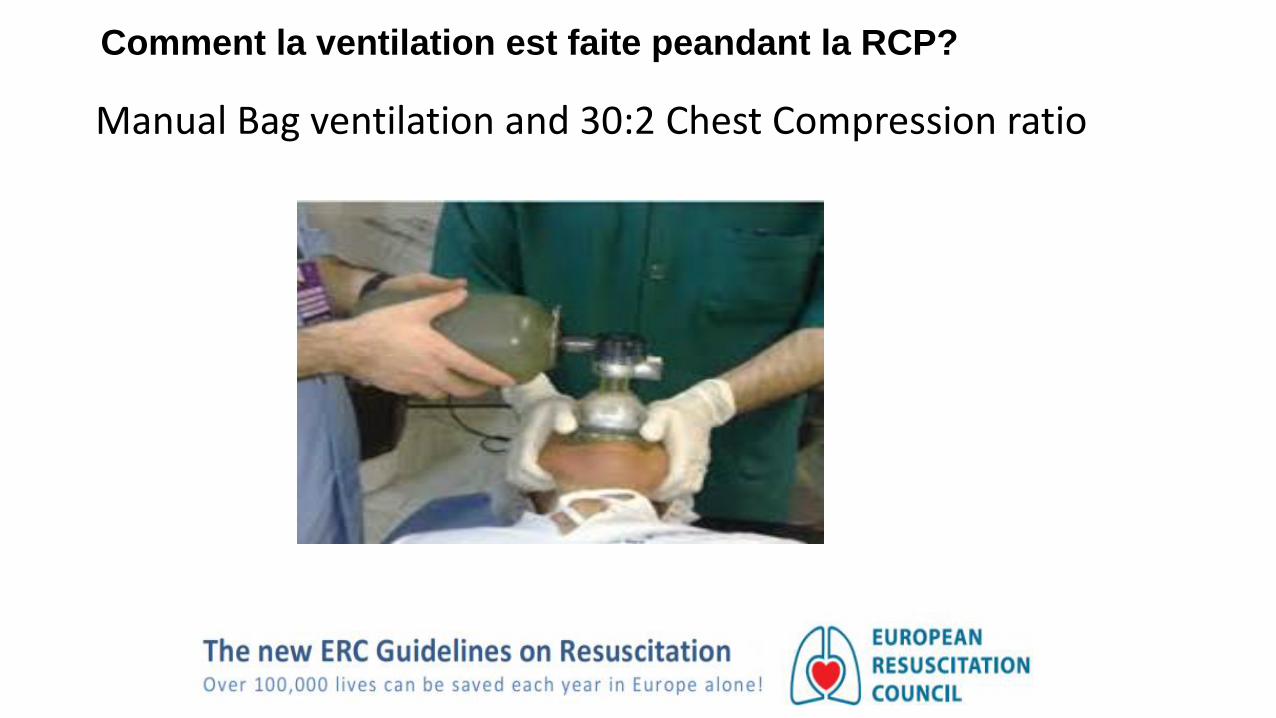
Comment la ventilation est faite peandant la RCP?
Manual Bag ventilation and 30:2 Chest Compression ratio

1328 questionnaires / 545 complétés
Compressions seulement pendant les premiers secours: (29.6%)
Interruption des compressions pendant l’intubation : (48%)
Interruption des compressions pour ventiler après intubation : (18%)

Risques associés à la ventilation au Bag Mask

JAMA 2005
Risques associés: hyper ventilation

The Lazarus phenomenon refers to a ROSC that occurs after ventilation interruption.
The Lazarus phenomenon is the moststraight full illustration of the riskassociated with hyperventilationduring CPR.

1 2 3 4 5 60.0
0.5
1.0
1.5
2.0
2.5
3.0
3.5
4.0
4.5
5.0
5.5
6.0
Minutes
Vo
lum
e (
L)
ICC 30:2
Vti (L)
Vte (L)
Gastric inflation (L)
1 2 3 4 5 60.0
0.5
1.0
1.5
2.0
2.5
3.0
3.5
4.0
4.5
5.0
5.5
6.0
Minutes
Vo
lum
e (
L)
CCC 30:2
Vti (L)
Vte (L)
Gastric inflation (L)
1 2 3 4 5 60.0
0.5
1.0
1.5
2.0
2.5
3.0
3.5
4.0
4.5
5.0
5.5
6.0
Minutes
Vo
lum
e (
L)
CCC 10/min
Vti (L)
Vte (L)
Gastric inflation (L)
30 insuflations 30 insuflations 60 insuflations
Ventilation & gastric inflation
N=5 cadavers
Standard deviations
Vti = 0,111
Vte = 0,165
Gastric Inflation = 2,3
Standard deviations
Vti = 0,099
Vte = 0,142
Gastric Inflation = 1,25
Standard deviations
Vti = 0,109
Vte = 0,103
Gastric Inflation = 1,170
Vt expiré : 319±165 ml (ICC 30:2) 341±142 ml (CCC 30:2) 277±103 ml (CCC 10/min)

Circulation Ventilation
Continuous Chest Compression strategy
Mécanisme des compressions thoraciques (CT)

• ETI + curarised subjects → Manual CC generates 156mL of VT (0 to 390mL)
• ETT + cardiac arrest subjects →Manual CC generates no VT

The median Vt per compression : 41.5 ml (33.0-62.1 ml) which was considerably less than measured dead space
ml
a
bc
d
e f
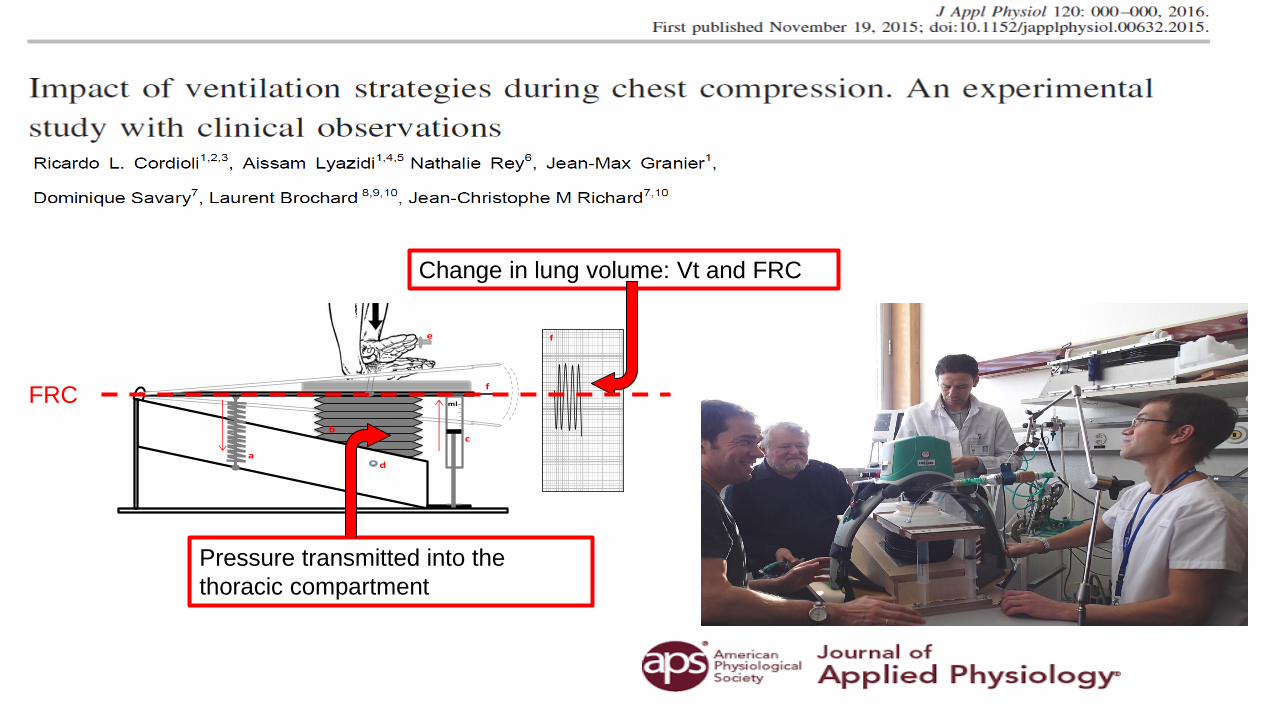
a. Ressort
b. Soufflet
c. Seringue
d. Prise de pression
dans le soufflet
e. Entré d’air
f. Stylet et Papier
millimétrique
f
Pressure transmitted into the
thoracic compartment
Change in lung volume: Vt and FRC
FRC

Reduction in lung volume below FRC induced by Chest compressionsF
low
P
aw
V
olu
me
Lung volume reduction below FRC
FRC
Cordioli et al. J Appl Physiol 2016

Flow limitation at PEEP 0
PEEP 3 cmH20 PEEP 0 cmH20
Lung airways closure limiting inspiratory flow during Chest compressions
Cordioli et al. J Appl Physiol 2016

For similar chest compressions, thoracic airways closure limits both Paw transmission and ventilation….
As results, thoracic airways closure may affect capnogram and therefore be informative regarding ventilation ….

ERC Guidelines 2015 on EtCO2 monitoring
1. To check proper placement of tracheal tube
2. To monitor respiratory rate to avoid hyperventilation
3. To assess quality of chest compressions
4. To detect ROSC without interrupting chest compressions
5. To predict outcome at 20 min
“Our Lack of confidence in the accuracy of EtCO2 measurement during CPR, and the need of
advance airway to measure EtCO2 reliably, limits our confidence in its use for prognostication” ….
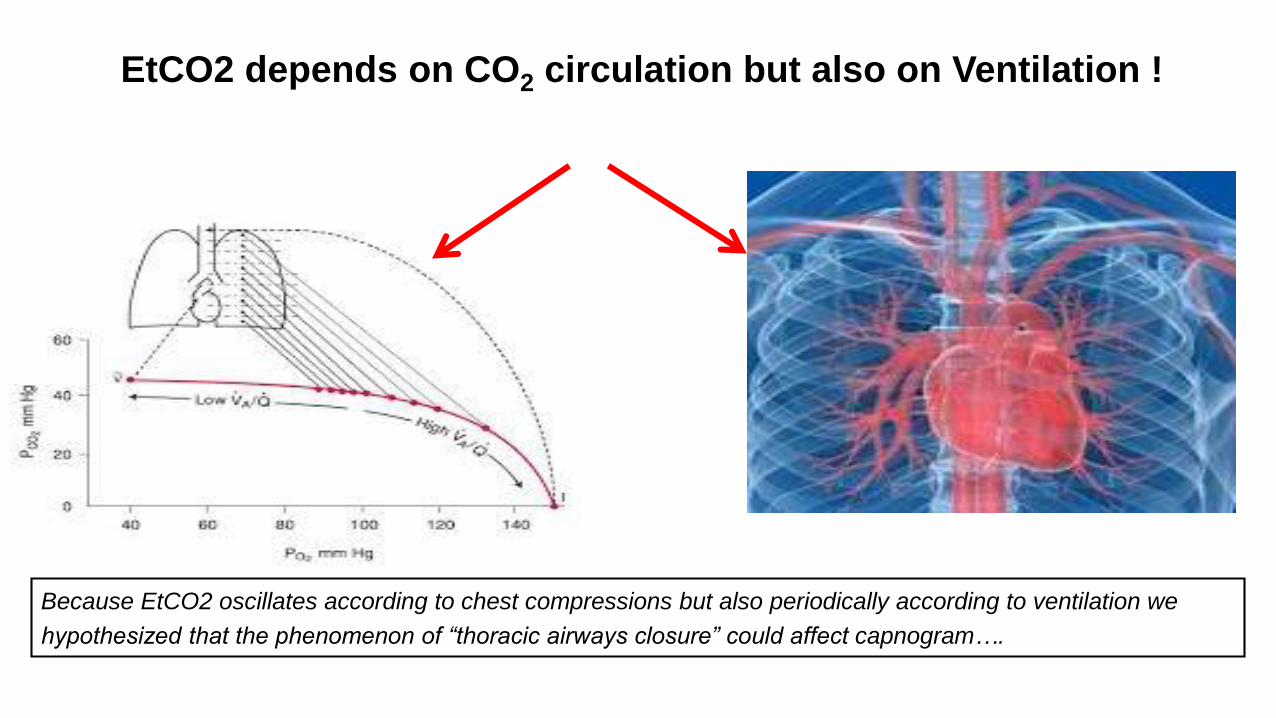
EtCO2 depends on CO2 circulation but also on Ventilation !
Because EtCO2 oscillates according to chest compressions but also periodically according to ventilation we
hypothesized that the phenomenon of “thoracic airways closure” could affect capnogram….

Accidental observation: Periodic variation of EtCO2 during CPR
Capnogram (EtCO2 waveform) during CPR may varies periodically with chest compressions and ventilation….

EtCO2 recordings in OHCA versus TC Lung Model
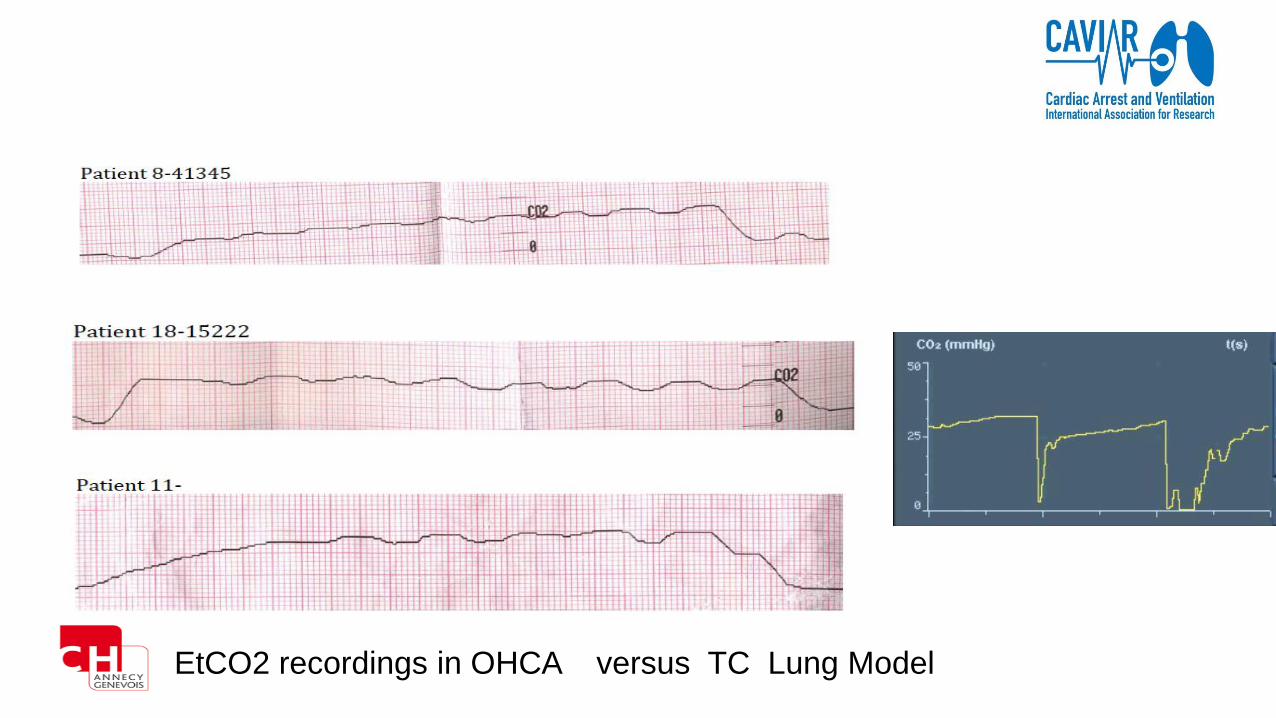
EtCO2 recordings in OHCA versus TC Lung Model

Leturiondo M et al. Resuscitation 2018

CO
2
Time (s)CO
2 P
rod
uct
ion
L/m
in
ROSC
Methods 1: Bench model with CO2 (Toronto Lab)
D Luca Grieco, et al. (manuscript in preparation)
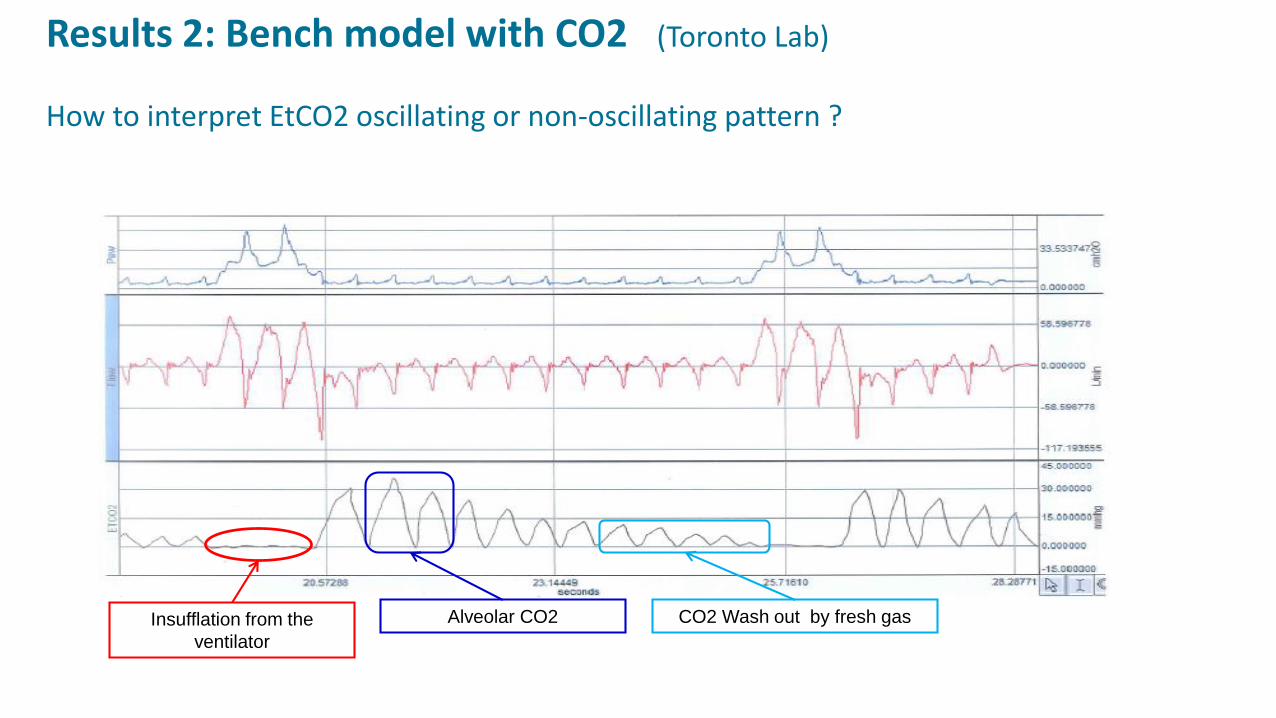
Insufflation from the
ventilator
Alveolar CO2 CO2 Wash out by fresh gas
Results 2: Bench model with CO2 (Toronto Lab)
How to interpret EtCO2 oscillating or non-oscillating pattern ?

CO
2
Airways opening measurements
P-P
aw
CO
2
ITP
CO
2
Intra thoracic measurements
D Luca Grieco, et al. (manuscript in preparation)
Methods 2: Thiel cadaver model with CO2 (CAVIAR lab)

D Luca Grieco, et al. (manuscript in preparation)
Results 3: Thiel cadaver model with CO2 (CAVIAR lab)
Airway transmission
P-P
aw
CO
2
Human cadaver recordings
Airway closure
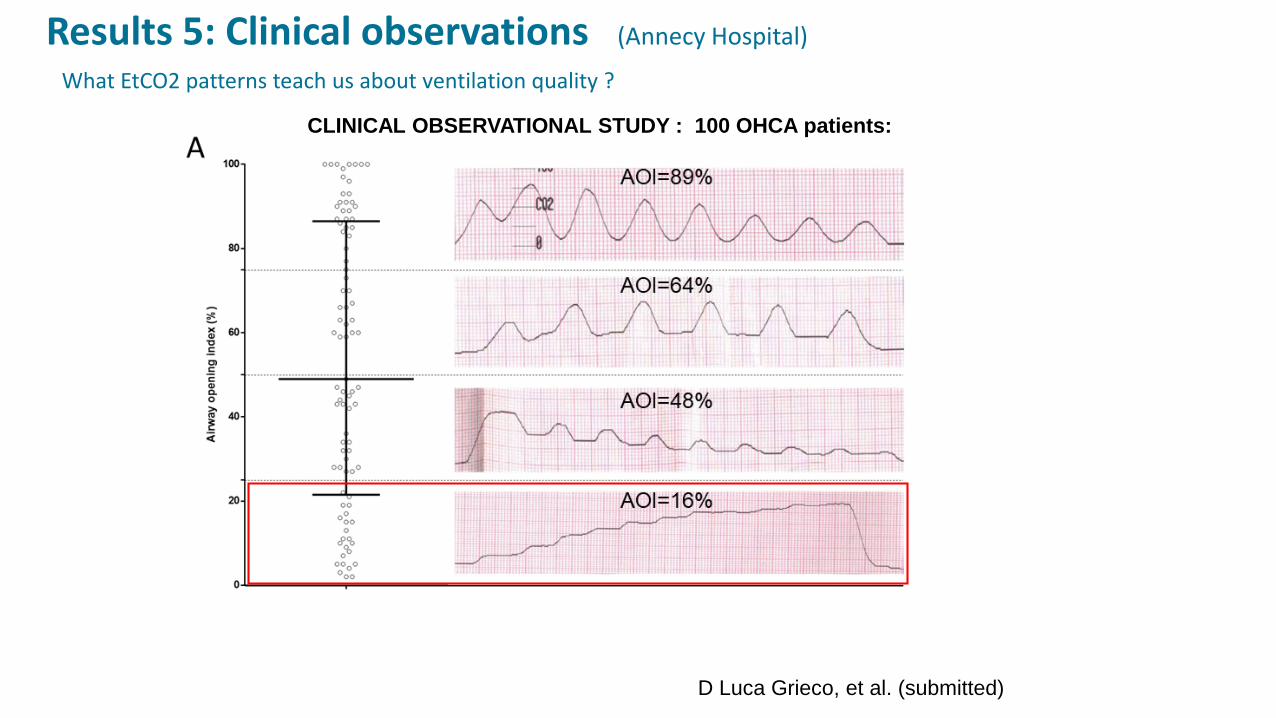
CLINICAL OBSERVATIONAL STUDY : 100 OHCA patients:
Results 5: Clinical observations (Annecy Hospital)
D Luca Grieco, et al. (submitted)
What EtCO2 patterns teach us about ventilation quality ?

Results 6: Clinical observations (Annecy Hospital)
D Luca Grieco, et al. (manuscript in preparation)
Which EtCO2 value is the best surrogate of alveolar CO2 ?
0
25
50
75
100
Patients
CO
2 (
mm
Hg
)
OHCA
N=90 Patients
CLINICAL OBSERVATIONAL STUDY : 100 OHCA patients:
EtCO2 values collected in 1 capnogram for each patient

CLINICAL OBSERVATIONAL STUDY : 100 OHCA patients:
Results 5: Clinical observations (Annecy Hospital)
D Luca Grieco, et al. (submitted)
What EtCO2 patterns teach us about ventilation quality ?

Figure 3.R1

Figure 5.R1

CPV : Cardio Pulmonary Ventilation ( Monnal T60 )
4 paramètres pour guider la RCP
• fCT, la fréquence des compressions thoraciques
• % CT, le % de compressions thoraciques continue (fraction CPR)
• P-P, Feed back sur la force des compressions thoraciques
• CO2, EtCO2 expiré max


SU
RV
IVA
L
TIME
Brain perfusion guided therapy
4 7 10
Airway Closure? guided therapy
ETCO2 guided therapy
Annecy CPR Round Table :Two phase time sensitive model to OHCA
High Quality CPREarly Defibrillation
Cardiac Pump
Goal Directed OptimizationCardiac and Thoracic Pump
Consider ECMO

CONCLUSIONS
• La ventilation pendant la RCP doit être revisitée pour en limiter les effets délétères circulatoires.
• Favoriser les CT continues doit être une prioritaire.
• La ventilation pendant la RCP est nécessaire car la fermetures des petites voies aériennes intra
thoracique limite la ventilation liée aux simples CT.
• Des outils de monitoring de l’EtCO2 spécifiquement adaptés à la RCP sont nécessaire pour la
pratique
• La valeur maximum d’EtCO2 est celle qui reflèterait le mieux le CO2 alvéolaire et l’état circulatoire
• L’analyse des variations d’EtCO2 pourrait aussi renseigner sur la qualité de la ventilation