venture capital and innovation juanita gonzalez-uribe
TRANSCRIPT

Venture Capital and Innovation
Juanita Gonzalez-Uribe
Submitted in partial fulfillment of the requirements for the degree of
Doctor of Philosophy under the Executive Committee
of the Graduate School of Arts and Sciences
COLUMBIA UNIVERSITY 2013

All rights reserved
INFORMATION TO ALL USERSThe quality of this reproduction is dependent upon the quality of the copy submitted.
In the unlikely event that the author did not send a complete manuscriptand there are missing pages, these will be noted. Also, if material had to be removed,
a note will indicate the deletion.
Microform Edition © ProQuest LLC.All rights reserved. This work is protected against
unauthorized copying under Title 17, United States Code
ProQuest LLC.789 East Eisenhower Parkway
P.O. Box 1346Ann Arbor, MI 48106 - 1346
UMI 3561218
Published by ProQuest LLC (2013). Copyright in the Dissertation held by the Author.
UMI Number: 3561218

© 2013 Juanita Gonzalez-Uribe
All rights reserved

ABSTRACT
Venture Capital and Innovation
Juanita Gonzalez-Uribe
This dissertation delves into the relation between venture capital and innovation. The existing
literature usually addresses this question by using industry-level data. In contrast, the analysis
here relies on data at the company level on patents invented in venture-backed companies. The
dissertation has four parts. The first part, a paper coauthored with my advisors Bruce Kogut and
Morten Sorensen, examines the relation between venture capital and the rate and quality of
companies' innovative activity. We compare the number of patent filings, and the quality of
innovations, before and after companies are first financed by a venture capital investor. As an
attempt to control for the endogeneity of venture capital investments we exploit amendment by
the Texas Legislature that freed public state pension funds in Texas to invest in venture capital.
Our results suggest that venture funding increases the rate of companies’ innovative activity.
Interestingly, we also find that venture capital is associated with a decrease in the quality of
companies’ research output. The second part estimates the effect of venture capital on the
diffusion of knowledge. I compare citations to patents invented in venture-backed companies to
those of comparable patents invented elsewhere. To isolate the causal effect, I exploit time
variation in the assets of state pension funds that allocate capital to venture capital. This variation
provides a valid instrument if the effect of changes in innovation opportunities within a state is
uniform across local patents in the same technology-class and vintage-year. I find that after

venture funding annual citations to a given patent increase 19% relative to the citations of
comparable patents. Additional results are consistent with two mechanisms: venture capital
investors certify the value of patents to the general public and facilitate communication among
companies in their portfolios. The third part of this dissertation explores whether the strategic
interaction of companies in the same venture capital network affects the direction of companies'
innovative activity. Theoretically, this effect is not clear. Whereas the presence of common
investors can stir companies' research in the same direction by facilitating knowledge spillovers,
competition for the same financial resources may undermine the incentives of companies in the
same venture capital network to collaborate, or even work in similar areas. To test this question
empirically I use the propensity of patent citations among pairs of companies as a measure of the
similarity in companies’ research. To reduce concerns of strategic investment by venture capital
investors, I control in the estimation for the technological similarity and geographical co-location
of companies. Consistent with venture capitalists facilitating the diffusion of knowledge across
the companies they finance I find that companies in the same venture capital network produce
similar innovations. Interestingly, I also find that this convergence in innovation is only true for
companies that are not competing for the same financial resources, specifically, those pairs of
companies that are geographically distant or work in different technological areas and industries.
Results suggest that the optimal strategy for companies that are competing for the same financial
resources is to differentiate and pursue different lines of research. Finally, the fourth part od this
dissertation describes in detail the construction of the dataset.

TABLE OF CONTENTS
List of Tables v
List of Figures vii
Acknowledgment viii
Dedication ix
1 Venture Capital and Innovative Activity (with Bruce Kogut and Morten Sorensen) 1
1.1 Data and Empirical Analysis . . . . . . . . . . . . . . . . . . . . . . . . . . . . . 4
1.1.1 Sample Composition . . . . . . . . . . . . . . . . . . . . . . . . . . . . . 4
1.1.2 Characterizing innovative activity . . . . . . . . . . . . . . . . . . . . . . 5
1.1.3 Econometric Modeling Strategy . . . . . . . . . . . . . . . . . . . . . . . 8
1.2 Results . . . . . . . . . . . . . . . . . . . . . . . . . . . . . . . . . . . . . . . . . 13
1.2.1 The rate of innovative activity increases after VC investment . . . . . . . . 13
1.2.2 Unconditionally, the quality of innovative activity is not affected . . . . . . 14
1.2.3 Conditionally on the quality of companies, the quality of innovative activ-
ity decreases . . . . . . . . . . . . . . . . . . . . . . . . . . . . . . . . . 16
1.2.4 Conditionally on the quality of companies, the novelty of innovative activ-
ity decreases . . . . . . . . . . . . . . . . . . . . . . . . . . . . . . . . . 16
i

1.2.5 An attempt at controlling for endogeneity . . . . . . . . . . . . . . . . . . 17
1.3 Conclusions . . . . . . . . . . . . . . . . . . . . . . . . . . . . . . . . . . . . . . 19
2 Venture Capital and the Diffusion of Knowledge 21
2.1 Data Description and Summary Statistics . . . . . . . . . . . . . . . . . . . . . . 24
2.1.1 Citation baseline . . . . . . . . . . . . . . . . . . . . . . . . . . . . . . . 26
2.1.2 Restricted Sample . . . . . . . . . . . . . . . . . . . . . . . . . . . . . . 27
2.2 Empirical Analysis . . . . . . . . . . . . . . . . . . . . . . . . . . . . . . . . . . 27
2.2.1 Univariate Tests . . . . . . . . . . . . . . . . . . . . . . . . . . . . . . . . 27
2.2.2 Poisson Regressions . . . . . . . . . . . . . . . . . . . . . . . . . . . . . 28
2.2.3 Addressing endogeneity of VC investments . . . . . . . . . . . . . . . . . 32
2.2.4 Interpretation of results . . . . . . . . . . . . . . . . . . . . . . . . . . . . 39
2.2.5 Back-of-the-envelope calculation . . . . . . . . . . . . . . . . . . . . . . 41
2.3 Disentangling Mechanisms . . . . . . . . . . . . . . . . . . . . . . . . . . . . . . 42
2.3.1 Knowledge Diffusion and VC portfolios . . . . . . . . . . . . . . . . . . . 42
2.3.2 Knowledge Diffusion and Inventor Mobility . . . . . . . . . . . . . . . . . 46
2.3.3 Knowledge Diffusion and Patent Sales . . . . . . . . . . . . . . . . . . . . 47
2.3.4 Discussion . . . . . . . . . . . . . . . . . . . . . . . . . . . . . . . . . . 49
2.4 Knowledge Diffusion and Patent Citations . . . . . . . . . . . . . . . . . . . . . . 50
ii

2.5 Conclusion . . . . . . . . . . . . . . . . . . . . . . . . . . . . . . . . . . . . . . 51
3 Direction of Inventive Activity in Venture Capital Networks 53
3.1 Data . . . . . . . . . . . . . . . . . . . . . . . . . . . . . . . . . . . . . . . . . . 57
3.1.1 Example of weights . . . . . . . . . . . . . . . . . . . . . . . . . . . . . . 58
3.1.2 Sample Composition . . . . . . . . . . . . . . . . . . . . . . . . . . . . . 59
3.2 Empirical Approach . . . . . . . . . . . . . . . . . . . . . . . . . . . . . . . . . . 60
3.2.1 VC-proximity . . . . . . . . . . . . . . . . . . . . . . . . . . . . . . . . . 60
3.2.2 Technological-Proximity . . . . . . . . . . . . . . . . . . . . . . . . . . . 61
3.2.3 Geographical Distance . . . . . . . . . . . . . . . . . . . . . . . . . . . . 63
3.2.4 Summary Statistics . . . . . . . . . . . . . . . . . . . . . . . . . . . . . . 63
3.2.5 Regression Model . . . . . . . . . . . . . . . . . . . . . . . . . . . . . . 64
3.2.6 Non-Parametric Evidence . . . . . . . . . . . . . . . . . . . . . . . . . . 66
3.2.7 Estimation Results . . . . . . . . . . . . . . . . . . . . . . . . . . . . . . 66
3.3 Conclusions . . . . . . . . . . . . . . . . . . . . . . . . . . . . . . . . . . . . . . 72
4 Tables 74
5 Figures 122
6 References 129
iii

7 Appendix 135
7.1 Capturing patent data . . . . . . . . . . . . . . . . . . . . . . . . . . . . . . . . . 135
7.2 Sample . . . . . . . . . . . . . . . . . . . . . . . . . . . . . . . . . . . . . . . . 136
7.3 Summary Statistics . . . . . . . . . . . . . . . . . . . . . . . . . . . . . . . . . . 138
8 Tables Appendix 140
iv

List of Tables
Table 1.1 - Sample Composition . . . . . . . . . . . . . . . . . . . . . . . . . . . 78
Table 1.2 - Univariate tests of rate and quality of innovative activity . . . . . . . 80
Table 1.3 - VC and the rate of innovative activity . . . . . . . . . . . . . . . . . 81
Table 1.4 - VC and the rate of innovative activity by industry . . . . . . . . . . 82
Table 1.5 - VC and the rate of innovative activity by type of VC exit . . . . . . 84
Table 1.6 - VC and the quality of innovative activity . . . . . . . . . . . . . . . 85
Table 1.7 - VC and the quality of innovative activity by industry . . . . . . . . . 87
Table 1.8 - VC and the quality of innovative activity by type of VC exit . . . . . 89
Table 1.9 - VC quality of innovative activity with company �xed e¤ects . . . . . 90
Table 1.10 - VC and the nature of innovative activity . . . . . . . . . . . . . . . . 91
Table 1.11 - VC and the rate of innovative activity: exploiting the 1999 legislative
amendment in Texas . . . . . . . . . . . . . . . . . . . . . . . . . . . . . . . 93
Table 1.12 - VC and the quality of innovative activity: exploiting the 1999 Leg-
islative amendment in Texas . . . . . . . . . . . . . . . . . . . . . . . . . . . 94
Table 2.1 - Summary statistics analysis sample . . . . . . . . . . . . . . . . . . . 95
Table 2.2 - Summary statistics restricted sample 1993-2008 . . . . . . . . . . . . 98
Table 2.3 - Univariate tests VC investments and patent citations . . . . . . . . . 102
Table 2.4 - Poisson regressions VC investments and patent citations . . . . . . . 103
Table 2.5 - VC investments and state pension funds�assets . . . . . . . . . . . . 104
Table 2.6 - IV analysis VC investments and patent citations . . . . . . . . . . . 105
Table 2.7 - First robustness check IV analysis VC investments and patent citations106
Table 2.8 - Second robustness check IV analysis VC investments and patent citations107
Table 2.9 - Originality . . . . . . . . . . . . . . . . . . . . . . . . . . . . . . . . 108
Table 2.10 - Univariate Tests VC investments and patent citations inside and out-
side VC portfolios . . . . . . . . . . . . . . . . . . . . . . . . . . . . . . . . . 109
v

Table 2.11 - Poisson regressions VC investments and patent citations inside and
outside VC portfolios . . . . . . . . . . . . . . . . . . . . . . . . . . . . . . . 110
Table 2.12 - IV analysis VC investments and patent citations inside and outside
VC portfolios . . . . . . . . . . . . . . . . . . . . . . . . . . . . . . . . . . . 111
Table 2.13 - Univariate Tests VC investments and inventor and non-inventor-linked
citations . . . . . . . . . . . . . . . . . . . . . . . . . . . . . . . . . . . . . . 112
Table 2.14 - Poisson regressions VC investments and non-inventor-linked citations
inside and outside VC portfolios . . . . . . . . . . . . . . . . . . . . . . . . . 113
Table 2.15 - IV analysis VC investments and non-inventor-linked citations inside
and outside VC portfolios . . . . . . . . . . . . . . . . . . . . . . . . . . . . 114
Table 2.16 - Summary statistics patent sales . . . . . . . . . . . . . . . . . . . . . 115
Table 3.1 - Sample composition . . . . . . . . . . . . . . . . . . . . . . . . . . . 116
Table 3.2 - Summary statistics . . . . . . . . . . . . . . . . . . . . . . . . . . . . 119
Table 3.3 - Non parametric evidence . . . . . . . . . . . . . . . . . . . . . . . . . 120
Table 3.4 - Technological convergence in VC networks . . . . . . . . . . . . . . . 121
Table 3.5 - Robustness check: excluding the state of California . . . . . . . . . . 122
Table 3.6 - Robustness check: excluding Computers and Communications . . . . 123
Table 3.7 - Robustness check: excluding top VCs . . . . . . . . . . . . . . . . . . 124
Table 3.8 - Technological convergence in VC networks and turnover of inventors
and executives . . . . . . . . . . . . . . . . . . . . . . . . . . . . . . . . . . . 125
vi

List of Figures
Figure 2.1 - Estimated temporal trends in citations to patents . . . . . . . . . . 126
Figure 2.2 - Patent sale likelihood . . . . . . . . . . . . . . . . . . . . . . . . . . 127
Figure 2.3 - Exposure E¤ect of VC investments . . . . . . . . . . . . . . . . . . 128
Figure 3.1 - Illustration of VC-proximity links . . . . . . . . . . . . . . . . . . . 129
Figure 3.2 - Predicted probabilities across geographical distance and VC- prox-
imity . . . . . . . . . . . . . . . . . . . . . . . . . . . . . . . . . . . . . . . 130
Figure 3.3 - Predicted probabilities across technological-proximity and VC- prox-
imity . . . . . . . . . . . . . . . . . . . . . . . . . . . . . . . . . . . . . . . . 131
vii

viii
ACKNOWLEDGEMENTS
I want to thank my advisor Morten Sorensen for his invaluable guidance and encouragement
throughout my doctoral studies. Our numerous conversations around coffee have shaped and
enriched the way I think about research and the academic profession in general. I can only hope
to become in the future as inspiring an advisor and researcher as him. I am also grateful to Daniel
Paravisini and Daniel Wolfenzon for teaching me to refine my research, concentrate on details,
and become more practical. I owe special thanks to Bruce Kogut for his unconditional support,
and his constant reminder that while immersed in the details I must not forget to connect the
dots.
This dissertation would not have been possible without the constant support of my parents, Jaime
and Sandra, and my sister, Catalina. Not only do they always help me follow my dreams, more
importantly, they make my dreams part of their own. Finally, I wouldn’t have been able to finish
this work if it were not for Daniel Perdomo, who has taught me time and again that the glass is
always half full, never half empty.
This research was funded in part by the Ewing Marion Kauffman Foundation. The contents of
this publication are solely the responsibility of Juanita Gonzalez Uribe.

1
1 Venture Capital and Innovative Activity (with Bruce Kogut
and Morten Sorensen)
The impact of Venture Capital (VC) on innovation has been a popular topic in the financ
literature for the past two decades. Although most of the empirical work at the industry level
find that VC increases innovative activity (e.g., Kortum and Lerner (2000), Mollica and Zingales
(2007), Hirukawa and Ueda (2008) and Popov and Roosenboom (2009)), evidence at the company
level suggests that this impact is weak at best (e.g., Engel and Keilbach (2007), Caselli et al.
(2009), and Stuck and Weingarten (2005)).
Theoretically, even if VC spurs innovation at the industry level it is not clear that VCs necessar-
ily encourage the innovative activity of the companies they invest in. Whereas VC can positively
affect overall industrial Research and Development (R&D) by facilitating the diffusion of technical
knowledge,1 or increasing access to potential risk capital, once companies are VC finance incen-
tives to innovate may be curtailed. For example, the competition for future financia resources
inside VC portfolios can push companies to exert more effort on the development part of R&D
relative to research. In light of these complex trade-offs, the studies that use data at the company
and at the industry level do not necessarily offer contradictory evidence. More systematic evidence
is required to have a better understanding on how VC interacts with innovation.
This chapter provides new evidence on the effect of VC on innovative activity using data at the
company level, and departs from the existing literature on two accounts. First, we rely on data
for US-based startups. In contrast, existing research at the company level uses data for European-
based startups. This is an important departure as the landscape for financin innovation has been
shown to be fundamentally different across these two regions. While the role of VC in the U.S. is
1For more on this topic see Chapter 2.

2
mainly to target high-risk, high-payoff innovations, in Europe this role seems to be partially fille
by business-groups (Belenzon et al. (2010)).2 Thus, it is likely that the types of companies that are
VC finance in each region are different, and that the effect of VC on companies’ innovation may
differ. In addition, the existing evidence is for the most part restricted to startups that ultimately
went public (e.g., Stuck and Weingarten (2005) and Caselli et al. (2009)). Since approximately
only a third of the companies that are VC-backed go public, and going public has its own effect on
innovation (e.g., Bernstein (2012)), our work offers a more comprehensive analysis.
The second departure from the existing literature is that we explore how VC affects not only
the rate of innovative activity but also its composition. Following a growing literature that uses
patent-based metrics to characterize innovation at the company level (e.g., Seru (2012) Lerner et
al. (2011), Bernstein (2012)), we use data on patent citations to explore how VC affects the quality,
novelty, and nature of the research output of companies.
There are two main findings Our results suggest that venture funding increases the rate of
companies’ innovative activity as measured by patent filings This result is consistent with the
evidence at the industry level, and stands to contrast with existing evidence at the company level.
Interestingly, we fin that the type of innovations produced by companies also changes after ven-
ture funding. Mainly, VC is associated with a decrease in the quality of companies’ research
output.
One interpretation of the finding is that they simply reflec endogenous VC choices. For ex-
ample, VCs may invest in companies when they expect a surge of patent filing following an
innovative breakthrough. As an attempt to control for endogeneity, we exploit an amendment by
the Texas Legislature that freed public state pension funds in Texas to invest in VC. Unlike private
retirement systems that are governed by the federal Employee Retirement Security Act (ERISA),
2The fundamental reasons for this difference are that in Europe the capitalization of R&D is on average lower thanin the U.S., and the stigma of failure is also higher (Belenzon et al., 2010).

3
the investment policy of public pension funds is governed by state laws. In contrast to private pen-
sion funds, most public pension funds were not explicitly allowed to invest in high-risk assets until
much later than the ERISA clarificatio in 1979. In fact, by 1990 almost 30% of public retirement
funds were prohibited from investments in VC.3 The clarificatio by the Texas Legislature led to
an increase in the funds committed to VC by local public pension funds, and is useful to identify
the causal impact of venture funding on innovative activity because it is likely unrelated to the ar-
rival of innovation opportunities. Using an instrumental variable approach based on this intuition,
we fin that the increase in the rate of innovative activity following venture funding, as well as the
decrease in the quality of innovations, are not be exclusively explained by VC selection.
This paper chapter to the literature that examines the relation between innovation and different
dimensions of corporate financ such as: institutional ownership (Aghion et al. (2009)), the de-
cision to go public (Bernstein (2012)), the decision to merge (Seru (2012)), financia constraints
(Almeida et al. (2013)), corporate governance (Chemmanur and Tian (2012)), and organizational
form (e.g., Belenzon et al. (2010) and Belenzon et al. (2012)). Our work is closest to Lerner et
al. (2010) which uses a similar framework to study the effect of Leveraged Buyouts (LBOs) on
innovation. Taken together, our finding suggest that LBOs and VC, the two most dominant forms
of Private Equity (PE) in the US, interact with innovation very differently. While LBOs are associ-
ated with an increase in the quality of their targets’ innovations, innovation novelty decreases after
venture funding. In addition, LBOs seem to have no effect on the scale of innovative activity, while
VC is associated with an increase in companies’ patent filings The difference in the interaction
between LBO and VC with innovation is consistent with the differences across these PE funds’
investment strategies. While LBOs target companies that have potential for improvement, VCs
target companies that are very close to their innovative peak, and ripe for monetization.
3Author’s calculations based on work by Snell and Wolfe (1990). The authors used a survey among 77 stateretirement systems and inquired about investment restrictions. About half of those funds reported having statutoryrestrictions on their investments.

4
This chapter also relates to the literature that examines the impact of financia development
on the real economy (e.g., LaPorta et al. (1999) and Rajan and Zingales (1998)). Given existing
evidence of a weak effect of venture funding on the innovative activity for European-based startups,
our contrasting finding for US-based startups are broadly consistent with Belenzon et al. (2010),
who fin a different role for VC in the U.S. and in Europe.
The rest of this chapter is organized as follows. In Section 1.1 we describe the data and the
empirical methodology. Section 1.1 summarizes the results. Conclusions and directions for future
research are presented in Section 1.3.
1.1 Data and Empirical Analysis
1.1.1 Sample Composition
The data in this analysis combines information on VC investments in US-based startups with
patent filing of U.S. companies. A thorough description of the construction of the sample can be
found in the Appendix. For this chapter, we subset the data to companies with at least one U.S.
utility patent application in the period from the calendar year starting 3 years before, to the calendar
year starting 5 years after, the year of the (first VC investment. This yields a sample of 36,980
patents file by 4,169 VC-backed companies. For large parts of the analysis we calculate the
number of citations a patent receives over the three years following the grant date. For these parts,
we exclude patents granted after December 2004, which restricts the sample to 21,138 patents file
by 3,231 VC-backed companies.
Table 1.1 shows the composition of the fina sample in terms of patents and companies. Panel
A in Table 1.1 breaks down the sample by year in which the companies were firs finance by a
VC. The distribution of VC investments is concentrated in the second half of the 1990s and the
firs half of the 2000s. This concentration reflect both the increasing volume of VC investments

5
during these years, and the growing representation of technology companies, which have more
patents. Panel A also breaks down the sample by type of VC exit. The type of exit is recorded by
SDC Thompson at the end of 2009. A third of the sample corresponds to investments that were
still active by the end of the sample. The most popular type of exit are Acquisitions. This category
is followed by: Initial Public Offering (IPO), company death (Defunct), and Other.
Panel A in Table 1.1 also displays the timing of the patent applications and awards. The appli-
cation dates extend from 1976 (3 years before the firs VC investment) to 2008.
Panel B in Table 1.1 breaks the sample down by industry classes. The distribution of compa-
nies is concentrated in Communications and Media, however, the distribution of patents is more
evenly spread out across industries. This difference in distributions reflect the different patent
propensities across industries.
1.1.2 Characterizing innovative activity
We focus on the size, quality and nature of companies’ patent portfolios to characterize innova-
tive activity. This section briefl describes the different patent-based metrics and present summary
statistics.
Patent filing and the rate of innovative activity We capture the rate of companies’ innovative
activity by tracking companies’ yearly patent filings Patent filing are timed using applications
dates as these approximate the timing of invention more accurately than grant dates. Table 1.2
compares patent activity around the VC investment. Companies fil 0.37 patents a year on average
before venture funding. After VC investment mean annual patent filing increase to 1.09. The
difference is statistically significant

6
Citation counts and the quality of innovative activity Following the innovation literature, we
use the citation count as a measure of the quality, or economic importance of the patent (e.g., Hall
et al. (2001) and Hall et al. (2005)). The citation count corresponds to the number of times the
patent has been cited by other patents in the calendar years of the patent grant and the 3 subsequent
years. Panel B in Table 1.2 compares the citation count for patents file before and after companies
are firs finance by a VC. On average, patents file before the VC investment are cited 9.192 times
in the firs three years after they are granted. In contrast, patents file after the VC investment are
cited 9.158 times over the 3 years after the grant date. This decrease in the citation count is not
statistically significant
We distinguish between self-citations and non-self-citations, which correspond to citations made,
and not made, by the filin company, respectively. Self-citations are traditionally regarded as a
measure of the degree in which companies are able to internalize the profit of their innovations.
As a consequence, the non-self-citation count is considered to be a better measure of patent qual-
ity. Panel B in Table 1.2 reports average self-citation and non-self-citation counts for patents file
in the years around the VC investments (self-cites and non-self-cites, respectively). Self-citations
increase after VC investment and the increase is significan at the 10% level. In contrast, non-self-
citations decrease, although the difference is not statistically significant
Following Lerner et al. (2010), we control for trends in citation rates at the grant-year and
technology-class level using a set of matching patents define as follows. For every patent in the
sample we determine all U.S. patents assigned to the same United States Patents and Trademark
Offic (USPTO) technology-class and with the same grant-year.4
4At present, the USPTO has assigned more than 400 technology-classes, examples of which include Radio WaveAntennas and Wheel Substitutes for Land Vehicles.
7
Using the matching patents, we construct a citation baseline as:
b=Total Cites
Number o f Matching Patents, (1)
where Total Cites corresponds to citations received by matching patents in the calendar years of
the patent grant and the 3 subsequent years. We repeat this procedure for each type of citation
count and construct analogous baselines.
Panel B in Table 1.2 reports scaled measures of patent quality, calculated as the ratio between
each type of citation count and the corresponding citation baseline. Scaled citation counts before
the VC investment are statistically different from one, suggesting that the VC firm are targeting
companies with unusual patenting activity. Post-VC investment there is a slight decrease in the
scaled non-self-citation count and an increase in the scaled self-citation count. However, none of
these changes in scaled citation counts are statistically significant
Distribution of citations across technology-classes and the nature of innovations Following
Hall et al. (2001) we study the nature of patents by looking at the patents’ originality and generality
measures. These measures are based on the distribution across technology-classes of the patents
cited, or of the patents that cite, the innovations in the sample. In detail, the originality measure is
calculated as one minus the Herf ndahl index of the cited patents across technology-classes.5 The
intuition is that patents that combine existing knowledge from few technology-classes to create
something new (and useful) probably constitute more marginal improvements relative to patents
that combine more different ideas ex-ante. The generality measure is calculated analogously to the
originality measure, but using the distribution across technology-classes of the citing patents.
Panels C and D in Table 1.2 compare the originality and generality of patents file before and
5We report results using adjusted measures of originality and generality based on the bias-correction described inJaffe and Trajtenberg (2002).

8
after the VC investment. We also include a measure of scaled originality (generality), calculated
as the ratio between the originality (generality) of the patents in the sample, and the average origi-
nality (generality) of matching patents. Although there is evidence of a slight decrease in both the
originality and generality of patents file after venture funding, these changes are not statistically
significant
1.1.3 Econometric Modeling Strategy
Modeling the rate of innovative activity Consider the firs moment of the relationship between
the rate of innovative activity, as measured by Patentsit , the number of ultimately successful patent
applications of company i in period t, and VC investments, as measured by A f ter VCit , a dummy
denoting observations after the VC investment. The conditional expectation of this measure of
innovation activity is:
E(Patentsit |η i,τ t) = exp(αA f terVCit+η i+ τ t). (2)
We adopt a log-link formulation, because of the count nature of the data. As is well known,
given the same firs moment, alternative estimators can be generated depending on the different
assumptions concerning the error term. Our main analysis uses a Poisson model where the mean
equals the variance. However, since we allow the standard errors to have arbitrary heteroscedasticty
and autocorrelation (i.e., by clustering standard errors at the company level) the exact functional
form of the error distribution is not so important (Aghion et al. (2009)).
The model includes fi ed-effects for each year to control for the time variation in the propensity
to patent. We introduce company fi ed-effects, η i, using the conditional fi ed-effects Poisson
model of Hausman et al. (1984). To address the truncation of the data we subset the sample to VC
investments made until 1999 and report results for this subsample in the tables. While we observe
some successful patent fi ings in the fina years of the sample, many applications that were file

9
during these years were likely still not issued as of December 2008.6 Because the later years in
the sample, where this truncation will be worse, are disproportionately likely to be in the years
after a VC investment, this effect may bias the counts of patent filings In the sub-sample of VC
investments prior to 1999 effects due to not-yet-issued patent applications should be reduced.
We compare the results of this count data model to OLS estimates, i.e.,
ln(Patentsit+1) = αA f terVCit+η i+ τ t+ ε it , (3)
where we use as dependent variable an arbitrary re-scaling in order to avoid dropping all observa-
tions of companies with zero patent filings
Modeling the quality and nature of innovative activity Consider now the firs moment of
the relationship between the quality of innovative activity, as measured by Citeskit , the number of
citations received by patent k file by company i, in period t, (or any other measure of quality or
nature of innovations describe in Section 1.2) and VC investments, as measured by A f ter VCit ,
the dummy denoting observations after the VC investment. The conditional expectation of this
measure of quality of innovative activity is:
E(Citeskit |η i,τ t) = exp(βA f terVCit+η i+ ln(b)), (4)
where b corresponds to the citation baseline explained above. We use the citation baseline as an
offset in the estimation of this model in order to control for changes in citation behavior and the
industry composition of companies over time. By offsetting the citation baseline, we force the
expected value of citations received by patent k to equal the average number of citations received
6The average lag between grant and application years in the sample is of 2.3 years.

10
by similar patents in the same technology-class and granted the same year. Note that b absorbs
all time variation in patent citations at the technology-class and grant-year level, hence, we do
not include time fi ed-effects in the estimation. The estimated coefficien for β reflect the relative
citation intensities of patents granted to companies in our sample compared to the matching patents.
The model introduces company fi ed-effects, η i, to control for the heterogeneity in the qual-
ity and performance of companies that characterizes the VC industry. The methodology follows
closely Lerner et al. (2011), and is similar to the within-company estimators of Seru (2007) and
Bernstein (2012).
Similarly to the analysis of the rate of innovative activity, we compare the results of the count
data models to OLS estimates, i.e.,
ln(Scaled_Citeskit+1) = βA f terVCit+η i+ ε it , (5)
where Scaled_Citeskit corresponds to scale citations.7 The well known disadvantage of these mod-
els is the arbitrary re-scaling needed to avoid dropping all observations of patents with zero-
citations.
Selection Issues The coefficien on A f terVCit in the regression models (2)-(5) may be biased
for many reasons. The main concern is that VCs select companies to invest in on the basis of
characteristics that are observable to them but not to us. For example, VCs might invest in com-
panies when they anticipate a surge in innovation. As an attempt to tackle this issue we exploit an
amendment in the Texas legislature in 1999 that freed public pension funds in Texas to invest in
VC. This clarificatio was prompted by the Board of the Texas Teacher Retirement System (TRS),
7Recall from Section 1.2.2 that scaled citations are define as the ratio between citations and the citiation baseline:Scaled_Citeskit = Citeskit/b.

11
that asked the Attorney General to clarify the definitio of securities as used in Section 67, Article
XVI, of the Texas Constitution. The Attorney General issued the formal public opinion No. JC-
0043, clarifying that the TRS could invest in instruments define as securities under the Uniform
Commercial Code (UCC) definition Following the issuance of this Opinion, the Texas Legislature
amended the Texas Government Code (Section 825.301) to add a definitio of securities which
explicitly includes interests in limited partnerships among others. Consequently, the allocation of
local public pension funds to venture capital increased. In particular, the allocation of TRS to VC
quintupled from 1998 to 2002 (went from 44 million to 233 million). This change in the Texas
Government Code was later reinforced by the adoption of the "prudent investor rule" as the stan-
dard for governance of the asset allocation of state and local pension funds in 2004 (Title 9, Section
117.001 of the Uniform Prudent Investor Act).
The amendment in the Texas legislature should identify the effect of VC on innovative activity,
because it is unlikely to be related to the arrival of innovation opportunities. The main motivation
behind the request for the clarificatio was a desire to eliminate investment uncertainty as advised
by external auditors of the TRS.8 To capture this policy shift empirically one may firs think of
subsetting the sample to companies headquartered in Texas, and using a dummy variable taking on
the value of zero through 1999 and one thereafter. The problem with this simple approach is that
patenting rates in Texas may change over time for a variety of reasons, including changes in the
behavior of companies around the rise and bust of the dot-com. Using this strategy we would not
to be able to disentangle the shift in venture fund raising from that in the propensity to patent.
The Texas amendment, however, should have had a predictably greater impact on innovative
8The Texas State Auditor’s Offic contracted Independent Fiduciary Services (IFS) in 1996 to perform an inde-pendent evaluation of the TRS investment program and practices on behalf of the Legislative Audit Committee. TheIFS report recommended granting TRS authority to invest in a broader range of asset classes than was permitted. Sub-sequently, the Legislature took action to broaden the range of permitted investments (or at least help alleviate doubtsabout the scope of permitted investments), such as the clarificatio regarding admissible securities of 1999. Impor-tantly, the main motivation for these changes was to reduce uncertainty regarding authority to invest as it was seen toimpede the ability of the Board to optimally manage and diversify its portfolio.

12
activity in companies headquartered in Texas, as those likely experienced a greater increase in
the probability of being selected by a VC than companies elsewhere. Public pension funds have
been shown to be locally biased in their PE investments (Hochberg and Rauh (2010)), therefore,
VC firm headquartered in Texas should have experienced a greater increase in funding after the
amendment. In addition, at the time of the amendment the Texas constitution imposed travel limita-
tions for pension funds’ officials which curtailed the ability of pension funds to conduct necessary
due diligence of investments outside the state (see for example: IFS (2002)), and likely biased their
PE investments to local funds. At the same time, VC firm are also home-biased in their portfolio
company investments (e.g., Lerner (1995) and Sorenson and Stuart (2001)). The combination of
these two home-biases suggests that after the 1999 amendment companies headquartered in Texas
should have experienced a greater increase in the probability of being finance by a VC than those
in other states, and thus, a greater bust in patenting.
We implement the instrumental variable approach by restricting the sample to companies head-
quartered in Texas and its neighboring states: New Mexico, Colorado, Oklahoma and Louisiana
(the sample has no companies headquartered in Arkansas), and exploiting the aforementioned
home-biases using a dummy that equals 1 if companies are headquartered in Texas, interacted with
a dummy variable taking on the value of zero through 1999 and one thereafter, as an instrumental
variable. As a robustness check, we also use the fraction of investments across states made by
VC firm headquartered in Texas before the shift, interacted with the 1999 dummy, as an alterna-
tive instrumental variable. The main advantage in using this policy shift as an exogenous shock
to the capital available for VC firms instead of using ERISA as Kortum and Lerner (2000), is
that the Texas constitutional amendment occurred when the VC industry was already established.
The main disadvantage is that by restricting the sample to companies in Texas and its neighboring
states, statistical power decreases.
We implement the instrumental variable estimator using two-stage least squares. In future ver-
sions of this work we may use a control function approach (e.g., Blundell and Powell (2004))

13
suitable for our non-linear count data models.
1.2 Results
1.2.1 The rate of innovative activity increases after VC investment
Table 1.3 contains the firs set of results where we measure the rate of innovative activity using
yearly patent filings The table reports incidence rates. An incidence greater than one corresponds
to a positive coefficien and a positive effect of the characteristic on patent production intensity. In
column 1 the coefficien bigger than one on A f ter VC implies that there is an increase in patenting
activity following VC investment. The interpretation of the coefficien is as follows: after a com-
pany is finance by a VC patent filing increase by 153.5% (e.g., from the mean of 0.37 filing a
year to 0.57). In the second (third) column of Table 1.3 we repeat the analysis restricting the sam-
ple to VC investments after (prior to) 1999. Finally, column 4 restricts the sample to companies
that file at least one patent before, and one patent after, the VC investment. Results are similar
across the different subsamples.
In Panel B of Table 1.3, we divide the period after the VC investment into two: the period
while the VC is an investor in the company, and the period when the VC exits the company.
While we don’t have information on the exact date on which VC firm exit their investments, we
approximate the exit date as one year after the last observed financin round. As expected, the
increase in patent applications is strongest while the VC is an investor in the company, and this
result is robust to using the pre-1999 sample where the potential truncation of the fina years in the
sample is reduced.
Table 1.4 examines the heterogeneity in the effect on patent filing following VC investment,
and exit, across different industries. For industries that tend to use patents to protect Intellectual
Property (IP) such as Biotech and Semiconductors, there is the largest increase in patent applica-

14
tions. Interestingly, Panel B shows how on average, part of the increase in patent filing persists
after the VC exits the investment.
Table 1.5 breaks down results by type of VC exit.9 Interestingly, for all types of VC exit patent
production increases following the VC investment. As expected, however, for companies that go
defunct, patent filing decrease dramatically after the VC leaves the company. This is also true
for companies that get acquired. This last findin is presumably due to the fact that new patent
filing for companies that are acquired are assigned to the buyer. Finally, the increase in patent
applications is particularly pronounced for companies that ultimately go public. This is broadly
consistent with recent finding by Bernstein (2012).
1.2.2 Unconditionally, the quality of innovative activity is not affected
Table 1.6 reports results from the Poisson formulation of patent quality. Panel A in Table 1.6
contains results from pooled regressions. The coefficien of 0.996 in column 1 implies that patents
applied for after the VC investment garner 0.04% less citations than those file before venture
funding (e.g., from the mean of 9.19 citation counts to 9.16). This effect is not economically or
statistically significant The second and third columns replicate the analysis using as dependent
variables: self-citations and non-self-citations, respectively. There is no significan change for
either type of citation count.
Columns 4 through 6 in Panel A of Table 1.6 contain pooled regressions offsetting the different
types of citation baselines in the estimation. The coefficien of 1.016 in column 5 implies that
patents applied for after the VC investment garner 0.016% more citations than those applied for
9For some of the companies that SDC identifie as being involved in an active VC investment by 2009, the lastrecorded deal is very old (observations go back as far as 1979). We suspect that these observations are misclassifieas active investments. We check whether results are sensitive to this potential misclassification Reassuringly, we finthat overall results do not substantially vary whether we defin these investments as active or arbitrarily assume thatthey ended one year after the last recorded deal.

15
before the VC investment, and relative to the citation baseline. Similar to columns 1 through 3, the
estimated coefficien is not economically or statistically significant
Panel B in Table 1.6 compares changes in citation counts while the VC is an investor in the
company and after its approximated exit. Interestingly, patent quality seems to slightly increase
following venture funding but invariably falls after the VC exit. The estimated effects are however,
not statistically significant Finally, Panel C explores the dynamic pattern in venture funding and
citation counts by restricting the sample to observations during which the VC is likely to still be an
investor in the company.10 We estimate Poisson models that use as independent variables indicators
for the individual years of the patent filin relative to the year of the VC investment (event year 0
is the omitted base category with a coefficien normalized to one). Panel C in Table 1.6 shows no
consistent pattern in the citation count for patents file around the VC investment, except for an
apparent slight increase for event year 1, but which dies out in the following event year.
Table 1.7 examines the heterogeneity in the effect on the citation count following VC invest-
ment, and exit, across different industries. After controlling for the citation baseline, there is no
evidence that innovation quality changes and this result is robust across industries.
Finally, Table 1.8 breaks down results by type of VC exit. There is a lot of variation in the
estimated effect by type of VC exit. For companies that ultimately go public the citation count
increases after the VC investment. This increase is also numerically true for companies that get ac-
quired, although the effect is not statistically significant For companies that go public the increase
in innovation quality disappears once the VC exits the company. This result is broadly consistent
with Bernstein (2012). Interestingly, for companies that the SDC classifie as having an exit of
type "Other" patent quality strongly decreases post VC exit. This effect is also true for companies
that go defunct.
10In detail, an observation is only included if the application year of the patent is within one year of the company’slast recorded VC investment.

16
1.2.3 Conditionally on the quality of companies, the quality of innovative activity decreases
Table 1.9 presents results from the Poisson formulation on patent quality that includes company
fi ed-effects to control for the heterogeneity across companies. Interestingly, using this within-
company estimator, the coefficien on A f terVC is strongly significan and negative. The interpre-
tation of the 0.719 coefficien in column 1 is that for a given company, patents file after the VC
investment garner 29% less citations than patents file before the VC investment. The largest pre-
dicted decrease is on self-citations. Columns 4 through 6 repeat the analysis comparing the period
after the VC investment and the period after the VC exit. The citation count is predicted to decrease
both, after the VC investment and after the VC exit, although the decrease is signifi antly larger
after the VC exit. Finally, Columns 7 and 8, present the dynamic pattern in citation counts around
the VC investment. Consistent with VCs selecting companies with unusual patenting activity, the
years before venture funding are associated with more significan patents. In contrast, the years
after the VC investment are associated with consistently less important innovations.
Further, in unreported regressions we break down results by type of VC exit and by industry.
We fin no interesting pattern for the estimated effect in either dimension.
In summary, the within-company estimator predicts a negative effect from venture funding on
innovative quality. This negative effect is robust across all industries, and across all types of VC
exit.
1.2.4 Conditionally on the quality of companies, the novelty of innovative activity decreases
Table 1.10 explores the relation between venture funding and the originality and generality
of patents. Similar to the results for patent quality, we fin that unconditionally, the novelty and
generality of companies’ research output is not significantl affected by venture funding. However,
conditional on company quality, VC has a strong and negative effect on both measures.

17
1.2.5 An attempt at controlling for endogeneity
As discussed above, one interpretation of the finding is that they simply reflec endogenous
VC choices. For example, VCs may invest in companies when they expect a surge of patent
filing following an innovative breakthrough. To test whether the finding are entirely explained
by endogenous VC selection, in this section we consider and instrumental variable (IV) approach
that exploits the policy shift in Texas explained in Section 2.
Table 1.11 reports the results for the IV analysis of the relation between venture funding and
the rate of companies’ innovative activity. The firs column reproduces the basic OLS results of
regression model (3) that uses as dependent variable ln(Patentsit+1). Consistent with our Poisson
regressions, patent filing increase following venture funding. The second column presents the
corresponding reduced form, where we regress ln(Patentsit+1) against the instrument. There is a
positive and significan relation.
In the second panel of column 3 in Table 1.11 we present the firs stage where we regress
A f terVC on the instrument. As expected, the instrument is positive and highly significant The
F-test of the firs stage suggests the instrument is not weak (Stock and Yogo (2005)). The firs
panel of column 3 presents estimates where we use 2SLS to deal with endogeneity. The A f terVC
dummy remains positive. Results are similar if we use as an instrument the fraction of investments
made by VC firm across states interacted with the 1999 dummy as an instrumental variable.
Interestingly, the estimated effect of venture funding on patent filing using the 2SLS approach
is higher than the biased OLS estimate. At face value, this result suggests that we are underestimat-
ing the positive effect of venture funding on the rate of companies’ innovative activity by treating
VC financin as exogenous. As is well known, however, IV estimates are only representative of
the Local Average Treatment Effect (LATE) (i.e., the effect on companies who were finance be-
cause of the policy shift and that would not have been venture funded otherwise) and consequently,
their interpretation is limited. The negative direction of the bias is consistent with the IV results

18
from Kortum and Lerner (2000), and similar to other papers in the literature that use shocks to
the availability of capital to VCs as an instrument for VC investment (e.g., Mollica and Zingales
(2007) and Bernstein et al. (2008))
Because the variation in the instrument is at the regional level, standard errors in Table 1.11
are clustered at the state level. However, since the number of clusters is very small it is possible
that estimated standard errors are biased downwards. In unreported results, we repeat the analysis
clustering standard errors at the company level. Consistent with the presence of small-cluster
bias, we fin that the estimated effect of venture funding on patent filing is no longer statistically
significant
Table 1.12 reports results from the instrumental variable regressions for patent quality. Follow-
ing the same structure as Table 1.12, the firs column reproduces the basic OLS results of regression
model (5) using as dependent variable ln(Scaled_Citeskit+1). Consistent with our Poisson regres-
sions, patents file after venture funding have fewer citation counts. The second column presents
the corresponding reduced form, where we regress ln(Scaled_Citeskit + 1) against the instrument.
There is a negative and significan relation.
In the second panel of column 3 in Table 1.12 we present the firs stage where we regress
A f terVC on the instrument. Again as expected, the instrument is positive and highly significant
The F-test of the firs stage suggests the instrument is not weak (Stock and Yogo (2005)). The firs
panel of column 3 reports of the 2SLS model that deals with endogeneity of VC investments. The
A f terVC dummy remains negative with a coefficien that is much larger in absolute value than the
one in column 1. This result suggests that the negative relation between venture funding and patent
quality is unlikely to only arise from endogenous selection.
Similar to Table 1.11, standard errors in Table 1.12 are clustered at the state level. In unreported
results we check for the presence of small-cluster bias and cluster standard errors at the company
level. Results in Table 1.12 are robust to this alternative type of clustering.

19
1.3 Conclusions
Given the increasing popularity of growth policies that encourage VC activity (e.g., Lerner
(2009)), it is of paramount importance to understand the effect of VC on the innovative activity of
companies. This chapter tries to do so using a sample of US-based startups firs finance by VCs
during 1976 through 2008, and examining the changes after venture funding in the companies’
propensity to patent, as well as in the quality of companies’ innovations.
Contrary to existing research on European-based VC-backed companies, we fin that the scale
of companies’ innovative activity significantl increases after venture funding. Interestingly, we
also fin that the type of innovations produced by companies is affected by the VC investment.
Mainly, VC is associated with a decrease in the quality and novelty of companies’ research output.
To address natural concerns about endogeneity, we exploit a policy shift in Texas that freed public
pension funds to invest in VC. Our results suggest that the association between venture funding and
companies’ rate and quality of innovative activity may not simply arise from endogenous selection.
There are several interpretations of our findings The negative relation between VC and patent
quality is consistent with companies exerting more effort on the development part of R&D, relative
to research, after venture funding. It is likely that during the transition towards commercialization,
the patents file by companies correspond to more marginal inventions. This interpretation is
broadly consistent with Hellmann and Puri (2002), who fin that VC is associated with a signif-
icant reduction in the time to bring a product to market. Also, patent filing can increase after
venture funding if VCs encourage their companies to build up their patent portfolios to better
protect themselves from future patent wars against competitors.
There are many directions this future research could take. One interesting follow-up question is
to explore the mechanisms through which venture funding affects companies’ research output. In
future versions of the work we may pursue this line of research. Finally, one potentially important
omission is the impact of VC financin on patent trade. Patent trade remains a relatively unexplored

20
area of research, and VCs are likely to encourage their companies to strategically manage their
patent portfolios as a short-term source of profits This topic looks like a particularly promising
area of research for future studies.

21
2 Venture Capital and the Diffusion of Knowledge
Does the diffusion of knowledge depend on the environment in which ideas are developed? This
chapter explores this question by examining how the diffusion of an idea is affected by Venture
Capital (VC) financin of the company that patented the idea. Venture Capitalists (VCs) invest
in privately held innovative business. In addition to providing capital, they are generally believed
to contribute value in other ways (e.g., Hellman and Puri (2000) and Hellman and Puri (2002)).
In this chapter, I show that VC financin has a positive, causal effect on the diffusion of patented
knowledge. The empirical evidence points to two mechanisms: VCs facilitate communication
among companies in their portfolios, and more broadly, VC financin appears to certify the value
of innovations to the general public.
I use patent citations to measure knowledge diffusion (e.g., Jaffe (1986), Hall et al. (2001) and
Jaffe and Trajtenberg (2002)). Legislation requires inventors to cite all previous patents that their
inventions build upon. Subject to caveats, discussed below, these citations are an indirect mea-
sure of knowledge linkages between innovations (Hall et al. (2001)). To distinguish the effect of
VC financin on knowledge diffusion from its effect on knowledge production, I study a sample
of patents invented in companies before they are VC financed I compare subsequent increases
in citations to these patents to the citations of comparable patents in the same technology-class
and vintage-year, and not invented in VC-backed companies. The comparison focuses on knowl-
edge diffusion outside company boundaries, and only includes citations from inventors outside the
patenting company. My firs findin is that after VC financin citations to a given patent increase
by 19% relative to the citations of comparable patents.
The firs findin suggests that the diffusion of already existing, disclosed ideas increases with
VC ownership. While this result is interesting, one concern is the endogeneity of VC investments.
For instance, VCs may anticipate which existing innovations will be cited in the future. Alterna-
tively, VC financin may increase awareness of innovations and affect future citations. To isolate

22
the causal effect, I use time-series variation in the assets of state public pension funds as an in-
strumental variable (IV) (Mollica and Zingales (2007)). This IV approach relies on the home-bias
of state pension funds in their VC investments (Hochberg and Rauh (2012)), and on the exclusion
restriction that changes in pension assets are independent of the innovation opportunities facing
the companies. One potential concern with this exclusion restriction is that unobserved economic
activity at the state level may affect both the size of state pension funds and the innovative oppor-
tunities of local companies. Since the analysis compares citations to patents file by VC-backed
companies to those of comparable patents, the exclusion restriction is satisfied as long as the ef-
fect of unobserved economic activity on innovation opportunities within a state is uniform across
local patents in the same technology-class and vintage-year.11 As a robustness check, I relax this
identificatio assumption by eliminating citations directly linked to local innovation opportunities
and only counting citations from inventors in states other than the home-state of the patent. Using
this IV approach, I fin evidence that the effect of VC financin on patent citations is causal.
The second part of this chapter explores some mechanisms driving the effect of VC financin
on patent citations. One potential mechanism behind this effect is that VC financin increases
awareness of companies’ innovations, possibly certifie their value, and spurs follow-on innovation
by other inventors. In addition, VCs may also facilitate communication among companies in their
portfolio, and facilitate diffusion of knowledge in their networks. To test these mechanisms, I
distinguish between two types of citations: those from inventors in companies finance by the same
VC, portfolio-linked, and those from all other unrelated inventors, non-portfolio-linked. Consistent
with the firs mechanism, I fin a causal increase in non-portfolio-linked citations. Consistent with
the second mechanism, I fin that the increase in portfolio-linked citations is four times stronger
than the increase in non-portfolio-linked citations. I also analyze inventor mobility and patent
sales around the financin event as potential channels behind the effect of VC on patent citations.
11For example, it assumes that natural gas shale discoveries affect citations to all Hydraulic Fracture patents file in1995 and developed in California in a similar manner.

23
Inventors may choose to move to other companies after VC financing for example, if the presence
of VC investors implies a transition from creative freedom to a commercial focus (e.g., Aghion
et al. (2008)). This inventor mobility can facilitate knowledge fl ws between inventors’ new and
old employers. Also, companies may sell patents outside their core areas after VC financin and
directly transfer knowledge to buyers. My finding suggest, however, that the effect of VC on
patent citations is not driven by either of these two mechanisms.
The last part of this chapter addresses concerns about the relationship between the dependent
variable in the analyses, patent citations, and what I really want to measure, knowledge diffusion.
For example, patent reviewers are also likely to become aware of a company after it is VC fi
nanced. Since citations from patent reviewers are included in the analysis, citations may increase
when there is no diffusion of knowledge. I test this alternative story using a sub-sample of patents
for which I can distinguish the citations added by patent reviewers and exclude those from the
analysis. Results remain qualitatively similar, which minimizes concerns regarding the interpreta-
tion of patent citations as knowledge fl ws. I consider and test other alternative stories.
This chapter contributes to the literature that relates the diffusion of innovation to the institu-
tional environment in which new technology is developed (e.g., Mokyr (2003), Gans et al. (2010),
Williams (2011) and Gans and Murray (2012)). I extend this literature by focusing on the diffusion
of already patented innovation and showing that conditional on disclosure VC ownership matters
for diffusion.
This chapter also relates to the literature that considers the role of VC on innovation (e.g.,
Kortum and Lerner (2000), Hirukawa and Ueda (2008) and Nanda and Rhodes-Kropf, (2011)). I
offer a new approach to investigate this question by using data at the patent level and by focusing
on knowledge diffusion. A back-of-the-envelope calculation based on the finding suggests that by
facilitating the diffusion of their companies’ patents, VCs have contributed 2% to 10% of patent
production in the U.S. This findin helps explain why researchers using industry-level data estimate
that VCs contribute to 14% of patent production (Kortum and Lerner (2000)) even though less
24
than 4% of patents have been assigned to VC-backed companies.12 I argue that at least part of this
difference can be attributed to knowledge spillovers generated by VCs.
Finally, the chapter also relates to the literature that explores non-financia services VCs pro-
vide to their companies. Previously documented mechanisms include recruiting key managers
(Hellmann and Puri (2002)), implementing strong governance mechanisms (Hochberg (2011)),
and facilitating strategic alliances (Lindsey (2008)). I fin evidence that VCs help diffuse knowl-
edge across companies in their portfolio. Consistent with Hellmann (2002), my finding suggests
that VC portfolios change the complementary assets available to companies. Since patent citations
have been shown to be associated with value (Hall et. al (2005)), this non-financia service of VCs
can have value implications for VC-backed companies.
The rest of this chapter is organized as follows. Section 2.1 explains the data sources used
to construct the sample and presents summary statistics. In Section 2.2, I discuss the empirical
strategy used to identify the effect of VC on knowledge diffusion and present results. Section
2.3 explores the mechanisms behind this effect. Section 2.4 discusses the interpretation of patent
citations as a measure of knowledge fl ws, and considers alternative interpretations. Section 2.5
concludes.
2.1 Data Description and Summary Statistics
The data on VC investments are from SDC’s VentureXpert. Companies headquartered in the
United States (U.S.) and finance by U.S.-based VC firm from 1976 to 2008 are identified Data
on patents comes from the Harvard Business School (HBS) patent database (Lai et al. (2009)),
which has information on U.S. patent assignments from January 1976 through December 2008
based on the records from the U.S. Patent and Trademark Offic (USPTO). I combine the two data
12See Appendix.

25
sources by searching for each of the VC-backed company names among the patent assignees. The
Appendix has a detailed account of the matching procedure and includes summary statistics for
the matched sample.
To distinguish the effect of VC financin on knowledge diffusion from its effect on knowledge
production, this chapter restricts the data to patents file by companies at least two years before
they are f nanced by a VC.13 Since the empirical strategy explores subsequent changes in citations
to these patents, I only consider companies that were finance by VCs between 1977 and 2003.
This restriction makes sure that I observe at least two years of citations before VC f nancing, and
f ve years of citations afterwards. After these restrictions, the analysis sample consists of 2,336
patents file by 752 companies.
Table 2.1 presents summary statistics of the analysis sample and explores its representativeness
of all patents that are assigned to VC-backed companies, and of all companies finance by VCs.
Panel B shows that the analysis sample is slightly more concentrated in Massachusetts, Pennsyl-
vania, and Texas (Panel B). Also, the sample is composed of relatively more mature (Panel C) and
successful (Panel D) companies from industries that rely on patents to protect their Intellectual
Property (IP), such as medical health and semiconductors (Panel E).
Using these patents, I construct a database at the patent-year level where the variable of interest
is the annual number of citations received by patents from the patent’s application year until 2008.
Since the analysis focuses on knowledge diffusion outside company boundaries, I only include
citations from inventors outside the patenting company. Panel G of Table 2.1 shows summary
statistics of annual citations. Consistent with the well-known skewness in patent citation data,
13There are two dates associated to patents that are relevant for this study: the application-year and the grant-year. The application-year corresponds to the year in which inventors fil their patents at the USPTO. The grant yearcorresponds to the year in which the USTPO grants the patent to the inventor. The lag between these two dates ison average 2 years, and is not is not statistically different for patents invented by companies with and without VC-investors. In unreported results I restrict the sample to patents granted at least two years before they are finance by aVC. Results are robust to this change.

26
mean and median annual citations are 0.92 and 0, respectively. Citations are also classifie by state
using data on the geographical location of the citing inventors. Panel G shows summary statistics
of out-of-state citations, which exclude citations from inventors in the home-state of the companies
that file the patents.
2.1.1 Citation baseline
Patent citation rates have been increasing over time and tend to vary according to technology-
class and vintage-year (Hall et al. (2001)). To control for these aggregate trends in citations, and for
patent life-cycle effects in the analysis, I defin a set of comparable patents as follows. For every
patent in my sample I determine all U.S. patents assigned to the same USPTO technology-class,14
with the same application-year,15 and that were not file by a VC-backed company.
Using the comparable patents, I construct an annual citation baseline as:
bt =Total Citest
Number o f Comparable Patents, (6)
where Total Citest corresponds to citations received by comparable patents at time t. Panel G
in Table 2.1 reports summary statistics of the citation baseline. On average, the patents invented
in VC-backed companies receive 0.32 more annual citations than comparable patents. Panel G
in Table 2.1 also reports summary statistics of a citation baseline at the state level, in which the
comparable patents are additionally restricted to have been invented in the home-state of the VC-
14At present, the USPTO has assigned more than 400 technology-classes, examples of which include Radio WaveAntennas and Wheel Substitutes for Land Vehicles.
15In unreported results I use the grant-year as vintage-year, and also, both the application-year and the grant-year,to construct the group of comparable patents. Results remain robust to these alternative definitions Following Hallet al (2001), however, I use application-year to avoid including in the estimation noise from the review process at theUSPTO.
27
backed company that file the corresponding sample patent.
2.1.2 Restricted Sample
I collect information on financia assets held by state and local public pension funds from the
State and Local Government Public-Employee Retirement Systems annual survey. This survey
is conducted by the Census Bureau and is available starting in 1993. The 1993 to 2008 period
is referred to as the restricted sample throughout, and corresponds to the sample used in the IV
analysis of Section 2.2.3.
Table 2.2 reports summary statistics on the restricted sample, which consists of 1,657 patents
file by 517 VC-backed companies. Panel B in Table 2.2. reports the value of the assets held
by local and state public pension funds deflate by the Producer Price Index (PPI) and expressed
in billions of 1982 U.S. dollars. Panels B, C, D, and E show that the restricted sample is fairly
representative of the analysis sample. The main difference is that the restricted sample is slightly
overrepresented in Early Stage and Biotech companies. Finally, Panel G in Table 2.2 reports de-
scriptive statistics for the restricted sample on the main variables in the analysis: annual citations
to patents, the annual citation baseline, and the annual citation baseline at the state level. Com-
pared to the analysis sample, average annual citations to patents increase for the restricted sample,
reflectin the overall increase in citations throughout the period.
2.2 Empirical Analysis
2.2.1 Univariate Tests
Table 2.3 presents preliminary evidence that citations to patents increase after companies are
VC financed On average, patents are cited 0.64 times a year before venture funding. After VC
financing however, average annual citations increase by 63% to 1.04. This percentage increase

28
is summarized by the Ratio of 1.63 reported in Table 2.3. The average annual citation baseline
also increases, which illustrates aggregate citation trends. After controlling for these trends, the
estimated percentage increase in citations decreases from 63% to 33%. This adjusted percentage
increase is summarized by the Ratio of Ratios of 1.33 reported in Table 2.3.
Table 2.3 also shows that even before VC financin annual citations to patents are on average
significantl higher than the citation baseline. This difference does not invalidate the use of the
citation baseline to control for aggregate trends in citations at the technology-class and vintage-
year level. The key assumption is that citation trends, and not necessarily the levels, would be
similar across the patents in my sample and comparable patents in the absence of VC financing I
return to this assumption in the next section.
2.2.2 Poisson Regressions
Citation data are non-negative and discrete, thus, I use a Poisson model, which is the standard
model for count data (Cameron and Trivedi, 1998).16 I estimate the following equation:
E [Citespt |VCpt ,bt ] = exp(α p+ ln(bt)+βVCpt) , (7)
where the expected number of citations received by patent p in year t, Citespt , is an exponential
function of a dummy variable, VCpt , which equals one after VC financing I include a full set of
patent fi ed effects in the estimation, α p, which absorb all time-invariant patent heterogeneity. To
control for aggregate trends in citations, I offset the citation baseline, bt , in the estimation. This
is implemented by including in the Poisson regression the logarithm of bt with a coefficien fi ed
16Another common model for count data is the Negative Binomial model which is a generalization of the Poissonmodel that addresses overdispersion by including an additional error term to capture unobserved factors. In unreportedanalyses I replicate the analsysis using this model. Results hold and are not statistically different across models.

29
to one.17 To understand the intuition behind this approach, note that in equation (7) the expected
number of citations received by patents absent VC financing and ignoring the patent fi ed effects,
equals the citation baseline.
Table 2.4 reports the results from the Poisson analysis where I cluster standard errors at the
company level. All reported coefficient are incidence rates and reflec the proportional increase
of annual citations to an increase in the explanatory variable. An incidence rate greater than one
corresponds to a positive effect of the explanatory variable on annual citations to patents. An inci-
dence rate below one corresponds to a negative effect. Correspondingly, indications of statistical
significanc do not reflec whether the coefficient are different from zero, as is usual, but rather
whether they differ from one.
Column 1 in Table 2.4 reports the results from a pooled Poisson regression of equation (7)
excluding the citation baseline. I estimate the model using maximum likelihood (MLE). The in-
terpretation of the coefficien for VCpt is that annual citations to patents increase 62.7% after VC
financing Note the correspondence between the estimated coefficien and the Ratio reported in
Table 2.3.18
Column 2 in Table 2.4 summarizes the results from a pooled Poisson regression of equation (2)
by MLE. After controlling for aggregate trends, the estimated increase in citations declines. The
interpretation of the coefficien for VCpt in Column 2 is as follows: after VC financing annual
citations to patents increase 34.6% in excess of the citation baseline. Note the correspondence
17The baseline removes any aggregate annual variation. This technique is similar to including time-fi ed effects(cross technology-class and vintage-year) in the estimation.
18The estimated constant in Column 1 of Table 2.4, corresponds to the average annual citations to patents beforeVC financin reported in Table 2.3.

30
between the estimate in Column 2 and the Ratio of Ratios reported in Table 2.3.19
Column 3 in Table 2.4 presents results from the fi ed effects Poisson model. One concern
in using fi ed effects in non-linear models is that estimates may be inconsistent because of the
incidental parameters problem.20 I follow the literature and estimate the model using conditional
quasi-maximum likelihood (QMLE) as developed by Hausman et al. (1984), which eliminates the
patent fi ed effects by conditioning on ∑Citespt (a sufficien statistic of α p).21 The interpretation
of the coefficien for VCpt is that annual citations to the same patent, in excess of the citation
baseline, increase by 18.9% after VC financin of the issuing company.
In unreported results, I repeat the analysis of Table 2.4 excluding California, Massachusetts,
and Texas, and restricting the sample to the pre- and post-dot-com periods. The effect is not
statistically different across sub-samples. I also examine the heterogeneity of the results by patent
age. I fin that the increase is highest for patents younger than f ve years, but the effect is also
positive and signifi ant for patents between f ve and ten years of age. In addition, I explore the
heterogeneity of results by VC skill as measured by the number of prior successful financin
rounds. I fin that more experienced VCs have a greater effect on citations, but this stronger effect
is not statistically significant I distinguish between the extensive and intensive margins. I fin
that conditional on having been cited before VC financing the increase in citations to patents is
19The constant in Column 2 corresponds to the ratio between average annual citations to patents and the averagecitation baseline before VC financin reported in Table 2.3.
20The fi ed-effects Poisson model, however, is one of the few models for which consistency of the MLE holdsdespite the presence of incidental parameters (Cameron and Trivedi (1998)).
21The Poisson model is in the linear exponential family and the coefficien estimates remain consistent as long asthe conditional mean is correctly specifie (Wooldridge (1999)). In the estimation, therefore, I do not assume thatthe mean and the variance are equal, or arbitrary independence across observations. Instead, I compute the variance-covariance matrix using the outer product of the gradient vector and clustering the standard errors at the companylevel.

31
not statistically significant In contrast, for patents with no prior citations, the effect is large and
significant Furthermore, I experiment with different definition of the baseline by excluding from
the set of comparable patents those that are never cited throughout the sample, those that originate
in large companies, universities, and the public sector, 22 and by adding geographical restrictions
using the citation baseline at the state level define in Section 2.1.1. Results are quantitatively
similar across the different versions of the baseline.23 Finally, I also explore the effect of VCs
on the dispersion of citations across technology classes (i.e., the generality measure of Hall et al.
(2001)), and fin no significan effect.
Figure 2.1 explores the dynamics of the effect uncovered in Column 3 of Table 2.4. I estimate
a fi ed effects Poisson model where the independent variables are indicators for individual years
relative to the year of VC financing and restricting observations to two years before, and f ve years
after, the VC financin event (Event-year 0 is omitted from the estimation to avoid multicollinearity
with the patent fi ed-effect). Figure 2.1 plots the estimated coefficient (solid line) together with
their 95% confidenc interval (dashed lines). Before VC financing citations to the same patent in
excess of the baseline are not statistically different from those in the year of VC financing This
pattern is reflecte in the estimated coefficient of the dummy variables indicating event-years pre
VC financing neither is statistically different from one. This result is reassuring, as it shows that
the subsequent increase in citations is not driven by a pre-existing trend in citations. In contrast,
the estimated coefficient of the dummy variables indicating event-years post VC financin are
all larger than one, and significan from event-year 2 onwards. Note that although not significant
the point estimates for the dummy variables indicating event-years pre VC financin are actually
negative, which suggests that the patents in the sample were relatively unknown before the issuing
22I thank Scott Stern for this suggestion.
23In future versions of the paper I may report main results using more restrictive baselines as precision generallyincreases.

32
companies are finance by a VC. This pattern is consistent with the aforementioned results on the
extensive and intensive margins.
One interpretation of the temporal patterns in Figure 2.1 is that since there is no pre-trend, the
increase in citations reflect the causal effect of VC financing Alternatively, VCs may be able
to anticipate which innovations are more likely to be dominant in the future, and the increase in
citations at least partially reflect VCs’ ability to time their investments. Regardless of the inter-
pretation, and given that citations are associated with value (Hall et al. (2005)), the results help
visualize why VCs can command high compensation schemes. Even if the increase in citations
only reflect the skill of VCs in timing their investments, this is interesting from a financia per-
spective, as it means that VCs can cherry pick projects before any other agent in the market. This
ability to pick projects is not easy to imitate, and consequently translates into high returns. From
the point of view of policy, however, it is important to disentangle the two interpretations because
the policy implications are very different.
2.2.3 Addressing endogeneity of VC investments
To isolate the causal effect, I use time series variation in the assets of state public pension
funds as an instrumental variable (IV) (Mollica and Zingales (2007)). This IV approach relies
on the home-bias of state pension funds in their VC investments (Hochberg and Rauh (2012)),
and on the exclusion restriction that changes in pension assets are independent of the innovation
opportunities facing the companies. One concern with this exclusion restriction is that unobserved
economic activity may affect both pension assets and companies’ innovation opportunities. Since
the analysis compares citations to patents file by VC-backed companies to those of comparable
patents, the main identificatio assumption is that the effect of unobserved economic activity on
innovation opportunities within a state is uniform across local patents in the same technology-class
and vintage-year. In this section, I explain the IV approach in detail.

33
Intuition The intuition behind the IV approach is best explained following the same logic as the
local average treatment effect (LATE) of the linear literature (Imbens and Angrist (1994)). Start by
assuming that VCs select which companies to financ based on the unobserved and heterogenous
future popularity of their patents. Every year companies are classifie into three classes: popular,
marginal, and unpopular. Popular (unpopular) companies are those for which the future popularity
of their patents is high (low) and will (will not) be funded irrespective of the availability of capital
for VCs. Marginal companies, with marginal patents of average popularity, are funded only if the
availability of capital for VCs is sufficientl high. For simplicity, assume that every period the
availability of capital for VCs can be either high or low. If there is high availability of capital, VCs
financ their marginal companies, otherwise, marginal companies are not funded. The IV approach
is equivalent to comparing the average outcome (in terms of citations) for marginal patents across
periods of high and low availability of capital for VCs. The figur below illustrates the example.
This example helps clarify common misconceptions of IV. For instance, the estimation strategy
does not assume that given high capital availability VCs randomly pick the companies they finance
Instead, the identificatio strategy relies on two assumptions. First, that the size of state pension
assets is indicative of the local availability of capital for VCs. Second, that the average quality of
companies (and their patents) faced by VCs within a state is comparable across periods of high and

34
low pension assets. In the next sections, I discuss these two assumptions in detail.
State pension assets and local investments by domestic VC firm The validity of the firs
identificatio assumption stems from the home-bias of state pension funds in their VC investments,
and the home-bias of VCs in their financin of portfolio companies. Hochberg and Rauh (2012)
show that public pension funds display a 23 percentage point home-state overweighting in VC
investments. On the home-bias of VC financing there is abundant evidence (e.g., Lerner (1995),
Cumming and Dai, (2013)). To provide additional suggestive evidence, I collect information from
VentureXpert on total value of investments by VC firm (both inside and outside their home-state)
and estimate the following equation:
Investmentst = α+θ s+ γ t+βPensionst−1+ηst , (8)
where Investmentst is the value of investments by VCs headquartered in state s at year t (deflate
by PPI). Pensionst−1 corresponds to the assets of local and state public pension funds in state s,
deflate by the PPI and lagged by one year.24 I include in the estimation state fi ed effects, θ s,
which control for the time-invariant importance of VC investments in states. I also include time
fi ed effects, γ t , which control for aggregate trends.
Table 2.5 summarizes results from estimating equation (8) and clustering standard errors at
the state level. The interpretation of the coefficien in Column 1 is as follows: an increase of $1
billion in state pension assets increases the value of VC investments by $52 million. The second
(third) column uses as the dependent variable the value of investments by VCs in local (non-local)
companies. The interpretation of the coefficien in the second (third) column is as follows: an
increase of $1 billion in state pension assets increases the value of VC investments in local (non-
24The process for VCs of raising a fund and beginning to deploy capital takes about one to two years.

35
local) companies by $36 ($16) million. Columns 4 through 6 replicate the analysis of Columns 1
through 3 restricting the dependent variable to VC financin of new companies. The results are
robust to this restriction. Overall, results in Table 2.5 show that the size of state pension assets
affects the availability of capital for VCs.
Local innovation opportunities and public pension assets The second identificatio assump-
tion is the exclusion restriction and cannot be tested.25 To examine its validity, consider the three
main sources of variation in the size of state pension assets: demographic conditions, pension
policy, and returns to past investments. The fir t two are determined by broader socioeconomic
considerations other than current innovation opportunities and are unlikely to raise any concerns.
Returns to past investments, however, may reflec unobserved economic activity at the state level
that can affect both the size of state pension funds and the innovative opportunities of local compa-
nies. Since for every patent file by a VC-backed company the citation baseline includes citations
to comparable patents not necessarily invented in the same state, changes in innovation opportu-
nities within a VC-backed company’s state may affect disproportionately citations received by the
company’s patents relative to the citation baseline. This disproportional effect could imply that the
average quality of patents faced by VCs, as measured by citations in excess of the baseline, across
periods of high and low pension assets is not comparable. This lack of comparability would raise
concerns regarding the exclusion restriction.
To address this concern, I use the citation baseline at the state level define in Section 2.1.1. The
identificatio assumption is that the effect of unobserved economic activity on innovation opportu-
nities within a state is uniform across local patents in the same technology-class and vintage-year.
As an additional robustness check, I relax this identificatio assumption by eliminating citations
25As suggestive evidence, in unreported regressions I ran a placebo test where I test whether the correlation betweenpension assets and relative citations to patents in the sample is significan for all periods during the life of a patent.Reassuringly, I fin that the correlation is only significan while the VC is an investor in the company.

36
directly linked to local innovation opportunities and only counting citations from inventors in states
other than the home-state of the patent (out-of-state citations).26
Econometric Considerations I now turn to a rigorous econometric treatment of the IV approach.
I start by noting that to estimate the fi ed effects Poisson model using IV one may think to follow
the conventional approach in the linear literature. Regress the endogenous variable VCpt against
the instrument and the patent fi ed effects, and use the predicted value from that regression as a
regressor in the fi ed effects Poisson model instead of VCpt .27 This approach, however, is not
valid because the expected value operator does not pass through non-linear functions. Instead, to
estimate the non-linear IV I follow Wooldridge (1997) and Windmeijer (2000) and use a quasi-
differentiation of the fi ed effects Poisson model, together with the implied exclusion restriction
of the IV, to derive moment conditions, which I estimate using the generalized method of moments
(GMM-IV hereafter).
The main intuition behind this approach is as follows. Recall from Section 2.1 that although
the fi ed effects Poisson model does not suffer from the incidental parameters problem, the fi ed
effects are still eliminated for convenience in the estimation. In this sub-section, I follow the same
principle using an approach similar to the within transformation in the linear literature. The starting
point is the fi ed effects Poisson equation (7). To simplify, let xpt ≡ [ln(bt) VCpt ]′ and B≡ [1 β ],
and consider the following transformation that eliminates α p as suggested by Wooldridge (1997):
Citesptexp [xptB]
− Citespt+1exp[xpt+1B
] = α p(ε pt− ε pt+1
)(9)
26See Table 1 Panel G for summary statistics on out-of-state citations.
27This is an example of the so-called forbidden regressions.

37
Let Pensiont correspond to the assets of local and state public pension funds at year t in the
home-state of the company that file patent p. Combining equation (9) with the exclusion restric-
tion, i.e., E [ε pt |Pensiont , ...,Pension1,bt ,α p] = 1, gives the following moment conditions:
E
[Citespt
exp [xptB]− Citespt+1exp[xpt+1B
] | Pensiont−1,bt]= 0. (10)
Using the moment conditions (10) generally causes computation problems. For example, when
the regressors include dummy variables such that the moment conditions can be made close enough
to zero by choosing arbitrarily large β s. To address this concern, I follow Windmeijer (2002), and
multiply through by exp(µxβ ), where µx = (NT )−1∑∑xpt . This adjustment minimizes the com-
putational problem because the deviated variables (i.e., xpt −µx) will always take on positive and
negative values. The modifie moment conditions I estimate to calculate the GMM-IV estimator
are the following:
E
[Citespt
exp [(xpt−µx)B]− Citespt+1exp[(xpt+1−µx
)B] | Pensiont−1,bt
]= 0. (11)
IV results Table 2.6 presents the basic IV results. I begin by providing the fi ed effects Poisson
estimates using the restricted sample of the GMM-IV approach in Column 1.28 The estimated co-
efficien remains positive and statistically significant The GMM-IV estimator that uses Pensiont−1
to instrument for VCpt is reported in Column 2. A comparison between Columns 1 and 2 reveals
that the estimated effect increases from 17.1% to 49.5% after accounting for non-random timing
of VC investments.
Table 2.6 also reports results using a standard linear IV approach (2SLS). As the dependent
28Recall that the data on state pension assets is only available at the Census starting on 1993. For details, see Section2.1.2.

38
variable, I use scaled citations define as the ratio between citations to patents and the citation
baseline. As shown in Columns 5 and 6, the results are similar across the non-linear and the linear
approaches. The second panel in Column 6 reports results from the first-stage where I regress the
endogenous variable, VCpt , on the instrument and on patent fi ed effects. The F-statistic suggests
that the instrument is unlikely to be weak (Stock and Yogo (2005)).29
Tables 2.7 and 2.8 present the IV approach using the citation baseline at the state level. Table 2.8
summarizes results of the main robustness check where I use out-of-state citations as the dependent
variable to minimize concerns that unobserved economic activity may affect both VC financin
and patent citations. I report standard errors clustered at the company-level as they are more
conservative than those at the state level, which is suggestive of small-cluster bias. Tables 2.7 and
2.8 show that the results continue to hold and are quantitatively similar to the basic IV results in
Table 2.6.3031
As extra robustness checks, Tables 2.6 through 2.8 report results using alternative instruments.
In each of these tables, the third (seventh) column reports estimates using Pensiont−1 normalized
by average state GDP (Pension_Norm) as instrument and using the GMM-IV (2SLS) approach.
Similarly, the fourth (eight) column reports estimates using Pensiont−1 demeaned at the time-
level (∆Pension) as instrument and using the GMM-IV (2SLS) approach. The results from this
29The correlation in-sample between the endogenous variable and the instrument is 0.18 and is statistically significant at the 1% level.
30However, note that the interpretation of the results changes. To illustrate, the coefficien of Column 1 in Table2.8 is interpreted as follows: after companies are finance by a VC, out-state citations to the same patent increase by24.7%, relative to other patents in the same technology-class and vintage-year and issued in the same state.
31Note that the difference in observations from Tables 2.6, 2.7, and 2.8, is due to the fact that by restricting thedependent variable to out-state citations or/and definin relative citations at the state level, there are patents for whichthere is not enough variation for the fi ed-effects Poisson to be estimated. Consequently, comparisons across modelsdo not have a straightforward interpretation.

39
robustness checks are qualitatively similar to the main results.
In additional unreported regressions, I exclude California from the sample and results remain
are qualitatively similar. I also experiment with different versions of the baseline by excluding
from the matching patents the patents that originate in large companies and the patents that are
never cited throughout the sample. I also sharpen identificatio by definin the citation baseline
at the city level.32 Results are quantitatively similar across the different versions of the citation
baseline, and significanc improves in most cases.33 In conclusion, the effect of VC financin on
patent citations is always positive, and significan across most IV specifications
2.2.4 Interpretation of results
An interesting findin that emerges from Tables 2.6 through 2.8 is that the IV estimates always
numerically exceed their basic (Poisson and OLS) counterparts. If one assumes on a priori grounds
that the basic approach leads to upward-biased estimates of the true causal effect of VCs, the even
larger IV estimates present something of a puzzle. This puzzling result is common to all papers in
the VC literature that instrument VC investments using changes in the availability of capital for
VCs (e.g., Kortum and Lerner (2000), Mollica and Zingales (2007), and Bernstein et al. (2010)
for the PE case).34 Does this mean that VCs have no skill in selecting companies and that the
increase in citations corresponds to the average treatment effect (ATE)? Not necessarily, because
32I thank Amit Seru for this suggestion.
33When I defin the citation baseline at the city level, I lose a lot of observations, thus the power in these regressionsis reduced. In future versions of this paper, I may use one of these alternative versions of the baseline as the preferredset of results.
34These results echo the debate in the literature of the returns to schooling, particularly the papers by (Card (1994)and Card (2001)).

40
identificatio using IV is representative only of the marginal patents whose treatment is affected
by the instrument (as illustrated in the figur of Section 2.2.3), and which are not necessarily
representative of the general population of patents. This is the standard argument of LATE in the
linear literature (e.g., Imbens and Angrist (1994)).
One interpretation is that there is underlying heterogeneity in the effect of VC financing and
changes in the capital available for VCs trigger investments on a sub-population of patents whose
diffusion is particularly responsive to VC financing For example, if the abundance of capital
allows VCs to experiment more effectively and shifts the types of startups that they financ towards
those that are riskier and more innovative. To explore this idea, I compare the average novelty of
patents from companies finance across periods of high and low availability of capital for VCs,
as determined by pension assets. A company is define to have been finance in a hot (cold)
market, if pension assets in the home-state of the company during the year of the VC investment
are within the top (bottom) 25% of the sample. As a proxy for novelty, for each patent I construct
the "originality" measure of Hall et al. (2001) as one minus the Herfindah index of the cited patents
across technology-classes.35 The intuition is that patents that combine existing knowledge from
few technology-classes to create something new (and useful) probably constitute more marginal
improvements relative to patents that combine more different ideas ex-ante.
Table 2.9 shows that patents funded in hot markets are on average more original than those
funded in cold markets.36 The difference is statistically significant even after controlling for the
35I use both standard and adjusted originality measures. The latter is based on the bias-correction described in Jaffeand Trajtenberg (2002).
36Graphically, Table 2.9 compares the shaded regions of the rectangles in the Figure of Section 2.2.3 across periodsof high and low pension assets. The exercise of Table 2.9, therefore, provides suggestive descriptive evidence of thecharacteristics of marginal patents. A common misconception is that this findin contradicts the exclusion restriction.This is not the case. Note that the exclusion restriction is not conditional on VC financing and compares the averagequality of patents across periods of high and low pension assets. Graphically it compares the full rectangles, includingboth shaded and un-shaded regions of the rectangles.

41
average originality of matching patents. This suggestive evidence is in line with Hirukawa and
Ueda (2008) and Nanda and Rhodes-Kropf (2011), and suggests that VCs play an additional role on
innovation. Not only do VCs financ the innovation of their portfolio companies and facilitate the
diffusion of knowledge, they also seem to use available capital to experiment, a role that is arguably
needed for the commercialization and diffusion of novel technologies (Nanda and Rhodes-Kropf
(2011)).
As it is common of IV analyses, one issue that remains to extrapolate policy lessons regards the
external validity of the results. To inform policy, however, the ATE may be less relevant than the
average return for the group who will be impacted by a proposed reform (Imbens (2009)). Since
an important part of growth policies seek to stimulate VC financin via shocks to the capital that
is available for VCs (Lerner (2009)), the results are informative for current policy, and suggest
that these type of policies can affect innovation not only by financin the innovative activity of
companies that are venture funded, but also by facilitating the diffusion of ideas in the economy.
2.2.5 Back-of-the-envelope calculation
Subject to caveats regarding the representativeness of the IV results discussed in Section 2.2.4
(i.e., LATE vs ATE), a back-of-the-envelope calculation based on the finding is that 1.6% to
10.24% of extra patent production can be attributed to VCs facilitating the diffusion of their tar-
gets’ patented knowledge. The calculation is as follows. Average annual citations to patents
pre-financin are 0.64. VC financin increases annual citations by roughly 20% (using the ba-
sic Poisson estimate). Assuming a patent life of 20 years, this implies that each VC-backed patent
receives 2.6 extra citations because of increased diffusion caused by VCs.37 On average, patents
37I approximate the life of a patent with 20 years because for utility patents, protection lasts a maximum of 20 yearsafter the application year (provided that renewal fees are paid). However, note that by law patents that have expiredstill need to be cited if they consitute relevant prior art.

42
cite 6.5 other patents as relevant art in their applications. Assuming that every citation contributes
with at least an equal share of the new innovation, and since 4% of patents have been assigned to
VC-backed companies (see the Appendix), this implies that a range of 1.6% to 10.24% of extra
patents in the U.S. can be traced-back to VCs facilitating the diffusion of knowledge.38 This find
ing helps explain why researchers using industry-level data estimate that VCs contribute to 14% of
patent production (Kortum and Lerner (2000)) in spite of the small percentage of patents assigned
to VC-backed companies. The finding in this chapter suggest that part of this difference can be
attributed to knowledge spillovers generated by VCs.
2.3 Disentangling Mechanisms
Having shown that VC financin has a causal effect on patent citations, the second part of this
chapter turns to disentangling some of the mechanisms behind this effect.
2.3.1 Knowledge Diffusion and VC portfolios
One potential mechanism through which VC affects patent citations is by increasing awareness
of companies’ innovations, possibly by certifying patents’ value, and thus spurring follow-on in-
novation by other inventors. A second potential mechanism is that VCs facilitate communication
among companies in their portfolio, thereby increasing knowledge fl ws in their networks. For ex-
ample, VCs often organize summits where managers of their companies informally interact. Also,
by actively participating in their company boards, VCs can detect technological complementarities
across companies in their portfolio, and encourage their portfolio companies to communicate.
To test these two mechanisms, I distinguish between two types of citations:
38The calculation of the bounds is as follows: 4%*2.6=10.24% and 10.24%/6.5=1.6%.

43
1. Portfolio-linked: those from inventors in other companies finance by the same VC.
2. Non-portfolio-linked: Otherwise.
Table 2.10 shows that average annual portfolio-linked citations to patents are 0.002 before VC
financing and increase by 305% after VC financing In contrast, annual non-portfolio-linked cita-
tions are 0.64 before VC financing and increase by 62% afterwards.39 To control for changes in
citation behavior and in the industry composition of companies over time, I use a similar approach
as discussed in Section 2.1.1 and calculate a citation baseline by type of citation. Comparable
patents have no portfolio-linked citations because they are not invented by VC-backed companies.
In order to classify their citations as portfolio-linked, thus, I use information on the VC-backed
company that file the patent in the sample. Table 2.10 shows that after controlling for the ag-
gregate increase in citations using the portfolio-linked (non-portfolio-linked) citation baseline, the
percentage increase post VC financin in portfolio-linked (non portfolio-linked) citations decreases
from 305% (62%) to 47% (33%).
To formally test these mechanisms, I estimate Poisson models where VC financin is allowed
to affect differently each type of citation. I start by estimating the following equation,
CitespCt = exp(α pC+ ln(bCt)+ γCDC+βCDC×VCpt
)ε pCt , (12)
where CitespCt are citations to patent p, of typeC, at time t, whereC ∈ {NP, P}. NP and P stand for
non-portfolio-linked and portfolio-linked, respectively. DC is a dummy that indicates each type of
citation and bCt corresponds to the citation baseline specifi to the type of citationC. By including
bCt in the estimation, I control for aggregate changes in citations at the technology-class, vintage-
39The difference in magnitudes between portfolio- and non portfolio-linked citations reflect the small size of VCportfolios.On average, the companies in my sample join portfolios with 17 other VC-backed companies.

44
year and type of citation level.40 VCpt is a dummy that equals one after the issuing company
is finance by a VC and ε pCt is an i.i.d random variable (with mean equal to 1) that captures
idiosyncratic multiplicative shocks at the patent-type of citation level. I include in the estimation
patent-cross-type-of-citation fi ed effects, α pC, to control for the time invariant propensity of each
patent to received citations of typeC. Finally, to test whether the effect of VC financin on citations
to patents is stronger inside VC portfolios I test whether βP and βNP are different. Panel A of
Table 2.11 summarizes results. Panel B tests whether the βCs are statistically different, using a
chi-squared test.
Column 1 of Table 2.11 reports results from estimating equation (12) using a pooled Poisson
model that excludes the citation baseline. Standard errors at clustered at the patent level. The
interpretation of the coefficien for DNP×VCpt (DP×VCpt) is that non-portfolio-linked citations
to patents increase by 62.0% (305.2%) after VC financing 41 Panel B confirm that the difference
between the estimated coefficient for DP×VCpt and DNP×VCpt is significantl different from
zero. Column 2 of Table 2.11 reports results from estimating (12) using a pooled Poisson model.
As expected, after controlling for aggregate trends the estimated effect decreases compared to
Column 1. Column 3 in Table 2.11 summarizes results from estimating equation (12) including
patent-cross-type of citation fi ed effects, which control for unobserved heterogeneity in patents
and type of citations. The interpretation of the coefficien for DNP×VCpt (DP×VCpt) is that after
VC financin non-portfolio-linked (portfolio-linked) citations to a given patent increase by 21.5%
(178.5%), relative to the citation baseline. Finally, Panel B confirm that the estimated percentage
increase in portfolio-linked citations is statistically larger than in non-portfolio-linked citations.
40This technique is similar to including type of citation cross time fi ed-effects, since it removes any aggregateannual variation by type of citation.
41The coefficient of 0.635 and 0.002 for DNP and DP respectively, represent average portfolio- and non portfolio-linked citations to patents before the VC investment. Note the correspondence of these numbers with the annualaverages reported in Table 2.10.

45
Similar to Section 2.2, in Table 2.12 I address the concern of non-random timing of VC selection
using an IV approach. The firs four columns report coefficien estimates using portfolio-linked
citations as the dependent variable and instrumenting the timing of VC financin using Pensiont−1.
Although the variation of the instrument is at the state level, the standard errors are clustered at the
patent level, because of potential small-cluster bias. The firs four columns show that the effect of
VC financin on portfolio-linked citations reported in Table 2.11 remains positive, but is no longer
significant This lack of significanc is likely driven by the small number of observations used
in these regressions. The last four columns of Table 2.12, report coefficien estimates using non-
portfolio-linked citations as the dependent variable. The positive impact of VC financin on non-
portfolio-linked citations is robust to controlling for non-random selection by VCs. In addition,
the percentage increase in citations is still estimated to be larger for portfolio-linked- citations than
for non-portfolio-linked citations, but the difference is no longer significant
In summary, consistent with VC financin increasing awareness of companies’ innovations,
possibly certifying their value, and spurring follow-on innovation by other inventors, I fin a causal
and strong increase in non-portfolio-linked citations. Consistent with VCs facilitating communi-
cation across companies in their portfolios, I fin that the increase in portfolio-linked citations is
four times stronger than the increase in non-portfolio-linked citations.
Robustness checks and extensions Non-portfolio-linked citations may increase after VC financ
ing without an increase in the general awareness of the innovations. For example, the increase in
citations may be exclusively concentrated among companies in the VC industry. To test this alter-
native hypothesis I exclude from the analysis citations from inventors in VC-backed companies.
The estimated effect of VC financin is still larger than one and statistically significant consistent
with the more general certificatio effect of VC financing
It has been suggested that syndication networks among VC firm matter for performance (Hochberg
et al. (2007)). One natural question is whether they also matter for knowledge diffusion. In unre-

46
ported results, I classify non-portfolio-linked citations as Syndication-linked if the citing company
is backed by at least one VC with whom one of the investors of the cited company has syndi-
cated an investment in the past. Using the fi ed effects Poisson model, I estimate the change in
Syndication-linked citations after VC-financing There is no clear pattern in the estimated effects
across the different specifications
2.3.2 Knowledge Diffusion and Inventor Mobility
Inventors may choose to move to other companies after VC financing For example, if the
presence of VC investors implies a transition from creative freedom to a commercial focus (e.g.,
Aghion et al. (2008)) or if the decision making becomes more centralized with VC arrival (e.g.,
Seru, 2012). This inventor mobility can facilitate knowledge fl ws between inventors’ new and
old employers (e.g., Almeida and Kogut (1999), Kim and Marschke (2005), Agrawal and Singh
(2011), Azoulay et al. (2012)).
To test this mechanism, I analyze inventor mobility around the VC financin event. This analy-
sis is facilitated by the HBS data-set that includes a unique identifie for inventors after a detailed
clean-up and analysis of the original patent records (Lai, D’ Amour and Fleming, 2008). Using this
identifie , I am able to trace individual mobility in my sample using changes in assignees through
time. Overall, I have information on 11,627 inventors that work at VC-backed companies with
patents, and their subsequent inventions in the same company or in other assignees. I distinguish
between two types of citations:
1. Inventor-linked: citations from inventors who assigned a patent to the VC-backed company
before VC-financin
2. Non-inventor-linked: Otherwise
Table 2.13 shows that even after excluding inventor-linked citations from the sample, both port-

47
folio and non-portfolio-linked citations significantl increase after VC financing This type of
comparison is informative but is likely to be biased. One concern is that the propensity of in-
ventors to change jobs is not constant over time. To address this concern and also control for
aggregate trends in citations and patent life-cycle effects, I follow a similar approach to the one in
2.1.1 construct a citation baseline based on average inventor-linked and non-inventor-linked cita-
tions to comparable patents. Column 6 shows that even after controlling for aggregate trends in
inventor mobility and citations, the percentage increase in non-inventor-linked citations after VC
financin is positive and significant In Tables 2.14 and 2.15, I replicate the Poisson analysis from
Section 2.2.2. using non-inventor-linked citations as the dependent variable. As expected from
Table 2.13, the results continue to hold. This is evidence that the bulk of the increase in citations
post VC financin cannot be linked to inventor mobility.
Note that one drawback from measuring mobility using data on patent assignments is that not
all moves are observable. First, I only record movements of inventors; other workers can move and
disseminate knowledge. Second, even if I focus on inventor mobility, the data are still necessarily
incomplete. I can identify the movement of an inventor only if the individual invents in the new
workplace. Some inventors may change jobs and enter executive positions in which they no longer
apply for patents, but still influenc the company’s innovation. The finding imply, thus, that the
effect of VC financin on citations is not fully explained by inventor mobility that is observable in
the data.
2.3.3 Knowledge Diffusion and Patent Sales
Companies may sell patent outside their core areas after VC financin and directly transfer
knowledge to buyers.42 Prior research has shown an association between VC financin and patent
42Also note that patent sales can also be used by VCs to recoup their capital in case of a liquidation.

48
trade. Katila and Shane (2005) fin that patents are more likely to be licensed in industries where
VC financin is prevalent.
To test this mechanism, I collect from the USPTO data on patent reassignments, which acknowl-
edge the transfer of the rights, title, and interest in a patent. A typical assignment is characterized
by a unique identifie , the patent number, the names of the buyer (i.e., assignee) and the seller, and
the date in which the private agreement between the two parties was signed. After standardizing
assignee names, I exclude all records for which the buyer matches the primary assignee of the
patent. I also exclude records of administrative events such as a name change.
I combine the clean reassignment data to my sample using patent numbers. Panel A in Table
2.16 reports summary statistics. Of the 2,336 patents in the sample, 375 are sold by their primary
assignees. The small number of matches reflect the size of the patent market, only 13.5% of
granted patents in the U.S. are ever sold during their life-cycle (Serrano (2010)). Panel B shows
that there is an increase in the probability that a patent is sold after VC financing The result holds
even after controlling for the likelihood that similar patents are sold. Figure 2.2 illustrates the sharp
increase in the probability of a patent sale (solid line), relative to average sales (dashed line), after
VC financing
To test whether patent sales explain the effect of VC financin on citations, I split the sample
of patents into two groups: those that are sold and those that are not sold by 2012. Panel C of
Table 2.16 shows that citations increase post financin for both groups of patents. Thus, although
there is an increase in the likelihood that patents are traded after companies are VC financed the
subsequent increase in citations cannot be traced to this effect.
One drawback from the reassignment data is that it is not exhaustive of all forms in which a
company’s IP can be traded (e.g., licenses). My f ndings thus imply that the effect of VC financin
on citations is not fully explained by patent trade that is observable in the data.

49
2.3.4 Discussion
Overall, this section points to two mechanisms. First, VC financin increases awareness of inno-
vations, possibly certifie their value, and spurs follow-on innovation by other inventors. There is
a causal increase in citations from inventors outside VC portfolios, which cannot be entirely traced
back to inventor mobility or to patent sales. This increase in the general awareness of innovations
can take several forms. VC financin may act as a certificatio of the quality of innovations or
provide the necessary resources for companies to bring their products to market and increase their
exposure. Disentangling between these channels is outside the scope of this chapter. As suggestive
evidence of increased awareness of companies after VC financing I took the names of companies
finance by VCs in 2006 as reported in VentureXpert and downloaded from Google Insights nor-
malized43 weekly hits for these names in Google from 2004 until 2011.44 I standardized names by
stripping them of punctuation, capitalization, and common acronyms. Consistent with increased
exposure post VC financing Figure 3 shows an increase in the number of hits after 2006 for the
names of the portfolio companies (solid line) relative to the word "Gold" (dashed-line).
Second, VCs facilitate communication among companies in their portfolios. This effect cannot
be entirely traced back to inventor turnover among companies finance by the same VC. One po-
tential channel behind this finding is that VCs encourage their companies to participate in research
alliances (Lindsey (2008)), which are known to promote knowledge fl ws (Gomes-Casseres et al.
(2006)). Another possibility is that VCs recycle executives across the companies in their portfolio,
and knowledge is diffused with top management. Disentangling between these channels is outside
the scope of this chapter.
43Weekly searches are divided by the maximum number of searches in the entire period and multiplied by 100.
44Data on Google Insights is only available starting on 2004.

50
2.4 Knowledge Diffusion and Patent Citations
While the analysis so far suggests a strong relationship between VC financin and patent cita-
tions, one concern remains. The increase in citations may be due to of a shift in the propensity
to cite patents issued by VC-backed companies that is not associated with knowledge fl ws. For
example, patent reviewers may also become aware of a company after it is VC financed Since ci-
tations from patent reviewers are included in the analysis, citations may increase when there is no
diffusion of knowledge. I test this alternative story using the sub-sample of patents file on 2001
for which I can distinguish the citations added by patent reviewers and exclude those from the
analysis. Unreported results remain qualitatively similar (although power is significantl reduced).
Another nuanced view is that potential targets may strategically cite patents issued by VC-
backed companies in order to attract VC finance To address this concern, I use investments by
VCs in public companies as an informal test. Since companies that are public are subject to close
monitoring and information disclosures, one should expect no extra boost on diffusion from VC
financing unless citations are used strategically by potential targets. In unreported results, I fin
that the coefficien estimate of VCpt is close to one and is not statistically significant
A fina alternative story is that the increase in citations is due to "litigation fear." Inventors may
decide to cite the patents of a company only after the company is VC financed because the threat
of litigation before VC financin is weak. This concern is however minimized to the extent that
citations represent no protection against patent infringement law suits.45 In other words, inventors
may choose not to infringe patents once the inventing companies are VC financed but the VC
financin event should have little effect on their citation behavior.
45For more on this topic see the Supreme Court Ruling of Microsoft Corp. versus I4I Limited Partnership.

51
2.5 Conclusion
This chapter investigates how the diffusion of an idea is affected by VC financin of the com-
pany that patented the idea. I fin a strong and causal effect on diffusion as measured by patent
citations. The empirical evidence points to two mechanisms. First, VCs increase awareness of
innovations, possibly by certifying their value to the general public, and influenc the direction
of aggregate innovative activity. Second, VCs provide a platform for interaction that facilitates
communication across portfolio companies.
The main identificatio challenge in estimating the effect of VC financin on the diffusion of ex-
isting knowledge is the endogeneity of VC investments. I address this challenge using time series
variation in the size of public pension assets as an instrumental variable. The validity of this ap-
proach relies on the home-bias of state pension funds in their VC investments (Hochberg and Rauh
(2012)), and on the exclusion restriction that changes in pension assets are independent of com-
panies’ innovation opportunities. To address concerns that unobserved economic activity affects
both the size of state pension assets and companies’ innovation opportunities, I compare citations
to patents file by VC-backed companies to those of comparable patents. The exclusion restriction
is satisfied thus, as long as the effect of unobserved economic activity on innovation opportunities
within a state is uniform across local patents in the same technology-class and vintage-year.
This chapter contributes to our understanding of how financia intermediaries affect innovation.
I fin evidence that VCs have a multiplier effect on innovation that goes above and beyond financ
ing the innovation of their targets. This result is informative for policy makers that seek to spur
innovation by stimulating VC activity. My finding suggest that VC financin increases diffusion
of ideas both inside and outside the VC industry, which implies that venture funding not only re-
wards VC-backed companies, but also creates benefit that are shared by society at large and can
have important distributional consequences. However, this feedback from financ to the creation
of scientifi knowledge does not necessarily imply that all innovation should be finance through

52
VCs. By focusing exclusively on research with high short-term rewards more basic research may
be sacrificed which can be costly for innovation in the long-run. Assessing the general equilibrium
effects of the role of VCs on innovation is a fruitful avenue for future research.
Finally, my findin that VC portfolios are conduits for information fl ws also deserves more
attention. I show that the stronger increase in citations inside VC portfolios cannot be explained by
inventor turnover among companies that share a common VC. However, it is possible that the mo-
bility of other personnel can explain this concentration of knowledge fl ws inside VC portfolios.
There is plenty of informal evidence that VCs recycle executives across portfolio companies. Ex-
ploring whether this evidence is systematic, and whether it is associated with knowledge spillovers,
are other avenues for future research.

53
3 Direction of Inventive Activity in Venture Capital Networks
A central characteristic of the Venture Capital (VC) industry is its network-based structure. In
contrast to more traditional financia intermediaries, VC investors facilitate relationships among
the companies they finance For example, VC investors establish links inside their portfolios by
participating in their companies’ boards. In addition, VCs tend to syndicate their investments rather
than invest alone (Lerner (1994)). Syndicated investments further web VC-backed companies into
networks of complex relationships with each other.
While the literature has shown that the links among VC-backed companies matter for perfor-
mance (e.g., Lindsey (2008), Hochberg et. al (2007)), their effect on the strategic behavior of
companies remains understudied. In this chapter, I seek to partially fil this gap by examining how
the links among VC-backed companies affect the direction of companies’ innovative activity. The-
oretically, this effect is not clear. Whereas the presence of common investors can stir companies’
research in the same direction by facilitating knowledge spillovers, competition for VCs’ financia
resources may undermine the incentives of companies to collaborate, or even work in similar areas.
To examine this question empirically, I use patent citations to measure the similarity or con-
vergence between the innovative activity of filin companies. The empirical strategy uses data on
patents file by VC-backed companies in the US, and estimates the likelihood of a citation be-
tween random pairs of patents. The main explanatory variables are measures of "VC-proximity"
as determined by whether the companies that file the patents share a common VC investor, and
thus have a "portfolio-link" (e.g., Microsoft and Sun in Figure 3.1), or whether their VC investors
are syndication partners and have thus a "syndication-link" (e.g., Microsoft and Resonate in Figure
3.1). My firs findin is that VC proximity increases the likelihood of a citation between patents.
One interpretation of the firs findin is that VC proximity induces companies to pursue similar
innovations, for instance, by facilitating the transfer of tacit knowledge among companies. An
alternative interpretation is that VCs fund companies that fi well in a strategic sense with the

54
rest of the portfolio, and that the estimated effect reflect this strategic selection. In an attempt
to disentangle between these two interpretations, I do two things. First, I control in the regression
models for geographical- and technological- proximity among filin companies that can affect both
the likelihood of a citation, and their VC-proximity.
Second, since these controls cannot address selection on companies’ unobservables, I exploit
"indirect" linkages across VC-backed companies.46 Indirect linkages occur when companies end
up connected inside the VC network not because they are finance by the same VC or because
their VCs syndicate together, but because their VCs have a common syndication partner (e.g.,
companies Microsoft and PortalPlayer in Figure 3.1). If indirect linkages occur due to factors that
are unrelated to companies’ potential fit the estimated impact of indirect links on the likelihood
of a citation provides an unbiased instrumental variable estimate of the impact of VC-proximity
on the convergence in the innovative activity of companies. As with any exclusion restriction,
this assumption cannot be tested. However, it is likely to be satisf ed, as prior research shows
that syndication allows VC investors to explore distinct industries and geographies, and invest in
companies with lower ex-ante synergy potential with incumbent companies in VC networks (e.g.,
Kogut et al. (2007), Hochberg et al. (2011)). I fin that VC-proximity as measured by either,
portfolio-, syndication- or indirect-linkages, increases the likelihood of a citation between patents,
even after controlling for observable similarities between filin companies. Also, the estimated
effect of VC-proximity is statistically the same when measured by portfolio-, syndication-, or
indirect- linkages. This last result suggests that the VC-proximity effect may not be entirely driven
by selection.
Next, I delve deeper into the relation between competition for financia resources and the con-
vergence of innovative activity among VC-backed companies. While it is true that companies that
share a common VC are in competition for the firm s financia resources, such competition is, how-
46This methodology is similar to Khwaja et al. (2011)

55
ever, likely to be stronger between pairs of companies in the same technological areas or that are in
the same geography. To test whether the competition effect is muffle in the basic estimations, I ex-
plore the relation between the interaction of VC-proximity with technological- and geographical-
proximity, and the citation likelihood. Interestingly, I fin that portfolio- and syndication-links in-
crease the citation likelihood between patents whose filin companies are technologically dissimi-
lar and geographically distant. In contrast, for patents whose filin companies are technologically
or geographically close, sharing a portfolio- or a syndication-link decreases the probability of a
citation. In other words, portfolio- and syndication-linkages appear to be substitutes for techno-
logical and geographical-proximity.
Finally, I examine potential mechanisms through which VC-proximity affects the likelihood of
citations. My finding suggest that the effect is driven by turnover of executives (CEOs, Vice-
president etc.) among close VC-backed companies. This result is consistent with Hellmann and
Puri (2002), which show that VCs help companies hire personnel for executive positions. These re-
sults are also consistent with VC-proximity facilitating convergence of innovation between compa-
nies that are technologically distant. Executive skills are more easily transferred across companies
in different technological fields in contrast to inventor skills which are likely to be technology-
specific
Overall, the finding suggest that the optimal behavior of companies who are competing for the
same financia resources is to differentiate, and focus on distinct lines of research. VC-proximity
deters convergence of innovative activity for similar companies, and induces companies to seek
different areas of specialization. This divergence in the direction of innovation is also convenient
for VCs, as it reduces their overall technology-specifi risk. In contrast, for companies who are
not in direct competition for VCs’ financia resources, such as companies that have an indirect-link
or such as companies that share a portfolio-link but that work in different technology areas, VC-
proximity provides a platform of interaction that facilitates the diffusion of tacit knowledge and
generates interdisciplinary knowledge spillovers. For non competing companies, VC-proximity

56
acts as a bridge for knowledge diffusion, and pushes companies towards working in similar or
complementary lines of research.
The contribution to the literature is three-fold. First, this chapter contributes to the literature on
competition and innovation. I show that the competition for financia resources affects innovative
activity. In contrast, most of the existing studies in this area focus on the impact of product market
competition on innovation (e.g., Aghion et al. (2001), Aghion et al. (2005), Dixit and Stiglitz
(1977)).
Second, this chapter also relates to the literature on intercompany governance and innovation
(e.g., Seru (2007), Schoar (2002), Belenzon and Berkovitz (2010), Belenzon et al. (2010)). While
most of this literature has focused on the interaction among companies within conglomerates and
business groups, I show that the interaction among companies within VC portfolios also affects
innovation.
Finally, this chapter is also related to the literature on the non financia effects of VCs on their
investments. Prior research has shown that VCs add value to their companies by helping them fin
and hire adequate personnel in their own networks (Hellmann and Puri (2002)). I fin that this
executive turnover inside VC networks is a mechanism for knowledge diffusion. More broadly,
this findin is also consistent with other papers in the innovation literature that fin evidence of
knowledge diffusion across companies through worker turnover (e.g., Kim and Marschke (2005),
Agrawal and Singh (2011) and Stoyanov and Zubanov (2012)).
The rest of this chapter is organized as follows. Section 3.1 describes the data. Section 3.2
explains the empirical approach and presents results. Section 3.3 concludes.

57
3.1 Data
I consider patents file by VC-backed companies between 1976 and 1998, and collect data
on all citations received by these patents during a 10-year window since their application year.47
Because the interest is in the convergence of innovative activity among VC-backed companies,
both within-company citations and citations from assignees that are not VC-backed are excluded
from the sample.
In order to estimate the likelihood of a citation between random pairs of patents file by VC-
backed companies in the US, ideally, one would complement the sample of realized citations with
a comprehensive list of all feasible citation dyads among patents file by VC-backed companies.
However, using a comprehensive sample poses a practical problem. To illustrate consider the
following simple calculation. The number of patents fi ed by VC-backed companies in 2002 was
10,583. The total number of possible citations made by these patents to all other patents file by
VC-backed companies is 862,863,739. Using a sample of that size would be computationally too
taxing. In addition, it is also not practical. To see why, note that in reality only 11,519 of the
862,863,739 potential citations actually materialized, implying that a citation is a rare event in my
setting. An estimation methodology that addresses this characteristic of the dependent variable
reduces the variance of maximum-likelihood estimators (Greene (2003)).
Following this intuition, in this chapter I use the approach of Singh and Marx (2013), and imple-
ment choice-based sampling to construct a control sample of potential (but unrealized) citations.
The choice-based sampling method consists of taking a fraction of the dyads with unrealized cita-
tions that is much smaller to the fraction taken of the dyads with realized citations, but that matches
the former sample on a number of characteristics. For estimation, I use the weighted-exogenous-
sampling maximum-likelihood (WESML) estimator of Manski and Lerman (1977). In order for
47A detailed explanation of the construction of the sample of patents file by VC-backed companies can be foundin the Appendix.

58
the choice-based sample to simulate a random exogenous sample, the weight of each observation
corresponds to the number of elements it represents from the overall population.
In detail, I start the sampling by matching each citing patent of the realized citations to a random
control patent with the same three-digit technology-class and application-year. I make sure the
control citing patent is file by a VC-backed company that is different from the company that file
the cited patent. I then extend the sample to ensure representation of potentially citing patents
belonging to years and/or technology-classes not represented in the original patent citations (and
hence in the resulting matched sample). For every cited patent I include an additional observation
corresponding to each potential citing year by randomly selecting one potentially citing patent for
each year after the application year, and belonging to one of the technology-classes from which no
actual citations were received by the cited patent (in that year).
The above steps lead to the fina sample of 344,573 patent pairs, which includes 102,098 actual
citations, 102,098 matched pairs and 143,791 additional pairs from citing classes and years not
represented in the matched sample. The appropriate weight for each observation is computed using
the implied sampling rates for random draws from the relevant subpopulations. The following
example illustrates the procedure.
3.1.1 Example of weights
One of the cited patents in my sample is patent 5968136. This patent is classifie under the
primary technology-class 713, and was file by Sun Microsystems on 1997. Patent 5968136 was
cited by patent 7356705, which Imprivata file on 2002 and was also classifie under the primary
technology-class 713. Patent pair (5968136, 7356705), is an observation in the dataset with a
weight of one. To construct a matched control pair observation, citing patent 7356705 was matched
to control patent 7043649 file by PortalPlayer in 2002 and classifie under technology-class 713.
In order to calculate the weight for this observation I construct the size of the actual pool of patents

59
from which patent 7043649 was randomly selected. The calculation is as follows: in year 2002
there were a total of 156 patents classifie in technology-class 713, from which I excluded 25
patents file by Sun Microsystems and patent 7356705. Hence, the number of patents from which
patent 7043694 was chosen at random is 130. Patent pair (5968136, 7043649) is therefore included
as control pair observation in the dataset with a weight of 130.
Finally, for each of the years between 1997 and 2007, I select a random potentially citing patent
file by a company that is not Sun Microsystems and constrained not to be from technology-
class 713 for the year 2002. For example, for year 2002 I pick patent 6903052 classifie under
technology-class 504 and file by Divergence. The total number of patents file by VC-backed
companies in 2002 that were not issued in technology-class 713 is 10,427. The total number of
patents applied for in 2002 by Sun that were not issued in technology-class 713 are 957. Hence,
the observation (5968136, 6903052) is included in the sample with a weight of 9,470. The range of
weights for these 11 observations are between 640 and 9,682, depending on the number of eligible
patents in the citing year being considered.
3.1.2 Sample Composition
Table 3.1 shows the composition of the fina sample both in terms of patents and companies.
Panel A breaks down the sample by application year of the cited and citing patents. The distribution
of application year for the cited patents reflect the construction of the sample. Panel A also breaks
down the sample by year in which the companies that file the cited and citing patents were firs
finance by a VC. The distribution of these dates follows the investment cycles in the VC industry.
Panel B breaks down the sample by state of the cited and the citing patents. As expected given
the importance of Silicon Valley, the state with the largest fraction of cited and citing patents is
California. California is followed by Texas, Massachusetts and Washington.
Finally, Panel C breaks the sample down by technology-classes using the 1-digit technology

60
classificatio of Hall et al. (2001). The most common technology-class of the cited patents is
Computers and Communications. This technology-class is followed by Drugs and Medical, Elec-
trical and Electronic, Chemical, Mechanical and Others.
3.2 Empirical Approach
I estimate the likelihood of a citation between random pairs of patents using a logit model. As
explanatory variables I consider three measures of proximity between pairs of companies: VC,
technological and geographical. This section explains in detail the construction of these measures.
3.2.1 VC-proximity
The VC-proximity between two companies is define as the minimum number of intermediate
VCs between them. This is analogous to measuring degrees of separation and is a common metric
used in network theory. For instance, If two companies share a common VC their VC distance is
0. I assume that an observed syndication marks the beginning of a tie between the VC firms which
persists beyond the recorded syndication date. This assumption is also used by other papers that
study the syndication network of VCs (Sorenson and Stuart (2001) and Hochberg et al. (2007)). In
inferring network ties that exist as of any year t (t being between 1976 and 2008), I include all VCs
that invest in VC-backed companies that patent, and their investments in these companies between
1976 and t (including those VCs and companies not associated with the VC-backed companies
used for analyzing knowledge fl ws in this chapter).
I consider three types of links between companies based on their VC proximity. Two companies
are define to have a portfolio-link at t if their VC distance is 0. Similarly, if two companies have
a VC distance of 1, that is, they do not share a common VC, but their two VCs have syndicated a
common investment, the pair of companies is define to have a syndication-link at t. Finally, two

61
companies are define to have an indirect-link at t if their VC distance is 2, that is, they do not
share a common VC, their VCs have not syndicated an investment in the past, but their VCs share
a common VC syndication partner.
The example illustrated in Figure 1 helps clarify these definitions Microsoft Corporation was
VC-backed in 1981 by Technology Venture Investors. Later, in 1982, Technology Venture In-
vestors invested in Sun Microsystems. In the data base, thus, Microsoft and Sun have a portfolio-
link starting in 1982.
Technology Venture Investors was not the only VC fir to invest in Sun. In total, f ve different
VCs invested in Sun Microsystems before it went public, including Kleiner, Perkins, Caufiel and
Byers from 1982 to 1984. The company PortalPlayer received money from three different VC
investors, none of which invested in Sun, hence, PortalPlayer and Sun do not have a portfolio-
link. One of the investors in PortalPlayer was Flatiron Partners in 2000. Flatiron Partners and
Kleiner, Perkins, Caufiel and Byers syndicated and investment in Resonate Inc. during 1997.
Hence, since Flatiron Partners, the investor in PortalPlayer, and Kleiner, Perkins, Caufiel and
Byers, the investor in Sun, share a syndicated investment, in the data, Sun and PortalPlayer have a
syndication-link starting in 2000.
Finally, because Microsoft and PortalPlayer do not share a common VC, and their VCs didn’t
syndicate any investment they have no portfolio- or syndication-link. However, since their VCs
have a common syndication partner, in the database they have an indirect-link starting in 2000.
3.2.2 Technological-Proximity
The position of a company in technology space is provided by its share of patents in each
USPTO technology-class These shares defin a vector of technological position Tit = (ti1t , ..., tiKt)
for each company i, where tikt corresponds to the number of patents file by company i in technology-
class k until year t. Following Jaffe (1986), the technological-proximity between the pair of compa-

62
nies i and j at year t is calculated as the uncentered correlation between the companies’ respective
vectors of technological position:
Tech_proxi jt =
K
∑k=1
tiktt jkt√K
∑k=1
t2iktK
∑k=1
t2jkt
.
The technological-proximity measure, Tech_prox, ranges between zero and one depending on
the degree of technological overlap of the research output between companies.
An example can clarify the construction of this measure of technological-proximity. Sun Mi-
crosystems file 5,592 patents between 1982 and 2002 across 99 different 3-digit technology-
classes. The squared sum of Sun’s patents equals 1,532,256. On the other hand, PortalPlayer file
9 patents between 2001 and 2002 across 8 different technology-classes. The squared sum of Por-
talPlayer’s patents equals 11. For all the technology-classes in which PortalPlayer file patents,
Sun had file patents as well. The distribution of patent production across common technology-
classes is shown in the table below.
Technology-class tSunkt tPortalPlayerkt tSunkttPortalPlayerkt
341 16 1 16
369 2 1 2
380 27 1 27
708 146 1 146
710 229 1 229
712 237 1 237
713 180 2 180
718 116 1 116K
∑k=1
tSunkttPortalPlayerkt 1,133

63
Given that 1,133√1,532,256∗
√11= 0.276, the technological proximity between Sun and PortalPlayer
in 2002 is therefore 0.276.
One drawback of the Jaffe (1986) technological-proximity metric is that it is sensitive to the
level of aggregation of technology In particular, the 3-digit technology classificatio used by the
USPTO may be too narrowly define to adequately capture the closeness between companies. To
address this concern as an alternative measure of closeness I use the 2-digit technology classifica
tion suggested by Hall et al. (2001).
3.2.3 Geographical Distance
The calculation of the geographical distance relies upon the HBS dataset. The data by Lai et
al. (2009) include inventors’ city, state and country of residence. In addition, the authors mapped
cities where inventors live to latitudes and longitudes. Using these coordinates, I estimate the
geographical distance between two patents using information on the coordinates of the patents’
inventors and the Haversine formula to calculate the great-circle distance between two points-
that is, the shortest distance over the earth’s surface. One natural drawback from this measure
of geographical distance is that the city in which inventors live may not coincide with the city in
which the work was done. Since the USPTO data has no information on the cities of the assignees
this is the best available proxy for an invention’s geographical origin.
3.2.4 Summary Statistics
Summary statistics of the key variables used in the analysis are presented in Table 3.2. Of the
pairs in the sample, 17.8%, 49.7% and 16.6%, have a portfolio-, syndication- and indirect-link,
respectively. For 23% of the pairs, the cited and citing patents have the same 3-digit technology-
class. The fraction of pairs for which the cited and citing patents were invented in the same state
is 38.9%. The average distance between the cited and citing patents is 2,183 kilometers, and the

64
average technological-proximity is 0.33.
3.2.5 Regression Model
I estimate the likelihood of a citation between random pairs of patents using a logit model. In
detail, I estimate the following citation function Pr(i, j), that specifie the probability that a patent
i cites patent j as
Pr(i, j) = Λ
α ′X+ γ1Same_state+ γ2Same_class
δ 1Geo_dist+δ 2Tech_prox.+
β 1Port f olio+β 2Syndication+β 3Indirect
, (13)
where Same_state is a dummy that equals one if both patents have been invented in the same
state and Same_class is a dummy that equals one if both patents are classifie in the same 3-digit
technology-class. These dummies control for geographical and technological clustering in patent
citations (Hall et. al (2001)). Geo_dist and Tech_prox correspond to the geographical distance and
technological-proximity between the company that invented patent i and the company that invented
patent j. Port f olio, Syndication and Indirect are all dummies that equal one if the company that
invented patent i and the company that invented patent j have a portfolio-, syndication- or indirect-
link, respectively.
X is a vector that includes various controls. A full set of indicator variables for the years
elapsed between the cited and citing patents in a pair are included to control for citation lag non-
parametrically. A separate set of indicator variables for application years of the cited patents are
also included. Similarly to Singh (2005) and Singh and Marx (2013), relying upon longitudinal
variation, I am able to separately identify cohort effects and citation lag effects in a way that
previous studies with more restrictive samples (e.g., Thompson (2006)) were not able to.
To control for the heterogeneity in citation likelihood by technology-class, I include indicators

65
for the cited patent’s 3-digit USPTO technology-class. Similarly, to account for the possibility
of higher citation rates in certain states, a complete set of dummy variables for the state of the
cited patent are included. Also, I include as a control the likelihood of a citation (scaled by 100)
between random patents from the population of patents (using data on all patents including those
file outside the VC industry) with the same 3-digit primary technology-classes of the cited and
citing patents in the pair.
Finally, the probability a patent of a VC-backed company is cited may depend on a variety of
characteristics of the VC such as, its skill, the size of its network, and its popularity. To capture
these effects in a fl xible way, I introduce a complete set of VC-fir fi ed effects for the lead VC
of the company that invented the cited patent. Following Gompers (1996), the lead VC fir is
taken to be the one who has invested in the company the longest. Using this definition a lead VC
fir cannot be uniquely determined in some cases, for these, I randomly pick one of the VC firm
in the syndicate as lead investor.
Estimation I estimate the logit using WESML. Since the sampling is made on the cited patent,
I control for common cited patent effects by clustering standard errors at the cited patent level.
As a robustness check, I also report standard errors double-clustered at the citing-company and
cited-company level, following Cameron et al. (2006). These latter standard errors are reported
in squared brackets. Finally, note that the interpretation of the WESML regression estimates is
as percentage effects on citation likelihood. To see this note that in a standard logistic model,
the marginal effect for a variable i is α i Λ′(.) (α i Λ(.) ∗ [1−Λ(.)]). In general, this expression
would need to be calculated either based on the mean predicted probability or using the sample
mean for Λ(.). However, the fact that citations are rare events allows further simplification since
Λ(.) is much smaller than 1, Λ(.) ∗ [1−Λ(.)] is practically equivalent to α i Λ(.) (Singh, 2005).
This simplificatio means that the coefficien estimate for α i can be directly interpreted as the
percentage change in citation probability with a unit change in variable i.

66
3.2.6 Non-Parametric Evidence
Table 3.3 compares the incidence of portfolio-, syndication- and indirect-links in actual citations
and control pairs.48 Panel A shows that the incidence of portfolio and indirect links is statistically
greater for actual citations relative to the control pairs. Panel B breaks down the comparison by
quartiles of the technological distance between the cited and citing patents. The incidence of
portfolio-links is concentrated in those observations where the technological-proximity of the fil
ing companies is less than the median. Consistent with the competition for financia resources
affecting the direction of innovative activity of companies, the preliminary evidence in this table
suggests that portfolio-links and technological-proximity are substitutes in citation likelihood. In
constrast, and still consistent with the competition story, the relation between indirect-links and
technological-proximity is positive along the distribution of technological-proximity (only nega-
tive but insignificantl so, for the third quartile), and is particularly pronounced for the upper quar-
tile of technological-proximity. In other words, unconditionally, indirect-links and technological-
proximity are complements.
Panel C breaks down the comparison for state-wide co-located (cited and citing patents invented
in the same state) and non-co-located pairs. Similarly to Panel B, Panel C shows that uncondition-
ally, portfolio-links are substitute to collocation in citation likelihood. Again, the result is flippe
for syndication-links. Indirect-links are a complement of state collocation.
3.2.7 Estimation Results
VC-proximity positively affects the citation likelihood I begin by verifying the preliminary
evidence that the likelihood of a citation is increasing in VC-proximity using a simple version
48In this table I only include the firs type of controls where the citing patent is matched to a patent in the sametechnology-class and with the same application-year.

67
of the logit model with only the VC-proximity dummies and controls as explanatory variables.
Results are presented in column 1 of Table 3.4. The likelihood of a citation between a pair of
patents increases by 138.9% if the companies that file the cited and citing patents (cited company
and citing company hereafter) have a portfolio-link. This is consistent with the results of Chapter
2. Similarly, the likelihood of a citation also increases if the cited and citing companies share a
syndication- or an indirect-link, by 63.5% and 53.1% respectively.
Column 2 in Table 3.4, includes in the logit model relevant control variables such as: an in-
dicator for same three-digit technology-class for both patents in the pair, the citation propensity
measure explained above, and a dummy that equals one when the cited and citing patents are in-
vented in the same state. In line with prior studies I fin that knowledge fl ws within the same
technology-class and within the same state are stronger than across technology-classes or states.
This is indicated by the positive coefficient on the same technology-class and same state dummies.
More interestingly, the finding in column 2 imply that the importance of VC-proximity continues
to hold even after including the aforementioned controls.
Columns 3 and 4 extend the analysis to include the measures of geographical distance and
technological-proximity respectively. Column 3 shows that even after controlling for the geo-
graphical distance between the patents, a citation is more likely to occur between patents whose
companies have a VC-proximity link. Finally, column 4 shows the importance of controlling for
the technological distance between the cited and citing companies in the pair. After controlling for
technological-proximity the estimated effects for portfolio-, syndication- and indirect-links, fall
considerably, and for the latter two, are no longer signifi ant under double clustering. The coeffi
cient of column 4 implies that after controlling for the technological-proximity and geographical
distance, a portfolio-link increases the likelihood of a citation by 22%. Finally, note that the pos-
itive impact of an indirect-link on the likelihood of a citation continues to hold, which reduces
concerns that the results are entirely driven by selection.

68
Portfolio-links and syndication-links are a substitute for technological-proximity Next, I in-
clude in the logit model the interactions between the different proximity measures. Results are
presented in columns 4 through 6 of Table 3.4. The main objective is to understand whether the
VC-proximity links are a complement or a substitute to technological-proximity and geographi-
cal distance. With this view, column 5 in Table 3.4 extends the analysis of column 4 by adding
the following interaction terms: Port f olio× Same state, Syndication× Same state and Indirect×
Same state. Interestingly, the estimated coefficient for the firs two interaction terms are negative
which suggests that close VC-proximity helps diffuse knowledge only for companies that are in
different states, and in fact for companies in the same state, close VC-proximity lowers the proba-
bility of a citation. In contrast, the estimated interaction effect for indirect-links is not significant
Following Greene (2009), I interpret the results for the interaction terms in this non-linear model
graphically by calculating the average predicted effect of a 0 to 1 transition for Same state. The
plots are presented in Figure 3.1. The top figur plots the predicted probabilities of a citation for
the different types of VC-proximity links using the model in column 4 which has no second order
term. The bottom f gure uses the model in column 5 which includes the second order terms of the
interactions. We can interpret the "interaction effect" as the distance between the sets of predicted
probabilities among the different types of VC-proximity links. Confirmin expectations, we see
that in the expanded model, this interaction effect shows up as an increase in the distance between
the predictors by both, decreasing the predicted probability for portfolio-links and syndication-
links and, dramatically increasing the predicted probability for indirect-links.
Column 6 in Table 3.4 extends the analysis of column 4 by adding the following interaction
terms: Port f olio× Tech_prox, Syndication × Tech_prox.and Indirect× Tech_prox. Similarly
to the interactions with the same state dummy, the estimated coefficient for the interaction terms
with the technological-proximity measure are negative except for Indirect× Tech_prox., which is
economically small and not significant The estimated coefficient suggest that close VC-proximity
is a substitute for technological-proximity. In other words, for companies that are technologically
similar, sharing a common VC investor or having VC investors that syndicate together reduces the

69
likelihood of a citation.
I examine the interaction terms between VC- and technological-proximity graphically by cal-
culating the average predicted effect of transitions between the 25th, 50th and 75th percentiles of
the empirical distribution of technological-proximity. Results are presented in Figure 3.2. Panel
A plots the average predicted probabilities for the different types of VC-proximity links using
the model in column 4 of Table 3.4 which has no interaction terms. Panel B plots the predicted
probabilities for the expanded model of column 6. The top figur in both Panel A and Panel B,
presents the transition from the 25th to the 50th percentile of technological-proximity. The bottom
figur in both Panel A and Panel B, presents the transition from the 50th to the 75th percentile
of technological-proximity. A comparison between the top and bottom figur within each panel,
graphically illustrates the substitutability between VC-proximity and technological-proximity. In
other words, for companies that share a common VC, if they are technologically similar they are
unlikely to cite each other.49 A comparison between Panel A and Panel B reflect the effect of
the interaction. The interaction effect shows up as increasing the gap between the predicted prob-
abilities for the different VC-proximity links, particularly by increasing (decreasing) the predicted
probability for portfolio-links when companies are technologically distant (close). For indirect-
links the estimated effect is very different. Companies that have an indirect-link are more likely to
cite each other independent of their technological-proximity.
Results are not driven by top states I examine specifi subsamples to figur out whether the
finding are driven by particular kinds of patents. First, I subset the sample by removing California
as Silicon Valley has often been described as an outlier for diffusion (e.g., Almeida and Kogut
(1999)) and, given the concentration of the sample in this state. Results are presented in Table 3.5.
49The predicted probability curve as a function of technological distance suggests a non linear effect. I addressthis issue in unreported results where I include a squared term for technological distance and the corresponding inter-actions. Results for portfolio-links continue to hold. Numerically results for syndication-links and indirect-links aresimilar, however, they are no longer significant

70
The importance of portfolio-links, syndication-links and indirect-links are much more pronounced
in this subsample. Although the coefficient on the interactions are still numerically negative, they
are no longer significant This does not mean however, that the marginal effects of the interactions
are not significan (Ai and Norton (2003)). However, a similar graphical analysis as in the last
section, not reported to conserve space, reveals that the interaction effect is not as strong in this
subsample. To further investigate whether the finding are state-specifi in ways not captured by
the state fi ed effects in the regressions, I also carried out analogous analyses for cited patent
subsamples excluding other important states such as Massachusetts, Washington and Texas. The
finding revealed that the importance of VC-proximity is also present in these subsamples. In
conclusion, the finding are not driven by the largest states in terms of their patent production.
Results are not exclusive to top 1-digit technology-classes I also check whether the results are
driven by specifi sectors. I exclude the one-digit Hall et al. (2001) technology category Comput-
ers and Communications, the leading sector of patent production by VC-backed companies. As
Table 3.6 shows results are qualitatively unchanged. I also carried out analyses for cited patent
subsamples for all six different one-digit technology categories. Results are qualitatively similar
across the different subsamples.
Role of top VC firm As a last robustness check, I test whether results are driven by top VCs.
The VC industry is characterized by heterogeneity in performance and persistence of skill (e.g.,
Sorensen (2008), Kaplan and Schoar (2005)). It is likely that the importance of VC-proximity is
only valid for companies whose lead VCs are among the top performers. To investigate this issue, I
exclude from the sample all cited patents file by companies whose lead VC is a top VC firm Top
VCs are define as those whose investments represent more than 1% of total investments in the
sample, and correspond to: New Enterprise Associates Inc., Kleiner Perkins Caufiel Byers, Oak
Investment Partners, U.S. Venture Partners, Mayfiel Fund, Accel Partners, Sequoia Capital and
Bessemer Venture Partners. Results are presented in Table 3.5. Results are numerically similar,

71
but no longer significant
Turnover of inventors is not associated with the relation between VC-proximity and citation
likelihood I consider potential mechanisms behind the VC-proximity effect. I start by testing
whether VC-proximity is a proxy for inventor turnover among companies. It is likely that VCs
recycle inventors across their companies. To test whether this mechanism can explain the effect
of VC-proximity on the likelihood of a citation, for every observation in the sample I explore
whether the filin companies share a common inventor. Two companies are said to share a common
inventor at t if there is at least one inventor who assigned patents to both companies at some point
before or during year t. The firs two columns of Table 3.8 present results from including in the
logit specificatio an indicator for inventor turnover and its interaction with the VC-proximity
measures. Column 1 shows that including the indicator for inventor turnover reduces the estimated
effect of VC-proximity, however the effect is still positive and significant Unexpectedly, column
2 shows that sharing a common inventor makes it less, instead of more likely for a citation to occur
between companies who share a portfolio- or syndication-link. This result may be explained by
prior finding that entrepreneurial spawning actually operate in new lines of businesses (Gompers
et al. (2005))
Turnover of executives drives the relation between VC proximity and citation likelihood
Next I consider turnover of executives. One of the fundamental value-adding roles of VCs is
helping them hire (Hellmann and Puri (2002)), and considerable overlap exists among the execu-
tives of companies that share a common VC. To test whether turnover of executives is behind the
effect of VC-proximity, for every observation in the sample I explore whether the filin companies
share a common executive. Two companies are said to share a common executive at t if there is at
least one executive who worked on these companies at some point before, or during. year t. The
last two columns of Table 3.8 present results from including in the logit specificatio an indicator
for executive turnover and its interaction with the VC-proximity measures. Column 3 shows that

72
the indicator for executive turnover is not significan and has no effect on the estimated effects
for VC-proximity. However, column 4 shows that after including the interactions, it is clear that
the effect of VC-proximity occurs only when companies share common executives. This result is
interesting, as it is evidence of a clear mechanism that facilitates knowledge diffusion inside VC
networks, namely, executive turnover.
Results from this section are overall consistent with VC-proximity facilitating knowledge dif-
fusion among companies that are technologically distant. Executive skills are likely to be more
transferable across companies in different technological areas, whereas inventor skills are likely to
be more technology specific
3.3 Conclusions
This chapter investigates the relationship between the strategic interaction among companies
inside VC networks and the direction of innovative activity. I fin that companies in the same
VC network and in similar technological or geographical areas tend to diverge in the direction
of their innovative activity. In contrast, companies in different technologies or geographies, but
within the same VC network, tend to converge in the direction of their patented research. The
firs findin could derive from the competition for finan ial resources inside VC networks (e.g.,
Townsend (2012)). The second findin may be associated to VCs facilitating relational contracting
(e.g., Lindsey (2008)).
This chapter also has some interesting finding regarding the mobility of workers and knowledge
spillovers. I fin that the convergence in innovative activity in VC networks is associated with
turnover of executives among VC-backed companies, but not with turnover of inventors. Given the
technology-specificit of inventor skill, and the more fl xible nature of executive skills, this findin
is consistent with most of the convergence in innovative activity inside VC networks occurring
among companies that are technologically dissimilar.

73
Given the importance of innovation on economic growth, understanding how financia interme-
diaries can shape the direction of innovative activity is of paramount interest. Most of the existing
research focuses on how financ and corporate governance can affect the rate of innovative activ-
ity. However, the quantity of innovations produced is not the only issue of interest in welfare eco-
nomics, but also, how diverse is the production of commodities and innovations. The VC industry
provides a particularly good setting for understanding how financ can affect this diversity, hence,
there are many directions that future research can take. For instance, although VC-backed compa-
nies are often posed as stand-alone innovators in theoretical models (e.g., Belenzon et al. (2010)),
conceptually VC firm share many characteristics with conglomerates. For example, decision mak-
ing is partially centralized as VCs often participate in their companies’ boards, and capital fl ws
akin to internal capital markets are also likely to be present (e.g.,Townsend (2012)). Understanding
how the structure of VC firm resembles conglomerates, and the predictions of those similarities
on the interaction among VC-backed companies and the impact on their innovative activity, is an
interesting area for future research.

74
4 Tables
Table 1.1 – Sample Composition The sample is composed of 36,980 patents invented by 4,169 companies and filed (applied for) during the period between 3 years before and 5 years after the VC investment. Panel A describes the distribution of patent applications and VC investments over time as well as the type of exit by the VC firm. Panel B describes the industry distribution of companies and patents. Panel A. Distribution of VC investments by year and exit
Year VC investments Defunct Other Acquisition Active IPO Patent Applications Patent Grant
1976 23 1977 38 10 1978 63 27 1979 31 7 1 12 1 10 96 30 1980 53 13 4 20 2 14 105 59 1981 101 23 4 47 8 19 177 81 1982 90 18 8 40 6 18 227 90 1983 90 24 2 40 7 17 273 131 1984 108 31 8 40 5 24 355 212 1985 84 22 2 38 2 20 389 261 1986 74 21 3 35 5 10 443 314 1987 101 36 5 25 7 28 494 444 1988 94 27 2 28 7 30 544 427 1989 126 28 10 47 12 29 518 589 1990 83 18 2 39 4 20 516 556 1991 53 16 3 15 6 13 483 517 1992 70 15 2 24 3 26 548 479 1993 85 11 6 20 10 38 615 478 1994 89 17 7 36 10 19 881 514 1995 164 38 2 58 20 46 1,183 549 1996 202 39 6 72 29 56 1,170 643 1997 232 39 4 106 34 49 1,706 825 1998 273 50 8 100 62 53 2,148 1,245 1999 324 47 12 129 95 41 2,352 1,394 2000 487 73 12 184 176 42 3,145 1,675 2001 300 36 3 102 134 25 3,773 1,953 2002 240 16 3 81 120 20 3,322 2,191 2003 234 11 3 67 140 13 2,217 2,725 2004 221 5 10 64 131 11 1,775 2,719 2005 160 2 1 34 119 4 1,177 2,439 2006 409 3,058 2007 93 2,487 2008 5 2,141 Total 4,169 683 133 1,503 1,155 695 31,263 31,263

75 Panel B. Industry distribution of companies and patents # of companies # of patents Biotechnology 428 4,070 Communications and Media 612 4,434 Computer Related 1,272 6,001 Medical Health Life Science 698 6,819 Non-High Technology 469 2,794 Semiconductors Other Elect 690 7,145 4,169 31,263

76
Table 1.2 - Univariate tests of rate and quality of innovative activity This table compares the rate of innovative activity, as measured by patent filings, before and after the VC investment. Panel B compares the quality and nature of innovative activity, as measured by different patent-based metrics explained in detail in Section 2, before and after venture funding. *, **, and *** indicate statistical significance at the 10%, 5% and 1% levels, respectively. Panel A
Patent Production Mean Std. Dev. Min Median Max Obs.
Pre VC 0.37 1.28 0 0 38 12,507 Post VC 1.09 2.99 0 0 95 24,473 Difference 0.85*** 36,980 Ratio 2.99
Panel B
Mean Pre-VC Obs. Mean Post-VC Obs. Diff. P- value Cites 9.192 3,393 9.158 17,745
0.034 0.907
Self-cites 1.179 3,393 1.322 17,745
0.144* 0.090 Non self-cites 8.013 3,393 7.836 17,745
-0.177 0.493
Originality 0.575 2,887 0.571 15,657
-0.004 0.558 Generality 0.839 3,160 0.825 16,338
-0.014*** 0.009
Scaled cites 1.875 3,393 1.900 17,745
0.026 0.616 Scaled self-cites 2.105 3,389 2.158 17,743
0.053 0.683
Scaled non self-cites 1.844 3,393 1.833 17,745
-0.011 0.835 Scaled originality 1.121 2,886 1.115 15,657
-0.005 0.667
Scaled generality 1.154 3,160 1.143 16,338
0.011 0.219

77
Table 1.3 - VC and the rate of innovative activity The table contains Poisson regression estimates. An observation is a company-year. The dependent variable is successful patent applications. is an indicator variable that equals 1 after VC investment. is a dummy that equals 1 while the company is being financed by at least one VC. is a dummy that equals 1 after all VC investors exit a company. While we don't have information on the exact date that each VC exits its investments, we approximate it as one year after the last observed financing round. The models include company and year fixed effects. The specification labeled “Full Sample” includes all patents. The specification labeled “After 1999” (“Before 1999”) includes only companies involved in VC (initial) investments after (before) 1999. The reported coefficients are incidence rates. A coefficient greater than one corresponds to a positive relationship between the explanatory variable and production intensity. Standard errors are clustered at the issuing company level. *, **, and *** indicate statistical significance at the 10%, 5% and 1% levels, respectively. Panel A
Full Sample Year VC investment Companies with patents before and after VC investment
After 1999 Before 1999 (1) (2) (3) (4)
After VC 2.535*** 2.268*** 2.422*** 1.614*** (0.121) (0.159) (0.178) (0.096) Observations 36,980 17,153 19,827 9,543 N. Companies 4,169 1,966 2,203 1,081 Year FE Yes Yes Yes Yes Company FE Yes Yes Yes Yes
Panel B
Full Sample Year VC investment Companies with patents before and after VC investment
After 1999 Before 1999 (1) (2) (3) (4)
Interim VC (I) 2.167*** 1.934*** 2.189*** 1.482*** (0.098) (0.122) (0.154) (0.082) After Exit (II) 1.335*** 0.827 1.626*** 1.007 (0.101) (0.110) (0.171) (0.105) p-value Chi 2 test (I=II)
0.00 0.00 0.00 0.00
Observations 36,980 17,153 19,827 9,543 N. Companies 4,169 1,966 2,203 1,081 Year FE Yes Yes Yes Yes Company FE Yes Yes Yes Yes

78
Table 1.4 - VC and the rate of innovative activity by industry
The table contains Poisson regression estimates. An observation is a company-year. The dependent variable is successful patent applications. is an indicator variable that equals 1 after VC investment. is a dummy that equals 1 while the company is being financed by at least one VC. is a dummy that equals 1 after all VC investors exit a company. While we don't have information on the exact date that each VC exits its investments, we approximate it as one year after the last observed financing round. The models include company and year fixed effects. The specification labeled “Full Sample” includes all patents. The specification labeled “After 1999” (“Before 1999”) includes only companies involved in VC (initial) investments after (before) 1999. We use the industry classification as reported by SDC and described in Panel B of Table 1. The reported coefficients are incidence rates. A coefficient greater than one corresponds to a positive relationship between the explanatory variable and production intensity. Standard errors are clustered at the issuing company level. *, **, and *** indicate statistical significance at the 10%, 5% and 1% levels, respectively. Panel A
Full Sample Year of VC investment After 1999 Before 1999 (1) (2) (3)
(II) 3.055*** 1.877*** 4.485*** (0.393) (0.346) (0.837) 2.770*** 2.463*** 2.603*** (0.316) (0.372) (0.559) (IV) 2.273*** 1.912*** 2.289*** (0.206) (0.212) (0.370) (V) (2.395*** 1.999*** 2.498*** (0.197) (0.235) (0.319) (I) 1.673*** 2.264*** 1.261 (0.212) (0.425) (0.204) (VI) 2.967*** 2.748*** 2.507*** (0.303) (0.342) (0.391) P-value Chi 2 test II=I 0.00 0.47 0.00 III=I 0.00 0.71 0.01 IV=I 0.04 0.42 0.01 V=I 0.02 0.56 0.00 VI=I 0.00 0.40 0.00 Observations 36,980 17,153 19,827 N. companies 4,169 1,966 2,203 Company FE Yes Yes Yes Year FE Yes Yes Yes

79 Panel B
Full Sample
Year of VC investment
After 1999 Before 1999 (1) (2) (3)
(I) 2.261*** 1.675*** 3.029*** (0.267) (0.277) (0.528) (II) 2.380*** 2.217*** 2.147*** (0.252) (0.300) (0.399) (III) 2.173*** 1.776*** 2.394*** (0.171) (0.174) (0.332) (IV) 2.098*** 1.685*** 2.378*** (0.159) (0.188) (0.265) (V) 1.463*** 1.631*** 1.324** (0.154) (0.280) (0.168) (VI) 2.452*** 2.253*** 2.186*** (0.235) (0.262) (0.309) (IA) 2.042*** 0.789 3.279*** (0.342) (0.297) (0.658) (IIA) 1.466* 0.942 1.732* (0.299) (0.282) (0.539) (IIIA) 1.185 0.930 1.409* (0.171) (0.220) (0.282) (IVA) 1.248* 0.747 1.591*** (0.150) (0.147) (0.250) (VA) 0.804 0.857 0.836 (0.182) (0.361) (0.210) (VIA) 1.417** 0.718 1.821*** (0.214) (0.148) (0.390) P-value Chi 2 test I=IA 0.37 0.03 0.50 II=IIA 0.01 0.00 0.34 III=IIIA 0.00 0.00 0.00 IV=IVA 0.00 0.00 0.00 V=VA 0.00 0.08 0.05 VI=VIA 0.00 0.00 0.26 Observations 36,980 17,153 19,827 N. companies 4,169 1,966 2,203 Company FE Yes Yes Yes Year FE Yes Yes Yes

80
Table 1.5 - VC and the rate of innovative activity by type of VC exit The table contains Poisson regression estimates. An observation is a company-year. The dependent variable is successful patent applications. is an indicator variable that equals 1 after VC investment. is a dummy that equals 1 while the company is being financed by at least one VC. is a dummy that equals 1 after all VC investors exit a company. While we don't have information on the exact date that each VC exits its investments, we approximate it as one year after the last observed financing round. The models include company and year fixed effects. The specification labeled “Full Sample” includes all patents. The specification labeled “After 1999” (“Before 1999”) includes only companies involved in VC (initial) investments after (before) 1999. We use the type of exit as reported by SDC and described in Panel A of Table 1. The reported coefficients are incidence rates. A coefficient greater than one corresponds to a positive relationship between the explanatory variable and production intensity. Standard errors are clustered at the issuing company level. *, **, and *** indicate statistical significance at the 10%, 5% and 1% levels, respectively. Panel A
Full Sample Year of VC investment After 1999 Before 1999 (1) (2) (3)
(I) 1.535*** 1.775*** 1.372*** (0.146) (0.315) (0.150) (II) 1.527** 1.075 1.958** (0.285) (0.293) (0.541) (III) 2.155*** 1.777*** 2.293*** (0.168) (0.193) (0.241) 2.333*** 2.108*** 2.097*** (0.154) (0.167) (0.287) (IV) 2.523*** 1.781*** 3.074*** (0.248) (0.268) (0.415) (IA) 0.349*** 0.270*** 0.383*** (0.057) (0.073) (0.075) (IIA) 1.043 0.925 1.333 (0.331) (0.356) (0.632) (IIIA) 0.988 0.617*** 1.247 (0.110) (0.107) (0.186) (IVA) 2.554*** 1.337 3.602*** (0.320) (0.275) (0.596) P-value Chi 2 test I=IA 0.00 0.00 0.00 II=IIA 0.14 0.68 0.21 III=IIIA 0.00 0.00 0.00 IV=IVA 0.86 0.08 0.06 Observations 36,980 17,153 19,827 N. companies 4,169 1,966 2,203 Company FE Yes Yes Yes Year FE Yes Yes Yes

81
Table 1.6 - VC and the quality of innovative activity The table contains pooled Poisson regression estimates. An observation is a patent. The dependent variable is reported at the top of each column. Cites correspond to the number of times the patent has been cited by other patents in the calendar years of the patent grant and the 3 subsequent years. Non-self-cites (Self-cites) exclude from (only include in) the citation count those citations made by other patents filed by the same company is an indicator variable that equals 1 after VC investment. is a dummy that equals 1 while the company is being financed by at least one VC. is a dummy that equals 1 after all VC investors exit a company. While we don't have information on the exact date that each VC exits its investments, we approximate it as one year after the last observed financing round. The reported coefficients are incidence rates. A coefficient greater than one corresponds to a positive relationship between the explanatory variable and the citation intensity. Standard errors are clustered at the issuing company level. *, **, and *** indicate statistical significance at the 10%, 5% and 1% levels, respectively. Panel A
(1) (2) (2) (6) (7) (8) Cites Self-cites Non- self-cites Cites Self-cites Non Self-cites
0.996 1.122 0.978 1.016 1.101 1.003 (0.063) (0.180) (0.061) (0.050) (0.170) (0.046) Constant 9.192*** 1.179 8.013*** 1.859*** 2.007*** 1.840*** (0.468) (0.121) (0.412) (0.074) (0.195) (0.072) Observations 21,138 21,138 21,138 21,138 21,132 21,138 N. Companies 3,231 3,231 3,231 3,231 3,231 3,231 Offset No No No Yes Yes Yes Panel B
(1) (2) (2) (6) (7) (8) Cites Self-cites Non- self-cites Cites Self-cites Non Self-cites
1.076 1.226 1.054 1.089* 1.196 1.072 (0.067) (0.192) (0.063) (0.055) (0.179) (0.050) 0.871 0.958 0.858* 0.900* 0.950 0.892** (0.074) (0.224) (0.073) (0.055) (0.215) (0.051) Constant 9.192*** 1.179 8.013*** 1.859*** 2.007*** 1.840*** (0.468) (0.121) 1.054 (0.074) (0.195) (0.072) p-value Chi 2 test (I=II)
0.00 0.21 0.00 0.00 0.23 0.00
Observations 21,138 21,138 21,138 21,138 21,132 21,138 N. companies 3,231 3,231 3,231 3,231 3,231 3,231 Offset No No No Yes Yes Yes

82 Panel C: Dynamics before the VC exit
(1) (2) (3) (6) (7) (8) Cites Self-cites Non- self-Cites Cites Self-cites Non Self-cites Event Year -3 0.836* 1.011 0.813** 0.936 1.092 0.915 (0.086) (0.231) (0.084) (0.079) (0.239) (0.074) Event Year -2 0.808** 0.880 0.798*** 0.893 0.923 0.888 (0.068) (0.157) (0.069) (0.065) (0.158) (0.065) Event Year -1 0.917 0.978 0.909 0.936 0.988 0.929 (0.063) (0.146) (0.065) (0.054) (0.138) (0.055) Event Year +1 1.035 1.364* 0.991 1.087 1.375* 1.047 (0.065) (0.223) (0.061) (0.062) (0.224) (0.056) Event Year +2 0.937 1.315 0.887 1.008 1.297 0.966 (0.078) (0.268) (0.071) (0.069) (0.256) (0.061) Event Year +3 0.874 1.204 0.830* 0.982 1.221 0.946 (0.089) (0.346) (0.080) (0.088) (0.345) (0.077) Event Year +4 0.741*** 0.891 0.721*** 0.924 0.949 0.919 (0.075) (0.238) (0.074) (0.076) (0.243) (0.076) Event Year +5 0.612*** 0.798 0.588*** 0.767*** 0.869 0.752*** (0.068) (0.199) (0.070) (0.073) (0.211) (0.074) Constant 10.632*** 1.237 9.395*** 2.016*** 2.032*** 2.014*** (0.582) (0.173) (0.518) (0.099) (0.271) (0.098) Observations 14,655 14,655 14,655 14,655 14,649 14,655 N. companies 2,907 2,907 2,907 2,907 2,906 2,907 Offset No No No Yes Yes Yes

83
Table 1.7 - VC and the quality of innovative activity by industry The table contains pooled Poisson regression estimates. An observation is a patent. The dependent variable is reported at the top of each column. Cites correspond to the number of times the patent has been cited by other patents in the calendar years of the patent grant and the 3 subsequent years. Non self-cites (Self-cites) exclude from (only include in) the citation count those citations made by other patents filed by the same company is an indicator variable that equals 1 after VC investment. is a dummy that equals 1 while the company is being financed by at least one VC. is a dummy that equals 1 after all VC investors exit a company. While we don't have information on the exact date that each VC exits its investments, we approximate it as one year after the last observed financing round. We use the industry classification as reported by SDC and described in Panel B of Table 1. The reported coefficients are incidence rates. A coefficient greater than one corresponds to a positive relationship between the explanatory variable and the citation intensity. Standard errors are clustered at the issuing company level. *, **, and *** indicate statistical significance at the 10%, 5% and 1% levels, respectively.
(1) (2) (3) (4) (5) (6) Cites Self-cites Non- self-cites Cites Self-cites Non- self-cites
(I)
0.691** 1.524 0.573*** 1.009 1.603* 0.883
(0.102) (0.475) (0.076) (0.102) (0.422) (0.071) (II)
1.238** 0.563*** 1.334*** 1.080 0.667* 1.123
(0.117) (0.118) (0.131) (0.078) (0.142) (0.082) (III)
1.463*** 1.378 1.475*** 1.173 1.309 1.159**
(0.160) (0.763) (0.113) (0.127) (0.718) (0.080) (IV)
1.309*** 1.467** 1.287** 1.109 1.136 1.104
(0.126) (0.223) (0.130) (0.094) (0.168) (0.098) (V)
0.754* 1.421 0.659*** 1.020 1.513 0.925
(0.129) (0.512) (0.100) (0.133) (0.464) (0.111) (VI)
0.850 1.243 0.794** 1.035 1.336 0.985
(0.091) (0.295) (0.079) (0.103) (0.307) (0.090) (IA)
0.512*** 1.164 0.419*** 0.828 1.376 0.714***
(0.085) (0.538) (0.050) (0.107) (0.594) (0.074) (IIA)
0.832 0.213*** 0.921 0.751*** 0.253*** 0.804**
(0.116) (0.046) (0.134) (0.065) (0.054) (0.071) (IIIA)
1.222* 0.881 1.271** 0.997 0.766 1.028
(0.135) (0.415) (0.144) (0.087) (0.367) (0.079) (IVA)
1.323* 1.635 1.279* 0.961 1.202 0.927
(0.195) (0.740) (0.180) (0.108) (0.530) (0.088) (VA)
0.537*** 1.134 0.453*** 0.811 1.300 0.714***
(0.098) (0.543) (0.055) (0.161) (0.606) (0.084) (VIA)
0.682*** 0.671 0.684*** 0.850 0.763 0.863
(0.088) (0.206) (0.097) (0.103) (0.246) (0.112) Constant 8.996*** 1.121 7.875*** 1.855*** 1.931*** 1.845*** (0.502) (0.110) (0.465) (0.088) (0.182) (0.092) P-value Chi 2 test I=IA 0.13 0.60 0.04 0.16 0.75 0.03

84 II=IIA 0.00 0.00 0.01 0.00 0.00 0.00 III=IIIA 0.11 0.00 0.19 0.08 0.00 0.16 IV=IVA 0.93 0.78 0.96 0.13 0.88 0.04 V=VA 0.01 0.27 0.01 0.10 0.49 0.06 VI=VIA 0.02 0.04 0.14 0.02 0.07 0.12 Observations 21,138 21,138 21,138 21,138 21,132 21,138 N. companies 3,231 3,231 3,231 3,231 3,231 3,231 Offset b No No No Yes Yes Yes

85
Table 1.8 - VC and the quality of innovative activity by type of VC exit The table contains pooled Poisson regression estimates. An observation is a patent. The dependent variable is reported at the top of each column. Cites correspond to the number of times the patent has been cited by other patents in the calendar years of the patent grant and the 3 subsequent years. Non self-cites (Self-cites) exclude from (only include in) the citation count those citations made by other patents filed by the same company is an indicator variable that equals 1 after VC investment. is a dummy that equals 1 while the company is being financed by at least one VC. is a dummy that equals 1 after all VC investors exit a company. While we don't have information on the exact date that each VC exits its investments, we approximate it as one year after the last observed financing round. We use the type of exit as reported by SDC and described in Panel A of Table 1. The reported coefficients are incidence rates. A coefficient greater than one corresponds to a positive relationship between the explanatory variable and the citation intensity. Standard errors are clustered at the issuing company level. *, **, and *** indicate statistical significance at the 10%, 5% and 1% levels, respectively.
(1) (2) (3) (4) (5) (6) Cites Self-cites Non- self-cites Cites Self-cites Non- self-cites
(I) 1.130 1.266 1.110 1.110 1.208 1.095 (0.103) (0.425) (0.085) (0.093) (0.395) (0.073) 0.885 1.338* 0.820* 1.096 1.357** 1.047 (0.098) (0.215) (0.099) (0.104) (0.211) (0.109) (II) 0.964 0.242*** 1.066 0.882* 0.233*** 0.969 (0.089) (0.037) (0.102) (0.062) (0.036) (0.071) (III) 0.673** 0.327*** 0.723* 0.687*** 0.334*** 0.738** (0.105) (0.090) (0.120) (0.100) (0.097) (0.112) (IV) 1.317*** 1.924*** 1.230** 1.209** 1.813*** 1.126 (0.125) (0.294) (0.123) (0.096) (0.263) (0.091) (IA) 0.903 0.723 0.929 0.873 0.700 0.897 (0.124) (0.246) (0.129) (0.076) (0.234) (0.072) (IIA) 0.610*** 0.217*** 0.666*** 0.715*** 0.210*** 0.803** (0.070) (0.063) (0.081) (0.070) (0.060) (0.081) (IIIA) 0.990 0.201*** 1.102 0.791*** 0.179*** 0.869 (0.284) (0.077) (0.317) (0.070) (0.051) (0.076) (IVA) 0.928 1.380 0.864 0.945 1.354 0.884 (0.103) (0.399) (0.095) (0.079) (0.375) (0.067) Constant 8.996*** 1.121 7.875*** 1.855*** 1.931*** 1.845*** (0.502) (0.110) (0.465) (0.088) (0.182) (0.092) P-value Chi 2 test I=IA 0.07 0.01 0.14 0.00 0.00 0.01 II=IIA 0.00 0.70 0.00 0.04 0.71 0.07 III=IIIA 0.22 0.28 0.18 0.34 0.10 0.29 IV=IVA 0.00 0.15 0.00 0.00 0.18 0.00 Observations N. companies Offset b No No No Yes Yes Yes

86
Table 1.9 - VC quality of innovative activity with company fixed effects The table contains Poisson regression estimates that include company fixed-effects. An observation is a patent. The dependent variable is reported at the top of each column. Cites correspond to the number of times the patent has been cited by other patents in the calendar years of the patent grant and the 3 subsequent years. Non self-cites (Self-cites) exclude from (only include in) the citation count those citations made by other patents filed by the same company is an indicator variable that equals 1 after VC investment. is a dummy that equals 1 while the company is being financed by at least one VC. is a dummy that equals 1 after all VC investors exit a company. While we don't have information on the exact date that each VC exits its investments, we approximate it as one year after the last observed financing round. The reported coefficients are incidence rates. A coefficient greater than one corresponds to a positive relationship between the explanatory variable and the citation intensity. Standard errors are clustered at the issuing company level. *, **, and *** indicate statistical significance at the 10%, 5% and 1% levels, respectively.
(1) (2) (3) (4) (5) (6) (7) (8) Cites Self-cites Non-
self-cites Cites Self-cites Non-
self-cites Cites Non-
self-cites 0.719*** 0.387*** 0.782*** (0.032) (0.047) (0.034) 0.795*** 0.466*** 0.850*** (0.036) (0.052) (0.038) (II) 0.565*** 0.242*** 0.640*** (0.036) (0.040) (0.041) Event Year -3 1.448*** 1.272** (0.147) (0.119) Event Year -2 1.213*** 1.150** (0.071) (0.067) Event Year -1 1.154*** 1.116** (0.056) (0.058) Event Year +1 0.887** 0.906** (0.044) (0.042) Event Year +2 0.753*** 0.777*** (0.039) (0.040) Event Year +3 0.702*** 0.750*** (0.047) (0.050) Event Year +4 0.697*** 0.757*** (0.052) (0.061) Event Year +5 0.616*** 0.691*** (0.061) (0.072) Constant 2.544*** 1.602*** 2.474*** 2.428*** 2.455*** (0.114) (0.195) (0.107) (0.123) (0.123) p-value Chi 2 test (I=II)
0.00 0.00 0.00
Observations 21,138 21,132 21,138 21,138 21,132 21,138 14,245 14,245 N. Companies 3,231 3,231 3,231 3,231 3,231 3,231 2,867 2,867 Offset Yes Yes Yes Yes Yes Yes Yes Yes Company FE Yes Yes Yes Yes Yes Yes Yes Yes

87
Table 1.10 - VC and the nature of innovative activity The table contains Poisson regression estimates. An observation is a patent. The dependent variable is reported at the top of each column. Originality and Generality are patent-based metrics of the novelty of patents and are described in Section 1.2.3. is an indicator variable that equals 1 after VC investment. is a dummy that equals 1 while the company is being financed by at least one VC. is a dummy that equals 1 after all VC investors exit a company. While we don't have information on the exact date that each VC exits its investments, we approximate it as one year after the last observed financing round. The reported coefficients are incidence rates. A coefficient greater than one corresponds to a positive relationship between the explanatory variable and the dependent variable. Standard errors are clustered at the issuing company level. *, **, and *** indicate statistical significance at the 10%, 5% and 1% levels, respectively. Panel A
(1) (2) (3) (4) (5) (6) Originality Originality Originality Generality Generality Generality
0.994 0.994 0.937*** 0.983* 0.995 0.971*** (0.017) (0.015) (0.017) (0.010) (0.009) (0.009) Constant 0.575*** 1.111*** 1.334*** 0.839*** 1.134*** 1.366*** (0.009) (0.015) (0.023) (0.007) (0.010) (0.013) Observations 18,544 18,543 18,543 19,498 19,498 19,498 N. Companies 3,034 3,034 3,034 3,116 3,116 3,116 Offset No Yes Yes No Yes Yes Company FE No No Yes No No Yes Panel B
(1) (2) (3) (4) (5) (6) Originality Originality Originality Generality Generality Generality
1.005 1.006 0.939*** 0.990 1.006 0.978** (0.017) (0.015) (0.017) (0.010) (0.010) (0.009) 0.976 0.975 0.932*** 0.972** 0.978** 0.957*** (0.020) (0.017) (0.019) (0.014) (0.011) (0.011) Constant 0.575*** 1.111*** 1.331*** 0.839*** 1.134*** 1.355*** (0.009) (0.015) (0.024) (0.007) (0.010) (0.013) p-value Chi 2 test (I=II)
0.08 0.02 0.61 0.13 0.00 0.00
Observations 18,544 18,543 18,543 19,498 19,498 19,498 N. Companies 3,034 3,034 3,034 3,116 3,116 3,116 Offset No Yes Yes No Yes Yes Company FE No No Yes No No Yes

88 Panel C: Dynamics before the VC exit
(1) (2) (3) (4) (5) (6) Originality Originality Originality Generality Generality Generality
Event Year -3 1.067** 1.070** 1.042 0.995 0.985 1.018 (0.032) (0.029) (0.038) (0.018) (0.016) (0.017) Event Year -2 1.025 1.032 1.066** 0.996 1.007 1.033** (0.029) (0.026) (0.030) (0.015) (0.017) (0.014) Event Year -1 1.015 1.023 1.073*** 1.007 0.995 1.012 (0.022) (0.020) (0.024) (0.011) (0.010) (0.012) Event Year +1 1.043** 1.051*** 1.020 0.998 1.011 0.995 (0.021) (0.019) (0.019) (0.012) (0.010) (0.011) Event Year +2 1.029 1.037* 1.015 0.977 0.989 0.973** (0.022) (0.020) (0.022) (0.015) (0.012) (0.012) Event Year +3 1.033 1.046* 0.991 0.993 1.012 0.972* (0.028) (0.026) (0.025) (0.016) (0.015) (0.014) Event Year +4 1.082*** 1.093*** 1.026 0.990 1.019 0.985 (0.028) (0.027) (0.032) (0.016) (0.015) (0.016) Event Year +5 1.059* 1.080*** 0.977 0.974 0.981 0.958* (0.031) (0.032) (0.034) (0.022) (0.019) (0.022) Constant 0.559*** 1.074*** 1.237*** 0.838*** 1.138*** 1.351*** (0.009) (0.016) (0.026) (0.007) (0.009) (0.015) Observations 12,631 12,630 12,630 13,245 13,245 13,245 N. companies 2,670 2,670 2,670 2,776 2,776 2,776 Offset No Yes Yes No Yes Yes Company FE No No Yes No No Yes

89
Table 1.11 - VC and the rate of innovative activity: exploiting the 1999 legislative amendment in Texas The table contains OLS regression estimates using the subsample of 341 companies headquartered in either the state of Texas (193) or one of its neighboring states: Colorado (119) , Louisiana (6), New Mexico (14) and Oklahoma (9) (note that there are no companies in Arkansas in the sample). An observation is a company-year. The dependent variable is the logarithm of successful patent applications (plus 1). After VC is an indicator variable that equals 1 after VC investment. After 1999 is a dummy that equals 1 after 1999 for all observations of companies headquartered in Texas and 0 otherwise. The models include company and year fixed effects. Standard errors are clustered at the state level. *, **, and *** indicate statistical significance at the 10%, 5% and 1% levels, respectively.
OLS Reduced Form IV 2SLS (1) (2) (3)
After VC 0.250*** 4.333** (0.029) (1.761) After 1999 1.305*** (0.453) Constant -0.093 -0.747*** (0.115) (0.178) First Stage 0.301*** After 1999 (0.035) F-statistic 11.35 Observations N. Companies 341 341 341 Year FE Yes Yes Yes Company FE Yes Yes Yes

90
Table 1.12 - VC and the quality of innovative activity: exploiting the 1999 Legislative amendment in Texas The table contains linear regression estimates using the subsample of 669 patents filed by 265 companies before 2005 and that are headquartered in either the state of Texas (144) or one of its neighboring states: Colorado (100) , Louisiana (6) , New Mexico (8) and Oklahoma (7) (note that there are no companies in Arkansas in the sample). An observation is a patent. The dependent variable is the logarithm of scaled citations (plus 1). The type of citation used in the regressions is reported n top of each column. After VC is an indicator variable that equals 1 after VC investment. After 1999 is a dummy that equals 1 after 1999 for all observations of companies headquartered in Texas and 0 otherwise. The models include company fixed effects. Standard errors are clustered at the state level. *, **, and *** indicate statistical significance at the 10%, 5% and 1% levels, respectively.
Scaled cites Scaled self- cites Scaled non-self- cites
OLS Reduced Form
IV 2SLS OLS Reduced Form
IV 2SLS OLS Reduced Form
IV 2SLS
(1) (2) (3) (4) (5) (6) (7) (8) (9) After VC -0.229 -0.650*** -0.466* -1.342*** -0.186 -0.533*** (0.118) (0.000) (0.181) (0.000) (0.098) (0.000) After 1999 -0.275*** -0.569*** -0.226*** (0.000) (0.000) (0.000) Constant 0.844*** 0.854*** 0.642*** 0.903*** 0.817*** 1.439*** (0.000) (0.139) (0.000) (0.076) (0.000) (0.000) First Stage 0.424*** After 1999 (0.000) F-stat. 24.30 Obs. 669 669 669 669 669 669 669 669 669 N. Comp. 265 265 265 265 265 265 265 265 265 Offset b Yes Yes Yes Yes Yes Yes Yes Yes Yes Comp. FE Yes Yes Yes Yes Yes Yes Yes Yes Yes

91
Table 2.1 - Summary statistics analysis sample The sample consists of 2,336 patents filed by 752 VC-backed companies at least two years before they were first financed by a VC (347 VC firms). For Panel B I use the state of the company as reported in the VentureXpert database. For Panels B, C, D and E the percentage of companies used for comparisons consists of 5,108 VC-backed companies that patent from the full matched sample, and of 20,058 companies included in the VentureXpert database between 1976 and 2009 (See Appendix 1 for details). The industry classification used in Panel D is based on the VentureXpert files. Panel A. Application and grant years of patents, and transaction years for the VC investments
Year Patent Applications Patent Grants VC investments 1976 144 3 1977 78 73 1978 84 85 3 1979 69 66 6 1980 45 67 10 1981 48 73 28 1982 47 37 15 1983 46 37 14 1984 62 52 15 1985 71 52 8 1986 44 70 17 1987 56 64 20 1988 70 53 12 1989 70 77 15 1990 66 62 16 1991 74 59 16 1992 92 61 13 1993 95 71 9 1994 99 80 18 1995 139 93 24 1996 117 78 38 1997 188 85 36 1998 207 132 67 1999 117 152 56 2000 126 160 86 2001 82 148 55 2002 107 77 2003 96 78 2004 51 2005 45 2006 30 2007 9 2008 8 Total 2,336 2,336
752

92
Panel B. Distribution by state of companies and associated patents: top states in the analysis sample % of Companies % of Patents
State Analysis Sample
Full Matched Sample
Overall VC Population
Analysis Sample
Full Matched Sample
CA
34.97% 44.4% 38.8%
32.6% 56.5% CO
2.39% 2.7% 2.9%
3.6% 1.2%
CT
2.66% 1.7% 1.6%
3.3% 0.8% IL
2.53% 1.9% 2.2%
2.1% 0.6%
MA
14.10% 12.8% 10.8%
10.5% 9.0% NJ
2.66% 2.6% 2.5%
2.3% 1.1%
NY
3.99% 2.9% 5.3%
3.4% 1.8% PA
3.46% 3.1% 3.4%
5.0% 2.2%
TX
5.32% 4.8% 5.7%
9.7% 5.9% WA 2.66% 2.9% 3.2% 1.9% 10.7% Panel C. Distribution of companies by type of VC investment % of Companies # of companies Analysis Sample Full matched Sample Overall VC Population Bridge Loan 21 2.8% 1.7% 2.4% Early Stage 257 34.2% 38.2% 39.8% Expansion 299 39.8% 25.3% 25.7% Later Stage 91 12.1% 7.0% 5.9% Seed 84 11.2% 27.8% 26.1% Total 752 Panel D. Distribution of companies by type of VC exit % of Companies # of companies Analysis Sample Full matched Sample Overall VC Population Acquisition 282 37.5% 34.9% 30.8% Active 209 27.8% 29.9% 35.8% Bankruptcy 9 1.2% 1.3% 1.3% Defunct 140 18.6% 14.4% 19.9% Merger 10 1.3% 1.6% 1.6% Other 11 1.4% 1.7% 1.6% Went Public 91 12.1% 16.3% 9.1% Total 752 Panel E. Industry distribution of companies and patents
% of Companies % of Patents
# of
companies Analysis sample
Full matched sample
Overall VC Population
# of patents
Analysis sample
Full matched sample
Biotechnology 63 8.4% 9.9% 6.1% 199 8.5% 11.6% Comm. and Media 75 10.0% 11.0% 10.3% 215 9.2% 8.9% Computer Hardware 51 6.8% 8.9% 6.3% 104 4.5% 17.2% Computer Software 94 12.5% 16.3% 21.3% 180 7.7% 13.6% Consumer Related 33 4.4% 2.0% 4.8% 125 5.4% 1.1% Industrial Energy 97 12.9% 8.0% 5.1% 377 16.1% 4.4% Internet Specific 37 4.9% 8.5% 20.7% 50 2.1% 2.0% Medical Health 145 19.3% 16.8% 11.6% 505 21.6% 15.1% Other Products 30 4.0% 2.6% 6.6% 101 4.3% 0.8% Semiconductors 127 16.9% 16.0% 7.2% 480 20.5% 25.3% Total 752 2,336

93
Panel F. Distribution of patent age the year of the VC investment Number of patents Percentage of sample 2 Years 462 19.78 3 Years 643 27.53 4 Years 325 13.91 5 Years 210 8.99 Between 6 years and 10 years 411 17.59 More than 10 years 285 12.19 Total 2,336
Panel G. Annual citations (excluding self-citations) Citation type Baseline state-level Mean S. D. Med. Min Max Obs. Patents All 0.92 2.45 0.00 0.00 60.00 43,519 Citation Baseline All No 0.63 0.77 0.39 0.00 13.50 43,519 Citation Baseline All Yes 0.61 1.14 0.25 0.00 32.00 43,519 Patents Out-state 0.75 2.01 0.00 0.00 43.00 46,519 Citation Baseline Out-state Yes 0.49 0.96 0.20 0.00 29.00 46,519

94
Table 2.2 - Summary statistics restricted sample 1993-2008
Information on public state pension funds’ assets from the Census Bureau is only available from 1993 to 2008. The sample restricted to VC investments during this period consists of 1,657 patents filed by 517 VC-backed companies. For Panel B, I use the state of the company as reported in the VentureXpert database. Pension Funds’ Assets is the value of the assets held by local and state pension funds deflated and expressed in billions of 1982 U.S. dollars. Panel A. Application and grant years of patents and transaction years for the VC
Year Patent Applications Patent Grants VC investments 1976 29 1977 16 14 1978 19 20 1979 16 13 1980 10 18 1981 12 14 1982 18 8 1983 15 8 1984 25 21 1985 25 17 1986 23 30 1987 27 26 1988 39 21 1989 48 38 1990 29 42 1991 50 29 1992 86 36 1993 95 45
1994 99 70 1995 139 88
13 1996 117 77
18
1997 188 85
25 1998 207 132
44
1999 117 151
49 2000 126 160
81
2001 82 148
53 2002
107
74
2003
96
77 2004
51
2005
45 2006
30
2007
9 2008
8
Total 1,657 1,657 517

95
Panel B. Distribution of public pension funds’ assets, companies and patents by state Pension Assets % of Patents % of Companies
Mean Std. dev. Restricted sample Analysis sample Restricted sample Analysis sample AL 17.17 1.45 0.60% 0.40% 0.40% 0.30% AZ 19.87 3.48 1.80% 1.80% 1.00% 1.60% CA 284.37 64.69 37.00% 32.60% 37.30% 35.00% CO 21.67 5.06 3.10% 3.60% 2.30% 2.40% CT 15.17 3.06 2.70% 3.30% 2.30% 2.70% DC 3.26 0.81 0.40% 0.30% 0.20% 0.10% FL 71.01 16.19 1.90% 2.00% 1.90% 2.00% GA 35.36 8.79 1.10% 1.30% 1.90% 2.00% ID 5.06 0.95 0.90% 0.70% 0.40% 0.40% IL 63.77 14.25 2.10% 2.10% 2.10% 2.50% IN 14.25 2.09 0.10% 0.20% 0.20% 0.40% KS 6.79 1.91 0.10% 0.20% 0.20% 0.10% LA 17.67 3.99 0.80% 0.60% 0.60% 0.40% MA 29.68 7.12 7.80% 10.50% 12.00% 14.10% MD 26.89 4.89 3.30% 3.40% 2.30% 2.40% ME 4.98 1.59 0.30% 0.20% 0.20% 0.10% MI 48.45 7.78 0.80% 1.20% 1.40% 1.60% MN 28.79 5.21 1.20% 1.30% 2.10% 2.30% MO 28.27 5.12 0.40% 0.70% 0.60% 0.90% NC 39.50 6.05 1.20% 0.80% 2.10% 1.50% NE 4.82 1.11 0.20% 0.20% 0.20% 0.10% NH 2.81 0.84 0.80% 1.20% 1.20% 1.50% NJ 36.51 6.14 2.70% 2.30% 2.70% 2.70% NM 10.42 2.48 0.50% 0.30% 0.60% 0.40% NV 9.47 3.18 0.10% 0.00% 0.20% 0.10% NY 177.14 35.43 3.80% 3.40% 4.60% 4.00% OH 80.36 12.57 2.30% 2.20% 1.70% 1.90% OR 27.04 7.99 0.40% 1.90% 0.60% 0.70% PA 58.90 10.68 2.90% 5.00% 3.10% 3.50% RI 4.49 1.51 0.10% 0.10% 0.40% 0.30% SC 14.78 2.91 0.10% 0.20% 0.20% 0.30% TN 20.31 3.82 2.20% 2.00% 0.60% 0.80% TX 90.55 21.93 12.20% 9.70% 6.40% 5.30% UT 9.51 2.35 0.30% 0.70% 0.80% 0.80% VA 30.84 6.57 0.80% 0.90% 1.40% 1.20% VT 1.53 0.40 0.30% 0.30% 0.20% 0.30% WA 32.06 5.81 2.20% 1.90% 3.10% 2.70% WI 44.96 7.34 0.20% 0.30% 0.40% 0.40% WY 2.85 0.81 0.30% 0.20% 0.20% 0.10%

96
Panel C. Distribution of companies by type of VC investment Percentage of sample Number of Companies Restricted Sample Analysis Sample Bridge Loan 16 3.1% 2.8% Early Stage 209 40.4% 34.2% Expansion 192 37.1% 39.8% Later Stage 57 11.0% 12.1% Seed 43 8.3% 11.2% Total 517 Panel D. Industry distribution of companies and patents
% of Companies % of Patents
# of
companies Restricted
Sample Analysis Sample
# of patents
Restricted Sample
Analysis Sample
Biotechnology 55 10.6% 8.4% 179 10.8% 8.5% Comm. and Media 52 10.1% 10.0% 170 10.3% 9.2% Computer Hardware 27 5.2% 6.8% 58 3.5% 4.5% Computer Software 72 13.9% 12.5% 141 8.5% 7.7% Consumer Related 17 3.3% 4.4% 79 4.8% 5.4% Industrial Energy 42 8.1% 12.9% 218 13.2% 16.1% Internet Specific 36 7.0% 4.9% 46 2.8% 2.1% Medical Health 109 21.1% 19.3% 362 21.9% 21.6% Other Products 21 4.1% 4.0% 67 4.0% 4.3% Semiconductors 86 16.6% 16.9% 337 20.3% 20.5% Total 517 1,657 Panel E. Distribution of companies by type of VC exit % of Companies Number of companies Restricted Sample Analysis Sample Acquisition 185 35.8% 37.5% Active 184 35.6% 27.8% Bankruptcy 8 1.6% 1.2% Defunct 77 14.9% 18.6% Merger 4 0.8% 1.3% Other 7 1.4% 1.4% Went Public 52 10.1% 12.1% Total 517 Panel F. Distribution of patent age the year of the VC investment Number of patents Percentage of sample
2 Years 329 28.12 3 Years 425 34.79 4 Years 220 15.9 5 Years 132 9.06 Between 6 years and 10 years 298 12.14 More than 10 years 253 Total 1,657

97
Panel G. Annual citations (excluding self-citations) Citation type Baseline state-level Mean S. D. Med. Min Max Obs. Patents All 1.21 2.97 0.00 0.00 60.00 21,757 Citation Baseline All No 0.82 0.92 0.56 0.00 11.47 21,757 Citation Baseline All Yes 0.84 1.39 0.41 0.00 28.69 21,757 Patents Out-state 0.97 2.40 0.00 0.00 43.00 21,757 Citation Baseline Out-state Yes 0.66 1.15 0.31 0.00 25.67 21,757

98
Table 2.3 – Univariate tests VC investments and patent citations
This table compares average annual citations to patents to the average annual citation baseline before and after the VC investment. *, **, and *** indicate statistical significance at the 10%, 5% and 1% level.
Annual Average Pre-VC Post-VC Difference Ratio
Citations 0.64 1.04 0.40*** 1.63 (1.69) (2.69) Citation Baseline 0.54 0.66 (0.61) (0.83) Difference 0.10*** 0.37***
Difference in Difference Ratio of Ratios 0.28*** 1.33

99
Table 2.4 - Poisson regressions VC investments and patent citations The table contains Poisson regression estimates. An observation is a patent-year. The dependent variable is annual citations. is an indicator variable that equals 1 after VC investment. corresponds to average citations received at year t by matching patents in the same technology-class and with the same application-year. The Poisson model requires that annual average citations to matching patents be different from zero, which explains the difference in observations across columns (1)-(2). The fixed-effects Poisson model requires variation in the dependent variable for each patent, which explains the difference in observations across columns (2), and, (3). The reported coefficients are incidence rates. A coefficient greater than one corresponds to a positive relationship between the explanatory variable and the citation intensity. Standard errors are clustered at the issuing company level. *, **, and *** indicate statistical significance at the 10%, 5% and 1% levels, respectively.
(1) (2) (3) Model Poisson Poisson Poisson 1.627*** 1.328*** 1.189*** (0.106) (0.063) (0.045) Constant 0.636*** 1.177*** (0.038) (0.050) Observations 43,519 41,172 38,981 Number of patents 2,336 2,336 2,183 Number of companies 752 752 723 Offset No Yes Yes Patent FE No No Yes

100
Table 2.5 - VC investments and state pension funds’ assets The table reports the relation between investments by VC firms and pension funds’ assets in their home-state. Observations are at the state-year level. The dependent variable is stated at the beginning of each column. Investments correspond to the value of investments made by VC firms (in billions 1982 U.S dollars). Local Investments correspond to the value of investments made by VC firms in local companies (in billions 1982 U.S dollars). New Investments correspond to the value of investments made by VC firms in new companies (in billions 1982 U.S dollars). Standard errors are clustered at the state level. corresponds to the value of assets held by local and state pension funds in 1982 billion U.S. dollars and lagged by 1 year. *, **, and *** indicate statistical significance at the 10%, 5% and 1% level.
(1) (2) (3) (4) (5) (6) Dependent Variable
Investments Local Investments
Non-local Investments
New Investments
New Local Investments
Non-local New Investments
0.052*** 0.036** 0.016*** 0.013*** 0.009** 0.004*** (0.016) (0.014) (0.003) (0.004) (0.003) (0.001) Constant -1.502** -1.126** -0.376*** -0.401** -0.291** -0.109*** (0.591) (0.486) (0.114) (0.157) (0.131) (0.028) Obs. 765 765 765 765 765 765 F.E. Yes Yes Yes Yes Yes Yes F.E. Yes Yes Yes Yes Yes Yes

101
Table 2.6 - IV analysis VC investments and patent citations This table contains Poisson and Linear regression coefficients of the IV analysis. An observation is a patent-year. The dependent variable is indicated on top of each column. The instrument used in each model is indicated on top of each column. Scaled-cites corresponds to the number of citations a patent receives divided by the average number of citations received by matching patents in the same technology-class and filed the same year as the patent. is a dummy variable that equals one after the VC investment. corresponds to the value of assets held by local and state pension funds in the home-state of the company expressed in 1982 billion U.S. dollars, lagged by 1 year. corresponds to the value of assets held by local and state pension funds in the home-state of the company expressed 1982 billion U.S. dollars, normalized by average state GDP, and lagged by 1 year. corresponds to the value of assets held by local and state pension funds in the home-state of the company expressed in 1982 billion U.S. dollars, lagged by 1 year, and demeaned by time. corresponds to average citations received at year t by matching patents in the same technology-class and with the same application-year. The estimated coefficients for columns (1)-(4) are incidence rates, except for the estimated coefficient of the first-stage. For the incidence rates a coefficient greater than one corresponds to a positive relationship between the explanatory variable and the citation intensity. Standard errors are clustered at the state level. *, **, and *** indicate statistical significance at the 10%, 5% and 1% level.
(1) (2) (3) (4) (5) (6) (7) (8) Dep. Var. Cites Cites Cites Cites Scaled-
cites Scaled-
cites Scaled-
cites Scaled-
cites Instrument Model Poisson GMM-
IV GMM-IV GMM-
IV OLS 2SLS 2SLS 2SLS
1.171*** 1.495*** 1.318 1.564*** 0.225* 0.607*** 0.524* 0.683*** (0.069) (0.199) (0.239) (0.179) (0.132) (0.218) (0.272) (0.187) First Stage 0.006*** 2.409** 0.006*** (0.001) (0.969) (0.001) F-test 31.13 6.187 84.46 Obs. 15,622 15,622 15,622 15,622 18,928 18,928 18,928 18,928 # patents 1,487 1,487 1,487 1,487 1,657 1,657 1,657 1,657 # comp. 491 491 491 491 517 517 517 517 # states 38 38 38 38 39 39 39 39 Offset Yes Yes Yes Yes Patent FE Yes Yes Yes Yes Yes Yes Yes Yes

102
Table 2.7 - First robustness check IV analysis VC investments and patent citations This table contains Poisson and Linear regression coefficients of the IV analysis. An observation is a patent-year. The dependent variable is indicated on top of each column. The instrument used in each model is indicated on top of each column. Scaled Cites corresponds to the number of citations a patent receives divided by the average number of citations received by matching patents in the same technology-class, with the same application-year and issued in the same state as the patent. is a dummy variable that equals one after the VC investment. corresponds to the value of assets held by local and state pension funds in the home-state of the company expressed in 1982 billion U.S. dollars, lagged by 1 year. corresponds to the value of assets held by local and state pension funds in the home-state of the company expressed 1982 billion U.S. dollars, normalized by average state GDP, and lagged by 1 year. corresponds to the value of assets held by local and state pension funds in the home-state of the company expressed in 1982 billion U.S. dollars, lagged by 1 year, and demeaned by time. corresponds to average citations received at year t by matching patents in the same technology-class, with the same application-year and issued in the same state. The estimated coefficients for columns (1)-(4) are incidence rates, except for the estimated coefficient of the first-stage. For the incidence rates a coefficient greater than one corresponds to a positive relationship between the explanatory variable and the citation intensity. Standard errors are clustered at the company level. Standard errors for the First Stage are clustered at the state level. *, **, and *** indicate statistical significance at the 10%, 5% and 1% level.
(1) (2) (3) (4) (4) (5) (6) (7) Dep. Var. Cites Cites Cites Cites Scaled
Cites Scaled Cites
Scaled Cites Scaled Cites
Instrument Model Poisson GMM-IV GMM-IV GMM-IV OLS 2SLS 2SLS 2SLS 1.258*** 1.435** 1.428** 1.513** 0.277** 0.485** 0.435* 0.506** (0.067) (0.219) (0.223) (0.263) (0.123) (0.215) (0.256) (0.230) First Stage 0.007*** 3.066 0.007*** (0.001) (8.818) (0.001) F-test 41.50 12.09 92.86 Obs. 11,726 11,726 11,726 11,726 14,820 14,810 14,810 14,810 # patents 1,288 1,288 1,288 1,288 1,513 1,503 1,503 1,503 # comp. 456 456 456 456 490 490 490 490 # states 32 32 32 32 32 32 32 32 Offset Yes Yes Yes Yes Patent FE Yes Yes Yes Yes Yes Yes Yes Yes

103
Table 2.8 - Second robustness check IV analysis VC investments and patent citations This table contains Poisson and Linear regression coefficients of the IV analysis. An observation is a patent-year. The dependent variable is indicated on top of each column. The instrument used in each model is indicated on top of each column. Scaled out-of-state-cites corresponds to the number of citations a patent receives from assignees in a different state divided by the average number of out-of-state citations received by matching patents in the same technology-class, with the same application-year and issued in the same state as the patent. is a dummy variable that equals one after the VC investment. corresponds to the value of assets held by local and state pension funds in the home-state of the company expressed in 1982 billion U.S. dollars, lagged by 1 year. corresponds to the value of assets held by local and state pension funds in the home-state of the company expressed in 1982 billion U.S. dollars, normalized by average state GDP, and lagged by 1 year. corresponds to the value of assets held by local and state pension funds in the home-state of the company expressed in 1982 billion U.S. dollars, lagged by 1 year, and demeaned by time. corresponds to average citations received at year t by matching patents in the same technology-class, with the same application-year and issued in the same state. The estimated coefficients for columns (1)-(4) are incidence rates, except for the estimated coefficient of the first-stage. For the incidence rates a coefficient greater than one corresponds to a positive relationship between the explanatory variable and the citation intensity. Standard errors are clustered at the company level. Standard errors for the First Stage are clustered at the state level. *, **, and *** indicate statistical significance at the 10%, 5% and 1% level.
(1) (2) (3) (4) (5) (6) (7) (8) Dep. Var. Out-of-
state cites
Out-of- state cites
Out-of- state cites
Out-of- state cites
Scaled out-of- state cites
Scaled out-of- state cites
Scaled out-of- state cites
Scaled out-of- state cites
Ins.
Model Poisson GMM- IV
GMM-IV GMM- IV
OLS 2SLS 2SLS 2SLS
1.292*** 1.384** 1.451*** 1.457** 0.310** 0.670** 0.614** 0.704** (0.065) (0.214) (0.205) (0.262) (0.123) (0.262) (0.276) (0.286) First Stage 0.006*** 3.061*** 0.007*** (0.001) (0.902) (0.001) F-test 43.70 11.56 101.67 Obs. 11,020 11,020 11,020 11,020 14,566 14,566 14,566 14,566 # patents 1,223 1,223 1,223 1,223 1,500 1,500 1,500 1,500 # comp. 447 447 447 447 490 490 490 490 # states 31 31 31 31 32 32 32 32 Offset Yes Yes Yes Yes Patent FE Yes Yes Yes Yes Yes Yes Yes Yes

104
Table 2.9 - Originality This table reports Originality and Relative Originality measures for patents that are funded in hot versus cold markets. A patent is said to have been financed in a hot market if the size of local public pension funds’ assets in the home-state of the company is above the 75th percentile of the state’s average the year of the VC investment. Analogously, a patent is said to have been financed in a cold market if the size of local public pension funds’ assets in the home-state of the company is below the 25th percentile of the state’s average the year of the VC investment. *, **, and *** indicate statistical significance at the 10%, 5% and 1% level. Hot Market Cold Market Top 75% Bottom 25% Difference Originality 0.55 0.37 0.18*** Originality Adjusted 0.64 0.45 0.18*** Relative Originality 0.15 0.09 0.06*** Relative Originality Adjusted 0.15 0.10 0.06**

105
Table 2.10 - Univariate Tests VC investments and patent citations inside and outside VC portfolios Panel A compares average annual portfolio-linked citations to patents to the average annual portfolio-linked citation baseline before and after the VC investment. Panel B compares average annual non-portfolio-linked citations to patents to the annual average non-portfolio-linked citation baseline before and after the VC investment. *, **, and *** indicate statistical significance at the 10%, 5% and 1% level. Panel A. Portfolio-Linked Citations
Annual Average Pre-VC Post-VC Difference Ratio
Citations 0.002 0.008 0.006*** 4.05 (0.08) (0.15) Citation Baseline 0.001 0.003 0.002*** 2.75 (0.61) (0.83) Difference 0.001 0.005*** Ratio 2.17 2.88
Difference in Difference Ratio of Ratios 0.004*** 1.47
Panel B. Non-Portfolio-Linked Citations Annual Average Pre-VC Post-VC Difference Ratio
Citations 0.64 1.03 0.39*** 1.62 (1.68) (2.68) Citation Baseline 0.54 0.66 0.12*** 1.22 (0.61) (0.83) Difference 0.11*** 1.37*** Ratio 1.19 1.56
Difference in Difference Ratio of Ratios 0.27*** 1.33

106
Table 2.11 - Poisson regressions VC investments and patent citations inside and outside VC portfolios
The table presents Poisson estimates where the effect of VC financing is allowed to affect differently citations that originate inside or outside VC portfolios. An observation is at the patent, year, and type of citation level. The dependent variable is annual citations. ( ) is a dummy that equals one if the type of citation is portfolio- linked (non portfolio- linked). is a dummy that equals one after the VC investment. corresponds to average citations of type C, where , received at year t by matching patents in the same technology-class and with the same application-year. The Poisson model requires that annual average citations to matching patents be different from zero, which explains the difference in observations across columns (1)-(2). The fixed-effects Poisson model requires variation in the dependent variable for each patent-type of citation group for estimation, which explains the difference in observations across columns (2), and, (3). The reported coefficients are incidence rates. A coefficient greater than one corresponds to a positive relationship between the explanatory variable and the citation intensity. Standard errors are clustered at the patent level and reported in parenthesis. *, **, and *** indicate statistical significance at the 10%, 5% and 1% levels, respectively. (1) (2) (3) Model Poisson Poisson Poisson
A. Estimated Coefficients 0.635*** 1.176*** (0.024) (0.040) 0.002*** 0.868 (0.001) (0.497) (I) 1.620*** 1.325*** 1.186*** (0.067) (0.050) (0.035) (II) 4.052*** 2.437 2.785** (1.619) (1.541) (1.276)
B. Difference in Coefficients Chi2 5.37 0.93 3.44 p- value Chi2 test (0.03) (0.34) (0.06) Observations 87,038 45,064 39,299 # of patents 2,336 2,336 2,183 # of companies 752 752 726 Offset No Yes Yes Patent-type of citation FE No No Yes

107
Table 2.12 - IV analysis VC investments and patent citations inside and outside VC portfolios This table contains Poisson and Linear regression coefficients of the IV analysis. The dependent variable is indicated on top of each column. An observation is at the patent- year level. is a dummy that equals one after the VC investment. corresponds to average citations of type C, where is either portfolio- or non portfolio-linked citations, received at year t by matching patents in the same technology-class and with the same application-year. The GMM-IV and 2SLS specifications use , the size of local and state pension funds’ real assets in the home-state of the company lagged by one year, to instrument . For columns (1)-(4) standard errors are clustered at the patent level and reported in parenthesis. For columns (5)-(8) standard errors are clustered at the state level and reported in parenthesis. *, **, and *** indicate statistical significance at the 10%, 5% and 1% levels, respectively. (1) (2) (3) (4) (5) (6) (7) (8) Dep. Var. Portfolio-
linked cites
Portfolio- linked cites
Portfolio- linked scaled cites
Portfolio- linked scaled cites
Non- portfolio-
linked cites
Non- portfolio-
linked cites
Non- portfolio-
linked scaled cites
Non- portfolio-
linked scaled cites
Model Poisson GMM-IV OLS 2SLS Poisson GMM-IV OLS 2SLS 2.390* 6.274 1.361 5.113 1.167*** 1.463*** 0.224* 0.596*** (1.228) (14.289) (1.908) (3.747) (0.039) (0.191) (0.132) (0.215) First Stage 0.007*** 0.006*** (0.000) (0.001) F test 437.56 31.13 Obs. 115 115 2,617 2,513 15,622 15,622 18,928 18,928 # patents 15 15 590 486 1,487 1,487 1,657 1,657 # comp. 9 9 235 235 491 491 517 517 # states 3 3 25 25 38 38 39 39 Offset Yes Yes Yes Yes Patent FE Yes Yes Yes Yes Yes Yes Yes Yes

108
Table 2.13 - Univariate Tests VC investments and inventor and non-inventor-linked citations The table presents average annual inventor- and non-inventor- linked citations. Panel A, reports citations from all assignees. Panel B, reports portfolio-linked citations. Panel C reports non portfolio-linked citations. Column (5) presents the ratio between average annual non- inventor-linked citations post VC-investment, and average annual citations pre VC-investment for patents. Column (6) presents the “ratio of ratios” defined as the ratio between the ratio of average annual non- inventor-linked citations post and pre VC-financing for patents, to the ratio of average annual non-inventor-linked citations post and pre VC-financing for matching patents. *, **, and *** indicate statistical significance at the 10%, 5% and 1% level. Panel A. All Citations
Average Annual Citations
Average Annual Citation Baseline Ratio Ratio of Ratios
Pre-VC Post-VC Pre-VC Post-VC
(1) (2) (3) (4) (5) (6) Non- inventor-linked 0.64 [1.69] 0.97 [2.53] 0.54 [0.61] 0.58 [0.83] 1.52 1.411 Inventor-linked 0.07 [0.56] 0.08 [0.14] Panel B. Portfolio-linked Citations
Average Annual Citations
Average Annual Citation Baseline
Pre-VC Post-VC Pre-VC Post-VC Ratio Ratio of
Ratios (1) (2) (3) (4) (5) (6) Non-inventor -linked 0.0020 [0.08] 0.0076 [0.14] 0.0009 [0.08] 0.0024 [0.02] 3.87 1.459 Inventor- linked 0.0004 [0.03] 0.0004 Panel C. Non-Portfolio-linked Citations
Average Annual Citations
Average Annual Citation Baseline
Pre-VC Post-VC Pre-VC Post-VC Ratio Ratio of Ratios (1) (2) (3) (4) (5) (6) Non-inventor-linked 0.63 [1.68] 0.96 [ 2.52] 0.54 [0.61] 0.58 [0.72] 1.52 1.408 Inventor-linked 0.07 [0.55] 0.08

109
Table 2.14 - Poisson regressions VC investments and non-inventor-linked citations inside and outside VC portfolios
The table presents Poisson regression coefficients where the effect of the VC investment is allowed to affect differently non-inventor-linked citations that originate inside or outside VC portfolios. An observation is at the patent, year, and type of citation level. The dependent variable is annual non-inventor-linked citations. ( ) is a dummy that equals one if the type of citation is portfolio-linked (non portfolio-linked). is a dummy that equals one after the VC investment. corresponds to average citations received at year t by matching patents of citations type C, where , }. The Poisson model requires that annual average citations to matching patents be different from zero, which explains the difference in observations across columns (1)-(2). The fixed-effects Poisson model requires variation in the dependent variable for each patent-type of citation group for estimation, which explains the difference in observations across columns (2), and, (3). The reported coefficients are incidence rates. A coefficient greater than one corresponds to a positive relationship between the explanatory variable and the citation intensity. Standard errors are clustered at the patent level and reported in parenthesis. *, **, and *** indicate statistical significance at the 10%, 5% and 1% levels, respectively. (1) (2) (3) Model Poisson Poisson Poisson
A. Estimated Coefficients 0.635*** 1.176*** (0.024) (0.040) 0.002*** 0.868 (0.001) (0.497) (I) 1.517*** 1.409*** 1.281*** (0.063) (0.053) (0.038) (II) 3.869*** 2.620 2.891** (1.557) (1.667) (1.394)
B. Difference in Coefficients II-I
Chi2 5.51 0.96 2.83 p- value Chi2 test 0.02 0.33 0.09 Observations 87,038 44,991 39,115 Number of patents 2,336 2,336 2,170 Number of companies 752 752 726 Offset No Yes Yes Patent-type of citation FE No No Yes

110
Table 2.15 - IV analysis VC investments and non-inventor-linked citations inside and outside VC portfolios This table contains linear regression coefficients of the instrumental variable analysis of non-inventor-linked inside and outside VC portfolios. The dependent variable is indicated on top of each column. An observation is at the patent- year level. is a dummy that equals one after the VC investment. corresponds to average citations of type C, where is either (non-inventor-linked) portfolio- or non-portfolio-linked citations, received at year t by matching patents in the same technology-class and with the same application-year. The GMM-IV and 2SLS specifications use , the size of local and state pension funds’ real assets in the home-state of the company lagged by one year, to instrument . For columns (1)-(4) standard errors are clustered at the patent level and reported in parenthesis. For columns (5)-(8) standard errors are clustered at the state level and reported in parenthesis. *, **, and *** indicate statistical significance at the 10%, 5% and 1% levels, respectively. (1) (2) (3) (4) (5) (6) (7) (8) Dep. Var. Portfolio-
linked cites
Portfolio- linked cites
Portfolio- linked scaled cites
Portfolio- linked scaled cites
Non- portfolio-
linked cites
Non- portfolio-
linked cites
Non- portfolio-
linked scaled cites
Non- portfolio-
linked scaled cites
Model Poisson GMM-IV OLS 2SLS Poisson GMM-IV OLS 2SLS 2.934 4.081 0.705 2.481* 1.274*** 1.595*** 0.325** 0.684*** (2.021) (14.374) (0.581) (1.493) (0.076) (0.235) (0.140) (0.227) First Stage 0.007*** 0.710*** 0.006*** (0.0003) (0.13) (0.001) F-test 437.56 30.04 31.13 Obs. 109 109 2,617 2,513 15,516 15,516 18,928 18,928 # patents 15 15 590 486 1,475 1,475 1,657 1,657 # comp. 9 9 210 210 491 491 517 517 # states 3 3 24 24 38 38 39 39 Offset Yes Yes Yes Yes Patent FE Yes Yes Yes Yes Yes Yes Yes Yes

111
Table 2.16 - Summary statistics patent sales This table reports summary statistics of patent sales around the VC investment. Panel A reports number of patents that were sold before and after the VC investment. Panel B compares patents and matching patents and their respective likelihood of being sold at least once throughout the sample. Standard deviations are included in parenthesis. The number of observations is reported in squared brackets. Panel C compares average annual citations for patents and the citation baseline according to whether the patents were sold or not throughout the sample. Panel A. Number of patents sold Number Percentage of Total Total patents sold during the sample 375 16% Patents sold at least once before the VC investment 62 3% Patents sold at least once after the VC investment 327 14% Panel B. Annual Likelihood that a patent is traded (percentage)
Patents Matching Patents Diff. Diff. in Diff. Pre-VC Post-VC Pre-VC Post-VC 0.51 0.92 0.37 0.31 0.41*** 0.477*** (7.12) (10.21) (0.75) (0.60)
[12,767] [40,096] [12,767] [40,096]
Panel C. Difference in citations to patents Annual Average
Citations Annual Average Citation Baseline Diff. Ratio Diff.-in-
Diff. Ratio of Ratios
Pre-VC Post-VC Pre-VC Post-VC Sold 0.75 1.20 0.54 0.68 0.45*** 1.61 0.31*** 1.28
(2.11) (3.08) (0.65) (0.86)
[1,902] [5,257] [1,902] [5,257] Not Sold 0.62 1.00 0.54 0.66 0.39*** 1.62 0.27*** 1.33
(1.60) (2.61) (0.60) (0.82)
[10,865] [25,495] [10,865] [25,495] Sold - Not
Sold 0.13*** 0.20*** 0.01 0.03*** 0.07 -0.02 0.05 -0.05 [12,767] [30,752] [12,767] [30,752]

112
Table 3.1 - Sample composition
This table uses a sample of 347,987 patent pairs, which includes 102,098 actual citations (taking g = 1), 102,098 JTH-style matched pairs and 143,791 additional pairs from citing classes and years not represented in the matched sample. The total number of cited (citing) patents is 13,072 (82,597). Panel A: Distribution of application years for cited and citing patents and year of first VC investment
Cited patents Citing patents Cited company Citing company Date Citation
1976 3 3 12 14 3 1977 3 6 13 19 6 1978 10 14 17 20 16 1979 14 28 15 27 30 1980 22 48 44 65 54 1981 39 69 81 111 93 1982 64 128 57 96 177 1983 83 175 79 108 274 1984 115 252 82 124 425 1985 139 304 65 100 596 1986 199 398 52 93 847 1987 290 518 71 119 1,234 1988 413 695 70 108 1,736 1989 488 864 81 142 2,464 1990 628 1,018 65 97 3,376 1991 704 1,239 39 55 4,462 1992 973 1,550 49 75 5,978 1993 1,127 1,931 68 85 8,357 1994 1,604 2,660 55 92 12,038 1995 2,331 4,282 83 172 18,778 1996 2,240 4,786 63 208 26,603 1997 1,437 6,213 43 238 31,775 1998 146 6,484 4 278 32,220 1999 7,257 319 34,904 2000 8,380 459 36,916 2001 8,352 290 33,968 2002 8,128 234 30,546 2003 6,069 218 22,873 2004 5,290 207 18,992 2005 3,411 158 11,042 2006 1,549 122 5,251 2007 472 88 1,807 2008 24 61 146 2009 3 22 3 Total 13,072 82,597 1,208 4,624 347,987

113
Panel B: Distribution across U.S. States of cited and citing patents
Cited patent Citing patent
AL 47 251 AR
1
AZ 78 452 CA 8,079 47,312 CO 163 982 CT 53 607 DC 4 61 DE 3 30 FL 61 567 GA 46 404 HI
5
IA 2 21 ID 3 53 IL 105 511 IN 45 211 KS
11
KY
6 LA 1 23 MA 1,039 7,313 MD 81 709 ME
12
MI 29 217 MN 391 2,560 MO 4 146 MS
14
MT
2 NC 33 656 ND
3
NE
16 NH 16 338 NJ 117 865 NM 3 47 NV 18 48 NY 186 1,355 OH 56 446 OK 5 52 OR 75 411 PA 225 1,314 RI 7 40 SC 2 17 SD
3
TN 6 150 TX 1,071 5,098 UT 11 154 VA 36 384 VT
23
WA 918 8,414 WI 53 281 WV
1
Total 13,072 82,597

114
Panel C: Distribution across technology classes of cited patents Citations Patents
Number % Number %
Chemical 23,222 6.67 1,074 8.22 Computers and Communications 140,888 40.49 5,614 42.95 Drugs and Medical 106,845 30.7 3,017 23.08 Electrical and Electronic 63,096 18.13 2,724 20.84 Mechanical 9,964 2.86 447 3.42 Others 3,972 1.14 196 1.5

115
Table 3.2 - Summary statistics This table presents summary statistics of the main variables used in the regression models. The sample consists of 347,7987 patent pairs, which includes 102,098 actual citations (taking g = 1), 102,098 JTH-style matched pairs and 143,791 additional pairs from citing classes and years not represented in the matched sample. The total number of cited (citing) patents is 13,072 (82,597). Variable Observations Mean Std. Dev. Min Max Citation 347,987 0.293 0.455 0 1.000 Portfolio link 347,987 0.178 0.382 0 1.000 Syndication link 347,987 0.497 0.500 0 1.000 Indirect link 347,987 0.166 0.372 0 1.000 Same class 347,987 0.230 0.421 0 1.000 Same state 347,987 0.389 0.488 0 1.000 Technological proximity 347,987 0.326 0.344 0 1.000 Geographical distance 344,774 2.183 2.373 0 18.987 Propensity 347,987 0.015 0.030 0 0.590 Portfolio link × Same state 347,987 0.074 0.263 0 1.000 Syndication link × Same state 347,987 0.231 0.421 0 1.000 Indirect link × Same state 347,987 0.036 0.186 0 1.000 Portfolio link × Technological proximity 347,987 0.075 0.206 0 1.000 Syndication link × Technological proximity 347,987 0.159 0.292 0 1.000 Indirect link × Technological proximity 347,987 0.054 0.194 0 1.000 Portfolio link × Geographical distance 344,774 0.344 1.232 0 17.177 Syndication link × Geographical distance 344,774 1.046 2.026 0 18.987 Indirect link × Geographical distance 344,774 0.421 1.305 0 16.967

116
Table 3.3 - Non parametric evidence This table presents summary statistics of the main variables used in the regression models. The sample consists of 347,7987 patent pairs, which includes 102,098 actual citations (taking g = 1), 102,098 JTH-style matched pairs and 143,791 additional pairs from citing classes and years not represented in the matched sample. The total number of cited (citing) patents is 13,072 (82,597). Panel A. VC proximity
Cites Control Diff. t-stat Portfolio link 22.40% 21.52% 0.89% 4.849 Syndication link 49.5% 49.9% -0.37% -1.69 Indirect link 16.8% 15.2% 1.64% 10.12 Observations 102,098 102,098 Panel B. VC and technological proximity Tech. distance <=p25 p25< Tech. distance <=p50
Cites Control Diff. t-stat
Cites Control Diff. t-stat Portfolio link 12.04% 7.82% 4.22% 5.93
16.4% 14.2% 2.2% 5.71
Syndication link 42.0% 49.5% -7.49% -6.15
53.1% 56.8% -3.7% -6.84 Indirect link 22.1% 20.0% 2.12% 2.14
17.5% 15.8% 1.6% 4.01
Observations 2,599 4,639 13,172 23,853
p50< Tech. distance <=p75 p50< Tech. distance <=p75 Cites Control Diff. t-stat
Cites Control Diff. t-stat
Portfolio link 25.1% 25.6% -0.5% -1.71
22.6% 23.8% -1.3% -4.28 Syndication link 50.5% 48.7% 1.8% 4.83
48.3% 46.6% 1.7% 4.90
Indirect link 13.1% 13.4% -0.4% -1.53
19.2% 16.0% 3.2% 11.83 Observations 37,020 38,831 49,307 34,775
Panel C. VC proximity and state borders Different State Same State Cites Control Diff. t-stat
Cites Control Diff. t-stat
Portfolio link 26.3% 20.7% 5.6% 22.51
17.8% 22.7% -4.9% -18.29 Syndication link 39.1% 43.1% -4.0% -13.62
61.9% 59.4% 2.5% 7.59
Indirect link 22.9% 20.2% 2.7% 10.94
9.6% 8.1% 1.5% 7.76 Observations 55,483 59,481 46,615 42,617

117
Table 3.4 - Technological convergence in VC networks This tables shows results of estimating weighted logistic regressions. The unit of observation is a pair of patents representing an actual or potential citation (control). The dependent variable is an indicator for whether or not the citing patent actually cited the cited patent. The regression model also uses a constant and a set of fixed-effects as indicated below, but these are not reported to conserve space. Robust standard errors are shown in parentheses, and are clustered on the cited patent. *, **, and *** indicate statistical significance at the 10%, 5% and 1% levels, respectively. Standard errors double clustered at the cited-company and citing-company levels are reported in squared brackets.
(1) (2) (3) (4) (5) (6) (7) Same class 3.438*** 3.413*** 1.527*** 1.531*** 1.514*** 1.525*** (0.056) (0.056) (0.066) (0.066) (0.066) (0.066) [0.172] [0.175] [0.195] [0.196] [0.193] [0.196] Same state 0.404*** 0.276*** 0.320*** 0.766*** 0.311*** 0.315*** (0.032) (0.034) (0.036) (0.072) (0.037) (0.036) [0.168] [0.170] [0.111] [0.201] [0.108] [0.109] Citation propensity 10.793*** 10.904*** 5.518*** 5.506*** 5.554*** 5.544*** (0.935) (0.938) (1.093) (1.101) (1.085) (1.091) [1.722] [1.775] [1.788] [1.794] [1.800] [1.783] Geographical distance -0.082*** -0.070*** -0.069*** -0.072*** -0.106*** (0.006) (0.006) (0.006) (0.006) (0.016) [0.014] [0.013] [0.013] [0.013] [0.035] Technological proximity 4.735*** 4.724*** 5.174*** 4.735*** (0.051) (0.053) (0.081) (0.051) [0.211] [0.220] [0.285] [0.212] Portfolio-link 1.389*** 0.929*** 0.919*** 0.227*** 0.527*** 0.890*** 0.145** (0.042) (0.047) (0.048) (0.054) (0.072) (0.065) (0.068) [0.272] [0.239] [0.238] [0.171] [0.217] [0.234] [0.183] Syndication-link 0.635*** 0.449*** 0.450*** 0.171*** 0.407*** 0.378*** 0.089 (0.033) (0.036) (0.036) (0.042) (0.055) (0.044) (0.054) [0.200] [0.151] [0.151] [0.145] [0.145] [0.165] [0.159] Indirect-ink 0.531*** 0.422*** 0.432*** 0.235*** 0.331*** 0.225*** 0.225*** (0.039) (0.042) (0.042) (0.046) (0.058) (0.061) (0.065) [0.239] [0.195] [0.193] [0.126] [0.157] [0.178] [0.140] Interactions Same
State Tech.
proximity Geo.
Distance Portfolio link× -0.695*** -1.238*** 0.044** (0.098) (0.112) (0.019) [0.269] [0.320] [0.038] Syndication link× -0.542*** -0.424*** 0.044*** (0.080) (0.082) (0.017) [0.221] [0.238] [0.035] Indirect link× -0.146 -0.042 0.010 (0.097) (0.103) (0.021) [0.218] [0.295] [0.034] Observations 347,786 347,786 344,573 344,573 344,573 344,573 344,573 Pseudo-R2 0.035 0.140 0.219 0.219 0.219 0.219 0.219 Prob.> chi2 0.000 0.000 0.000 0.000 0.000 0.000 0.000
Year FE Yes Yes Yes Yes Yes Yes Yes
Citation Lag FE Yes Yes Yes Yes Yes Yes Yes
Technology class FE Yes Yes Yes Yes Yes Yes Yes
State FE Yes Yes Yes Yes Yes Yes Yes
Lead VC Firm FE Yes Yes Yes Yes Yes Yes Yes

118
Table 3.5 - Robustness check: excluding the state of California This tables shows results of estimating weighted logistic regressions. The unit of observation is a pair of patents representing an actual or potential citation (control). The dependent variable is an indicator for whether or not the citing patent actually cited the cited patent. The regression model also uses a constant and a set of fixed-effects as indicated below, but these are not reported to conserve space. Robust standard errors are shown in parentheses, and are double clustered at the cited-company and citing-company level. *, **, and *** indicate statistical significance at the 10%, 5% and 1% levels, respectively.
(1) (2) (3) (4) Same class 1.749*** 1.753*** 1.731*** 1.749*** (0.115) (0.115) (0.115) (0.115) [0.190] [0.192] [0.189] [0.190] Same state 0.192** -0.018 0.181* 0.197** (0.093) (0.273) (0.093) (0.092) [0.157] [0.562] [0.156] [0.158] Citation propensity 5.196*** 5.193*** 5.165*** 5.138*** (1.935) (1.948) (1.930) (1.937) [3.274] [3.295] [3.258] [3.252] Geographic distance -0.042*** -0.041*** -0.042*** -0.007 (0.009) (0.009) (0.009) (0.024) [0.014] [0.014] [0.014] [0.037] Technology proximity 4.630*** 4.628*** 4.899*** 4.630*** (0.098) (0.098) (0.134) (0.098) [0.246] [0.244] [0.320] [0.247] Portfolio link 0.595*** 0.605*** 1.180*** 0.765*** (0.096) (0.099) (0.122) (0.122) [0.203] [0.224] [0.288] [0.213] Syndication link 0.470*** 0.436*** 0.473*** 0.520*** (0.073) (0.076) (0.084) (0.103) [0.167] [0.190] [0.233] [0.204] Indirect link 0.271*** 0.248*** 0.425*** 0.330*** (0.078) (0.083) (0.105) (0.118) [0.169] [0.198] [0.222] [0.211] Interactions Same State Tech. proximity Geo. distance Portfolio link× -0.185 -1.084*** -0.075** (0.319) (0.190) (0.030) [0.658] [0.336] [0.041] Syn. link× 0.483 -0.010 -0.022 (0.302) (0.134) (0.026) [0.615] [0.258] [0.039] Indirect link× 0.292 -0.335** -0.026 (0.323) (0.157) (0.035) [0.630] [0.215] [0.042] Observations 124,074 122,586 122,586 122,586 Pseudo-R2 0.051 0.144 0.144 0.208 Prob.> chi2 0.000 0.000 0.000 0.000 Year FE Yes Yes Yes Yes Citation Lag FE Yes Yes Yes Yes
Technology class FE Yes Yes Yes Yes
State FE Yes Yes Yes Yes
Lead VC Firm FE Yes Yes Yes Yes
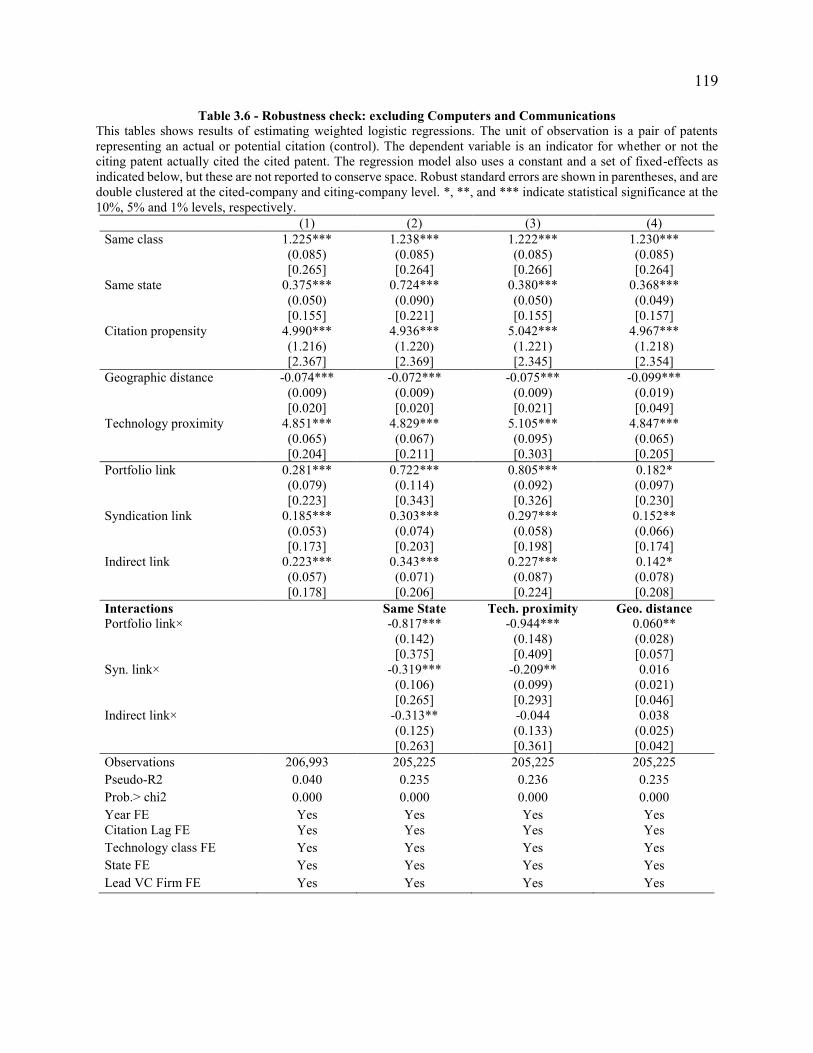
119
Table 3.6 - Robustness check: excluding Computers and Communications This tables shows results of estimating weighted logistic regressions. The unit of observation is a pair of patents representing an actual or potential citation (control). The dependent variable is an indicator for whether or not the citing patent actually cited the cited patent. The regression model also uses a constant and a set of fixed-effects as indicated below, but these are not reported to conserve space. Robust standard errors are shown in parentheses, and are double clustered at the cited-company and citing-company level. *, **, and *** indicate statistical significance at the 10%, 5% and 1% levels, respectively.
(1) (2) (3) (4) Same class 1.225*** 1.238*** 1.222*** 1.230*** (0.085) (0.085) (0.085) (0.085) [0.265] [0.264] [0.266] [0.264] Same state 0.375*** 0.724*** 0.380*** 0.368*** (0.050) (0.090) (0.050) (0.049) [0.155] [0.221] [0.155] [0.157] Citation propensity 4.990*** 4.936*** 5.042*** 4.967*** (1.216) (1.220) (1.221) (1.218) [2.367] [2.369] [2.345] [2.354] Geographic distance -0.074*** -0.072*** -0.075*** -0.099*** (0.009) (0.009) (0.009) (0.019) [0.020] [0.020] [0.021] [0.049] Technology proximity 4.851*** 4.829*** 5.105*** 4.847*** (0.065) (0.067) (0.095) (0.065) [0.204] [0.211] [0.303] [0.205] Portfolio link 0.281*** 0.722*** 0.805*** 0.182* (0.079) (0.114) (0.092) (0.097) [0.223] [0.343] [0.326] [0.230] Syndication link 0.185*** 0.303*** 0.297*** 0.152** (0.053) (0.074) (0.058) (0.066) [0.173] [0.203] [0.198] [0.174] Indirect link 0.223*** 0.343*** 0.227*** 0.142* (0.057) (0.071) (0.087) (0.078) [0.178] [0.206] [0.224] [0.208] Interactions Same State Tech. proximity Geo. distance Portfolio link× -0.817*** -0.944*** 0.060** (0.142) (0.148) (0.028) [0.375] [0.409] [0.057] Syn. link× -0.319*** -0.209** 0.016 (0.106) (0.099) (0.021) [0.265] [0.293] [0.046] Indirect link× -0.313** -0.044 0.038 (0.125) (0.133) (0.025) [0.263] [0.361] [0.042] Observations 206,993 205,225 205,225 205,225
Pseudo-R2 0.040 0.235 0.236 0.235 Prob.> chi2 0.000 0.000 0.000 0.000
Year FE Yes Yes Yes Yes Citation Lag FE Yes Yes Yes Yes
Technology class FE Yes Yes Yes Yes
State FE Yes Yes Yes Yes
Lead VC Firm FE Yes Yes Yes Yes

120
Table 3.7 - Robustness check: excluding top VCs This tables shows results of estimating weighted logistic regressions on the subsample of citations among VC-backed companies not financed by top VCs. Top VCs are those whose investments represent more than 1% of total investments: New Enterprise Associates Inc., Kleiner Perkins Caufield Byers, Oak Investment Partners, U.S. Venture Partners, Mayfield Fund, Accel Partners, Sequoia Capital and Bessemer Venture Partners. The unit of observation is a pair of patents. The dependent variable is an indicator for whether or not the citing patent actually cited the cited patent. The regression model also uses a constant and a set of fixed-effects as indicated below, but these are not reported to conserve space. Robust standard errors are shown in parentheses, and are double clustered at the cited-company and citing-company level. *, **, and *** indicate statistical significance at the 10%, 5% and 1% levels, respectively.
(1) (2) (3) (4) Same class 1.487*** 1.485*** 1.469*** 1.481*** (0.113) (0.114) (0.112) (0.113) [0.238] [0.246] [0.241] [0.240] Same state 0.500*** 0.698*** 0.494*** 0.499*** (0.065) (0.113) (0.065) (0.065) [0.173] [0.339] [0.172] [0.168] Citation propensity 7.888*** 7.888*** 7.921*** 7.930*** (2.004) (2.015) (2.006) (2.013) [3.633] [3.678] [3.655] [3.667] Geographic distance -0.067*** -0.067*** -0.068*** -0.069*** (0.009) (0.009) (0.009) (0.021) [0.015] [0.015] [0.015] [0.033] Technology proximity 4.976*** 4.981*** 5.285*** 4.984*** (0.088) (0.091) (0.123) (0.088) [0.333] [0.342] [0.365] [0.334] Portfolio link 0.232** 0.450*** 0.846*** 0.288** (0.104) (0.129) (0.129) (0.120) [0.267] [0.324] [0.342] [0.282] Syndication link 0.029 0.243*** 0.196*** -0.020 (0.066) (0.084) (0.068) (0.082) [0.220] [0.201] [0.232] [0.257] Indirect link 0.201*** 0.148* 0.265*** 0.279*** (0.061) (0.080) (0.078) (0.086) [0.122] [0.184] [0.202] [0.131] Interactions Same State Tech. proximity Geo. Distance Portfolio link× -0.717*** -1.117*** -0.035 (0.220) (0.230) (0.035) [0.413] [0.468] [0.040] Syn. link× -0.468*** -0.360*** 0.027 (0.125) (0.123) (0.024) [0.380] [0.244] [0.041] Indirect link× 0.240* -0.147 -0.035 (0.128) (0.135) (0.029) [0.250] [0.278] [0.036] Observations 149,000 149,000 149,000 149,000 Pseudo-R2 0.041 0.146 0.149 0.231 Prob> chi2 0.00 0.00 0.00 0.00
Year FE Yes Yes Yes Yes Citation Lag FE Yes Yes Yes Yes Technology class FE Yes Yes Yes Yes State FE Yes Yes Yes Yes Lead VC Firm FE Yes Yes Yes Yes

121
Table 3.8 - Technological convergence in VC networks and turnover of inventors and executives This table shows results of estimating weighted logistic regressions. The unit of observation is a pair of patents representing an actual or potential citation (control). The dependent variable is an indicator for whether or not the citing patent actually cited the cited patent. The regression model also uses a constant and a set of fixed-effects as indicated below, but these are not reported to conserve space. Robust standard errors are shown in parentheses, and are double clustered at the cited-company and citing-company level. *, **, and *** indicate statistical significance at the 10%, 5% and 1% levels, respectively.
(1) (2) (3) (4) Same Class 1.555*** 1.554*** 1.527*** 1.522*** (0.066) (0.066) (0.066) (0.066)
[0.195] [0.197] [0.195] [0.195] Same State 0.311*** 0.314*** 0.320*** 0.314*** (0.037) (0.038) (0.036) (0.036)
[0.115] [0.111] [0.112] [0.114] Citation propensity 5.490*** 5.475*** 5.518*** 5.455*** (1.108) (1.106) (1.093) (1.092)
[1.792] [1.809] [1.787] [1.793] Geographical distance -0.069*** -0.069*** -0.070*** -0.071***
(0.006) (0.006) (0.006) (0.006) [0.013] [0.013] [0.013] [0.013]
Technological closeness 4.575*** 4.579*** 4.735*** 4.746*** (0.058) (0.058) (0.051) (0.052) [0.244] [0.245] [0.209] [0.209] Inventor Turnover 0.336*** 0.602*** (0.042) (0.096)
0.003 -0.357*** Executive Turnover (0.046) (0.090)
[0.110] [0.268] Portfolio link 0.148*** 0.278*** 0.229*** -0.131 (0.055) (0.065) (0.064) (0.101)
[0.175] [0.178] [0.195] [0.318] Syndication link 0.154*** 0.201*** 0.172*** -0.128 (0.042) (0.043) (0.053) (0.092)
[0.153] [0.145] [0.175] [0.305] Incidental link 0.202*** 0.217*** 0.237*** 0.026 (0.046) (0.052) (0.054) (0.088)
[0.121] [0.134] [0.122] [0.197] Interactions Inventor Turnover Executive Turnover Portfolio link× -0.417*** 0.920*** (0.113) (0.144) [0.268] [0.365] Syndication link× -0.266** 0.436*** (0.109) (0.109) [0.368] [0.287] Incidental link× -0.170 -0.050 (0.121) (0.129) [0.254] [0.266] Observations 344,573 344,573 344,573 344,573 Pseudo-R2 0.219 0.219 0.219 0.219 Prob> chi2 0.00 0.00 0.00 0.00 Year FE Yes Yes Yes Yes Citation Lag FE Yes Yes Yes Yes Technology class FE Yes Yes Yes Yes State FE Yes Yes Yes Yes Lead VC Firm FE Yes Yes Yes Yes

122
5 Figures
Figure 2.1 - Estimated temporal trends in citations to patents
The solid lines in the plot correspond to the coefficient estimates of a fixed-effects Poisson model in which the dependent variable corresponds to annual citations to patents, and the explanatory variables are Event Year dummies. I restrict the sample to a [-2,5] year window around the financing event of the issuing company. The 95% confidence interval (corresponding to robust standard errors, clustered at the issuing company level) around these estimates is plotted with dashed lines. The reference period for interpreting the plot is the year of the VC investment (Event Year 0).
0.85
0.90
0.95
1.00
1.05
1.10
1.15
1.20
1.25
1.30
1.35
-2 -1 0 1 2 3 4 5Event Year

123
Figure 2.2 - Patent sale likelihood The figure presents the annual probability that a patent is sold in the two years before, and nine years after a VC invests in the issuing company. The solid line describes patents in my sample, and the dashed line corresponds to matching patents at the technology-class and application- year, and that were not financed by a VC.
0.0%
0.5%
1.0%
1.5%
2.0%
2.5%
3.0%
-2 -1 0 1 2 3 4 5 6 7 8 9
Event Year around the VC investment

124
Figure 2.3 - Exposure Effect of VC investments The figure presents the normalized annual searches made in Google to companies that were first financed by a VC in 2006. To construct the graph, I strip company names of punctuation, capitalization and common acronyms and search for weekly hits in Google Insights since January 2004 until the end of 2011. The solid line corresponds to average annual searches to the normalized names, relative to the total number of searches done on Google over time. The dashed lines correspond to average annual searched to the word “Gold”. Google Insights analyzes only a portion of Google web searches to compute how many searches have been done for the entered terms, relative to the total number of searches done on Google over time. This analysis indicates the likelihood of a random user to search for a particular search term at a certain time. Google Insights designates a certain threshold of traffic for search terms, so that those with low volume won't appear. It also eliminates repeated queries from a single user over a short period of time, so that the level of interest isn't artificially impacted by this type of queries. The information on companies that were first financed by a VC in 2006 is from SDC Thompson.
5
10
15
20
25
30
0
10
20
30
40
50
60
70
80
2004 2005 2006 2007 2008 2009 2010 2011
Gold Companies financed by VCs in 2006

125
Figure 3.1 - Illustration of VC-proximity links

126
Figure 3.2 - Predicted probabilities across geographical distance and VC-proximity This figures plot predicted probabilities. The left panel plots the predicted probabilities of a citation for the different types of VC-proximity links using the basic model with no interaction terms. The right panel plots the predicted probabilities using the model that includes the second order terms of the interactions. The "interaction effect" is interpreted as the distance between the sets of predicted probabilities among the different types of VC-inferred links.

127
Figure 3.3 - Predicted probabilities across technological-proximity and VC-proximity These figures plot predicted probabilities. The first panel plots the average predicted probabilities for the different types of VC-proximity links using the basic model with no interaction terms. The second panel plots the predicted probabilities for the expanded model that includes interactions between the types of VC-proximity links and the technological proximity of companies. The figures to the left (for both panels) present the predicted effects of a transition from a 25th to a 50th percentile in technological proximity between filing companies. The figures to the right (for both panels) present the predicted effects of a transition from a 50th to the 75th percentile in technological proximity between filing companies. Panel A

128 Panel B

129
6 References
Aghion, Philippe, Harris, Christopher, Howitt, Peter and John Vickers, 2001, Competition, Imita-tion and Growth with Step-by-Step Innovation, Review of Economic Studies, 41, 771-782.
Aghion, Philippe., Bloom, Nick, Blundell, Richard, Griffith Rachel, and Peter Howitt, 2005, Com-petition and Innovation: An inverted U Relationship?, Quarterly Journal of Economics, 120(2),701-728.
Aghion,Philippe, Dewatripont, Mathias and Jeremy Stein, 2008, Academic Freedom, Private-Sector Focus and the Process of Innovation, RAND Journal of Economics 39(3), 617-635.
Aghion, Philippe, Van Reenen, John. and Luigi Zingales, 2009, Innovation and Institutional Own-ership, NBER Working Paper, No. 16484.
Agrawal, Ajay K. and Jasgit Singh, 2011, Recruiting for Ideas: How Firms Exploit the PriorInventions of New Hires, Management Science 57(1), 129-150.
Ai, Chunrong and Edward C. Norton, 2003, Interaction Terms in Logit and Probit Models, Eco-nomics Letters, 80, 123-129.
Almeida, Paul and Bruce Kogut, 1999, Localization of Knowledge and the Mobility of Engineersin Regional Networks, Management Science 45(7), 905-917.
Almeida, Heitor, Hsu, Po-Hsuan, and Dongmei Li, 2013, When Less is More: Financial Con-straints and Innovative Efficien y, Working Paper, University of California, San Diego, Availableat SSRN: http://ssrn.com/abstract=1831786.
Almeida, Paul and Bruce Kogut, 1999, Localization of Knowledge and the Mobility of Engineersin Regional Networks, Management Science 45(7), 905-917.
Azoulay, Pierre, Graff Zivin, Joshua S. and Bavan Sampat, 2012, The Diffusion of ScientifiKnowledge Across Time and Space: Evidence from Professional Transitions for the Superstarsof Medicine in Joshua Lerner and Scott Stern ed.: The Rate & Direction of Inventive ActivityRevisited (University of Chicago Press).
Belenzon, Sharon and Tomer Berkovitz, 2010, Innovation in Business Groups, Management Sci-ence 56 (3), 519-535.
Belenzon, Sharon and Mark Schankerman, 2012, Spreading the Word: Geography, Policy andKnowledge Spillovers, The Review of Economics and Statistics (forthcoming)
Belenzon, Sharon, Bolton, Patrick and Ulya Tsolmon, 2013, The Organization of InnovationAcross Countries and Industries, Unpublished Working Paper, Duke University.
Bernstein, Shai, Lerner, Joshua, Sorensen, Morten and Per Stromberg, 2008, Private Equity and In-

130
dustry Performance, Unpublished Harvard Business School Entrepreneurial Management WorkingPaper No. 10-045.
Bernstein, Shai, 2012, Does Going Public Affect Innovation? Unpublished Working Paper, Avail-able at SSRN: http://ssrn.com/abstract=2061441.
Blundell, Richard and James L. Powell, 2004, Endogeneity in Semiparametric Binary ResponseModels, Review of Economic Studies 71, 655–679.
Cameron, A. Colin and Pravin K. Trivedi, 1998, Regression Analysis of Count Data (CambridgeUniversity Press).
Cameron, A. Colin, Gelbach, Jonah B. and Douglas L. Miller, 2011, Robust Inference With Mul-tiway Clustering, Journal of Business and Economic Statistics, 29 (2), 238-249.
Caselli, Stefano, Gatti Stefano and Francesso Perrini, 2009, Are Venture Capitalists a Catalyst forInnovation? European Financial Management 5(1) 92–111.
Chemmanur, Thomas. and Xuan Tian, 2012, Do Anti-takeover Provisions Spur Corporate Innova-tion? Working paper, Boston College and Indiana University, Available at SSRN: http://ssrn.com/abstract=1572219.
Cumming, Douglas and Na Dai, 2010, Local Bias in Venture Capital Investments, Journal ofEmpirical Finance 17, 362-380.
Engel, Dirk and Max Keilbach, 2007, Firm Level Implications of Early Stage Venture CapitalInvestment - An Empirical Investigation, Journal of Empirical Finance 14(2), 150-167.
Gans, Joshua, Murray, Fiona and Scott Stern, 2010, Contracting Over the Disclosure of ScientifiKnowledge: Intellectual Property and Academic Publication, MIT Working Paper, Available at:http://papers.ssrn.com/sol3/papers.cfm?abstract_id=1559871.
Gans, Joshua and Fiona Murray, 2012, Funding Scientifi Knowledge: Selection, Disclosure andthe Public-Private Portfolio in Joshua Lerner and Scott Stern ed.: The Rate & Direction of InventiveActivity Revisited (University of Chicago Press).
Gomes-Casseres, Benjamin, Hagedoom, John and Adam B. Jaffe, 2006, Do Alliances PromoteKnowledge Flows?, Journal of Financial Economics 80 (1), 5-33.
Greene, William H., 2003, Econometric Analysis, 5th edition, (Prentice Hall, Upper Saddle RiverN.J.).
Greene, William H., 2009, Testing Hypotheses About Interaction Terms in Nonlinear Models,Unpublished Working Paper, New York University.
Gompers, Paul A., 1996, Grandstanding in the Venture Capital Industry, Journal of FinancialEconomics 42. 133–156.
Gompers, Paul A., Josh Lerner, and David S. Scharfstein, 2005, Entrepreneurial Spawning: Public

131
Corporations and the Genesis of New Ventures, 1986 to 1999, Journal of Finance, 60 (2), 577-614.
Hall, Bronwyn, Jaffe, Adam B. and Manuel Trajtenberg, 2001, The NBER Patent Citations DataFile: Lessons, Insights and Methodological Tools, NBER Working Paper No. 8498.
Hall, Bronwyn, Jaffe, Adam B. and Manuel Trajtenberg, 2005, Market Value and Patent Citations,RAND Journal of Economics 36(1), 16-38.
Hausman, Jerry, Hall, Bronwyn and Zvi Griliches, 1984, Econometric Models for Count Data withan Application to the Patents - R&D relationship, Econometrica 52, 909-938.
Hellmann, Thomas, 2002, A Theory of Strategic Venture Investing, Journal of Financial Eco-nomics, 64, 285-314.
Hellmann, Thomas and Manju Puri, 2000, The Interaction between Product Market and FinancingStrategy: The Role of Venture Capital, Review of Financial Studies 13(4), 959-984.
Hellmann, Thomas and Manju Puri, 2002, Venture Capital and the Professionalization of Start-UpFirms: Empirical Evidence, Journal of Finance 57(1), 69-197.
Hirukawa, Masayuki andMasako Ueda, 2008, Venture Capital and Industrial Innovation, Availableat: http://papers.ssrn.com/sol3/papers.cfm?abstract_id=1242693
Hochberg, Yael, Ljungqvist, Alexander and Yang Lu, 2007, Whom you Know Matters: VentureCapital Networks and Investment Performance, Journal of Finance 62(1), 251-301.
Hochberg, Yael, 2011, Venture Capital and Corporate Governance in the Newly Public Firm, Re-view of Finance 0, 1-52.
Hochberg, Yael, Lindsey, Laura A. and Mark M. Westerfield 2011, The Formation of Inter-firEconomic Ties: Evidence From Venture Capital, Working paper, Northwestern University.
Hochberg, Yael and Joshua Rauh, 2012, Local Overweighting and Underperformance: Evidencefrom Limited Partner Private Equity Investments, UnpublishedWorking Paper, Available at SSRN:http://ssrn.com/abstract=1798747
Imbens, Guido, and Joshua Angrist, 1994, Identificatio and Estimation of Local Average Treat-ment Effects, Econometrica, 62, 467-475.
Imbens, Guido, 2009, Better LATE Than Nothing: Some Comments on Deaton (2009) and Heck-man and Urzua (2009), Journal of Economic Literature 48(2), 399-423.
Independent Fiduciary Services (IFS), 2002, An Independent Review of the Teacher RetirementSystem Investment Program.
Jaffe, Adam B., 1986, Technological Opportunity and Spillovers of R&D: Evidence from Firms’Patents, Profit and Market Value, American Economic Review 76 (5), 984-1001.

132
Jaffe, Adam B. and Manuel Trajtenberg, 2002, Patents, Citations and Innovations: A Window onthe Knowledge Economy (MIT Press, Cambridge, MA).
Katila, Riitta and Scott Shane, 2005, When does lack of resources make new firm innovative?,Academy of Management Journal,48 (5), 814–829.
Kaplan, Steven N. and Antionette Schoar, 2005, Private Equity Performance: Returns, Persistenceand Capital Flows, Journal of Finance 60, 1791-1823.
Khwaja, Asim I., Mian, Atif R. and Abid Qamar, 2011, Bank Credit and Business Networks, HKSWorking Paper No. RWP11-017.
Kim, Jinyoung and Gerald Marschke, 2005, Labor Mobility of Scientists, Technological Diffusion,and the Firm’s Patenting Decision, RAND Journal of Economics 36(2), 298-317.
Kogut, Bruce, Urso, Pietro and Gordon Walker, 2007, Emergent Properties of a New FinancialMarket: American Venture Capital Syndication, Management Science 53 (7), 1181-1198.
Kortum, Samuel and Joshua Lerner, 2000, Assessing the Contribution of Venture Capital to Inno-vation, RAND Journal of Economics 31(4), 674-692.
Lai, Ronald, D’Amour Alexander, and Lee Fleming, 2009, The Careers and Coauthorship Net-works of U.S. Patent-Holders, since 1975, hdl:1902.1/12367 UNF:5:daJuoNgCZlcYY8RqU+/j2Q==Harvard Business School;Harvard Institute for Quantitative Social Science [Distributor]
La Porta, Rafael, Shleifer, Andrei, Lopez de Silanes, Florencio and Robert Vishny , 1999, Law andFinance, Journal of Political Economy 106(6), 1113-1155.
Lerner, Joshua, 1994, The Syndication of Venture Capital Investments, Financial Management 23,16-27.
Lerner, Joshua 1995, Venture Capital and the Oversight of Private Firms, Journal of Finance 50,301-318.
Lerner, Joshua, 2009, Boulevard of Broken Dreams, (Princeton University Press, Princeton, N.J.).
Lerner, Joshua, Sorensen, Morten. and Per Stromberg, 2011, Private Equity and Long-Run Invest-ment: The Case of Innovation, Journal of Finance 66 (2), 445-477.
Lindsey, Laura, 2008, Blurring Firm Boundaries: The Role of Venture Capital in Strategic Al-liances, Journal of Finance 63 (3), 1137-1168.
Manski, Charles F., and Steven R. Lerman, 1977, The Estimation of Choice Probabilities fromChoice Based Samples, Econometrica 45(8), 1977-88.
Mokyr, Joel, 2003, Thinking about Technology and Institutions. Macalester International: Vol.13, Article 8.

133
Mollica, Marcos A. and Luigi Zingales, 2007, The Impact of Venture Capital on Innovation andthe Creation of New Business, Unpublished Working Paper, University of Chicago.
Nanda, Ramana andMatthew Rhodes-Kropf, 2011, Investment Cycles and Startup Innovation, Un-published HBSWorking Paper No. 12-032, Available at SSRN: http://ssrn.com/ abstract=1950581.
Popov, Alexander and Peter Roosenboom, 2009, Venture Capital and Patented Innovation: Evi-dence from Europe, Economic Policy 27(71), 447-482.
Rajan, Raghuram G., and Luigi Zingales, 1998, Financial Dependence and Growth, AmericanEconomic Review , 88 (3), 559-586.
Schoar, Antoinette, 2002, The Effect of Diversificatio on Firm Productivity, Journal of Finance62 (6), 2379-2403.
Seru, Amit, 2012, Firm Boundaries Matter:Evidence from Conglomerates and R&DActivity, Jour-nal of Financial Economics (forthcoming).
Serrano, Carlos, 2010, The Dynamics of the Transfer and Renewal of Patents, RAND Journal ofEconomics, 41(4), 686-708.
Singh, Jasgit, 2005, Collaborative Networks as Determinants of Knowledge Diffusion Patterns,Management Science 51(5) 756-770.
Singh, Jasgit and Matt Marx, 2013, Geographic Constraints on Knowledge Spillovers: PoliticalBorders vs. Spatial Proximity, Management Science (forthcoming).
Snell, Ronald K. and Susan Wolfe, 1990, Public Pension Funds’ Investment Practices, LegislativeFinance Paper #72, National Conference of State Legislatures.
Sorensen, Morten, 2007, How Smart is Smart Money? A Two-sided Matching Model of VentureCapital, Journal of Finance 62(6) 2725-2762.
Sorenson, Olav and Toby E. Stuart, 2001, Syndication Networks and the Spatial Distribution ofVenture Capital Investments, American Journal of Sociology 106(6), 1546-1588.
Stock, James and Motohiro Yogo, 2005, Testing for Weak Instruments in Linear IV Regressionin James Stock and Donald Andrews ed.: Identificatio and Inference for Econometric Models:Essays in Honor of Thomas J. Rothenberg (Cambridge University Press).
Stoyanov, Andrey and Nikolay Zubanov, 2012, Productivity Spillovers Across Firms throughWorker Mobility, American Economic Journal: Applied Economics 4(2), 168-198.
Stuck, Bart and Michael Weingarten, 2005, How Venture Capital Thwarts Innovation and IPOInnovation Rankings, IEEE Spectrum, April, 50-55.
Thompson, Peter, 2006, Patent Citations and the Geography of Knowledge Spillovers: Evidencefrom Inventor- and Examiner-Added Citations, Review of Economics and Statistics, 88(2) 383-389.

134
Townsend, Richard, 2013, Propagation of Financial Shocks: The Case of Venture Capital, Unpub-lishedWorking Paper, Available at: http://papers.ssrn.com/sol3/papers.cfm? abstract_id=2021301.
Williams, Heidi, 2011, Intellectual Property Rights and Innovation: Evidence from the HumanGenome, NBER Working Paper 16213.
Windmeijer, Frank, 2000, Moment Conditions for Fixed Effects Count Data Models with Endoge-nous Regressors, Economic Letters 68, 21-24.
Wooldridge, Jeffrey M., 1997, Multiplicative Panel Data Models Without the Strict ExogeneityAssumption, Economic Theory 13, 667-678.
Wooldridge, Jeffrey M., 1999, Distribution-Free Estimation of Some Nonlinear Panel Data Mod-els, Journal of Econometrics 90, 77-97.

135
7 Appendix: Construction of Dataset
My starting point is the universe of transactions registered in VentureXpert that closed between
January 1976 and December 2009. I eliminate four types of investments. First, VentureXpert
contains transactions by private equity groups other than independent Venture Capital firm such
as angel groups, bank affiliate firms corporate venture capital firms endowment foundations,
pension funds, government affiliate programs, incubator development programs, individuals, in-
surance fir affiliate and investment management firms While these transactions are part of the
financia landscape for companies, they are not the focus of this study; hence, I eliminate them
from the sample. Second, the data contain transactions by VC firm that are not focused on ven-
ture capital, such as buyout funds and funds of funds, and I eliminate these deals as well. I also
remove investments by VC firm in companies that were already traded in public markets before
the transaction (called PIPEs), and secondary purchases. Finally, I only include investments made
by U.S. VC firm in U.S. companies. After these eliminations, the data contain 116,574 invest-
ments made to 20,058 U.S. based companies. After these eliminations, the data contain 116,574
investments made to 20,058 U.S. based companies.
7.1 Capturing patent data
I match the companies involved in VC transactions to their patent records based on name. To
do so, I employ the Harvard Business School (HBS) patent database. The HBS data contain all
electronic records of the U.S. Patent and Trademark Offic (USPTO) through December 2008,
which have been cleaned and consolidated by HBS.1 The patent database also has information
on all citations made and received by patents as well as information on the inventors. I restrict
my sample to primary assignments of utility patents (99%) awarded to US companies from 1976
1The database is documented in Lai, D’Amour, and Fleming (2009).

136
onwards. After these restrictions the sample consists of 2,881,097 patents, awarded to 1,980,696
inventors, and issued to 242,767 U.S. assignees.2 The total number of citations made and received
by these patents is 22,511,338.
In order to combine the two databases, I strip company names from VentureXpert, and assignee
names from the HBS database, of punctuation, capitalization and common acronyms. I then match
the samples on the normalized company and assignee names using a fuzzy-match procedure based
on the Levenshtein edit distance. The Levenshtein edit distance is a measure of the degree of prox-
imity between two strings, and corresponds to the number of substitutions, deletions or insertions
needed to transform one string into the other one (and vice versa).3 I assign a score for each match
as a function of the Levenshtein edit distance and the length of each of the normalized company
names in the match. Using a random sampling procedure, I determine a score threshold such that
matches with scores above the threshold are hand checked, and those below the threshold are elim-
inated. During the manual check of the remaining matches, I check that the two companies are
in the same state. There are ambiguous situations where the names are similar, but not exactly
identical, or where the location of the patentee differs from that given in the records of SDC. In
these cases, I research the potential matches using web searches. Finally, in some cases, there are
multiple names in either of the bases that appear to match a single name in the other data set. For
these, I add the observations into an aggregated entity.
7.2 Sample
In total, I identify 5,018 companies that are VC-backed and with at least one U.S. utility patent
grant. The total number of patents awarded to these companies from January 1976 to December
2The assignee of a patent is the individual or entity that owns the patent.
3For more information and an application to Perl see Text::LevenshteinXS in CPAN.

137
2008 is 105,484 patents. The total number of inventors in the sample is 74,666 inventors, and the
total number citations made and received by these patents is 1,200,190. The total number of VC
firm that invest in these companies is 1,383 with 41,401 investments in the companies.
The small number of matches between the two data sets likely reflect two facts. First, in many
instances, specially more recently, the companies that are VC-backed belong to sectors in which
IP is not usually protected using patents (e.g. internet, media, and software companies), and in
which there is greater reliance on trade secrets to protect it. Second, VentureXpert includes data
on all companies that received VC financing including those that were not ultimately successful,
and which may not have reached a stage in which IP should be protected.
Note that the 105,484 patents assigned to VC-backed companies correspond to less that 4% of
U.S. patent stock. This stands to contrast with existing estimates from the venture capital literature
on the patent stock of patents attributed to venture capital funds. For example, Kortum and Lerner
(2000) analyze annual data from twenty manufacturing industries. The dependent variables is
U.S. patents issued to U.S. inventors by industry and date of application. The main explanatory
variables are measures of venture funding collected by Venture Economics. The authors estimate
a patent production function and estimate the impact on patenting that a dollar of venture capital
has relative to a dollar of R.&D on industrial patent production. Using a back-of-the-envelope
calculation of their findings the author estimate that venture capital funds have accounted for
approximately 14% of industrial patent production. More recent studies by Hirukawa and Ueda
(2011) confir the order of magnitude of this estimate. The difference between these macro-based
estimates, and my micro-based quantification suggests that VCs generate knowledge spillovers,
and that their role on innovation goes above and beyond financin the patents of their targets.
Before I discuss summary statistics of the matched sample, a couple of points need to be clarifie
regarding institutional arrangement of patent data. There are two relevant dates associated with
each patent: application and grant date. The application date marks the officia date in which the
inventor submitted the patent application to the USPTO office The grant date is the date in which

138
the patent was issued to the inventor. For patents applied for before October 2000, their content was
made public the firs Tuesday after grant date in the USPTO’s officia magazine. For patents applied
for after October 2000, the American Inventor Protection Act (enacted on November 29 1999)
specifie they are to be disclosed 18 months after application. Nevertheless, citations to patents
start as early as the application year, which can be partially explained by technical disclosures, or
diffusion of new technologies via conferences or connections among agents.
7.3 Summary Statistics
Table A.1 presents summary statistics of the matched sample. Panel A shows an apparent
decrease in patent applications by VC-backed companies starting on 2002. The reason for this
decrease is the well documented lag between the application and the grant of a patent by the
USPTO office
For patents issued after 1976 and granted to any (VC-backed) patentee by 2008, the lag is 2.30
(2.75) years. The difference in the lag between Non VC- and VC-backed assignees is not sig-
nificant Panel A also shows an apparent decrease in the number of investments by VC-backed
companies. This decrease is due in part to the expansion of investments in sectors such as internet
and media that do not generally rely on patent protection, and not to a real decrease in the number
of total investments by VCs. Panel B exhibits the distribution of patents and VC-backed companies
that patent by state. As it is common in the VC literature, the sample is concentrated in Califor-
nia, Massachusetts, Washington and Texas. Panel C shows the distribution of type of firs time
investments by VC firm on companies that patent. The types of investments include traditional
VC investments such as: Bridge Loans, Early Stage, Expansion, Later Stage and Seed. Panel D
shows the distribution of companies that patent by industry, according to the industry classificatio
from SDC. The data is concentrated in Medical Health, Semiconductors and Computer Software.
Panel E shows distribution of VC-backed companies that patent by type of VC exit. Approximately

139
50% of companies have a successful exit, either through an IPO or acquisition. Finally, Panel F
lists the companies that have a disproportionate share of patents in my sample (more than 1% of
the sample). This group of companies includes well known successful examples of VC-backed
investments such as Sun Microsystems, Intel and Microsoft.
Table A.2 compares patents from VC-backed companies and patents issued to Non VC-backed
assignees. Panel A shows that patents assigned to VC-backed companies receive more citations
three years following the grant date. This is true for both citations made by the same assignee
(self-citations) and citations made by other assignees (no self citations).
The generality measure is an statistic used in the innovation literature to describe patents, and is
constructed using information on the citations received by patents. A patent has a higher generality,
if it is cited by subsequent patents that belong to a wide range of technology classes. Thus, a high
generality score suggests the patent presumably had a widespread impact, in that it influence
subsequent innovations in a variety of fields The generality measure corresponds to one minus
the Herfindah index of the technology classes of the citing patents. Panel B, shows that patents
assigned to VC-backed companies have higher generality measures three years following the grant
date.
The originality measure is an additional statistic used in the innovation literature to describe
patents, and is constructed using information on the citations made by patents. A patent has a
higher originality, if it cites patents that belong to a wide range of technology classes. The intuition
is that patents that combine existing knowledge from few technology classes to create something
new (and useful), probably constitute more marginal improvements relative to patents that combine
more ex-ante different ideas. This measure is constructed as one minus the Herfindah index of the
cited patents across technological classifications Panel C shows that VC-backed patents are on
average more original.

140
8 Tables Appendix
Table A1 - Summary statistics of matched sample The matched full sample consists of 105,484 patents awarded between 1976 and December 2008 to 5,018 companies that were financed by at least one U.S. VC firm during 1976 to 2009. Panel A. Application and grant years of patents issued by VC-backed companies and total number of VC-backed companies by year of first VC transaction Patents Companies
Applications Grants Number Percentage 1976 247 3
20 0.4
1977 243 113
24 0.48 1978 258 225
29 0.58
1979 260 182
37 0.74 1980 246 232
77 1.53
1981 340 229
139 2.77 1982 348 217
113 2.25
1983 421 251
123 2.45 1984 518 369
138 2.75
1985 570 397
111 2.21 1986 696 463
103 2.05
1987 860 671
122 2.43 1988 1,007 699
112 2.23
1989 1,162 1,009
147 2.93 1990 1,321 976
100 1.99
1991 1,581 1,057
60 1.2 1992 1,939 1,325
77 1.53
1993 2,309 1,562
91 1.81 1994 3,166 1,814
95 1.89
1995 5,130 2,104
175 3.49 1996 5,405 2,689
214 4.26
1997 7,000 3,287
247 4.92 1998 7,354 5,288
295 5.88
1999 8,208 5,767
333 6.64 2000 9,825 6,433
497 9.9
2001 10,537 6,891
308 6.14 2002 10,583 7,424
245 4.88
2003 8,133 8,236
242 4.82 2004 7,379 7,961
236 4.7
2005 5,338 7,498
180 3.59 2006 2,430 10,139
134 2.67
2007 643 9,906
102 2.03 2008 27 10,067
67 1.34
2009
25 0.5 Total 105,484 105,484 5,018

141 Panel B. Distribution of Patents and VC-backed companies by state Patents Companies
Number Percentage Number Percentage
AL 309 0.29 10 0.2 AR 1 0 1 0.02 AZ 562 0.53 47 0.94 CA 59,644 56.54 2,226 44.36 CO 1,275 1.21 137 2.73 CT 796 0.75 84 1.67 DC 72 0.07 8 0.16 DE 36 0.03 2 0.04 FL 674 0.64 75 1.49 GA 469 0.44 88 1.75 HI 6 0.01 2 0.04 IA 25 0.02 9 0.18 ID 58 0.05 7 0.14 IL 671 0.64 97 1.93 IN 332 0.31 15 0.3 KS 14 0.01 8 0.16 KY 11 0.01 4 0.08 LA 29 0.03 6 0.12 MA 9,469 8.98 643 12.81 MD 939 0.89 106 2.11 ME 13 0.01 3 0.06 MI 303 0.29 43 0.86 MN 2,713 2.57 91 1.81 MO 157 0.15 23 0.46 MS 16 0.02 5 0.1 MT 5 0 1 0.02 NC 882 0.84 80 1.59 ND 6 0.01 1 0.02 NE 20 0.02 3 0.06 NH 492 0.47 49 0.98 NJ 1,198 1.14 129 2.57 NM 52 0.05 14 0.28 NV 67 0.06 9 0.18 NY 1,905 1.81 146 2.91 OH 538 0.51 62 1.24 OK 63 0.06 10 0.2 OR 523 0.5 55 1.1 PA 2,370 2.25 155 3.09 RI 54 0.05 12 0.24 SC 19 0.02 6 0.12 SD 4 0 1 0.02 TN 164 0.16 21 0.42 TX 6,206 5.88 243 4.84 UT 204 0.19 33 0.66 VA 483 0.46 69 1.38 VT 26 0.02 3 0.06 WA 11,242 10.66 144 2.87 WI 359 0.34 28 0.56 WV 2 0 2 0.04 WY 6 0.01 2 0.04 Total 105,484 5,018

142 Panel C. Distribution of type of investment by VC firms in companies that patent Type of Investment Number of deals Percentage of sample Bridge Loan 85 1.69 Early Stage 1,917 38.2 Expansion 1,269 25.29 Later Stage 350 6.97 Seed 1,397 27.84 Total 5,018 Panel D. Industry distribution of VC investments in companies that patent
Number of companies Percentage of sample
Biotechnology 495 9.86 Communications and Media 554 11.04 Computer Hardware 446 8.89 Computer Software 819 16.32 Consumer Related 101 2.01 Industrial Energy 400 7.97 Internet Specific 425 8.47 Medical Health 842 16.78 Other Products 131 2.61 Semiconductors 805 16.04 Total 5,018 Panel E. Distribution of VC-backed companies with prior patents by type of VC exit
Number of companies Percentage of sample
Acquisition 1,722 34.32 Active 1,537 30.63 Bankruptcy - Chapter 11 23 0.46 Bankruptcy - Chapter 7 38 0.76 Defunct 726 14.47 In Registration 20 0.4 LBO 37 0.74 Merger 82 1.63 Other 20 0.4 Pending Acquisition 7 0.14 Went Public 806 16.06 Total 5,018

143
Table A2 – Comparison Patents from VC-backed versus Non VC-backed patents
The full matched sample consists of 105,484 patents awarded through December 2008 to 5,018 companies that received VC backing between 1976 and 2009Panel B, presents citation counts 3 years following the grant date, and excludes from the analysis patents granted after 2005. Panel C, presents Generality measures using the USPTO technological classification and the Hall bias correction (Hall, et al. 2001). Panel D, presents Generality measures for citations 3 years following the grant date. Panel E, presents Originality measures. See Appendix 1 for a detailed definition of the variables.
Panel A. Total Citations, Self-citations and No-self citations until 3 years after grant date
Three-year Citations Three-year Self
Citations Three-year No Self
Citations Mean S.D. Med. Mean S.D. Med. Mean S.D. Med. Obs. VC-backed 7.4 13.79 3 1.23 4.15 0
6.17 12.22 2
95,110
Non VC-backed 3.32 6.56 1 0.53 1.91 0
2.79 5.95 1
2,652,052
p-value t-test 0.00 0.00 0.00
Panel B. Generality, Self Generality and No-self generality until 3 years after grant date Three-year Generality Three-year No Self Generality Mean S.D. Med. Obs. Mean S.D. Med. Obs. VC-backed 0.40 0.28 0.48 64,946 0.39 0.29 0.47 61,648 Non VC-backed 0.28 0.28 0.28 1,734,688 0.26 0.28 0.17 1,605,061 p-value t-test 0.00 0.00 Panel C. Originality Originality Originality Adjusted Mean S. D. Med. Obs. Mean S. D. Med. Obs. VC-backed 0.455 0.283 0.5 105,484 0.56 0.31 0.50
99,551
Non VC-backed 0.305 0.293 0.32 2,775,613 0.436 0.37 0.32
2,451,091 p-value t-test 0.00 0.00