vi. anemone and corallimorpharian distribution and abundance
TRANSCRIPT

2011 Quick Look Report: Miller et al.
- 161 -
VI. Anemone and Corallimorpharian Distribution and Abundance
Background
The Florida Keys has a long history of commercial and recreational fisheries exploitation of an incredible
diversity of invertebrates and fishes (Bohnsack et al. 1994). A portion of this effort is represented by
commercial marine-life fisheries and aquarium hobbyists. Otherwise known as the marine ornamental
fishery, aquarium fisheries from West Palm Beach to Key West target many fish, invertebrate, and algal
species, in addition to sand and live rock (FWCC 2001). State and Federal waters near Key West and
Marathon in the Florida Keys constitute 94% of the total fishes and invertebrates removed in southeast
Florida for the marine aquarium trade. Commercial data do not include an undocumented effort from
recreational fishers, nor are data available concerning species abundance patterns and population trends
relative to fishing effort (NOAA 1996). Key Largo has been protected from marine aquarium trade
species collection since 1960 in John Pennekamp Coral Reef State Park, followed by the protection in
federal waters in 1975 with the establishment of Key Largo National Marine Sanctuary (now known as
the Key Largo Management Area). The Looe Key area has been protected since 1981, as well as
Everglades National Park (Florida Bay), portions of the Dry Tortugas area, Biscayne National Park, and
Fish and Wildlife Service management areas.
The paucity of basic ecological information for most Florida Keys anemone and corallimorpharian
(Cnidaria, Anthozoa) species persists, with even fewer studies reporting on the effects of populations
under exploitation. During 2011, we continued a time series dating back to 1999 that quantifies the habitat
distribution and abundance patterns of selected actinians (O. Actiniaria) and corallimorpharians (O.
Corallimorpharia) in the Florida Keys in relation to habitat type and management zone (i.e. inside and
outside of no-take zones). Besides general Caribbean field guides (e.g. Sefton and Webster 1986; Kaplan
1988; Humann 1992) and isolated distribution studies (Voss and Voss 1955; Wheaton and Jaap 1988;
reviewed in Levy et al. 1996), our program represents the only large-scale concerted effort to quantify
distribution and abundance patterns over large areas of hard-bottom and coral reef habitat in the Florida
Keys. The ecological importance of these organisms is best exemplified by the many anemones that form
associations with several invertebrates such as cleaner shrimps (Limbaugh et al. 1961; Shick 1991) and
provide refuge for smaller reef fishes (Hanlon and Kaufman 1976; Colin and Heiser 1973). Some of these
associations, such as cleaning stations, provide a valuable function to reef fishes (Herrnkind et al. 1976;
Sluka et al. 1999) and the large-scale removal of certain species may have important, but as of yet,
undocumented effects on other biota. The establishment of the Florida Keys National Marine Sanctuary
(FKNMS) in 1990 and the subsequent designation of 23 no-fishing zones in 1997 afford the opportunity
to evaluate the effects of exploitation for a variety of species, including those targeted by the marine

2011 Quick Look Report: Miller et al.
- 162 -
aquarium fishery (Bohnsack 1997). These data provide a means from which to measure the responses of
organisms to protection from exploitation. The results presented below only consider differences in
distribution and density among habitats and FKNMS no-take zones. Subsequent analyses will consider
differences inside and outside of other management zones that have a much longer history of protection
from marine aquarium collection.
Quantitative surveys in the upper Florida Keys during May-September 2011 targeted anemones (O.
Actiniaria) and corallimorpharians (O. Corallimorpharia) known or suspected to occur in the Florida
Keys, and focused on the larger and conspicuous or field-identifiable members of both orders. Similar
surveys were conducted in the study area during 1999-2001 (211 sites), 2005 (195 sites), 2008 (145 sites),
2009 (160 sites), and 2010 (120 sites), as well as in the Dry Tortugas region during 2000, 2006, and 2008
(see previous Quick Look Reports at http://people.uncw.edu/millers). Three anemone species were
recorded during 2011 (classification according to Cairns et al. 1991), all of which tend to have solitary
and larger polyps compared to other cnidarians: the giant Caribbean or pink-tipped anemone Condylactis
gigantea in the Family Actiniidae, the ringed or corkscrew anemone Bartholomea annulata in the Family
Aiptasiidae, and Lebrunia danae in the Family Aliciidae. Although surveyed in previous years, we did
not encounter the speckled anemone Epicystes (=Phymanthus) crucifera in the Family Phymanthidae,
Bunodosoma granuliferum in the Family Actiniidae, the knobby anemone (Heteractis lucida), or the
Caribbean sun anemone Stichodactyla (=Stoichactis) helianthus. Corallimorpharians, sometimes called
false corals, differ from anemones in the arrangement of the tentacles, and may be solitary, but are
typically found in clusters. Three corallimorpharian species were encountered during 2011: Discosoma
(=Paradiscosoma) carlgreni and D. sanctithomae in the Family Actinodiscidae and Ricordea florida in
the Family Corallimorpharidae.
2011 Survey Results
Anemones
Three anemone species representing 595 individuals were recorded from the 280 upper Florida Keys sites
in 2011 (Figure 6-1). The five anemone species were represented by: Bartholomea annulata (480
individuals, 81% of all anemones), Condylactis gigantea (83 individuals, 13.9%), and Lebrunia danae
(32 individuals, 5.4%). Bunodosoma granuliferum, Epicystis crucifera, Heteractis lucida, and
Stichodactyla helianthus were searched for, but not encountered during 2011. Overall, 77% of the
surveyed sites yielded anemones from 30 m2 search areas per site. Site presence of all species combined
2011 Quick Look Report: Miller et al.
- 163 -
was greatest on offshore patch reefs (90%) and mid-channel patch reefs (82%) and lowest in back reef
rubble (22%). The species richness of anemones (total species encountered per 30 m2) followed a similar
pattern. For all species combined, there were no consistent patterns in site presence or species richness.
For both metrics, reference areas yielded greater values for mid-channel patch reefs, high-relief spur and
groove, and deep fore-reef habitats, but not for the remaining habitats.
Bartholomea annulata (corkscrew anemone) (Lesueur)
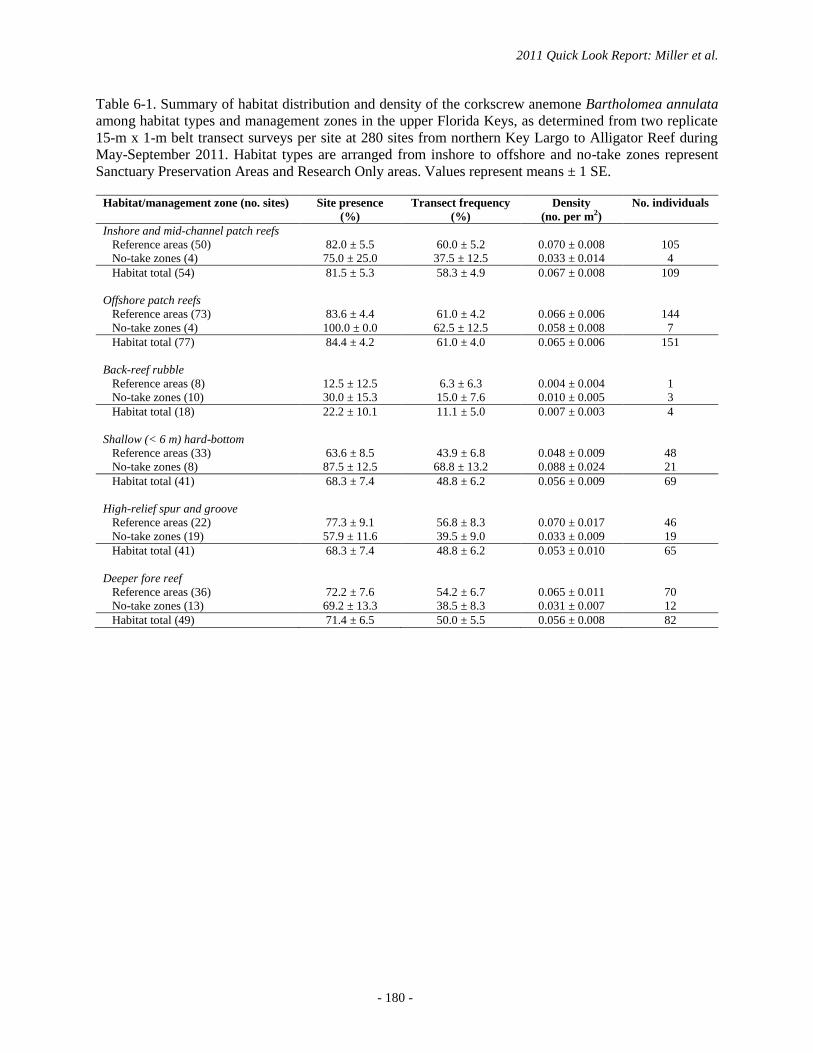
As in previous years, the corkscrew anemone (Bartholomea annulata) was the most abundant and wide-
ranging anemone that we surveyed, with individuals recorded from 73% of the 280 sites and within 52%
of the sampled transects. B. annulata was distributed among all of the cross-shelf habitats sampled in the
upper Florida Keys (Table 6-1). Site-level densities were as high as 0.300 ± 0.167 individuals per m2,
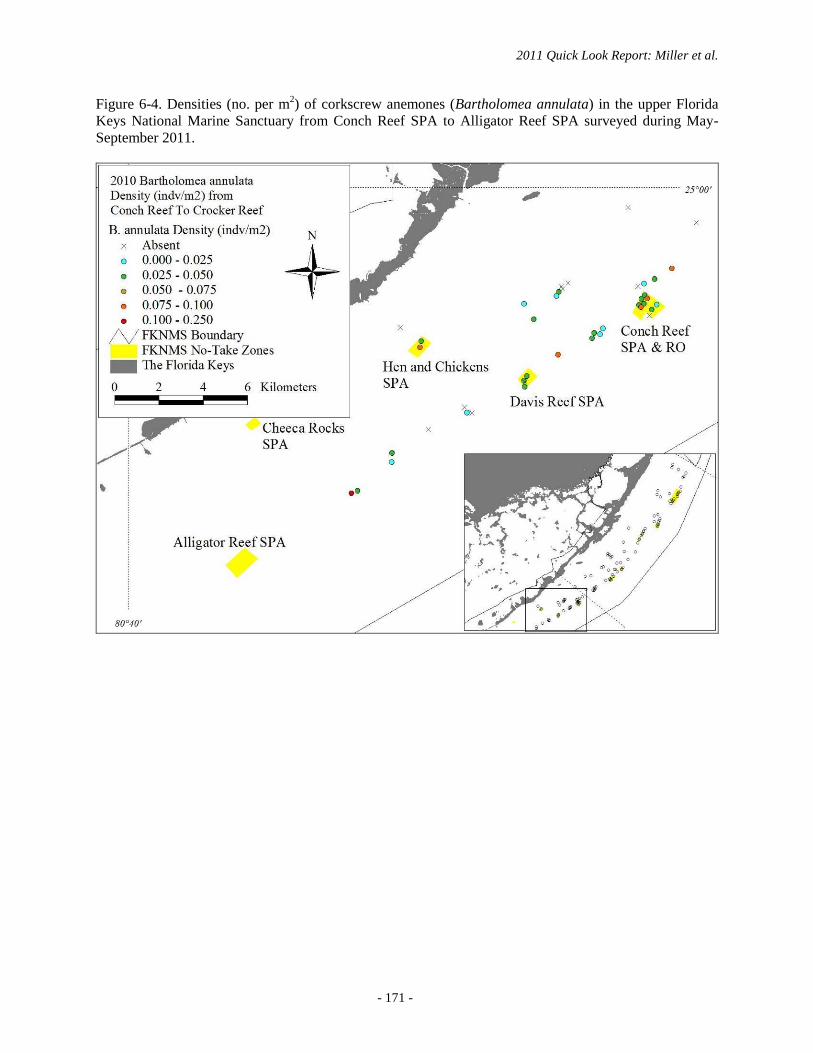
with the greatest density recorded from an inner line reef tract site north of Grecian Rocks. Figures 6-2 to
6-4 show the spatial distribution of B. annulata densities across the upper Florida Keys study area. Site
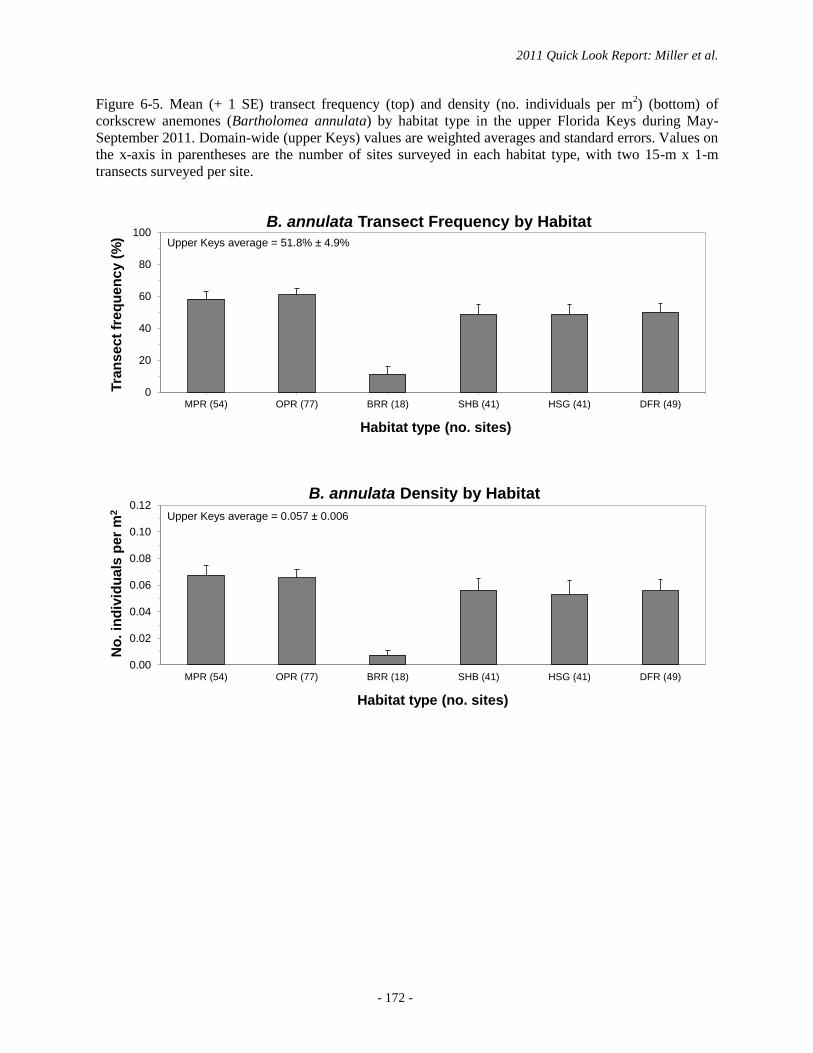
presence, transect frequency, and density were greater on mid-channel and offshore patch reefs and
lowest in back-reef rubble sites (Figure 6-5). Among habitats sampled, there was no consistent pattern in
site presence or transect frequency of corkscrew anemones between no-take zones and reference areas
(Table 6-1 and Figure 6-6). However, overall mean densities were greater in reference areas compared to
no-take zones for four of the six major habitats sampled, particularly inshore and mid-channel patch reefs,
high-relief spur and groove, and deeper fore-reef habitats (Table 6-1). In contrast, no-take zones yielded
greater overall mean densities in the shallow hard-bottom habitat.
Condylactis gigantea (giant Caribbean anemone) (Weinland)
Similar to previous surveys dating back to 1999, the site presence, transect frequency, and density of the
giant Caribbean anemone (Condylactis gigantea) were relatively low in 2011 for the upper Keys habitats
surveyed (Table 6-2). A total of 83 individuals were found among the 280 sites, with individuals present
at 18.6% of all sites and within 11.1% of the sampled transects. A maximum site-level density of 0.200 ±
0.133 individuals per m2 was recorded from a mid-channel patch reef south of the Basin Hill Shoals area.
Proportional site presence, transect frequency, and density were greatest on offshore patch reefs, followed
by shallow hard-bottom and mid-channel patch reef habitats (Table 6-2). For four of the six habitats, C.
gigantea were more common and occurred in greater densities in no-take zones compared to reference
areas.

2011 Quick Look Report: Miller et al.
- 164 -
Lebrunia danae (Duchassaing and Michelotti)
The branching anemone Lebrunia danae was the least common anemone recorded (32 individuals) in the
upper Keys during 2011, but was distributed among all habitats except back-reef rubble (Table 6-3). Site
presence, transect frequency, and density were greater on inshore and mid-channel patch reefs, followed
by offshore patch reefs, high-relief spur and groove, and the deeper fore reef.
Corallimorpharians
A total of 820 corallimorpharians representing three species were recorded from 280 sites: Discosoma
carlgreni (9 individuals, 1.1%), D. sanctithomae (23 individuals, 2.8%), and Ricordea florida (788
individuals, 96.1%) (Figure 6-7). Tables 6-4 to 6-6 provide summary values for site presence, transect
frequency, and density by habitat and management zone for each species. Corallimorpharians were
recorded from 15% of all sites surveyed and 17% of sampled belt transects. Among habitats for all
species combined, corallimorpharians were more frequently encountered on offshore patch reefs (23.4%
of sites) and high-relief spur and groove (29.3%). Back-reef rubble was the only habitat type sampled
where corallimorpharians were not encountered. Similar to anemones, there were no consistent patterns
for site presence and transect frequency between no-take zones and reference areas for all
corallimorpharian species combined. For example, these metrics were greater on reference mid-channel
patch reef and high-relief spur and groove, but not for offshore patch reef and shallow hard-bottom
habitats.
Discosoma carlgreni (Watzl)
The forked-tentacle corallimorpharian, Discosoma carlgreni, was only found on offshore patch reefs (3
out of 77 total sites), with a maximum site-level density of 0.133 ± 0.133 individuals per m2 (Table 6-4).
Although we have documented aggregations (10-20 individuals) in other areas of the Florida Keys, this
corallimorpharian continues to be relatively rare in the upper Keys.
Discosoma sanctithomae (Duchassaing and Michelotti)
The warty corallimorpharian, Discosoma sanctithomae, similar to its congener, was rarely encountered in
the upper Keys during 2011, with only 23 individuals recorded among three habitat types (Table 6-5). All
2011 Quick Look Report: Miller et al.
- 165 -
but four of the individuals were recorded from inshore and mid-channel patch reefs (2 out of 54 sites),
and most were recorded from one patch reef site.
Ricordea florida Duchassaing and Michelotti
The Florida corallimorpharian, Ricordea florida, was the most common and widely distributed
corallimorpharian in the upper Keys during 2011 (Figures 6-8 to 6-10), with 788 individuals recorded
from all 280 sites combined. R. florida was found in all habitats except back-reef rubble (Table 6-6). The
greatest site-level mean density (9.83 ± 2.70 per m2) was recorded from a mid-channel patch reef
northeast of Cannon Patch Reef. Similar to previous years, most individuals were encountered on mid-
channel and offshore patch reefs (Figure 6-11), especially in reference areas outside of FKNMS no-take
zones (Figure 6-12). Site presence and transect frequency were greatest on offshore patch reefs and high-
relief spur and groove (Figure 6-11), while mean densities were greatest on mid-channel patch reefs; the
latter result reflects a large (295 individuals) aggregation found on one patch reef site northeast of Cannon
Patch. Site presence and transect frequency were not consistent between reference areas and no-take
zones by habitat type, although overall mean densities were greater for reference areas for three of the
habitats where R. florida was the most abundant (Figure 6-12).
Discussion
While numerous studies address the life history characteristics of anemones and corallimorpharians,
including feeding behavior (Bursey and Guanciale 1977; Bursey and Harmer 1979; Elliot and Cook
1989), reproduction (Jennison 1981), and associations with other fauna (Limbaugh et al. 1961; Colin and
Heiser 1973; Hanlon and Kaufman 1976), studies that describe or quantify habitat distribution and
abundance in the Florida Keys are limited. Nine actinian species are common in the Caribbean; of these,
seven are planktivores, while the two larger species (Condylactis gigantea and Stichodactyla helianthus)
can eat macroscopic prey such as gastropods and echinoids (Van-Praët 1985). Several field guidebooks
provide qualitative descriptions of habitat occurrence, biogeographic distribution, and taxonomic
characters (Voss 1976; Kaplan 1988; Humann 1992), but with the exception of one quantitative study of
benthic cnidarians at Looe Key, in which Ricordea florida was included (Wheaton and Jaap 1988), the
data collected by our program represent the only large-scale assessments of habitat distribution and
abundance of actinians and corallimorpharians on Florida Keys ocean-side habitats dating back over a
decade. Levy et al. (1996) reviewed Florida Keys invertebrate inventories as of 1995 and found only three
publications (e.g. Voss and Voss 1955; Voss et al. 1969) that discussed abundance and habitat
distribution of these organisms.

2011 Quick Look Report: Miller et al.
- 166 -
The 2011 upper Florida Keys survey results indicate that, with the exception of the corallimorpharian
Ricordea florida on some mid-channel and offshore patch reefs, mean densities of the anemones and
corallimorpharians sampled were usually below one individual per 100 m2 for the habitats sampled. All
but one of the three actinians and one of the three corallimorpharians species were rare and/or exhibited
limited habitat distribution. The more commonly encountered species exhibited different density and
distribution patterns. B. annulata was the most frequently encountered anemone and generally had similar
densities among most habitats, while Condylactis gigantea and Lebrunia danae were more common on
patch reefs. The most abundant corallimorpharian, R. florida, was most abundant on mid-channel and
offshore patch reefs.
Conclusions from the 2011 surveys are confined because of poor life history knowledge and the paucity
of historical abundance data for anemones and corallimorpharians. Interpretation of density patterns is
further complicated because of the possibility that large numbers of these organisms are removed from
the Florida Keys by commercial and private collectors. However, surveys dating back to 1999 confirm, at
least for an 11-year period, consistent patterns in habitat-based patterns of abundance. It is also possible
that locations not sampled by our program, including nearshore hard-bottom and seagrass beds (ocean-
side and bay-side), mangrove channels, and tidal channels into Florida Bay, comprise important habitat
types for various anemones and corallimorpharians. We did not sample any soft-sediment communities
such as seagrass beds, and it is well known that some of the actinians (e.g. Bartholomea annulata and
Condylactis gigantea) form relatively large aggregations in these habitats. Subsequent analyses will
compare distribution and abundance patterns for John Pennekamp Coral Reef State Park (protected since
1960) and the Key Largo Management Area (protected since 1975), which contain six of the FKNMS no-
take zones (established in 1997), to areas further south with a longer history of exploitation for marine life
species. To our knowledge, no other studies are looking at this group or other cnidarians inside and
outside of no-take zones in the FKNMS.
Certain aspects of cnidarian life history have implications for fisheries management. For example,
recruitment of sexually produced planula into natural populations of sea anemones seems rare, and it
appears that most anemones studied (see review in Shick 1991) have great longevity of adults, low and
sporadic larval recruitment, and high juvenile mortality. Asexual reproduction, especially for
corallimorpharians, appears to be very important for maintenance of local aggregations if recruitment is
successful (Elliot and Cook 1989), and probably explains the very high, but localized densities or clusters
of Discosoma sanctithomae and Ricordea florida. Without basic information on life history, it will remain

2011 Quick Look Report: Miller et al.
- 167 -
difficult to ascertain the ability of these organisms to maintain populations, especially considering the
apparent level of exploitation in the Florida Keys (Bohnsack et al. 1994).
Although spatially explicit (e.g. at the scale of individual reefs) landings and fishing effort data are not
available for Florida Keys anemones and corallimorpharians, the possibility that the observed density
patterns are influenced by fishing should not be dismissed. For example, anecdotal observations, acquired
from interviews with Florida Keys residents in 1993, indicated that Condylactis gigantea declined by the
early 1990s, possibly due to collection, disease, or other causes (DeMaria 1996). Commercial marine life
collectors and aquarium hobbyists potentially collect all of the cnidarians surveyed in this study
(Bohnsack et al. 1994). Only a saltwater license is needed for recreational fishing, and a saltwater
products license and commercial vessel registration is required to fish commercial quantities of
unregulated species (NOAA 1996; FWCC 2000). In addition to a prohibition on collection in 23 of the
no-take zones within the FKNMS (not including Tortugas North and South), fishing for these
“unregulated” species is also prohibited in Biscayne National Park, John Pennekamp Coral Reef State
Park/Key Largo National Marine Sanctuary (since 1960), the Florida Bay area within Everglades National
Park, and Dry Tortugas National Park. Management of exploited species obviously requires information
on fishing effort, population trends, and life history parameters. Density estimates for anemones and
corallimorpharians provide a baseline from which to measure the effects of protection within no-fishing
zones. When coupled with important and much needed information on the marine life fishery, the outputs
of this sampling approach can furnish state and federal resource managers with improved guidelines on
population estimates and trends relative to fishing intensity. Moreover, the implementation of no-fishing
zones in the Florida Keys National Marine Sanctuary presents a unique opportunity to evaluate the effects
of fishing (Bohnsack 1997), not only on the most economically important species (Bohnsack et al. 1994),
but also on a diversity of targeted, but relatively understudied taxa.

2011 Quick Look Report: Miller et al.
- 168 -
Figure 6-1. Anemones (Cnidaria, Anthozoa) surveyed for presence-absence, density, and habitat
distribution in the upper Florida Keys during May-September 2011. Not pictured is the Caribbean sun
anemone, Stichodactyla helianthus (Ellis). Only Bartholomea annulata, Condylactis gigantea, and
Lebrunia danae were encountered in the upper Florida Keys during 2011.
Bartholomea annulata (Lesueur)
Epicystis crucifera (Lesueur)
Bunodosoma granuliferum (Lesueur) Heteractis lucida
Condylactis gigantea (Weinland) Lebrunia danae (D & M)

2011 Quick Look Report: Miller et al.
- 169 -
Figure 6-2. Densities (no. per m2) of corkscrew anemones (Bartholomea annulata) in the upper Florida
Keys National Marine Sanctuary from the southern BNP boundary to Carysfort/S. Carysfort SPA
surveyed during May-September 2011.

2011 Quick Look Report: Miller et al.
- 170 -
Figure 6-3. Densities (no. per m2) of corkscrew anemones (Bartholomea annulata) in the upper Florida
Keys National Marine Sanctuary from Elbow Reef to Pickles Reef surveyed during May-September 2011.
2011 Quick Look Report: Miller et al.
- 171 -
Figure 6-4. Densities (no. per m2) of corkscrew anemones (Bartholomea annulata) in the upper Florida
Keys National Marine Sanctuary from Conch Reef SPA to Alligator Reef SPA surveyed during May-
September 2011.
2011 Quick Look Report: Miller et al.
- 172 -
Figure 6-5. Mean (+ 1 SE) transect frequency (top) and density (no. individuals per m2) (bottom) of
corkscrew anemones (Bartholomea annulata) by habitat type in the upper Florida Keys during May-
September 2011. Domain-wide (upper Keys) values are weighted averages and standard errors. Values on
the x-axis in parentheses are the number of sites surveyed in each habitat type, with two 15-m x 1-m
transects surveyed per site.
0
20
40
60
80
100
MPR (54) OPR (77) BRR (18) SHB (41) HSG (41) DFR (49)
Tra
ns
ect
fre
qu
en
cy (
%)
Habitat type (no. sites)
B. annulata Transect Frequency by Habitat
Upper Keys average = 51.8% 4.9%
0.00
0.02
0.04
0.06
0.08
0.10
0.12
MPR (54) OPR (77) BRR (18) SHB (41) HSG (41) DFR (49)
No
. in
div
idu
als
per
m2
Habitat type (no. sites)
B. annulata Density by Habitat
Upper Keys average = 0.057 0.006

2011 Quick Look Report: Miller et al.
- 173 -
Figure 6-6. Mean (+ 1 SE) transect frequency (top) and density (no. individuals per m2) (bottom) of
corkscrew anemones (Bartholomea annulata) by habitat type and management zone in the upper Florida
Keys during May-September 2011. Open bars = reference areas (Ref), filled bars = no-take zones (NTZ).
Domain-wide (upper Keys) values are weighted averages and standard errors. Habitat abbreviations are:
MPR = inshore and mid-channel patch reefs, OPR = offshore patch reefs, BRR = back-reef rubble, SHB =
shallow (< 6 m) hard-bottom, HSG = high-relief and groove, and DFR = deeper (6-15 m) fore-reef
habitats. Numbers in parentheses on the x-axis are the number of sites surveyed, with two replicate 15-m
x 1-m transects surveyed per site (30 m2 per site).
0
20
40
60
80
100
Ref (50) NTZ (4) Ref (73) NTZ (4) Ref (8) NTZ (10) Ref (33) NTZ (8) Ref (22) NTZ (19) Ref (36) NTZ (13)
Tra
ns
ect
fre
qu
en
cy (
%) B. annulata Transect Frequency by Habitat and Zone
Upper Keys average = 51.8% 4.9%
MPR DFRHSGSHBBRROPR
0.00
0.02
0.04
0.06
0.08
0.10
0.12
Ref (50) NTZ (4) Ref (73) NTZ (4) Ref (8) NTZ (10) Ref (33) NTZ (8) Ref (22) NTZ (19) Ref (36) NTZ (13)
No
. in
div
idu
als
per
m2
B. annulata Density by Habitat and Zone
Upper Keys average = 0.057 0.006
DFRHSGSHBBRROPRMPR

2011 Quick Look Report: Miller et al.
- 174 -
Figure 6-7. Corallimorpharians (Cnidaria, Anthozoa, Corallimorpharia) surveyed for presence-absence,
density and habitat distribution in the upper Florida Keys National Marine Sanctuary during May-
September 2011.
Discosoma carlgreni (Watzl)
Ricordea florida (D & M)
D. sanctithomae (D & M) R. florida (D & M)
D. sanctithomae (D & M) R. florida (D & M)

2011 Quick Look Report: Miller et al.
- 175 -
Figure 6-8. Densities (no. per m2) of the Florida corallimorph (Ricordea florida) in the upper Florida
Keys National Marine Sanctuary from the southern BNP boundary to Carysfort/S. Carysfort SPA
surveyed during May-September 2011.

2011 Quick Look Report: Miller et al.
- 176 -
Figure 6-9. Densities (no. per m2) of the Florida corallimorph (Ricordea florida) in the upper Florida
Keys National Marine Sanctuary from Elbow Reef to Pickles Reef surveyed during May-September 2011.

2011 Quick Look Report: Miller et al.
- 177 -
Figure 6-10. Densities (no. per m2) of the Florida corallimorph (Ricordea florida) in the upper Florida
Keys National Marine Sanctuary from Conch Reef SPA to Alligator Reef SPA surveyed during June-
August 2010.

2011 Quick Look Report: Miller et al.
- 178 -
Figure 6-11. Mean (+ 1 SE) transect frequency (top) and density (no. individuals per m2) (bottom) of the
Florida corallimorph (Ricordea florida) by habitat type in the upper Florida Keys during May-September
2011. Domain-wide (upper Keys) values are weighted averages and standard errors. Values on the x-axis
in parentheses are the number of sites surveyed in each habitat type, with two 15-m x 1-m transects
surveyed per site.
0
10
20
30
40
50
MPR (54) OPR (77) BRR (18) SHB (41) HSG (41) DFR (49)
Tra
ns
ect
fre
qu
en
cy (
%)
Habitat type (no. sites)
R. florida Transect Frequency by Habitat
Upper Keys average = 9.5% 2.4%
0.00
0.10
0.20
0.30
0.40
0.50
MPR (54) OPR (77) BRR (18) SHB (41) HSG (41) DFR (49)
No
. in
div
idu
als
per
m2
Habitat type (no. sites)
R. florida Density by Habitat
Upper Keys average = 0.094 0.030

2011 Quick Look Report: Miller et al.
- 179 -
Figure 6-12. Mean (+ 1 SE) transect frequency (top) and density (no. individuals per m2) (bottom) of the
Florida corallimorph (Ricordea florida) by habitat type and management zone in the upper Florida Keys
during May-September 2011. Open bars = reference areas (Ref), filled bars = no-take zones (NTZ).
Domain-wide (upper Keys) values are weighted averages and standard errors. Habitat abbreviations are:
MPR = inshore and mid-channel patch reefs, OPR = offshore patch reefs, BRR = back-reef rubble, SHB =
shallow (< 6 m) hard-bottom, HSG = high-relief and groove, and DFR = deeper (6-15 m) fore-reef
habitats. Numbers in parentheses on the x-axis are the number of sites surveyed, with two replicate 15-m
x 1-m transects surveyed per site (30 m2 per site).
0
10
20
30
40
50
Ref (50) NTZ (4) Ref (73) NTZ (4) Ref (8) NTZ (10) Ref (33) NTZ (8) Ref (22) NTZ (19) Ref (36) NTZ (13)
Tra
ns
ect
fre
qu
en
cy (
%) R. florida Transect Frequency by Habitat and Zone
Upper Keys average = 9.5% 2.4%
MPR DFRHSGSHBBRROPR
0.00
0.10
0.20
0.30
0.40
0.50
Ref (50) NTZ (4) Ref (73) NTZ (4) Ref (8) NTZ (10) Ref (33) NTZ (8) Ref (22) NTZ (19) Ref (36) NTZ (13)
No
. in
div
idu
als
per
m2
R. florida Density by Habitat and Zone
Upper Keys average = 0.094 0.030
DFRHSGSHBBRROPRMPR
2011 Quick Look Report: Miller et al.
- 180 -
Table 6-1. Summary of habitat distribution and density of the corkscrew anemone Bartholomea annulata
among habitat types and management zones in the upper Florida Keys, as determined from two replicate
15-m x 1-m belt transect surveys per site at 280 sites from northern Key Largo to Alligator Reef during
May-September 2011. Habitat types are arranged from inshore to offshore and no-take zones represent
Sanctuary Preservation Areas and Research Only areas. Values represent means ± 1 SE.
Habitat/management zone (no. sites) Site presence
(%)
Transect frequency
(%)
Density
(no. per m2)
No. individuals
Inshore and mid-channel patch reefs
Reference areas (50) 82.0 ± 5.5 60.0 ± 5.2 0.070 ± 0.008 105
No-take zones (4) 75.0 ± 25.0 37.5 ± 12.5 0.033 ± 0.014 4
Habitat total (54) 81.5 ± 5.3 58.3 ± 4.9 0.067 ± 0.008 109
Offshore patch reefs
Reference areas (73) 83.6 ± 4.4 61.0 ± 4.2 0.066 ± 0.006 144
No-take zones (4) 100.0 ± 0.0 62.5 ± 12.5 0.058 ± 0.008 7
Habitat total (77) 84.4 ± 4.2 61.0 ± 4.0 0.065 ± 0.006 151
Back-reef rubble
Reference areas (8) 12.5 ± 12.5 6.3 ± 6.3 0.004 ± 0.004 1
No-take zones (10) 30.0 ± 15.3 15.0 ± 7.6 0.010 ± 0.005 3
Habitat total (18) 22.2 ± 10.1 11.1 ± 5.0 0.007 ± 0.003 4
Shallow (< 6 m) hard-bottom
Reference areas (33) 63.6 ± 8.5 43.9 ± 6.8 0.048 ± 0.009 48
No-take zones (8) 87.5 ± 12.5 68.8 ± 13.2 0.088 ± 0.024 21
Habitat total (41) 68.3 ± 7.4 48.8 ± 6.2 0.056 ± 0.009 69
High-relief spur and groove
Reference areas (22) 77.3 ± 9.1 56.8 ± 8.3 0.070 ± 0.017 46
No-take zones (19) 57.9 ± 11.6 39.5 ± 9.0 0.033 ± 0.009 19
Habitat total (41) 68.3 ± 7.4 48.8 ± 6.2 0.053 ± 0.010 65
Deeper fore reef
Reference areas (36) 72.2 ± 7.6 54.2 ± 6.7 0.065 ± 0.011 70
No-take zones (13) 69.2 ± 13.3 38.5 ± 8.3 0.031 ± 0.007 12
Habitat total (49) 71.4 ± 6.5 50.0 ± 5.5 0.056 ± 0.008 82

2011 Quick Look Report: Miller et al.
- 181 -
Table 6-2. Summary of habitat distribution and density of the giant, pink-tipped anemones Condylactis
gigantea among habitat types and management zones in the upper Florida Keys, as determined from two
replicate 15-m x 1-m belt transect surveys per site at 280 sites from northern Key Largo to Alligator Reef
during May-September 2011. Habitat types are arranged from inshore to offshore and no-take zones
represent Sanctuary Preservation Areas and Research Only areas. Values represent means ± 1 SE.
Habitat/management zone (no. sites) Site presence
(%)
Transect frequency
(%)
Density
(no. per m2)
No. individuals
Inshore and mid-channel patch reefs
Reference areas (50) 22.0 ± 5.9 13.0 ± 3.7 0.013 ± 0.005 19
No-take zones (4) 0 ± 0 0 ± 0 0 ± 0 0
Habitat total (54) 20.4 ± 5.5 12.0 ± 3.5 0.012 ± 0.004 19
Offshore patch reefs
Reference areas (73) 28.8 ± 5.3 17.1 ± 3.4 0.016 ± 0.004 35
No-take zones (4) 75.0 ± 25.0 62.5 ± 23.9 0.058 ± 0.028 7
Habitat total (77) 31.2 ± 5.3 19.5 ± 3.6 0.018 ± 0.004 42
Back-reef rubble
Reference areas (8) 0 ± 0 0 ± 0 0 ± 0 0
No-take zones (10) 10.0 ± 10.0 5.0 ± 5.0 0.003 ± 0.003 1
Habitat total (18) 5.6 ± 5.6 2.8 ± 2.8 0.002 ± 0.002 1
Shallow (< 6 m) hard-bottom
Reference areas (33) 21.2 ± 7.2 12.1 ± 4.4 0.010 ± 0.004 10
No-take zones (8) 37.5 ± 18.3 18.8 ± 9.1 0.017 ± 0.009 4
Habitat total (41) 24.4 ± 6.8 13.4 ± 3.9 0.011 ± 0.004 14
High-relief spur and groove
Reference areas (22) 13.6 ± 7.5 9.1 ± 5.3 0.006 ± 0.004 4
No-take zones (19) 0 ± 0 0 ± 0 0 ± 0 0
Habitat total (41) 7.3 ± 4.1 4.9 ± 2.9 0.003 ± 0.002 4
Deeper fore reef
Reference areas (36) 5.6 ± 3.9 2.8 ± 1.9 0.002 ± 0.001 2
No-take zones (13) 7.7 ± 7.7 3.8 ± 3.8 0.003 ± 0.003 1
Habitat total (49) 6.1 ± 3.5 3.1 ± 1.7 0.002 ± 0.001 3

2011 Quick Look Report: Miller et al.
- 182 -
Table 6-3. Summary of habitat distribution and density of the anemone Lebrunia danae among habitat
types and management zones in the upper Florida Keys, as determined from two replicate 15-m x 1-m
belt transect surveys per site at 280 sites from northern Key Largo to Alligator Reef during May-
September 2011. Habitat types are arranged from inshore to offshore and no-take zones represent
Sanctuary Preservation Areas and Research Only areas. Values represent mean ± 1 SE.
Habitat/management zone (no. sites) Site presence
(%)
Transect frequency
(%)
Density
(no. per m2)
No. individuals
Inshore and mid-channel patch reefs
Reference areas (50) 16.0 ± 5.2 8.0 ± 2.6 0.005 ± 0.002 8
No-take zones (4) 25.0 ± 25.0 12.5 ± 12.5 0.008 ± 0.008 1
Habitat total (54) 16.7 ± 5.1 8.3 ± 2.6 0.006 ± 0.002 9
Offshore patch reefs
Reference areas (73) 11.0 ± 3.7 7.5 ± 2.7 0.006 ± 0.002 14
No-take zones (4) 0 ± 0 0 ± 0 0 ± 0 0
Habitat total (77) 10.4 ± 3.5 7.1 ± 2.6 0.006 ± 0.002 14
Back-reef rubble
Reference areas (8) 0 ± 0 0 ± 0 0 ± 0 0
No-take zones (10) 0 ± 0 0 ± 0 0 ± 0 0
Habitat total (18) 0 ± 0 0 ± 0 0 ± 0 0
Shallow (< 6 m) hard-bottom
Reference areas (33) 3.0 ± 3.0 1.5 ± 1.5 0.001 ± 0.001 1
No-take zones (8) 0 ± 0 0 ± 0 0 ± 0 0
Habitat total (41) 2.4 ± 2.4 1.2 ± 1.2 0.001 ± 0.001 1
High-relief spur and groove
Reference areas (22) 13.6 ± 7.5 6.8 ± 3.7 0.005 ± 0.002 3
No-take zones (19) 5.3 ± 5.3 2.6 ± 2.6 0.002 ± 0.002 1
Habitat total (41) 9.8 ± 4.7 4.9 ± 2.3 0.003 ± 0.002 4
Deeper fore reef
Reference areas (36) 8.3 ± 4.7 4.2 ± 2.3 0.004 ± 0.002 4
No-take zones (13) 0 ± 0 0 ± 0 0 ± 0 0
Habitat total (49) 6.1 ± 3.5 3.1 ± 1.7 0.003 ± 0.002 4

2011 Quick Look Report: Miller et al.
- 183 -
Table 6-4. Summary of habitat distribution and density of the corallimorpharian Discosoma carlgreni
among habitat types and management zones in the upper Florida Keys, as determined from two replicate
15-m x 1-m belt transect surveys per site at 280 sites from northern Key Largo to Alligator Reef during
May-September 2011. Habitat types are arranged from inshore to offshore and no-take zones represent
Sanctuary Preservation Areas and Research Only areas. Values represent mean ± 1 SE.
Habitat/management zone (no. sites) Site presence
(%)
Transect frequency
(%)
Density
(no. per m2)
No. individuals
Inshore and mid-channel patch reefs
Reference areas (50) 0 ± 0 0 ± 0 0 ± 0 0
No-take zones (4) 0 ± 0 0 ± 0 0 ± 0 0
Habitat total (54) 0 ± 0 0 ± 0 0 ± 0 0
Offshore patch reefs
Reference areas (73) 4.1 ± 2.3 2.1 ± 1.2 0.004 ± 0.003 9
No-take zones (4) 0 ± 0 0 ± 0 0 ± 0 0
Habitat total (77) 3.9 ± 2.2 1.9 ± 1.1 0.004 ± 0.002 9
Back-reef rubble
Reference areas (8) 0 ± 0 0 ± 0 0 ± 0 0
No-take zones (10) 0 ± 0 0 ± 0 0 ± 0 0
Habitat total (18) 0 ± 0 0 ± 0 0 ± 0 0
Shallow (< 6 m) hard-bottom
Reference areas (33) 0 ± 0 0 ± 0 0 ± 0 0
No-take zones (8) 0 ± 0 0 ± 0 0 ± 0 0
Habitat total (41) 0 ± 0 0 ± 0 0 ± 0 0
High-relief spur and groove
Reference areas (22) 0 ± 0 0 ± 0 0 ± 0 0
No-take zones (19) 0 ± 0 0 ± 0 0 ± 0 0
Habitat total (41) 0 ± 0 0 ± 0 0 ± 0 0
Deeper fore reef
Reference areas (36) 0 ± 0 0 ± 0 0 ± 0 0
No-take zones (13) 0 ± 0 0 ± 0 0 ± 0 0
Habitat total (49) 0 ± 0 0 ± 0 0 ± 0 0

2011 Quick Look Report: Miller et al.
- 184 -
Table 6-5. Summary of habitat distribution and density of the corallimorpharian Discosoma sanctithomae
among habitat types and management zones in the upper Florida Keys, as determined from two replicate
15-m x 1-m belt transect surveys per site at 280 sites from northern Key Largo to Alligator Reef during
May-September 2011. Habitat types are arranged from inshore to offshore and no-take zones represent
Sanctuary Preservation Areas and Research Only areas. Values represent mean ± 1 SE.
Habitat/management zone (no. sites) Site presence
(%)
Transect frequency
(%)
Density
(no. per m2)
No. individuals
Inshore and mid-channel patch reefs
Reference areas (50) 4.0 ± 2.8 2.0 ± 1.4 0.013 ± 0.010 19
No-take zones (4) 0 ± 0 0 ± 0 0 ± 0 0
Habitat total (54) 3.7 ± 2.6 1.9 ± 1.3 0.012 ± 0.010 19
Offshore patch reefs
Reference areas (73) 0 ± 0 0 ± 0 0 ± 0 0
No-take zones (4) 0 ± 0 0 ± 0 0 ± 0 0
Habitat total (77) 0 ± 0 0 ± 0 0 ± 0 0
Back-reef rubble
Reference areas (8) 0 ± 0 0 ± 0 0 ± 0 0
No-take zones (10) 0 ± 0 0 ± 0 0 ± 0 0
Habitat total (18) 0 ± 0 0 ± 0 0 ± 0 0
Shallow (< 6 m) hard-bottom
Reference areas (33) 3.0 ± 3.0 1.5 ± 1.5 0.001 ± 0.001 1
No-take zones (8) 0 ± 0 0 ± 0 0 ± 0 0
Habitat total (41) 2.4 ± 2.4 1.2 ± 1.2 0.001 ± 0.001 1
High-relief spur and groove
Reference areas (22) 9.1 ± 6.3 4.5 ± 3.1 0.005 ± 0.003 3
No-take zones (19) 0 ± 0 0 ± 0 0 ± 0 0
Habitat total (41) 4.9 ± 3.4 2.4 ± 1.7 0.002 ± 0.002 3
Deeper fore reef
Reference areas (36) 0 ± 0 0 ± 0 0 ± 0 0
No-take zones (13) 0 ± 0 0 ± 0 0 ± 0 0
Habitat total (49) 0 ± 0 0 ± 0 0 ± 0 0

2011 Quick Look Report: Miller et al.
- 185 -
Table 6-6. Summary of habitat distribution and density of the corallimorpharian Ricordea florida among
habitat types and management zones in the upper Florida Keys, as determined from two replicate 15-m x
1-m belt transect surveys per site at 280 sites from northern Key Largo to Alligator Reef during May-
September 2011. Habitat types are arranged from inshore to offshore and no-take zones represent
Sanctuary Preservation Areas and Research Only areas. Values represent mean ± 1 SE.
Habitat/management zone (no. sites) Site presence
(%)
Transect frequency
(%)
Density
(no. per m2)
No. individuals
Inshore and mid-channel patch reefs
Reference areas (50) 6.0 ± 3.4 5.0 ± 2.9 0.199 ± 0.197 299
No-take zones (4) 0 ± 0 0 ± 0 0 ± 0 0
Habitat total (54) 5.6 ± 3.1 4.6 ± 2.7 0.185 ± 0.182 299
Offshore patch reefs
Reference areas (73) 20.5 ± 4.8 15.1 ± 3.7 0.149 ± 0.067 327
No-take zones (4) 50.0 ± 28.9 25.0 ± 14.4 0.075 ± 0.044 9
Habitat total (77) 22.1 ± 4.8 15.6 ± 3.6 0.145 ± 0.064 336
Back-reef rubble
Reference areas (8) 0 ± 0 0 ± 0 0 ± 0 0
No-take zones (10) 0 ± 0 0 ± 0 0 ± 0 0
Habitat total (18) 0 ± 0 0 ± 0 0 ± 0 0
Shallow (< 6 m) hard-bottom
Reference areas (33) 9.1 ± 5.1 4.5 ± 2.5 0.008 ± 0.005 8
No-take zones (8) 25.0 ± 16.4 12.5 ± 8.2 0.008 ± 0.005 2
Habitat total (41) 12.2 ± 5.2 6.1 ± 2.6 0.008 ± 0.004 10
High-relief spur and groove
Reference areas (22) 50.0 ± 10.9 31.8 ± 7.7 0.205 ± 0.071 135
No-take zones (19) 0 ± 0 0 ± 0 0 ± 0 0
Habitat total (41) 26.8 ± 7.0 17.1 ± 4.8 0.110 ± 0.041 135
Deeper fore reef
Reference areas (36) 8.3 ± 4.7 5.6 ± 3.3 0.006 ± 0.004 7
No-take zones (13) 7.7 ± 7.7 3.8 ± 3.8 0.003 ± 0.003 1
Habitat total (49) 8.2 ± 4.0 5.1 ± 2.6 0.005 ± 0.003 8