vibrant india
TRANSCRIPT
8/4/2019 Vibrant India
http://slidepdf.com/reader/full/vibrant-india 1/12
__________________________________________________________________________________
1 | P a g e
Market overview
Vibrant India
Opportunities For The Flavour And Fragrance Industry
by
Sant Sanganeria
Ultra International Limited New Delhi, INDIA
India is the country of the future. Its economy is robust, with strongfundamentals, and it will continue to be one of the fastest growing countriesin the world in years to come.
The vast and growing Indian market is a reality. The increase in the number of
households headed by salary earners, professionals and businesspersons, along with
the emergence of a thriving consumer finance business, have led to a steep rise in the
number of consumers with greater disposable incomes. Expenditure on consumer
durables has shown an impressive growth in the last decade.
India offers one of the largest markets in the world for manufactured items of massconsumption such as clothing, footwear, detergents and cooking oil. Markets for most
manufactured products have exhibited strong growth rates over the past few years.
Rural areas, where over 70% of Indians live, have witnessed rapid market growth in
recent times, driven largely by agricultural growth, income redistribution, and inroads
made by the audio-visual media. The rural share of the market for durable goods has
grown steadily over the last few years.
India has an extensive sales and distribution network. It is estimated that there are
more than one million market intermediaries such as wholesalers, stockist's
transporters and retailers who are involved in the distribution of a variety of consumer
goods. Marketers use this network to access nearly 3,800 cities and towns and morethan 500,000 villages.
While urban areas have a range of distribution outlets, from large supermarkets and
superstores to the smaller neighborhood retail stores, small shops that are part of the
local supply network cater to almost every village in India.
The widespread sales and distribution network is supported by an equally extensive
banking network. Consumer financing is an accepted form of consumer goods
marketing in India. The presence of several non-banking finance companies engaged
in leasing and hire purchase activities has given a fillip to consumer goods sales. The
credit card market too has shown tremendous growth in recent years. The products of
several international companies like Diners Club, Visa International, Master Card and
8/4/2019 Vibrant India
http://slidepdf.com/reader/full/vibrant-india 2/12
__________________________________________________________________________________
2 | P a g e
American Express Bank are widely used in the country along with the cards offered by
several domestic banks.
Indian Economy at a glanceCurrently the 4th largest economy in PPP terms after USA, China & Japan.
Will be the third largest economy in terms of GDP in next five years
Second fastest growing economy in the world
Among top 10 FDI destinations
Stable Government with second stage reforms in place
Growing Corporate Ethics (labour laws, child labour regulations, Environmental-Protection
lobby, intellectual and property rights responsibility)
Major tax reforms including implementation of VAT
US$ 130 billion investment plans in infrastructure in next five years
Second most attractive developing market, ahead of China
Fifth amongst the 30 emerging markets for new retailers to enter
Indian aromatic chemical Industry overview:
Total US$150 million.
Fragmented and dispersed - multi product and multi faceted.
Aroma Chemicals sold directly to large customers and through distribution channels.
Distribution channels mostly consist of stockists and dealers spread all over India
addressing small segments and retail market.
Industry structure highly fragramented and widely dispersed.
Western India accounts for 45-50% of total Indian chemical Industry.
Both large and small players in Fine and Speciality bulk chemicals.
Presence of many multinational companies
The Economy India has the largest youth population in the world-more than 867 million peoplebelow 45 years of age! In addition there are more English speaking citizens in Indiathan in the whole of Europe. A 300 million-odd middle class is another striking feature.With more than 600 million effective consumers by year 2010. India will emerge asone of the largest consumer markets of the world.
Essential Oil Industry
With the initiation of globalisation process and the falling values of
currency from Southeastern countries, which are our immediate
competitors for agricultural produces, it has become imperative to
look into our priorities with more serious thoughts.
The increasing importance of natural extracts as pharmaceutical & natural cosmetic
aid and their use as nutraceutical ingredients in recent times has opened up newvistas for this sector besides their widespread use as flavour & fragrance ingredients.
India will play a dominant role in the production & processing of these naturalextracts. Country's biodiversity coupled with competent scientific force, make our
8/4/2019 Vibrant India
http://slidepdf.com/reader/full/vibrant-india 3/12
__________________________________________________________________________________
3 | P a g e
country as the best choice to become a foremost leader in aroma business in thecoming years.
Our national vision is to become a significant global player by the year 2010 increasing
our share in world markets from 16 percent to 25-30 percent. We have to spread ourtechnology base and utilise the vast resources and opportunities made available bythe rest of the world.
Present Scenario: The world's total production of essential oils is estimated at about
1,00,000-1,10,000 tons and India stands at No. 3 contributor with a share of 16-17
percent. In value terms India's position is No.2 with the share of 21-22 percent,
thanks to mint revolution in North India. Brazil with its production of Citrus oil at
40000 tons, is the largest producer of essential oils in the world. However, its share
in value terms is only 9.0 percent. (start the United State, by the way is undoubtedly
the largest producer and consumer of essential oils.) Turpentine oil is not included in
the data.
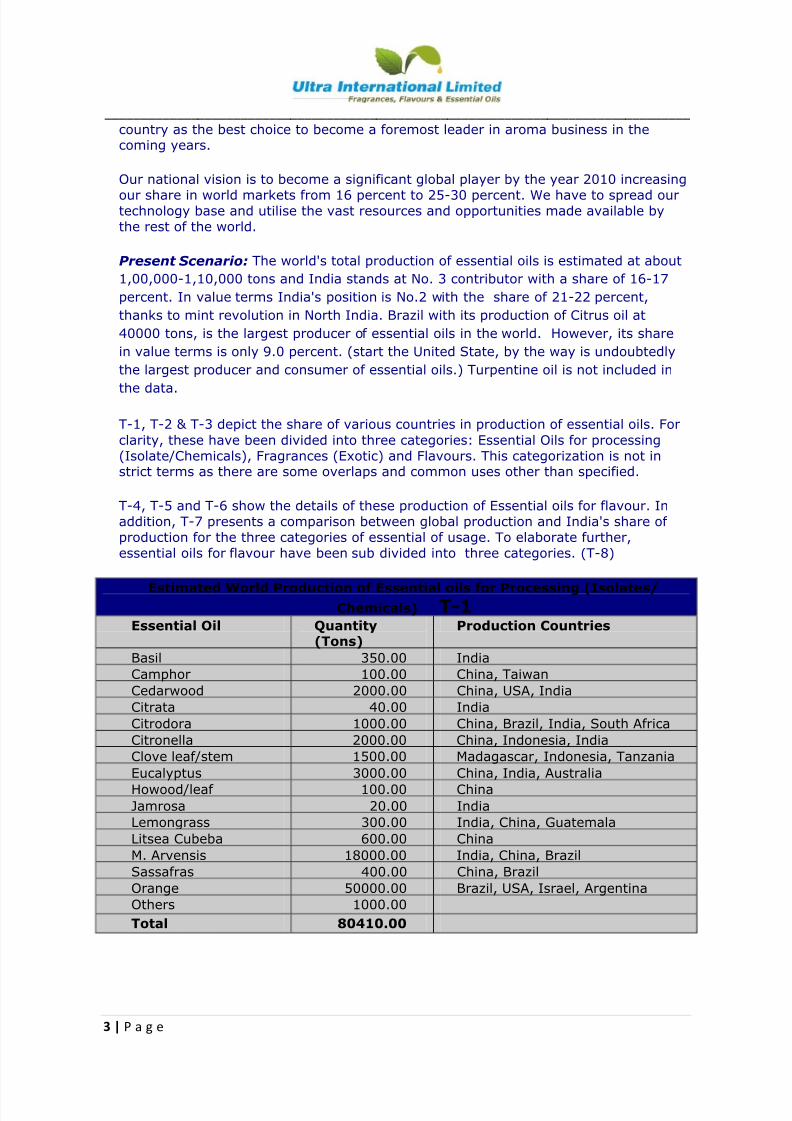
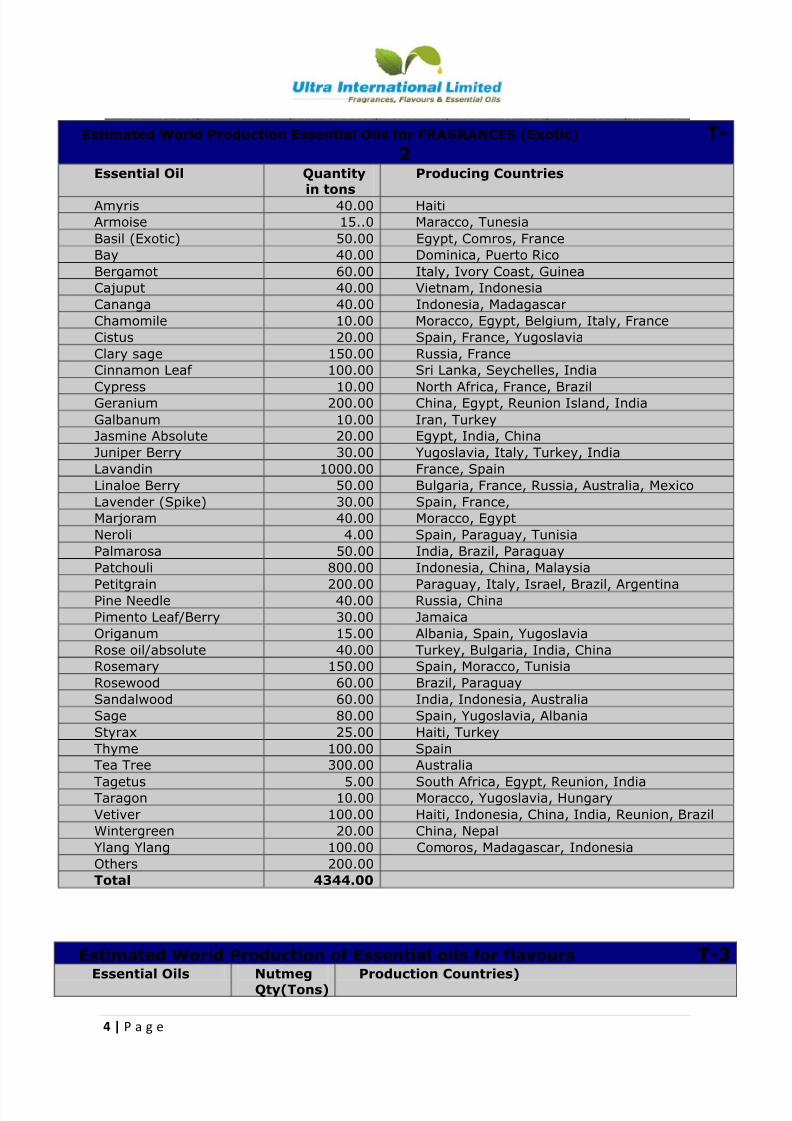
T-1, T-2 & T-3 depict the share of various countries in production of essential oils. For
clarity, these have been divided into three categories: Essential Oils for processing(Isolate/Chemicals), Fragrances (Exotic) and Flavours. This categorization is not instrict terms as there are some overlaps and common uses other than specified.
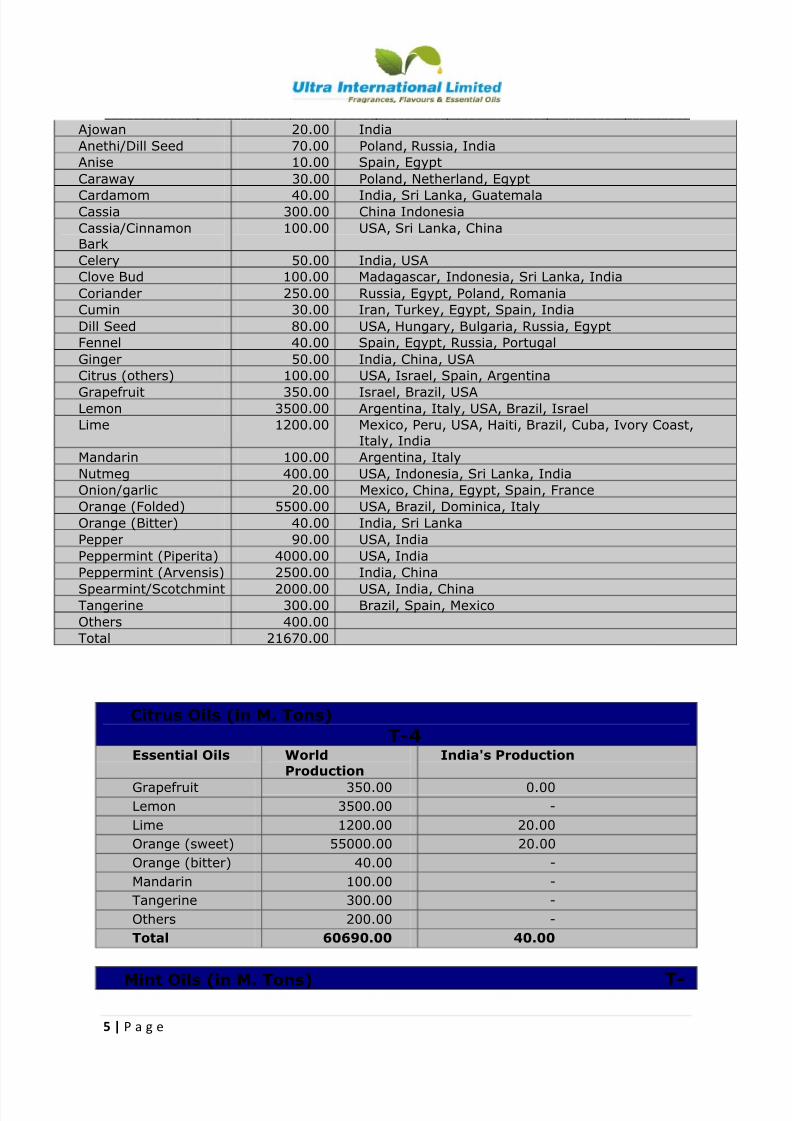
T-4, T-5 and T-6 show the details of these production of Essential oils for flavour. Inaddition, T-7 presents a comparison between global production and India's share of production for the three categories of essential of usage. To elaborate further,essential oils for flavour have been sub divided into three categories. (T-8)
Estimated World Production of Essential oils for Processing (Isolates/
Chemicals) T-1 Essential Oil Quantity
(Tons)Production Countries
Basil 350.00 India
Camphor 100.00 China, Taiwan
Cedarwood 2000.00 China, USA, India
Citrata 40.00 India
Citrodora 1000.00 China, Brazil, India, South Africa
Citronella 2000.00 China, Indonesia, India
Clove leaf/stem 1500.00 Madagascar, Indonesia, Tanzania
Eucalyptus 3000.00 China, India, AustraliaHowood/leaf 100.00 China
Jamrosa 20.00 India
Lemongrass 300.00 India, China, Guatemala
Litsea Cubeba 600.00 China
M. Arvensis 18000.00 India, China, Brazil
Sassafras 400.00 China, Brazil
Orange 50000.00 Brazil, USA, Israel, Argentina
Others 1000.00
Total 80410.00
8/4/2019 Vibrant India
http://slidepdf.com/reader/full/vibrant-india 4/12
__________________________________________________________________________________
4 | P a g e
Estimated World Production Essential Oils for FRAGRANCES (Exotic) T-2
Essential Oil Quantity
in tons
Producing Countries
Amyris 40.00 Haiti
Armoise 15..0 Maracco, Tunesia
Basil (Exotic) 50.00 Egypt, Comros, France
Bay 40.00 Dominica, Puerto Rico
Bergamot 60.00 Italy, Ivory Coast, Guinea
Cajuput 40.00 Vietnam, Indonesia
Cananga 40.00 Indonesia, Madagascar
Chamomile 10.00 Moracco, Egypt, Belgium, Italy, France
Cistus 20.00 Spain, France, Yugoslavia
Clary sage 150.00 Russia, France
Cinnamon Leaf 100.00 Sri Lanka, Seychelles, India
Cypress 10.00 North Africa, France, BrazilGeranium 200.00 China, Egypt, Reunion Island, India
Galbanum 10.00 Iran, Turkey
Jasmine Absolute 20.00 Egypt, India, China
Juniper Berry 30.00 Yugoslavia, Italy, Turkey, India
Lavandin 1000.00 France, Spain
Linaloe Berry 50.00 Bulgaria, France, Russia, Australia, Mexico
Lavender (Spike) 30.00 Spain, France,
Marjoram 40.00 Moracco, Egypt
Neroli 4.00 Spain, Paraguay, Tunisia
Palmarosa 50.00 India, Brazil, Paraguay
Patchouli 800.00 Indonesia, China, Malaysia
Petitgrain 200.00 Paraguay, Italy, Israel, Brazil, ArgentinaPine Needle 40.00 Russia, China
Pimento Leaf/Berry 30.00 Jamaica
Origanum 15.00 Albania, Spain, Yugoslavia
Rose oil/absolute 40.00 Turkey, Bulgaria, India, China
Rosemary 150.00 Spain, Moracco, Tunisia
Rosewood 60.00 Brazil, Paraguay
Sandalwood 60.00 India, Indonesia, Australia
Sage 80.00 Spain, Yugoslavia, Albania
Styrax 25.00 Haiti, Turkey
Thyme 100.00 Spain
Tea Tree 300.00 Australia
Tagetus 5.00 South Africa, Egypt, Reunion, India
Taragon 10.00 Moracco, Yugoslavia, Hungary
Vetiver 100.00 Haiti, Indonesia, China, India, Reunion, Brazil
Wintergreen 20.00 China, Nepal
Ylang Ylang 100.00 Comoros, Madagascar, Indonesia
Others 200.00
Total 4344.00
Estimated World Production of Essential oils for flavours T-3 Essential Oils Nutmeg
Qty(Tons)Production Countries)
8/4/2019 Vibrant India
http://slidepdf.com/reader/full/vibrant-india 5/12
__________________________________________________________________________________
5 | P a g e
Ajowan 20.00 India
Anethi/Dill Seed 70.00 Poland, Russia, India
Anise 10.00 Spain, Egypt
Caraway 30.00 Poland, Netherland, Egypt
Cardamom 40.00 India, Sri Lanka, GuatemalaCassia 300.00 China Indonesia
Cassia/CinnamonBark
100.00 USA, Sri Lanka, China
Celery 50.00 India, USA
Clove Bud 100.00 Madagascar, Indonesia, Sri Lanka, India
Coriander 250.00 Russia, Egypt, Poland, Romania
Cumin 30.00 Iran, Turkey, Egypt, Spain, India
Dill Seed 80.00 USA, Hungary, Bulgaria, Russia, Egypt
Fennel 40.00 Spain, Egypt, Russia, Portugal
Ginger 50.00 India, China, USA
Citrus (others) 100.00 USA, Israel, Spain, Argentina
Grapefruit 350.00 Israel, Brazil, USA
Lemon 3500.00 Argentina, Italy, USA, Brazil, Israel
Lime 1200.00 Mexico, Peru, USA, Haiti, Brazil, Cuba, Ivory Coast,
Italy, India
Mandarin 100.00 Argentina, Italy
Nutmeg 400.00 USA, Indonesia, Sri Lanka, India
Onion/garlic 20.00 Mexico, China, Egypt, Spain, France
Orange (Folded) 5500.00 USA, Brazil, Dominica, Italy
Orange (Bitter) 40.00 India, Sri Lanka
Pepper 90.00 USA, India
Peppermint (Piperita) 4000.00 USA, India
Peppermint (Arvensis) 2500.00 India, ChinaSpearmint/Scotchmint 2000.00 USA, India, China
Tangerine 300.00 Brazil, Spain, Mexico
Others 400.00
Total 21670.00
Citrus Oils (in M. Tons)
T-4Essential Oils World
Production
India's Production
Grapefruit 350.00 0.00
Lemon 3500.00 -
Lime 1200.00 20.00
Orange (sweet) 55000.00 20.00
Orange (bitter) 40.00 -
Mandarin 100.00 -
Tangerine 300.00 -
Others 200.00 -
Total 60690.00 40.00
Mint Oils (in M. Tons) T-
8/4/2019 Vibrant India
http://slidepdf.com/reader/full/vibrant-india 6/12
__________________________________________________________________________________
6 | P a g e
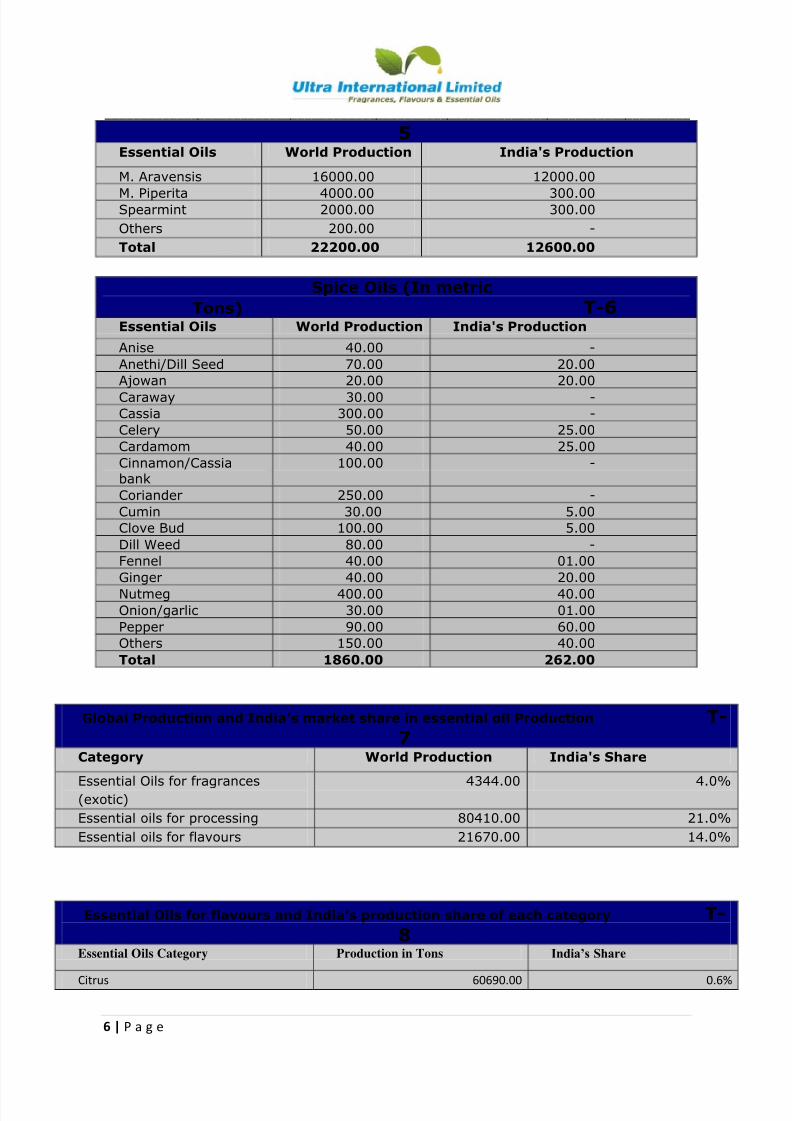
5Essential Oils World Production India's Production
M. Aravensis 16000.00 12000.00
M. Piperita 4000.00 300.00Spearmint 2000.00 300.00
Others 200.00 -
Total 22200.00 12600.00
Spice Oils (In metric
Tons) T-6Essential Oils World Production India's Production
Anise 40.00 -
Anethi/Dill Seed 70.00 20.00
Ajowan 20.00 20.00Caraway 30.00 -
Cassia 300.00 -
Celery 50.00 25.00
Cardamom 40.00 25.00
Cinnamon/Cassiabank
100.00 -
Coriander 250.00 -
Cumin 30.00 5.00
Clove Bud 100.00 5.00
Dill Weed 80.00 -
Fennel 40.00 01.00
Ginger 40.00 20.00Nutmeg 400.00 40.00
Onion/garlic 30.00 01.00
Pepper 90.00 60.00
Others 150.00 40.00
Total 1860.00 262.00
Global Production and India’s market share in essential oil Production T-7
Category World Production India's Share
Essential Oils for fragrances
(exotic)
4344.00 4.0%
Essential oils for processing 80410.00 21.0%
Essential oils for flavours 21670.00 14.0%
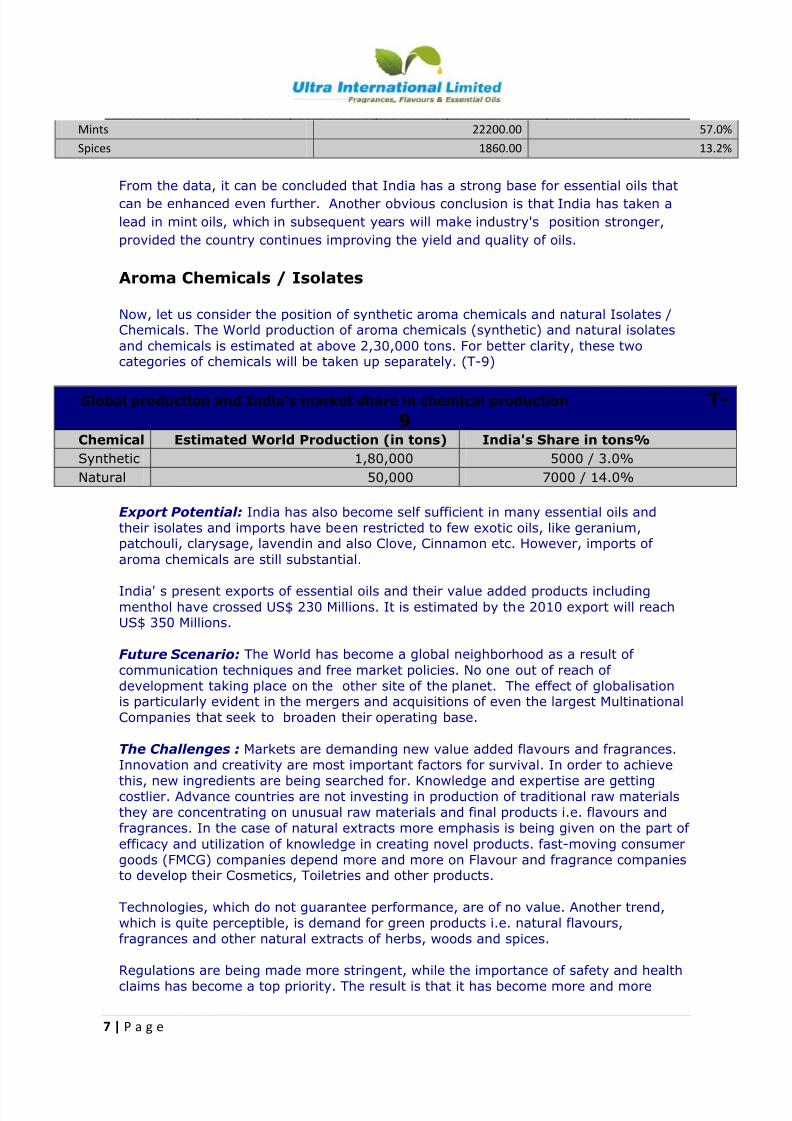
Essential Oils for flavours and India’s production share of each category T-8
Essential Oils Category Production in Tons India’s Share
Citrus 60690.00 0.6%
8/4/2019 Vibrant India
http://slidepdf.com/reader/full/vibrant-india 7/12
__________________________________________________________________________________
7 | P a g e
Mints 22200.00 57.0%
Spices 1860.00 13.2%
From the data, it can be concluded that India has a strong base for essential oils that
can be enhanced even further. Another obvious conclusion is that India has taken a
lead in mint oils, which in subsequent years will make industry's position stronger,
provided the country continues improving the yield and quality of oils.
Aroma Chemicals / Isolates
Now, let us consider the position of synthetic aroma chemicals and natural Isolates /Chemicals. The World production of aroma chemicals (synthetic) and natural isolates
and chemicals is estimated at above 2,30,000 tons. For better clarity, these twocategories of chemicals will be taken up separately. (T-9)
Global production and India’s market share in chemical production T-9
Chemical Estimated World Production (in tons) India's Share in tons%
Synthetic 1,80,000 5000 / 3.0%
Natural 50,000 7000 / 14.0%
Export Potential: India has also become self sufficient in many essential oils andtheir isolates and imports have been restricted to few exotic oils, like geranium,patchouli, clarysage, lavendin and also Clove, Cinnamon etc. However, imports of
aroma chemicals are still substantial.
India' s present exports of essential oils and their value added products including
menthol have crossed US$ 230 Millions. It is estimated by the 2010 export will reachUS$ 350 Millions.
Future Scenario: The World has become a global neighborhood as a result of
communication techniques and free market policies. No one out of reach of development taking place on the other site of the planet. The effect of globalisationis particularly evident in the mergers and acquisitions of even the largest MultinationalCompanies that seek to broaden their operating base.
The Challenges : Markets are demanding new value added flavours and fragrances.Innovation and creativity are most important factors for survival. In order to achievethis, new ingredients are being searched for. Knowledge and expertise are gettingcostlier. Advance countries are not investing in production of traditional raw materialsthey are concentrating on unusual raw materials and final products i.e. flavours andfragrances. In the case of natural extracts more emphasis is being given on the part of
efficacy and utilization of knowledge in creating novel products. fast-moving consumergoods (FMCG) companies depend more and more on Flavour and fragrance companiesto develop their Cosmetics, Toiletries and other products.
Technologies, which do not guarantee performance, are of no value. Another trend,which is quite perceptible, is demand for green products i.e. natural flavours,fragrances and other natural extracts of herbs, woods and spices.
Regulations are being made more stringent, while the importance of safety and healthclaims has become a top priority. The result is that it has become more and more
8/4/2019 Vibrant India
http://slidepdf.com/reader/full/vibrant-india 8/12
__________________________________________________________________________________
8 | P a g e
difficult in introduce a new essential oil or aroma chemical or herbal extract withoutperforming more than 100 tests and obtaining certifications from authenticlaboratories on safety aspects. These tests are quite elaborate and require funding.Today's R&D activities cannot remain limited to merely identifying a new strain of an
essential oil bearing crop or new source of existing aroma chemical on the basis of itsmajor component.
A new strain has to be thoroughly investigated for all major, minor and trace
constituents by advance chromatographic techniques and their safety datacollaborated.
Consumers have become more discerning, demanding more intensive flavours/fragrances and healthy indulgence products. Products having anti-stress, anti-aging orhealth promoting benefits but at the same time, possessing intensive flavour orsophisticated fragrance are being preferred.
The implication of ingredients supplier is that more information on functionality andefficacy of ingredients will be needed. This means that more clinical studies need to be
done, as authenticated results are needed by the users of flavours/fragrances in orderto make health claims on their products.
Aroma ChemicalsEnvironmental protection laws and safety consideration are becoming paramount inmost of the developed countries. Cost of investments and operating cost are alsogetting higher each year. Under these circumstances, the clearances for new projectsare tough to obtain in developed countries and there project cost are running in
millions of dollars. As a result, world is looking towards developing counties, like, Indiaand China to do all the processing of aroma isolates and chemicals for the future. This
is to be accepted as a challenge and also as an opportunity to develop these isolates/chemicals keeping the large global markets in view.
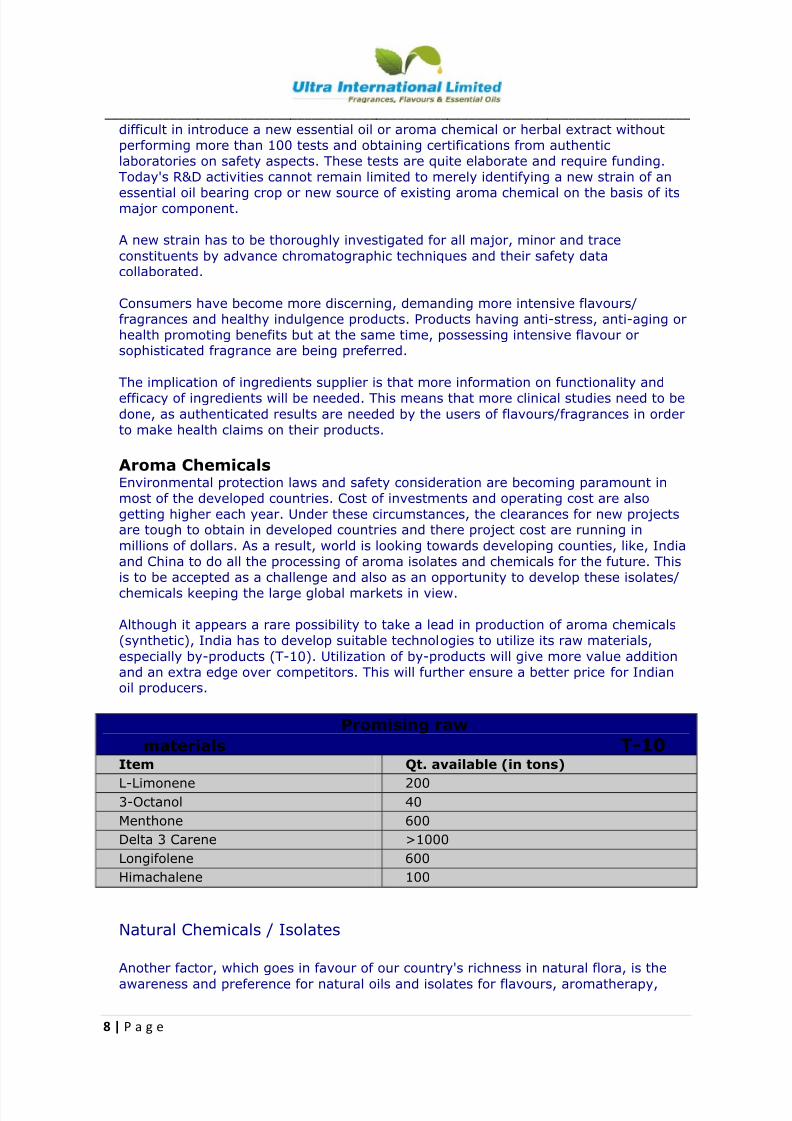
Although it appears a rare possibility to take a lead in production of aroma chemicals(synthetic), India has to develop suitable technologies to utilize its raw materials,
especially by-products (T-10). Utilization of by-products will give more value additionand an extra edge over competitors. This will further ensure a better price for Indianoil producers.
Promising raw
materials T-10 Item Qt. available (in tons)
L-Limonene 200
3-Octanol 40
Menthone 600
Delta 3 Carene >1000
Longifolene 600
Himachalene 100
Natural Chemicals / Isolates
Another factor, which goes in favour of our country's richness in natural flora, is theawareness and preference for natural oils and isolates for flavours, aromatherapy,
8/4/2019 Vibrant India
http://slidepdf.com/reader/full/vibrant-india 9/12
__________________________________________________________________________________
9 | P a g e
herbal cosmetics and even pharmaceuticals. This trend is catching fast in USA, Europe& Japan and as a result, the demand for natural isolates has gone up. World is lookingtowards novel isolates to be used as a pan of their flavourings which are beingpreferred by end users from safety point of view. Naturals have started replacing
synthetic flavours all over the world. This market is enormous. The prices of naturalchemicals are much higher than prices of similar synthetic ones.
India's share in natural isolates chemicals is around 14percent. It focus however, is indeveloping many isolates and chemicals by fractional distillation of new essential oilsor utilizing biotechnology or reactions with natural chemicals. If the country's industry
is successful in producing natural esters by fermentation or by natural reactions, itspositions will be quite strong. Even conversion of Methyl Chavicol to Anethole by anatural process will be helpful to some extent.
Most of the natural alcohols are easily available in India. Even natural acetic acid
(natural vinegar) is available. We have to look for other acids and develop a
technology to produce natural esters.
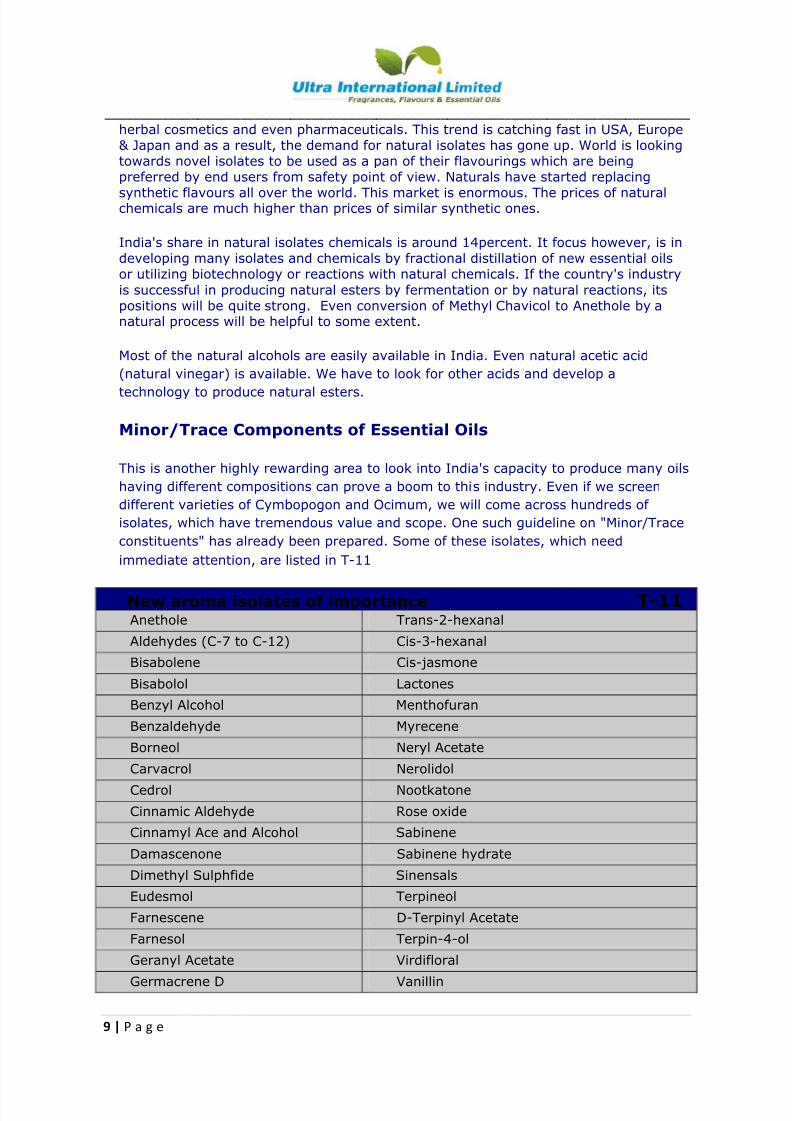
Minor/Trace Components of Essential Oils
This is another highly rewarding area to look into India's capacity to produce many oils
having different compositions can prove a boom to this industry. Even if we screen
different varieties of Cymbopogon and Ocimum, we will come across hundreds of
isolates, which have tremendous value and scope. One such guideline on "Minor/Trace
constituents" has already been prepared. Some of these isolates, which need
immediate attention, are listed in T-11
New aroma isolates of importance T-11 Anethole Trans-2-hexanal
Aldehydes (C-7 to C-12) Cis-3-hexanal
Bisabolene Cis-jasmone
Bisabolol Lactones
Benzyl Alcohol Menthofuran
Benzaldehyde Myrecene
Borneol Neryl Acetate
Carvacrol NerolidolCedrol Nootkatone
Cinnamic Aldehyde Rose oxide
Cinnamyl Ace and Alcohol Sabinene
Damascenone Sabinene hydrate
Dimethyl Sulphfide Sinensals
Eudesmol Terpineol
Farnescene D-Terpinyl Acetate
Farnesol Terpin-4-ol
Geranyl Acetate VirdifloralGermacrene D Vanillin
8/4/2019 Vibrant India
http://slidepdf.com/reader/full/vibrant-india 10/12
__________________________________________________________________________________
10 | P a g e
Natural Essential Oils Sector
The use of natural essential oils is on the rise although present demand for exotic
essential oil for use in natural cosmetics, aromatherapy, pharmaceuticals and
combined with natural flavours is about 6500-7000 tons and shall increaseconsiderably in the future. India's production of exotic oils is far behind expectations.However, with the efforts of industry and associations, developmental work has
already been taken up by R&D Institutes. We hope India will be able to meet its ownrequirements of many exotic oils like geranium, patchouli and lavender by 2010.
These days, advanced countries are demanding functional fragrances where odourvalue of a fragrance is reinforced with natural oils. Thus many exotic essential oils,like, Geranium, Lavender, Rosemary and Clarysage, Junipers, Sandal are finding favorin new blends. Many citrus oils, like orange lemon and lime are still to be introducedby India, followed by petitgraing and neroli oils. this will be posible when the foodprocessing industry advances in India, which is likely to occur.
New sources of essential oils or new varieties of essential oils from Ocimum and
Cymbopogon, leaves of forest trees, which can be made available on sustainable basisand can be cultivated, subsequently, are to be searched for as a source of new aromaisolates.
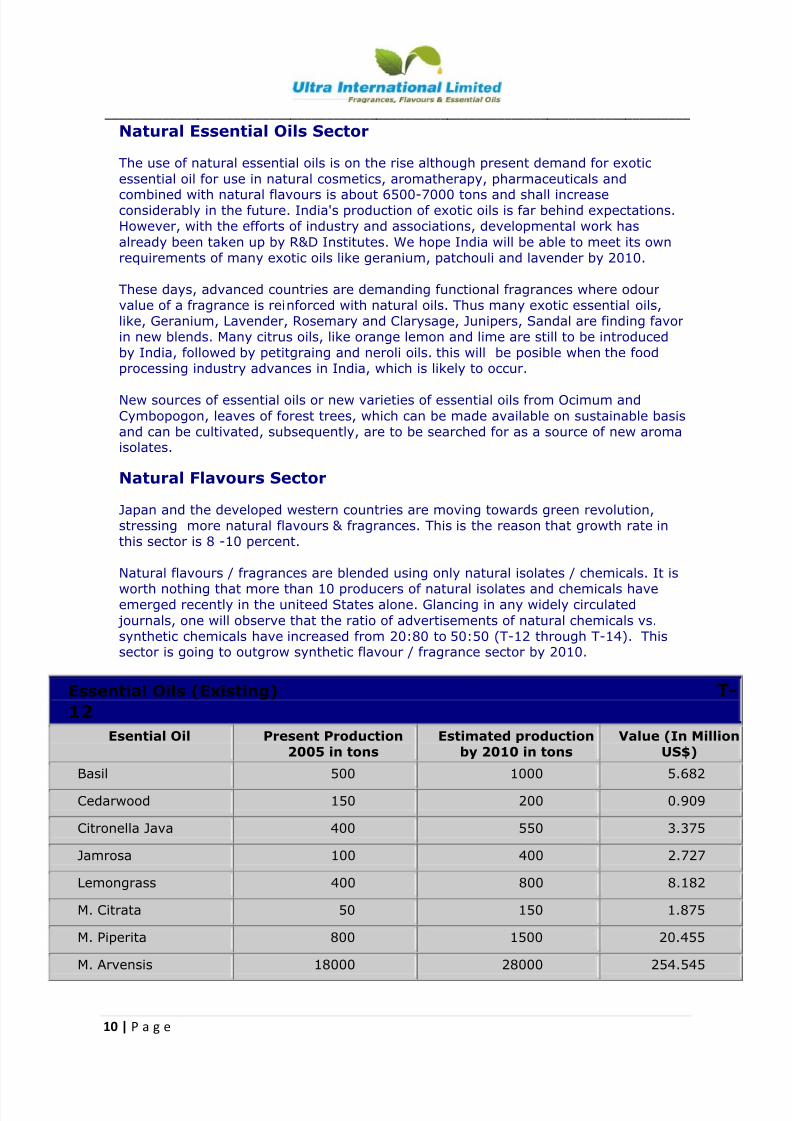
Natural Flavours Sector
Japan and the developed western countries are moving towards green revolution,stressing more natural flavours & fragrances. This is the reason that growth rate inthis sector is 8 -10 percent.
Natural flavours / fragrances are blended using only natural isolates / chemicals. It isworth nothing that more than 10 producers of natural isolates and chemicals haveemerged recently in the uniteed States alone. Glancing in any widely circulated
journals, one will observe that the ratio of advertisements of natural chemicals vs.synthetic chemicals have increased from 20:80 to 50:50 (T-12 through T-14). Thissector is going to outgrow synthetic flavour / fragrance sector by 2010.
Essential Oils (Existing) T-12
Esential Oil Present Production2005 in tons
Estimated productionby 2010 in tons
Value (In MillionUS$)
Basil 500 1000 5.682
Cedarwood 150 200 0.909
Citronella Java 400 550 3.375
Jamrosa 100 400 2.727
Lemongrass 400 800 8.182
M. Citrata 50 150 1.875
M. Piperita 800 1500 20.455
M. Arvensis 18000 28000 254.545
8/4/2019 Vibrant India
http://slidepdf.com/reader/full/vibrant-india 11/12
__________________________________________________________________________________
11 | P a g e
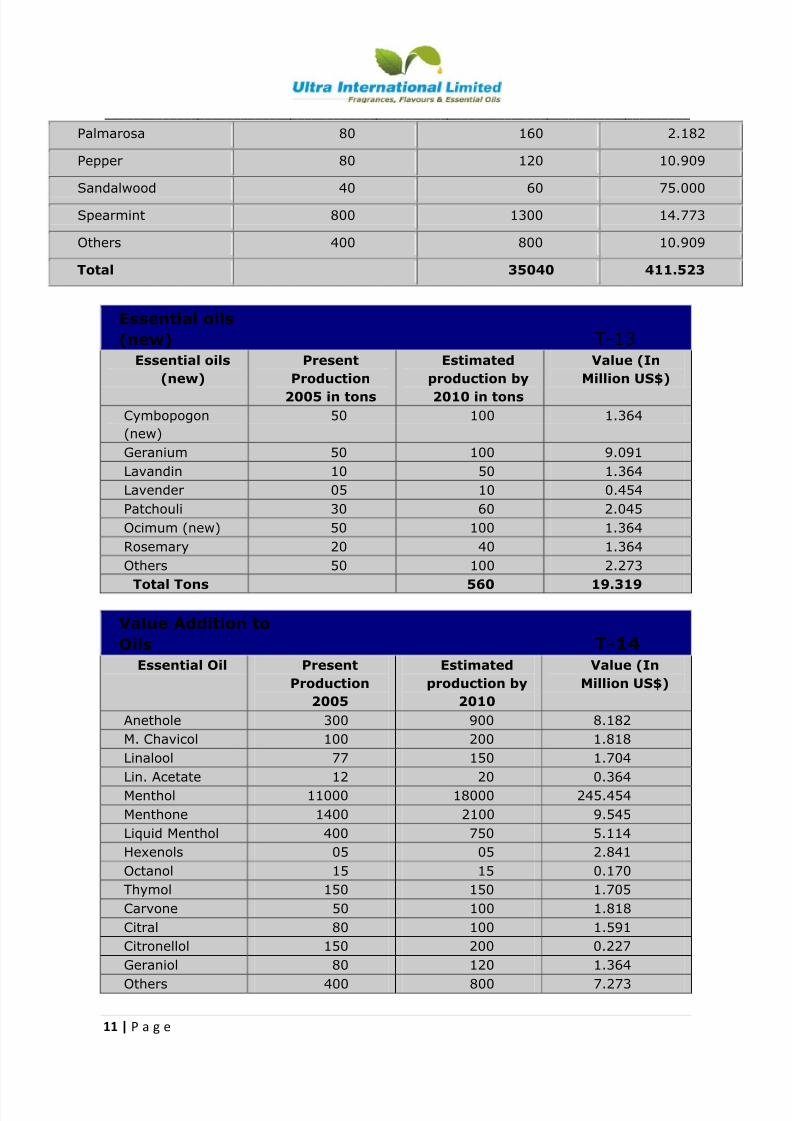
Palmarosa 80 160 2.182
Pepper 80 120 10.909
Sandalwood 40 60 75.000
Spearmint 800 1300 14.773
Others 400 800 10.909
Total 35040 411.523
Essential oils
(new) T-13
Essential oils
(new)
Present
Production
2005 in tons
Estimated
production by
2010 in tons
Value (In
Million US$)
Cymbopogon
(new)
50 100 1.364
Geranium 50 100 9.091
Lavandin 10 50 1.364
Lavender 05 10 0.454
Patchouli 30 60 2.045
Ocimum (new) 50 100 1.364
Rosemary 20 40 1.364
Others 50 100 2.273
Total Tons 560 19.319
Value Addition to
Oils T-14Essential Oil Present
Production
2005
Estimated
production by
2010
Value (In
Million US$)
Anethole 300 900 8.182
M. Chavicol 100 200 1.818
Linalool 77 150 1.704
Lin. Acetate 12 20 0.364
Menthol 11000 18000 245.454
Menthone 1400 2100 9.545
Liquid Menthol 400 750 5.114
Hexenols 05 05 2.841
Octanol 15 15 0.170
Thymol 150 150 1.705
Carvone 50 100 1.818
Citral 80 100 1.591
Citronellol 150 200 0.227
Geraniol 80 120 1.364Others 400 800 7.273
8/4/2019 Vibrant India
http://slidepdf.com/reader/full/vibrant-india 12/12
__________________________________________________________________________________
12 | P a g e
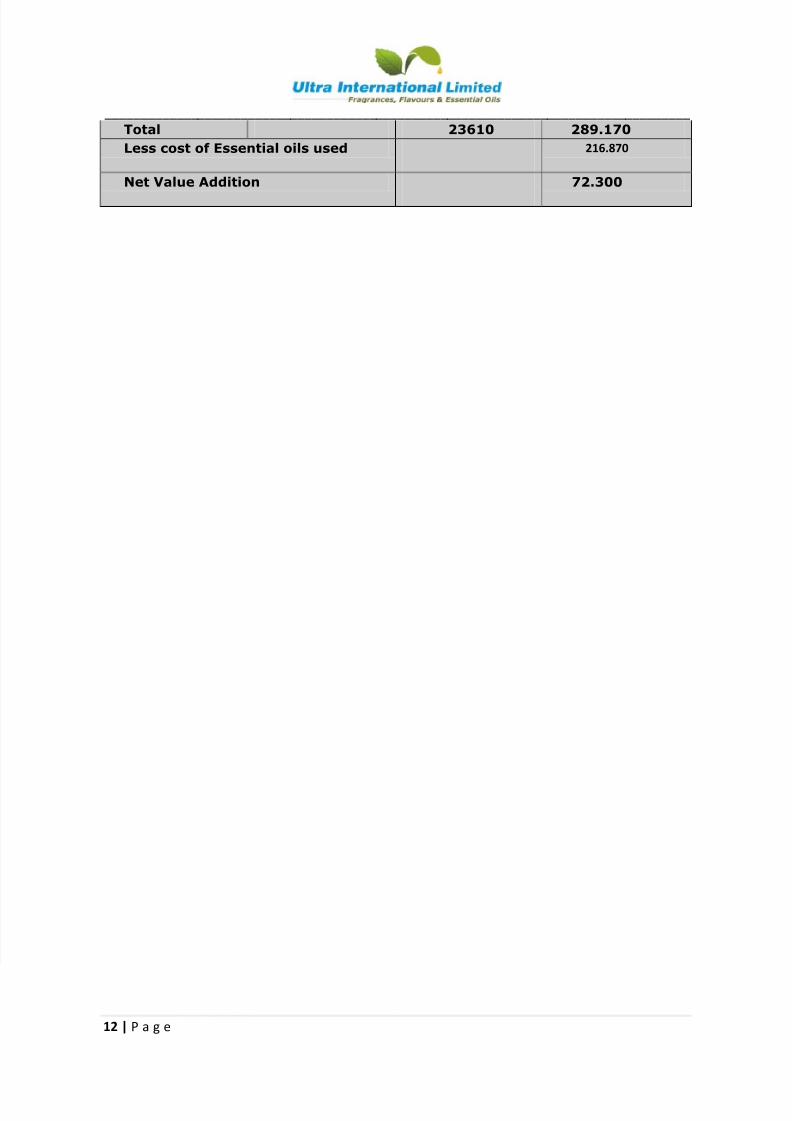
Total 23610 289.170
Less cost of Essential oils used 216.870
Net Value Addition 72.300